Abstract
High-volume space structures are characterized by high combustible loads, rapid fire development, difficulty in firefighting, and potential building collapse risks, making early fire detection particularly crucial. The effectiveness of early fire detection technologies relies on their ability to adapt to the characteristics of smoke-dominant combustion products in the protected space. However, there is a lack of targeted research on the characteristics of the smoke generated during the early low-power stages of fires in high-volume spaces, which has not supported the development of early fire detection technologies for such environments. To address this, this paper presents an experimental study that, for the first time, collects data on fire smoke parameters such as temperature, velocity, concentration, and particle size at heights ranging from 6.5 m to 18.5 m using lightweight sensors. The study analyzes the characteristic and correlations of these parameters and their impact on early fire detection in high-volume spaces for the first time, presenting variation patterns in the plume velocity and particle size distribution of early fire smoke with height. It identifies three patterns of particle size distribution, contrasting with previous studies, and offers a qualitative explanation for these findings. This research enhances the understanding of early fire smoke signals in large spaces and offers valuable insights for developing more accurate and efficient fire detection strategies and technologies.
1. Introduction
With the rapid economic growth and advancements in construction technology in recent years, various types of exhibition centers, ultra-high warehouses, and large, tall factories have proliferated across China and the globe. For instance, in Tianjin City of China alone in 2021, there were 804 such establishments. These structures often span more than 30 m and have internal heights ranging from 8 m to 30 m, which are called high-volume spaces in this paper. Due to their expansive dimensions, high vertical clearance, and ample ventilation, fires in these high-volume space structures can escalate swiftly. Once ignited, fires can quickly cover over 500 m2 within ten minutes [1], filling the space with smoke, which hampers evacuation and smoke control efforts [2]. Many of these buildings are constructed with steel–concrete or steel structures, which pose a heightened risk of collapse within 15 min of exposure to fire. Moreover, firefighting in these environments is further complicated by the rapid vaporization of water used for extinguishing, leading to prolonged fire suppression efforts lasting more than three days in some cases [1]. These fire characteristics in high-volume space structures present significant challenges for evacuation, smoke management, and firefighting efficiency. Detecting fires early becomes crucial in mitigating these challenges, yet high-volume spaces present unique obstacles to early fire detection. Smoke from fires with in the smoldering burning stage may be diluted in the vertical expanse, and due to the height and the small power of the early-stage fire, the smoke may not reach fire detectors or the smoke concentration might be too low to trigger detection [3]. To address these challenges, highly sensitive detectors are sometimes employed, though this increases the risk of false alarms due to disturbances like dust in high-volume spaces [4,5].
To address the aforementioned challenges in preventing and controlling fires in high-volume spaces, researchers have conducted extensive studies on the smoke and temperature characteristics of fires in these environments. For example, in terms of theoretical modeling, in the early stages of research, Mccaffrey, Zukoski, Heskestad et al. modeled three relationships between temperature rise at different heights along the plume axis and the power of the fire source [6,7,8]. Zukoski first proposed an analytical model for indoor smoke filling based on mass–energy conservation [9]. Frederick W Mowrer extended Zukoski’s model by considering the effects of global mean temperature rise and oxygen consumption on the maximum global mean temperature rise of indoor fires [10]. Ying Zhang et al. proposed three improved methods for predicting fire-smoke-layered interfaces based on a three-layer smoke zone model [11], which can predict smoke interfaces under different fire types and ventilation conditions. Michael Delichatsios gave an analytical solution for the smoke-filling time and upper smoke temperature of fire in a large space, taking into account the volume expansion factor [12].
In terms of numerical simulation, Ruifang Wang et al. simulated the optical density of smoke in buildings of different heights and compared the advantages and disadvantages of horizontal and vertical mounting of linear beam smoke detectors at different heights [13]. Jiuzhu Wang et al. investigated the natural filling pattern of smoke in an ultra-thin and tall atrium [14] and found the exponential function and power function dependence of axial smoke filling rate and axial temperature rise of the ultra-thin and tall atrium, respectively. Yufeng Huang et al. investigated the fire growth and smoke-spreading process in a high-volume space building through the simulation of fire dynamics and discussed the alarm process of linear beam smoke detectors and aspirating smoke detectors [15]. Lei Xu et al. studied the influence of smoke spreading process on the design and installation of a smoke alarm system in thin and high ceiling [16]. Qiyu Liu et al. researched the effect of the descending height of the fire shutter on the smoke emission efficiency of a large-space atrium [17]. Yongwang Zhang et al. modeled the maximum temperature change in the smoke layer near the ceiling of a large-space wood-frame building by simulating hundreds of design conditions, including variations in space size, the heat-release rate (HRR) of the fire source, and the fire growth type by using FDS, and they determined the critical conditions for predicting the occurrence of flashover using this model [18]. Nils Johansson developed a method to estimate the air temperature in large-scale spaces under well-ventilated conditions through multi-region modeling [19].
In addition to numerical simulation studies, a large number of studies have been carried out based on scaled-down or full-scale experiments. Ao Jiao et al. studied the characteristics of smoke development, longitudinal temperature distribution in rooms, and transverse temperature distribution in circular corridors under different mechanical smoke exhaust modes in indoor pedestrian streets through full-scale experiments [20]. Chang Liu et al. conducted full-scale fire experiments in a large underground power plant to investigate smoke propagation under natural ventilation conditions and measured the overall temperature distribution using distributed temperature-sensing cables [21]. Zhilei Wang et al. combined scaled-down experiments and full-scale numerical simulations to study the effects of ventilation speed on the temperature distribution and smoke layer height under the high ceilings of subway depots [22]. Guowei Zhang et al. conducted full-scale experiments on the fire resistance of large-space building structures to obtain the natural fire temperature distribution in high-volume spaces and developed a temperature field prediction model based on the evolution of temperature distribution [23]. Gabriele Vigne and Cándido Gutiérrez-Montes et al. adopted a research approach combining full-scale experiments with FDS simulations to study the characteristics of smoke and wall temperatures, exhaust port pressure drops, and airflow variations [24], as well as the smoke layer’s height and temperature characteristics under multiple fire sources [25]. Both studies indicated that FDS is more suitable for simulating smoke and temperature in the far field of plumes. Shi CongLing et al. proposed a calculation model for mechanical exhaust rates in high-volume spaces buildings through theoretical analysis and conducted full-scale experimental tests [26]. Yan Tong et al. [27] and J. A. Capote et al. [28] used scaled-down experiments and numerical simulations to study the height and control methods of fire smoke in high-volume spaces.
In the current studies on the characteristics of fire smoke in these large spaces, the heat release rate of fires ranges from a minimum of 250 kW [26] to a maximum of 7.8 MW [21]. These studies primarily aim to improve models of flame combustion temperature fields, assist in smoke control and evacuation during fires, and support the performance-based design of fire resistance for building structures [14,17,19,20,21,22,23,24,25,26,27,28]. Some researchers have conducted studies on the characteristics of fire smoke in high-volume spaces specifically for fire detection [13,15,16]. However, the minimum heat release rate of these fires is still as high as 80 kW [15], and these studies are based on numerical simulations rather than full-scale experimental research. In comparison, the power of the fire sources in previous studies is not small enough, but they have large amounts of smoke and significant thermal plumes, which insufficiently reflect the early stages of fire smoke. For instance, in [15], the optical density of smoke near the ceiling can reach over 85% obs/m, which far exceeds the concept of early fire detection. However, in real fire incidents, the smoke concentration and temperature in the early stages of a fire in high-volume spaces may not trigger alarms in conventional fire detectors with sensitivities of less than 2 dB/m or less than 36.9% obs/m optical smoke density. Therefore, these previous studies are not suitable for researching the early weak smoke signals in high-volume spaces for the purpose of fire detection. They cannot provide new references for research on new early fire detection technologies in high-volume spaces. Even without considering the differences in fire source power, previous research on the measurement and collection of fire smoke and temperature in large spaces is primarily aimed at smoke control and evacuation. These studies are more concerned with the filling process of smoke in the space, along with the height, thickness, and temperature of the smoke. However, they do not address the optical smoke density and particle size distribution of the smoke, which are crucial for fire detection.
This study will investigate the early fire smoke characteristics in large spaces using the standard-scale fire defined in ISO 7240-9 [29], with a minimum heat release rate of 2.3 kW [30]. Unlike conventional residential spaces, the dilution effect, air movement, and thermal barrier effects present in large spaces create significant non-uniformity in the distribution and behavior of fire smoke within the space. Therefore, while the laws of fire smoke characteristics derived from standard scale tests based on ISO 7240-9 in standard combustion chambers are well established, they cannot be directly proportionally transferred to large spaces. To address this, for the purpose of serving early fire detection, this paper makes several contributions. Firstly, using the ISO 7240-9 standard-scale test fire as the fire source, it gathers, for the first time, fire smoke parameter information, including temperature, plume velocity, concentration, particle size across different heights (6.5 m to 18.5 m), and horizontal positions within this height range via lightweight sensors. Secondly, it summarizes and analyzes the characteristics of plume temperature, plume velocity, smoke concentration, and smoke particle size distribution, as well as the correlations between these parameters. Notably, the characteristics of smoke plume velocity and particle size distribution varying with height and the three particle size distribution modes of smoke particles in high-volume space are reported for the first time. Thirdly, this article discusses and presents the impact of smoke characteristics on early fire detection in high-volume spaces. Lastly, the study provides a qualitative inference based primarily on factors such as particle coagulation, thermal lift, and particle mass to explain the pattern observed in the variations in plume velocity and particle size distribution with height. The analytical results of this experimental study deepen the understanding of the characteristics of fire smoke signals during the early pre-alarm phase of detectors, which will provide valuable insights for developing more accurate and efficient fire detection strategies and technologies.
2. Experiments
2.1. Experimental Space
The experiments were carried out in the large space fire laboratory of the Shenyang Fire Science and Technology Research Institute of MEM. The experimental space is 100 m long from north to south, 30 m wide from east to west, and the structure’s height is divided into two areas of 30 m and 18 m with a natural smoke vent at the top. There is no air conditioning system on site, the ambient temperature during the experiments was not higher than 9 °C and not lower than 4 °C, and the relative humidity was not higher than 57% and not lower than 41%. During the test, the doors and windows were kept closed. The test fire was set in the center of the 30 m height area, as shown in Figure 1 and Figure 2.
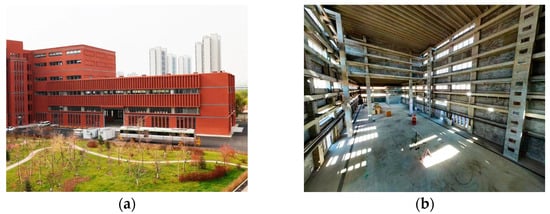
Figure 1.
Interior and exterior view of the experimental space: (a) exterior view; (b) interior view.
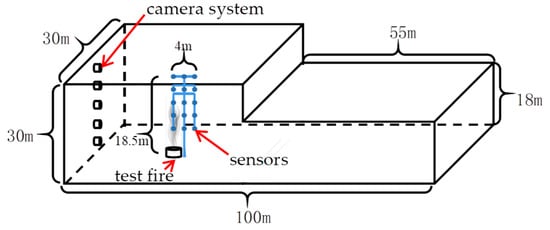
Figure 2.
Experimental fire and data acquisition system location diagram.
2.2. Acquisition System
The acquisition system includes an early fire smoke information field sensing system and smoke spreading camera system, and the overall design layout is shown in Figure 2. The early fire smoke information field acquisition system collects five types of data information, including smoke concentration, particle size distribution, plume temperature, plume velocity, and mass loss. As shown in Figure 2, all suspended sensors used in our experiments are lightweight, with small dimensions and masses, allowing them to be suspended in the air to form multiple sampling points without causing any additional impact on the movement of the smoke.
The smoke concentration data are conventionally measured using an optical smoke densitometer to represent the extinction coefficient. However, due to the large size and weight of the optical smoke densitometer, it is not suitable for multi-point distributed collection suspended in the air. Therefore, we used point-type smoke detectors (GST Co., Ltd., Qinhuangdao, China) instead of the optical smoke densitometer, and all these detectors meet the requirements of ISO 7240-7 regarding the repeatability, consistency, and directional uniformity of smoke detection to provide sufficient accuracy [31]. We used the smoke scattering intensity A/D conversion value of the point-type smoke detectors as an indirect representation of concentration. Then, using a cyclic smoke chamber, we calibrated the A/D conversion values corresponding to the extinction coefficients for different experimental fire sources. Consequently, the extinction coefficient of the smoke was ultimately obtained through the point-type smoke detectors.
The particle size distribution data were collected using a low-cost optical particle sizer, SDS029 (NOVA Technology Co., Ltd., Jinan, China), which covers a particle size range of 0.25 to 31.5 μm across 31 logarithmically spaced channels. This particle sizer is compact and suitable for multi-point deployment. The measurement results are highly consistent with those obtained from the commonly used, more expensive multi-channel laser particle sizers [32]. Temperature is measured by T-type thermocouples (HIOKI Shanghai measurement technologies Co., Ltd., Shanghai, China) with a measurement accuracy of 0.5 °C. The rise velocity of the smoke plume was measured by heat-type anemometers (KANOMAX Inc., Tokyo, Japan) with a measurement accuracy of 0.01 m/s, which was mounted on the vertical axis of the fire source. Mass loss was measured by a high-precision scale (Mettler-Toledo Schweiz GmbH., Greifensee, Switzerland), with a measurement accuracy of 0.01 g. All of the above sensors were acquired at a frequency of 1 Hz. The configuration of various sensors is shown in Figure 3. The smoke concentration field included 10 measurement points, the particle size distribution field included 4 measurement points, the temperature field included 15 measurement points, and the plume velocity field included 5 measurement points. All sensors were raised by a steel wire pulled by a telescopic elevation metal rod to the designated heights and positions. Since the characteristics of fire smoke in ordinary residential spaces have already been studied and our research focuses on the early smoke characteristics in large spaces with high ceilings, the characteristics of conventional heights are not the focus of this study. Therefore, our sampling heights are set at five levels within the range of 6.5 m to 18.5 m, which fall under the category of high ceilings. The fire source is set at 0 m on the ground. In the horizontal direction, there are three positions at distances of 0 m, 2 m, and 4 m from the vertical axis of the fire source. The smoke spreading camera system set up a total of 5 cameras, with a vertical 5 m interval with a total of 5 rows.
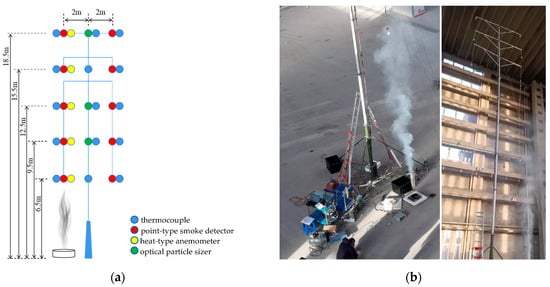
Figure 3.
Sensor placement diagram: (a) acquisition position of different sensors; (b) a practical test scenario.
2.3. Fire Source
The fire sources were set according to ISO 7240-9 TF2~TF5 test fires using beech wood, cotton rope, polyurethane, and heptane in sequence, as shown in Figure 4. The specific settings for the four test fire sources were as follows.
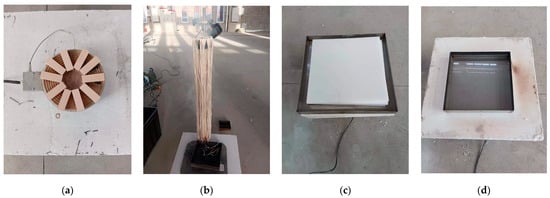
Figure 4.
Setting of the four test fires: (a) wood smoldering fire; (b) cotton rope smoldering fire; (c) polyurethane open-flame fire; (d) heptane open-flame fire.
Wood smoldering fire: ten 75 mm × 25 mm × 20 mm beechwood sticks (moisture content approximately equal to 5%) were used as fuel. The sticks were placed in a radial shape on top of a heating plate with a heating power of 3 kW and a diameter of 220 mm, with the 20 mm wide side of the sticks in contact with the surface of the heating plate. There were 8 concentric grooves on the surface of the heating plate, the width of the grooves was 5 mm, the depth was 2 mm, the distance between the grooves was 3 mm, and the distance between the grooves and the edge of the heating plate was 4 mm. The temperature of the heating plate was maintained by increasing the temperature from room temperature to 600 °C in 11 min during the test.
Cotton rope smoldering fire: 90 cotton ropes of 80 cm in length and 3 g in weight were used as fuel, which were fixed on a metal ring 10 cm in diameter and then hung on a stand and ignited at the lower end of the cotton ropes, and the open flame was extinguished immediately after ignition to maintain a smoldering state.
Polyurethane open-flame fire: three pieces of 50 cm × 50 cm × 2 cm flexible polyurethane foam without flame retardant, with a mass density of about 20 kg/m3, were stacked together and placed in the middle of the fire plate, the edge of the fire plate was rolled upwards, and ignition is was out at the corner of the lowest polyurethane foam.
Heptane open-flame fire: Heptane (purity ≥ 99%) plus 3% (v/v) toluene (purity ≥ 99%) was used as fuel with a total mass of 650 g. The fuel was placed in a 33 cm × 33 cm × 5 cm container and ignited.
Unlike previous studies, this experiment did not use scaled-up fire sources to ensure that the smoke had enough kinetic energy to reach the ceiling but instead used standard-scale fire sources. Of the four test fires used in this study, the average power of the two smoldering fires was 2.3 kW and 3.2 kW, respectively, while the average power of the two open-flame fires was 30 kW and 150 kW, respectively, covering the early phase of fire [30]. Additionally, these four fires are the standard test fires used in the ISO 7240 series standards to evaluate whether fire detection and alarm systems can respond to early fire signals. So in the experimental space with a ceiling height of up to 30 m and an internal volume of 70,200 cubic meters, these fires were sufficiently representative of early fire scenarios and the weak nature of fire smoke signals.
3. Results
3.1. Repeatability
We conducted two repeated experiments for each parameter of each test fire, and the experiments demonstrated good repeatability. As shown in Figure 5, using the plume velocity as an example, the open-flame fire exhibited very high reproducibility, with values from the two experiments being very close at each specific moment. Although there was some fluctuation for the smoldering fire, our research does not target the specific values at individual moments. Instead, we focus on the overall statistical characteristics exhibited; thus, the two experiments for the smoldering fire also showed good repeatability in this context. Since the patterns reflected by the two sets of experimental data are similar and point to the same conclusions in the aspects we are concerned with in this study, such as the range of smoke concentration, particle size distribution patterns, and plume velocity distribution patterns, we present and analyze the results of one set of experiments in the subsequent text, while the data from the other set of experiments are included in the Appendix A.

Figure 5.
Repeatability of two experiments, taking plume velocity at 6.5 m as an example.
3.2. Mass Loss
The mass loss of the four test fires is shown in Figure 6, with the ignition times aligned to 0 s. The mass loss of the all four test fires exhibited good linearity. This indicates that these fires, as standardized fire models, have a relatively stable burning process with a constant heat release rate throughout the experiment. The mass loss curve of the wood smoldering fire, which had a reduced heating rate, showed poorer linearity than the other three. The heating process before reaching the ignition temperature caused the evaporation of moisture and other volatile substances in the wood. After pyrolysis began, the mass loss accelerated, and then the rate decreased after most of the wood had been carbonized. From the entire experimental process, it can be seen that the heat release rates of the four test fires are relatively stable, without high-frequency fluctuations in the mass loss rate.

Figure 6.
The mass loss of test fires.
3.3. Smoke Concentration
The original smoke concentration variation curves for the four test fires are shown in Figure 7, with time zero aligned to the ignition moment. The raw curves exhibit considerable randomness. To more intuitively highlight the patterns, we applied a moving average filter to the smoke concentration data for the wood smoldering fire and the cotton rope smoldering fire at horizontal distances of 0 m and 4 m from the fire source and for the polyurethane fire and heptane fire at a horizontal distance of 0 m from the fire source, as shown in Figure 8. This was performed to mitigate the impact of random plume fluctuations. The moving average filter is essentially a finite-impulse-response low-pass filter (FIR), with the width of the moving window determining the cutoff frequency. We selected 10% of the time from zero to the mass loss inflection point as the filter window width. The filter window widths for the wood smoldering fire, cotton rope smoldering fire, polyurethane open-flame fire, and heptane open-flame fire were 120 s, 150 s, 18 s, and 25 s, respectively. The results obtained with these window widths allow for a more significant differentiation of the different height data and also avoid the elimination of the overall velocity characteristics during the upward motion of the smoke. The results indicated a significant increase in smoke concentration along the vertical axis above the fire source for the wood smoldering fire and the cotton smoldering rope fire, with a smoke concentration increase signal also observed at a horizontal distance of 4 m from the fire source. For the polyurethane fire and heptane fire, the smoke concentration increase signal was only observed along the vertical axis above the fire source, with no signal at a horizontal distance of 4 m. Therefore, in Figure 8, we did not present the smoothed smoke concentration signals for the two open-flame fires at the 4 m horizontal distance.
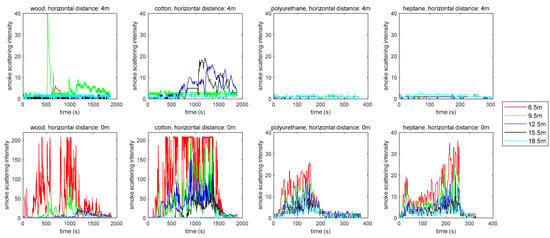
Figure 7.
Smoke concentration (represented by light scattering signal intensity); 0 s aligned to the ignition moment.
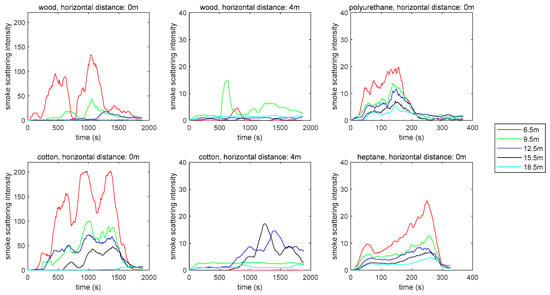
Figure 8.
Smoothed smoke concentration (represented by light scattering signal intensity); 0 s aligned to the ignition moment.
The smoke concentration produced by the four fire sources decreased with increasing height. For the low-power fire sources we used, the smoke from the wood smoldering fire and the cotton rope smoldering fire was concentrated below 15 m in height, while the smoke from the polyurethane and heptane fires could reach beyond 18.5 m. Within these height ranges, the smoke concentration along the vertical axis above the fire source can reached levels significantly different from the background concentration. Additionally, for smoldering smoke, horizontal dispersion within the 9 m to 15 m height range could result in smoke concentrations within a 4 m radius that are also significantly different from the background concentration.
3.4. Plume Velocity
The upward velocity of the smoke plume is shown in Figure 9. The first column of data curves represents the raw sampling data, where the plume velocity of all four test fires exhibits high-frequency oscillations. To better observe the basic trends, we applied smoothing filters. The second column of data presents the smoothed results obtained through moving average filtering, using the same parameters as for smoothing the smoke concentration data. The third column shows the average net increase in the original velocity data from ignition to the end of the experiment, removing the influence of background wind speed before ignition and plotting according to the different heights of the acquisition points. The ignition and end times of the experiments are indicated in the figure by vertical dashed lines.
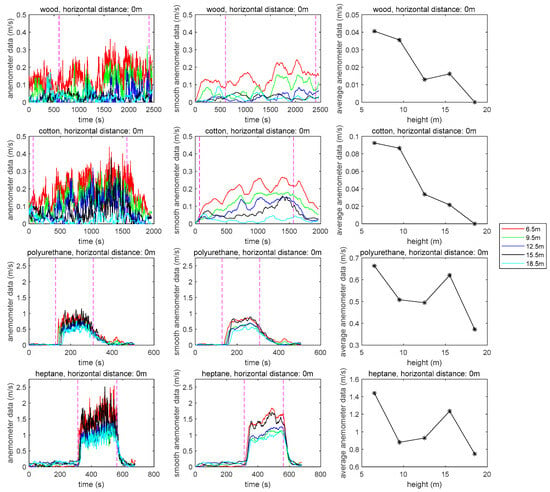
Figure 9.
Plume velocity. Left: raw plume velocity; middle: smoothed plume velocity; right: average plume velocity, removing the influence of background wind speed at different heights during combustion. The ignition and end times of the experiments are indicated by vertical dashed lines.
From the data, it can be seen that the plume velocity of the wood smoldering fire and the cotton rope smoldering fire shows a slight increase compared to the air velocity before the test, with maximum velocities of 0.36 m/s and 0.44 m/s, respectively. In contrast, the plume velocities of the polyurethane fire and the heptane fire show a significant increase compared to the air velocity before the test, with maximum velocities of 1.15 m/s and 2.54 m/s, respectively. This substantial difference is primarily due to the varying power levels of the fire sources, as corroborated by the smoke temperature measurement data.
The average smoke plume velocity curves during the test process reveal that the plume velocities of the four test fires did not change linearly with increasing height, nor do they change monotonically. The plume velocities were highest at 6.5 m for all four test fires. For the wood smoldering fire and the cotton rope smoldering fire, the plume velocities decreased at 9.5 m, with a more pronounced decrease at 12.5 m. However, at 15.5 m, the rate of decrease for the cotton rope smoldering fire slowed, and the plume velocity for the wood smoldering fire even increased slightly. The plume velocities of the polyurethane fire and heptane fire also showed a pattern of initial decrease followed by a significant increase as height increases, with the highest velocities observed at 15.5 m. All four test fires showed a sharp decrease in plume velocities in the 15.5 m to 18.5 m range, reaching their lowest points.
3.5. Plume Temperature
The plume temperature produced by the open-flame fires increased significantly throughout the entire measurement area. However, the two smoldering fires did not significantly affect the air temperature above 6.5 m during the experiments, as shown in Figure 10. Despite the fluctuations in the plume temperature of the smoldering fire, these variations are not caused by the heat generated by the smoldering fire itself. As shown in Figure 10, at the height of 6.5 m directly above the fire source (i.e., at a horizontal distance of 0 m), the temperature sensor data closest to the fire source does not exhibit such fluctuations. From the smoke concentration data and the temperature data of the open-flame fire, it can be inferred that the plume of the smoldering fire should have the highest temperature at 6.5 m, gradually decreasing with height. However, the temperature variations of the smoldering fire plume observed in our experiment appear chaotic, lacking any discernible pattern. According to our observations, the fluctuation of the data at certain heights for the smoldering come from the effect of sunlight passing through the window during the experiments.
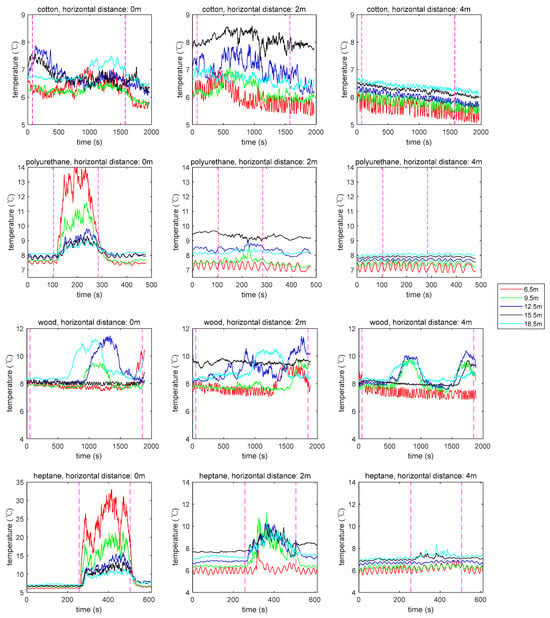
Figure 10.
Plume temperature. The ignition and end times of the experiments are indicated by vertical dashed lines.
Compared to the open-flame fire, smoldering fire consumes less oxygen during combustion, has lower combustion efficiency, and produces significantly less heat. Due to the absence of flames, the heating effect of smoldering fire smoke on the surrounding environment is very minimal, insufficient to cause a noticeable increase in the temperature of the air plume. Our experimental data confirm this. At heights above 6.5 m, the two smoldering fires used in our tests may cause some increase in plume temperature and potentially exhibit different temperature rises. However, the tests show that the temperature increases of both smoldering fire plumes are very weak, even below the measurement accuracy of our thermocouples (0.5 °C). As a result, the temperature signals from the smoldering fire plumes are submerged in various environmental noises.
3.6. Smoke Particle Size
The frequency data of smoke aerosol particle size distributions at 9.5 m, 12.5 m, and 18.5 m of the four test fires are shown in Figure 11. These data have been adjusted to exclude the influence of background environmental aerosols. The typical particle size distributions of the smoke at different times for the four test fires are shown in Figure 12. The particle size distributions for the two smoldering fires, as indicated by the three columns on the left side, exhibit three typical patterns: large unimodal distribution, small unimodal distribution, and bimodal distribution. The peak of the small unimodal distribution is around 0.3 , while the peak of the large unimodal distribution is around 2 . Here, we use the wood smouldering fire as an example, with the cotton rope smouldering fire showing similar results. These findings differ from previous literature reports of tests conducted in standardized fire test room or furnaces [33,34,35,36,37], where the large unimodal distribution and bimodal distribution are reported here for the first time. The particle size distribution of the smoke from the two open-flame fires shows only one pattern, as exemplified by the polyurethane open flame on the right side of Figure 12, which can be considered a small unimodal distribution, consistent with previous literature reports.
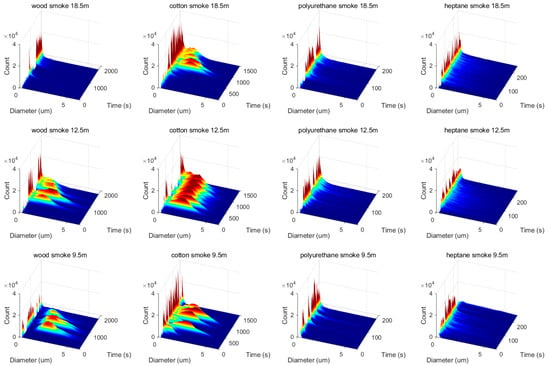
Figure 11.
The variations of frequency raw data of smoke particle size distributions at 9.5 m, 12.5 m, and 18.5 m of the four test fires during experiments.

Figure 12.
The typical particle size distributions modes of the smoke at different times of wood smoldering fire and polyurethane fire. The particle size distributions of wood smoldering fire smoke are from three different times: t1, t2, and t3.
We intend to use the mean particle size to analyze the overall characteristics and patterns of particle size variations in the smoke. However, since the minimum particle size measurement channel of the laser particle sizer we used is 0.25 , the quantity of smaller smoke particles is unknown. Therefore, we cannot directly calculate the mean particle size from the raw particle size data. To address this, after observing the characteristics of the particle size distribution curves reflected in the raw data, we made an a priori assumption that the smoke particle size from the four test fires follows a bimodal log-normal distribution. Based on this assumption, we conducted a subsequent analysis and obtained an analytical expression of the smoke aerosol particle size distribution by fitting the probability density curves. From this, we derived the mean particle size. The probability density function of the log-normal distribution we used is shown in Equation (1):
where represents the particle size. and are weighting coefficients, and are the geometric mean particle sizes of the two log-normal components, and and are their geometric standard deviations. We used the nonlinear least squares method to fit the above log-normal probability density function. The fitting process employed the Trust-Region optimization algorithm [38], and the particle swarm optimization algorithm [39] was used to determine the initial optimization values, ensuring better-fitting parameters. To prevent overfitting, we interpolated the particle numbers of the 31 channels of the laser particle sizer, selecting several interpolation points to introduce into the objective function as a penalty term. The solid lines in Figure 12 represent the fitting results for the example data points. We performed fitting every 3 s, and Figure 13 shows the cumulative probability distribution of the adjusted R2 values for all fitting results. The results showed that 89% of the adjusted R2 values are above 0.95, and 92% are above 0.90, indicating that our assumption of a bimodal log-normal distribution is reasonable.
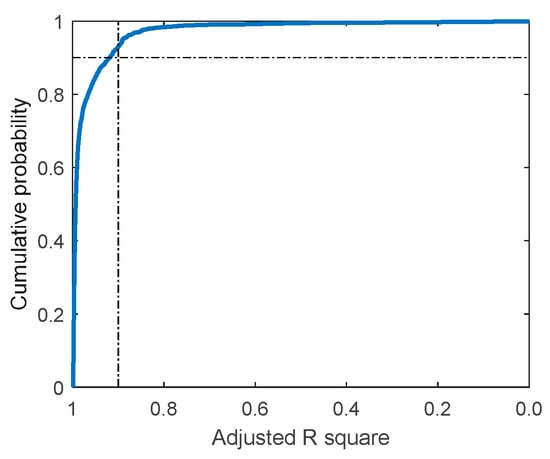
Figure 13.
The cumulative probability distribution of the adjusted R2 values for all fitting results. The vertical dotted line marks the position where R2 is equal to 0.9 and the horizontal dotted line marks the position where the cumulative probability is equal to 0.9.
In our experiments, we found that the occurrence frequency of the bimodal distribution of particle sizes in smoldering smoke is relatively low. For most of the time, the particle size distribution of smoldering smoke exhibits a unimodal distribution of either small or large particles. For example, Figure 14 shows the particle size distribution heatmap of smoldering wood smoke at a height of 9.5 m. It can be observed that the bimodal distribution is a transitional state between two unimodal distributions. It is important to note that the transitions in particle size distribution shown in Figure 14 do not represent the size state transitions of the same cluster of smoke aerosol particles. We cannot conclude from Figure 14 that a cluster of smoke aerosol particles transitions from a large particle state to a small particle state. Instead, Figure 14 reflects the characteristics of different clusters of smoke, with each time point representing a specific cluster of smoke. From the perspective of the particle sizer as an observer, unimodal clusters of smoke are predominantly observed, with bimodal states being observed only occasionally. We analyzed the fitting results of the probability density function corresponding to Figure 14. The bimodal particle size distribution fitting results have the characteristic that the means of the two sub-distributions should be relatively far apart, with a distance of at least 500 nm. Moreover, the weighting coefficients of the two sub-distributions should not differ significantly; otherwise, the bimodal characteristic would not be apparent. According to our observations, the ratio of the weighting coefficients for the bimodal state is always below 10. Based on these principles, we calculated that in the particle size distribution of smoldering wood smoke corresponding to Figure 14, the unimodal state accounts for 90.27%, while the bimodal state accounts for 9.73%.
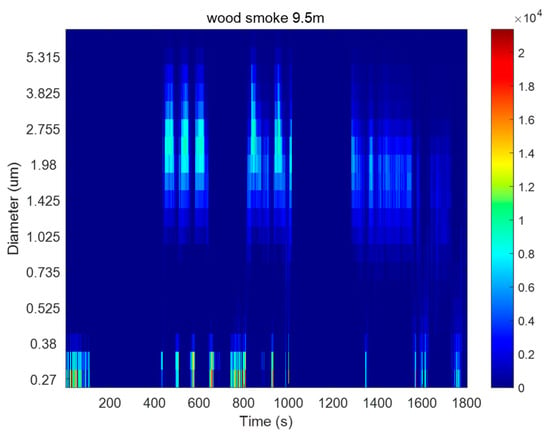
Figure 14.
Heatmap of the variation of particle size distribution of wood smoldering fire at 9.5 m. The heat bar indicates the number of particles.
Based on the fitting results, we calculated the average particle size of the smoke clusters at each sampling point, as shown in Figure 15. Under conditions where the smoke particle sizes of different test fires each reach their peak, the smoldering smoke has more large-sized smoke clusters compared to open flame smoke, with average particle sizes showing two distribution zones. For wood smoldering fire, at a 9.5 m height, the mean particle size is distributed in the [2, 3] and [0, 1] intervals. At a 12.5 m height, the gap between these intervals narrows, and at an 18.5 m height, the distribution is mainly in the [0, 0.5] interval. For the cotton rope smoldering fire, at a 9.5 m height, there are more smoke clusters with mean particle sizes in the [0, 0.75] interval, but many clusters still have mean particle sizes above 1 . At a 12.5 m height, except for the early ignition and late burnout stages, most smoke clusters have mean particle sizes between [1.5, 2.5] . However, at an 18.5 m height, the mean particle sizes of most clusters are below 1 . In contrast, the mean particle size of smoke clusters from open-flame fires does not show such a clear binary distribution. However, the trend of mean particle size change with height was consistent between open flame and smouldering smoke. We further averaged the mean particle sizes at each time point, and their variation with height is shown in Figure 16. It shows that for three out of the four test fires, the average particle size initially increased from 9.5 m to 18.5 m, then decreased. For the wood smoldering fire, the average mean particle size continuously decreased, but the rate of decrease slowed at 12.5 m.
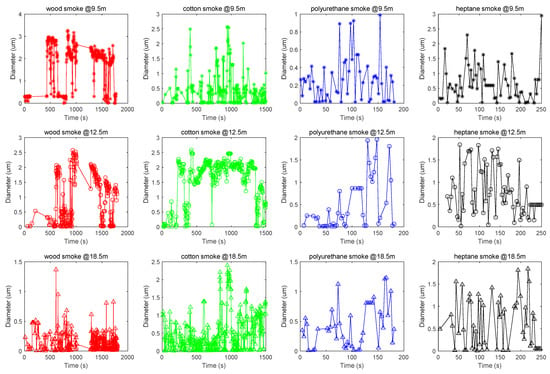
Figure 15.
The mean particle size of smoke variation with time.
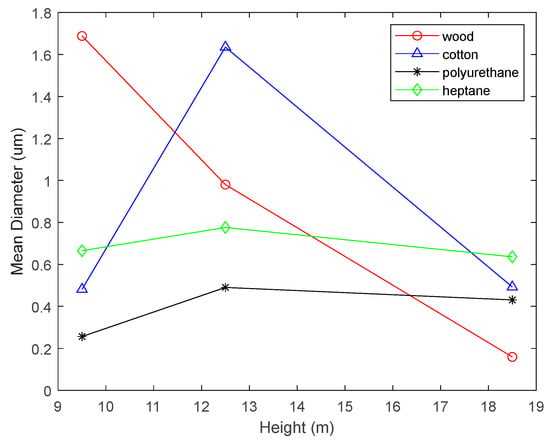
Figure 16.
The altitude variation of the average mean particle size of smoke.
4. Discussion
We calibrated the light-scattering-based fire detectors used in the experiments. By using test fires with the same fuel, we calibrated the light scattering intensity values of the fire detectors in a circulating smoke chamber to the corresponding obscuration coefficient values, as shown in Figure 17.
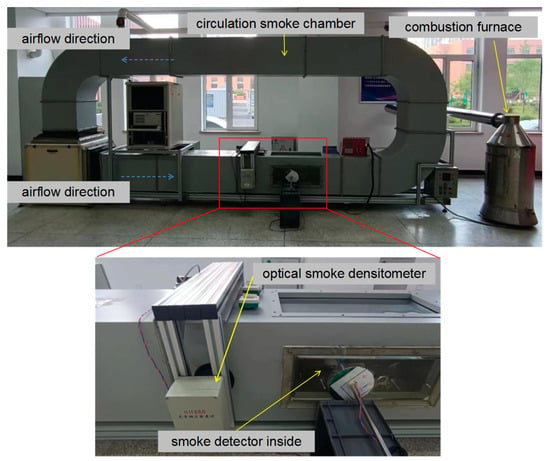
Figure 17.
Calibrating the light scattering intensity values of the fire detectors in a circulating smoke chamber to the corresponding obscuration coefficient values.
The obscuration coefficient is a parameter that has been widely used in the field of fire smoke detection to measure smoke concentration. This parameter essentially refers to the degree of light attenuation after passing through smoke. Converting the light scattering values to this coefficient provides comparable reference information over a broader range. ISO 7240-7 specifies the requirements for standardized obscuration-coefficient measurement equipment (optical smoke densitometer), which mandates that the light beam used for measurement should be an infrared beam, with at least 50% within a wavelength range from 800 nm to 950 nm, and no more than 10% in the wavelength range above 1050 nm [31]. In our calibration experiments, we used an optical smoke densitometer that meets the ISO 7240-7 requirements.
For aerosols, both the obscuration coefficient and light scattering intensity increase monotonically with the increase in aerosol concentration. For ideal spherical particles, the relationship between the obscuration coefficient and light scattering intensity can be quantitatively described by Mie scattering theory and the Beer–Lambert law [40]. Therefore, under certain beam parameters, there exists a one-to-one relationship between aerosol concentration and both the obscuration coefficient and light scattering intensity. This forms the basis for our calibration, allowing us to convert light scattering values into obscuration coefficient values for further discussion. Since fire aerosols are not composed of spherical particles, we chose to directly use experimental methods for mapping calibration.
In the calibration experiments, we used a combustion furnace to introduce smoke from four types of test fires into a circulation smoke chamber, which also meets the ISO 7240-7 requirements. Our smoke detector was placed in front of the flow straightener, with the smoke passing through the straightener and entering the detector. The optical smoke densitometer’s optical path was set in front of the detector. As the experiment commenced, the smoke concentration in the circulation chamber gradually increased, and we measured the corresponding relationship between the light scattering intensity of the smoke detector and the extinction coefficient value from the optical smoke densitometer, completing the calibration.
The smoke produced by smoldering fire is grayish-white, with a refractive index of 1.55 + 0.02i, while the smoke from open-flame fire is black, with a refractive index of 1.55 + 0.5i [41]. Black smoke has stronger light-absorption characteristics, resulting in significantly lower light-scattering intensity compared to grayish-white smoke with a smaller imaginary part of the refractive index at the same extinction coefficient. This was also confirmed in our experimental data.
The calibration results are shown in Table 1. We found that, for our experiments conducted in large open spaces, the obscuration coefficient values for smoldering fire smoke at 6.5 m reached 0.3 dB/m (corresponding to a light scattering value of about 45) at most sampling time points, and at certain times even reached 0.8 dB/m (corresponding to a light scattering value > 120). At 9.5 m, the maximum value also reached 0.3 dB/m, with some sampling times reaching 0.5 dB/m (corresponding to an obscuration coefficient of about 70). For open-flame fire smoke, the obscuration coefficient values at 6.5 m reached 0.3 dB/m (corresponding to a light scattering value of about 5) most of the time, with a maximum value of 0.75 dB/m (corresponding to a light scattering value > 20). At 9.5 m, the maximum value also reached 0.5 dB/m (corresponding to a light scattering value of about 10). In ordinary residential or office spaces, the response threshold range for the obscuration coefficient of fire smoke detectors is typically between 0.1 to 0.5 dB/m. When such smoke detectors are exposed to the smoke with obscuration coefficients generated in our experiments, they will also trigger an alarm. This indicates that the smoke produced by the four types of test fires is detectable not only at 6.5 m but also in spaces above 9.5 m.

Table 1.
Light scattering intensity of point-type photoelectric smoke detectors with corresponding smoke obscuration coefficient.
Therefore, research on fire detection in high-volume spaces does not require increasing the power of the test fires to ensure that sufficient smoke concentration reaches the vicinity of the ceiling to analyze and test the performance of the detectors. On the contrary, we should use these low-power fires as a guide. Given that the difficulty in smoke detection in high-volume spaces lies in the smoke’s inability to reach the detectors, but the smoke itself already has a sufficient concentration, we should consider making the detectors proactive. This involves developing new detection technologies that can actively enter or approach the smoke. For example, we could consider developing new beam fire detectors with functions similar to lidar light scanning, enabling the beams to cover detectable smoke concentration areas through spatial scanning. This would help avoid the delayed reporting of early fires in high-volume spaces.
The plume velocities of the smoke from the four test fires exhibited a highly consistent pattern with altitude variation: as the smoke particles from the low-power test fires ascended in the high-volume space, above a height of 6.5 m, they first decelerated, then accelerated, and finally decelerated again, or they sharply decelerated, then decelerated slowly, and finally sharply decelerated again. We considered the possible factors related to this pattern, including the coalescence of smoke particles, the decrease in smoke temperature, and the ambient background air temperature gradient in the large space. We can provide a possible qualitative explanation of the experimental data and the observed phenomena as follows: In the first stage, as the smoke rises, collisions between particles cause coalescence, increasing the mass of individual particles. As particle temperature decreases, the effect of gravity compared to buoyancy increases, leading to a reduction in ascent speed. In the second stage, the combined effect of gravity and buoyancy prevents large particles from reaching higher altitudes while smaller particles continue rising; the disengagement of the low-speed large particles allows the remaining smoke, which continued to rise as a particle team, to gain a brief boost of average rising velocity or slow down the degree of decline of average rising velocity. In the third stage, the temperature difference between the small smoke particles that have crossed the second stage and the environment gradually decreases, and with ongoing particle coalescence, the effect of gravity becomes prominent again, slowing the ascent speed.
Figure 18 shows images of smoke from the wood smoldering fire experiment at two different moments, collected by the smoke spread camera system. These images illustrate the macroscopic manifestation of the aforementioned smoke coagulation and ascent process of smoldering fire. We can observe that the general movement trend of smoldering smoke is a vertical ascent along the axis of the fire source. As the particles coagulate, some smoke cannot rise further and begins to spread horizontally, while the remaining smoke continues to ascend, forming a shape with a smoke column at the top and bottom and a smoke layer in the middle. As the smoke continues to rise and coagulate, some smoke in the top column can no longer ascend and starts to spread horizontally. Through these continuous dynamic processes, the smoke ultimately forms a thickened smoke layer at the top and a smoke column at the bottom.
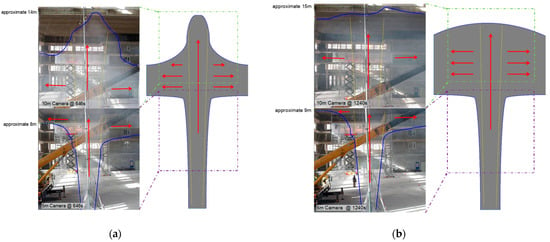
Figure 18.
Typical contours of smoldering fire smoke at different moments. An example of wood smoldering fire: the blue solid line marks the outer contour of the smoke, the main area of smoke ascent is between the two yellow dashed lines, and the red arrows indicate the overall movement direction of the smoke in this area. (a) Typical contour during the smoke rising process: the top-left image is captured by the 10 m camera at 646 s, the bottom-left image is captured by the 5 m camera at 646 s, and the right image is the diagram of typical contour during the smoke rising process. (b) Typical contour of fully dispersed smoke in the later stage of the experiment: the top-left image is captured by the 10 m camera at 1240 s, the bottom-left image is captured by the 5 m camera at 1240 s, and the right image is the diagram of typical contour of fully dispersed smoke in the later stage of the experiment.
As we describe above—“as the smoke particles from the low-power test fires ascended in the high-volume space, above a height of 6.5 m, they first decelerated, then accelerated, and finally decelerated again; or they sharply decelerated, then decelerated slowly, and finally sharply decelerated again”—this altitude-dependent pattern of plume velocity suggests that it may be a potential factor for early fire detection. In addition to considering traditional fire parameters such as smoke concentration and temperature, monitoring and identifying the distinctive airflow velocity patterns observed during the early stages of a fire may offer a promising direction for further exploration in fire detection studies.
Regarding temperature, the plume temperature variation caused by open-flame fires is a very significant parameter for fire detection. However, the plume temperature variation caused by smoldering fires is very weak and can be easily influenced by sunlight passing through the skylight. It may require further trend analysis or domain transformation analysis to extract some usable information. Overall, utilizing plume temperature information for smoldering fire detection presents a challenging and low-yield option.
Different fire-smoke-detection technologies all have false alarm issues. Apart from vision-based fire-smoke-detection techniques, most fire smoke detection technologies are photoelectric, which is based on light scattering or extinction principles. Although there are still some ionization-type fire smoke detectors, due to the use of radioactive materials, the safe and compliant recycling of ionization-type fire smoke detectors is challenging, making them rare. Therefore, we primarily discuss photoelectric smoke-detection technology. Both fire smoke and non-fire smoke cause light scattering or extinction. Photoelectric fire-detection technologies using a single scattering angle or single wavelength cannot distinguish between fire smoke and non-fire smoke based on the scattering or extinction signals. Consequently, numerous novel photoelectric smoke detection methods have emerged in recent years, primarily aiming to reduce false alarm rates through multi-angle or multi-wavelength approaches [40,42,43,44,45,46]. The underlying mechanism is to use multi-angle, multi-wavelength scattering or multi-wavelength extinction information to directly or indirectly estimate the mean particle size of the smoke [47,48,49,50,51].
Whether the particle size is directly inverted or indirectly inferred through differences in optical properties caused by different particle sizes, these fire-smoke-detection technologies are based on the premise that the mean particle size of fire smoke is relatively smaller than that of non-fire smoke particles. This assumption has been validated in numerous previous studies [33,34,35,36,37,44,46]. Supported by experimental results with unimodal distributions whose mean particle size is less than 1 μm, research on particle-size-based fire smoke detection has generally accepted this hypothesis. It is commonly established that if the mean particle size is less than 1 μm, the detector can identify it as fire smoke. If the mean particle size is greater than 1 μm, the detector identifies it as non-fire smoke and re-evaluates it after a delay.
However, regarding the particle size distribution characteristics of early fire smoke in high-volume spaces, the experimental results of our study present new findings. The fire smoke in high-volume spaces not only exhibits the previously reported small-size unimodal distribution with a mean less than 1 μm but also shows two new modes: a large-size unimodal distribution with a mean greater than 1 μm, and a bimodal distribution where both modes coexist. Compared to lower (9.5 m in this experiment) or higher (18.5 m in this experiment) spatial intervals, the proportion of large particle smoke clusters tends to increase in the middle interval (12.5 m in this experiment). This causes the smoke from the cotton rope smoldering fire, heptane fire, and polyurethane fire to exhibit smaller mean particle sizes in lower or higher spaces while showing larger mean particle sizes in the middle region. This is most evident with the smoldering fire of cotton rope, where the mean particle size at 12.5 m remains in the larger size range most of the time. This implies that detectors developed based on the 1 μm criterion would experience missed or delayed alarms when operating in this large particle smoke region, which could significantly increase the difficulty of firefighting in high-volume spaces.
Similar to the inferred causes of the variation pattern in smoke plume velocity, we consider that the pattern in particle size exhibited by the experimental fires is also primarily caused by the coagulation of smoke particles. That is, after the fire smoke is generated, it undergoes coagulation during the ascent, leading to an increased proportion of large particles and a larger average particle size. Once this reaches a certain level, the large particles will eventually either be suspended or slow down due to insufficient buoyancy, while smaller particles continue to rise, causing the mean particle size at higher altitudes to decrease again.
In the experiment, the pattern of particle size variation of the smoldering fire of wood differed from the other three experimental fires. The average heat release rates for the four test fires were 2.3 kW for the wood smoldering fire, 3.2 kW for the cotton rope smoldering fire, 30 kW for the polyurethane open-flame fire, and 150 kW for the heptane open-flame fire [30]. There may be multiple potential factors contributing to the earlier peak in the average particle size of the smoldering wood fire. We consider the lowest heat release rate of the smoldering wood fire as one of these factors, resulting in the weakest upward driving force for smoke particles among the four experimental fires. Consequently, the large particles resulting from coagulation lose sufficient upward momentum from earlier. Therefore, the increase in mean particle size with height has already reached its peak in a section below 9.5 m, and the average particle size continues to decrease in spaces above 9.5 m. We also find support for this in the supplementary experimental results shown in Figure 19.
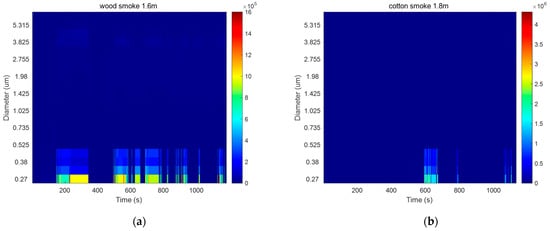
Figure 19.
Particle size data at close distances to the fire source; the heat bar indicates the number of particles: (a) 1.6 m from the smoldering part of the wood smoldering fire; (b) 1.8 m from the smoldering part of the cotton rope smoldering fire.
Our approach differs from previous studies in that we utilize a particle sizer based on optical principles for particle size measurement, consistent with the detector’s operating principles. Previous research relied on a Scanning Mobility Particle Sizer (SMPS) for measuring particle sizes in fire smoke, where SMPS is used for submicron particle measurements. The SMPS used in earlier studies has a maximum range of 0.7 nm or 1 µm, making it unable to measure portions or cases of smoke particle distributions larger than 1 µm. For non-fire smoke, previous research uses measurements based on aerodynamic or optical principles, which fundamentally differ in principle from their SMPS fire smoke measurement. Whether using SMPS, aerodynamic principles, or optical principles, the measured particle sizes are equivalent in diameter, which means they cannot be directly compared from different equivalent perspectives but require corresponding transformations [52]. Therefore, the accuracy of the 1 µm empirical criterion based on different equivalent diameter measurement principles also requires inter-instrument data comparison studies for further validation.
Furthermore, previous studies have typically collected particle size data in standard fire test rooms or directly from burners [33,34,35,36,37,44], with limited height and span. In contrast, we conducted our sampling above 9.5 m, allowing ample time for smoke particles to cool and coalesce. Supplementary experiments for particle size distribution were conducted directly above the fire sources for wood and cotton rope smoldering fires. The collection positions were 1.6 m from the smoke generation point for the wood smoldering fire and 1.8 m for cotton rope smoldering fire. Data exceeding the SDS029 range were set to 0. The heat maps of particle size distribution collected at close proximity for both fire types are shown in Figure 19. It is evident that at a close range, smoke particle sizes for both fire types are predominantly below 0.5 µm. Although wood smoldering fire shows a weak peak above 1 µm, its peak concentration is less than 6.6% of the peak below 0.5 µm. Therefore, we conclude that the particle size distributions of both types of smoldering fires at a close proximity to the fire source exhibit a small unimodal distribution, supporting our hypothesis regarding the causes of particle size variation with height, and showing consistency with previous studies [33,34,35,36,37,44].
5. Conclusions
This paper investigates the characteristics of smoke generated by low-power experimental fires representing the early stages of fires in high-volume spaces, specifically within a height range of 6.5 m to 18.5 m; analyzes the characteristics and correlations of fire parameters such as plume temperature, plume velocity, smoke concentration, and smoke particle size distribution from field data; and explores their impact on early detection of fires in high-volume spaces. The findings reveal that, for smoke concentration, early-stage smoke in high-volume spaces can reach detectable levels above 9.5 m, with local obscuration coefficients ranging from 0.3 dB/m to 0.5 dB/m. Regarding smoldering fires, smoke begins to diffuse laterally after reaching a certain height and cannot reach the ceiling. For plume temperature, unlike the significant temperature rise characteristic of open-flame fire smoke, the temperature of smoldering fire smoke does not provide directly effective information for fire detection. For plume velocity, it exhibits a pattern of initial deceleration followed by acceleration and then deceleration again with height, or a specific pattern of rapid deceleration followed by slow deceleration and then rapid deceleration again. This distinctive variation in airflow velocity patterns makes it a potential consideration for early fire detection. For particle size, early fire smoke in high-volume spaces exhibits three distribution patterns: a log-normal unimodal small-size distribution with mean particle sizes less than 1 μm, a log-normal unimodal large-size distribution with mean particle sizes greater than 1 μm, and a log-normal bimodal distribution where both small and large particle sizes are present. As the height increases, the mean particle size of the smoke first increases and then decreases. Notably, for a cotton rope smoldering fire, the mean particle size at 12.5 m falls within the 1.5 to 3 μm range in most time. The finding of the three particle size distributions challenges the traditional understanding that fire smoke particle sizes follow a log-normal unimodal distribution with small particle sizes less than 1 μm. This paper provides a qualitative explanation for the aforementioned characteristics of smoke plume velocity and particle size distribution from the perspective of particle coagulation but does not present a quantitative kinetic model explanation; this is a future research direction for our study.
Author Contributions
Conceptualization, L.W. and X.Z.; methodology, L.W.; Experiment, L.W. and B.L.; data analysis, L.W. and L.L.; writing—original draft preparation, L.W.; writing—review and editing, L.L. and B.L.; supervision, X.Z.; project administration, Z.M.; funding acquisition, Z.M. All authors have read and agreed to the published version of the manuscript.
Funding
This research was funded by National Key R&D Program of China, 2021YFC3001603 and Fundamental Research Funds for Central Non-profit Scientific Institution, CA518.
Institutional Review Board Statement
Not applicable.
Informed Consent Statement
Not applicable.
Data Availability Statement
The original contributions presented in the study are included in the article, further inquiries can be directed to the corresponding author.
Conflicts of Interest
The authors declare no conflicts of interest.
Appendix A
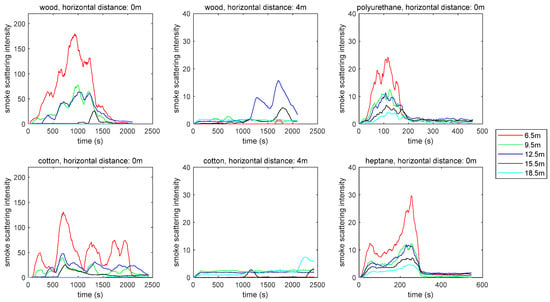
Figure A1.
Smoothed smoke concentration (represented by light scattering signal intensity) of repetition experiments.
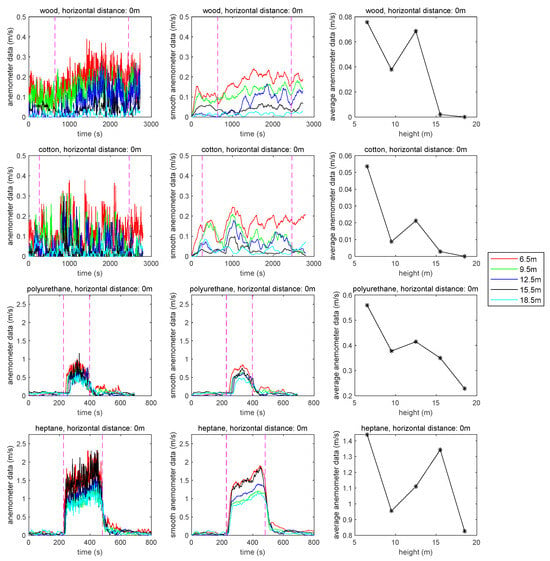
Figure A2.
Plume velocity of repetition experiments. Left: raw plume velocity; middle: smoothed plume velocity; right: average plume velocity, with the influence of background wind speed at different heights during combustion removed. The ignition and end times of the experiments are indicated by vertical dashed lines.
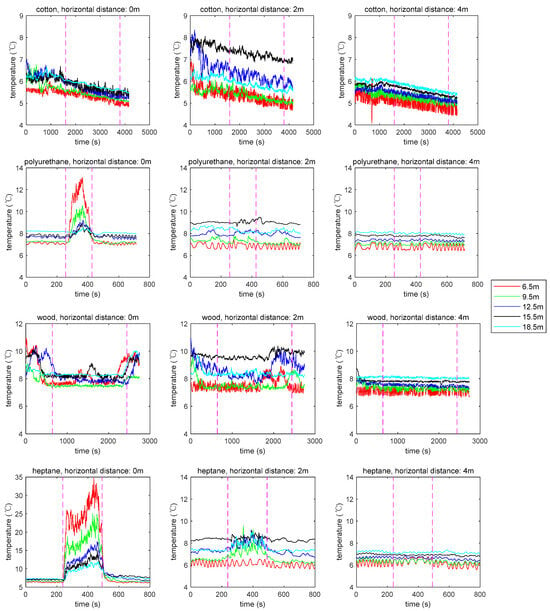
Figure A3.
Plume temperature of repetition experiments. The ignition and end times of the experiments are indicated by vertical dashed lines.
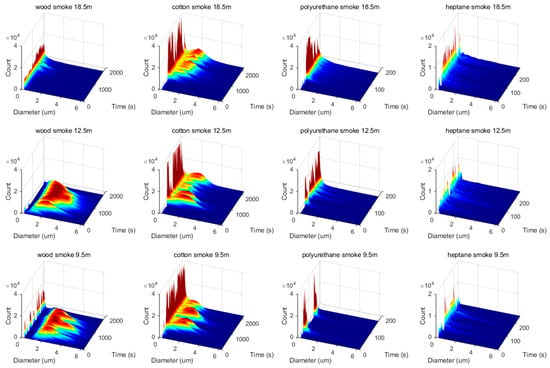
Figure A4.
The variations in the frequency raw data of smoke particle size distributions at 9.5 m, 12.5 m, and 18.5 m of the four test fires during the repetition experiments.
References
- Yang, C.; Hong, Y.; Duan, J. Case Analysis of Firefighting in Long-Span and Large-Space Factory Buildings. China Emerg. Rescue 2021, 4, 66–69. [Google Scholar] [CrossRef]
- Zhang, G. A Study on Firefighting Strategies in Fire Accidents of Large-Span Buildings. J. China People’s Police Univ. 2016, 32, 27–30. [Google Scholar]
- Liu, Y.; Yao, B.; Li, M.; Lin, B.; Yang, X. Comparative Analysis on Fire Detection System for Depot of Urban Rail Transit. Fire Saf. Sci. 2019, 28, 190–196. [Google Scholar]
- Chagger, R. Live Investigations of False Fire Alarms; Building Research Establishment: Hertfordshire, UK, 2015. [Google Scholar]
- Chagger, R. The Performance of Multi-Sensors in Fire and False Alarm Tests; Building Research Establishment: Hertfordshire, UK, 2018. [Google Scholar]
- McCaffrey, B.J. Purely Buoyant Diffusion Flames: Some Experimental Results; National Bureau of Standards: Washington, DC, USA, 1979.
- Zukoski, E.E.; Kubota, T.; Cetegen, B. Entrainment in Fire Plumes. Fire Saf. J. 1981, 3, 107–121. [Google Scholar] [CrossRef]
- Heskestad, G. Virtual Origins of Fire Plumes. Fire Saf. J. 1983, 5, 109–114. [Google Scholar] [CrossRef]
- Zukoski, E.E. Development of a Stratified Ceiling Layer in the Early Stages of a Closed-room Fire. Fire Mater. 1978, 2, 54–62. [Google Scholar] [CrossRef]
- Mowrer, F.W. Enclosure Smoke Filling Revisited. Fire Saf. J. 1999, 33, 93–114. [Google Scholar] [CrossRef]
- Zhang, Y.; Liu, Z.; Lin, Y.; Fu, M.; Chen, Y. New Approaches to Determine the Interface Height of Fire Smoke Based on a Three-layer Zone Model and Its Verification in Large Confined Space. Fire Mater. 2020, 44, 130–138. [Google Scholar] [CrossRef]
- Delichatsios, M. Tenability Conditions and Filling Times for Fires in Large Spaces. Fire Saf. J. 2004, 39, 643–662. [Google Scholar] [CrossRef]
- Wang, R.; Lan, X.; Xu, L. Smoke Spread Process under Different Heights Based on Numerical Simulation. Case Stud. Therm. Eng. 2020, 21, 100710. [Google Scholar] [CrossRef]
- Wang, J.; Du, C.; Zhang, H. Numerical Simulation of Smoke Natural Filling in Ultra-Thin and Tall Atrium. Case Stud. Therm. Eng. 2021, 28, 101521. [Google Scholar] [CrossRef]
- Huang, Y.; Wang, E.; Bie, Y. Simulation Investigation on the Smoke Spread Process in the Large-Space Building with Various Height. Case Stud. Therm. Eng. 2020, 18, 100594. [Google Scholar] [CrossRef]
- Xu, L.; Wang, Y.; Song, L. Numerical Research on the Smoke Spread Process of Thin-Tall Atrium Space under Various Ceiling Height. Case Stud. Therm. Eng. 2021, 25, 100996. [Google Scholar] [CrossRef]
- Liu, Q.; Xiao, J.; Cai, B.; Guo, X.; Wang, H.; Chen, J.; Zhang, M.; Qiu, H.; Zheng, C.; Zhou, Y. Numerical Simulation on the Effect of Fire Shutter Descending Height on Smoke Extraction Efficiency in a Large Atrium. Fire 2022, 5, 101. [Google Scholar] [CrossRef]
- Zhang, Y.; Wang, L. Research on Flashover Prediction Method of Large-Space Timber Structures in a Fire. Materials 2021, 14, 5515. [Google Scholar] [CrossRef]
- Johansson, N. Evaluation of a Zone Model for Fire Safety Engineering in Large Spaces. Fire Saf. J. 2021, 120, 103122. [Google Scholar] [CrossRef]
- Jiao, A.; Lin, W.; Cai, B.; Wang, H.; Chen, J.; Zhang, M.; Xiao, J.; Liu, Q.; Wang, F.; Fan, C. Full-Scale Experimental Study on Thermal Smoke Movement Characteristics in an Indoor Pedestrian Street. Case Stud. Therm. Eng. 2022, 34, 102029. [Google Scholar] [CrossRef]
- Liu, C.; Tian, X.; Zhong, M.; Lin, P.; Gong, Y.; Yin, B.; Wang, H. Full-Scale Experimental Study on Fire-Induced Smoke Propagation in Large Underground Plant of Hydropower Station. Tunn. Undergr. Space Technol. 2020, 103, 103447. [Google Scholar] [CrossRef]
- Wang, Z.; Zhu, L.; Guo, X.; Pan, X.; Zhou, B.; Yang, J.; Jiang, J.; Hua, M.; Feng, L. Reduced-Scale Experimental and Numerical Study of Fire in a Hybrid Ventilation System in a Large Underground Subway Depot with Superstructures under Fire Scenario. Tunn. Undergr. Space Technol. 2019, 88, 98–112. [Google Scholar] [CrossRef]
- Zhang, G.; Li, H.; Zhu, G.; Li, J. Temperature Fields for Fire Resistance Analysis of Structures Exposed to Natural Fires in Large Space Buildings. Struct. Des. Tall Spec. Build. 2020, 29, e1708. [Google Scholar] [CrossRef]
- Vigne, G.; Węgrzyński, W.; Cantizano, A.; Ayala, P.; Rein, G.; Gutiérrez-Montes, C. Experimental and Computational Study of Smoke Dynamics from Multiple Fire Sources inside a Large-Volume Building. Build. Simul. 2021, 14, 1147–1161. [Google Scholar] [CrossRef]
- Gutiérrez-Montes, C.; Sanmiguel-Rojas, E.; Viedma, A.; Rein, G. Experimental Data and Numerical Modelling of 1.3 and 2.3 MW Fires in a 20 m Cubic Atrium. Build. Environ. 2009, 44, 1827–1839. [Google Scholar] [CrossRef]
- Shi, C.; Zhong, M.; Huo, R. Investigation on Mechanical Exhaust of Cabin Fire in Large-Space Building. Sci. China Ser. E Technol. Sci. 2008, 51, 65–76. [Google Scholar] [CrossRef]
- Tong, Y.; Huo, D.; Zhu, P.; Niu, X. Prediction of Natural and Hybrid Ventilation Performance Used for Fire-Induced Smoke Control in a Large Single Space. Fire Saf. J. 2018, 100, 20–31. [Google Scholar] [CrossRef]
- Capote, J.; Alvear, D.; Abreu, O.; Lazaro, M.; Espina, P. Scale Tests of Smoke Filling in Large Atria. Fire Technol. 2009, 45, 201–220. [Google Scholar] [CrossRef]
- ISO/TR 7240-9:2022; Fire Detection and Alarm Systems—Part 9: Test Fires for Fire Detectors 2022. ISO: Geneva, Switzerland, 2022.
- National Institute of Standards and Technology. A Review of Measurements and Candidate Signatures for Early Fire Detection; National Institute of Standards and Technology: Gaithersburg, MD, USA, 1995.
- ISO 7240-7:2023; Fire Detection and Alarm Systems—Part 7: Point-Type Smoke Detectors Using Scattered Light 2023. ISO: Geneva, Switzerland, 2023.
- Tang, M.; Shen, Y.; Ge, Y.; Gao, J.; Wang, C.; Wu, L.; Si, S. Laboratory and Field Evaluation of a Low-Cost Optical Particle Sizer. J. Environ. Sci. 2024, 142, 215–225. [Google Scholar] [CrossRef] [PubMed]
- Ma, S.; Zhang, Y.; Yuan, H. Dynamic Smoke Particle Size Distribution in Test Fire. J. Univ. Sci. Technol. China 2006, 36, 44–48. [Google Scholar] [CrossRef]
- Ma, S.; Zhang, Y.; Fang, J.; Zhu, Y.; Jiang, Y.; Wang, J.; Yuan, H. Fire Smoke Particle Size Distribution Evolution Under Brownian Coagulation. J. Combust. Sci. Technol. 2007, 13, 147–151. [Google Scholar] [CrossRef]
- Ma, S. Fire Smoke Particle Size Distribution Measurement and Evolution Simulation. Ph.D. Thesis, University of Science and Technology of China, Hefei, China, 2007. [Google Scholar]
- Xie, Q.; Yuan, H.; Song, L.; Zhang, Y. Experimental Studies on Time-Dependent Size Distributions of Smoke Particles of Standard Test Fires. Build. Environ. 2007, 42, 640–646. [Google Scholar] [CrossRef]
- Dong, W.-H.; Sheng, X.-E.; Wang, S.; Deng, T. Experimental Study on Particle Size Distribution Characteristics of Aerosol for Fire Detection. Appl. Sci. 2023, 13, 5592. [Google Scholar] [CrossRef]
- Beck, A. Introduction to Nonlinear Optimization: Theory, Algorithms, and Applications with MATLAB; SIAM-Society for Industrial and Applied Mathematics: Philadelphia, PA, USA, 2014; ISBN 978-1-61197-364-8. [Google Scholar]
- Kennedy, J.; Eberhart, R. Particle Swarm Optimization. In Proceedings of the ICNN’95—International Conference on Neural Networks, Perth, WA, Australia, 27 November–1 December 1995; Volume 4, pp. 1942–1948. [Google Scholar]
- Li, K.; Liu, G.; Yuan, H.; Chen, Y.; Dai, Y.; Meng, X.; Kang, Y.; Huang, L. Dual-Wavelength Smoke Detector Measuring Both Light Scattering and Extinction to Reduce False Alarms. Fire 2023, 6, 140. [Google Scholar] [CrossRef]
- Deng, T.; Wang, S.; Xiao, X.; Zhu, M. Eliminating the Effects of Refractive Indices for Both White Smokes and Black Smokes in Optical Fire Detector. Sens. Actuators B Chem. 2017, 253, 187–195. [Google Scholar] [CrossRef]
- Zhou, Y.; Shi, L.; Li, C.; Zhang, H.; Zheng, R. Scattering Characteristics of Fire Smoke and Dust Aerosol in Aircraft Cargo Compartment. Fire Technol. 2023, 59, 2543–2565. [Google Scholar] [CrossRef]
- Deng, L.; Wu, D.; Zhou, J.; He, Y.; Liu, Q.; Wang, H. A Review on Aircraft Cargo Compartment Fire Detection Using Dual-Wavelength Sensors. In Proceedings of the Third International Computing Imaging Conference (CITA 2023), Sydney, Australia, 6 November 2023; Volume 12921, p. 1292126. [Google Scholar]
- Wang, S.; Xiao, X.; Deng, T.; Chen, A.; Zhu, M. A Sauter Mean Diameter Sensor for Fire Smoke Detection. Sens. Actuators B Chem. 2019, 281, 920–932. [Google Scholar] [CrossRef]
- Özyurt, O. The Effect of Time Correlation Function, Sauter Mean Diameter and Asymmetry Ratio on Machine Learning Classifiers for Particle Discrimination by Using Light Scattering. Fire Saf. J. 2023, 141, 104002. [Google Scholar] [CrossRef]
- Xia, J.; Zhou, Y.; Zeng, J. Dual-Wavelength Optical Sensor for Fire Detection and Measurement of Aerosol Mass Concentration. Fire Saf. J. 2024, 146, 104129. [Google Scholar] [CrossRef]
- Lin, M.; Zhu, M.; Xiao, X.; Li, C.; Wu, J. Optical Sensor for Combustion Aerosol Particle Size Distribution Measurement Based on Embedded Chip with Low-Complexity Mie Scattering Algorithm. Opt. Laser Technol. 2023, 158, 108791. [Google Scholar] [CrossRef]
- Gao, L.; Chen, H.; Chen, G.; Deng, J. Particle Size Distributions and Extinction Coefficients of Aerosol Particles in Land Battlefield Environments. Remote Sens. 2023, 15, 5038. [Google Scholar] [CrossRef]
- Sipkens, T.A.; Boies, A.; Corbin, J.C.; Chakrabarty, R.K.; Olfert, J.; Rogak, S.N. Overview of Methods to Characterize the Mass, Size, and Morphology of Soot. J. Aerosol Sci. 2023, 173, 106211. [Google Scholar] [CrossRef]
- Han, J.; Liu, X.; Jiang, M.; Wang, Z.; Xu, M. An Improved On-Line Measurement Method of Particulate Matter Concentration Using Tri-Wavelength Laser Light Scattering. Fuel 2021, 302, 121197. [Google Scholar] [CrossRef]
- Zeng, J.; Bian, A.; Chen, A.; Xu, W.; Cheng, W.; Yan, S.; Wang, S.; Deng, T. A Miniaturized Aerosol Sizing Sensor Using Light-Scattering Angular Spectrum. Opt. Lasers Eng. 2023, 160, 107257. [Google Scholar] [CrossRef]
- Cheng, M.; Kabela, E.; Cable-Dunlap, P. Intercomparison of Aerosol Instrumental Responses Using AEROTRAK, SMPS, and APS in a Simulated Building; Oak Ridge National Laboratory (ORNL): Oak Ridge, TN, USA, 2021.
Disclaimer/Publisher’s Note: The statements, opinions and data contained in all publications are solely those of the individual author(s) and contributor(s) and not of MDPI and/or the editor(s). MDPI and/or the editor(s) disclaim responsibility for any injury to people or property resulting from any ideas, methods, instructions or products referred to in the content. |
© 2024 by the authors. Licensee MDPI, Basel, Switzerland. This article is an open access article distributed under the terms and conditions of the Creative Commons Attribution (CC BY) license (https://creativecommons.org/licenses/by/4.0/).