1. Introduction
The occurrence of wildfires has been increasing over the years [
1]. Although wildfires have a natural character, the interval between massive events is becoming shorter, with an impressive number of very deadly events recorded in recent decades. While Portugal is relatively used to and prepared to face wildfires, frequent during its dry Mediterranean summers, the devastating wildfires of 2017 have profoundly changed how the country coexists with these events. In that year, more than 100 people died as a consequence of two significant events that occurred in the central region of the country. The municipality of Pedrógão Grande was the epicentre of the biggest one, which alone took the lives of about 66 people [
2,
3,
4].
Besides these human losses, the official statistics point out that the effect of this devastating wildfire also exerted tremendous pressure on the surrounding environment and rural traditional settlements. In this massive wildfire, up to 80% of the area consumed by the fire was forestry, and the remaining hardly affected areas are primarily composed of medium and small villages [
5,
6].
Like in many other countries [
7,
8], small rural villages in Portugal have struggled to retain their populations [
9], as these places are losing most of their young families to the cities in the pursuit of better work opportunities. Thus, the villages are frequently composed of older remaining people with lesser mobility conditions and a significant number of uninhabited and poorly conservated houses. This is a dual challenge for an evacuation situation, as elderly residents may take a longer time to abandon these areas, and uninhabited buildings tend to delay the detection of the event by the population [
10].
In the case of the 2017 wildfires in Portugal, almost 50% of the unoccupied buildings—representing around 12.5% of the entire building stock—were destroyed [
11]. The combination of these factors, old populations, and a large volume of unoccupied buildings, with the proximity of those settlements to the forest results in a high level of exposure, and that is why it is critically important to assess these wildland–urban interfaces (WUI) and to outline and implement effective protection measures [
12].
The term WUI is not standardised globally, there are discrepancies regarding the size of areas considered representative, the safe distance between forests and settlements, and the combination of data to be considered when assessing it [
13,
14,
15]. Beyond these questions, it is recognised that WUI areas worldwide tend to increase due to the expansion of urbanisation into forests and deficiencies in fuel management [
16,
17,
18]. This trend dangerously exposes more people to wildfires, who are often unprepared to deal with such events [
19] or incapable of doing so [
18,
20].
Considering these points, the task of identifying WUI areas has been pursued among researchers across the globe. Huang and Jin [
21] developed a deep-learning-based methodology for identifying the building footprint, vegetation cover and distance to remote areas in California, USA, over eight years. The work is interesting as it uses only satellite images available through a governmental agency as the primary data source. With these, the findings of the study provided accurate results in measuring the evolution of WUI areas over time. However, this technique is limited by the existing available data, which are frequently suitable only for large-scale analysis due to the resolution of the imagery.
To encompass finer analysis on identifying precise WUI areas, several studies have been carried out by combining different remote sensing techniques, such as LiDAR and high-resolution aerial images. While LiDAR equipment is very powerful in detecting the three-dimensional properties of vegetation and relief, high-resolution images are more easily encountered on open-access databases, avoiding the need for fieldwork. Alvaréz et al. [
22] developed a study in Galicia, Spain, aimed at characterising existing biomass, for instance, proportions of vegetation, canopy sizes and density. The study was mainly focused on the collection of point clouds with UAV and automatic classification of the point clouds for differentiating the vegetation. The technique proposed by the authors proved relatively efficient in detecting canopies, although challenges were found when dealing with more intricate vegetation patterns.
When developing a strategy for identifying the WUI areas, many considerations may be made to understand the actual vulnerability of urbanisation to wildfires. The study by Tampekis et al. [
23] defines that far from just considering the hazard in mapping the wildfire risk, the socio-ecological aspect also plays an essential role in the WUI areas. In their theoretical work, the authors propose to join the effect of affected areas, socio-ecological impacts, and the effects of decision variables on improving the resilience of the urban–forest interfaces.
While the combination of aerial imagery with deep learning algorithms has nowadays leveraged the precision in identifying buildings and vegetation in WUI areas [
24,
25], interpreting the outcomes of these methods and the usual demand for large training datasets may restrict their applicability of all areas. In this perspective, Pereira et al. [
26] proposed assessing the WUI areas in Portugal using urbanisation data provided by the government. The study successfully mapped the large-scale WUI areas, but the authors mentioned that a detailed delineation of these segments along the perimeter of urban areas would enhance the methodology. Nevertheless, relying solely on the post-processed governmental data may subject the methodology to updates and cause delays in the monitoring processes.
Considering the complexity of defining a methodology to identify interface zones, it often becomes necessary to adapt those to suit regional requirements, bearing in mind the specificities of the area. In developing the Wildland–Urban Interface Index (WUIX) methodology, Caballero [
27] tested his index in the post-wildfire event of Mati, Greece [
28], yielding promising results in terms of correctly identifying exposure levels in a local/regional context. However, no further validation was carried out to enable the application of this method for the Mediterranean region as a whole [
29,
30,
31], thus limiting the results when applied to the Portuguese context, for example.
From this perspective, considering the fundamental high value of accurate information about the WUI areas in villages, this paper seeks to provide a validation of the WUIX methodology through its application to Pedrógão Grande, Portugal, and the subsequent comparison of its results with actual fire scenarios in three villages affected by the abovementioned 2017 events [
32]. Ultimately, this work aims to contribute to enhancing the understanding of the WUI conditions of those villages at that time and to discuss the suitability of the WUIX methodology to be applied to the Portuguese territory, ultimately leading to more effective wildland–urban interface assessment and pointing out mitigation strategies.
2. Methodological Framework
To achieve the objective of the WUI assessment of the Pedrógão Grande region, the definition of the most affected villages was initially conducted. Through an examination of the aerial imagery related to the affected area [
32], ruins were identified, and based on the places with a higher concentration of them, the most affected villages as well as the extension of the damages were characterised.
2.1. Area Definition and Data Collection
As in a typical wildfire development, while the higher concentration of buildings and urban infrastructure shielded larger urban areas by reducing the available fuel, the surrounding villages within the Pedrógão Grande region were hardly affected by the event. These villages are predominantly small, and their geographical proximity to wildland areas resulted in the spread of vegetation and fuels into their urban environment. This scenario creates ideal conditions for the rapid percolation of fire and affecting of the dwellings.
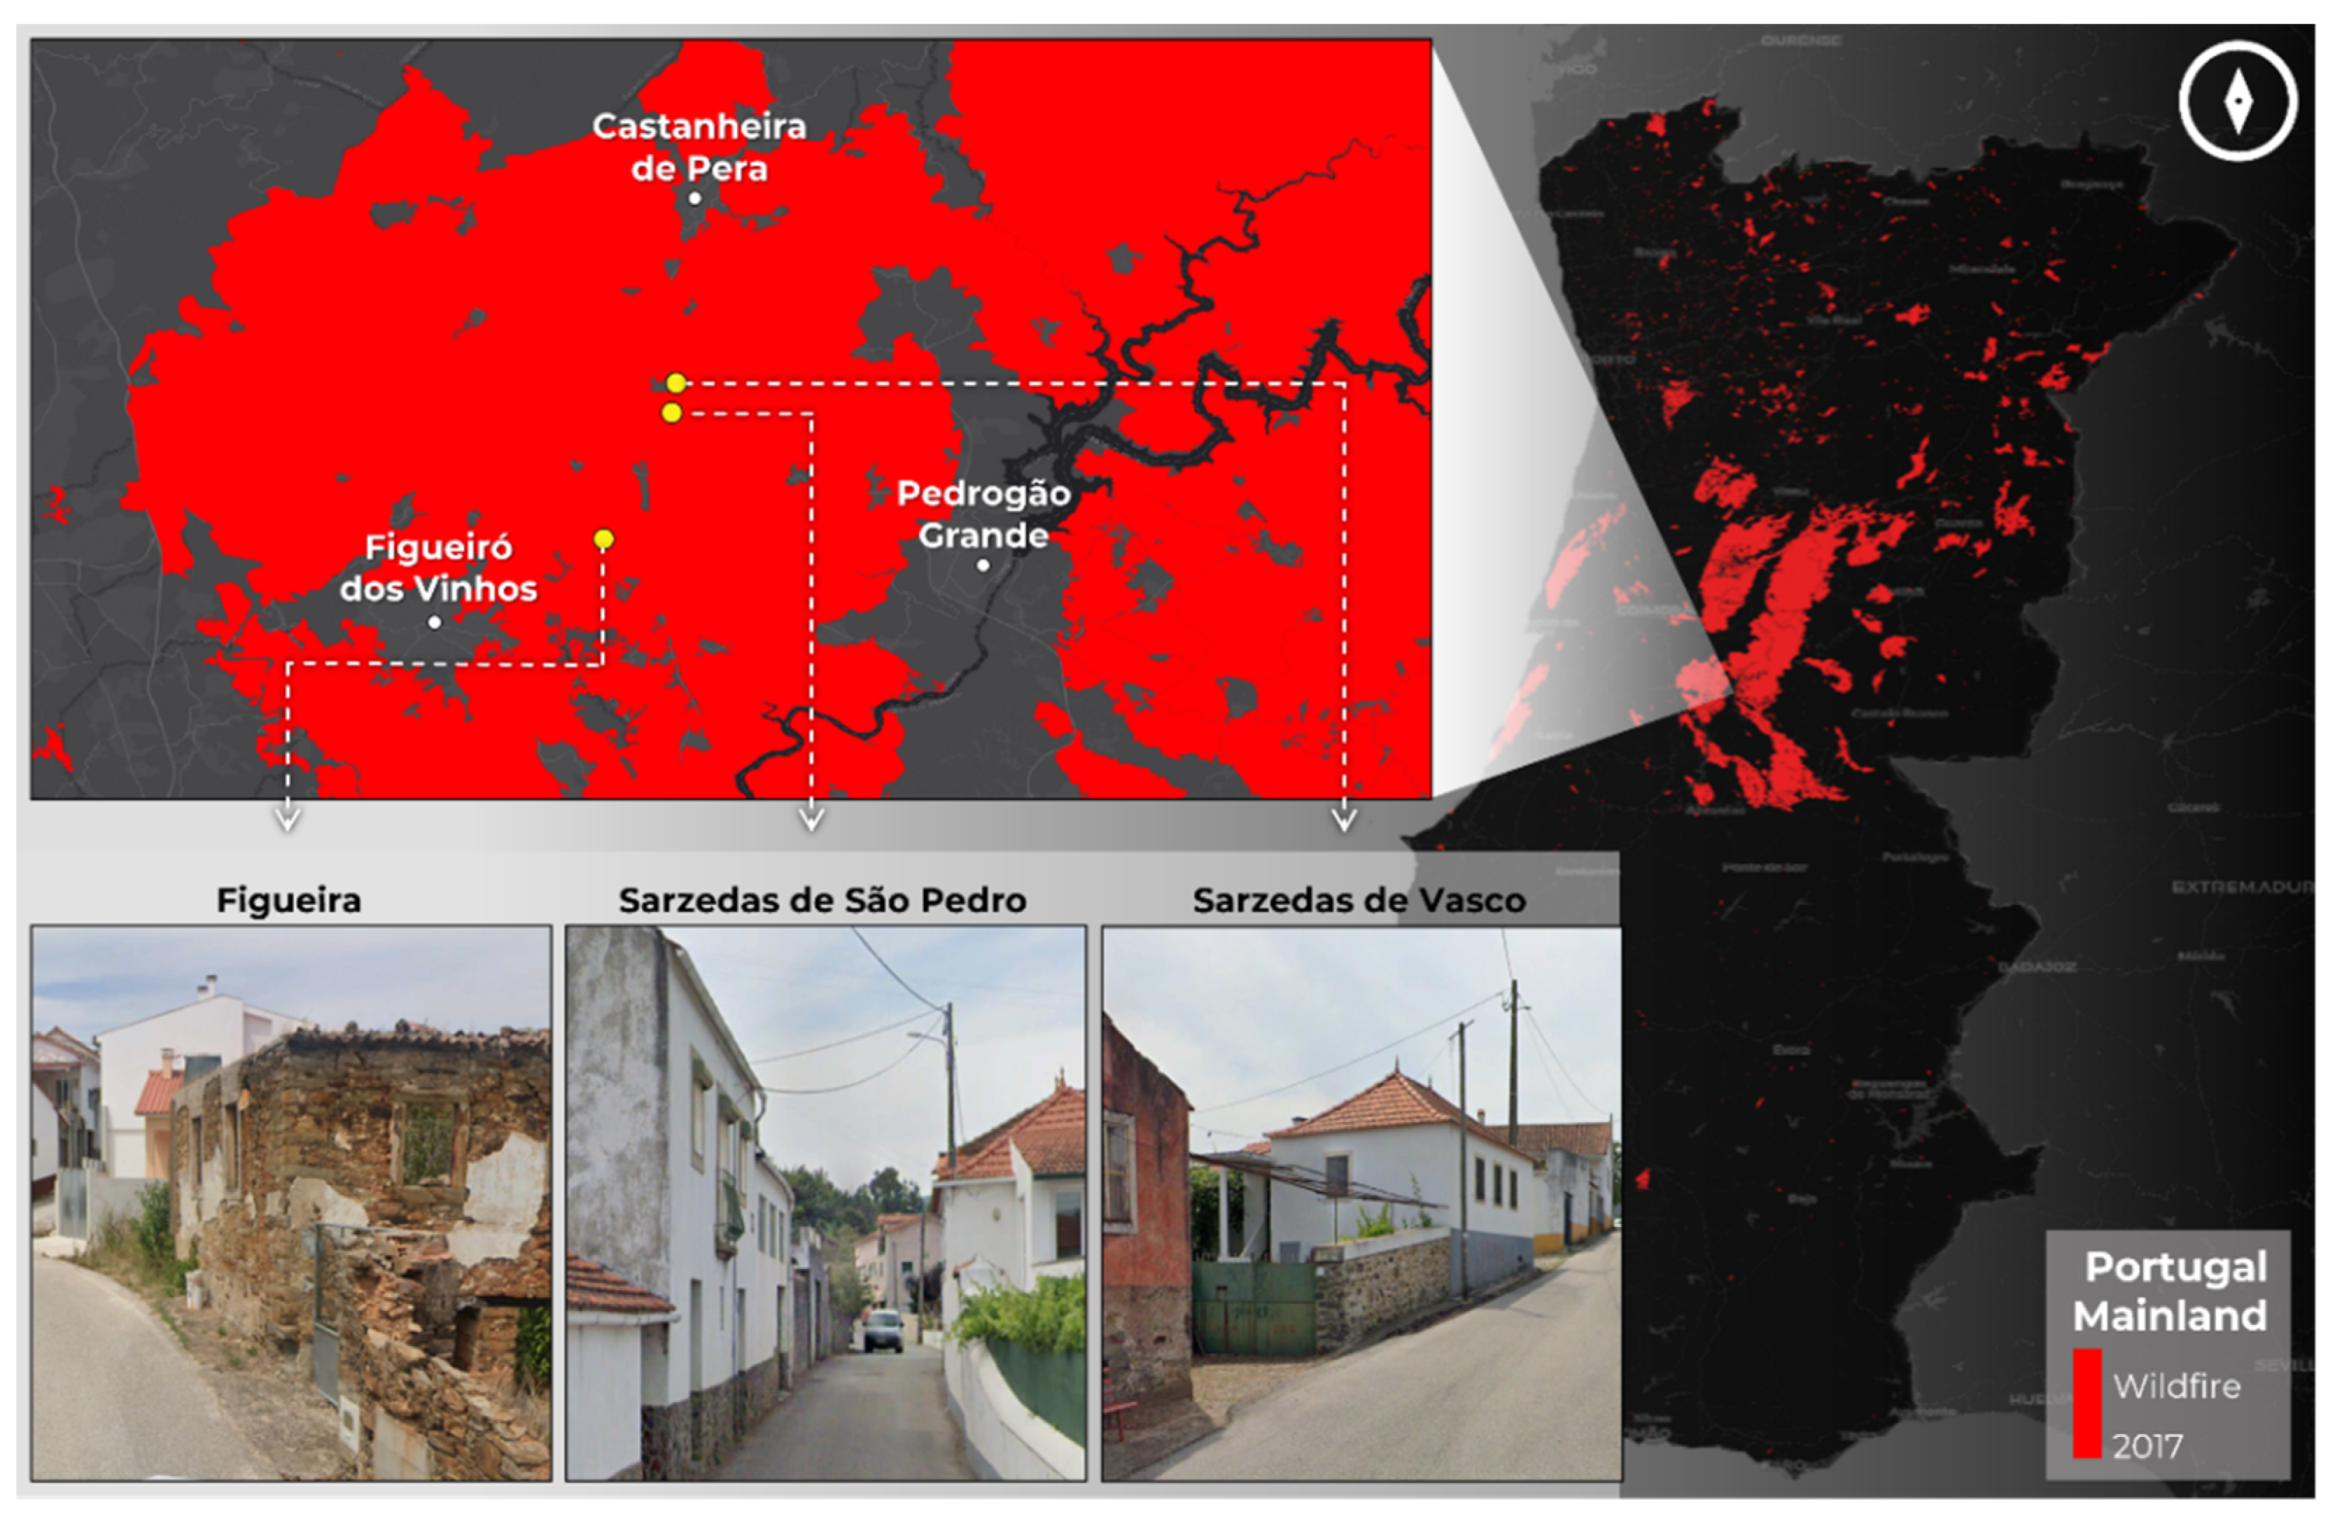
After a visual screening of the post-disaster satellite image, a region was identified as gathering a significant concentration of buildings destroyed. The region is in the middle of the triangle formed by the three major cities in the area: Pedrógão Grande, Figueiró dos Vinhos, and Castanheira de Pera (
Figure 1). In this area, besides a high concentration of forest, bushlands, and diverse vegetation, generally set in a very rugged terrain, the landscape is interspersed by numerous rural villages. These villages are primarily agrarian, i.e., their economy is based mainly on agricultural resources, although industrial and service buildings and zones were also identified.
Based on the collected information, it was determined that the most suitable choice for the case study would be villages located within this area. Among the possibilities, the villages of Figueira (Pedrógão Grande), as well as Sarzedas de São Pedro and Sarzedas de Vasco (both from Castanheira de Pera), were selected based on two primary criteria: the impact of the 2017 wildfires in those villages and their size.
Each of these villages was severely affected by the wildfires, yet they experienced no complete destruction, largely due to the efforts of firefighters and property owners who worked tirelessly to protect the dwellings and properties. The size of the villages was another factor in this selection since larger villages would implicate a more complex preparation process, involving a much higher number of polygons to be drawn without any expected positive contribution to the results since larger villages tended to be more protected by their urbanisation and fire combat. By focusing on these smaller and heavily affected villages, this study aims to reflect the impact of wildfires on WUI areas in a general sense.
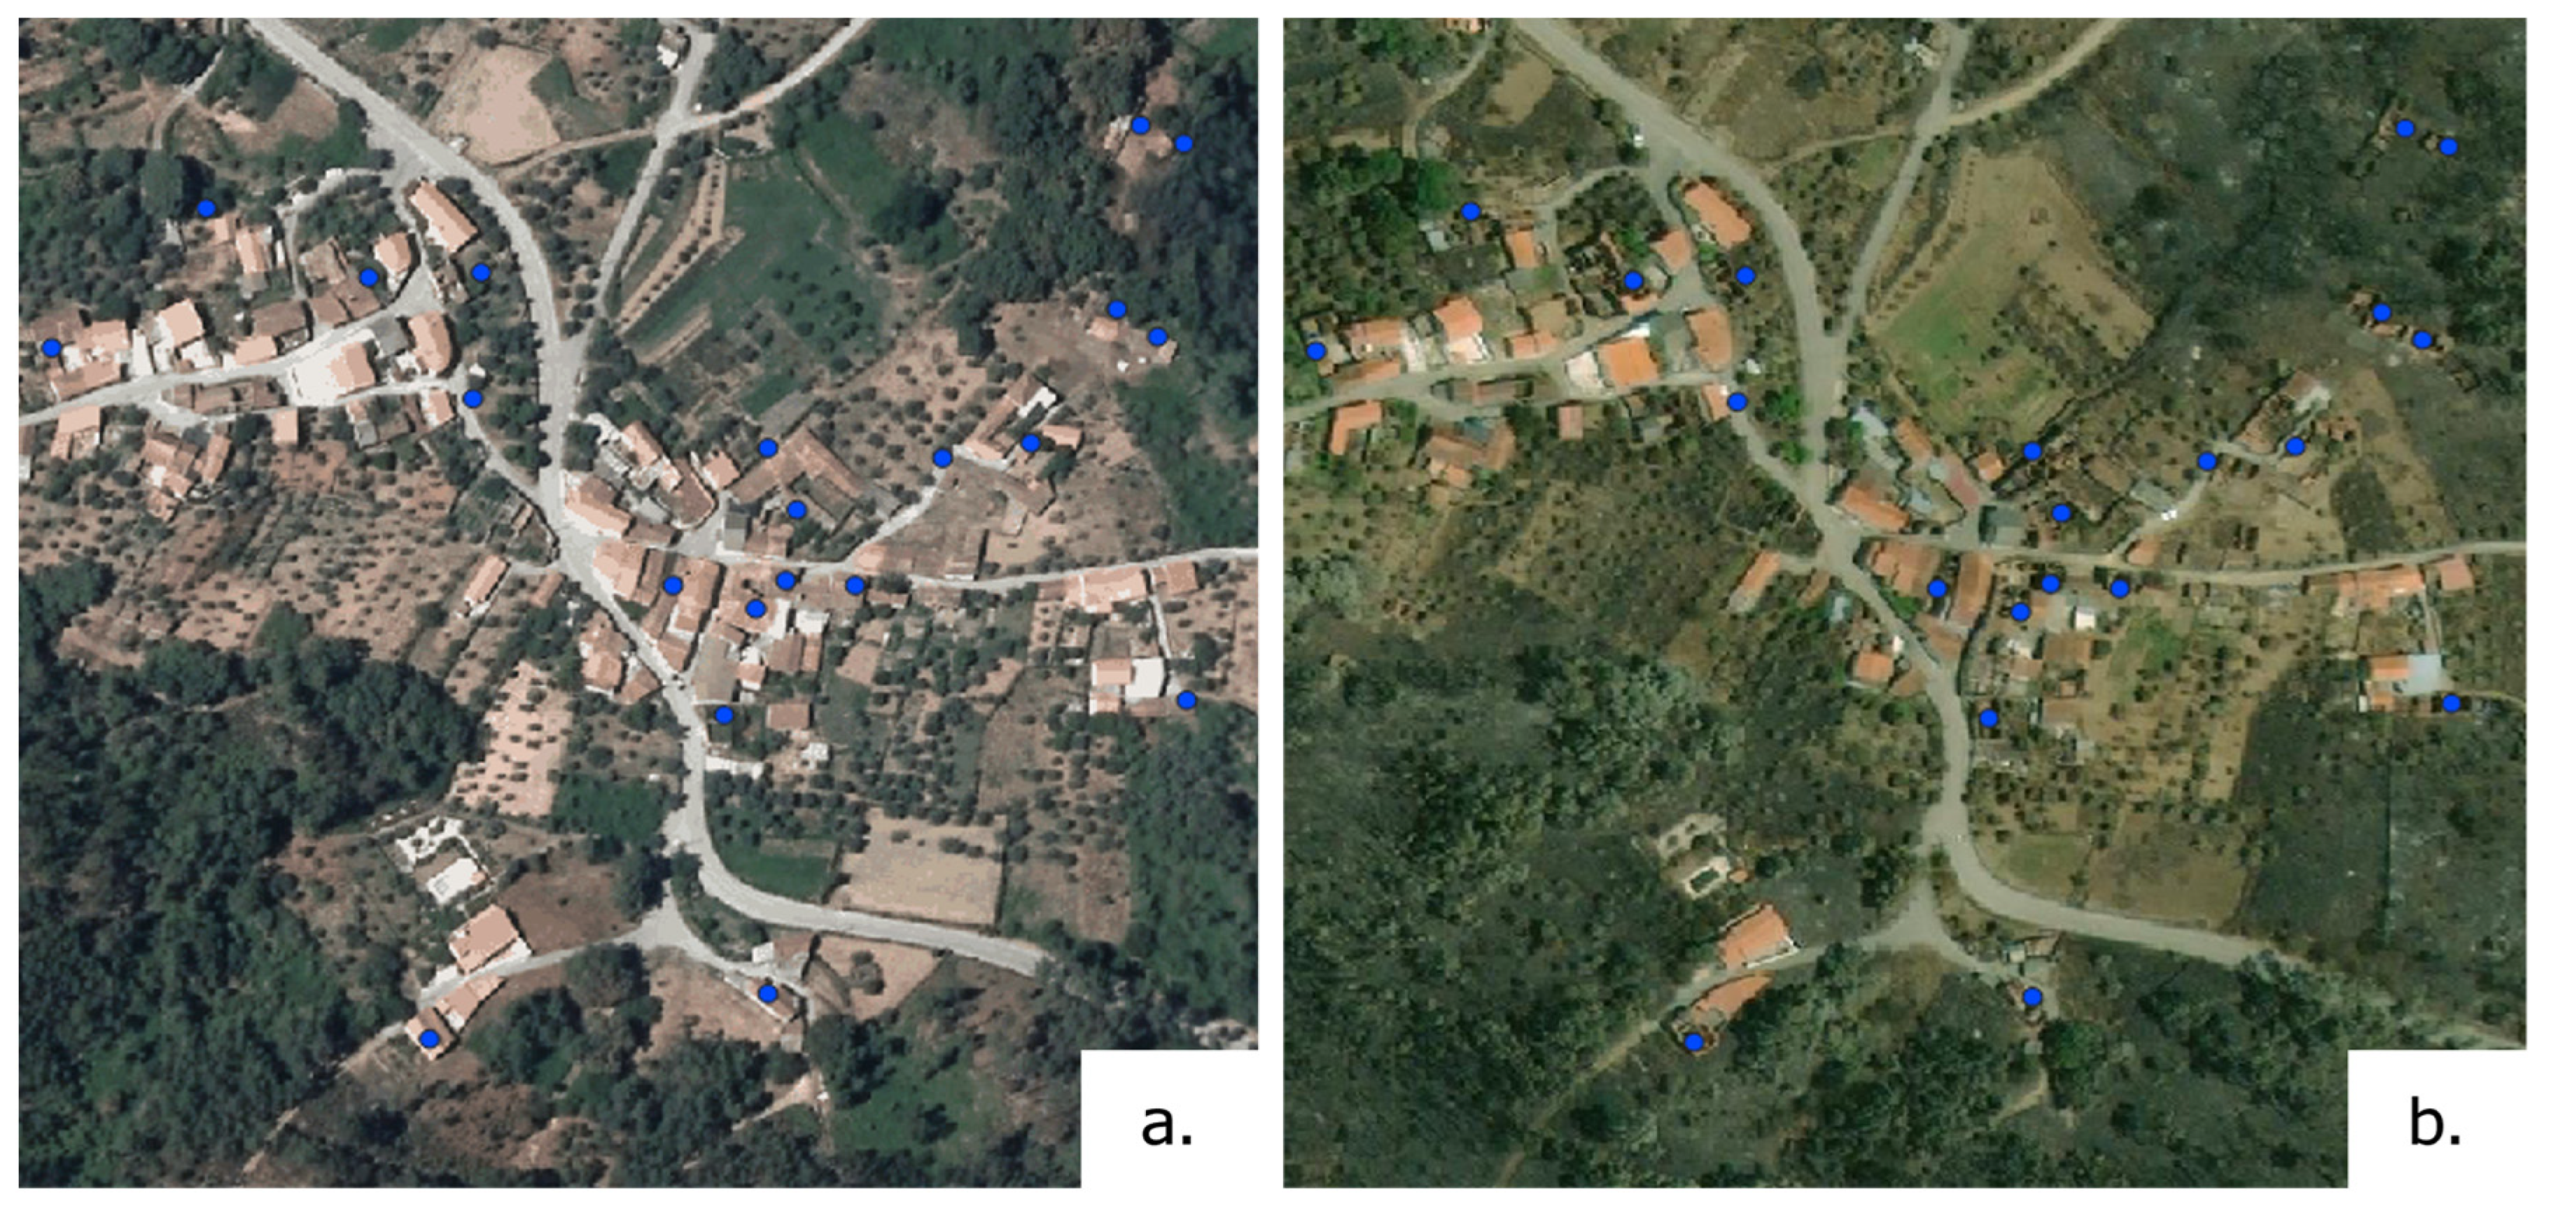
As a result of large-scale natural hazards, such as the one that occurred in Pedrógão Grande, Maxar Technologies [
32] has provided high-resolution aerial imagery of the affected regions. This imagery, which is intended to serve as a dataset for conducting post-disaster damage assessment, has enough detail to identify the ruins and paths of the fires. However, due to the processes of orthorectification of the pictures, the exact location of the buildings slightly differs from the images from 2015 provided by the Directorate General (DGT) [
33] that will be used for the methodology, for which more details will be presented in the next section. Through this process, the observed ruins in the vicinity of burnt vegetation were identified as caused by the fire, and to validate whether the ruins were already existent by the time they were captured two years before the disaster, the same manual identification procedure was also performed for the 2015 images (
Figure 2).
After the villages’ selection, the polygons of the buildings were drawn through aerial images from 2015 provided by the DGT (
Figure 3). This ensures that the analysis of interfaces between buildings, urban infrastructures and vegetated areas will be accurate when using this correspondent orthoimage. This was a critical stage because the analysis was made based on the patterns of the pixels on the images, meaning that minor discrepancies resulting from the construction or demolishing of buildings, as well as differences in the process of orthorectification and other interferences, can interfere on the inferences made from the analysis.
2.2. Background and Application of the Wildland–Urban Interface Index (WUIX)
Within the selection of the villages and the visual delineation of building polygons in the 2015 DGT images, it was possible to apply the WUI assessment method [
27]. This process was facilitated by a Python script developed for data preparation, processing, and implementation [
34]. The script automates the process of collecting aerial images from the database, extracts the vegetation by using well-established indices and the buildings from the vectorial file, converts these data into inputs for applying the WUIX and converts these back into georeferenced results to be analysed and the map of interface types
1.
To assess the WUI areas, the Wildland–Urban Interface Index (WUIX) methodology [
27] systematically approaches the zones provided. It evaluates the level of exposure to wildfires when they result from the interplay between human settlements and vegetation. This methodology resorts to aerial or satellite imagery combined with georeferenced building polygons, information that, although it can be obtained from public repositories or open access geodata sources, needs to be treated in a way to separate the vegetation from the images and combined with building information.
The first step concerns the collection of aerial images. These aerial images are obtained from national agencies and serve as the foundation for the analysis. The basic requirements for the images are related to the resolution required to correctly identify the local elements as well as the availability of infrared imagery to pair with the natural satellite image. This element is necessary to manipulate the pixels on the images and identify the vegetation. To ensure the accuracy of the subsequent procedures and of the comparison of the outputs with the burnt areas from Maxar images, the images were collected based on georeferencing calculated on a Python script. Only orthophotos from 2015, which is the latest imagery produced by the Portuguese Agency (DGT) with the required spectral bands (R, G, B, and NIR), were used in this research.
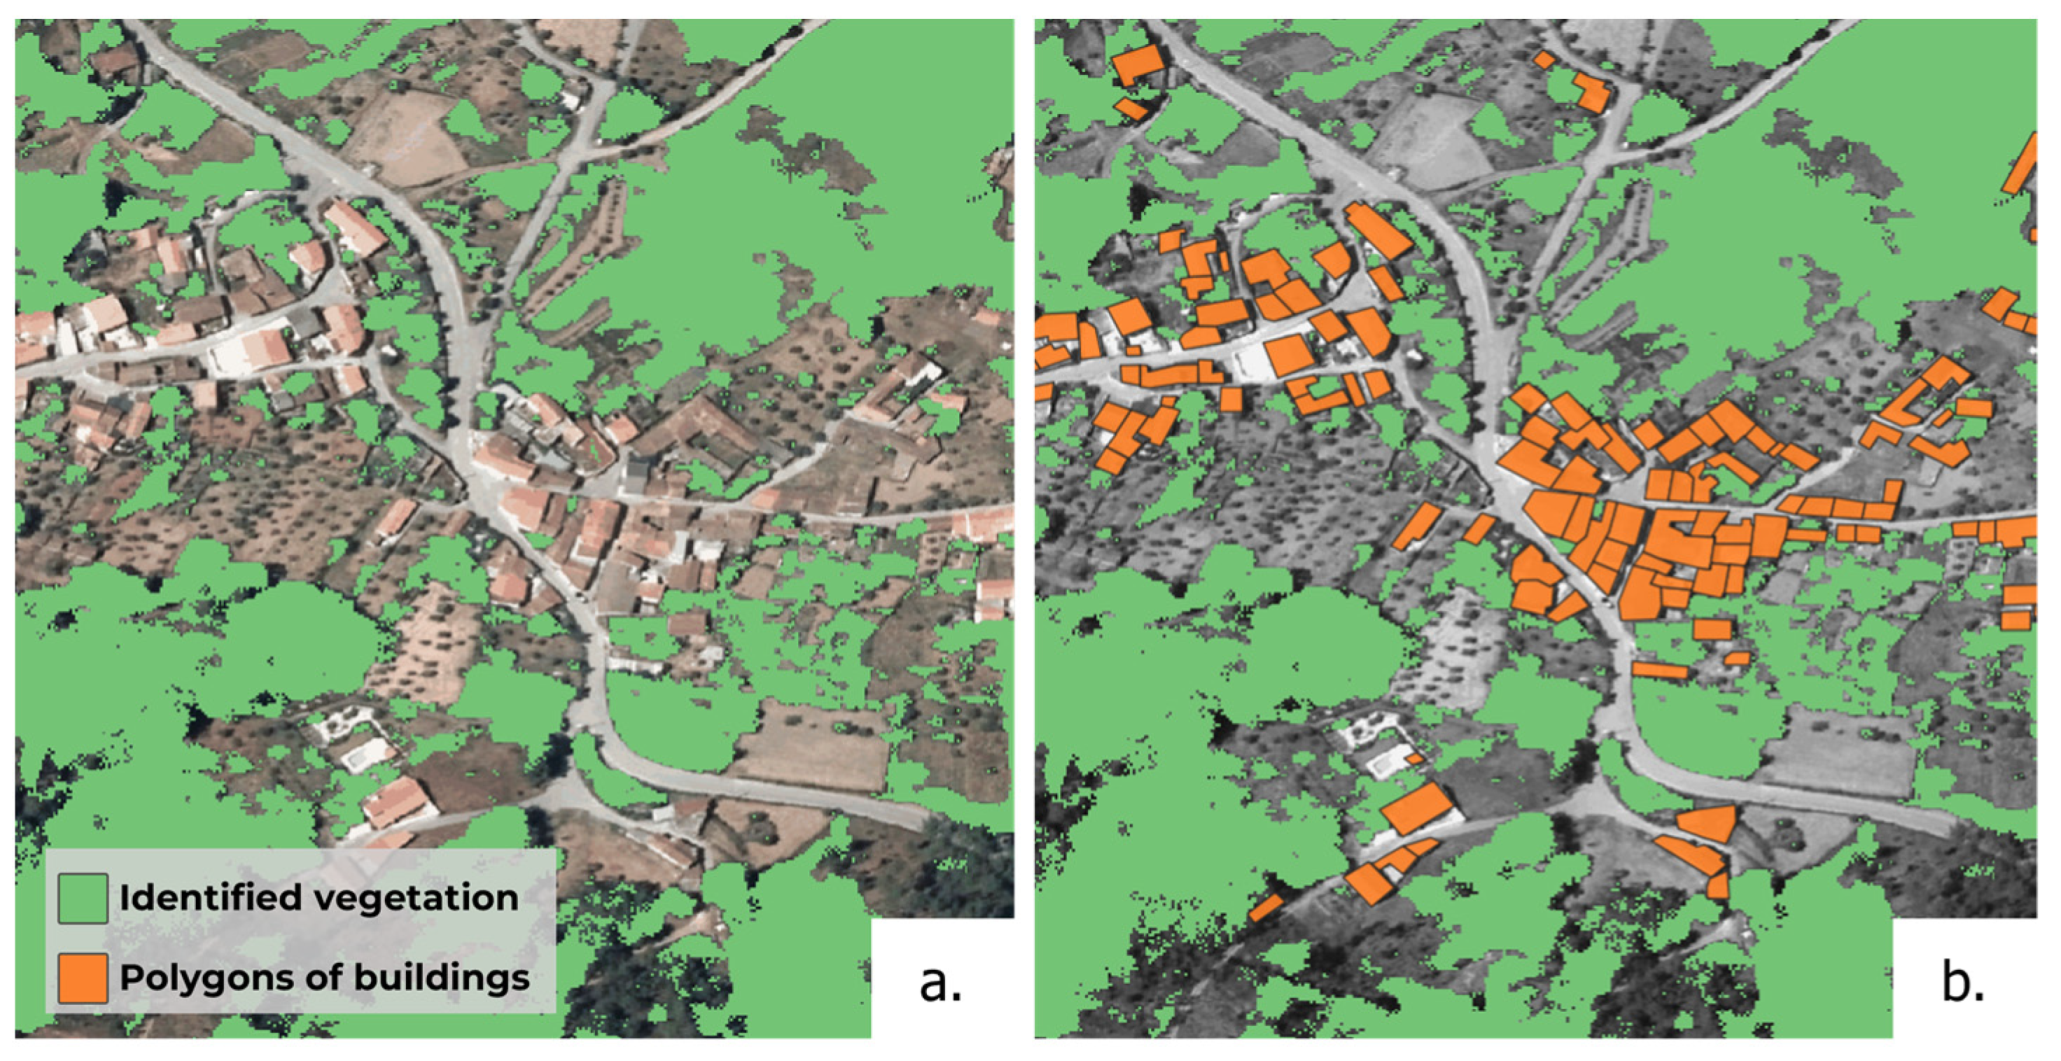
Following the acquisition of aerial images, the Python script was used to apply colour band extraction, unravelling the problem of accurately capturing the vegetation from the orthoimages. By applying two different indices, such as the Normalised Difference Vegetation Index (NDVI) and the Green Normalised Difference Vegetation Index (GNDVI), the amount of vegetation was estimated based on its density and vitality. Details about the selection of the most appropriate index for the requirements of the analysis and data about the vegetation can be found in GNDVI.
After preprocessing and preparing the data about the vegetation and housing for the application of WUIX (
Figure 4), these will serve as an input for the methodology to proceed to the core of the process by determining and levelling zones with elevated WUI exposure due to the interaction between the built environment and the surrounding vegetation. Such is determined herein using the Continuity and Friction indices and WUIX proposed by [
27].
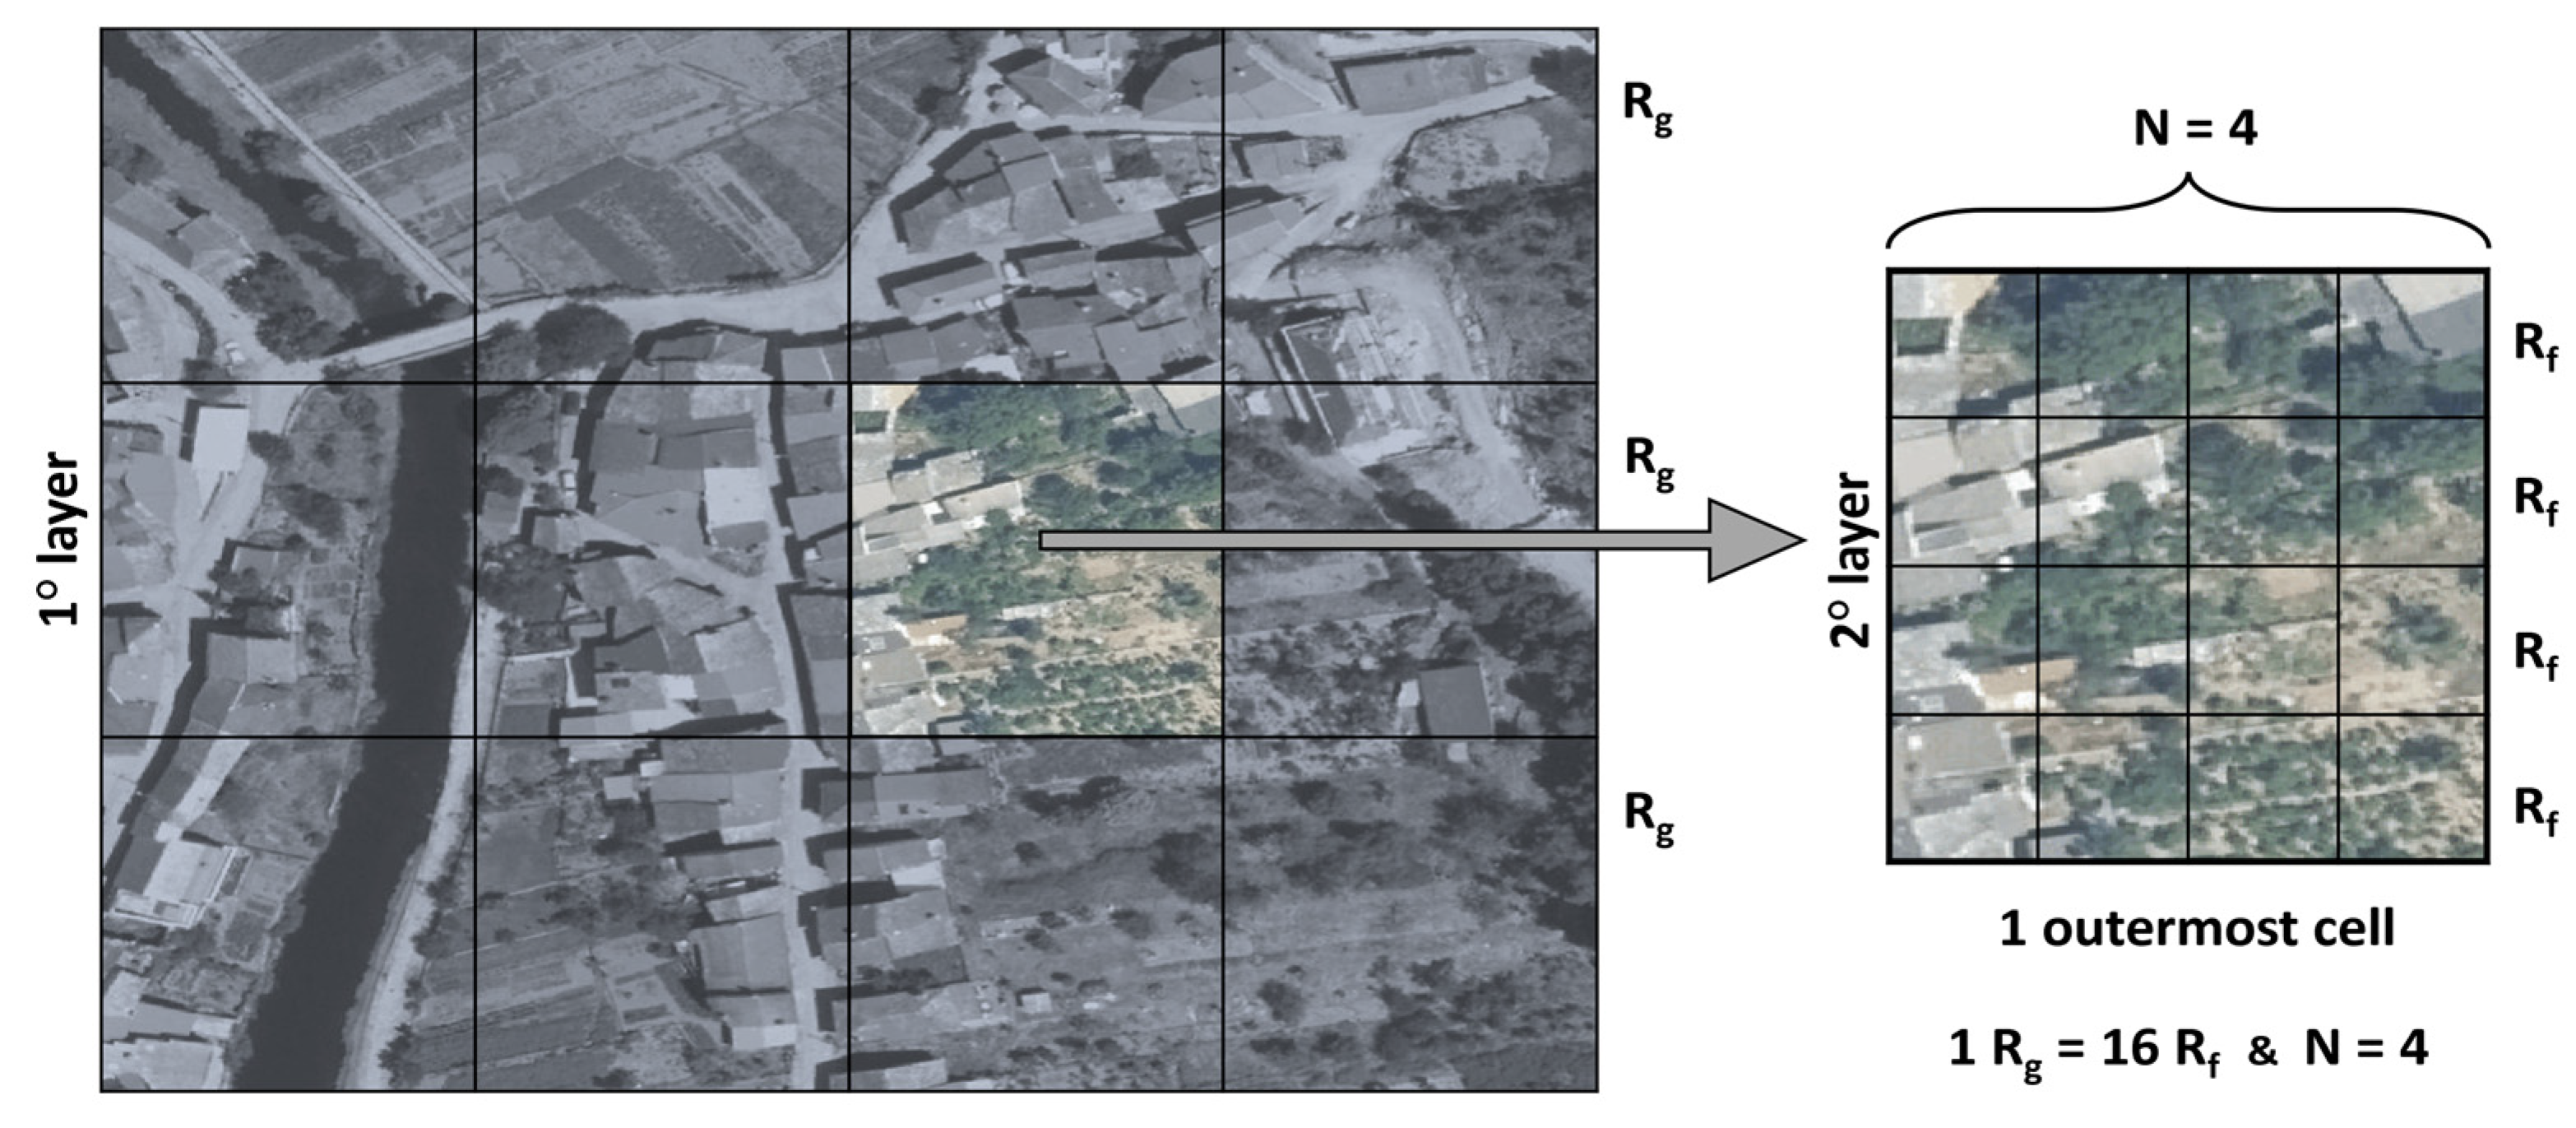
In short, the first step for applying the WUIX approach involves creating calculation matrices: the study area is divided into matrices with two levels, each having different resolutions, creating a hierarchical structure (
Figure 5). In this scenario, the inner level is the split of all the data into a matrix with fine cells, while the second level is formed by grouping them in a set of matrices where each of their large cells has a number
N² of fine cells. From this, two key metrics are defined:
Rf (fine resolution), and
Rg (large resolution).
The choice of N, the large resolution basis, is critical for interpreting the outputs. Smaller N values result in finer results and less concentrated information. Larger N values, on the other hand, may lead to misrepresentations due to a high number of fine cells being diluted in a few large ones. The value of N should be appropriate for the analysis, such as garden analysis (8–10 m) or interface configuration (50–100 m).
Continuity (Ci) and Friction (Fi) are the key coefficients of the WUIX and are computed based on each fine-resolution cell. These coefficients are gathered by measuring the proportion of neighbouring vegetation as well as the existence of a building polygon in that cell and its adjacencies. For Ci, a value of 1.0 is added for each adjacent cell containing vegetation and 0.5 for the corner cells. As for Fi, a similar process was performed for cells containing overlap between vegetation and buildings, summing up 1.0 more value for overlap within the cell itself. In summary, Ci ranges from 0.0 to 6.0, while Fi ranges from 0.0 to 7.0.
This matrix of values is then aggregated into large-resolution cells (
Cg and
Fg) by capturing the fine cells constrained inside each large cell and summing up its multiplication by each
Rf. Continuity and Friction coefficients are obtained through Equations (1) and (2).
Ultimately, the Wildland–Urban Interface Index (WUIX) (
Wg) for every
Rg cell is acquired by multiplying the large cell of continuity by friction, Equation (3). The final WUIX is expressed in square metres (m
2).
To enhance the readability of the results, the values obtained for Rg can be converted in two different ways. First, by comparing each indicator to the worst-case scenario, it is possible to convert the scale of the values into a percentage. Although these indices became comparable between the different grid sizes, they might be challenging to interpret since results close to the worst-case scenario are not commonly obtained. To convert the outputs into more meaningful representations, Continuity and Friction indices and WUIX can be converted into specific values by area. This conversion allows for intuitive comparisons and analyses.
Since this study involves conducting a comparison between the sizes of the grid (
Rg), the most adequate conversion of WUIX values is the normalised one, explained above. For further details about the conversion, please refer to Caballero (2019) [
27]. Yet, following the range recommended by the author,
Rf was defined in 1 m. The
N value was set in a range from 5 to 65 m in intervals of 5 m.
2.3. Testing the WUIX Outputs
The georeferenced WUIX values and the data observed from the 2017 post-disaster satellite imagery [
32] were compared to validate the obtained results. This evaluation aimed to understand the accuracy of WUIX methodology in identifying the vulnerable areas in the Portuguese context of Pedrógão Grande, and to point out limitations on the process of classifying areas that should be identified as burned or unburned when calculating their WUIX.
To provide means for this comparison, buildings were further classified into three groups based on the impact of the wildfire on them. This was carried out by analysing the burned areas on the MAXAR satellite image. The categories are as follows: “No-affec” for the buildings that, based on the satellite image, was clear to see were affected by the fire; “Surro-affec” for the buildings whose surroundings were noticeably burned, although these might not have been burned down by the fire (it was inconclusive from the satellite image); and “build_affec” for the buildings that were noticeably affected by the fire (often in ruin or with apparent damages on the roof).
By updating the shapefile, it was possible to assign to each building both the WUIX found based on the DGT orthophoto of 2015 and the assessed categories from the post-event image after the massive wildfire in 2017. The process of assigning WUIX values for each building is also based on a condition: since the definition of N value does not necessarily match the size of the polygon, the highest WUIX value intersecting the building was considered the relevant one. This way, the largest identified exposure is defined as the standard value of the polygon.
From the comparison, it was expected to obtain lower values of WUIX for non-affected areas and higher values for those affected directly and by the surroundings. This outcome would support the idea of the correlation between WUIX and the ground truth. The process of testing WUIX was performed through a Python script that imports the data and applies statistical methods to assess the accuracy of WUIX2, and the results of this analysis are presented in the next section.
3. Results and Discussion
Before analysing the variations between the different types of fire effect, a correlation analysis was performed on each
N number, from 5 to 100, with increments of 5, to assess the influence of this parameter on the normalised WUIX. To perform the correlation analysis, the normality of the data was tested using two different statistical tests (see
Table 1).
The table shows that in all villages and both tests, there was a failure to keep the hypothesis of parametric data. These tests confirmed the hypothesis suggested by the data that most of the WUIX values are close to zero but are not negative, meaning that the distribution is skewed to the left. From the non-parametric assumption, a Spearman’s rank correlation test was performed between the product of the WUIX methodology and the actual scenario for each village and the entire sample (
Figure 6).
In order to implement it, the categories of fire effect were converted into two categories: “both buildings and the surroundings were affected”; and “non-affected”. In this way, it was possible to obtain a better correlation between the higher WUIX values and the affected buildings. Likewise, the correlation between the lower WUIX values and the non-affected group was also improved. Additionally, to avoid misinterpretations, whenever the WUIX values were divergent by more than 2%, they were considered non-correlated.
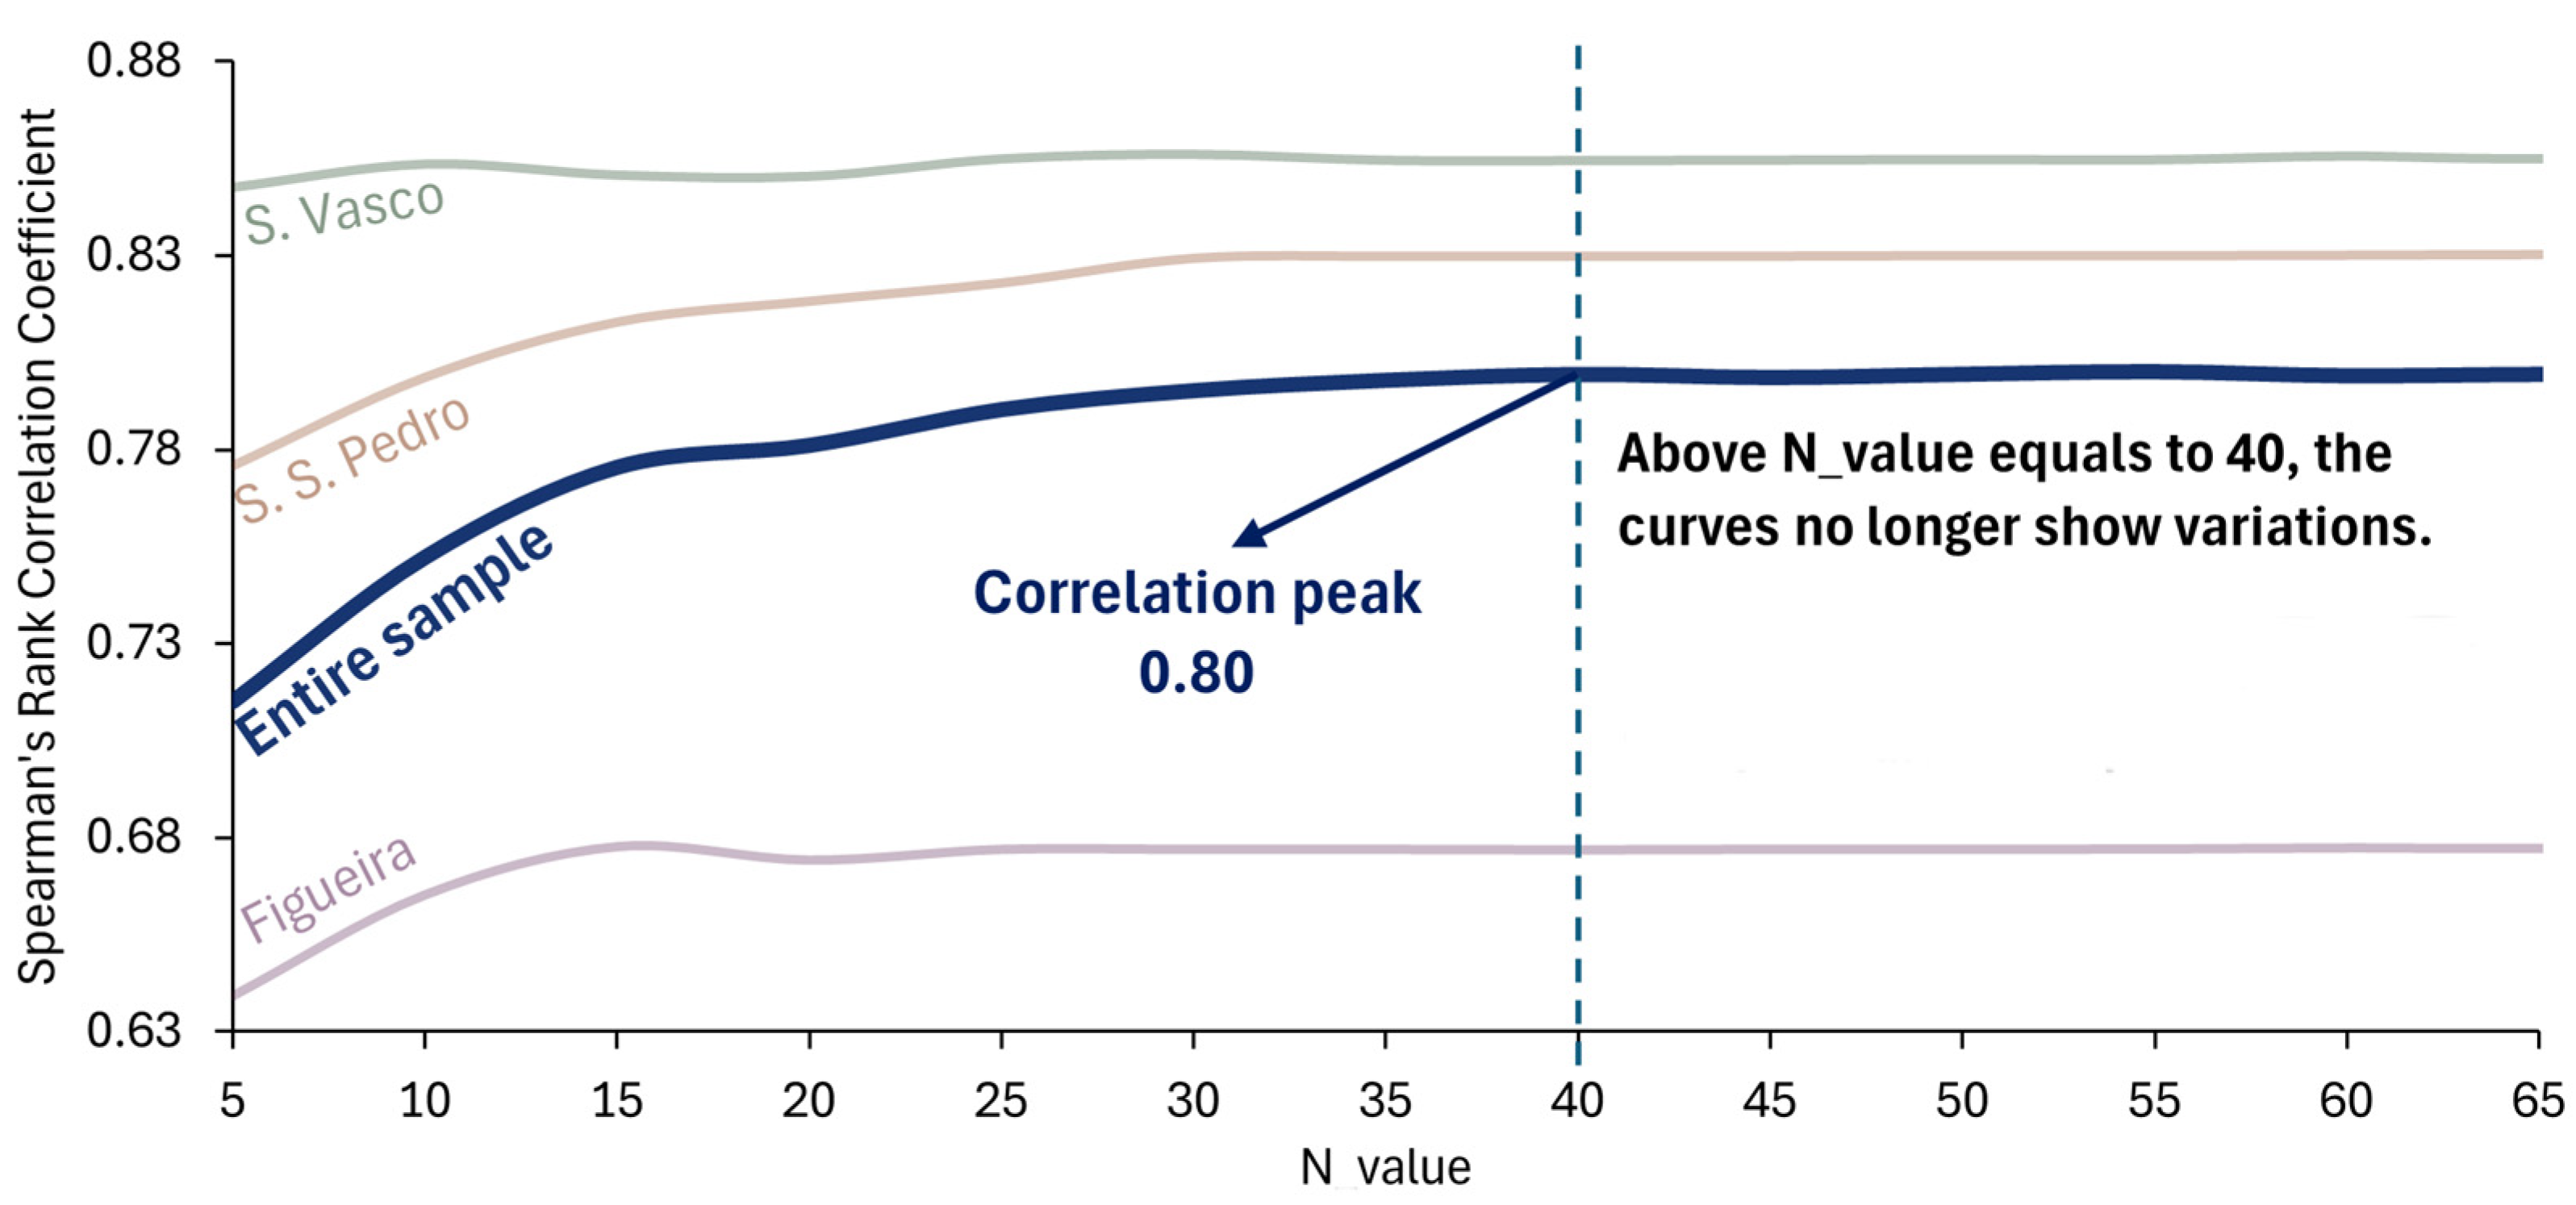
The graph of
Figure 6 shows that the correlation of the group “Entire sample” presents a steady increase for
N values ranging between 5 and 25 and peaks when
N equals 40 (Spearman’s rank correlation coefficient = 0.80). For
N values greater than 40, Spearman’s rank correlation coefficient remains relatively constant, which means that the correlation is no longer affected by the limitation on non-affected buildings, as explained above. This is because the
N value is negatively correlated with the WUIX, i.e., the greater the value of
N, the smaller the WUIX. Therefore, when
N is equal to or greater than 45, no non-affected building presents a WUIX value greater than 2.
When analysing the curves given in
Figure 5 individually, it is possible to observe that Sarzedas de Vasco presented a higher, almost constant correlation, which diverges from the other curves. On the other hand, Figueira showed a lower correlation with the actual scenario overall; this fact might be related to the existence of some isolated buildings that were not captured by WUIX. The trends illustrated in
Figure 5 may denote that for larger grid sizes, the results of the WUIX are very attenuated, resulting in a loss of resolution.
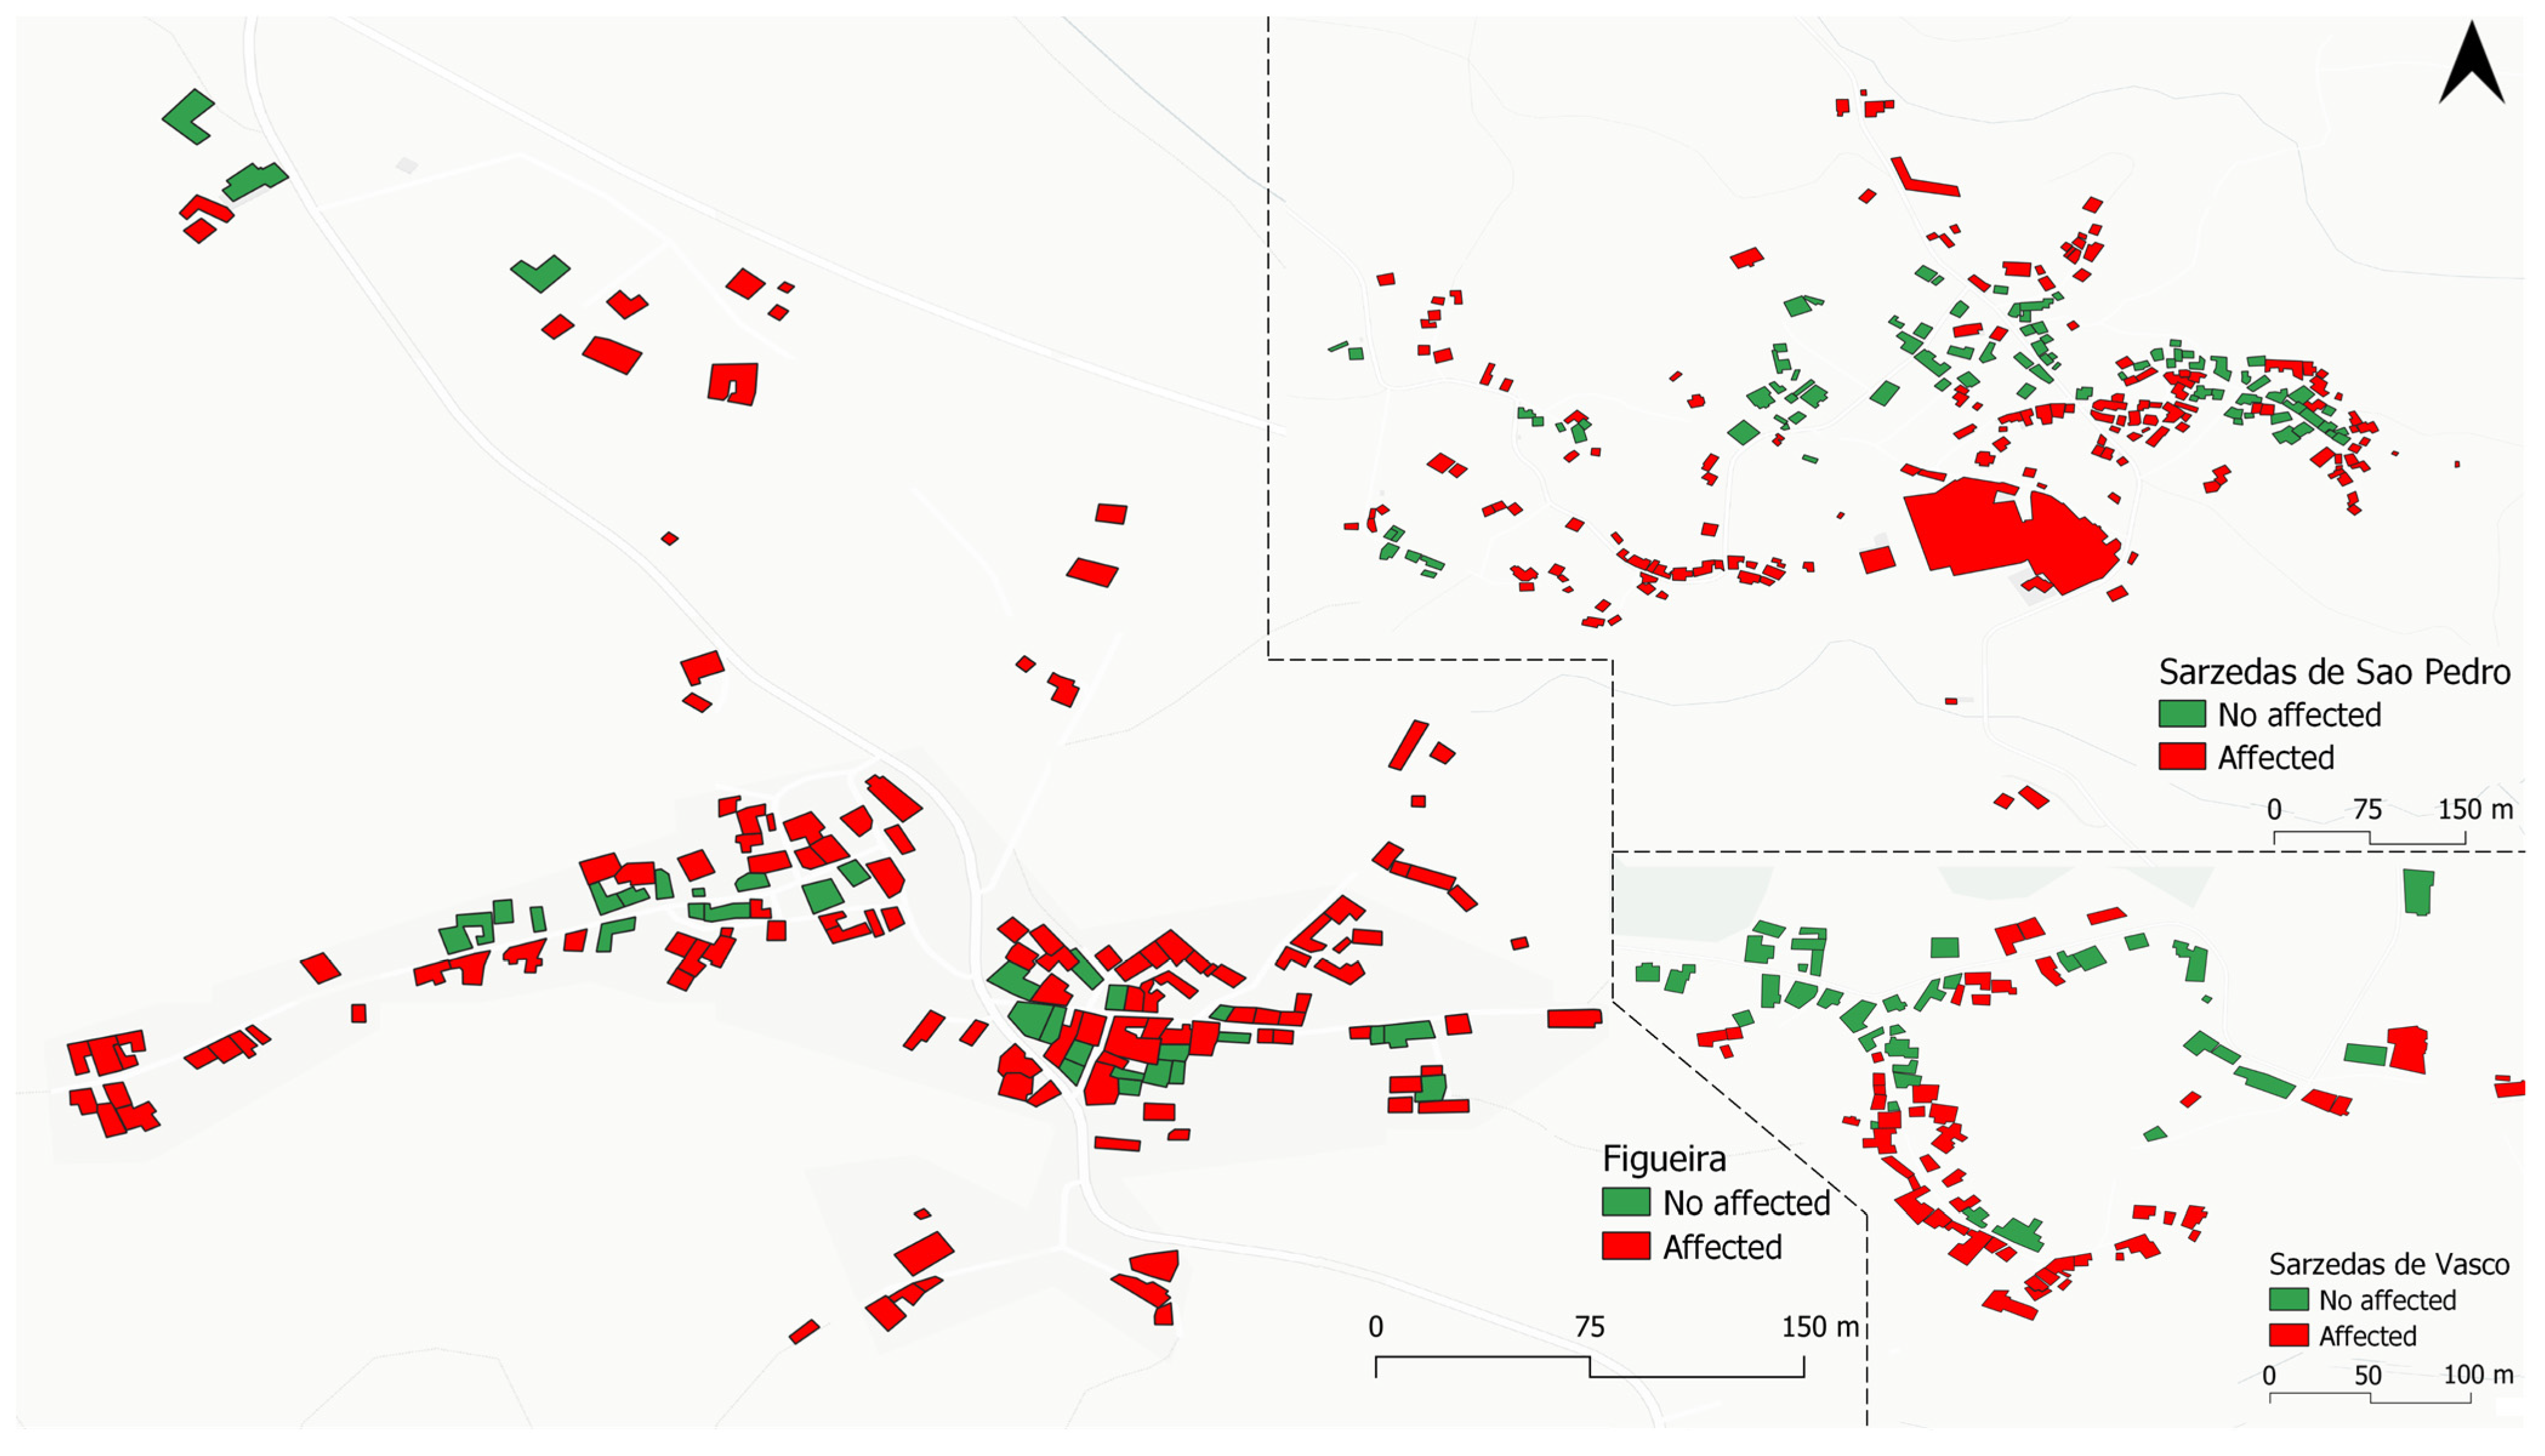
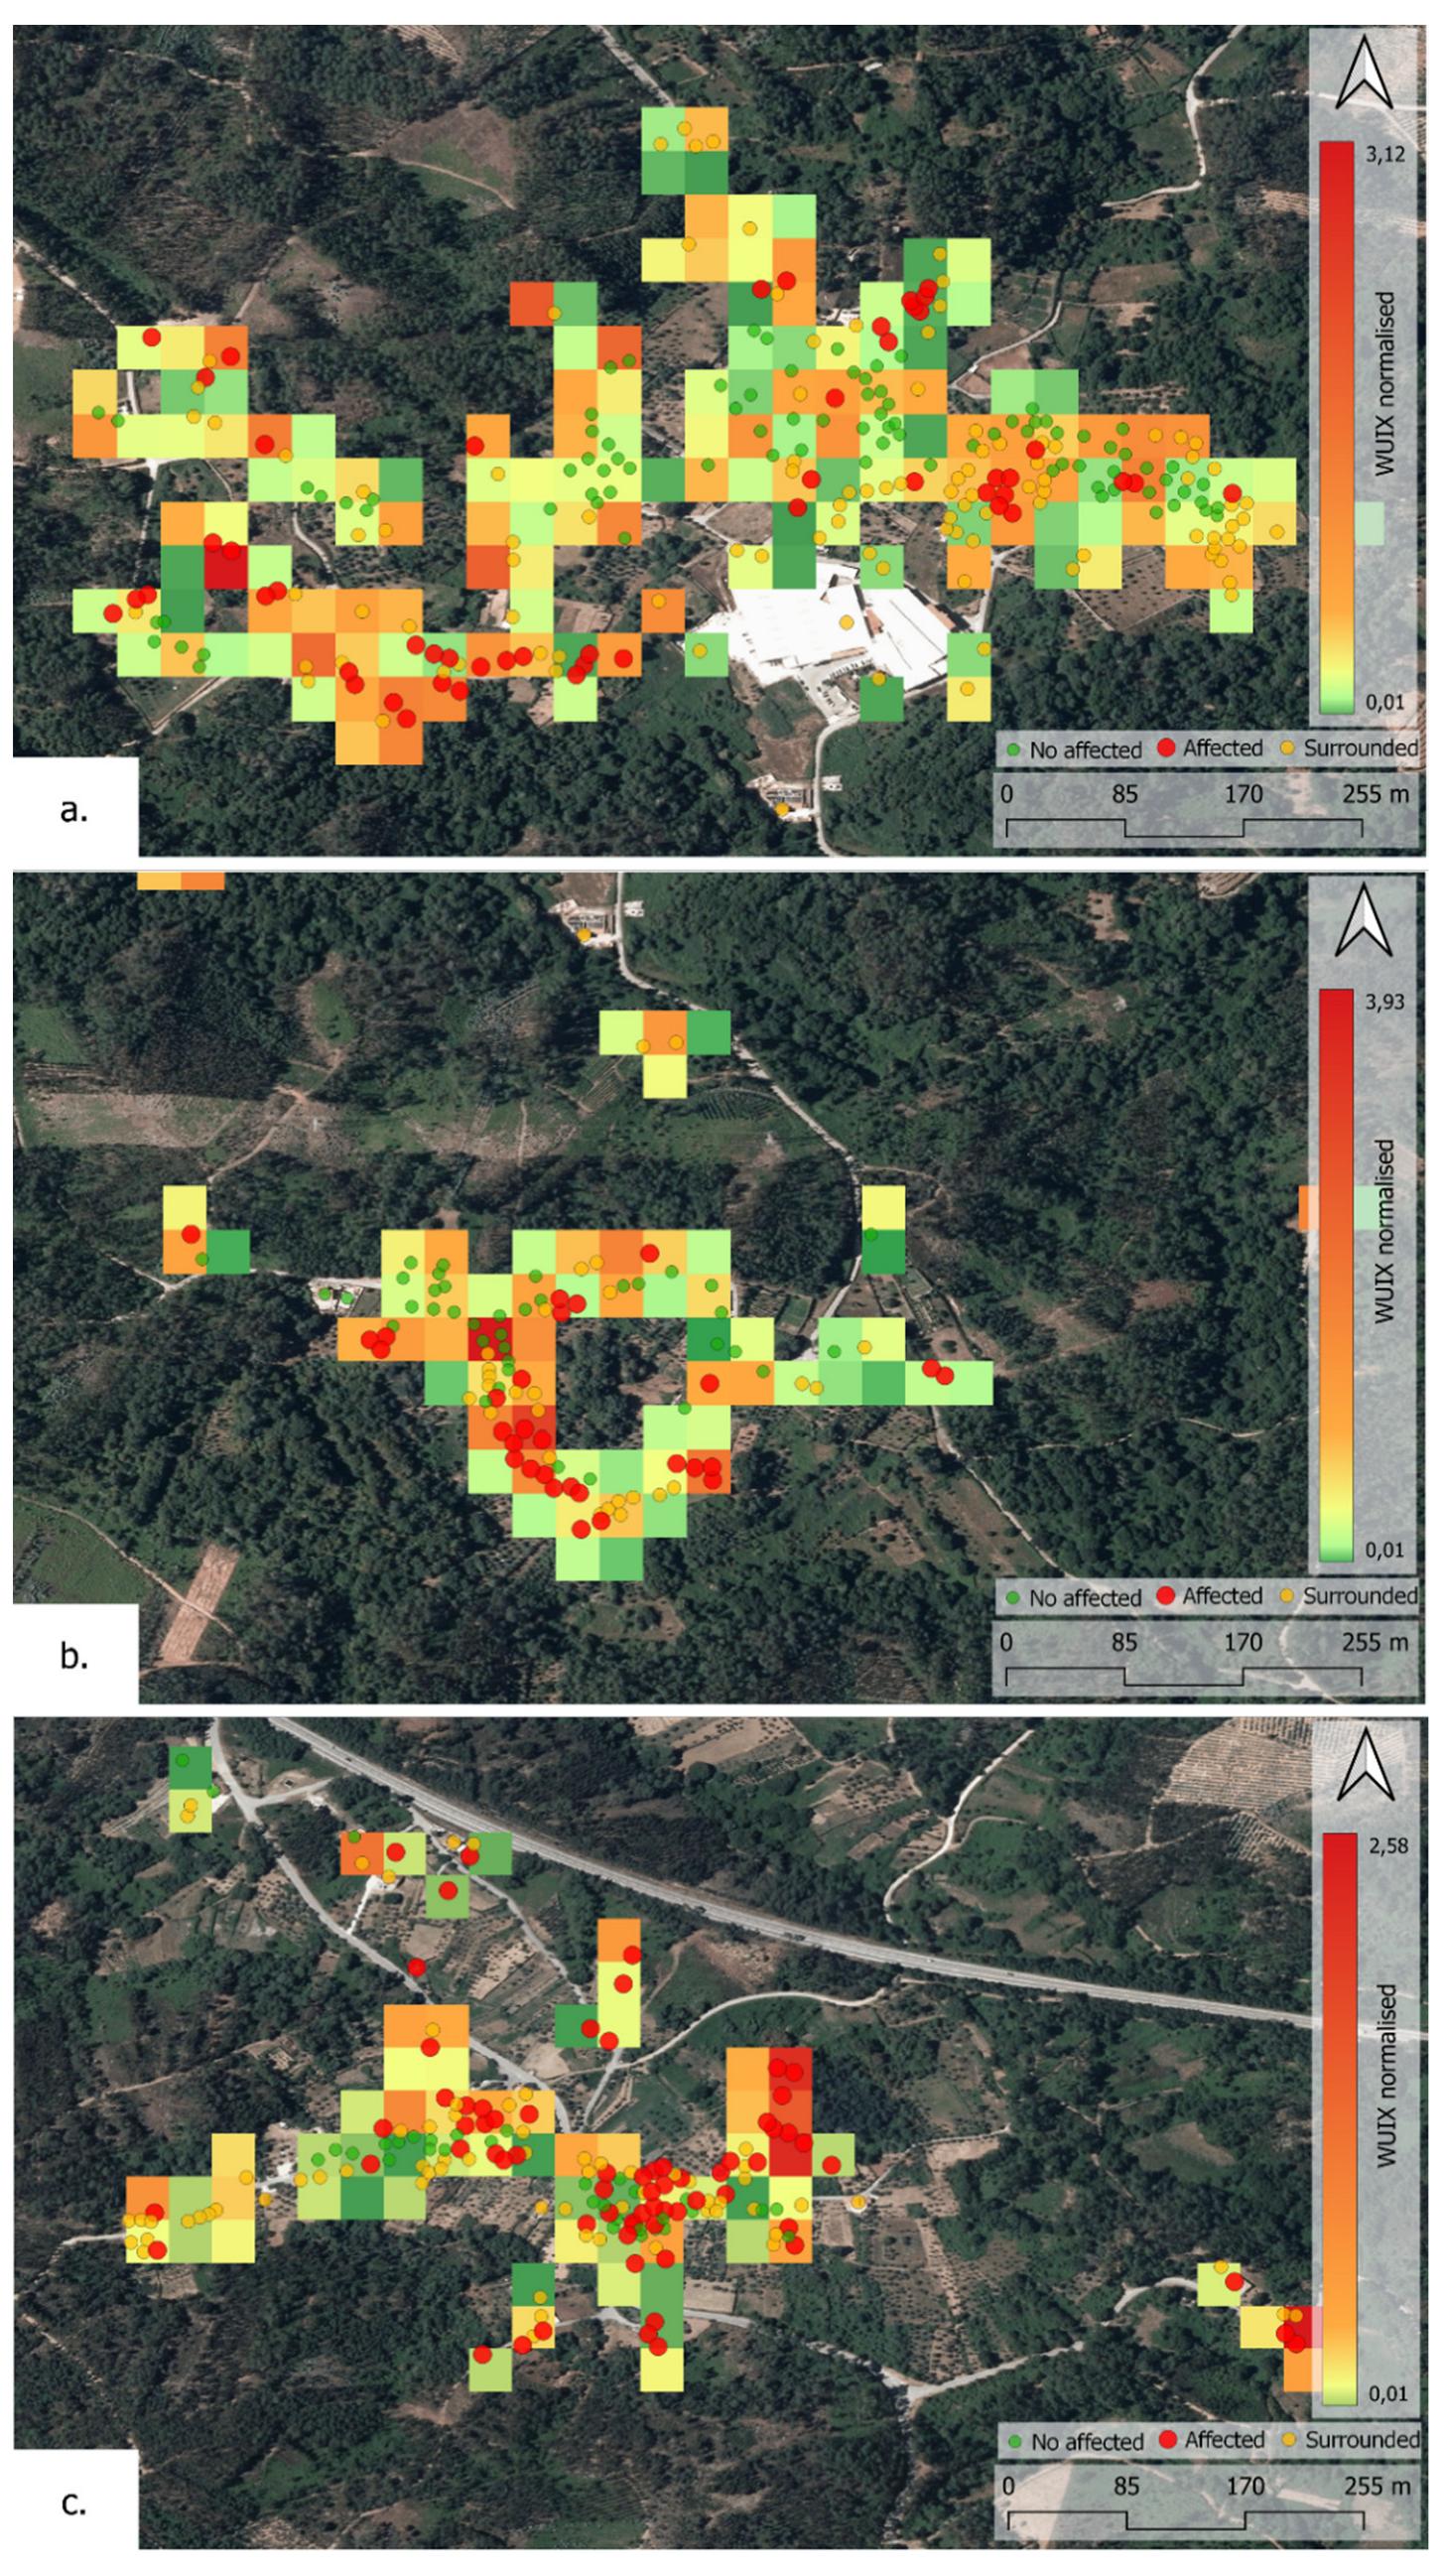
From the application of the WUIX methodology, a set of different ways to show the same results can be generated. Based on the previous correlation analysis, the normalised WUIX and an
N value equal to 40 were chosen to produce the outputs for the three villages (
Figure 7). The ruler in the map’s legend represents the data’s quartiles. As can be observed, the values close to zero are illustrated in the figure in green colour. The buildings are represented with red, yellow and green dots, standing for affected, surrounded and not affected, respectively.
The values obtained for the normalised WUIX being so low, not surpassing 4%, can be explained by the characteristics of these particular settlements. The tests carried out by Caballero [
27] were made in areas with a great amount of intermixed vegetation, with trees and shrubs directly surrounding the buildings. That is not common in Portugal, as was already observed in the Montesinho Natural Park’s reality [
34], where the vegetation surrounds the village as a whole instead of the buildings individually.
Summarising the fire effect attribute, an effect of 69.9% on the buildings directly or indirectly by the surroundings was found (
Table 2). Figueira was the village with higher severity of the effects of fire, while Sarzedas de Vasco showed less damage. Among the numerous reasons for the discrepancy, the distance from the forest and the dispersion of the buildings may have contributed to it.
From
Table 2, it is possible to notice that the category “Surrounding affected” includes a significant percentage of buildings. In this category, it is assumed that many of these buildings could be burned due to the fire; however, due to fire combat or other types of intervention acting as a suppressor of the effect, the fire was deviated to the building surroundings. There are also cases in which the fire damage was not evident on the satellite image, and, therefore, this adds uncertainty to the analysis. However, since WUIX quantifies the exposure to the wildfire, and given the previous considerations, the buildings with close surroundings affected by the fire were considered affected for comparison.
Yet, in
Table 2, it is evident that each village had a different behaviour. While in Sarzedas de Vasco, the fire effect is almost evenly distributed among the three categories, the buildings and the surroundings in Figueira were more severely affected. In Sarzedas de São Pedro, on the other hand, the surroundings were particularly affected. This is probably due to the size of the village, which is significantly larger than Sarzedas de Vasco and Figueira, how the fire was combated, and the greater dimension of non-vegetated areas.
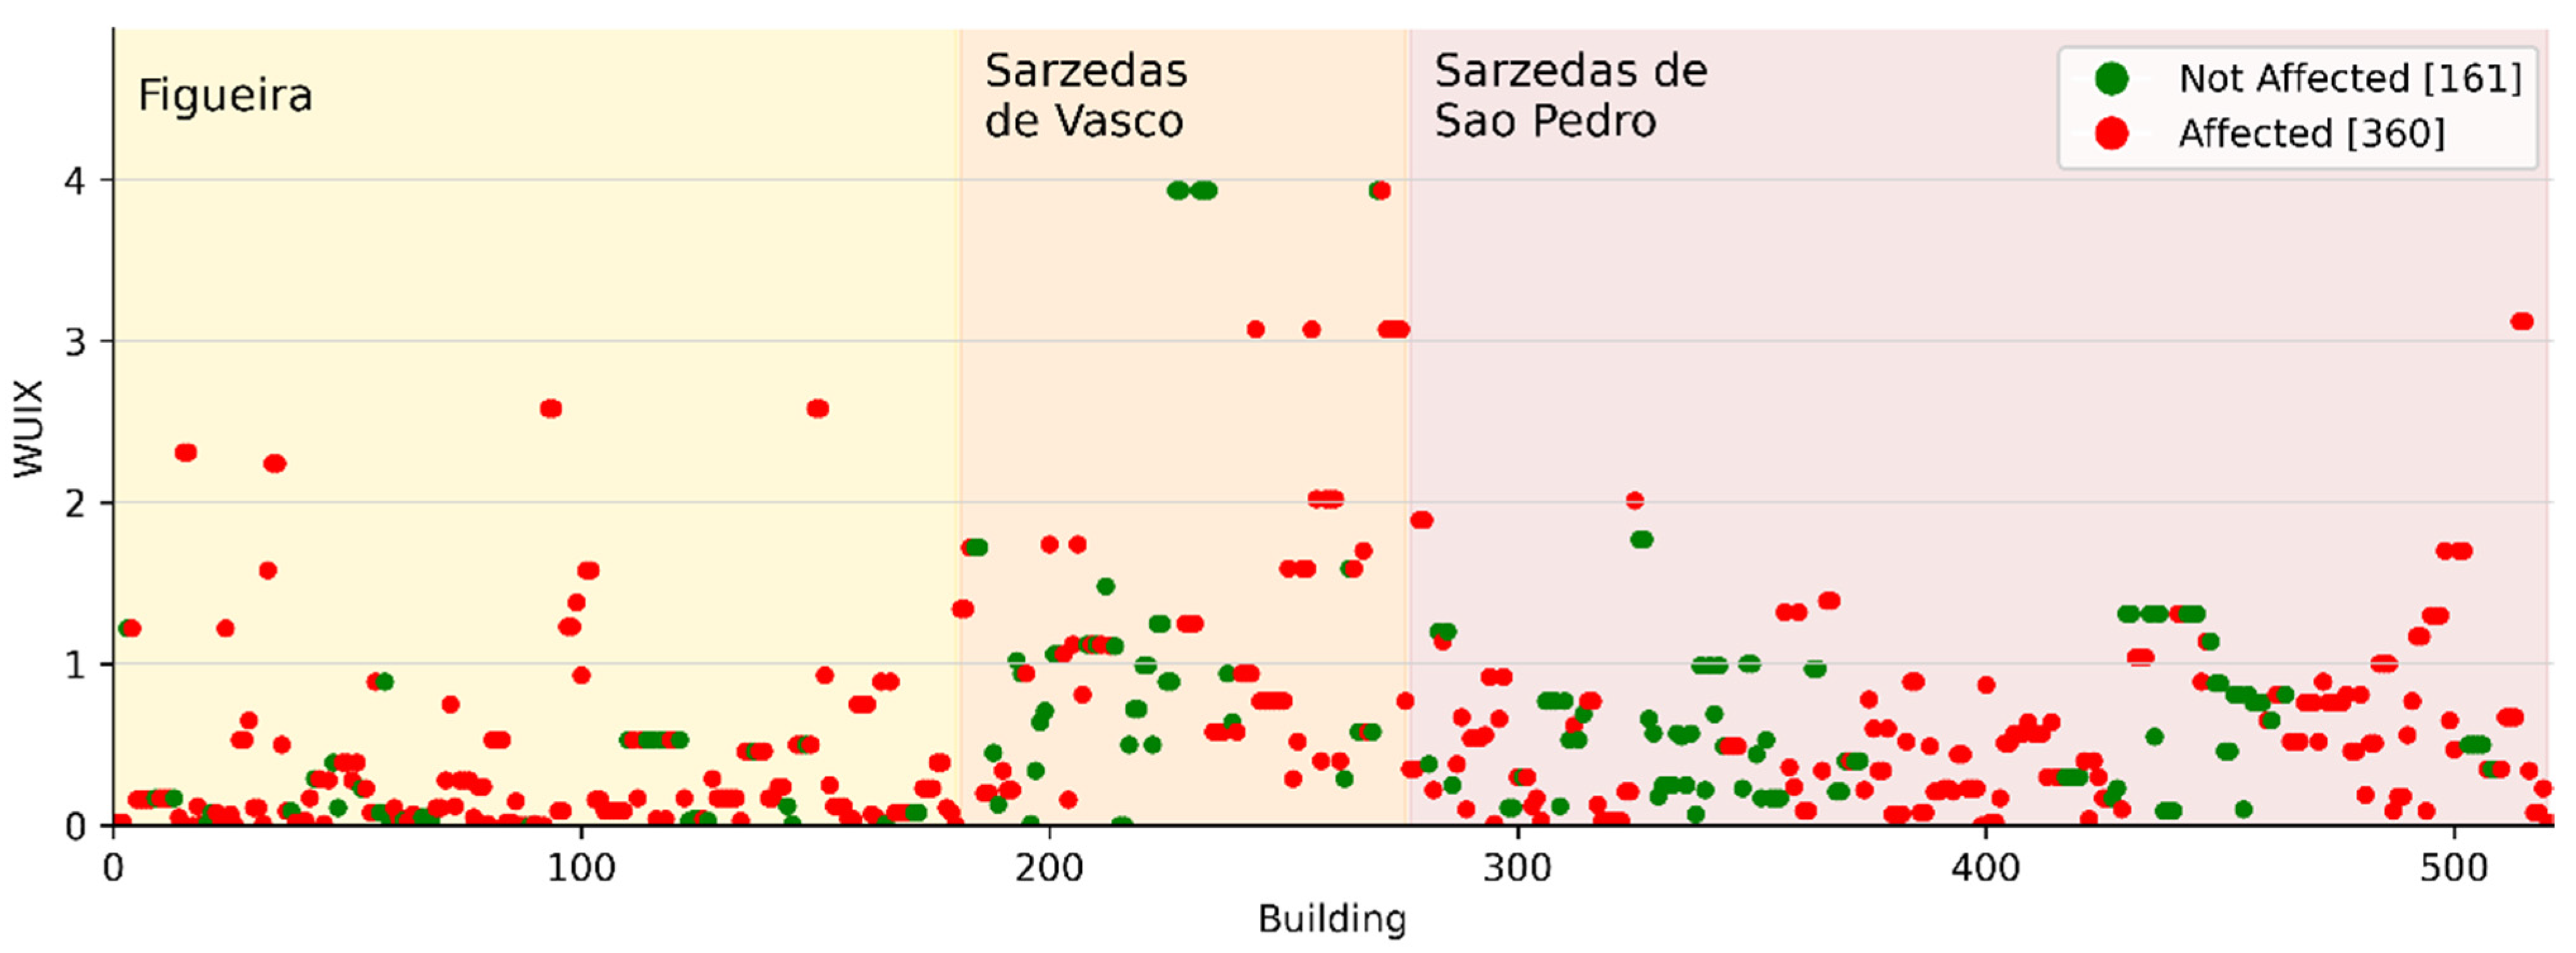
To assess the distribution of WUIX for each building, the overlap of “build_affec” and “surro_affec” performed for Spearman’s rank correlation was used here, defining the category as “Affected”. The plot in
Figure 8 shows the distribution of affected and non-affected buildings, where greater WUIX values express generally larger friction areas between the vegetation and building and, consequently, higher chances of the building being hit by the fire due to its higher exposure.
From the analysis presented in
Figure 7, it is possible to observe an apparent dispersion of the results for low WUIX values (between 0 and 1). For higher WUIX values, on the other hand, there is a clearer correlation between the WUIX and the effect, as expected. Specifically, Figueira presents a better correlation, consistently showing burnt buildings for WUIX values above 1.0. This correlation is not so clear in the other two villages, particularly for Sarzedas de São Pedro, which presents several cases of non-burned buildings with a high WUIX value. No data are considered related to the local interference with fire protection, which can change the relation with the observed mismatch of results.
The Kruskal–Wallis test was carried out on the three villages separately and joined together to assess the difference between the groups.
Table 3 shows the results of the analysis.
Despite the medians of WUIX for each type of effect leading to the conclusion that they are correlated, the Kruskal–Wallis test does not entirely confirm the statistical significance of the results. Higher medians for buildings affected by the fire may indicate that the results obtained with the WUIX methodology do point out regions with higher WUI exposure and, therefore, are not randomly assessed. However, the Kruskal–Wallis test did not show statistical significance in any of the groups.
The effect identified on the medians of the groups, presented in
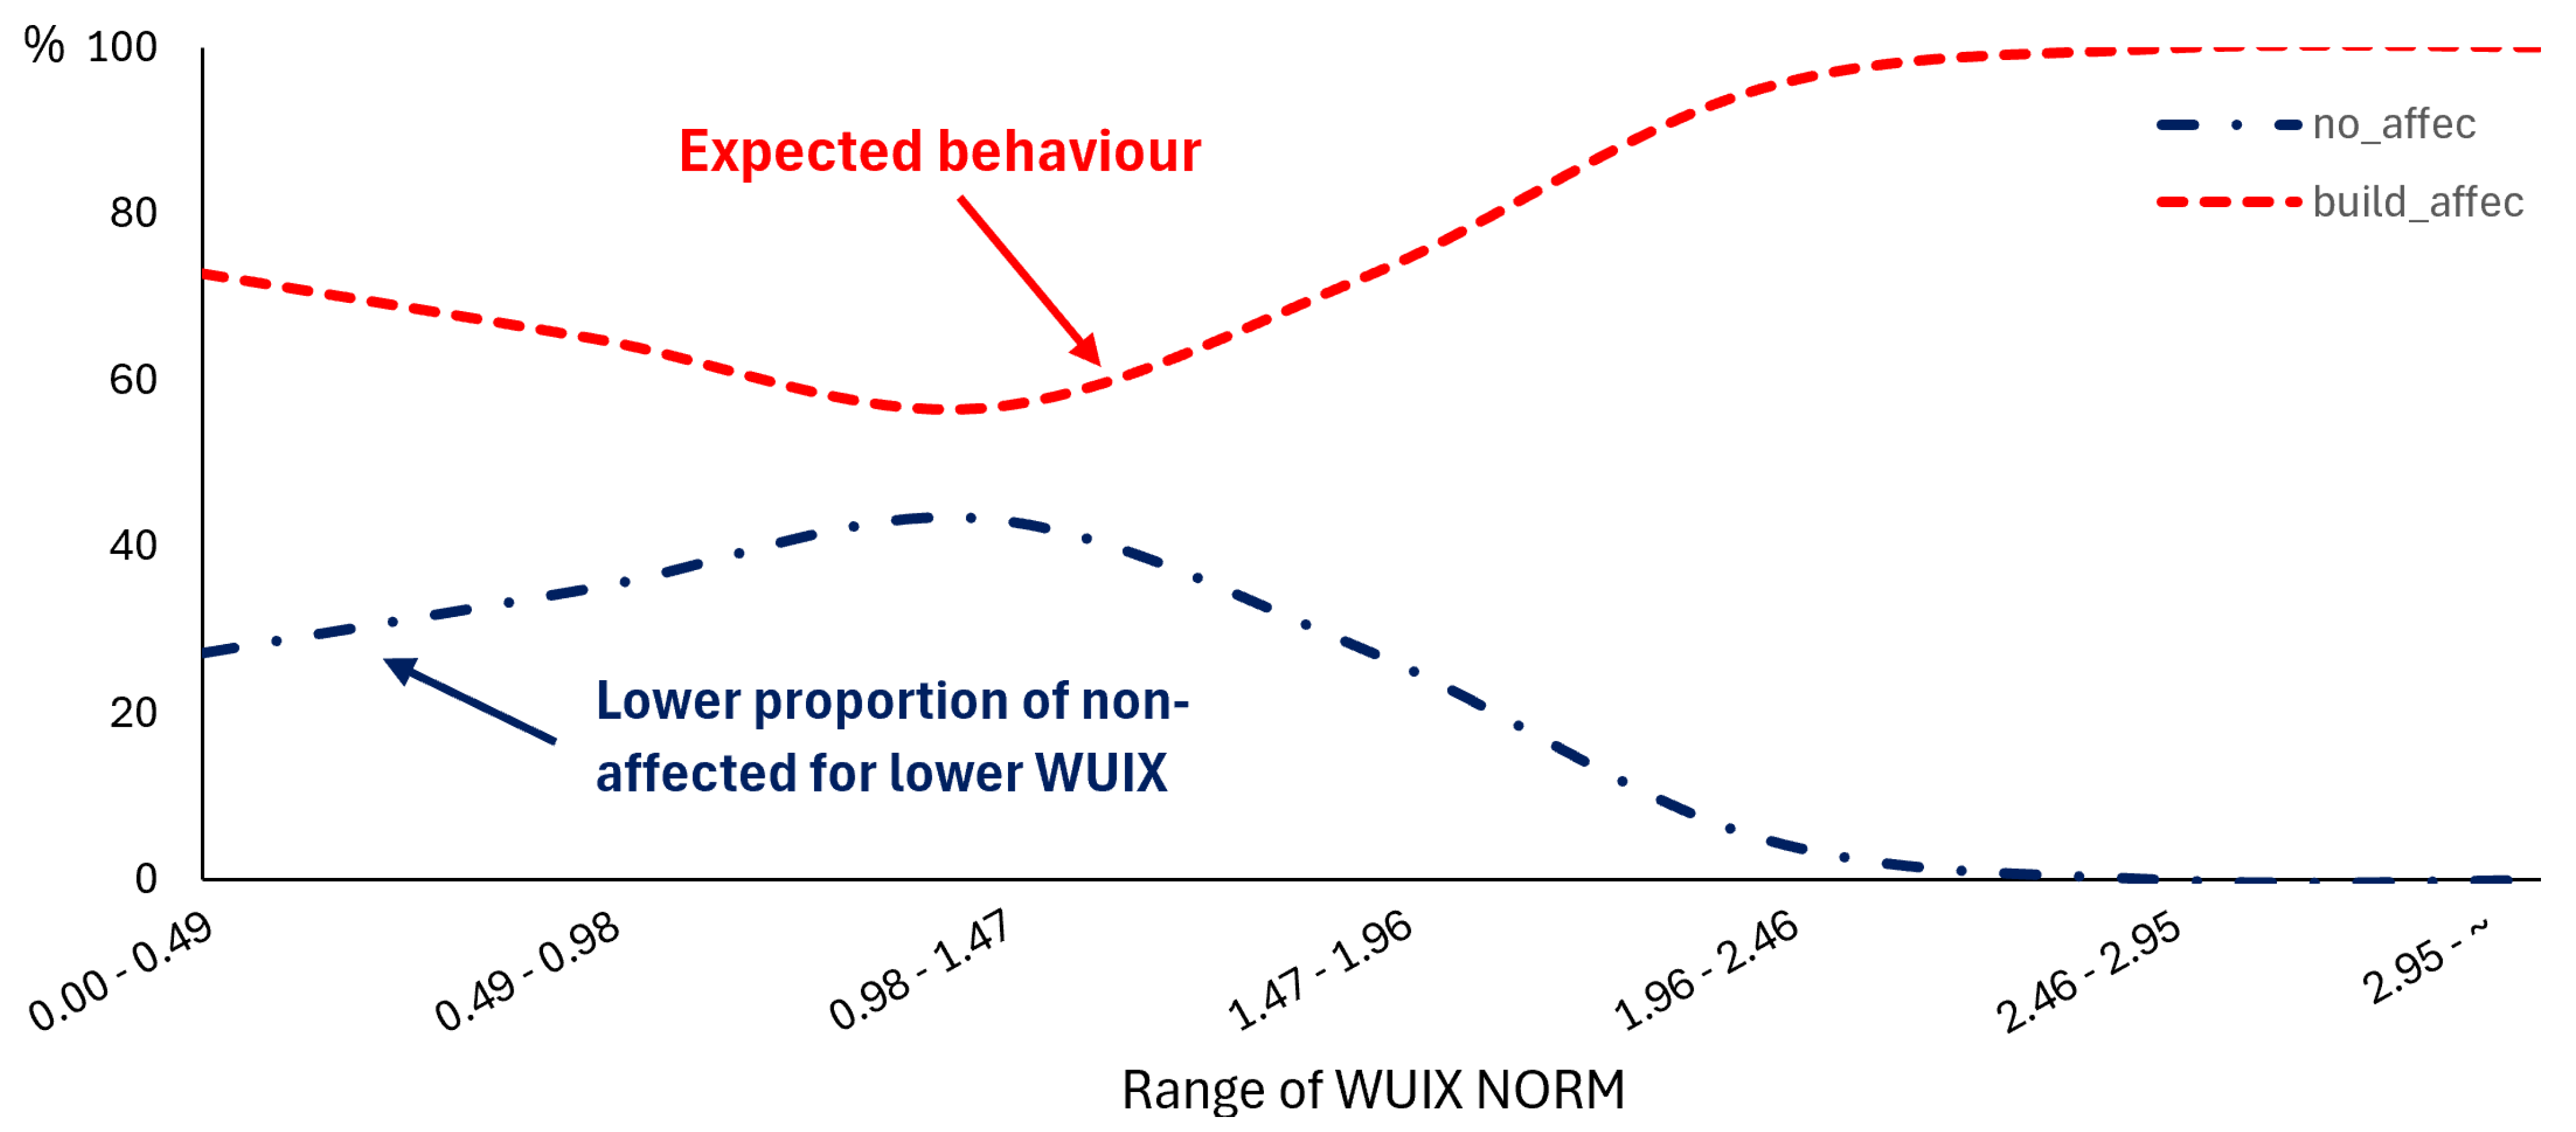
Table 3, is also observed when comparing affected and non-affected categories.
Figure 9 displays the tendency for fire effect with the increase in the WUIX value.
Although the expected result of this plot is an increase in the line associated with the affected buildings and the opposite behaviour in the non-affected ones, the undefinition of the results in Sarzedas de São Pedro e de Vasco for the lower values of WUIX caused this disturbance in the initial ranges. The last range of the plot was excluded because it was affected by two outliers in Sarzedas de Vasco and, therefore, does not represent the tendency of the whole data.
Aiming to check the differences between the three types of fire effect individually and to perform a more robust comparison, a post hoc Dunn’s test was performed, which gave a perspective of which group is pointedly distinct from the others with the same 5% significance as the Kruskal–Wallis test.
Table 4 presents the test results. From the analysis of the results, it is possible to observe that, for the case when the entire sample was combined, the null hypothesis was only rejected for the comparison between “no _affec” and “surro_affec”.
From this analysis, it can be inferred that “build_affec” and “no_affec” tend to be different in Figueira, admitting a slightly higher significance than the defined 5% level. The Cohen’s d coefficient upholds the analysis by revealing a moderate effect on the differentiation. This result supports the claim that the higher fire exposure detected by the WUIX correlates with the records of buildings affected during the Pedrógão Grande wildfire.
At the same time, for the global analysis, the difference between these two groups is not observed; this fact might be related to the effect of the other villages on this assessment, showing the non-possibility of merging the results for the Kruskal–Wallis test and subsequent post hoc analysis.
Nevertheless, in the comparison between “build_affec” and “surro_affec”, a greater difference is identified than that observed for “build_affec” and “no_affec” for the “Entire sample” group, which is not consistent since the lowest match between the first comparison group was expected. This fact may be attributed to the higher uncertainty of these data, and lower WUIX value range, causing a bigger dispersion of values in this analysis. On the other hand, “no_affec” and “surro_affec” show concordance with the results when the entire sample is assessed.
In summary, the trend shown in
Figure 9 reveals that up to a normalised WUIX value of 1, the categories present the same behaviour. Consequently, it is challenging to draw some conclusion on whether the methodology determines what happened to the actual scenario or not. Looking into the Kruskal–Wallis analysis in
Table 3 and the distribution of the values in
Figure 8, it is clear that the results obtained for Figueira align better with what would be expected. In contrast, the results obtained for the other two villages present a higher dispersion, preventing one from drawing any solid conclusions.
4. Conclusions
The present study aimed to test the accuracy of the Wildland–Urban Interface (WUI) methodology in the Portuguese rural context. The methodology was applied in three villages located in the centre of the country, in a region that was severely affected by the 2017 Pedrógão Grande wildfire. The depopulation and abandonment of these rural settlements may have magnified their vulnerability, and due to their geographical isolation, the assessment of these areas is challenging and potentially onerous. Therefore, remote sensing technologies can open possibilities that, until very recently, were unavailable.
With that in mind, the investigation was started with the study of the size of the analysis grid, through which it was possible to identify the ideal size for the analysis grid, i.e., the size for which the correlation between WUIX values and the actual fire effect on the buildings stabilised at the highest level. This result suggested that the most satisfactory size of the grid is about 40 m, and the subsequent analysis was applied to this size.
From the results of the WUIX, the Kruskal–Wallis test and post hoc Dunn’s test were applied to assess the significance of the differences between the WUIX values and the real scenario of fire effect. While the results suggest a relationship between higher WUIX values and fire effect, particularly in Figueira, the complexity of adapting this methodology directly to Pedrógão Grande’s wildfire context is apparent. This is primarily because factors related to fire combat and environmental variables that influence the development of the fire are not included in the WUIX methodology.
One of shortcomings observed in the analysis reported herein is directly related to the ‘surro-affec’ category. When this category was grouped with the affected buildings, the result was a significant correlation between WUIX results and the actual scenario. However, when this category was disaggregated for subsequent tests, a greater dispersion of the results was observed. This suggests that a clarification of this classification is required, potentially through on-site inspections. The two villages with fewer buildings in this category presented better results in the analysis, especially in the case of Figueira, where the higher number of buildings seemed to attenuate the issue.
In general, this study contributes to the field of wildfire risk assessment with new information, serving as an ally to more precise fuel management while emphasising the importance of tailoring methodologies to address local specificities. Furthermore, although Spearman’s rank correlation test suggests a high correlation between the real case and the WUIX values, the tests for the differentiation between the groups did not show complete concordance with what is expected from the method, suggesting that further analysis must be conducted. By exploring further, the vegetation assessment could yield solid results. As an additional factor, the impact of fire combat on the wildfire event might have added a layer of uncertainty to the results for lower WUIX levels and could serve as a future enhancement of the methodology.


