Abstract
A numerical investigation has been conducted to analyse the effect of wind on the vertical spread of fire through a front opening in a building’s external walls. The study utilises a building geometry established from previous experimental work conducted by the National Research Council of Canada (NRCC). A horizontal projection or a vertical spandrel is introduced above the opening of the compartment of fire origin. The purpose of the projection or spandrel is to inhibit the vertical spread of the fire, following the relevant requirements in the Australian National Construction Code (NCC). A computational fluid dynamics (CFD) package for fire-driven fluid flow, namely the Fire Dynamics Simulator (FDS), is employed to simulate the fire behaviour. The FDS model is validated against the NRCC’s experimental results, and a good agreement is achieved. Winds from three horizontal directions (front wind is normal to the opening, side wind is parallel to the opening, and back wind is from behind the building) have been investigated, with speeds ranging up to 10 m/s for each wind direction. Front wind speeds below 1 m/s are found to slightly enhance the vertical spread of the fire, while speeds exceeding 1 m/s are inclined to promote horizontal spread. The impact of side wind on the vertical fire spread was also found to vary with wind speed. The increase in the speed of back wind influences flame buoyancy, resulting in an augmented vertical fire spread. Furthermore, the numerical results reveal that a vertical spandrel of 1100 mm height is less effective in preventing vertical fire spread through openings, compared to a 1100 mm deep horizontal projection. The study suggests that the fire safety design in reducing the hazard of vertical fire spread through openings in buildings’ external walls could be further improved if the effect of wind is considered.
1. Introduction
Prevention of fire spread via openings in external walls of buildings is an important aspect of fire safety engineering [1]. For a fire ignited in the interior of a building, the glass windows are easily broken when exposed to sudden thermal radiation, given that the fire resistance of glass is lower than other parts of the walls [2,3]. This allows the fire to spread into an oxygen-rich ambient environment and exceed floor heights, resulting in vertical external fire spread [4]. Should the material of the external wall be combustible, this will cause significant vertical flame spread [5]. Ignition of a material will be dependent on material properties and the magnitude and duration of heat flux exposure. For materials often used within cladding, the literature gives pilot ignition (in the presence of direct flame) for vertical orientation of at least 11 kW/m2 for many woods and plastics; and more specifically, breakage or failure heat fluxes of 20 kW/m2 for normal glass and 70 kW/m2 for tempered glass and cracking as low as 3 kW/m2 [6,7,8]. An overall assumption of the current study is no ignition of the external wall; that is, fire only impinges onto a building with non-combustible external walls. This paper aims to advance the understanding of vertical external fire spread on multilevel buildings and explore the building code’s established approaches to inhibit it under various wind conditions.
The Australian Building Code, i.e., the National Construction Code (NCC), requires fire safety measures to be provided to certain unsprinklered buildings to mitigate the hazard of vertical fire spread through openings in external walls, which can be vertical spandrels (flat panels) or horizontal projections, made of fire-resistant materials [9]. Specifically, NCC 2019 Amendment 1 Clause C2.6 requires a vertical spandrel to have a height of not less than 0.90 m or a horizontal projection with a depth of not less than 1.10 m, extending at least 0.45 m beyond the openings [9]. Though the specifications differ between countries, several studies have been conducted to understand the effect of vertical spandrels and/or horizontal projections on inhibiting fire spread [8,10,11,12,13,14]. Notably of these studies was the finding that equivalent protection effectiveness was found to be achieved in the range where the ratio of the height of the vertical spandrel to the depth of the horizontal projection is between 1.67 and 4.17. This depends on the vertical location of the horizontal projection and the height of the external flame and may not be true in the presence of wind [15,16,17]. However, the effect of the ambient environment, such as wind, was neglected in all these aforementioned studies, which limits the practicability in real scenarios.
Yuen et al [18] and Yuen et al [19] state that in the presence of no or low wind, a fire will freely burn vertically, and buoyancy dominates over the momentum/velocity generated within a fire plume. At upper levels of a high-rise building where wind speed is nonnegligible, external winds can have a significant effect on the fire flame/plume from an opening (e.g., a façade or a window frame). In the literature, the effects of front wind (i.e., flow direction normal to the opening) on internal temperature [20,21] and external flame height [22] have been studied with a single opening in the fire compartment. Specifically, the flame height [22] and the maximum temperature together with the corresponding heat release rate (HRR) [20,23] were found to decrease with increasing front wind velocity. This implies that front wind may have the potential to inhibit vertical fire spread. Studies on side wind applied to a fire compartment with a single opening identified that the external flame height and the flame horizontal extending distance are the two key parameters that can affect fire spread [23,24]. The external flame height was found to decrease with an increase in the wind speed, while the flame’s horizontal extending distance was found to depend on the opening size and the wind speed [23].
The external geometry of the building can also affect the wind flow and therefore the fire spread. As illustrated by [25], if the flow cannot follow a continuous path around the blunt-edged obstructing body, such as the side of a building or a projection, boundary layer separation occurs, and vortices form between the obstruction and boundary layer flow. When this occurs off the back edge of an obstructing body, the phenomenon is called a backward-facing step [26]. Similar phenomena can form as a flow approaches an obstruction, called a forward-facing step. For lower velocity flows, or small obstructions, the boundary layer is proportionally sized, and these flows reattach to the surface. For larger velocities or larger obstructions, the reattachment distance increases until the extreme case where flow no longer reattaches; the case of a blunt body such as a building with high-velocity wind. Entrainment of fire into these flows will transport and spread the fire.
There is a lack of literature investigating the approaches to inhibit external fire spread in the presence of wind. Therefore, there is a need to understand the use of a horizontal projection or a vertical spandrel to prevent fire spread in the presence of wind.
2. Methodology
The overall aim of the present project is to understand the effect of wind on the external fire behaviour from a single opening of a three-storey building equipped with a horizontal projection or a vertical spandrel. To be specific, heat flux on the exterior walls is studied to investigate fire spread with different wind directions and speeds. This is achieved through fire modelling using a computational fluid dynamics (CFD) package for fire-driven fluid flow, Fire Dynamics Simulator (FDS) version 6.7.9. FDS is suitable for modelling low-speed (Mach number smaller than 0.3) fire-driven fluid flows [27]. The large eddy simulation (LES) approach is widely used in modelling for airflows in buildings [28] and building fire simulations [18,19]. FDS is used to assess the geometry of a fire compartment with a single opening and model the fire characteristics under various airflow conditions. In a conference paper authored by our research group [29], the influence of front wind on fire spread outside a building was explored through simulation studies. However, the findings presented in this earlier work were preliminary, focusing on specific instances of front wind. In this current paper, a thorough parametric study that encompasses a broader scope, considering three distinct wind directions is reported. In addition, the simulation results are validated against previous experimental measurements conducted by the National Research Council of Canada (NRCC) to provide confidence in the modelling predictions [30,31].
2.1. Geometries for the Numerical Model
The building being modelled is schematically presented in Figure 1. The fire compartment (highlighted in pink) is located on the ground floor, together with a single opening in the compartment (highlighted in yellow). Two different opening widths were investigated. The opening shown in Figure 1 is 0.94 m wide and 2.70 m high from the floor, representing a narrow opening case. The alternative wide opening case features a width of 2.60 m, with other dimensions remaining the same as the narrow opening case. Note that the wide opening exceeds the width of the projection and does not conform to the NCC. Figure 1 and Table 1 give the details for the geometry of a horizontal projection (shown in blue) added with its lower face 2.75 m above the floor. Both the opening and the projection are located along the centre of the building. That is, the building geometry is symmetric from the front view. The detailed dimensions of the geometry of the model are presented in Table 1.
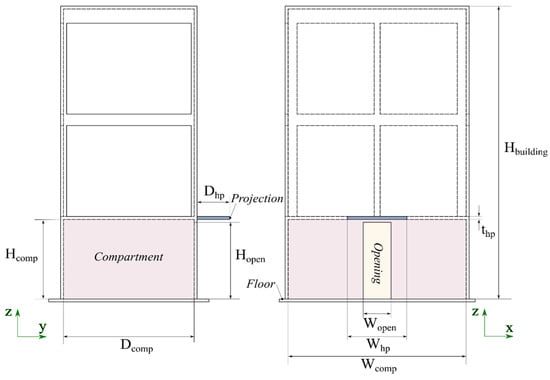
Figure 1.
A schematic diagram of the geometry of the building/compartment with a horizontal projection used in this study: left, a side view; right, a front view. Here, the opening dimensions are 0.94 m wide (narrow opening) and 2.70 m high. Note that fire sources are not included.

Table 1.
Detailed dimensions of the geometry of the model. The values in the brackets of the opening width are the dimensions of the alternative geometry.
Figure 2 shows an alternative configuration of the fire protection strategy, a vertical spandrel consisting of a non-combustible material, which is attached to the front wall of the building. The bottom of the vertical spandrel is at z = 2.75 m. As the dimensions of the compartment remain the same, only key features are reported here. The width of the vertical spandrel, , equals the magnitude of the horizontal projection width, (2.00 m), while the height of the vertical spandrel, , equals the magnitude of the horizontal projection depth, (1.10 m). The vertical spandrel has the same depth as the horizontal projection thickness of 0.10 m. As such, the vertical spandrel is effectively flush to the front wall and will provide negligible interference with heat flow from the opening. Thus, the vertical spandrel simulations are used as a limiting case to compare with the horizontal projection, and this comparison is conducted after the discussion on horizontal projection. The planes shown in Figure 2 will be discussed fully below.
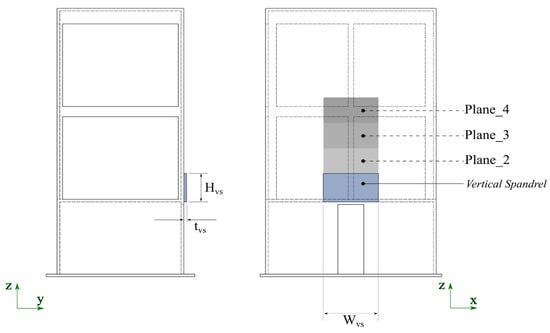
Figure 2.
A schematic diagram of the geometry of the building/compartment with a narrow opening and a vertical spandrel: left, a side view; right, a front view. Area-averaged heat flux is recorded on Plane_2, Plane_3, and Plane_4 on the front wall.
Numerical simulations were conducted using FDS. The specific boundary conditions of the model were defined using PyroSim, which is a commercially available graphical user interface for FDS. The computational domain encompassing the experimental building was defined with dimensions of 10.0 m width, 10.2 m depth, and 10.8 m height, as presented in Figure 3. The dimensions of the domain are considered to be sufficient for modelling wind effects, based on the domain width of at least twice that of the plume width [32] and have been validated for a similar domain in an FDS model of the same experiment in the literature [27]. The top boundary of the domain was defined as an ‘open’ boundary which allows flow to enter or exit, while the bottom boundary of the domain was defined as an ‘inert’ boundary that mimics a solid wall. In this study, front, side, and back winds were created by setting the surface (i), (ii), and (iii) (see Figure 3) to be the supply boundary, respectively, with the remaining side boundaries set to open. That is, the front wind was generated at y = −5.0 m, upstream of the opening, while the side wind was generated at x = −5.0 m. The details of the variables in this study are presented in Table 2. The speed of the wind increases from 0.5 m/s to 10.0 m/s. Note that there is one windless case for each wind direction for comparison purposes (i.e., wind speed of 0.0 m at surfaces (i), (ii), and (iii) by setting the open boundary condition at all of the side boundary surfaces).
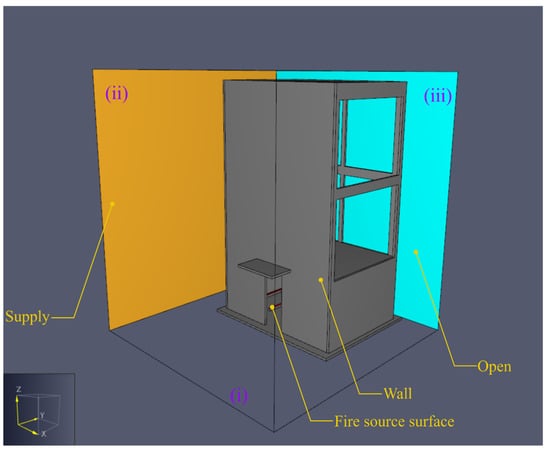
Figure 3.
Boundary conditions of the FDS model in PyroSim for side wind case.
Table 2.
Details of the variables in each case in this study. Note that the cases with wind speed of 0.0 m/s are the same for each group.
2.2. Fire Numerical Model Setup
The NRCC experiment [30] used four linear propane burners to produce a fire with a total Heat Release Rate, = 5.50 MW. The simulation reproduced this with four propane (C3H8) fire sources (not shown in any figures), placed parallel to each other and evenly spaced within the compartment along the x-axis. The surface of each fire source had a width of 0.10 m, a length of 3.80 m, and was 0.10 m above the floor. The Heat Release Rate Per Unit Area (HRRPUA) was 3618 kW/m2 for each fire source, leading to the total Heat Release Rate of the fire, , being 5.50 MW.
As per the NRCC experiment (Table 3), the whole compartment is covered by 0.025 m thick ceramic fibre insulation so that the conductive heat losses through the walls and ceiling are negligible. To simulate this, all modelled surfaces of the building (except for the four fire source surfaces) were set to be 0.10 m thick concrete walls with an initial internal temperature of 20 °C and emissivity of 0.90. The default concrete properties in FDS were used: density of 2100 kg/m3, specific heat of 0.88 kJ/(kg·K), and conductivity of 1.37 W/(m·K). The ambient temperature, , was set to be 20 °C. Figure 3 shows the key model setup in the simulation compared with that of the NRCC experiment [30].
Table 3.
Details of key model setup in FDS simulation compared with that of the NRCC experiment [30].
In the NRCC experiment [30], four heat flow transducers were used to measure and record the total heat flux on the external wall. These were mounted at 1.0 m vertical intervals with the lowest at 0.5 m above the centre of the opening’s top edge. This arrangement of heat flux measurements is matched in the simulations and is used for CFD grid independence testing and validation of the modelling, as discussed below.
In the simulations, the temperature, , and the gauge heat flux, , were recorded, at 0.2 m intervals, along a total of nine transects or linear profiles (five vertical and four horizontal) on the front wall, as presented in Figure 4. FDS measures the gauge heat flux, , as the total of convective and radiative heat flux. Simulation durations matched the total burning time of 1800 s as used in the NRCC experiment [30], and time-averaged data were then used for further analysis.
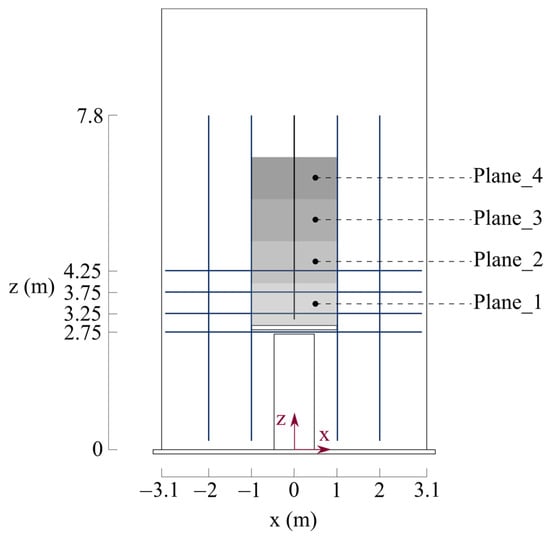
Figure 4.
The coordinate system of the model, together with the locations of transects and planes for which numerical data are available. The narrow opening geometry is also marked.
Additionally, where analysis focuses on the impact of fire on the building surface above the opening, the area-averaged gauge heat flux, , expressed in Equation (1), was obtained on four planes (in grey) each with area , as presented in both Figure 2 and Figure 4.
The planes have a width ( direction) of 2.0 m and a height ( direction) of 1.0 m. The 2.0 m width is also the width of both the horizontal projection and vertical spandrel when they are applied to the modelling. The centres of these planes are located at 3.4, 4.4, 5.4, and 6.4 m along the centre line of the model. Note that Plane_1 (positioned between z = 2.90 m and z = 3.90 m) effectively measures the area-averaged gauge heat flux of the vertical spandrel.
2.3. Grid Independence Test and Model Validation
The FDS grid independence test is used to prevent large mesh sizes from introducing anomalies to simulation results. According to [33], a non-dimensional expression, , can be used to determine how well the flow field is resolved in a CFD simulation, where is the characteristic fire diameter, and is the mesh cell size. It should be noted that a preferred value for depends on the result of each case. Here, can be expressed as follows:
where is the ambient air density, the air specific heat, the ambient temperature, and is the gravitational constant. For the case of a narrow opening without external wind or horizontal projection, was calculated to be 1.9 m for of 5.50 MW, as used in the NRCC experiments. The three mesh cell sizes chosen for comparison are listed in Table 4 with the resulting computational burdens.
Table 4.
Comparison of grid independence test results for a characteristic fire diameter of 1.9 m for of 5.50 MW for narrow opening.
The simulated gauge heat flux, , along the vertical transect at is presented in Figure 5a. The average relative differences between the fine mesh and the coarse mesh results, and between the fine mesh and the medium mesh results, , are calculated as follows:
where is the number of the recording locations for heat flux measurement along the centre vertical transect at (as presented in Figure 4), which is 25, is the simulated value of heat flux of each recording location for the fine mesh, and is the simulated value of heat flux of each recording location for the medium or coarse mesh. It can be found that between the fine mesh and the medium mesh is 2%, while between the fine mesh and the coarse mesh is 65%. The reason that is much larger between the fine mesh and the coarse mesh is because the width of the fire source is kept at 0.1 m, which is smaller than the cell size of 0.2 m, which results in two of the fire sources not being resolved by the model mesh. For the medium and fine meshes, the value of is small enough, indicating that both cell sizes are acceptable for predicting fire behaviour in this study. Therefore, for assessing more accurate results, fine mesh with of 0.05 m was selected for all cases in the current study. Figure 5a,b also present model validation against the experimental results of conducted by NRCC [30]. Here, the average relative difference between the experimental and numerical results, , is calculated as follows:
where is the number of heat flux measurements taken along the centre transect in the study [30], which is 4, and is the corresponding heat flux from the experimental results [30]. It can be found that is less than 29% for the narrow opening case presented in Figure 5a, and is less than 30% for the wide opening case presented in Figure 5b. As the emissivity of the gauge is unknown and the temperature of the gauge is different from the ambient temperature in the experiment [30], the emissivity of the gauge was assumed to be 1.0, and the temperature of the gauge was assumed to be the same as the ambient temperature in the FDS simulation. These are likely the primary reasons for the error between the experimental and simulation results. The simulation curves are conservative, but both trends of the experiment and the simulation match each other well. This indicates that the simulation results have agreement with the experimental results from the fire protection engineering point of view. Therefore, it can be said that the FDS model provides a level of confidence in further investigating the effect of the wind on fire spread for a constant value of .
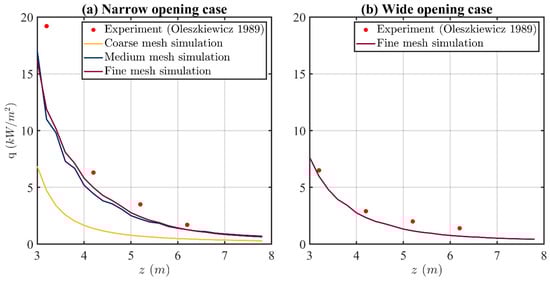
Figure 5.
Profiles of measured [30] and simulated gauge heat flux along the vertical transect at x = 0 without external wind or a horizontal projection for: (a) the narrow opening case () with three cell sizes; (b) the wide opening case () with a fine cell size of 0.05 m.
3. Results
3.1. Effect of Front Wind
The time-averaged horizontal profiles of the gauge heat flux, , from m to m for ranged from 0 to 10 m/s are presented in Figure 6. It should be noted that the profile at m is beneath the horizontal projection, while that of the other three are above it. It can be seen that the profiles are symmetric for all cases with front wind. However, for the case without wind, the profiles at m are asymmetric between m and m, which is the width of the projection. This may be an attribute of the instability (flow turbulence) in the simulated fire above the projection. The maximum values of , greater than 30 kW/m2, occur for the profiles beneath the horizontal projection at m (Figure 6a), for all values of x and with all wind speeds. Above the horizontal projection, reduces to less than 4 kW/m2 (Figure 6b–d). This indicates that a horizontal projection is effective in inhibiting the vertical spread of the fire in the presence of wind, which improves the findings of previous research [14,15,17] conducted with no external wind. This is explored further in the comparison between a horizontal projection and a vertical spandrel in Section 3.4.
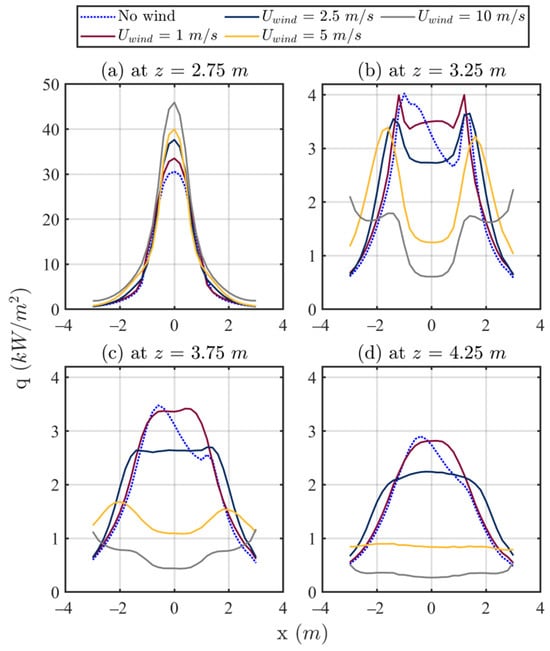
Figure 6.
Simulation results of gauge heat flux profiles at five horizontal transects for various front wind speeds for the narrow opening case.
At z = 3.25 m, as presented in Figure 6b, the value of directly above the horizontal projection ( m) for cases with front wind is lower than that of the sides of the projection, producing side lobes. That is, the width of the projection is critical in reducing vertical fire spread. As height increases, as shown in Figure 6c,d, decreases with the increase in , and the side lobe effect lessens significantly, although the main peaks broaden, and in the case of = 10 m/s even increase slightly at m. This indicates that the flame spread along the direction is more significant for high wind speeds.
Figure 7 presents the simulated vertical profiles of (an alternate representation of the data presented in Figure 6) for the narrow opening case for all wind cases. It can be found that the heat flux profiles are almost symmetric about the centre line m for the cases with the front wind (i.e., Figure 7a–d). This matches the expectation because the direction of front wind is normal to the plane of the front wall. In the region m, no significant difference in the value of is observed when exposed to front wind ranging from 1 m/s to 10 m/s in speed. Given that hot gases exiting the compartment have a smaller density than that of the ambient air, the indistinguishable values of in the region m can be attributed to the top of the opening having a higher concentration of hot air with cooler air (mostly ambient air) then being drawn into the compartment below the hot air layer. At m, in Figure 7c,d, the value of decreases rapidly from more than 10 kW/m2 to approximately 3 kW/m2 for all values of at approximately m, because that location is the edge of the projection.
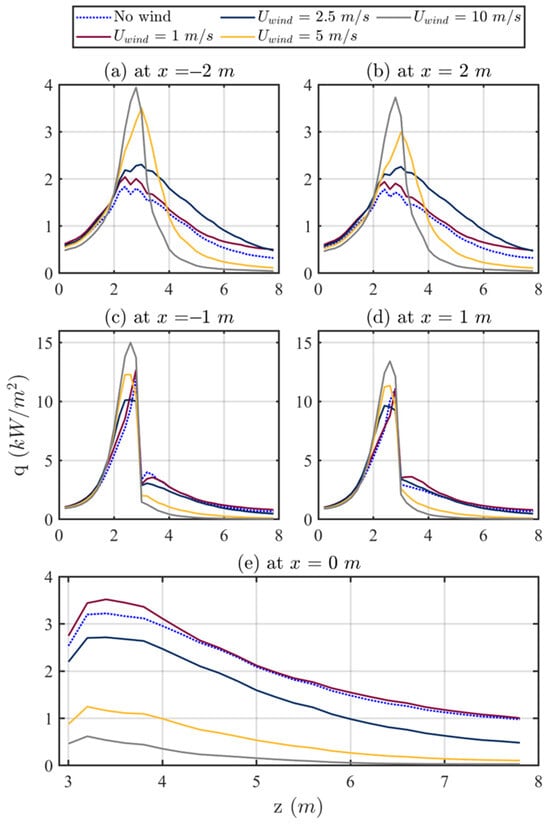
Figure 7.
Simulation results of gauge heat flux profiles at five vertical transects for various front wind speeds for the narrow opening case.
At m, in Figure 7a,b, the maximum value of is found to occur between m and m, which is approximately the same height as the horizontal projection. This implies that in the presence of front wind, a horizontal projection spreads heat sideways. In particular, for of 5 and 10 m/s, the value of drops faster as height increases above the horizontal projection than the other three lower wind speeds (0–2.5 m/s) at m.
Figure 7e presents the simulated profiles of along the centre line that is above the projection (i.e., m) on the plane of the front wall. For all wind cases evaluated, the value of increases to a peak located between m and m and then gradually reduces. As the top edge of the projection is at m (from Table 1, the underside of the projection is at m plus thickness of 0.10 m), the hot gas from the compartment is restricted from reaching the corner between the top of the projection and the front wall, resulting in a low value of there. This is a forward-facing step, discussed in the Introduction. It can also be found that the values of along the direction for the case without wind are always lower than that with of 1 m/s, while higher than those with of 2.5, 5, and 10 m/s. It appears that the front wind with a lower speed, e.g., 1 m/s, slightly enhances the flame out of the opening of the compartment below the projection, while that with a higher speed, such as m/s, inhibits it.
Figure 8 presents the dependence of the simulated area-averaged gauge heat flux, (as defined in Equation (1)), on on four planes (represented by their heights, as shown in Figure 4) for both the narrow opening and the wide opening cases. Both narrow and wide openings follow a similar trend with respect to . The value of increases to a maximum value when increases from 0 m/s to 1 m/s, and then starts to reduce for all values of for both narrow and wide opening cases.
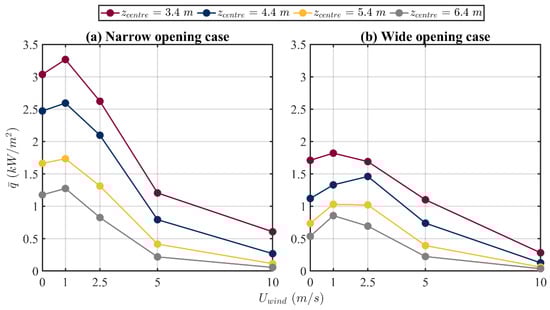
Figure 8.
Influence of the front wind speed on the predicted area-averaged gauge heat flux at four z locations of the centre of each plane for (a) the narrow opening case , (b) the wide opening case .
As shown in Figure 8, it can also be seen that the value of is always smaller in the wide opening case than that of the narrow opening case for m/s, while almost the same for both cases for of 5 and 10 m/s. The larger opening width, , results in a broader distributed fire for a constant value of in the presence of front wind.
Figure 9 presents the simulated velocity vector for the centre line of the narrow opening fire at 1000.0 s for both the no wind case and the case with of 1 m/s. Vertical fire spread can be observed in both cases, indicating that buoyancy is the dominant mechanism that controls fire spread for relatively low . Additionally, in both cases, flow recirculation just above the horizontal projection is obvious, which is mainly due to the forward-facing step phenomenon. As illustrated by [25], the forward-facing step introduces a boundary layer separation, as the airflow cannot follow a continuous path around the obstructing body, and results in a vortex. As shown in Figure 9, it appears that the heated air above the horizontal projection is ‘pushed’ toward the exterior wall with the increase in from 0 to 1 m/s, resulting in higher above the projection for the case of 1 m/s than the case without wind presents in simulated results of the gauge heat flux on the front exterior wall of the compartment at 1000.0 s for the narrow opening fire. As presented in Figure 10a,b, relatively high gauge heat flux (in light blue colour) can be found above the horizontal projection for cases of of 0 and 1 m/s, where is not high enough to suppress vertical spread of the fire over the horizontal projection. However, as presented in Figure 10c, a higher front wind speed results in suppressing vertical spread of the fire while enhancing lateral spread, supporting the previous findings. This phenomenon can be explained by the fact that high-speed front wind (e.g., 5 m/s, as shown in Figure 10c) possesses sufficient momentum to impede the flame from passing over the front edge of the horizontal projection. Consequently, the wind redirects the flame, compelling it to flow along the side edges of the horizontal projection and thereby encouraging lateral spread.
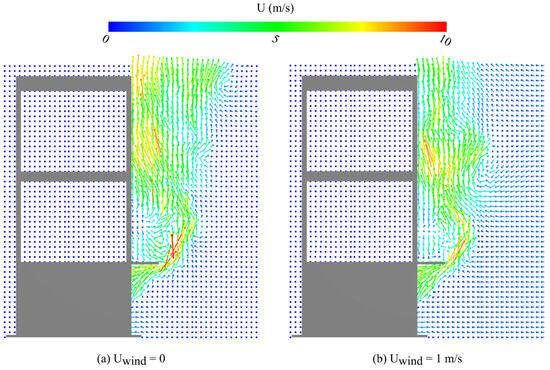
Figure 9.
Simulated velocity vector on the y-z plane at x = 0 m of the compartment model for the narrow opening case at 1000.0 s for: (a) no wind; (b) front wind speed of 1 m/s.
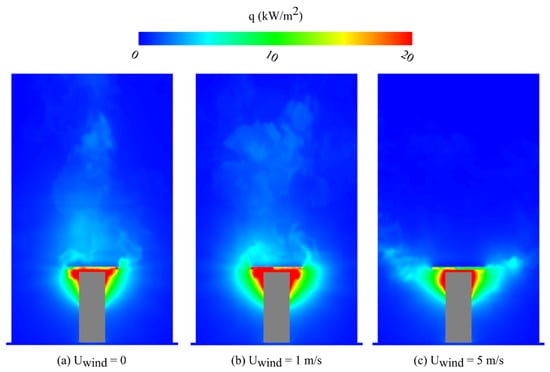
Figure 10.
Gauge heat flux colour map simulated on the front exterior wall plane for the narrow opening case at 1000.0 s for three values of the wind speed of: (a) 0; (b) 1 m/s; (c) 5 m/s.
3.2. Effect of Side Wind
The simulated transect profiles of for the narrow opening case from m to m for side wind cases with ranged from 0 to 10 m/s are presented in Figure 11. Note that the side wind is generated at −5 m. It can be found that the profiles of for non-zero side wind cases are asymmetric, as expected. The values of are higher at the side along all 4 horizontal transects for the cases that ranges from 2.5 to 10 m/s. These results indicate that the fire is shifted upwind, which is counterintuitive as the fire was expected to be pushed downwind. For the case of 1 m/s, higher values of are found to be at for all horizontal transects, indicating that the fire is shifted downwind. For the case of 1 m/s, it can also be found that the maximum values of at to 4.25 m are lower than those of the case without wind.
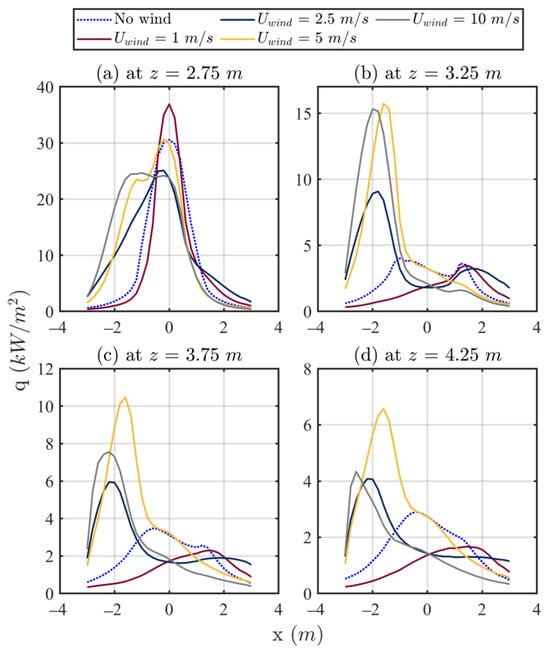
Figure 11.
Simulation results of gauge heat flux profiles at five horizontal transects for various side wind speeds for the narrow opening case.
Figure 12 presents the dependence of on in 4 planes along the direction for both the narrow opening and the wide opening cases. Except for where , both narrow and wide openings display similar trends. At for the narrow opening, heat appears to flow more easily around the projection. Then, increases with increasing from 1 to 5 m/s, and after that, decreases with increasing from 5 to 10 m/s. It can be found that the values of along 3.4 and 4.4 m for 2.5 m/s are higher in the wide opening case than in the narrow opening case. The reasoning is that the upwind movement of the fire effectively concentrates the fire into a narrower zone, noting that the wide opening exceeds the width of the projection. This is consistent with the front wind behaviour where the narrower opening produces higher heat flux than the wide opening, resulting in the side wind having a more significant effect on the larger opening width.
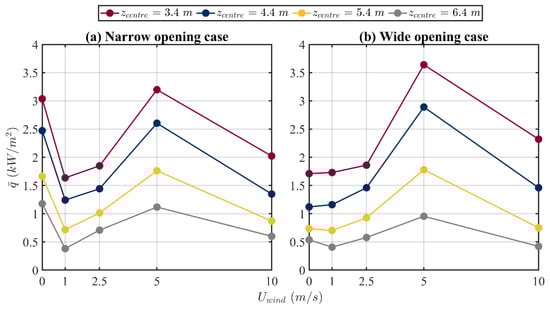
Figure 12.
Influence of the side wind speed on the predicted area-averaged gauge heat flux at four z locations of the centre of each plane for (a) the narrow opening case , (b) the wide opening case .
As both opening sizes have a similar trend, a detailed explanation is given only for the narrow opening case. The first decrease in with increasing from 0 to 1 m/s shown in Figure 12 is mainly due to the shift of the fire along the direction, as evidenced by the heat flux profile shown in Figure 11 and visualised in Figure 13a by the velocity vectors on the plane at = 3.25 m. This indicates that the spread of fire is dominated by side wind for from 0 to 1 m/s, rather than buoyancy. The increase in for from 1 to 5 m/s is again due to the forward-facing step phenomena, this time caused by the side wall of the building. As presented in Figure 13b,c, the flow separation occurs at the corner of the building, creating a recirculation vortex immediately downstream of the step at relatively high Reynolds numbers. In Figure 13b, is still low enough to allow the flow to reattach to the building. The effects of flow recirculation are enhanced, resulting in the fire shifting towards the upwind direction flowing the recirculating flows. With the increase in to 5 m/s, in Figure 13c, the flow recirculation near the separation point also increases, drawing the fire upwind. The increase also causes the flow reattachment zone to move further downstream. With further increase in from 5 to 10 m/s, the recirculation flow close to the separation point expands on the plane, as shown in Figure 13d. The heat drawn into this zone is no longer as concentrated against the building, resulting in a reduced value of on the building above the horizontal projection (referring back to Figure 11 and Figure 12). Also of note in Figure 13d is that the continuous flow no longer reattaches to the building.
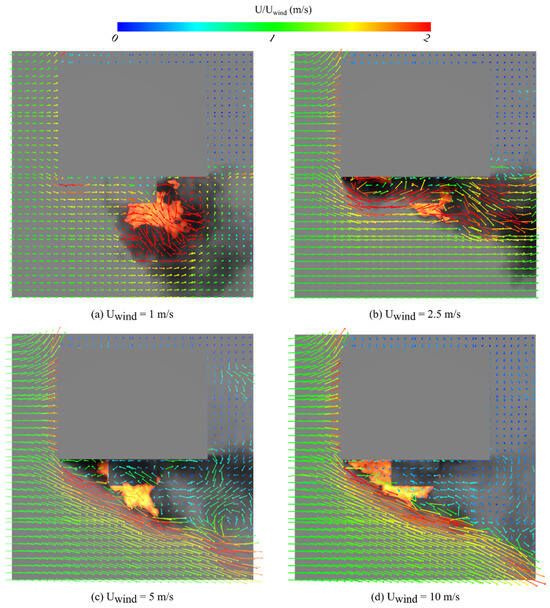
Figure 13.
Simulated velocity vector on the x-y plane at z = 3.25 m of the compartment model for the narrow opening case at 1000.0 s for the side wind speed of (a) 1 m/s; (b) 2.5 m/s; (c) 5 m/s; (d) 10 m/s. The vectors are overlaid on a visualisation of the fire based on heat release rate per unit area and soot density.
3.3. Effect of Back Wind
The influence of back wind on on the four planes for both the narrow opening and the wide opening cases are presented in Figure 14. The value of increases with the increase in from 0 to 10 m/s for both cases, which is attributed to the wind speed in the wake zone downwind of the building. This indicates that buoyancy is the dominant parameter in controlling vertical spread of the fire for all values of assessed in this study. It can also be found that values of are higher for the narrow opening case than those for the wide opening case. This is because the fire is more concentrated at the opening for a smaller value of . The mean increase percentage in for from 0 to 10 m/s is 52% and 118% for the narrow opening and wide opening cases, respectively, which matches the findings for the buoyancy-dominated front wind effect (for relatively low front wind speed), substantiating that the fire is dominated by buoyancy for back wind.
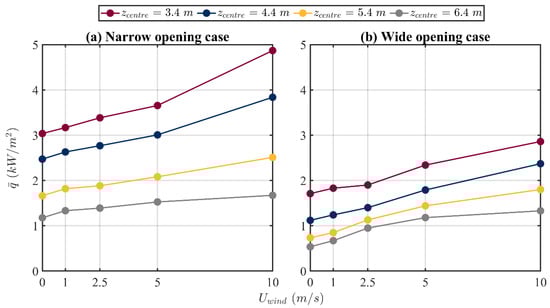
Figure 14.
Influence of the back wind speed on the predicted area-averaged gauge heat flux at four z locations of the centre of each plane for (a) the narrow opening case , (b) the wide opening case .
The increase in with the increase in shown in Figure 14 occurs as the wind is generated at the back of the building, resulting in the back and side of the building having higher pressure than the front of the building. This differential pressure results in airflow moving toward the front of the building, slightly ‘pushing’ the fire toward the front wall of the building, as the velocity vectors show in Figure 15. Furthermore, with the increase in , the differential pressure increases correspondingly, resulting in a rise in , as presented in Figure 14. This trend is similar to the effect of front wind with relatively low velocity (please refer to Figure 9).
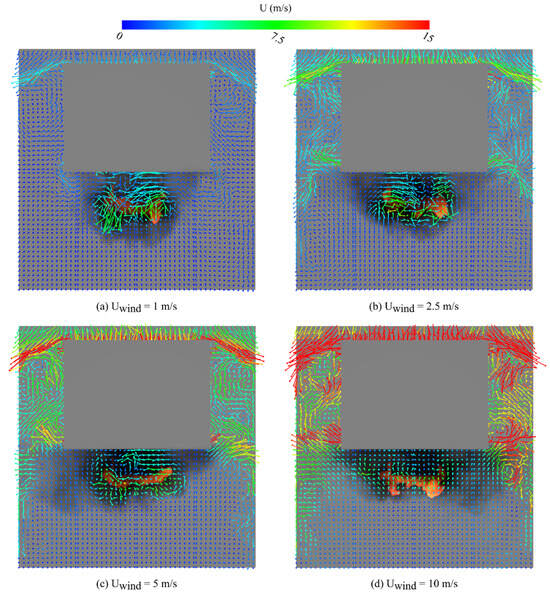
Figure 15.
Simulated velocity vector on the x-y plane at z = 3.75 m of the compartment model for the narrow opening case at 1000.0 s for the back wind speed of (a) 1 m/s; (b) 2.5 m/s; (c) 5 m/s; (d) 10 m/s. The vectors are overlaid on a visualisation of the fire based on heat release rate per unit area and soot density.
3.4. Comparison between Vertical Spandrel and Horizontal Projection
Figure 16 shows a comparison of on the four planes above the opening of the compartment of fire origin under the two protection measures, i.e., with a vertical spandrel and with a horizontal projection, considering the front wind speed ranging from 0 to 10 m/s. It can be seen that the value of is always higher for the vertical spandrel case than the horizontal projection case. The highest value of is found for of 2.5 or 5 m/s for the vertical spandrel case, while that for the horizontal projection case is found for of 1 or 2.5 m/s. This is because the horizontal projection forms a step altering the upward flow of hot gases, which is not the case for the vertical spandrel, as presented in Figure 17. That is, only front wind ‘pushes’ the fire towards the exterior wall of the compartment for the vertical spandrel case. For of 10 m/s, the decrease in for the compartment equipped with a vertical spandrel is due to the flame spread along the direction.
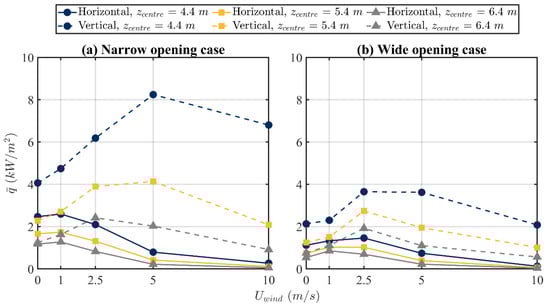
Figure 16.
Influence of the front wind speed on the predicted area-averaged gauge heat flux at three z locations of the centre of each plane for the vertical spandrel and the horizontal projection for (a) the narrow opening case , (b) the wide opening case .
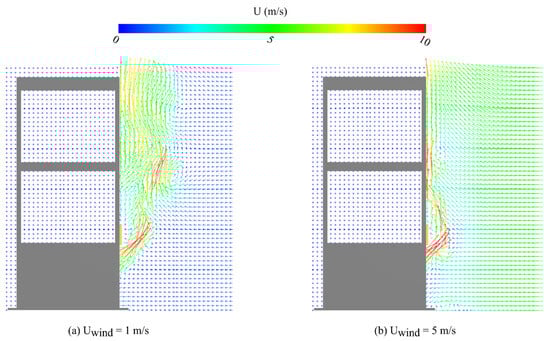
Figure 17.
Simulated velocity vector on the y-z plane at x = 0 m of the compartment model equipped with a vertical spandrel for the narrow opening case at 1000.0 s for front wind speed of: (a) 1 m/s; (b) 5 m/s.
As presented in Figure 18, similar trends in can be found in the simulation results of the cases with a vertical spandrel and those with a horizontal projection. For the side wind, the values of increase for increasing from 1 to 5 m/s and then decrease for increasing from 5 to 10 m/s for both the narrow opening and wide opening cases. This is mainly because the flow recirculation caused by the forward-facing step exists for the configuration of the building, which is illustrated in Figure 12. For the back wind, the values of increase with the increase in . This is because buoyancy is dominant for all wind speeds, which is illustrated in Figure 14. Furthermore, it can be found that for the vertical spandrel case is always higher than the horizontal projection case for the same value of .
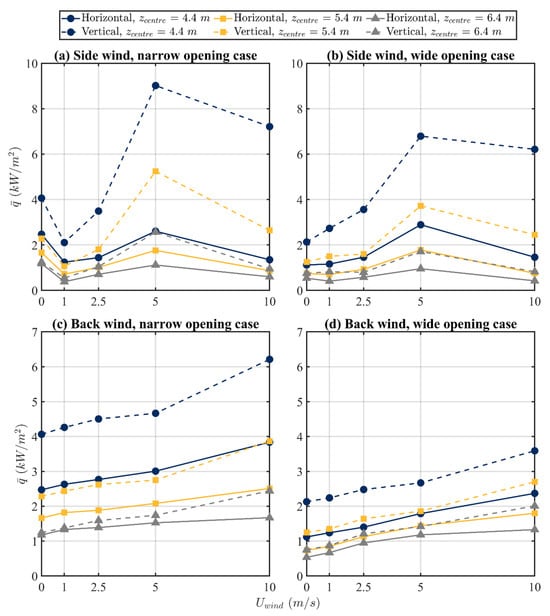
Figure 18.
Influence of the side and back wind speed on the predicted area-averaged gauge heat flux at three z locations of the centre of each plane for the vertical spandrel and the horizontal projection for (a) the narrow opening case with side wind , (b) the wide opening case with side wind , (c) the narrow opening case with back wind , and (d) the wide opening case with back wind .
4. Discussion
The simulations have highlighted some trends in the wind patterns, and have addressed some issues mentioned in the Introduction, and these are discussed.
4.1. Comparing Narrow and Wide Openings
For the buoyancy-dominated fire (such as a relatively low front wind speed, or a range of back wind speeds), vertical spread of fire is more likely to occur in the case of an opening with a smaller width. The narrow opening allows higher heat flux to travel vertically as it is concentrated into a narrower vertical band. The wide opening results in a broader distributed fire such that the fire also impinges on the areas adjacent to the measurement planes and is being undetected by the current measurement areas underestimating the vertical heat flux. The current wide opening geometry does not meet the Australian Building Code minimum width requirements of projection extending 0.45 m beyond the opening, and for larger fires, this geometry could cause fire spread to the side of the projection.
4.2. Likelihood of Fire Spread
For the 5.5 MW fire without external wind or a horizontal projection, Figure 5 shows that the heat flux impinging on the centre line above the opening at a height of z = 3.30 m is 12 kW/m2 in the simulation (or 19 kW/m2 by experiment [30]). With a poor choice of cladding, this could be a large enough heat flux to cause vertical fire spread. When a horizontal projection is included in the modelling, the vertical heat flux is too low to support ignition.
Simulation results for the side wind (Figure 11) indicate that heat fluxes well above 12 kW/m2 can be obtained both immediately above the opening when a horizontal projection is present, and to the side of the projection, indicating that vertical fire spread is likely, particularly for winds at or above 5 m/s. Back winds do not appear to promote vertical fire spread under these conditions.
4.3. Equivalent Effectiveness of Vertical Spandrel and Horizontal Projection
In reference to the equivalent protection effectiveness ratio discussed in the Introduction (found to be 1.67 to 4.17 according to the literature [15,16,17]), using the current geometry with a horizontal projection of 1.10 m depth, a vertical spandrel would be required to extend vertically from the opening height to between z = 4.64 m and z = 7.39 m, which encompasses Plane_3 and Plane_4 in Figure 2, in order to be as effective as the horizontal projection.
The values in Figure 16 and Figure 18 at 5.4 and 6.4 m can be used to assess the equivalent effectiveness. For all wind directions, the vertical spandrel results in similar to the horizontal projection for lower wind speeds of m/s, so similar protection would be expected. As wind speeds increase, the equivalent effectiveness is at variance with the results from the literature, indicating that flow behaviour becomes complex, and a simple correlation is unable to be determined. The higher values for the vertical spandrel area averages at 4.4 m demonstrate that protection is required.
4.4. Wind Direction
Key observations regarding the effect of wind direction and wind speed can be made:
- For front wind (upstream and normal to the plane of the opening) with relatively low speeds (i.e., m/s), vertical spread of fire is slightly enhanced as buoyancy remains the dominant parameter in fire spread. With the increase in wind speed ( m/s), the dominant parameter is transitioned to the effect of front wind. That is, the vertical spread of the fire is inhibited for relatively high wind speeds. On the other hand, flame spread along the horizontal direction is enhanced.
- For side wind (parallel to the plane of the opening), the controlling parameter is the wind. At relatively low speeds, the behaviour is similar to that of a low-speed front wind, and the horizontal projection inhibits the vertical spread of the fire. With the increase in the speed of wind, the vertical spread of the fire is enhanced because the forward-facing step phenomenon leads to flow recirculation, which results in the flame spreading laterally toward the upwind direction. With further increase in the wind speed, the spread of the fire is then inhibited, due to the increased flow instability.
- For back wind (normal to the plane of the opening), buoyancy remains the dominant parameter. With the increase in the wind speed, the vertical spread of the fire increases.
- The use of a 1.1 m deep horizontal projection above the opening of the compartment is substantiated to be more effective in inhibiting vertical spread of the fire than the use of a 1.1 m high vertical spandrel for the wind speeds and directions investigated. This indicates that a horizontal projection has a positive impact on preventing vertical spread of the fire for a high front wind speed; instead, high wind speed enhances the lateral spread of the fire as heat is forced sideways.
5. Conclusions
The effect of external wind from different directions on the vertical spread of fires via openings in external walls of buildings, under the protection of a horizontal projection or a vertical spandrel between openings, was investigated.
The work confirms that a horizontal projection performs better at inhibiting vertical fire spread than a vertical spandrel, particularly at wind speeds greater than 2.5 m/s. Winds from different directions affect the performance of a horizontal projection or a vertical spandrel placed above a compartment opening in preventing vertical fire spread. For the 5.5 MW compartment fire, protective systems and wind velocities studied here, fire spread is possible in the presence of side winds at and between 5 m/s and 10 m/s but is unlikely to occur for front and back winds below 10 m/s, as incident heat flux is too low to support material ignition. Therefore, the effect of external wind from different directions should be taken into consideration in the design of fire safety measures.
Although the simulation meshing was initially validated against a set of fire experiments with no wind, future work should compare the simulation to real data from a variety of fire sizes and investigate actual wind velocities expected around buildings at different heights. Furthermore, other building parameters, such as the number of openings and spandrel/projection dimensions, shall be considered for future works on this topic, so that the hazard of vertical fire spread via openings in external walls can be further mitigated.
Author Contributions
Conceptualization, Z.T. and X.C.; methodology, Z.H., X.C. and Y.T.; validation, Y.T.; formal analysis, Y.T.; investigation, Y.T., Z.T. and X.C.; writing—original draft preparation, Y.T.; writing—review and editing, Z.T., X.C., Z.H., B.S. and G.G.; supervision, Z.T. and X.C.; project administration, Z.T., B.S. and G.G.; funding acquisition, Z.T., B.S. and G.G. All authors have read and agreed to the published version of the manuscript.
Funding
We gratefully acknowledge the financial support from Australia Research Council (ARC) Industrial Transformation Training Centres (IC170100032).
Institutional Review Board Statement
Not applicable.
Informed Consent Statement
Not applicable.
Data Availability Statement
The raw data supporting the conclusions of this article will be made available by the authors on request.
Conflicts of Interest
Yining Tang is an employee of the company Sotera. Xiao Chen is an employee of the company WSP. The remaining authors declare that the research was conducted in the absence of any commercial or financial relationships that could be construed as a potential conflict of interest.
References
- Chen, T.B.Y.; Yuen, A.C.Y.; Yeoh, G.H.; Yang, W.; Chan, Q.N. Fire Risk Assessment of Combustible Exterior Cladding Using a Collective Numerical Database. Fire 2019, 2, 11. [Google Scholar] [CrossRef]
- Keski-Rahkonen, O. Breaking of window glass close to fire. Fire Mater. 1988, 12, 61–69. [Google Scholar] [CrossRef]
- Koohkan, M.; Dréan, V.; Girardin, B.; Guillaume, E.; Fateh, T.; Duponchel, X. Reconstruction of the Grenfell Tower Fire—Thermomechanical Analysis of Window Failure During the Grenfell Tower Disaster. Fire Technol. 2021, 57, 69–100. [Google Scholar] [CrossRef]
- Chow, C.L.; Chow, W.K. Heat release rate of accidental fire in a supertall building residential flat. Build. Environ. 2010, 45, 1632–1640. [Google Scholar] [CrossRef]
- Saito, K.; Quintiere, J.G.; Willians, F.A. Upward Turbulent Flame Spread. In Fire Safety Science—Proceedings of the First International Symposium; Hemisphere Publishing Corporation: New York, NY, USA, 1985. [Google Scholar]
- Drysdale, D. An Introduction to Fire Dynamics; John Wiley & Sons Inc.: Hoboken, NJ, USA, 2011. [Google Scholar]
- Hurley, M.J.; Gottuk, D.T.; Hall, J.R., Jr.; Harada, K.; Kuligowski, E.; Puchovsky, M.; Watts, J.M., Jr.; Wieczorek, C.J. SFPE Handbook of Fire Protection Engineering; Springer: Berlin/Heidelberg, Germany, 2015. [Google Scholar]
- An, W.; Meng, Q.; Pan, R.; Zhu, H. Influence of horizontal projection on upward flame spread over XPS thermal insulation material. Fire Mater. 2018, 42, 527–536. [Google Scholar] [CrossRef]
- ABCB. National Construction Code Volume One. In Building Code of Australia; ABCB: Canberra, Australia, 2019. [Google Scholar]
- Čolić, A.; Pečur, I.B. Influence of Horizontal and Vertical Barriers on Fire Development for Ventilated Façades. Fire Technol. 2020, 56, 1725–1754. [Google Scholar] [CrossRef]
- Delichatsios, M.A.; Ryan, J.; Tian, N.; Zhang, J. Vertical safe separation distance between openings in multi-storey buildings having a fire resistant spandrel. MATEC Web Conf. 2016, 46, 04003. [Google Scholar] [CrossRef]
- McKeen, P.; Liao, Z. The impact of horizontal projections on lateral fire spread in multi-unit residential buildings—Comparison of numerical and similarity correlations. Fire Saf. J. 2021, 126, 103441. [Google Scholar] [CrossRef]
- Nilsson, M. The impact of horizontal projections on external fire spread-a numerical comparative study. Master Thesis, Lund University, Lund, Sweden, 2016. [Google Scholar]
- Weinert, D.; Poh, W. Performance of horizontal projections in vertical separation of openings in external walls–comparison with BCA solutions. In Proceedings of the International Conference on Fire Safety Engineering, Gold Coast, Australia, 23 May 2006. [Google Scholar]
- Nilsson, M.; Husted, B.; Mossberg, A.; Anderson, J.; McNamee, R.J. A numerical comparison of protective measures against external fire spread. Fire Mater. 2018, 42, 493–507. [Google Scholar] [CrossRef]
- Nilsson, M.; Nilsen, J.; Mossberg, A. Validating FDS against a large-scale fire test for facade systems. In Proceedings of the 3rd Fire and Evacuation Modelling Technical Conference (FEMTC), Málaga, Spain, 16–18 November 2016. [Google Scholar]
- Oleszkiewicz, I. Vertical separation of windows using spandrel walls and horizontal projections. Fire Technol. 1991, 27, 334–340. [Google Scholar] [CrossRef]
- Yuen, A.C.Y.; Yeoh, G.H.; Timchenko, V.; Cheung, S.C.P.; Chan, Q.N.; Chen, T.B.Y. On the influences of key modelling constants of large eddy simulations for large-scale compartment fires predictions. Int. J. Comput. Fluid Dyn. 2017, 31, 324–337. [Google Scholar] [CrossRef]
- Yuen, A.C.Y.; De Cachinho Cordeiro, I.M.; Chen, T.B.Y.; Chen, Q.; Liu, H.; Yeoh, G.H. Multiphase CFD modelling for enclosure fires—A review on past studies and future perspectives. Exp. Comput. Multiph. Flow 2022, 4, 1–25. [Google Scholar] [CrossRef]
- Hu, L.; Ren, F.; Hu, K.; Tang, F.; Lu, K. An experimental study on temperature evolution inside compartment with fire growth and flame ejection through an opening under external wind. Proc. Combust. Inst. 2017, 36, 2955–2962. [Google Scholar] [CrossRef]
- Ren, F.; Hu, L.; Zhang, X.; Sun, X.; Fang, X. Temperature evolution from stratified- to well-mixed condition inside a fire compartment with an opening subjected to external wind. Proc. Combust. Inst. 2021, 38, 4495–4503. [Google Scholar] [CrossRef]
- Hu, L.; Hu, K.; Ren, F.; Sun, X. Facade flame height ejected from an opening of fire compartment under external wind. Fire Saf. J. 2017, 92, 151–158. [Google Scholar] [CrossRef]
- Hu, L.; Sun, X.; Zhang, X.; Ren, F. Facade flame height and horizontal extending distance from opening of compartment fire with external sideward wind. Proc. Combust. Inst. 2019, 37, 3859–3867. [Google Scholar] [CrossRef]
- Sugawa, O.; Momita, D.; Takahashi, W. Flow behavior of ejected fire flame/plume from an opening effected by external side wind. Fire Saf. Sci. 1997, 5, 249–260. [Google Scholar] [CrossRef][Green Version]
- Sherry, M.; Jacono, D.L.; Sheridan, J. An experimental investigation of the recirculation zone formed downstream of a forward facing step. J. Wind Eng. Ind. Aerodyn. 2010, 98, 888–894. [Google Scholar] [CrossRef]
- Benard, P.S.; Wallace, J.M. Turbulent Flow: Analysis, Measurement, and Prediction; John Riley & Sons Inc.: Hoboken, NJ, USA, 2002. [Google Scholar]
- McGrattan, K.B.; McDermott, R.J.; Weinschenk, C.G.; Forney, G.P. Fire Dynamics Simulator—Technical Reference Guide, 6th ed.; National Institute of Standards and Technology: Gaithersburg, MA, USA, 2013.
- Tian, Z.F. Numerical Modelling of Turbulent Gas-Particle Flow and Its Applications. Ph.D. Thesis, RMIT University, Melbourne, Australia, 2006. [Google Scholar]
- Huang, Z.; Tian, Z.F.; Chen, X. Numerical study of effects of wind on the vertical fire spread with vertical/horizontal spandrel. In Proceedings of the 13th International Conference on Computational Methods, Barcelona, Spain, 25–28 July 2022. [Google Scholar]
- Oleszkiewicz, I. Heat Transfer from a Window Fire Plume to a Building Façade; National Research Council of Canada, Institute for Research in Construction: Ottawa, ON, Canada, 1989. [Google Scholar]
- Oleszkiewicz, I. Fire exposure to exterior walls and flame spread on combustible cladding. Fire Technol. 1990, 26, 357–375. [Google Scholar] [CrossRef]
- Xin, Y. Assessment of Fire Dynamics Simulation for Engineering Applications: Grid and Domain Size Effects. In Proceedings of the Fire Suppression and Detection Research Application Symposium, Orlando, FL, USA, 21–23 January 2004. [Google Scholar]
- McGrattan, K.; Hostikka, S.; McDermott, R.; Floyd, J.; Weinschenk, C.; Overholt, K. Fire dynamics simulator user’s guide. NIST Spec. Publ. 2013, 1019, 1–339. [Google Scholar]
Disclaimer/Publisher’s Note: The statements, opinions and data contained in all publications are solely those of the individual author(s) and contributor(s) and not of MDPI and/or the editor(s). MDPI and/or the editor(s) disclaim responsibility for any injury to people or property resulting from any ideas, methods, instructions or products referred to in the content. |
© 2024 by the authors. Licensee MDPI, Basel, Switzerland. This article is an open access article distributed under the terms and conditions of the Creative Commons Attribution (CC BY) license (https://creativecommons.org/licenses/by/4.0/).