Article

New Experimental Approaches for the Determination of Flammability Limits in Methane–Hydrogen Mixtures with CO2 Inertization Using the Spark Test Apparatus

1
Escuela Técnica Superiror de Ingenieros de Minas y Energía, Universidad Politécnica de Madrid (UPM), 28003 Madrid, Spain
2
TECMINERGY-Laboratorio Oficial J.M. Madariaga (LOM), Universidad Politécnica de Madrid (UPM), 28906 Madrid, Spain
*
Author to whom correspondence should be addressed.
Fire 2024, 7(11), 403; https://doi.org/10.3390/fire7110403
Submission received: 25 September 2024 / Revised: 28 October 2024 / Accepted: 28 October 2024 / Published: 2 November 2024

Abstract

This study presents a novel experimental method to determine the flammability limits and the minimum oxygen concentration in methane–hydrogen mixtures using the spark test apparatus (STA), by incorporating CO2 as an inert compound. The proposed methodology allows for the more accurate and efficient assessment of the safety of these flammable mixtures, which is crucial for industrial applications where hydrogen-enriched fuels are used. When comparing the literature data, the differences between methods are not significant, although the procedure, apparatus, and test conditions influence the results. Then, the proposed method is experimentally validated in the STA. Methane is enriched with hydrogen at different concentrations (10, 20, 30, and 50%). The results in the STA show good alignment with the literature data. Furthermore, literature data analysis allows for the generation of an empirical curve that shows the influence of hydrogen addition in methane–air mixtures. The theoretical flammability intervals are also presented as a result. Such representations, after method validation, are the base of the flammability interval test in the STA. The capability of the STA to define flammability ranges in ternary diagrams provides an innovative graphical approach to control explosive atmospheres and facilitates its application in the prevention of industrial accidents.

1. Introduction

Hydrogen is gaining interest for its potential in various industrial applications, particularly in mixtures with other gases [1,2]. Despite its benefits, such as its non-toxicity and rapid dispersion in the case of leaks, hydrogen poses significant explosion risks due to its wide range of explosive concentrations when mixed with air and its lower ignition energy than gasoline or natural gas [3]. Ensuring the safe use of hydrogen in industry requires careful attention to ventilation and leak detection systems [4]. Recent studies show that mixing hydrogen with natural gas or using it in biogas production can enhance combustion efficiency and increase methane yield, making hydrogen a valuable addition to existing industrial processes [5,6,7].
Hydrogen-enriched methane has distinct flammability and explosiveness characteristics, which differ from pure methane and are critical to understanding its potential for safe industrial use [8,9,10]. Research highlights that small hydrogen concentrations can improve combustion efficiency, while larger amounts may lead to incomplete combustion. Studies typically focus on hydrogen concentrations between 0 and 50%, but in practical applications, the hydrogen content generally does not exceed 20% [11,12]. These developments underscore the growing importance of hydrogen mixtures in optimizing industrial processes and enhancing fuel performance.
Despite some authors affirming that the addition of less than 25% hydrogen does not necessarily raise the risk level in certain scenarios [13], knowledge of its flammability characteristics is essential as they allow for the controlling of safety parameters for fuel gases in industry. Lower and upper flammability limits (LFLs and UFLs, respectively) encompass a set of flammable mixtures and are one of the most important parameters for characterizing and handling flammable gases. LFLs, and largely UFLs, are affected by pressure and temperature conditions, so the tests developed in this study were carried out under atmospheric conditions [14]. The addition of inert gas to the flammable mixture allows for the avoidance of explosion risks, where the limiting oxygen concentration (LOC) represents the threshold value within which the mixture is not able to generate an explosive atmosphere [15,16].
Inert gases such as nitrogen and carbon dioxide are used in industry to prevent explosions [17]. Nitrogen is normally used due to its low cost, despite it having less inert power against hydrogen than carbon dioxide [18]. However, some processes generate carbon dioxide, and thus it could be used directly to carry out atmosphere inertization. This is the case in biomethane production since the addition of hydrogen in the fermentation process enhances the yield of methane conversion, generating CO2 that can be used for safety controls. Taking advantage of this scenario, this study is focused on carbon dioxide inertization.
The inertization of CH4–air mixtures decreases both the adiabatic and experimental pressure of an explosion, along with the explosion time [19,20,21], but the influence of hydrogen addition needs to be studied experimentally to check the theoretical data. Specifically, this regard safety measures in the industry since some prevention methods might be affected by hydrogen addition [22].
According to Le Chatelier’s law, the flammability limits of a mixture depend on molar fractions and the flammability limits of each single component [10]. Thus, the addition of a second flammable gas to the methane–air mixture, such as hydrogen, has a direct effect on this parameter. Hydrogen addition has a greater influence on UFLs than LFLs [17,23,24], as reflected in numerous studies focused on experimental procedures to obtain the flammability limits of methane–hydrogen mixtures in air, although there are significant discrepancies in the experimental results depending on the method used [25]. This is to be expected according to Le Chatelier’s law since the LFLs are close for both gases.
The sensitivity to electrostatic and electric ignition sources is strongly affected by hydrogen addition as well: the minimum ignition energy (MIE) decreases as the hydrogen content increases [26]. This kind of ignition source is quite interesting as hydrogen installations have an effect on process automation applications such as actuators, sensors, and displays, where electrical discharges may take place with current values below 1 A and voltages lower than 50 V. Normally, the discharge can be considered as a short arc; however, there are some caveats. When the discharge has shorter time periods and lower energies, it cannot be compared to an electric arc [27]. The electrical discharge depends on multiple factors, such as the surface characteristics, electrode surface characteristics, metal deposits on the electrodes, the oxide level, and the wire length. The correct maintenance of the electrodes is an essential measure to ensure the reproducibility of the results.
The experimental methodology presented in this study is based on the use of the spark test apparatus. The flammability limits determined in the STA depend on statistical parameters based on the number of contacts needed to ignite the mixture [28]. Indeed, one of the main disadvantages of the STA is the poor reproducibility of the results, as well as the toxicity of the cadmium electrode [29]. Some studies show good alignment with the literature data on flammability characteristics, such as the minimum ignition current (MIC) of hydrogen–methane mixtures in the air in the STA [30]—a parameter that can successfully indicate the sensitivity of flammable gas to electrostatic or electric sources.
Flammability characteristics are not physical material properties as they depend on the measuring method. The standardization of test methods is intended to avoid differences caused by parameters such as flame propagation direction, ignition energy, heat losses from the gas mixture to the surroundings, and isobaric and isochoric conditions of testing because the LFL, UFL, and LOC are strongly affected by these parameters. The main methods for measuring the explosion limits of gases and vapors are as follows [29]:
  • USBM method: The explosion occurs in a cylindrical vertical tube with an inner diameter of 50 mm and a length of 1500 mm. The ignition is made by an electric spark or a pilot flame passing by the open lower end of the tube.
  • ATSM 681-98 standard [31]: The explosion occurs in a 5 dm3 spherical glass; the ignition is made by a central spark igniter of 15 kV.
  • German method according to DIN 51 649 [32]: The explosion occurs in a cylindrical vertical glass tube with an inner diameter of 60 mm and a length of 300 mm. An electric spark igniter of 15 kV was located at the tube bottom.
  • Explosion vessel method: This method uses a closed volume chamber (spherical or cylindrical) into which a flammable mixture is introduced. Ignition is produced by an electric spark or a pilot flame, and the ignition criterion is usually based on the maximum pressure reached during combustion. This method is regulated by several standards such as ISO 10156 and EN 1839 [33] used to assess the flammability of gases and vapors.
  • Shock tube method: In this method, the ignition of a mixture is studied in a long tube, where a shock wave causes combustion. It is mainly used in chemical kinetics and ignition dynamics investigations, rather than in standard industrial LFL and UFL studies.
  • Moving vessel method: In this method, swelling is studied inside a vessel that moves or rotates during the process, allowing the simulation of flow or turbulent conditions. This type of technique is less common but is useful for studies in which flow dynamics affect the ignitable behavior.
In the above methods, the criteria for determining whether ignition has occurred can vary but are generally based on one of the following observations:
  • Pressure increase: In methods such as the explosion chamber method and ASTM E681-98, ignition is considered to have occurred when a sudden increase in pressure is detected in the chamber after application of the ignition source. Normally, a pressure increase of 5 to 10% above the initial value is taken as evidence of ignition.
  • Flame visualization: In methods such as USBM and DIN 51 649, the propagation of a visible flame or explosion through a tube or chamber can be directly observed. If the flame travelled from the ignition point through the gaseous mixture, ignition was considered to have occurred.
  • Burning rate: Some techniques, particularly in more detailed studies of combustion kinetics, use the fuel consumption rate or flame propagation speed as additional criteria for defining ignition.
  • Temperature: In some experiments, thermocouples or temperature sensors may be used to detect a sudden rise in the temperature of the gas mixture, indicating a combustion reaction.
The determination of the flammability limits and the limiting oxygen concentration are regulated in the standard EN 1839 [33], wherein the FL and LOC are obtained through an experimental method consisting of a test vessel (80 ± 2 mm in diameter) with two stainless steel electrodes that produce an electric spark to ignite the gas mixture.
All methods require consideration of the minimization of heat losses in the burnt gas region. There are also correlations that can be used to calculate the flammability limits by empirical methods, considering parameters such as the heat released, normal burning velocity, and adiabatic flame temperature [34].
Experimental methods to determine flammability limits or limiting oxygen concentrations provide single values of LFL, UFL, and LOC. The determination of these parameters is essential for the industry and for the characterization of mixtures; however, from a scientific point of view, knowing the entire set of flammable mixtures is very interesting. Although these methods are reliable and should be used in the industry, it is always beneficial to identify new methods that provide more data on the flammability of mixtures. In this way, triangular diagrams represent all possible concentrations of a ternary mixture. Ternary diagrams allow evaluation of the mixture from a safety point of view when both flammable and non-flammable mixtures are represented. The curve called the flammability interval (FI) or explosive zone separates both zones by a curve. This curve is delimited by the flammability limits (LFL and UFL) and LOC. The FI normally has the shape of a parabola where the vertex corresponds to the LOC.
Regarding the test methods, it must be noted that the use of the methodology proposed for the STA instead of the vessel tests allows the obtainment of all the points belonging to the flammability interval and not only the LOC which is the vertex of the flammability interval.
The STA is described in the intrinsic safety standards as an apparatus controlling the risk of ignition produced by contact arcs. Therefore, even if contact arc discharge occurs, the gas mixture does not ignite. The discharges occurring in the STA have been poorly studied, since there are few studies in the literature. From these studies, we know that electrical contact arcs are electric discharges and constitute an unknown ignition source. Discharges can occur when two electrodes are in contact or when the contact is broken [35]. One of the most dangerous aspects of electrical contact arcs is the fact they can occur at voltages significantly below 300 V which is the minimum voltage required for the dielectric breakdown of air according to Paschen’s law [36]. Typical conditions for electrical contact arcs are 15–40 V, 50–300 mA, and 30–200 µs. The highly flammable nature of hydrogen presents an important risk associated with this kind of ignition source, so the study of the addition of hydrogen to the methane–air mixture in the STA is an important research topic. In this study, we aim to experimentally evaluate the flammability characteristics of methane–hydrogen mixtures and the impact of carbon dioxide inertization using the spark test apparatus (STA). Specifically, we will determine the lower and upper flammability limits (LFL, UFL) and the limiting oxygen concentration (LOC) for CH4–H2; mixtures under varying hydrogen concentrations. The percentage of hydrogen will vary from 0% to 50%, as above this value no industrial uses are found [36,37]. By combining experimental data with theoretical models, we will propose a methodology to predict the flammability behavior of CH4–H2;–air–CO2; mixtures. This research builds on existing studies on flammability limits and safety measures in industrial environments and seeks to provide a more accurate understanding of how hydrogen affects combustion safety parameters.

2. Materials and Methods

As introduced above, there are few studies on discharges occurring in the STA, even though discharges are crucial phenomena controlling gas ignition. According to Uber et al., this phenomenon can be explained in four phases [35]. Contact between the electrodes occurs in the first phase. However, the preliminary processes occur when the electrodes begin to separate, in the second phase. The greatest discharge takes place in the third phase releasing the highest energy. Finally, in the fourth phase, the distance between both electrodes is greater, so the thermochemical reaction occurs. Hence, the spark test apparatus checks if the gas mixture produces a thermochemical ignition.
The experimental determination of the flammability limits and the LOC described in this section provides a methodology to overcome the poor reproducibility and to assure the accuracy of the literature data. The method is validated through flammability limit calculation and literature data comparison.

2.1. Experimental Development in the STA

The STA is described in the standard EN 60079-11 as an apparatus to measure the capability of a circuit to ignite an explosive atmosphere [28]. The extended use of the STA for intrinsic safety tests, the possibility to vary the energy of the spark, the ability to visually check the explosion, and the high sensitivity of the pressure sensors make the STA interesting equipment to experimentally obtain flammability parameters like the FL, LOC, and FI. However, its use is limited by its disadvantages. The uncontrolled way in which contact arcs occur implies an extremely poor reproducibility of results. In addition, the energy of the spark is not exactly the energy fixed in the external power supply. Moreover, the STA has physical differences compared with other experimental methods such as, among other factors, the volume and shape of the combustion chamber, the energy of the ignition source, and the sensitivity of the sensors to detect the explosion.
The STA contains a hemispherical chamber with a volume of 250 cm3, which is smaller than the chambers used in other methods [38]. The ignition energy is controlled by an external power supply allowing it to be adjusted depending on the gas tested or explosive atmosphere conditions. The discharge energy needs to ignite a hydrogen–methane–air mixture with a hydrogen content per volume of up to 50%. Energies greater than 18 µJ are effective for hydrogen percentages of up to 21% [29] and, according to the MIE of hydrogen, the ignition energy is fixed at 20 µJ. The electric discharge in the STA occurs by contact and not by dielectric breakdown of air. The first electrode consists of a rotating cadmium disk with two slots that cross it from side to side. The second one is a “thread holder”, constituted by a circle, or square, of brass wherein four wolfram wires of 0.2 ± 2% mm of diameter are attached. The wolfram wires must be long enough to ensure the contact between both electrodes. The rotation speed of the thread holder is fixed at 80 rpm, as established in the standard EN 60079-11.
The mass controller regulates the flow of the three gases setting the inlet pressure of each gas at 2 bar. To ensure the homogenization of the mixture, the experimental setup is composed of a mixer and a gas circuit before entering the ignition chamber. When the STA is used to characterize flammable gases, the explosion can be double-checked: by means of the high precision pressure sensors but also visually. The purge of gases is guaranteed with a filling time of 120 s which is recorded and measured by the equipment itself. Once this time has elapsed, the access valve is closed. Figure 1 describes the experimental setup previously explained.
The experimental methodology intends to overcome the reproducibility problems by registering and controlling the number of revolutions needed to ignite the mixture. The STA is an empirical test device that verifies the power limitation where the number of rounds needed to ignite the mixture is a key parameter to determine whether the risk of explosion is acceptably low or not [39,40]. Table 1 exposes the risk assessment criteria to determine the mixture flammability. The four groups are designed considering that the maximum number of turns is In addition, it has been experimentally shown that the most flammable gases produce ignition in the first 20 turns. If other groups are added, it is because concentration and mixture heterogeneity can be key factors to obtain ignition under other conditions. Whenever ignition occurs, whatever the group, the mixture will be considered flammable. Each test is repeated four times. If the result is in the same group as in Table 1 in all four repetitions, the result can be considered valid; otherwise, it is necessary to repeat it six times more (leading to ten test results). In this case, the result will be the group in which ignition occurred the most times.
Considering the classification reported in Table 1, between 1 and 50 rounds, the mixture is considered as flammable, after Round 51, the probability of ignition is low, so the mixture is considered non-flammable, as well as if the mixture does not inflame.
Considering these criteria, the experimental methodology consists of testing different concentrations of fuel–air mixtures, starting with lower values of air concentration and increasing them until ignition is observed. The first turning point corresponds to the UFL. To obtain the LFL, an inverse procedure was carried out. As the flammability limits are calculated for binary mixtures, methane and hydrogen are premixed, maintaining the same proportion of hydrogen in methane and varying the air concentration. Ignition was detected when a sharp pressure rise was registered. The pressure sensors detected the explosion from a 5% differential pressure.

2.2. Experimental System Validation

The values of the FL of H2–CH4 mixtures in air present remarkable differences in the literature [41]. Because this study proposes the use of a different apparatus, it is expected to obtain values with certain misalignment. However, to ensure the accuracy of the results presented in the present work, the experimental system is validated through the comparison of literature data and experimental results in the STA. Even so, by collecting the existing data and the results obtained in this study, it is possible to calculate a tendency line to approximate the influence of the hydrogen addition in the flammability limits of methane in the air. This line can provide reliable approximations from where it is possible to estimate the FL of the hydrogen–methane–air mixture.

2.3. Experimental and Theoretical Methodology to Obtain the Flammability Intervals in the STA

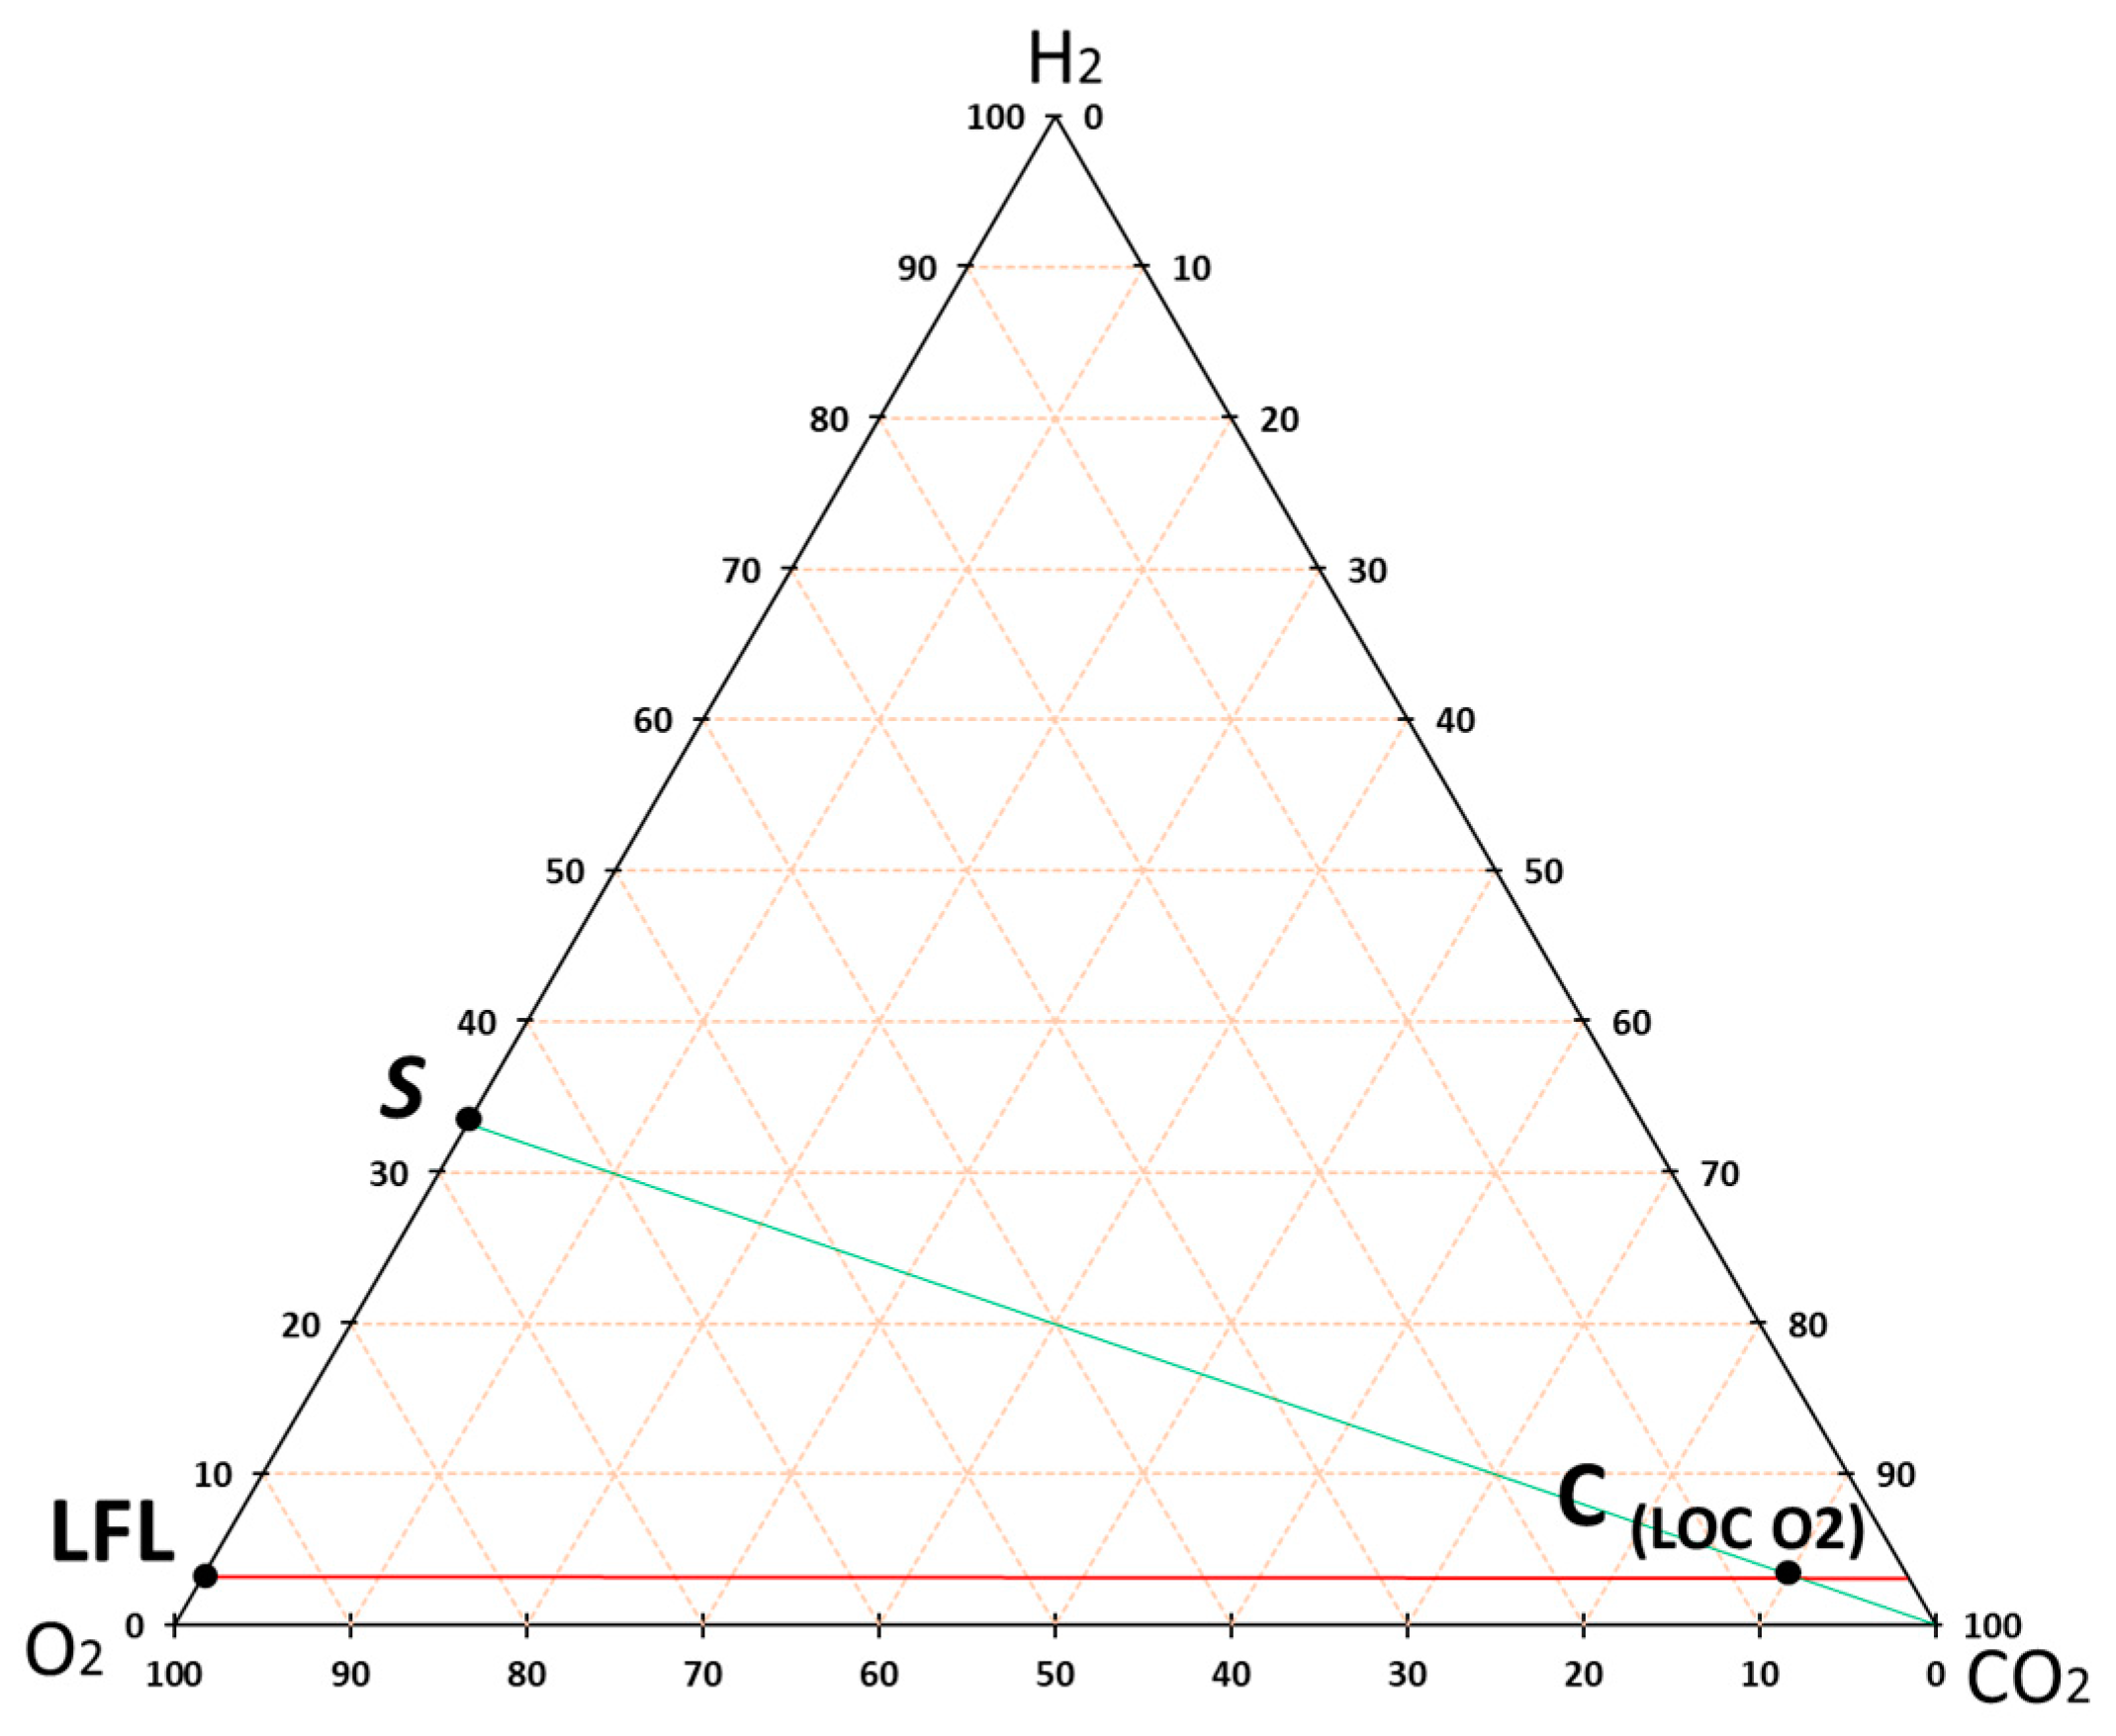
The representation of the flammability interval or explosive area in ternary diagrams is quite useful and is drawn on European standards [42]. Graphically, the set of flammable mixtures is delimited by the FL and LOC. The LOC point in the ternary diagram refers to the ternary mixture containing the oxygen limit above which an explosion cannot occur. Since the LOC is given as the percentage of oxygen, we will call this ternary point C(LOC). The three points belong to the flammability interval, which can be defined as the curve that contains all flammable mixtures. Knowledge of the theoretical flammability interval is a valuable approach to obtain a preliminary idea of the flammability of a ternary mixture. In this section, the theoretical method is explained through the calculation of the flammability interval of the H2–CO2–air mixture. Ternary diagrams must first refer to pure oxygen, as this method is based on the oxygen stoichiometric point. The LFL of hydrogen in oxygen is 4% and the UFL is 94% [18]. The stoichiometric point “S” in Figure 2 corresponds to the stoichiometric concentration of fuel on pure oxygen needed to complete the combustion reaction, XOThe “S” point results in the stoichiometric line connecting the “S” point and the inert vertex. Equations (1) and (2) show the generic equations defining a combustion reaction considering the stoichiometric coefficients.
C η C H η H O η O + v O 2 O 2   v C O 2 C O 2 + v H 2 O H 2 O
x O 2 = v O 2 v f u e l + v O 2 = η C η O 2 + η H 4   1 + η C η O 2 + η H 4
The stoichiometry of the reaction of the H2–CH4 mixture refers to both reactants, considering that methane is the major reactant. In the scenario of 0% methane (which is the case in this example), the combustion reaction refers to pure hydrogen, where XO2 is 33% (Figure 2). The theoretical LOCO2 is located approximately at the crossing point between the stoichiometric line and the LFL line which means that LOC occurs at a stoichiometric concentration. Razus et al. [43], measured the LOC for several hydrocarbon–air–nitrogen mixtures determining that the LOC occurs at a fuel–air equivalence ratio in the range of 1.10 to 1.49 and not at a stoichiometric concentration [43]. Despite this deviation, because this is a theoretical approximation that simplifies the experimental method, we can assume the difference. The LFL line can be approximated as parallel to the CO2-O2 vertex. This hypothesis is based on the lack of fuel gas; therefore, there is always an oxidant excess below the LFL, which means that it can be assumed that the LFL is independent of the oxygen concentration. Consequently, the line is approximately a parallel of the CO2-O2 vertex, drawn from the UFL. Both the lines and the CLOCO2 referring to oxygen are shown in Figure 2.
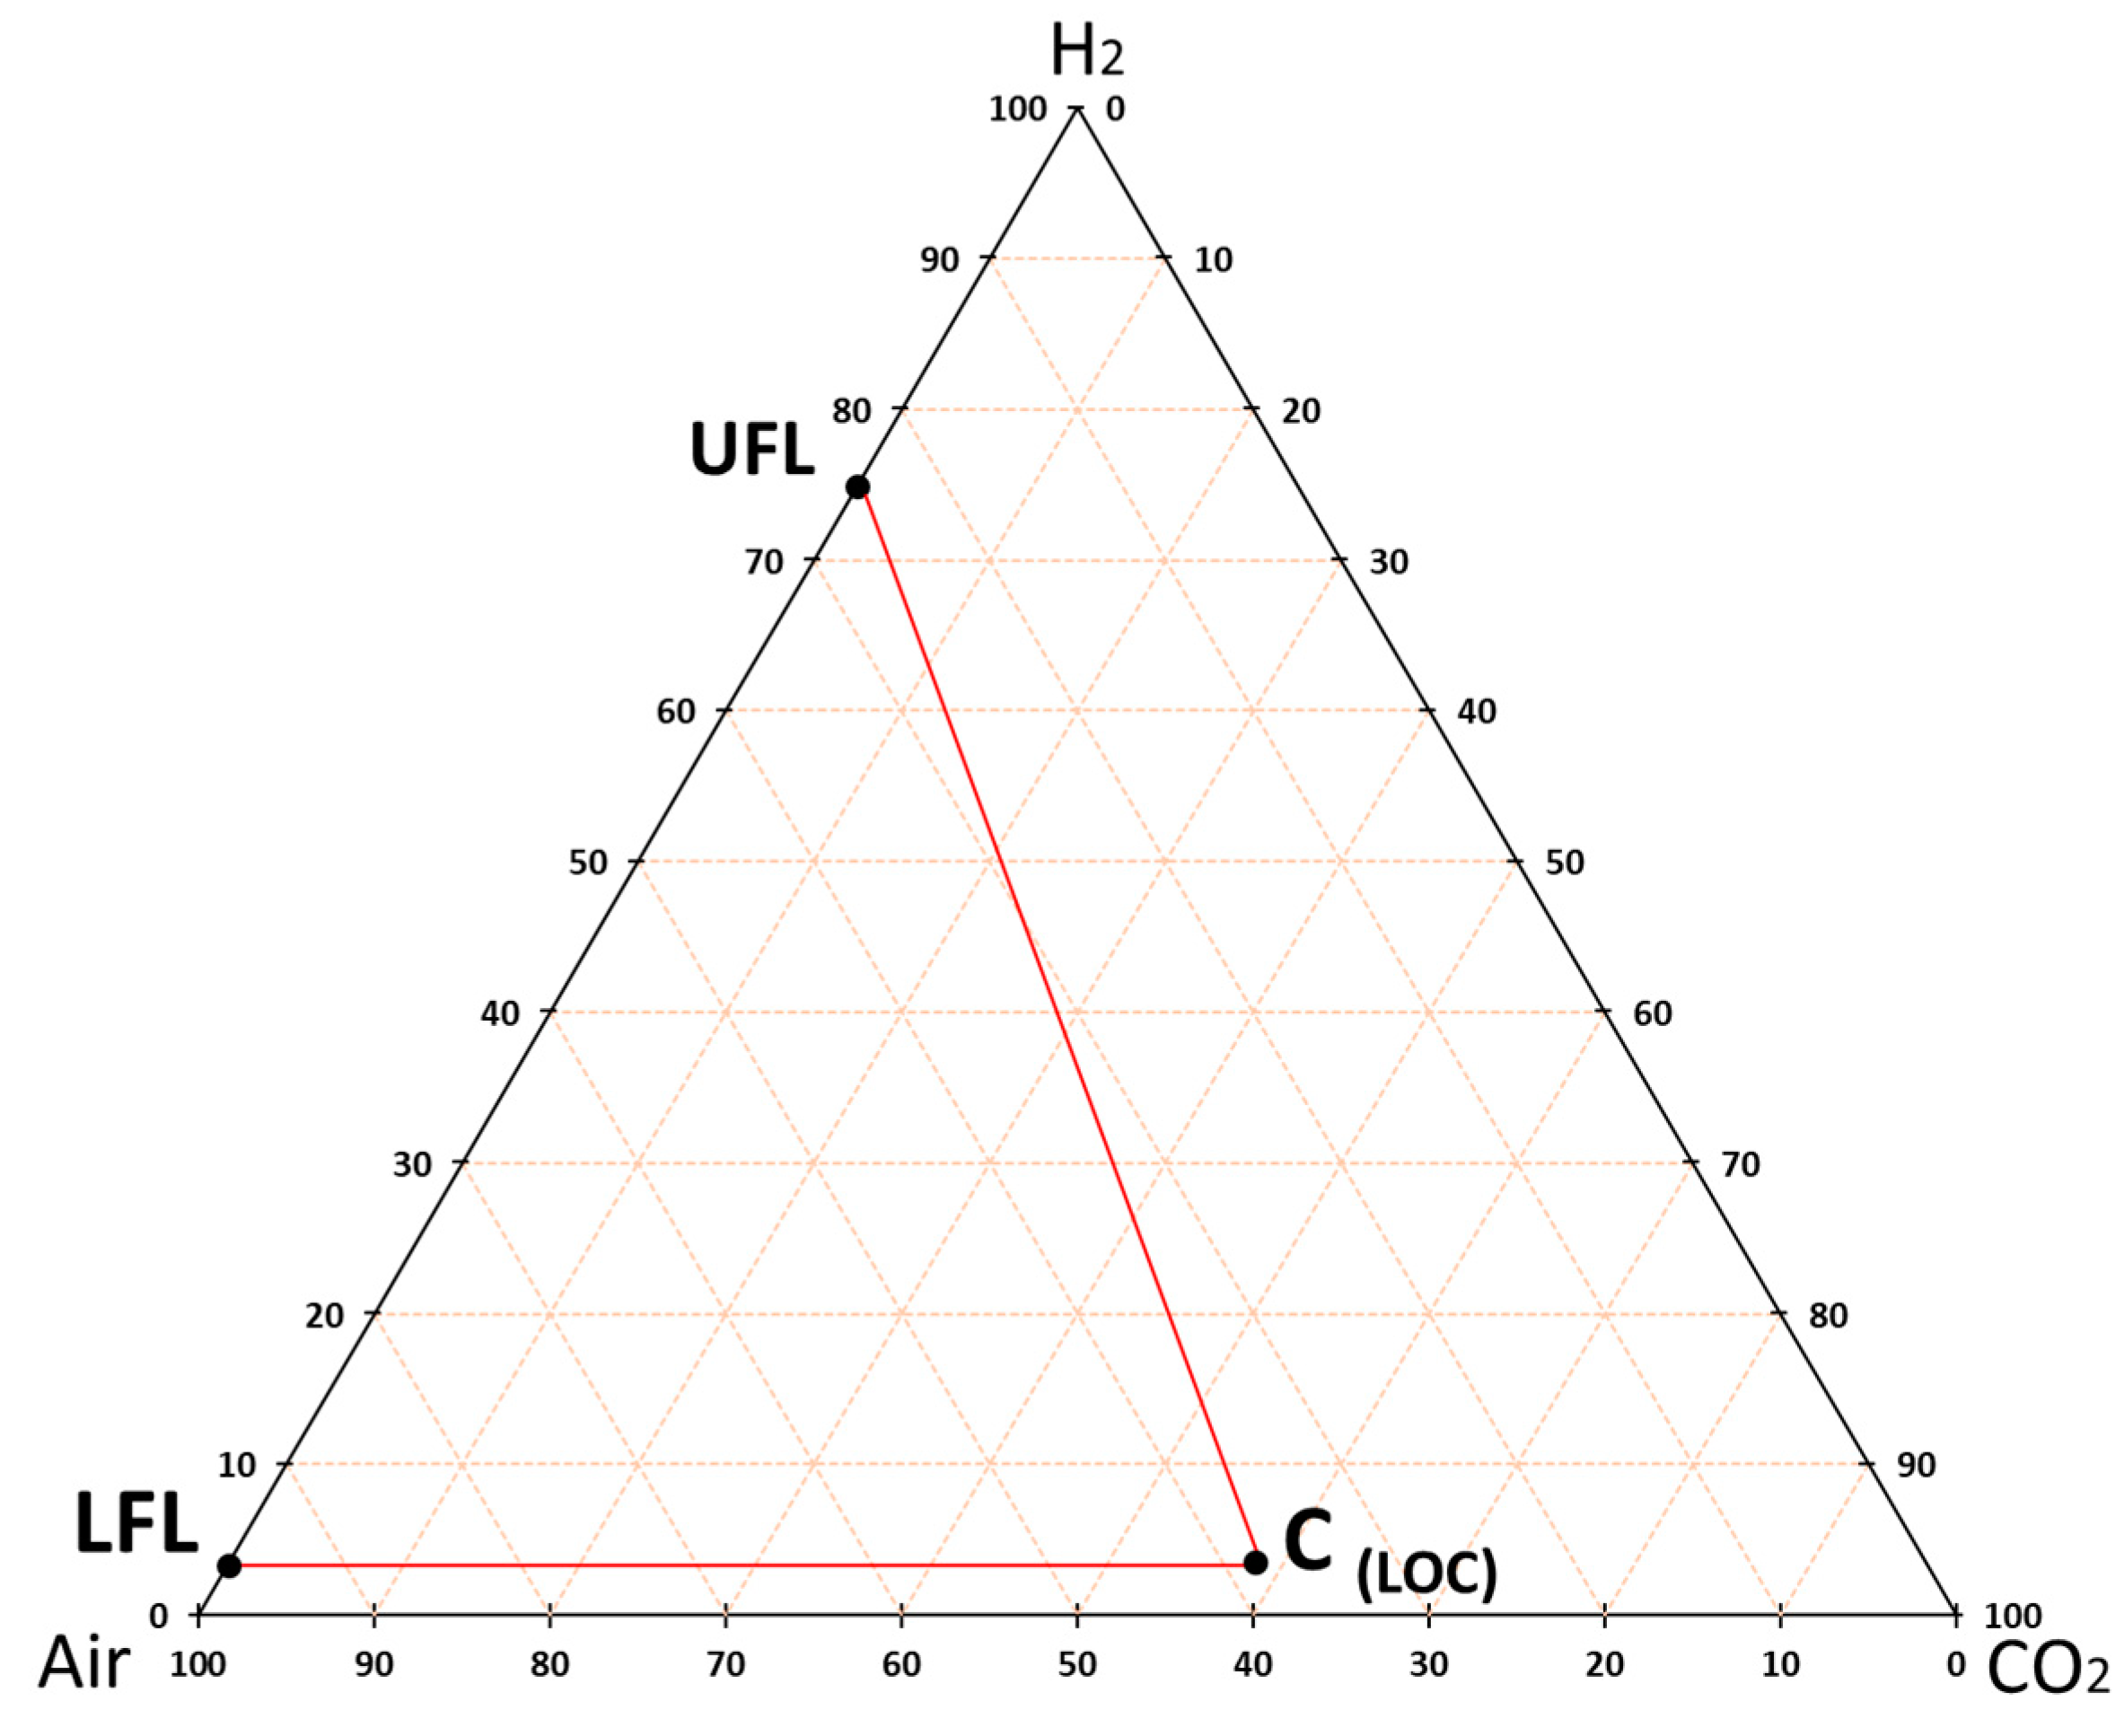
Figure 2 reveals that CLOCO2 is composed of 4% hydrogen, 8% oxygen, and 88% COConsidering that air is composed of approximately 21% oxygen and that the LFL of hydrogen in the air is also 4%, the LOC is composed of 4% hydrogen, 38.1% air, and 57.9% COThe authors of [44] proposed a minimum volume of 57% CO2 required to inertize the mixture, which is in good agreement with the theoretical percentage of CO2 calculated here. LOC differs largely, as the theoretical approximation gives an LOC of 8% while normally the oxygen concentration is between 4.6 and 5.2%. Figure 3 represents the flammability interval of hydrogen in air when it is diluted with CO2, in the simplest shape: a triangle. Nevertheless, the shape of the FI closes in the form of a parabola when it reaches the CLOC.
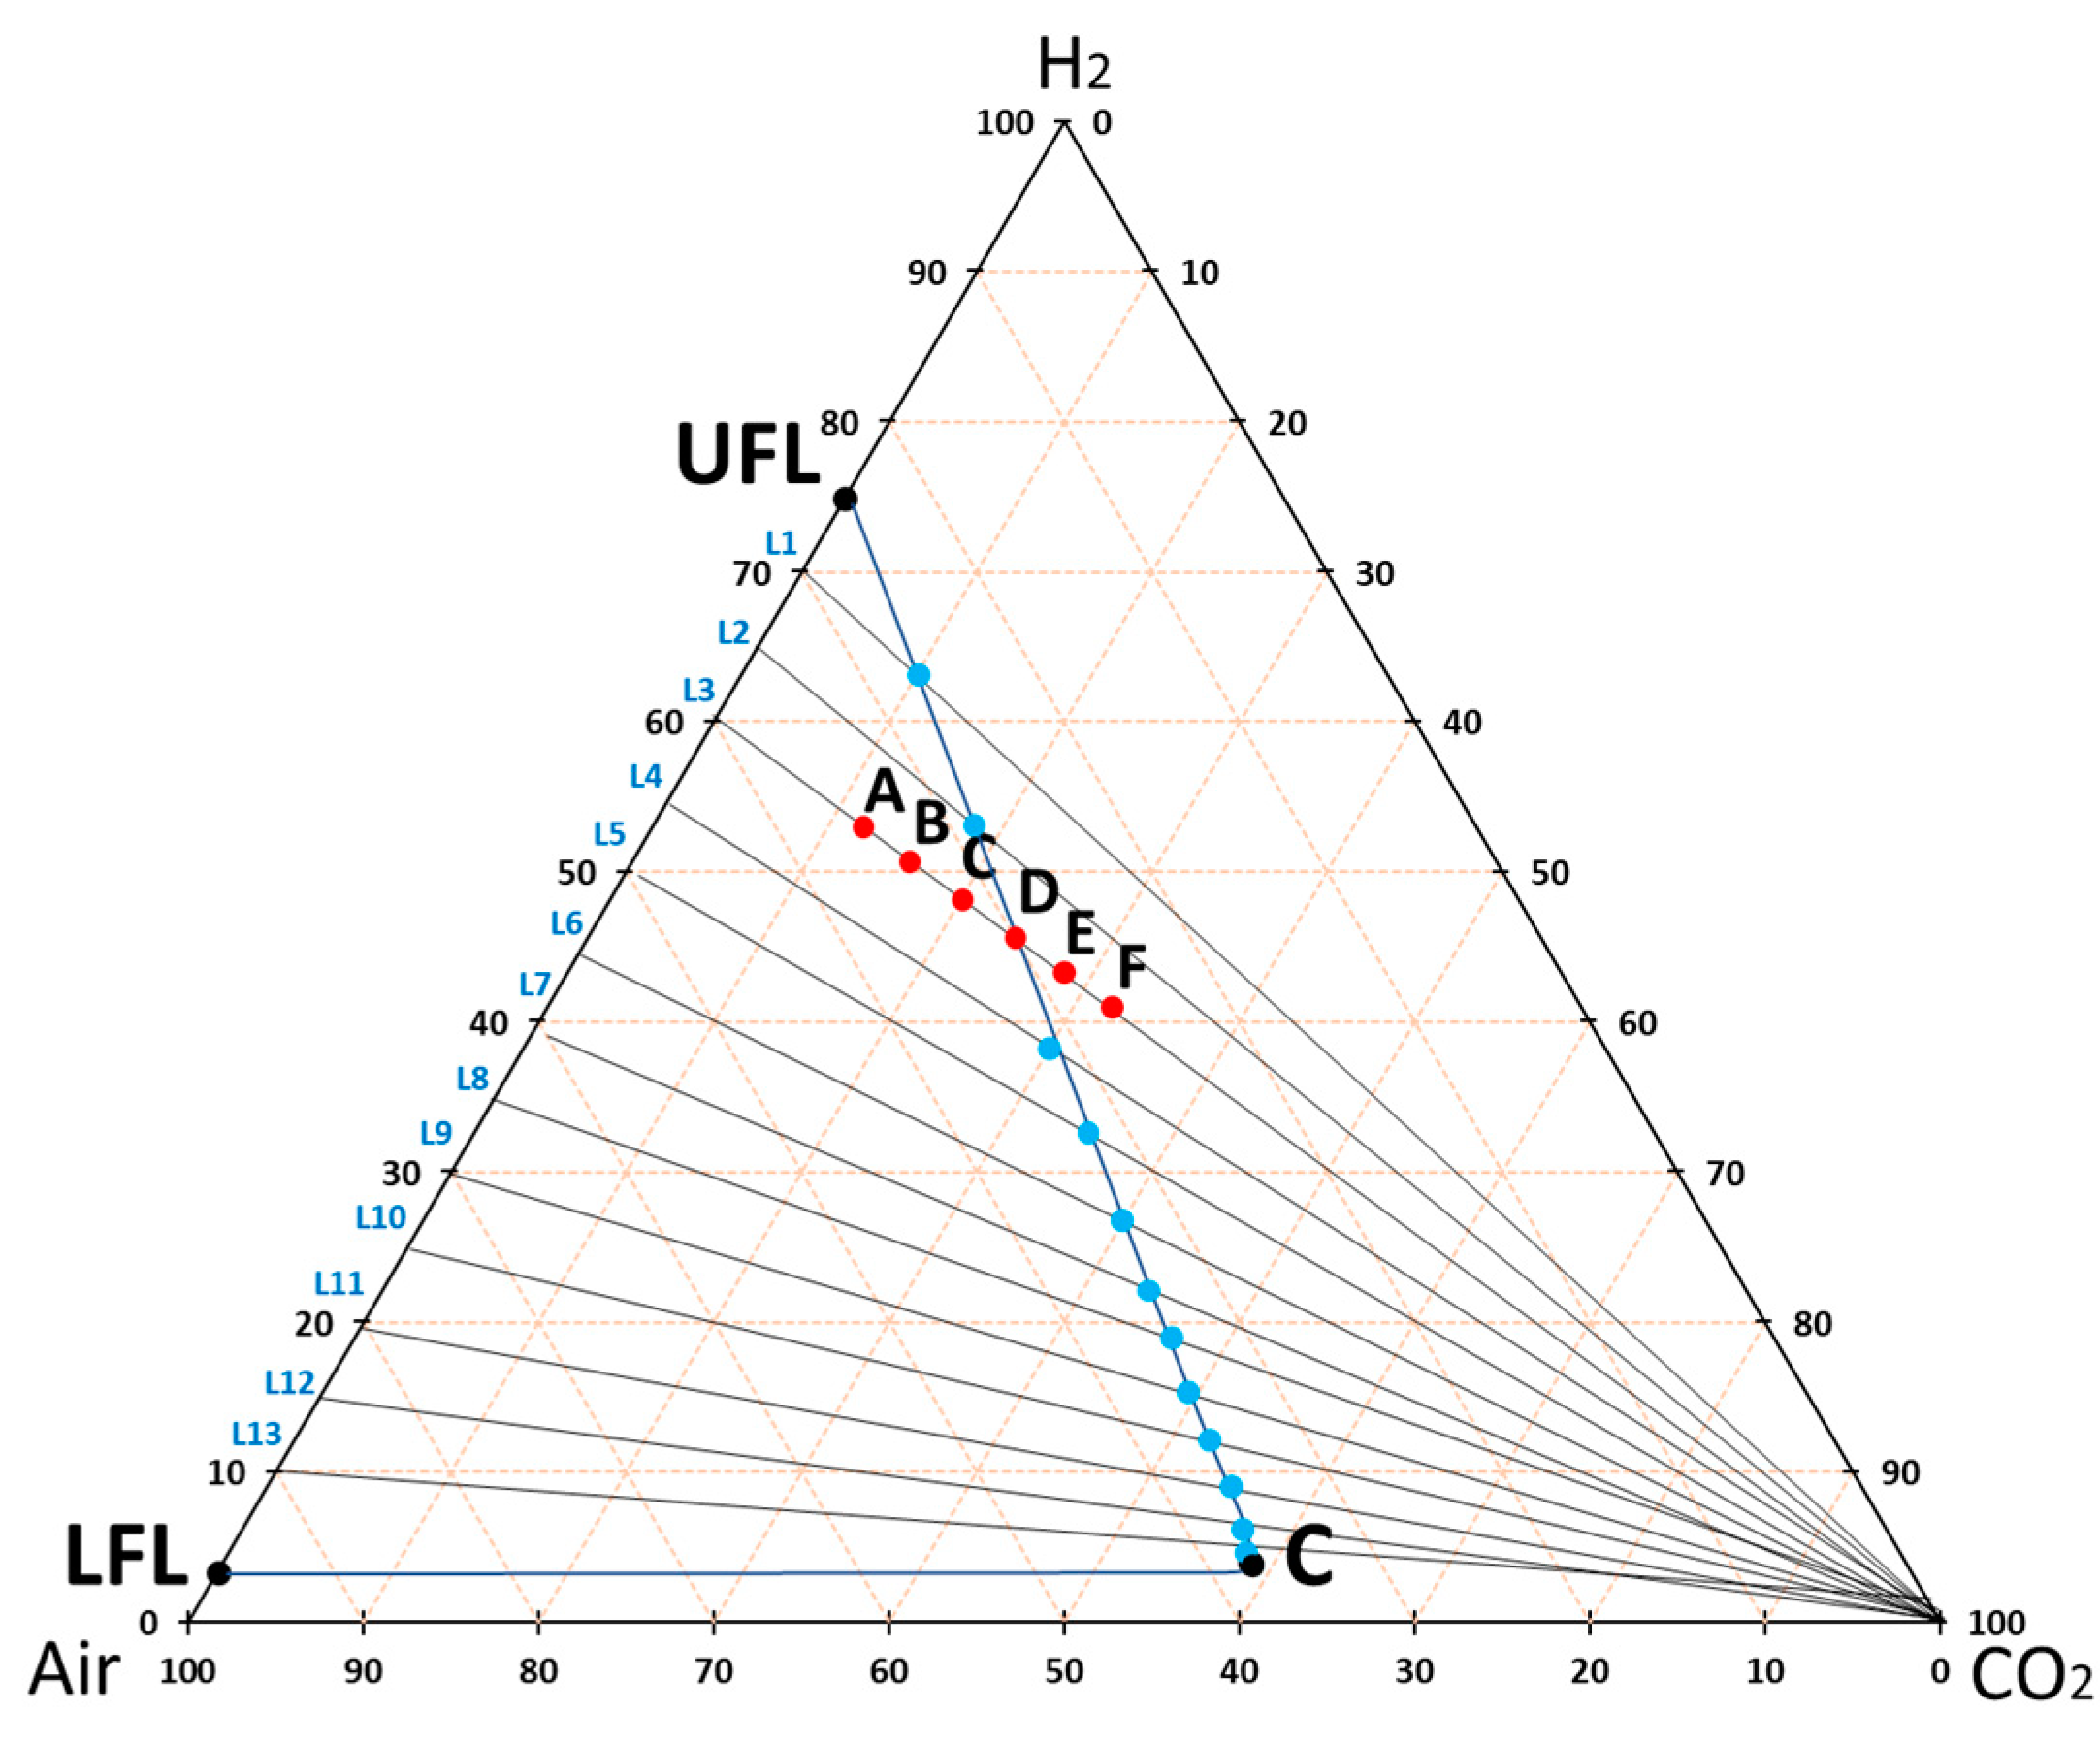
The experimental methodology to obtain the flammability interval is based on the theoretical FI, as shown in Figure Then, at least ten lines are represented, starting at the flammability limits and ending at the inert gas vertex. Each line crosses the theoretical flammability limit by one point (blue points in Figure 4). These points form the basis of the experimental methodology because this method intends to obtain the intersection between the experimental FI and each represented line (lines L1, L2, L3, … in Figure 4). To do that, it is necessary to represent over the lines at least three points after the intersection point (A, B, and C in Figure 4) and three before (D, E, and F in Figure 4). All these points were tested in the STA to determine the last flammable point and the first non-flammable point. The precision of this method depends on the number of lines represented and the distance between the points tested.

3. Results and Discussion

3.1. Experimental Results of the Flammability Limits

The theoretical flammability limits listed in Table 2 provide preliminary information regarding the expected results. Moreover, these data have also been included in the graphical comparison of existing data, since [45] established that both the flammable limits and limiting oxygen concentration of enriched natural gas can be reasonably calculated using the Le Chatelier formula.
Following the methodology described in Section 2.1, Table 3 presents the flammability limits obtained in the STA. The explosion behavior was analyzed through the translucent window of the STA chamber, and ignition was detected using pressure sensors. Empirically, the mixtures normally ignite between Rounds 1 and 5, particularly in mixtures near the flammability limits. In isolated cases, ignition occurs around the twentieth round. During these tests, it has been observed experimentally that if the mixture does not ignite in Round 40, it can be considered that the mixture does not ignite. This effect is related to the ignition energy because the fixed energy for the test is sufficiently high to ignite the mixture. In addition, the mixture homogeneity plays a key role in explosion risk probability even assuming a good blending. The addition of hydrogen has a direct influence on the explosion behavior, as it is possible to notice an increment in the explosion luminosity while the hydrogen concentration increases. The results are given with a standard deviation of 0.25%.

3.2. Experimental System Validation Results

Figure 5 compares the flammability limits of methane in air, specifically the LFL and UFL, obtained through the spark test apparatus (STA), against bibliographic data from sources such as Miao et al, Razus et al., and Van den Schoor et al. [38,43,46]. The arithmetic average of the values is represented in the middle of the graph, and the deviations are represented by the bars. The figure is divided into two parts: Figure 5a, which represents the deviation of the UFL values, and Figure 5b, which represents the deviation of the LFL values. The differences between the methods account for deviations between 0.01% and 1.25% for the UFL and between 0.05% and 0.5% for the LFL. This is a slight deviation depending on the method used; therefore, the impact on the results is low. The results demonstrate that the STA method produces values that closely align with existing data, with only slight deviations. Specifically, LFL values differ by just 0.1 points from the average, indicating excellent consistency between the experimental method employed and the values reported in the literature. This slight difference may be attributed to the specific parameters used in the STA, such as the test volume, ignition energy, and environmental conditions.
For the UFL, the deviation is slightly larger at 0.25 points. This is still within an acceptable range for validating the STA method, but it highlights the sensitivity of the UFL to experimental conditions, particularly the hydrogen content and ignition source. The variation in the UFL could also be influenced by the different geometries of the combustion chambers in other studies, which impact the turbulence and flame propagation during the test. Chamber size and shape are known to influence the fluid dynamics of the combustion process, leading to variations in results, as discussed by Green (2009) [15]. The method validation provided by these figures supports the robustness of STA in determining the flammability limits for methane–air mixtures. Although minor deviations exist, they are within acceptable ranges, confirming that STA is a reliable method for industrial and experimental applications, especially when safety coefficients are applied.
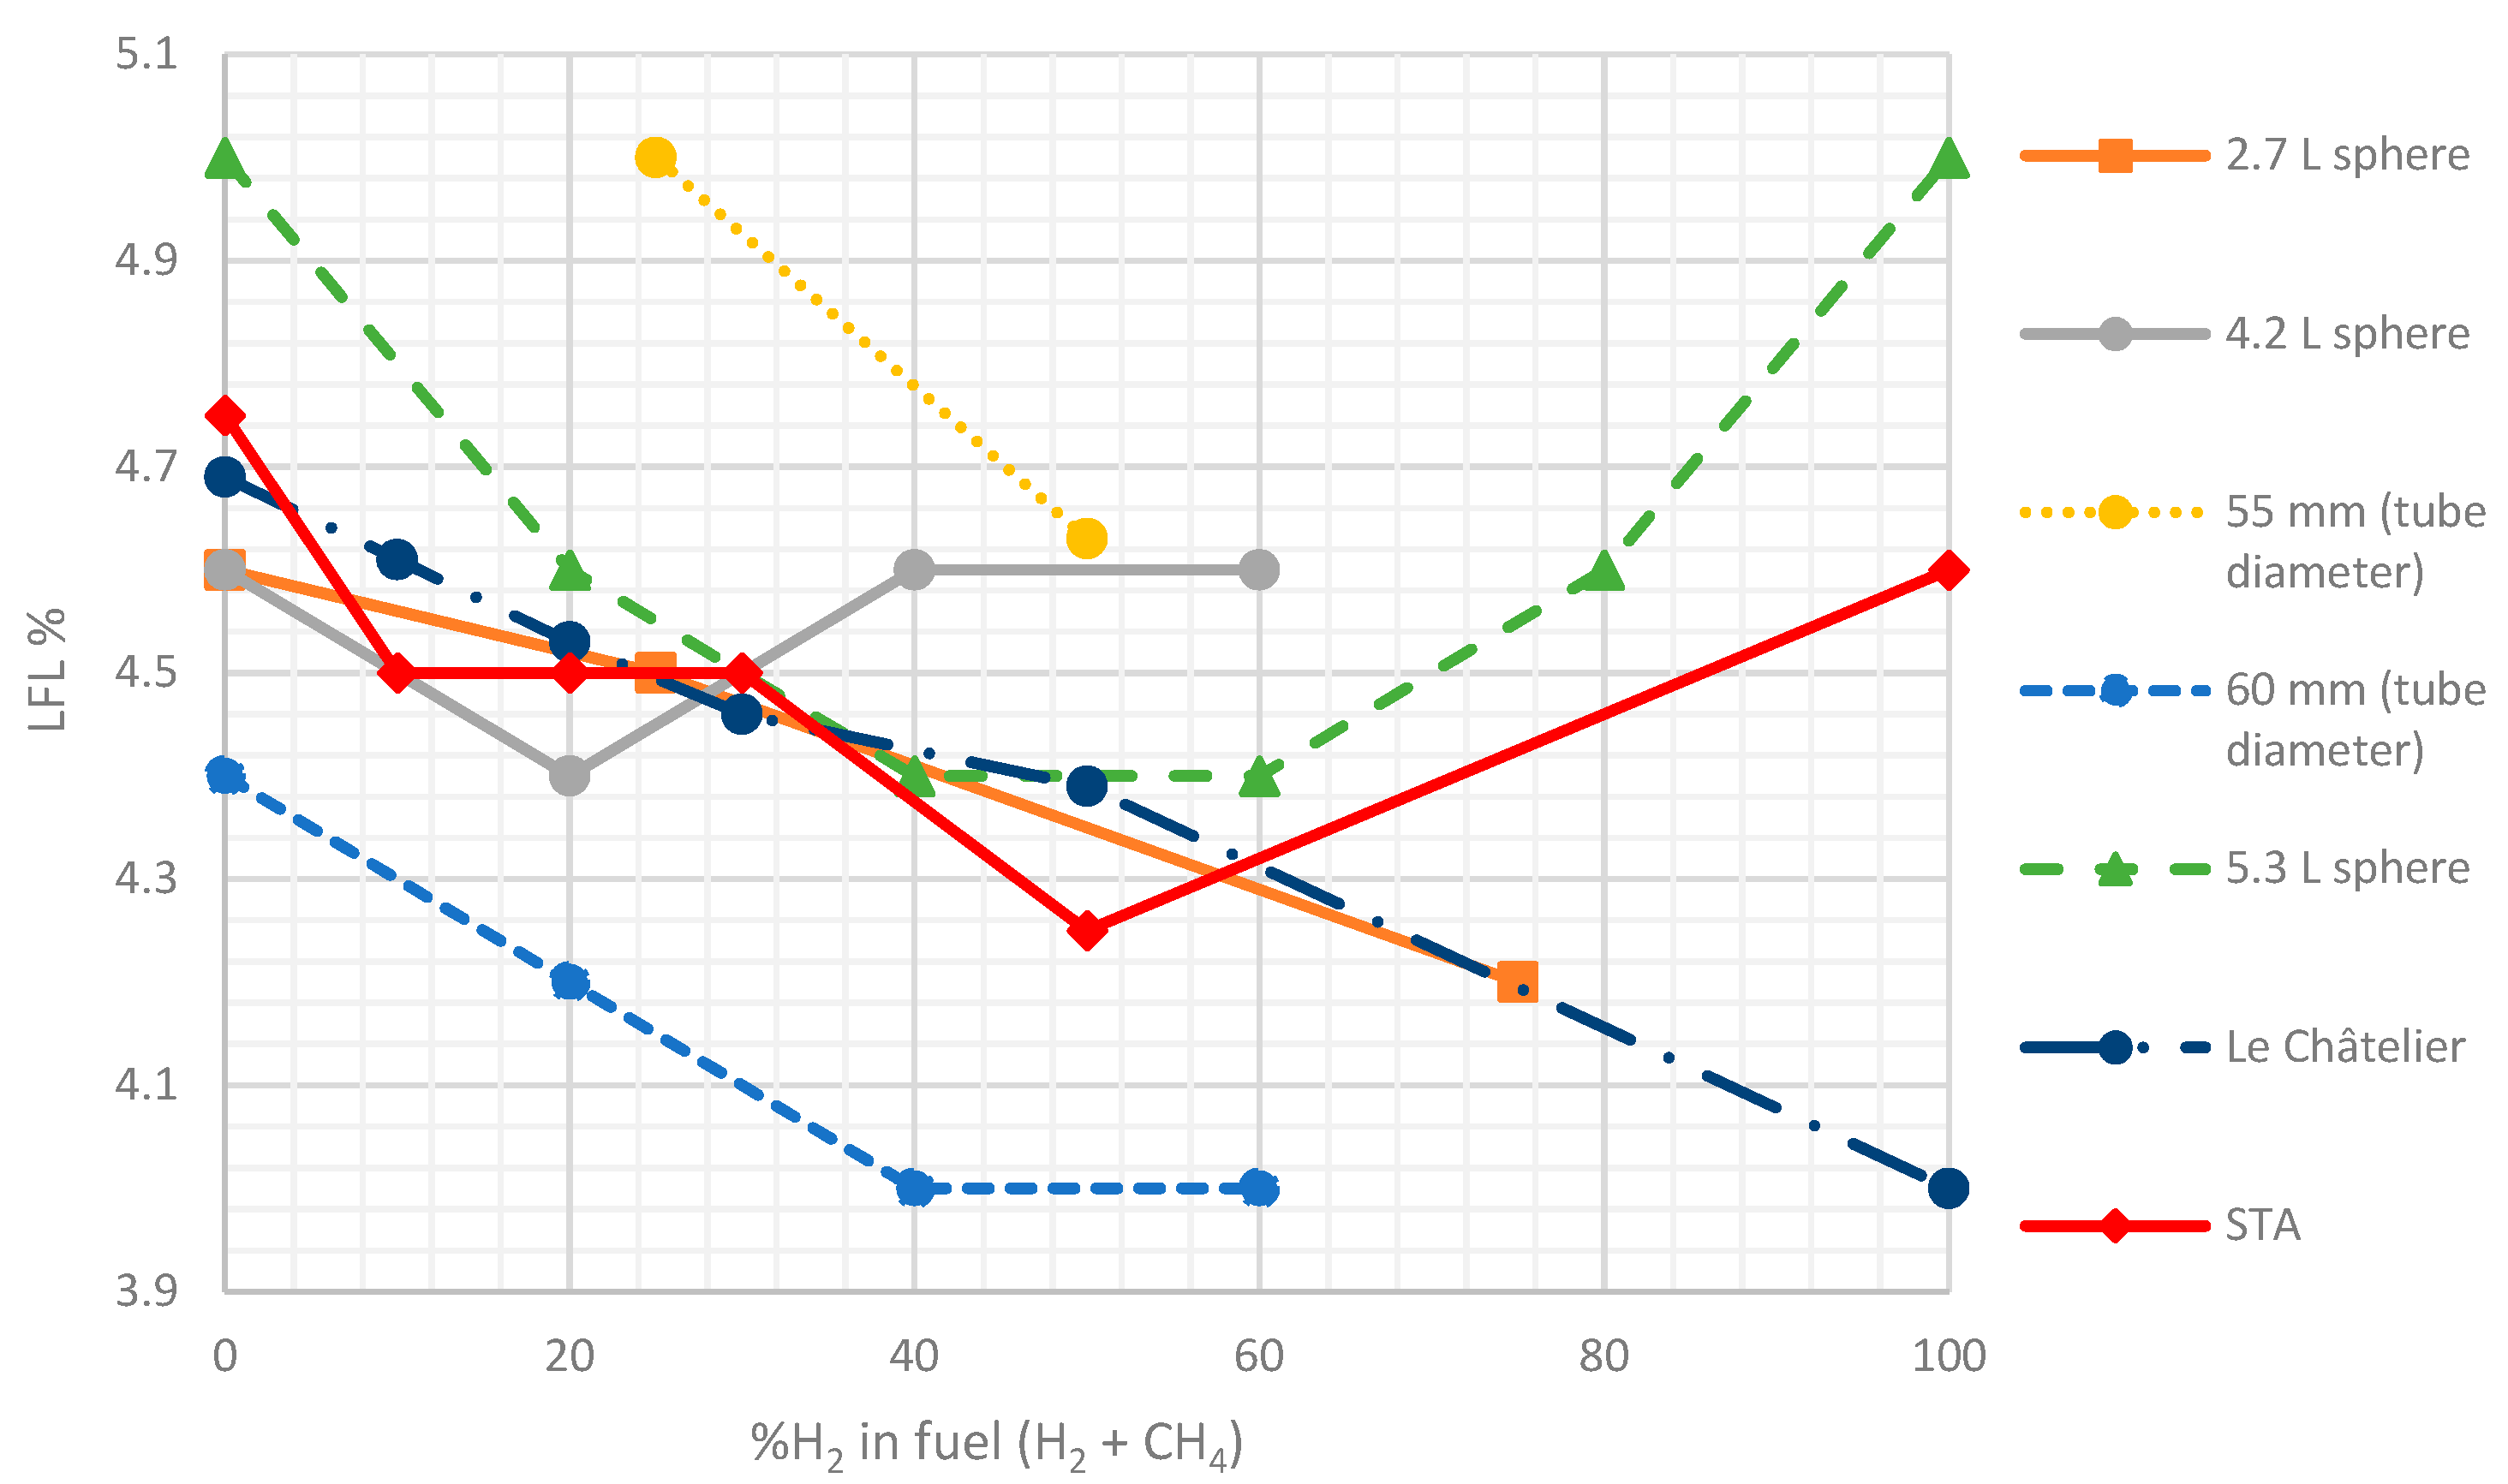
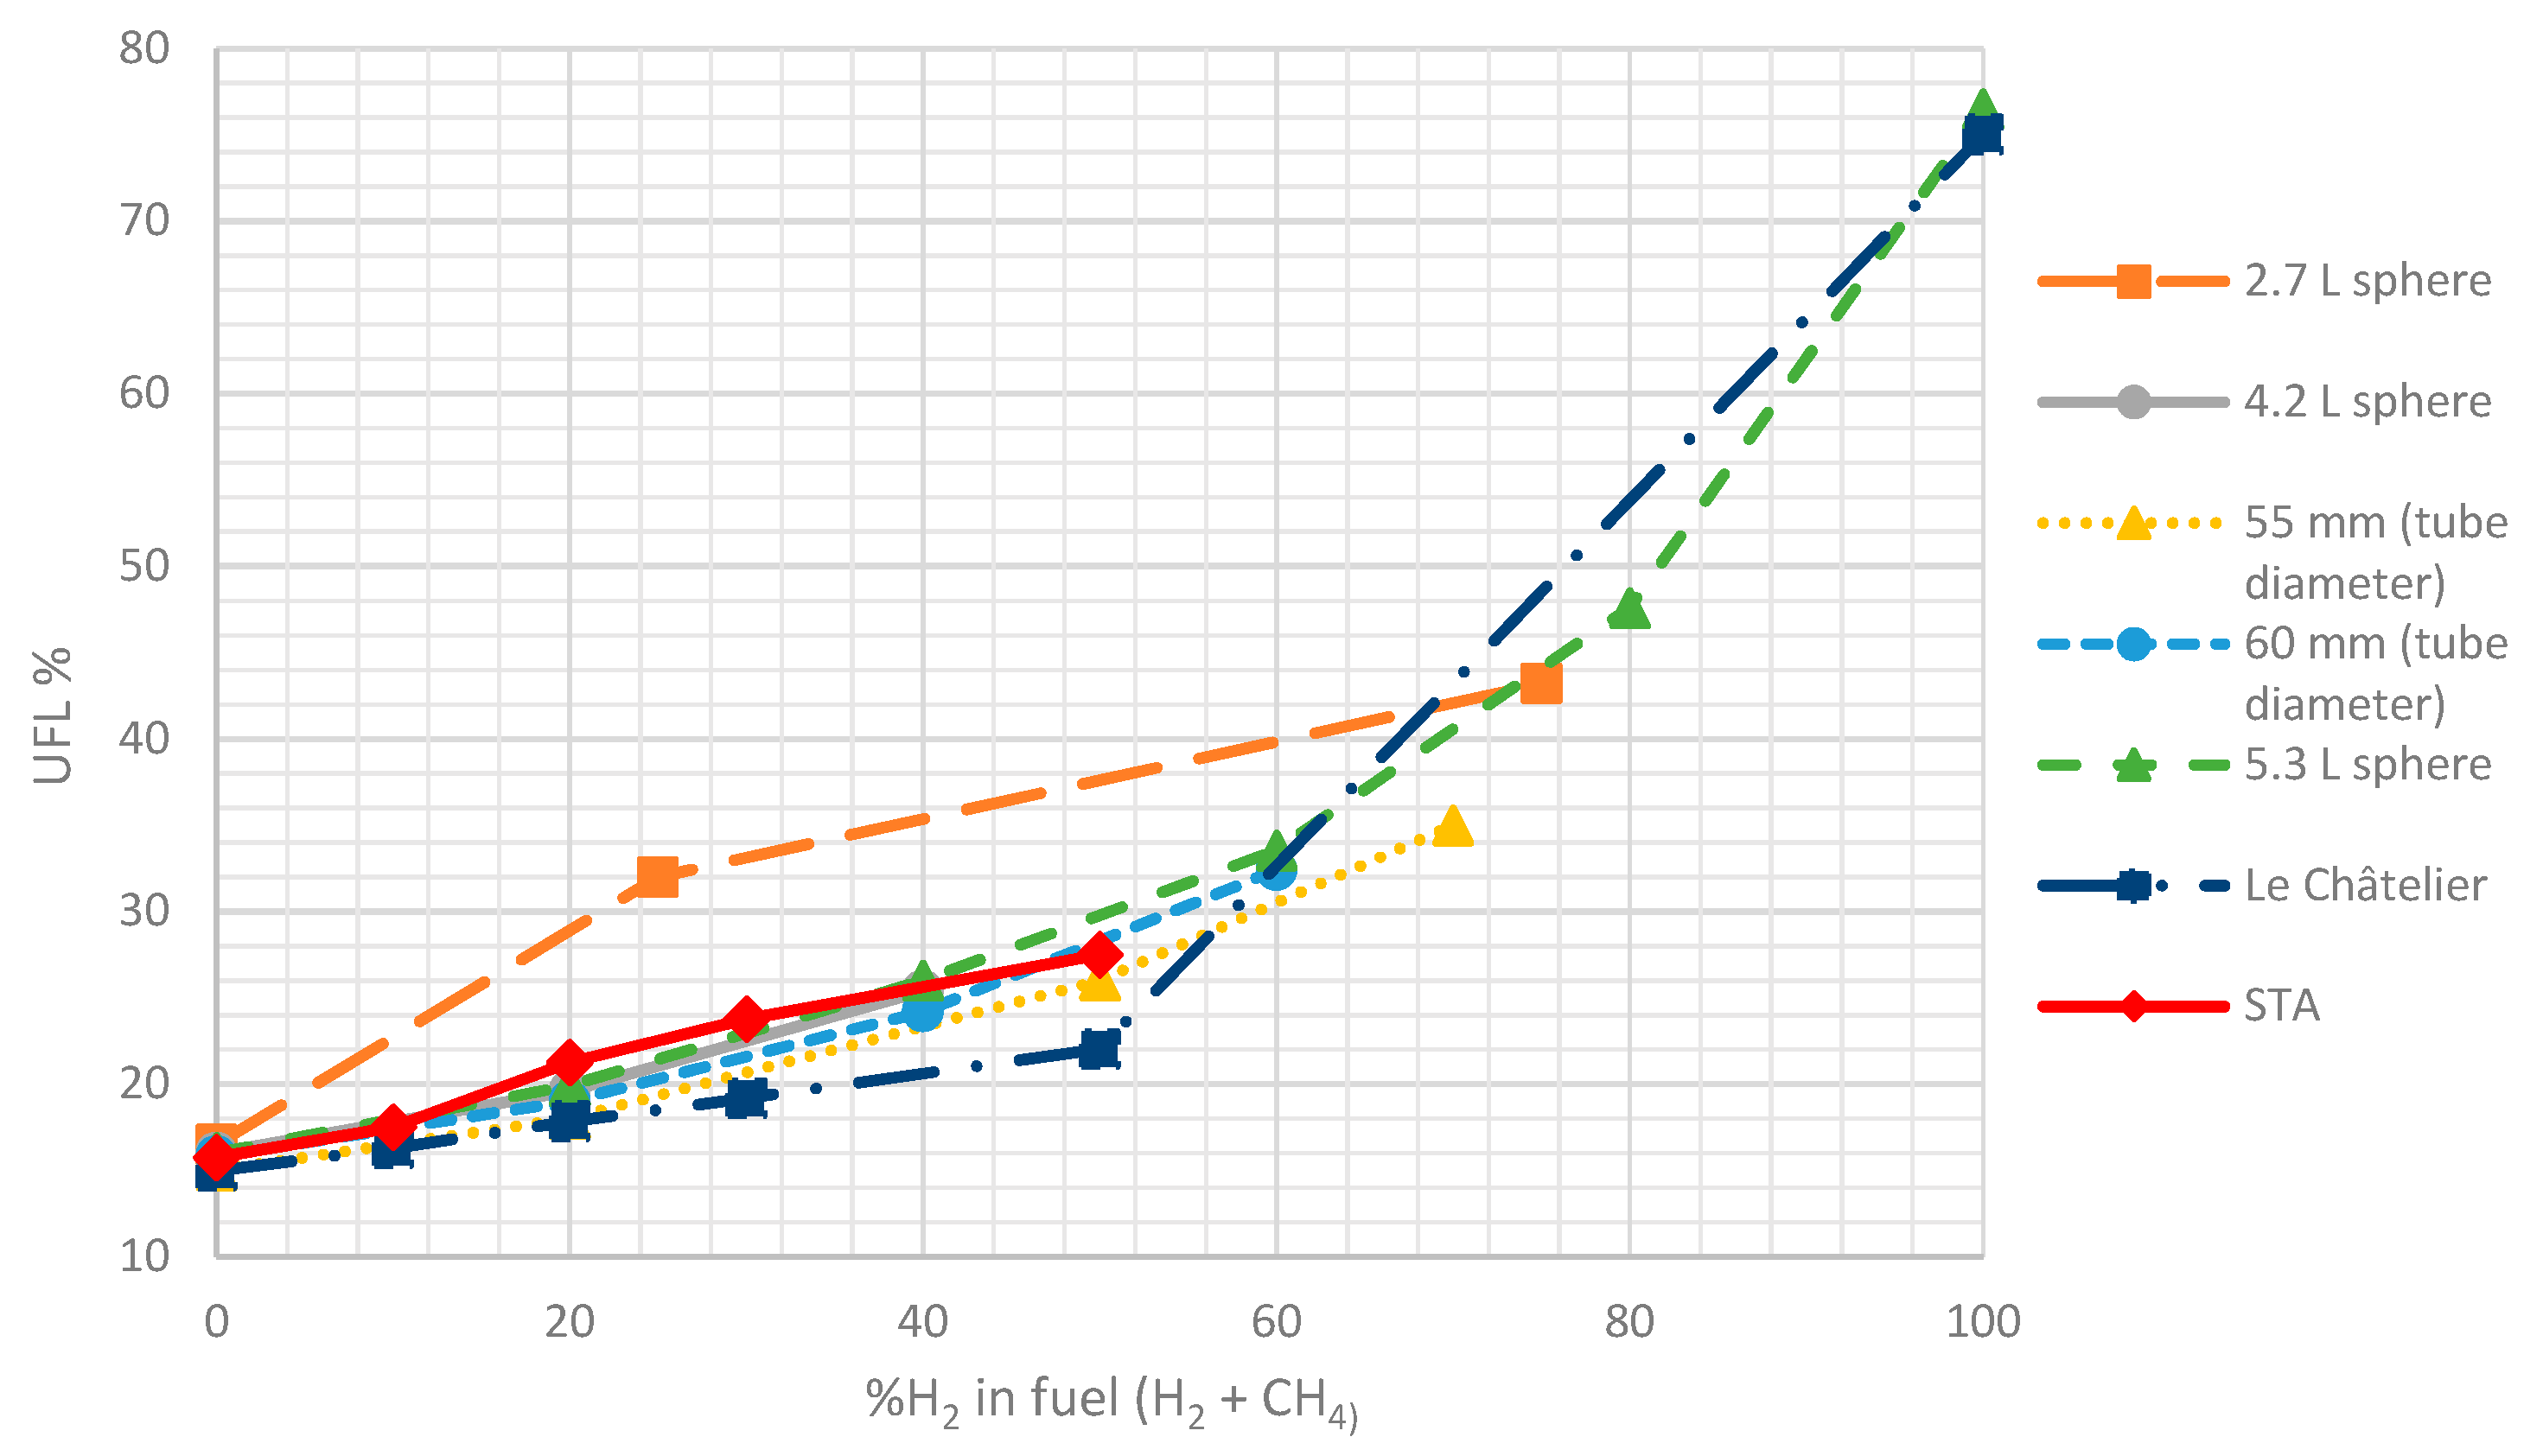
The methods shown in Figure 6 and Figure 7 consider different combustion chamber volumes, with the STA being the smallest. However, those methods also have similarities, as all of them ignite the mixtures by electric sparks, and the criteria to detect explosion is a pressure rise in the range of 2–10%, typically, fixing the pressure rise at 5% or 7%.
The method using the 2.7 L chamber shows an FL closer to the theoretical results. Most of the tests share the same results, specifically for hydrogen concentrations up to 50%. Moreover, both methods using tubes to test the FL are the most desalinated ones. Analyzing the STA method, with a volume of 250 cm3, the results are close enough to the theoretical values.
These variations with other geometries may be due to the resulting turbulence patterns. Zlochower and Green explain in their study that the chamber geometry can significantly influence fluid flow patterns and turbulence intensity, which affects flame propagation and flammability limits [15].
Both figures reveal a clear tendency that is similar in every experimental study. First, the addition of hydrogen has a low influence in the LFL, since all the values vary between 5% and 4% as expected. From an industrial point of view, this comparison is enough to fix the lower flammability limit of the hydrogen–methane mixture at 4.5 ± 0.5% for every concentration of hydrogen, always applying safety coefficients.
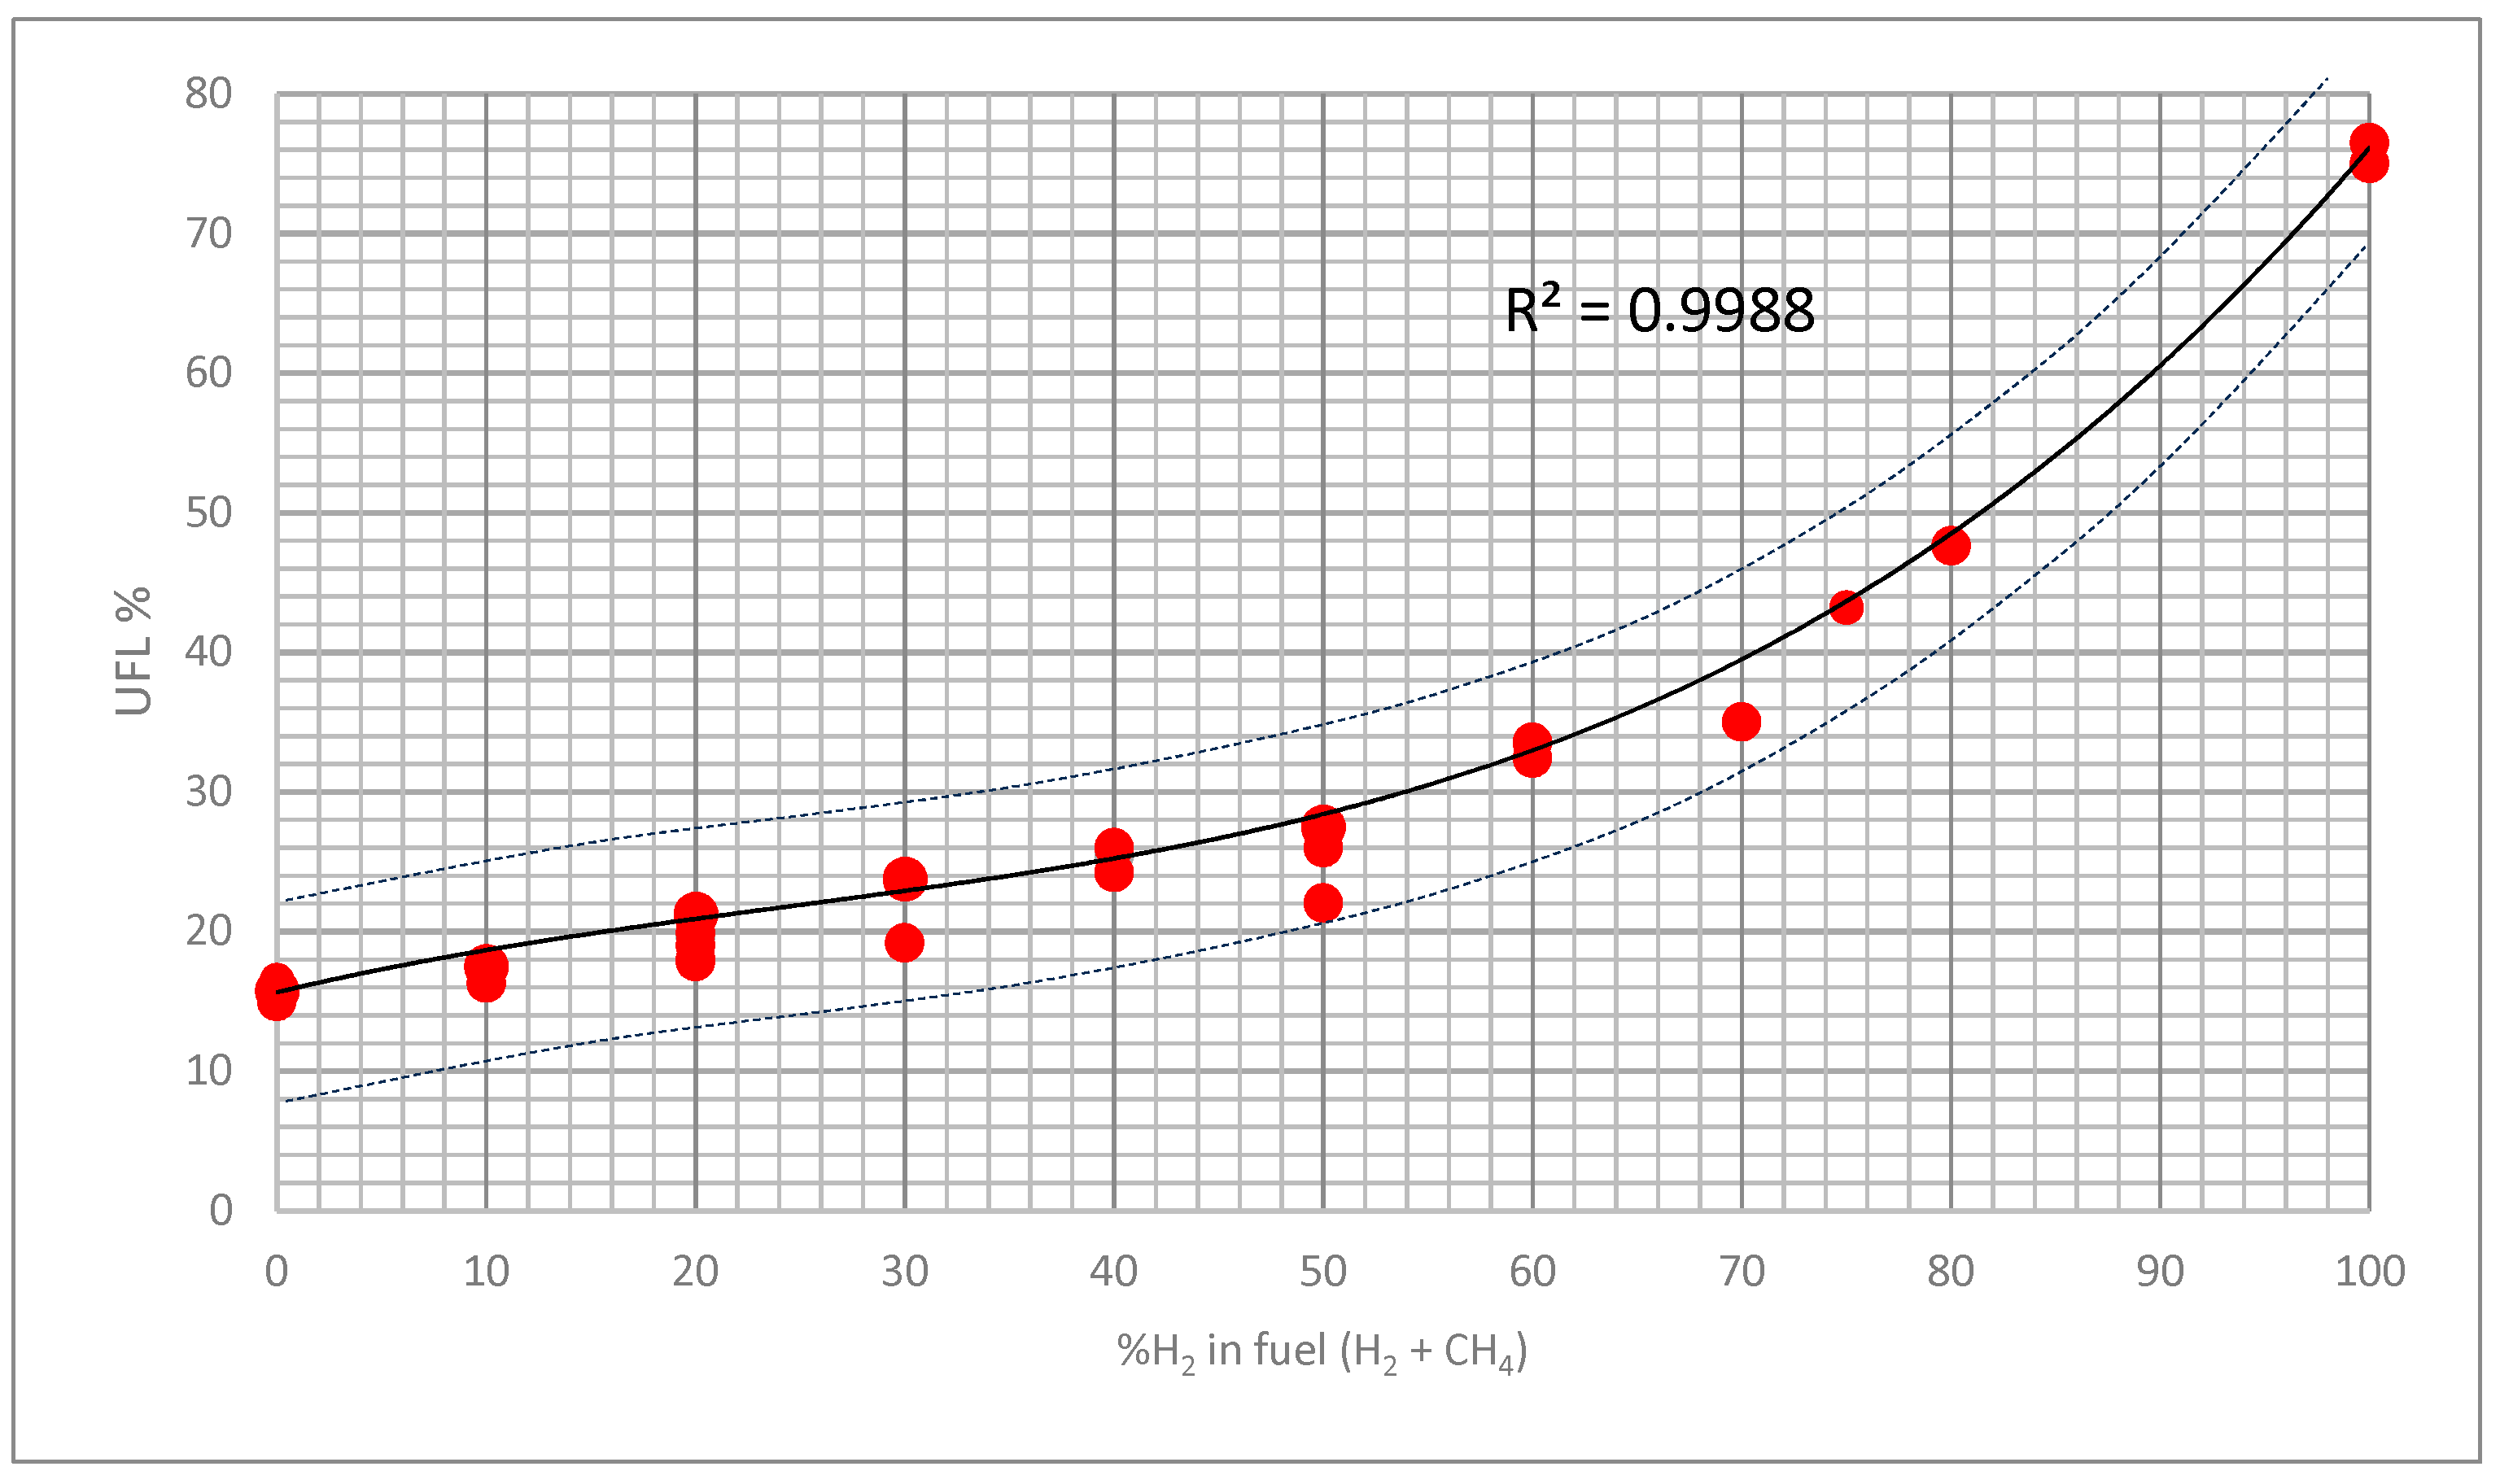
However, the addition of hydrogen clearly influences the UFL, as it increases as the hydrogen concentration in fuel mixture increases. This behavior is consistent across various experimental methods and aligns with theoretical predictions based on Le Chatelier’s mixing rule. Thanks to several data collected in this study, Figure 8 represents a cloud of points from which the tendency equation is obtained. The curve can be used to obtain the UFL for every concentration of hydrogen, considering that the results need a safety coefficient to be used under real conditions.
As mentioned before, from the experimental data, it is possible to define a trendline that allows the estimation of UFL from the hydrogen content, as Figure 8 explains. This trendline accurately fitted the experimental data, as the R2 is 0.The empirical equation that defines the influence of hydrogen addition is defined in Equation (3):
U F L = 9   ×   10 5   ·   H 2 % 3 i n   f u e l 0.0066 · H 2 % 2 i n   f u e l + 0.3589 ·   H 2 % i n   f u e l + 15.665
The empirical equation has good results between concentrations of 0 and 100%. However, as every empirical approach is flawed, two more curves are defined, the first one 10 points over (+10%) the trendline and the second one 10 points beneath (−10%) the trendline. By doing this, the trendline becomes an area whose error margin has remarkably diminished. All the points located outside of both lines can be considered as safety mixtures.

3.3. Theoretical Approximation of the FI

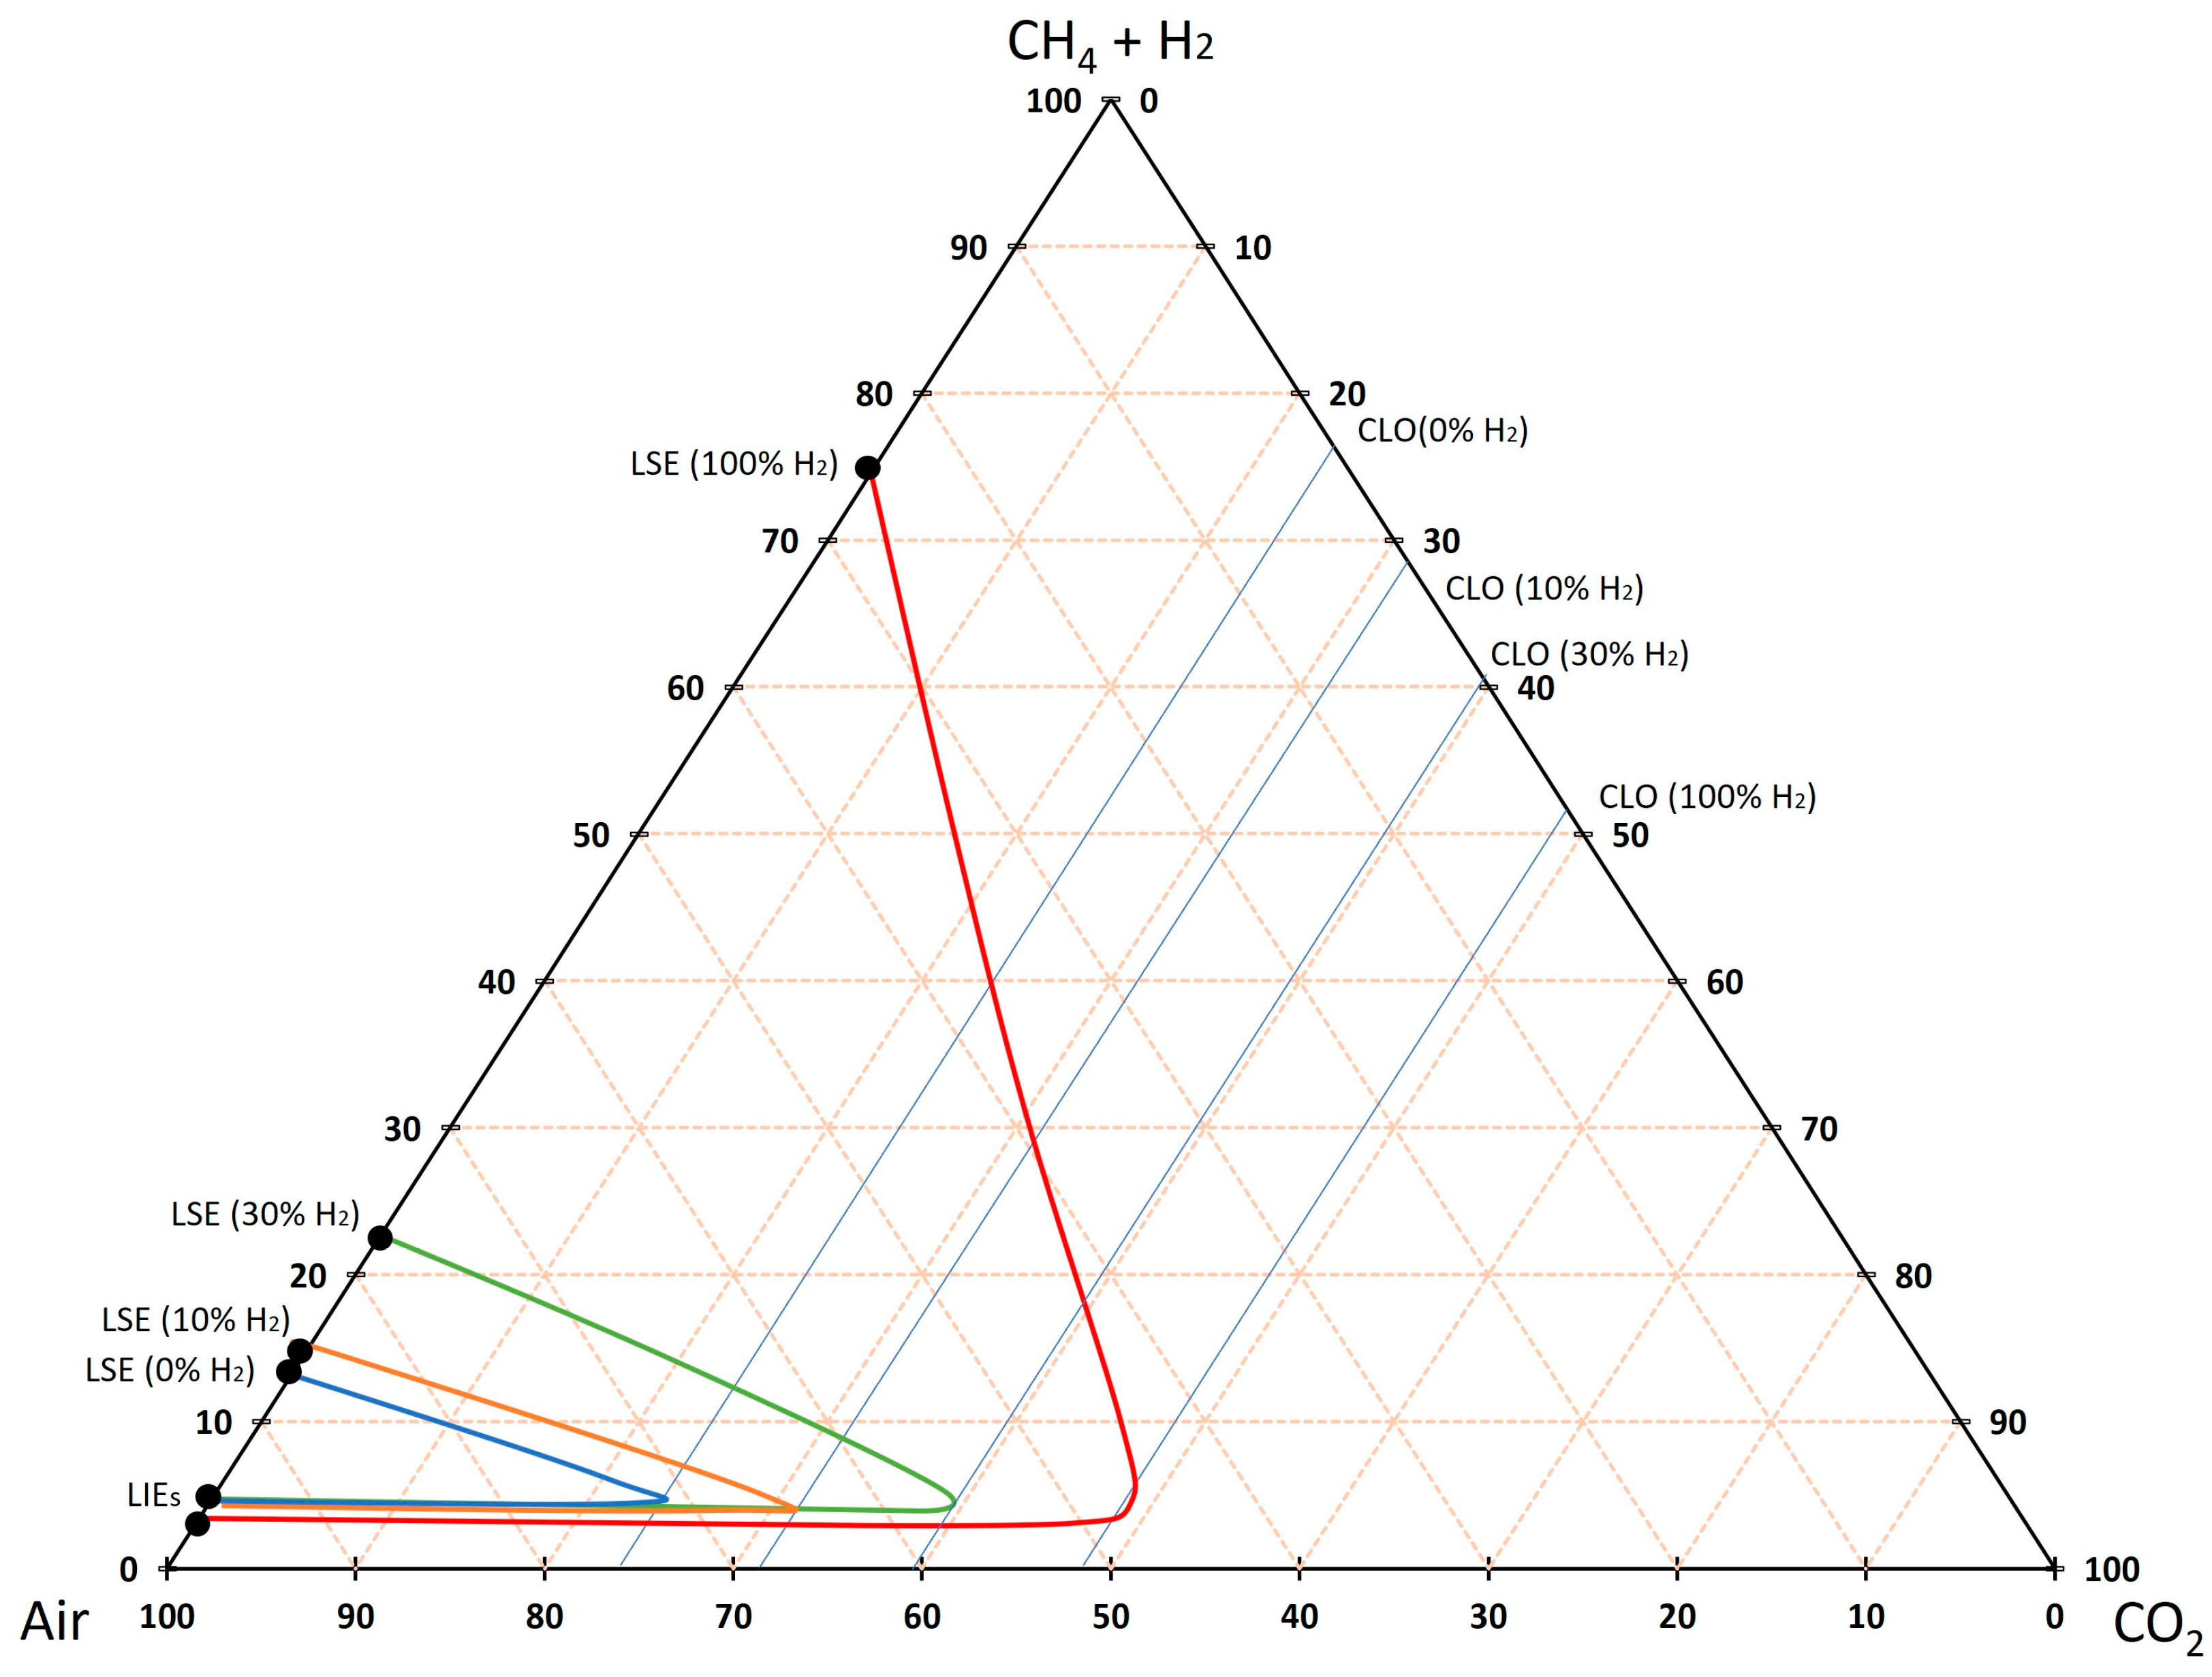
As mentioned previously, the influence of hydrogen addition on the flammability limits directly involves the influence on the flammability interval. Then, as the results of Table 3 show an increment in the flammability limit when hydrogen is added, the flammability intervals also increase. The authors of [47] obtained the flammability interval according to the standard EN 14756 [42], which is currently overturned by the standard EN 1839 [33]. This method is focused on LOC calculation; however, the STA allows the obtainment of all the points belonging to the flammability interval, so safety measures can be assured.
Figure 9 shows the theoretical flammability intervals calculated in this study. The influence of hydrogen addition appears clear, so it is essential to evaluate it further. The inert gas concentration needed to avoid the explosion seems lower in theoretical calculations than in experimental calculations [47]. Experimental calculations according to European standards locate the minimum concentration of CO2 at 34% for a concentration of hydrogen of 10%, while the theoretical results shown in Figure 9 locate it at 31%. The difference was even greater with the LOC of pure hydrogen and pure methane. The use of theoretical approximations can provide a preliminary idea for the control of explosive atmospheres. Naturally, the application of safety coefficients is always needed, because the comparison in Figure 9 shows that the theoretical flammability intervals are less conservative regarding the safety uses of the mixtures. Experimental procedures are essential to adjust safety measures.

4. Conclusions

This study introduces a novel experimental methodology using the spark test apparatus (STA) to determine the flammability limits (lower flammability limit, LFL, and upper flammability limit, UFL) and limiting oxygen concentration (LOC) of methane–hydrogen–air mixtures. The innovative approach presented allows for the precise evaluation of the flammability characteristics of these gas mixtures under controlled conditions, offering significant advantages over traditional methods when discussing the determination of the flammable region. The incorporation of hydrogen into methane substantially alters its combustion dynamics, making a comprehensive understanding of its effects critical for both industrial safety and scientific research.
The results demonstrate that small additions of hydrogen (10%–50%) to methane significantly influence the UFL, with a marked increase as the hydrogen concentration increases. This shift in the UFL has direct implications for industrial applications, where safety margins must be carefully managed. Conversely, the LFL showed minimal variation, maintaining a consistent threshold of approximately 4.5% across all tested hydrogen concentrations. These findings provide a reliable basis for establishing safety parameters in industries handling methane–hydrogen mixtures.
In addition, this study highlights the role of CO2 as an inert agent. The use of carbon dioxide to reduce the flammability of methane–hydrogen mixtures was explored, revealing that higher hydrogen concentrations demand greater CO2 proportions to effectively prevent combustion. This aspect is particularly relevant in processes such as biogas production, where CO2 is readily available and can be leveraged for safety purposes.
The STA method proved to be highly effective in determining flammability intervals and LOC, as validated by comparison with bibliographic data. Although minor deviations were observed between the experimental results and theoretical predictions, the accuracy of the STA method, particularly in capturing the UFL trends, supports its use as a reliable tool for flammability testing. The representation of flammability intervals through ternary diagrams further enriches our understanding of these complex gas mixtures, offering a practical means of assessing safety conditions.
The key contribution of this research lies in its potential application to energy transition. As the demand for hydrogen as a cleaner fuel increases, understanding its integration into conventional fuel systems such as natural gas becomes essential. This study provides a technical foundation for future work aimed at optimizing the safe use of hydrogen-enriched fuels and ensuring both a higher efficiency and stringent safety standards.
Overall, the findings from this research serve as a crucial step towards the development of safer hydrogen–methane fuel systems, enabling a smoother transition towards hydrogen-based energy while mitigating the associated risks of explosion and fire hazards.

Author Contributions

Conceptualization, I.A. and B.C.; methodology, I.A., D.L. and R.P.; validation, D.B., B.C., D.L. and R.P.; formal analysis, I.A.; investigation, I.A. and D.P.; resources, D.B; data curation, I.A.; writing—original draft preparation, I.A. and D.P.; writing—review and editing, I.A., B.C., D.L. and R.P. All authors have read and agreed to the published version of the manuscript.

Funding

This research received no external funding.

Institutional Review Board Statement

Not applicable.

Informed Consent Statement

Not applicable.

Data Availability Statement

Data is contained within the article: The original contributions presented in the study are included in the article, further inquiries can be directed to the corresponding author/s.

Conflicts of Interest

The authors declare no conflicts of interest.

References

  1. Prajapati, L.K.; Tirkey, J.V.; Jena, P.; Giri, A. Parametric performance evaluation of SI engine using producer gas-biogas-hydrogen blend as a fuel: A thermodynamic modeling and optimization approach. Int. J. Hydrogen Energy 2024, 72, 268–287. [Google Scholar] [CrossRef]
  2. Arabzadeh, V.; Frank, R. Creating a renewable energy-powered energy system: Extreme scenarios and novel solutions for large-scale renewable power integration. Appl. Energy 2024, 374, 124088. [Google Scholar] [CrossRef]
  3. Xie, L.; Yuan, F.; Long, R.; Liu, Z.; Liu, W. Accelerating flammable gas cloud dissipation in hydrogen leakage during refilling hydrogen-powered vehicles via employing canopy fans. Int. J. Hydrogen Energy 2024. [Google Scholar] [CrossRef]
  4. Wang, X.; Zou, X.; Gao, W. Flammable gas leakage risk assessment for methanol to hydrogen refueling stations and liquid hydrogen refueling stations. Int. J. Hydrogen Energy 2024, 54, 1286–1294. [Google Scholar] [CrossRef]
  5. Sebai, S.; Tran, K.H.; Guibert, P. Experimental investigation of hydrogen-enriched biogas deflagration characteristics within a constant volume cylindrical vessel. Int. J. Hydrogen Energy 2024, 82, 1389–1401. [Google Scholar] [CrossRef]
  6. Wei, Z.; Liu, H.; Chen, Z.; Liu, Z.; Zhen, H. Quenching distance, wall heat flux and CO/NO thermochemical states in the wall vicinity of laminar premixed biogas-hydrogen impinging flame. Fuel 2022, 307, 121849. [Google Scholar] [CrossRef]
  7. Ryckebosch, E.; Drouillon, M.; Vervaeren, H. Techniques for transformation of biogas to biomethane. Biomass Bioenergy 2011, 35, 1633–1645. [Google Scholar] [CrossRef]
  8. Gieras, M.; Klemens, R.; Rarata, G.; Wolański, P. Determination of explosion parameters of methane-air mixtures in the chamber of 40 dm3at normal and elevated temperature. J. Loss Prev. Process Ind. 2006, 19, 263–270. [Google Scholar] [CrossRef]
  9. Tian, H.; Wu, M.; Shu, G.; Liu, Y.; Wang, X. Experimental and theoretical study of flammability limits of hydrocarbon–CO2 mixture. Int. J. Hydrogen Energy 2017, 42, 29597–29605. [Google Scholar] [CrossRef]
  10. Wang, W.Q.; Sun, Z.Y. Experimental studies on explosive limits and minimum ignition energy of syngas: A comparative review. Int. J. Hydrogen Energy 2019, 4, 5640–5649. [Google Scholar] [CrossRef]
  11. Wang, J.; Wu, Y.; Zheng, L.; Yu, M.; Pan, R.; Shan, W. Study on the propagation characteristics of hydrogen/methane/air premixed flames in variable cross-section ducts. Process Saf. Environ. Prot. 2020, 135, 135–143. [Google Scholar] [CrossRef]
  12. Rajpara, P.; Shah, R.; Banerjee, J. Effect of hydrogen addition on combustion and emission characteristics of methane fuelled upward swirl can combustor. Int. J. Hydrogen Energy 2018, 43, 17505–17519. [Google Scholar] [CrossRef]
  13. Shirvill, L.C.; Roberts, T.A.; Royle, M.; Willoughby, D.B.; Sathiah, P. Experimental study of hydrogen explosion in repeated pipe congestion—Part 2: Effects of increase in hydrogen concentration in hydrogen-methane-air mixture. Int. J. Hydrogen Energy 2019, 44, 3264–3276. [Google Scholar] [CrossRef]
  14. Zhai, R.; Yang, Z.; Zhang, Y.; Lv, Z.; Feng, B. Effect of temperature and humidity on the flammability limits of hydrocarbons. Fuel 2020, 270, 117442. [Google Scholar] [CrossRef]
  15. Zlochower, I.A.; Green, G.M. The limiting oxygen concentration and flammability limits of gases and gas mixtures. J. Loss Prev. Process Ind. 2009, 22, 499–505. [Google Scholar] [CrossRef]
  16. Hussein, T.; Maxa, D. Flammability of complex hydrocarbon mixtures in air and nitrogen diluted atmosphere at ambient conditions and at elevated pressures. Fuel 2024, 357, 129555. [Google Scholar] [CrossRef]
  17. Wu, S.Y.; Lin, N.K.; Shu, C.M. Effects of Flammability Characteristics of Methane with Three Inert Gases. Process Saf. Prog. 2021, 25, 326–330. [Google Scholar] [CrossRef]
  18. García Torrent, J. Seguridad Industrial en Atmósferas Explosivas, 1st ed.; AUTOR-EDITOR-9788460774815; Laboratorio Oficial José María Madariaga: Madrid, Spain, 2003; ISBN 84-407-7481-3. [Google Scholar]
  19. Mitu, M.; Prodan, M.; Giurcan, V.; Razus, D.; Oancea, D. Influence of inert gas addition on propagation indices of methane-air deflagrations. Process Saf. Environ. Prot. 2016, 102, 513–522. [Google Scholar] [CrossRef]
  20. Mitu, M.; Giurcan, V.; Razus, D.; Oancea, D. Inert gas influence on the laminar burning velocity of methane-air mixtures. J. Hazard. Mater. 2017, 321, 440–448. [Google Scholar] [CrossRef]
  21. Wang, D.; Ji, C.; Wang, S.; Yang, J.; Tang, C. Experimental investigation on near wall ignited lean methane/hydrogen/air flame. Energy 2019, 168, 1094–1103. [Google Scholar] [CrossRef]
  22. Wen, X.; Wang, M.; Su, T.; Zhang, S.; Pan, R.; Ji, W. Suppression effects of ultrafine water mist on hydrogen/methane mixture explosion in an obstructed chamber. Int. J. Hydrogen Energy 2019, 44, 32332–32342. [Google Scholar] [CrossRef]
  23. Amez, I.; Castells, B.; Garcia-Torrent, J.; Medic, L. Influence of the addition of hydrogen on the flammability intervals of the methane, air and CO2 mixtures. In Proceedings of the Air and Waste Management Association’s Annual Conference and Exhibition, AWMA, Quebec, QC, Canada, 25–28 June 2019; p. 8. [Google Scholar]
  24. Wang, Q.; Zhao, Y.; Wu, F.; Bai, J. Study on the combustion characteristics and ignition limits of the methane homogeneous charge compression ignition with hydrogen addition in micro-power devices. Fuel 2018, 236, 354–364. [Google Scholar] [CrossRef]
  25. Ge, B.; Ji, Y.; Zhang, Z.; Zang, S.; Tian, Y.; Yu, H.; Chen, M.; Jiao, G.; Zhang, D. Experiment study on the combustion performance of hydrogen-enriched natural gas in a DLE burner. Int. J. Hydrogen Energy 2019, 44, 14023–14031. [Google Scholar] [CrossRef]
  26. Ghosh, A.; Munoz-Munoz, N.M.; Lacoste, D.A. Minimum ignition energy of hydrogen-air and methane-air mixtures at temperatures as low as 200 K. Int. J. Hydrogen Energy 2022, 47, 30653–30659. [Google Scholar] [CrossRef]
  27. Wilsdon, J. The politics of small things: Nanotechnology, risk, and uncertainty. IEEE Technol. Soc. Mag. 2004, 23, 16–21. [Google Scholar] [CrossRef]
  28. IEC 60079-11; Explosive Atmospheres—Part 11: Equipment Protection by Intrinsic Safety “i”. IEC: Geneva, Switzerland, 2011.
  29. Uber, C.; Hilbert, M.; Felgner, A.; Hüser, D.; Kurrat, M.; Gerlach, U. Electrical discharges caused by opening contacts in an ignitable atmosphere – Part I: Analysis of electrical parameters at ignition limits. J. Loss Prev. Process. Ind. 2019, 61, 114–121. [Google Scholar] [CrossRef]
  30. Janès, A.; Lesage, J.; Weinberger, B.; Carson, D. Experimental determination of minimum ignition current (MIC) ratio of hydrogen/methane (H 2 NG) blends up to 20 vol.% of hydrogen. Process. Saf. Environ. Prot. 2017, 107, 299–308. [Google Scholar] [CrossRef]
  31. ASTM E 681 98; Standard Test Method for Concentration Limits of Flammability of Chemicals (Vapors and Gases) 1. ASTM: West Conshohocken, PA, USA, 1998.
  32. DIN 51 69; Method for the Determination of Flammability Limits. DIN: Wittenbergplatz, Germany.
  33. EN 1839:2017; Determination of the Explosion Limits and the Lim-Iting Oxygen Concentration (LOC) for Flammable Gases and Vapours. European Committee for Standarization: Brussels, Belgium, 2017.
  34. Saito, N.; Ogawa, Y.; Saso, Y.; Liao, C.; Sakei, R. Flame-extinguishing concentrations and peak concentrations of N2, Ar, CO2 and their mixtures for hydrocarbon fuels. Fire Saf. J. 1996, 27, 185–200. [Google Scholar] [CrossRef]
  35. Uber, C.; Hilbert, M.; Felgner, A.; Hüser, D.; Kurrat, M.; Gerlach, U. Electrical discharges caused by opening contacts in an ignitable atmosphere – Part II: Spectroscopic investigation and estimation of temperatures. J. Loss Prev. Process. Ind. 2019, 61, 213–219. [Google Scholar] [CrossRef]
  36. Zhou, S.; Xiao, J.; Luo, Z.; Kuznetsov, M.; Chen, Z.; Jordan, T.; Banuti, D.T. Analysis of spontaneous ignition of hydrogen-enriched methane in a rectangular tube. Proc. Combust. Inst. 2024, 40. [Google Scholar] [CrossRef]
  37. Sekar, M.; Alahmadi, T.A.; Nithya, S. Numerical simulation of industrial gas burners fueled with hydrogen-methane mixtures for enhanced combustion efficiency and reduced greenhouse gas emissions. Fuel 2024, 370. [Google Scholar] [CrossRef]
  38. Miao, H.; Lu, L.; Huang, Z. Flammability limits of hydrogen-enriched natural gas. Int. J. Hydrogen Energy 2011, 36, 6937–6947. [Google Scholar] [CrossRef]
  39. Shekhar, R.; Boeck, L.R.; Uber, C.; Gerlach, U. Ignition of a hydrogen–air mixture by low voltage electrical contact arcs. Combust. Flame 2017, 186, 236–246. [Google Scholar] [CrossRef]
  40. Uber, C.; Shekhar, R.; Felgner, A.; Koenders, L.; Gerlach, U. Experimental investigation of low-voltage spark ignition caused by separating electrodes. J. Loss Prev. Process. Ind. 2017, 49, 822–831. [Google Scholar] [CrossRef]
  41. Van den Schoor, F.; Norman, F.; Vandermeiren, K.; Verplaetsen, F.; Berghmans, J.; Van den Bulck, E. Flammability limits, limiting oxygen concentration and minimum inert gas/combustible ratio of H2/CO/N2/air mixtures. Int. J. Hydrogen Energy 2009, 34, 2069–2075. [Google Scholar] [CrossRef]
  42. EN 14756; Determination of the Limiting Oxygen Concentration (LOC) for Flammable Gases and Vapours. European Committee for Standarization: Brussels, Belgium, 2007.
  43. Razus, D.; Molnarne, M.; Fuß, O. Limiting oxygen concentration evaluation in flammable gaseous mixtures by means of calculated adiabatic flame temperatures. Chem. Eng. Process. Process. Intensif. 2004, 43, 775–784. [Google Scholar] [CrossRef]
  44. Kutcha, J.M. Investigation of Fire and Explosion Accidents in the Chemical Mining and Fuel-Related in-Dustries—A Manual; United states Department of the Interior, Bureau of Mines, Bulletin 680: Washington, DC, USA, 1985; Volume 30, pp. 876–878. [Google Scholar]
  45. Hodges, J.; Geary, W.; Graham, S.; Hooker, P.; Goff, R. Injecting Hydrogen into the Gas Network—A Lit-Erature Search; Health and Safety Laboratory: Buxton, UK, 2015; pp. 1–53. [Google Scholar]
  46. Schoor, F.V.D.; Hermanns, R.; van Oijen, J.; Verplaetsen, F.; de Goey, L. Comparison and evaluation of methods for the determination of flammability limits, applied to methane/hydrogen/air mixtures. J. Hazard. Mater. 2008, 150, 573–581. [Google Scholar] [CrossRef]
  47. Molnarne, M.; Schroeder, V. Hazardous properties of hydrogen and hydrogen containing fuel gases. Process. Saf. Environ. Prot. 2019, 130, 1–5. [Google Scholar] [CrossRef]
Figure 1. Experimental setup in the STA and STA description.
Fire 07 00403 g001
Figure 2. Graphical calculation of LOC referring to pure oxygen.
Fire 07 00403 g002
Figure 3. Theoretical LOC of the hydrogen–air–carbon dioxide mixture.
Fire 07 00403 g003
Figure 4. Representation of the experimental method to obtain the flammability interval in the STA.
Fire 07 00403 g004
Figure 5. Comparison of bibliographic values of methane–air flammability limits for STA method validation; (a) Normal deviation of UFL comparing bibliographic and experimental results. (b) Normal deviation of LFL comparing bibliographic and experimental results.
Fire 07 00403 g005
Figure 6. LFL comparison between existing data in the literature and data from this study [38,43,46].
Fire 07 00403 g006
Figure 7. UFL comparison between existing data in the literature and data from this study [38,43,46].
Fire 07 00403 g007
Figure 8. Trendline of hydrogen addition’s influence in the UFL of methane–air mixtures.
Fire 07 00403 g008
Figure 9. Theoretical flammability interval of different percentages of hydrogen addition.
Fire 07 00403 g009
Table 1. Criterion for the determination of the probability of explosion.
Number of RoundsProbability
1–20Very high probability
20–50High probability
50–100Low probability
100–200Very low probability
Table 2. Theoretical flammability limits of methane–air mixtures from Le Chatelier’s equation.
%H2010203050100
LFL4.694.614.534.464.394.00
UFL14.9816.2817.8319.7122.0375.00
Table 3. Experimental flammability limits of methane–air mixtures obtained in the STA.
%H210203050
LFL4.504.504.504.25
UFL16.2521.2523.7527.50
Disclaimer/Publisher’s Note: The statements, opinions and data contained in all publications are solely those of the individual author(s) and contributor(s) and not of MDPI and/or the editor(s). MDPI and/or the editor(s) disclaim responsibility for any injury to people or property resulting from any ideas, methods, instructions or products referred to in the content.