Abstract
Natural disasters like hurricanes, wildfires, and floods pose immediate hazards. Such events often necessitate prompt emergency evacuations to save lives and reduce fatalities, injuries, and property damage. This study focuses on optimizing wildfire evacuations by analyzing the influence of different transportation infrastructures and the penetration of autonomous vehicles (AVs) on a historical wildfire event. The methodology involves modeling various evacuation scenarios and incorporating different intersection traffic controls such as roundabouts and stop signs and an evacuation strategy like lane reversal with various AV penetration rates. The analysis results demonstrate that specific interventions on evacuation routes can significantly reduce travel times during evacuations. Additionally, a comparative analysis across different scenarios shows a promising improvement in travel time with a higher level of AV penetration. These findings advocate for the integration of autonomous technologies as a crucial component of future emergency response strategies, demonstrating the potential for broader applications in disaster management. Future studies can expand on these findings by examining the broader implications of integrating AVs in emergency evacuations.
1. Introduction
Natural disasters are catastrophic events resulting from natural hazards. These events, including earthquakes, hurricanes, wildfires, and floods, are very powerful and unpredictable events and often cause widespread damages, injuries, and fatalities [1,2]. According to statistical data, the United States witnesses an alarming frequency of natural disasters annually. In 2021 alone, the country encountered a staggering total of 97 natural disasters including severe thunderstorms, wildfires, heat waves, and floods [3]. The country has sustained 373 weather and climate disasters since 1980, where overall damages reached or exceeded USD $1 billion. In 2005, Hurricane Katrina, the costliest disaster at USD $182.5 billion, resulted in nearly 2000 fatalities, making it one of the deadliest in United States history [4]. Similarly, the 2018 Camp Fire was the most destructive wildfire in modern history. The fire caused USD $12.5 billion in total insured losses and burned over 150,000 acres, forcing at least 52,000 people to evacuate. Tragically, 85 people lost their lives in the fire, making it the deadliest wildfire in the United States in the past 100 years [5,6].
Each natural disaster necessitates a specific set of mitigation and response measures to safeguard the safety and well-being of the affected communities [7]. For instance, according to the Federal Emergency Management Agency (FEMA), responding to an earthquake may involve immediate evacuation and advising residents to seek emergency shelter. Wildfires may demand rapid containment efforts and the timely evacuation of residents. Hurricanes and floods require early warnings and effective evacuation strategies. Conversely, for events like tornadoes or volcanic eruptions, seeking shelter indoors in a robust, windowless area such as a basement is advised [8]. However, the timely evacuation of individuals residing in vulnerable areas remains a critical factor in responding to most natural calamities. Whether it involves receiving early warnings about hurricanes or dealing with the swift progression of wildfires, the capability to evacuate swiftly and efficiently plays a crucial role in markedly reducing the potential loss of life [9].
Among the various natural disasters that demand immediate evacuation measures, wildfires stand out due to their rapid and often unpredictable spread [10]. A wildfire is a raging, uncontrolled fire that erupts in natural environments like forests, grasslands, or prairies, and it poses a severe threat to property, lives, and the ecological balance of the area [11]. The urgency of evacuation in wildfire-prone regions cannot be overstated given the speed at which these infernos can engulf vast swaths of land, homes, and natural habitats. Large-scale wildfires frequently result in mass evacuations, causing societal upheaval, long-term infrastructure damage, and injuries and deaths among evacuees and first responders [12,13]. Research has shown that the intensities, frequency, and social harms of wildfires have increased in recent years, largely due to global warming and climate change [14]. According to the United States Fire Administration (USFA), the country saw an estimated yearly average of 1,344,100 wildfires between 2008 and 2017, resulting in over 3000 deaths, 16,225 injuries, and USD $14.7 billion in direct property losses [15].
Communities located in wildland–urban interface (WUI) zones, characterized by undeveloped wildland, face the greatest wildfire risks due to their proximity to highly flammable vegetation [16,17]. Many of these communities are experiencing rapid growth [18], but their infrastructure remains inadequate to meet the growing traffic demands [19]. The inadequacy of the transportation systems often leads to congestion and traps the evacuees, especially during wildfire events [20]. Moreover, delayed evacuation trigger alarms and delays in evacuation advice implementation are other problems that force locals to stay until the last minute and face hazardous situations. This underlines the significance of a well-coordinated, timely evacuation during a wildfire, as a disorganized evacuation is likely to result in damages and the loss of lives [21].
The primary focus of wildfire evacuation research has centered on human behavioral studies, and these studies are reliant on social science-based surveys. This emphasis has stemmed primarily from a lack of empirical data on traffic movement and clearance time in existing evacuation studies [22]. However, in recent years, substantial datasets on human mobility have surfaced due to the widespread use of sensor technologies, i.e., global positioning system (GPS) devices, in various modes of transportation and the ubiquitous presence of mobile phones. This abundance of data has become a cornerstone in shaping the evolving standards of smart cities [23]. Multiple independent third-party entities, such as Waze, INRIX, TomTom, and HERE, are now actively accumulating extensive crowdsourced data to offer accurate real-time traffic insights [24,25,26]. Additionally, prominent big data firms such as Otonomo and Wejo have emerged, and they specialize in organizing and standardizing historical data obtained from connected vehicles (CVs) [27,28]. Several studies have already effectively tested these datasets [17,29,30,31]. Given the lack of empirical data and the limitations of existing travel data collection methods, these datasets present an exceptional alternative for accurately modeling, validating, and analyzing historical wildfire events. The validated models can be utilized for different scenario studies to strategize and coordinate evacuation routes and signal timings, pinpoint and resolve potential bottlenecks, and communicate accurate estimates of travel time and the fastest evacuation routes to the public [32]. Many studies have frequently employed scenario-based approaches to assess the efficacy of various options in traffic studies by employing simulated situations to gauge real-world effectiveness [33,34,35]. Scenario-based approaches could be particularly useful in wildfire evacuation studies due to the dynamic and unpredictable nature of wildfires by allowing researchers to simulate various scenarios and optimize evacuation strategies accordingly.
Various factors can significantly impact evacuation efforts during emergencies, especially along evacuation routes. Factors such as road width and curvature, types of traffic control devices, and intersection designs can influence evacuation routes and traffic flow, potentially causing significant delays, particularly during evacuations [36]. While traffic signals are commonly used to regulate traffic flow, alternative options such as roundabouts, stop signs, and specialized evacuation strategies can offer distinct advantages in emergency evacuations [37,38]. Understanding the implications of these diverse geometric configurations is crucial for developing robust emergency response plans, particularly for designated evacuation routes. Moreover, as the world increasingly integrates autonomous vehicles (AVs) into transportation systems, the importance of these configurations becomes even more pronounced.
The advent of AVs has marked a groundbreaking shift in modern transportation. Partial AVs are already present in the market due to computer and sensor engineering advancements, and fully automated vehicles are anticipated to arrive [39]. The Society of Automotive Engineers has classified AVs into six degrees of automation based on how the human driver and the vehicle system manage the task of driving. There is no automation at Level 0, which reflects conventional cars. Level 1 refers to driver assistance, Level 2 to partial automation, and Level 3 to conditional automation. The human driver is mainly responsible for the core driving activities in the first three tiers. Conversely, at Levels 4 and 5, both of which denote complete automation, the vehicle system handles most of the dynamic driving responsibilities [40]. Fully automated vehicles that run without a human driver ‘s aid are called “autonomous” vehicles. AVs are projected to be commercially available in the near future. AVs operate without direct human input, relying on advanced sensors and AI algorithms [41]. According to recent research studies, AVs would provide various benefits to transportation networks. These advantages include increasing the traffic capacity of existing roadway infrastructure, improving traffic flow, enhancing safety, and reducing traffic congestion [42,43,44,45]. The potential impact of AVs extends across multiple industries, offering the prospects of safer roads and more efficient transportation systems, as well as providing potential environmental advantages. Unmanned aerial AVs have already found applications in disaster management, especially in wildfire monitoring [46].
An AV’s present substantial potential in a wildfire evacuation relates to potentially furnishing real-time updates on road conditions, adeptly navigating evacuation routes, and maneuvering through challenging terrain, such as areas with limited visibility due to smoke [47]. The impact assessments of AVs in previous studies have been conducted through simulations or field test experiments. A microscopic simulation is a commonly used method that has been employed in previous studies to examine the effects of AVs on traffic flow due to the currently low penetration rate of these emerging technologies. Different microsimulation platforms such as SUMO, AIMSUN, and VISSIM are utilized by researchers to model the behaviors of AVs and assess the shared traffic flows of autonomous and conventional vehicles [48,49,50]. Yet, a limited number of studies have delved into the utilization of AVs in wildfire evacuations. It remains imperative to thoroughly examine the potential utilization of AVs in emergency scenarios, considering the complexities associated with the interactions of AVs with other vehicles in different geometric configurations [50,51].
Therefore, expanding upon the existing research gap, this study aimed to conduct scenario studies for a historical wildfire event for both conventional vehicles and AVs. This dual approach aimed to provide insights into the distinct travel dynamics exhibited by both vehicle types under different geometric conditions and contribute valuable knowledge to the optimization of wildfire evacuation routes.
2. Materials and Methods
2.1. Case Study: Knolls Fire of 2020, Utah
In recent years, numerous wildfire events have occurred in the United States [15]. The state of Utah has been identified as one of the most wildfire-prone states in the United States. According to the Utah Division of Forestry and Fire, Utah’s WUI comprises of approximately 93% undeveloped WUI and 7% developed WUI [52]. For this study, the Knolls Fire of 2020, which took place in the WUI area of Saratoga Springs, Utah, on 28 June 2020, was selected. The Knolls Fire 2020 originated between 2:00 p.m. and 2:30 p.m. to the east of Lake Mountain, south of the City of Saratoga Springs, and it quickly spread toward the City due to strong 60 mph gusts of wind [53]. The City of Saratoga springs is bordered by Utah Lake on its eastern side and Lake Mountain on its western side. State Route 68 (SR-68), commonly known as ‘Redwood Road’, served as the primary evacuation route from the City. Following the fire’s ignition, mandatory evacuation orders were issued for nearly one-third of the City’s population, encompassing over 3100 homes and approximately 13,000 residents [54]. The evacuation commenced at 2:45 p.m., starting with the southern neighborhoods of the City, as shown in Figure 1. The residents in these areas were asked to evacuate immediately amidst strong winds, smoke, and dust. Following that, later in the afternoon, all individuals living south of Grandview Boulevard on the western stretch of Redwood Road were advised to evacuate their houses due to the rapid spread of the fire [55]. A shelter area was established at Westlake High School for the evacuees on Redwood Road, which was used to redirect Northbound traffic. Moreover, southbound traffic was blocked by downed power lines near the fire’s perimeter [56]. The evacuation traffic on NB SR-68 gradually resulted in heavy traffic congestion and vehicle queues, which was also evident in the operator response notes of the Utah Department of Transportation (UDOT) [31].
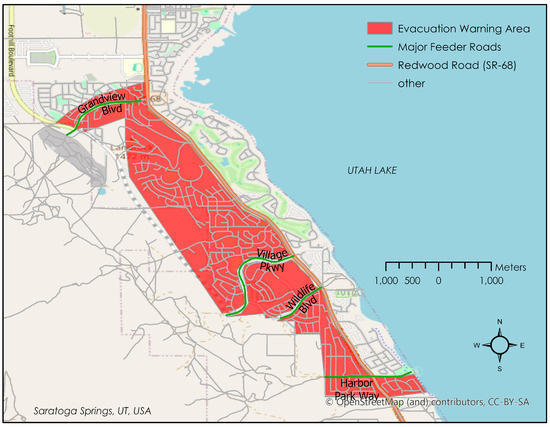
Figure 1.
Evacuation area, Knolls Fire of 2020, Saratoga Springs, Utah.
The study area chosen for the calculation of travel time encompassed a five-mile stretch along NB SR-68, spanning from mile markers (MMs) 25 to 30. This section of SR-68 included various connecting roads and five traffic signals, facilitating the entry and exit of vehicular traffic from the affected neighborhoods, as depicted in Figure 2.
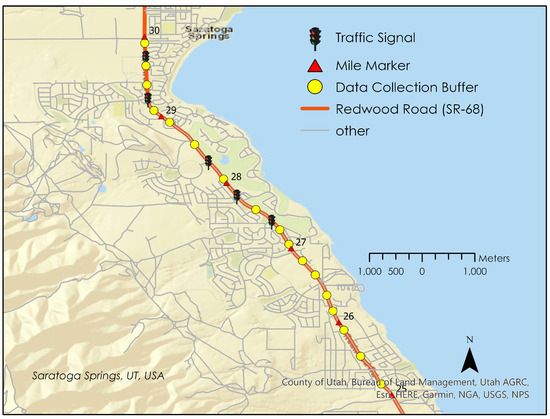
Figure 2.
Study area map: Saratoga Springs, Utah, United States.
2.2. Scenario Studies
A baseline scenario was established using PTV VISSIM, which serves as a robust microsimulation tool for analyzing networks at intersections, freeways, and various road segments [57]. PTV VISSIM was chosen for its advanced features, which include an integrated scenario manager that simplifies traffic scenario creation, provides precise simulation control, and aids in efficient traffic management planning for enhanced decision-making through scenario comparisons [58]. The study utilized a VISSIM model, previously validated by Ahmad et al. in 2023 [31], to simulate conditions along a three-mile segment of SR-68, covering MMs 27 to 30. This segment included five traffic signals and interconnected roads, as shown in Figure 2. The model’s validation comprised a similarity assessment, comparing its outcomes with historical performance metrics obtained from the UDOT ATSPM website. The validation process affirmed that our baseline scenario accurately replicated travel times comparable to those observed on the actual evacuation day.
Following the establishment of the baseline scenario, a case study was conducted to evaluate the potential outcomes of an evacuation scenario utilizing AVs. In a comprehensive evaluation of available car-following models [49], the car-following models identified in accordance with Chen et al., 2019 [59], were used for this study. The adopted values are given in Table 1 and Table 2. In Chen’s model, the simulation of foggy conditions focused exclusively on visibility as the variable, with a potential range from 0 to 10,000 m. This singular focus on visibility made it particularly relevant to our model. Notably, during a wildfire evacuation, driver visibility may be severely compromised by smoke and ash, which is akin to the reduced visibility encountered in foggy conditions, thus underscoring the pertinence of the visibility parameter in our scenario analysis.

Table 1.
Adopted values for the W99 car-following model for human-driven vehicles [59].

Table 2.
Adopted values for the W99 car-following model for autonomous vehicles [59].
Moreover, for accurate travel time estimations of each simulated vehicle in the network, we defined nine vehicle travel-time-measuring segments, as shown in Table 3. In the delineated vehicle travel-time-management framework, each segment was defined by a pair of nodes—a start link and an end link—with the interconnecting junction serving as the primary traffic control structure, as shown in Figure 3. The “start position” and “end position” in Table 3 specified the respective exact points within these links between which travel times were measured.

Table 3.
Vehicle travel-time-measuring segments.
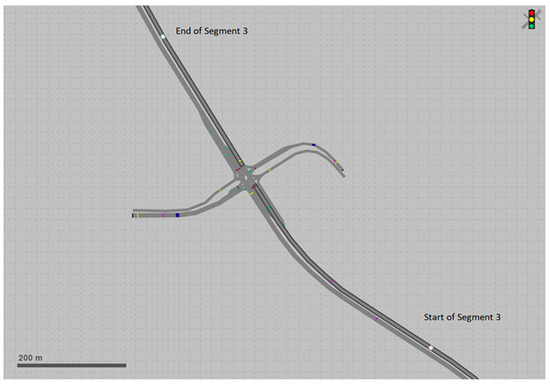
Figure 3.
Traffic control structure in Segment 3.
Within our network, there were eight such junctions, resulting in nine distinct segments. This segmentation facilitated a singular modification in the traffic structure for the purpose of the scenario analysis. Of the eight junctions, specifically those in Segment 3 and Segment 9, two featured four-way, signal-controlled intersections, while the remaining were three-way intersections. Our scenario analysis focused on modifying the traffic control infrastructure at Segments 3 and 9 to assess the repercussions on the overall network travel time, as well as on the individual and adjacent segment travel times, thereby enabling a comparative evaluation of the outcomes.
Various simulations were conducted to study scenarios involving both conventional vehicles and AVs. The study introduced different intersection controls, such as stop signs and roundabouts, as well as an evacuation strategy involving lane reversal, into the network. These scenarios were simulated with five different AV penetration rates (0%, 25%, 50%, 75%, and 100%). Since a 100% penetration rate was not anticipated in the near future, the penetration rates were projected to gradually increase over time [60].
During emergency wildfire evacuations, ensuring consistent power supply becomes a critical concern. In the event of power outages or malfunctioning signal configurations, employing stop signs and alternative methods to traditional intersection traffic control signals becomes reasonable. Moreover, during the Knolls Fire of 2020, regular traffic monitoring was suspended, and the traffic signals were used as stop signs on the day of evacuation to enhance the flow of vehicles [17]. Similarly, roundabouts often lead to improved operational performance, as the improved traffic flow, aesthetics, and cost savings make them a proven alternative [37,61]. Moreover, traffic management authorities implement lane reversal strategies in the event of an emergency, i.e., temporarily changing the direction of specific lanes to facilitate the flow of vehicles away from affected areas [38].
These simulations were conducted to provide a comprehensive examination of AV efficiency under varied conditions, shedding light on how AVs respond and adapt to different traffic scenarios. Moreover, to capture traffic variability and accommodate a broader range of fluctuations, each scenario was simulated 10 times.
2.2.1. Scenario 1—No Change
In this scenario, the study simulated the integration of AVs into regular traffic flow without any modifications to the network. The focus was on understanding how AVs interact with human-driven vehicles in typical road conditions. It also evaluated the compatibility of AVs with existing traffic infrastructure, including road signs, lane markings, and signals. Understanding how well AVs interpret and respond to standard traffic control features is crucial for ensuring their seamless integration into current transportation systems. Thus, Scenario 1 served as a baseline scenario to understand how AVs operate in the absence of special challenges.
2.2.2. Scenario 2—Different Intersection Controls
This scenario delved into the response of AVs within a modified network. The primary focus was on evaluating the efficiency with which AVs navigated through the intersections which were regulated by stop signs or roundabouts to calculate the potential travel time savings. For this scenario, the static routes for vehicles passing through a roundabout were changed from three directions (left, right, and straight) to four directions (the first, second, third, and fourth exits of a roundabout) to cover the possibilities. All connectors were removed from the intersections at Segment 3 and Segment 9 and replaced with roundabouts.
2.2.3. Scenario 3—Lane Reversal
The structural change in the network for this scenario involved reversing all links and connectors for the southbound Segment 3 and for Segment 9, which was located north of the traffic controller. Additionally, static route settings were adjusted to accommodate vehicles traveling through this temporary reversal of lanes and detouring back at the next segment’s traffic controller. We allocated an equal probability for both the newly reversed link and the original link to accommodate the passage of vehicles.
3. Results and Discussion
3.1. Scenario Results
In this section, we delve into the compelling outcomes of the diverse scenarios studied with our traffic simulation model. As shown in Figure 4, the travel time varied significantly compared to the baseline scenario, i.e., “No Change”. The stop sign scenario showed an increase in travel time which could be attributed to the frequency of stops. However, the roundabout and dynamic lane reversal strategies showed significant reductions in travel times by promoting continuous traffic flow.
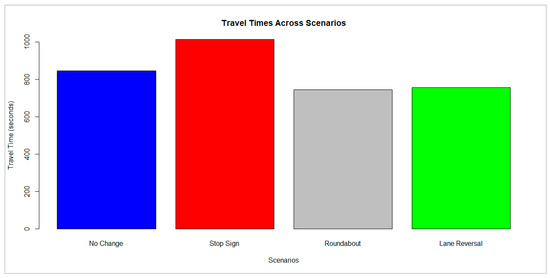
Figure 4.
Travel times across the different scenarios.
3.2. Impact of AV Penetration
Figure 5 illustrates the impacts of different AV penetration levels, i.e., 0%, 25%, 75%, and 100%, across the different traffic scenarios. While there was a general trend of improved travel time with higher AV penetration, the magnitude of this improvement fluctuated depending on the specific traffic scenario. For instance, the “No Change” scenario showed a slight increase in travel time, indicating minimal benefits from AV penetration alone. Conversely, the “Stop Sign” scenario, with a consistently higher travel time, showed a negligible reduction, suggesting limited efficiency gains. The “Roundabout” scenario stood out with its significant and consistent reduction in travel time, peaking at 50% AV penetration, whereas the “Lane Reversal” scenario displayed fluctuating travel times, with the best performance at 75% AV penetration, though the overall trends were inconsistent.
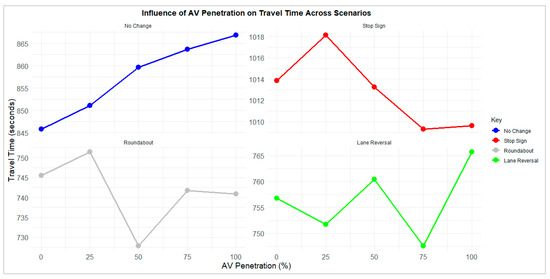
Figure 5.
Typical travel times across the different scenarios (Impact of AV penetration).
3.3. Travel Time Comparison
The travel time comparison highlighted some notable trends. As demonstrated in Figure 6, the “Stop Sign” scenario consistently exhibited higher travel times compared to the baseline “No Change” scenario, with an average increase of approximately 19.8%, whereas the “Roundabout” and “Lane Reversal” scenarios showcased significant reductions in travel times. The “Roundabout” scenario, for instance, showed an average decrease of approximately 12.4% across all levels of AV penetration, indicating its effectiveness in improving traffic flow. Similarly, the “Lane Reversal” scenario demonstrated substantial improvements, with an average travel time reduction of approximately 10.6%. These findings underscore the considerable benefits of implementing “Roundabout” and “Lane Reversal” strategies in the context of AV-integrated traffic systems.
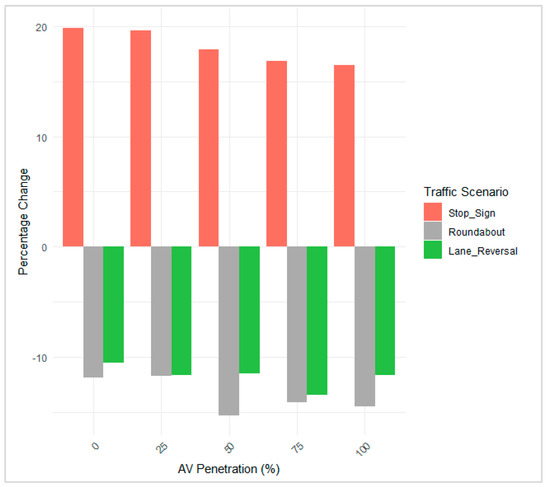
Figure 6.
Percentage change in travel time compared to “No Change 0% AV”.
The observed delays at the stop signs aligned with the understanding that intersections with stop signs can typically result in traffic congestion and slower travel speeds which are further exacerbated by the presence of AVs. Similarly, the improvements observed with roundabouts and lane reversals were in line with the known benefits of these traffic configurations in enhancing traffic flow and reducing delays.
Moreover, the travel time comparison showed that changes to road settings by themselves are insufficient for significantly improving travel times without accounting for AV penetration. Greater AV penetration can boost efficiency, especially in smoother-flow scenarios like roundabouts. Therefore, an integrated approach combining effective road settings with higher AV penetration is essential for optimizing travel time reductions.
4. Conclusions
This study aimed to study wildfire evacuations by conducting scenario simulations on a historical wildfire event, i.e., the Knolls Fire of 2020 in Saratoga Springs, Utah. The traffic data revealed consistent travel times on non-evacuation days, contrasting sharply with the substantial increase reported on the evacuation day.
Through various scenarios simulated with our baseline model, we assessed the travel time performance of both conventional vehicles and AVs. The study found that certain interventions on evacuation routes could lead to travel-time savings during evacuations. Particularly, adjustments like roundabouts and lane reversals contributed to commendable, system-wide travel-time savings. However, replacing the existing traffic signal lights with stop signs resulted in a system-wide travel-time delay. Nevertheless, it is crucial to emphasize the enduring significance of stop signs in evacuation scenarios due to their reliability, which is unaffected by electricity.
Furthermore, the study noted minimal benefits from AV penetration alone. However, AVs demonstrated promising improvements in travel time reductions when coupled with other traffic control settings, which promoted improved traffic flow.
5. Recommendations
This study highlights the promising role that AVs can play in enhancing emergency evacuation efforts. The benefits noted in our research support the integration of autonomous technologies as a key element in future emergency response strategies. However, this study focused solely on traffic simulations and did not consider the impacts of ambient factors, such as wind, or the dynamics of wildfire spread. Future studies can build on these findings by exploring the broader implications of integrating AVs into wildfire emergency evacuations. Specifically, incorporating wildfire spread models into traffic simulations will enable a comprehensive examination of safety aspects, such as accident prevention, adaptability to dynamic conditions, and coordination with emergency response systems. This approach will provide a deeper understanding of the potential benefits and challenges associated with AVs in such events.
Author Contributions
Conceptualization, A.A., M.G. and Y.H.; methodology, A.A. and M.G.; software, A.A. and M.G.; validation, A.A., M.G. and S.A.; formal analysis, A.A., M.G. and S.A.; investigation, A.A. and M.G.; resources, A.A., M.G., Y.H. and P.L.; data curation A.A., M.G. and Y.H.; writing—original draft preparation, A.A. and M.G.; writing—review and editing, A.A., M.G., Y.H. and P.L.; visualization, A.A., M.G. and S.A.; supervision, Y.H. and P.L.; project administration, Y.H. and P.L.; funding acquisition, Y.H. and P.L. All authors have read and agreed to the published version of the manuscript.
Funding
This research was funded by the United States Department of Transportation under the University Transportation Center (UTC), contract agreement no. 131987-Z912530 through CMMM project no. FAR0037360 and the UTC Mountain Plains Consortium.
Institutional Review Board Statement
Not applicable.
Informed Consent Statement
Not applicable.
Data Availability Statement
The data used in this article is confidential. Requests to access the datasets should be directed to the corresponding author.
Conflicts of Interest
The authors declare no conflicts of interest.
References
- Grünthal, G.; Thieken, A.H.; Schwarz, J.; Radtke, K.S.; Smolka, A.; Merz, B. Comparative Risk Assessments for the City of Cologne—Storms, Floods, Earthquakes. Nat. Hazards 2006, 38, 21–44. [Google Scholar] [CrossRef]
- Zuzak, C.; Mowrer, M.; Goodenough, E.; Burns, J.; Ranalli, N.; Rozelle, J. The national risk index: Establishing a nationwide baseline for natural hazard risk in the US. Nat. Hazards 2022, 114, 2331–2355. [Google Scholar] [CrossRef]
- Statista. Natural Disasters in the U.S. Available online: https://www.statista.com/topics/1714/natural-disasters/#topicOverview (accessed on 21 December 2023).
- Smith, A.B. US Billion-Dollar Weather and Climate Disasters, 1980-Present. 2022. Available online: https://www.geoplatform.gov/metadata/9b3248e8-a6fe-4f71-92cb-e71bf65447d9 (accessed on 21 December 2023).
- Hamideh, S.; Sen, P.; Fischer, E. Wildfire impacts on education and healthcare: Paradise, California, after the Camp Fire. Nat. Hazards 2022, 111, 353–387. [Google Scholar] [CrossRef] [PubMed]
- Camp Fire. California Department of Forestry and Fire Protection. Available online: https://www.fire.ca.gov/incidents/2018/11/8/camp-fire/ (accessed on 20 December 2023).
- Haddow, G.; Haddow, K.S.; Coppola, D. Introduction to Emergency Management, Enhanced; Butterworth-Heinemann: Oxford, UK, 2014. [Google Scholar]
- FEMA. Mitigation Ideas: A Resource for Reducing Risk to Natural Hazards. Available online: https://www.fema.gov/sites/default/files/2020-06/fema-mitigation-ideas_02-13-2013.pdf (accessed on 22 February 2024).
- Thompson, R.R.; Garfin, D.R.; Silver, R.C. Evacuation from natural disasters: A systematic review of the literature. Risk Anal. 2017, 37, 812–839. [Google Scholar] [CrossRef]
- Tedim, F.; Leone, V.; Amraoui, M.; Bouillon, C.; Coughlan, M.R.; Delogu, G.M.; Fernandes, P.M.; Ferreira, C.; McCaffrey, S.; McGee, T.K.; et al. Defining Extreme Wildfire Events: Difficulties, Challenges, and Impacts. Fire 2018, 1, 9. [Google Scholar] [CrossRef]
- McKENZIE, D.; Gedalof, Z.; Peterson, D.L.; Mote, P. Climatic Change, Wildfire, and Conservation. Conserv. Biol. 2004, 18, 890–902. [Google Scholar] [CrossRef]
- Beverly, J.L.; Bothwell, P. Wildfire evacuations in Canada 1980–2007. Nat. Hazards 2011, 59, 571–596. [Google Scholar] [CrossRef]
- Caton, S.E.; Hakes, R.S.P.; Gorham, D.J.; Zhou, A.; Gollner, M.J. Review of Pathways for Building Fire Spread in the Wildland Urban Interface Part I: Exposure Conditions. Fire Technol. 2017, 53, 429–473. [Google Scholar] [CrossRef]
- United States Environmental Protection Agency. Climate Change Indicators: Wildfires. Available online: https://www.epa.gov/climate-indicators/climate-change-indicators-wildfires#:~:text=Multiple%20studies%20have%20found%20that,wildfire%20frequency%2C%20and%20burned%20area.&text=The%20wildfire%20season%20has%20lengthened,and%20drier%20soils%20and%20vegetation (accessed on 22 February 2024).
- U.S. Fire Administration. Fire in the United States 2008–2017. November 2019. Available online: https://www.usfa.fema.gov/downloads/pdf/publications/fius20th.pdf (accessed on 22 February 2024).
- Mietkiewicz, N.; Balch, J.K.; Schoennagel, T.; Leyk, S.; Denis, L.A.S.; Bradley, B.A. In the line of fire: Consequences of human-ignited wildfires to homes in the U.S. (1992–2015). Fire 2020, 3, 50. [Google Scholar] [CrossRef]
- Ahmad, S.; Ahmed, H.U.; Ali, A.; Yang, X.; Huang, Y.; Guo, M.; Ren, Y.; Lu, P. Evaluating driving behavior patterns during wildfire evacuations in wildland-urban interface zones using connected vehicles data. Fire Saf. J. 2024, 142, 104015. [Google Scholar] [CrossRef]
- U.S. Fire Administration. Wildland Urban Interface. Available online: https://www.usfa.fema.gov/wui/ (accessed on 22 February 2024).
- Theobald, D.M.; Romme, W.H. Expansion of the US wildland–urban interface. Landsc. Urban Plan. 2007, 83, 340–354. [Google Scholar] [CrossRef]
- Fraser, A.M.; Chester, M.V.; Underwood, B.S. Wildfire risk, post-fire debris flows, and transportation infrastructure vulnerability. Sustain. Resilient Infrastruct. 2020, 7, 188–200. [Google Scholar] [CrossRef]
- Beyki, S.M.; Santiago, A.; Laím, L.; Craveiro, H.D. Evacuation Simulation under Threat of Wildfire—An Overview of Research, Development, and Knowledge Gaps. Appl. Sci. 2023, 13, 9587. [Google Scholar] [CrossRef]
- Kuligowski, E. Evacuation decision-making and behavior in wildfires: Past research, current challenges and a future research agenda. Fire Saf. J. 2021, 120, 103129. [Google Scholar] [CrossRef]
- Ramezani, M.; Geroliminis, N. Queue Profile Estimation in Congested Urban Networks with Probe Data. Comput. Civ. Infrastruct. Eng. 2015, 30, 414–432. [Google Scholar] [CrossRef]
- Li, X.; Dadashova, B.; Yu, S.; Zhang, Z. Rethinking highway safety analysis by leveraging crowdsourced waze data. Sustainability 2020, 12, 10127. [Google Scholar] [CrossRef]
- Cookson, G.; Pishue, B. INRIX Global Traffic Scorecard—Appendices. INRIX Res. 2017, p. 44. Available online: https://media.bizj.us/view/img/10360454/inrix2016trafficscorecarden.pdf (accessed on 14 March 2023).
- Wojnarski, M.; Gora, P.; Szczuka, M.; Nguyen, H.S.; Swietlicka, J.; Zeinalipour, D. IEEE ICDM 2010 Contest: TomTom Traffic prediction for intelligent GPS Navigation. In Proceedings of the 2010 IEEE International Conference on Data Mining Workshops (ICDMW), Sydney, Australia, 13 December 2010; IEEE: Piscataway, NJ, USA, 2010; pp. 1372–1376. [Google Scholar] [CrossRef][Green Version]
- Otonomo. Available online: https://otonomo.io/ (accessed on 3 April 2023).
- Wejo. Available online: https://www.wejo.com/ (accessed on 3 April 2023).
- Desai, J.; Saldivar-Carranza, E.; Mathew, J.K.; Li, H.; Platte, T.; Bullock, D. Methodology for Applying Connected Vehicle Data to Evaluate Impact of Interstate Construction Work Zone Diversions. In Proceedings of the 2021 IEEE International Intelligent Transportation Systems Conference (ITSC), Indianapolis, IN, USA, 19–22 September 2021; IEEE: Piscataway, NJ, USA, 2021; pp. 4035–4042. [Google Scholar] [CrossRef]
- Saldivar-Carranza, E.D.; Hunter, M.; Li, H.; Mathew, J.; Bullock, D.M. Longitudinal Performance Assessment of Traffic Signal System Impacted by Long-Term Interstate Construction Diversion Using Connected Vehicle Data. J. Transp. Technol. 2021, 11, 644–659. [Google Scholar] [CrossRef]
- Ahmad, S.; Ali, A.; Ahmed, H.U.; Huang, Y.; Lu, P. Evaluating traffic operation conditions during wildfire evacuation using connected vehicles data. Fire 2023, 6, 184. [Google Scholar] [CrossRef]
- Bahaaldin, K.; Fries, R.; Bhavsar, P.; Das, P. A Case Study on the Impacts of Connected Vehicle Technology on No-Notice Evacuation Clearance Time. J. Adv. Transp. 2017, 2017, 6357415. [Google Scholar] [CrossRef]
- Grajdura, S.; Borjigin, S.; Niemeier, D. Fast-moving dire wildfire evacuation simulation. Transp. Res. Part D Transp. Environ. 2022, 104, 103190. [Google Scholar] [CrossRef]
- Duanmu, J.; Taaffe, K.M.; Chowdhury, M.; Robinson, R.M. Simulation analysis for evacuation under congested traffic scenarios: A case study. Simulation 2012, 88, 1379–1389. [Google Scholar] [CrossRef]
- Tumminello, M.L.; Macioszek, E.; Granà, A.; Giuffrè, T. Simulation-Based Analysis of “What-If” Scenarios with Connected and Automated Vehicles Navigating Roundabouts. Sensors 2022, 22, 6670. [Google Scholar] [CrossRef] [PubMed]
- Federal Highway Administration (FHWA). Traffic Congestion and Reliability: Trends and Advanced Strategies for Congestion Mitigation. Available online: https://ops.fhwa.dot.gov/congestion_report/chapter2.htm (accessed on 13 April 2024).
- U.S. Department of Transportation. Federal Highway Administration. Roundabouts. Available online: https://highways.dot.gov/safety/intersection-safety/intersection-types/roundabouts (accessed on 29 February 2024).
- Williams, B.M.; Tagliaferri, A.P.; Meinhold, S.S.; Hummer, J.E.; Rouphail, N.M. Simulation and analysis of freeway lane reversal for coastal hurricane evacuation. J. Urban Plan. Dev. 2007, 133, 61–72. [Google Scholar] [CrossRef]
- McAslan, D.; Gabriele, M.; Miller, T.R. Planning and policy directions for autonomous vehicles in metropolitan planning organizations (mpos) in the United States. J. Urban Technol. 2021, 28, 175–201. [Google Scholar] [CrossRef]
- The Society of Automotive Engineers. Taxonomy and Definitions for Terms Related to Driving Automation Systems for On-Road Motor Vehicles. Available online: https://www.sae.org/standards/content/j3016_202104/ (accessed on 24 February 2024).
- Tyagi, A.K.; Aswathy, S.U. Autonomous Intelligent Vehicles (AIV): Research statements, open issues, challenges and road for future. Int. J. Intell. Netw. 2021, 2, 83–102. [Google Scholar] [CrossRef]
- Boualam, O.; Borsos, A.; Koren, C.; Nagy, V. Impact of autonomous vehicles on roundabout capacity. Sustainability 2022, 14, 2203. [Google Scholar] [CrossRef]
- Morando, M.M.; Tian, Q.; Truong, L.T.; Vu, H.L. Studying the safety impact of autonomous vehicles using simulation-based surrogate safety measures. J. Adv. Transp. 2018, 2018, 6135183. [Google Scholar] [CrossRef]
- Padmaja, B.; Moorthy, C.V.; Venkateswarulu, N.; Bala, M.M. Exploration of issues, challenges and latest developments in autonomous cars. J. Big Data 2023, 10, 61. [Google Scholar] [CrossRef]
- Stanek, D.; Milam, R.T.; Huang, E.; Wang, Y.A. Measuring autonomous vehicle impacts on congested networks using simulation. In Proceedings of the Transportation Research Board Annual Meeting, Washington, DC, USA, 7–11 January 2018. [Google Scholar]
- Saffre, F.; Hildmann, H.; Karvonen, H.; Lind, T. Monitoring and Cordoning Wildfires with an Autonomous Swarm of Unmanned Aerial Vehicles. Drones 2022, 6, 301. [Google Scholar] [CrossRef]
- Liu, J.; Liu, Z.; Jia, B.; Zheng, S.; Ji, H. Managing traffic evacuation with multiclass connected and autonomous vehicles. Phys. A Stat. Mech. Its Appl. 2023, 625, 128985. [Google Scholar] [CrossRef]
- Rahimi, A.M.; Dulebenets, M.A.; Mazaheri, A. Evaluation of microsimulation models for roadway segments with different functional classifications in northern iran. Infrastructures 2021, 6, 46. [Google Scholar] [CrossRef]
- Ahmed, H.U.; Huang, Y.; Lu, P. A Review of car-following models and modeling tools for human and autonomous-ready driving behaviors in micro-simulation. Smart Cities 2021, 4, 314–335. [Google Scholar] [CrossRef]
- Abohassan, M.; El-Basyouny, K. Leveraging LiDAR-based simulations to quantify the complexity of the static environment for autonomous vehicles in rural settings. Sensors 2024, 24, 452. [Google Scholar] [CrossRef] [PubMed]
- Ali, A.; Guo, M.; Huang, Y.; Ahmed, T.; Lu, P. Evaluating Autonomous Vehicles’ Impact on Emergency Evacuation Clearance Time: A Comparative Study. In Proceedings of the International Conference on Transportation and Development 2024, Atlanta, Georgia, 15–18 June 2024; pp. 573–582. [Google Scholar]
- Utah Department of Public Safety. UTAH Hazard Mitigation. Available online: https://hazards.utah.gov/wildfire/#:~:text=Utah%20is%20one%20of%20the,1%2C000%20wildfires%20in%20Utah%20annually (accessed on 23 February 2024).
- Tribune, T.S.L. 1 Home Destroyed, 12 Damaged as Knolls Fire Grows to 10,000 Acres; Thousands Still under Evacuation in Saratoga Springs. 2020. Available online: https://www.sltrib.com/news/2020/06/28/draper-lehi-residents/ (accessed on 20 December 2023).
- The Weather Channel. 13,000 Utah Residents Forced out by Wildfire May Return Home; Hundreds Evacuated in Nevada, Arizona and Colorado. Available online: https://weather.com/news/news/2020-06-29-utah-wildfire-evacuations-saratoga-springs-knolls-traverse-canal (accessed on 23 February 2024).
- Fox13. Thousands Evacuated as ‘Knolls Fire’ Threatens Saratoga Springs Homes. 2020. Available online: https://www.fox13now.com/news/local-news/knolls-fire-forces-evacuations-in-saratoga-springs (accessed on 20 December 2023).
- Radio, K.S.L.N. 3100 Homes Evacuated in Saratoga Springs by Fire Near Utah Lake. 2020. Available online: https://kslnewsradio.com/1928165/lightning-sparks-fire-near-utah-lake-some-saratoga-springs-neighborhoods-evacuated/ (accessed on 23 December 2023).
- Virginia Department of Transportation. VDOT Vissim User Guide. 2020. Available online: http://166.67.201.35/business/resources/VDOT_Vissim_UserGuide_Version2.0_Final_2020-01-10.pdf (accessed on 3 April 2023).
- Jiang, Q.; Nian, D.; Guo, Y.; Ahmed, M.; Yang, G.; Ma, J. Evaluating connected vehicle-based weather responsive management strategies using weather-sensitive microscopic simulation. J. Intell. Transp. Syst. 2023, 27, 92–110. [Google Scholar] [CrossRef]
- Chen, C.; Zhao, X.; Liu, H.; Ren, G.; Zhang, Y.; Liu, X. Assessing the influence of adverse weather on traffic flow characteristics using a driving simulator and VISSIM. Sustainability 2019, 11, 830. [Google Scholar] [CrossRef]
- Abdeen, M.A.R.; Yasar, A.; Benaida, M.; Sheltami, T.; Zavantis, D.; El-Hansali, Y. Evaluating the impacts of autonomous vehicles’ market penetration on a complex urban freeway during autonomous vehicles’ transition period. Sustainability 2022, 14, 10094. [Google Scholar] [CrossRef]
- IOWA DOT. Benefits of Going in Circles. Available online: https://iowadot.gov/traffic/roundabouts/BENEFITS-OF-GOING-IN-CIRCLES (accessed on 29 February 2024).
Disclaimer/Publisher’s Note: The statements, opinions and data contained in all publications are solely those of the individual author(s) and contributor(s) and not of MDPI and/or the editor(s). MDPI and/or the editor(s) disclaim responsibility for any injury to people or property resulting from any ideas, methods, instructions or products referred to in the content. |
© 2024 by the authors. Licensee MDPI, Basel, Switzerland. This article is an open access article distributed under the terms and conditions of the Creative Commons Attribution (CC BY) license (https://creativecommons.org/licenses/by/4.0/).