Article

Fire Cycles and the Spatial Pattern of the Scrub–Sedgeland Mosaic at Blakes Opening in Western Tasmania, Australia

Fire Centre, School of Natural Sciences, University of Tasmania, Sandy Bay, Hobart, TAS 7005, Australia
*
Author to whom correspondence should be addressed.
Fire 2023, 6(6), 232; https://doi.org/10.3390/fire6060232
Submission received: 26 April 2023 / Revised: 2 June 2023 / Accepted: 6 June 2023 / Published: 8 June 2023

Abstract

:
The cause of large areas of treeless Sedgeland and Scrub communities in western Tasmania, one of the wettest regions of Australia, has long puzzled ecologists, given the climatic suitability for temperate Eucalyptus and rainforests. A pervasive theory, known as the ecological drift model, is that landscape fires have created a dynamic mosaic of fire-adapted and fire-sensitive vegetation. A contrary view, known as the fire cycle model, asserts that fire patterns are a consequence, not a cause, of the mosaics, which are edaphically determined. We leveraged the opportunity presented by a large wildfire that occurred in a Sedgeland tract surrounded by Eucalyptus forest in the Huon Valley in 2019 to help discriminate between these competing models. Specifically, we sought to determine whether there was any evidence that the Sedgeland was becoming infilled with Scrub prior to the 2019 fire, and whether the fire caused the Scrub community to convert to Sedgeland. A field survey was used to assess the mortality of shrubs and their regeneration following the 2019 fire, and we used dendrochronology to determine the age of the fire-killed shrubs. We also used historical aerial photography since the 1980s to map fire scars and the distribution of Sedgeland and Scrub. We found that fire killed most shrubs in the Sedgeland and Scrub communities and initiated a cohort of shrub regeneration. Dendrochronological analysis of the fire-killed shrubs revealed that most were established approximately 40 years ago, following a fire that is apparent from aerial photography and most likely occurred around 1983. An analysis of aerial photography revealed that since 1980, the distribution of the Scrub community has remained stable, although the density of shrubs declined following the 1983 fire. The recovery of the burned Scrub areas in 1983 and the rapid regeneration of the shrubs following the 2019 fire is more consistent with the fire cycle model than the ecological drift model. These findings concord with the demonstrated stability of the Eucalyptus forest boundary at this site revealed by a separate study. The slow growth of the shrubs cautions against frequently burning Sedgelands, because it could cause the collapse of shrub populations by killing the immature cohort initiated by fire.

1. Introduction

An influential concept in fire ecology and pyrogeography is the fire-mediated alternative stable states (FMASS) model [1]. This model posits that the frequency of fire can cause major changes in the distribution of forests and treeless vegetation. For example, if a fire-dependent savanna is protected from fire, then it may become a forest through the recruitment of trees and the shading out of grass; conversely, a rainforest can be converted to a treeless state by frequent burning [2,3]. These transitions are associated with changes in fire regimes such that vegetation transitions can become self-perpetuating [4]. Proving the FMASS model is extraordinarily difficult because of the long time frames involved in vegetation transition, which preclude field experimentation [5]. Accordingly, the model is typically supported by indirect lines of evidence, particularly the poor correlation between vegetation distributions and climate [1].
Western Tasmania is prominent in the FMASS literature, being one of the first environments where fire frequency was argued to be a determinant of vegetation mosaics [6]. In this high-rainfall, temperate environment, there are large, complex landscape mosaics of Sedgelands, Scrub communities, and Eucalyptus forests, which are all adapted to fire, and temperate rainforests that are poorly adapted to fire [5]. A model known as ecological drift asserts that chance changes in fire frequency could lead to shifts in vegetation type [7]. There has been trenchant debate between supporters of ecological drift and the opposing fire cycle model, which argues that vegetation mosaics are primarily controlled by soil conditions and that fire frequency is a consequence, not a cause, of the vegetation patterns [8]. Evidence for both models has relied on inferences based on field surveys of vegetation patterns [9] or analysis of pollen assemblages in wetland sediments [10], with limited investigation of post-fire mortality and regeneration. Recent large landscape fires in western Tasmania have afforded the opportunity to fill this gap [11,12]. Prior et al. studied permanent plots in wet Eucalyptus forest that were subsequently burned in a large wildfire in the Huon River valley, and they found that most canopy tree species were able to resist fire-kill because of a strong resprouting response when defoliated [11]. Likewise, Bowman et al. [12] found that a fire that burned a Sedgeland–Forest mosaic in the Huon River valley had no effect on forest boundaries because of the very strong post-fire vegetation recovery [12]. This conclusion was further substantiated by analysis of historical aerial photography, which showed negligible change in the forest boundary over the last 70 years.
Here, we extend the study of Bowman et al. [12] to investigate changes in the distribution of Scrub and Sedgeland using historical aerial photography since 1980 and in the population dynamics of shrubs at Blakes Opening burned in 2019 [12]. We expected that the Sedgeland had been invaded by shrubs and that the 2019 fire reversed this process. First, we undertook a field survey to determine shrub mortality and seedling establishment following the 2019 fire. Next, we used dendrochronology to determine the age of fire-killed shrubs that had recruited after the previous fire. We then analyzed historical aerial photography to track the recovery of Scrub communities since the establishment of this cohort. We discuss the implications of these findings for the ecological drift and fire cycle models and consider how this new information can inform sustainable fire management.

2. Materials and Methods

2.1. Study Area

Blakes Opening is a 315 ha Sedgeland tract located within wet Eucalyptus forests between the Huon River and the lower northern slopes (50 to 500 m asl) of the Picton Range on the eastern fringe of the Tasmanian Wilderness World Heritage Area (TWWHA) (Figure 1a). The region has a cool, moist, temperate climate (mean annual temperature of 10.4 °C and mean annual precipitation of 1709 mm at a nearby climate station at Warra on the Huon River). In 2019, the area was affected by a large forest fire, ignited by lightning, which burned 64,000 ha of wet eucalypt forests and the entirety of Blakes Opening (Figure 1b). A full description of the study site is provided by Bowman et al. [12].

2.2. Field Samples

2.2.1. Focal Plant Communities and Shrub Species

The study landscape has three main plant communities: wet Eucalyptus forest, Scrub, and Sedgeland [12]. These communities are differentiated by floristics and structure, although there is some intergrading amongst them. The Sedgeland has scattered low shrubs above a continuous ground cover of sedges, whereas the Scrub has a very high density of tall shrubs with a sparse ground cover. The Scrub community is restricted to the forest edge and in gullies in the Sedgeland (Figure 1). We focused on four myrtaceous shrub species: Leptospermum glaucescens, L. scoparium, Melaleuca squamea, and M. squarrosa. These species are dominant canopy-layer shrubs or small trees in Sedgeland and Scrub communities. These shrubs have contrasting responses to fire, with L. glaucescens and M. squamea considered post-fire obligate seeders and L. scoparium and M. squarrosa considered resprouters [12]. None of these species has a soil seedbank; rather, the seeds are held in robust woody fruits.

2.2.2. Shrub Mortality and Seedling Establishment

The field survey was carried out two years after a wildfire burned the area in January and February 2019, and the survey process has been described in detail by Bowman et al. [12]. Here, we used a small subset of their data relevant to understanding shrub dynamics in Sedgeland and adjacent Scrub communities, which were differentiated in the field by the dominance of Gymnoschoenus and the composition and height of the shrub layer (Balmer 2010).
Briefly, there were four sample areas, 10–20 ha in size, positioned at approximately equal intervals along the Sedgeland–Scrub–Forest boundary (Figure 1c–e). Within these areas, 25 transects were positioned to provide a stratified sample of Sedgeland and Scrub, based on a visual assessment of dominant vegetation using Google Earth. An additional 14 transects were regularly placed (c. 250 m apart) across the whole of the Sedgeland opening to connect the four sample areas (Figure 1c). Of the total of 39 transects, 24 were in Sedgeland and 15 were in Scrub. To estimate the pre-fire density, size, and species composition of all but the smallest woody plants, while ensuring that vegetation was representatively sampled, we used transects that were 30 m long and assessed in six 5 m segments.
The density, heights, and survival rates of our four focal species were obtained from a survey of shrubs, defined as small woody plants ≥0.5 m in height and ≤10 cm in diameter at breast height (DBH) [12]. Within each 5 m segment, the five shrubs nearest the transect midline were selected, and the ground area they occupied was calculated from the x and y distances of the furthest stem from the start of the midline in that 5 m segment. The shrub density in the segment was calculated from this ground area [12]. The five shrubs were identified to species level, and their overall height (whether live or dead) was measured. The status of each plant was recorded as dead (no live foliage) or alive (noting those that were resprouting after having been top-killed). All but three of the live individuals had been top-killed and were basally resprouting. Therefore, resprouting rates were very similar to survival rates, and we present only the latter. We calculated the indicative density for shrubs of the four focal species by pooling their counts in each community (Sedgeland or Scrub) and dividing by the total search area in that community.
Seedlings were defined as post-fire germinants of woody plants between 0.1 and 1.5 m in height. The height and species identity of all seedlings were recorded for each 5 m long segment, the width of which varied from 0.1 to 4 m based on seedling density.
We tested whether the heights of shrubs common to both communities were statistically different using linear modelling and Akaike’s Information Criterion modified for a small sample size (AICc), which balances model fit and parsimony [13]. The linear model with ‘Community’ as a predictor of height (log-transformed) was considered to be statistically supported if its AICc was lower than that of the intercept-only model by at least 2 [13]. Differences among communities in terms of survival were tested using binomial generalized linear models (logit link). The model with ‘Community’ as a predictor of the binomial response variable ‘alive’ was considered statistically important if its AICc was lower than that of the intercept-only model by at least 2.

2.2.3. Growth Rings

Growth rings were used to estimate the age and establishment date of mature shrubs: Tasmanian woody plants typically produce annual growth rings in keeping with the temperate, mid-latitude climate with cool winters. We were not permitted to sample live trees because Blakes Opening is part of the TWWHA, so we sampled only trees killed by the 2019 wildfire. We sampled all dead trees of the four target species within ~20 m radius of the center of the transects used by Bowman et al. [12]. Stem sections, or wedges from large-diameter individuals, were taken from 615 trees as close to the soil surface as possible, while avoiding any buttressing at the base of the tree. The samples were sanded using standard dendrochronological methods [14]. In total, 332 samples from Sedgeland and 175 from Scrub were considered suitable for counting rings (53–229 samples for each of the four species). The rings were clear and regular and were able to be counted visually. They appeared to be annual, with the large cells and vessel elements characteristic of early season growth, followed by small cells and thickened cell walls typical of later season growth. Stems were also inspected for fire scars, and the approximate year of the fire was noted.

2.3. Aerial Photographic Analysis of Woody Thickening

Land Tasmania [15] provided orthorectified aerial photographs (±5 m accuracy) of Blakes Opening for the years 1980, 1981, 1982, 1984, 1986, 1991, 1995, 2000, 2002, 2005, and 2010. As the statewide imagery program ended in 2010, no aerial photographs after that year were available. We resampled those images to a common resolution of 1 m and converted them to panchromatic to maximize comparability. The images were classified by combining spectral and textural information, which has been shown to provide accurate vegetation classification in Tasmanian habitats [12,16]. Following the approach described in Bowman et al. [12], we first used the package glcm [17,18] to calculate a Gray-Level Co-Occurrence Matrix (GLCM) [19,20], which provides information on texture parameters, representing measures of the smoothness, coarseness, and regularity of an image. Texture layers were then combined with the resampled aerial photographs to classify each pixel as either ‘Forest’, ‘Scrub’ (non-forest areas with a high density of shrubs), or ‘Sedgeland’ (non-forest areas with low shrub density) using Random Forest (RF) and Support Vector Machine (SVM) algorithms and the superClass function of the RStoolbox R package [21]. When visible, fire scars were manually mapped. Finally, field transects were associated with their corresponding vegetation class, as mapped for 1980, the first year investigated, based on their geolocation. More information on the algorithm choice, tuning parameters, and post-processing adjustments can be found in Bowman et al. [12].

3. Results

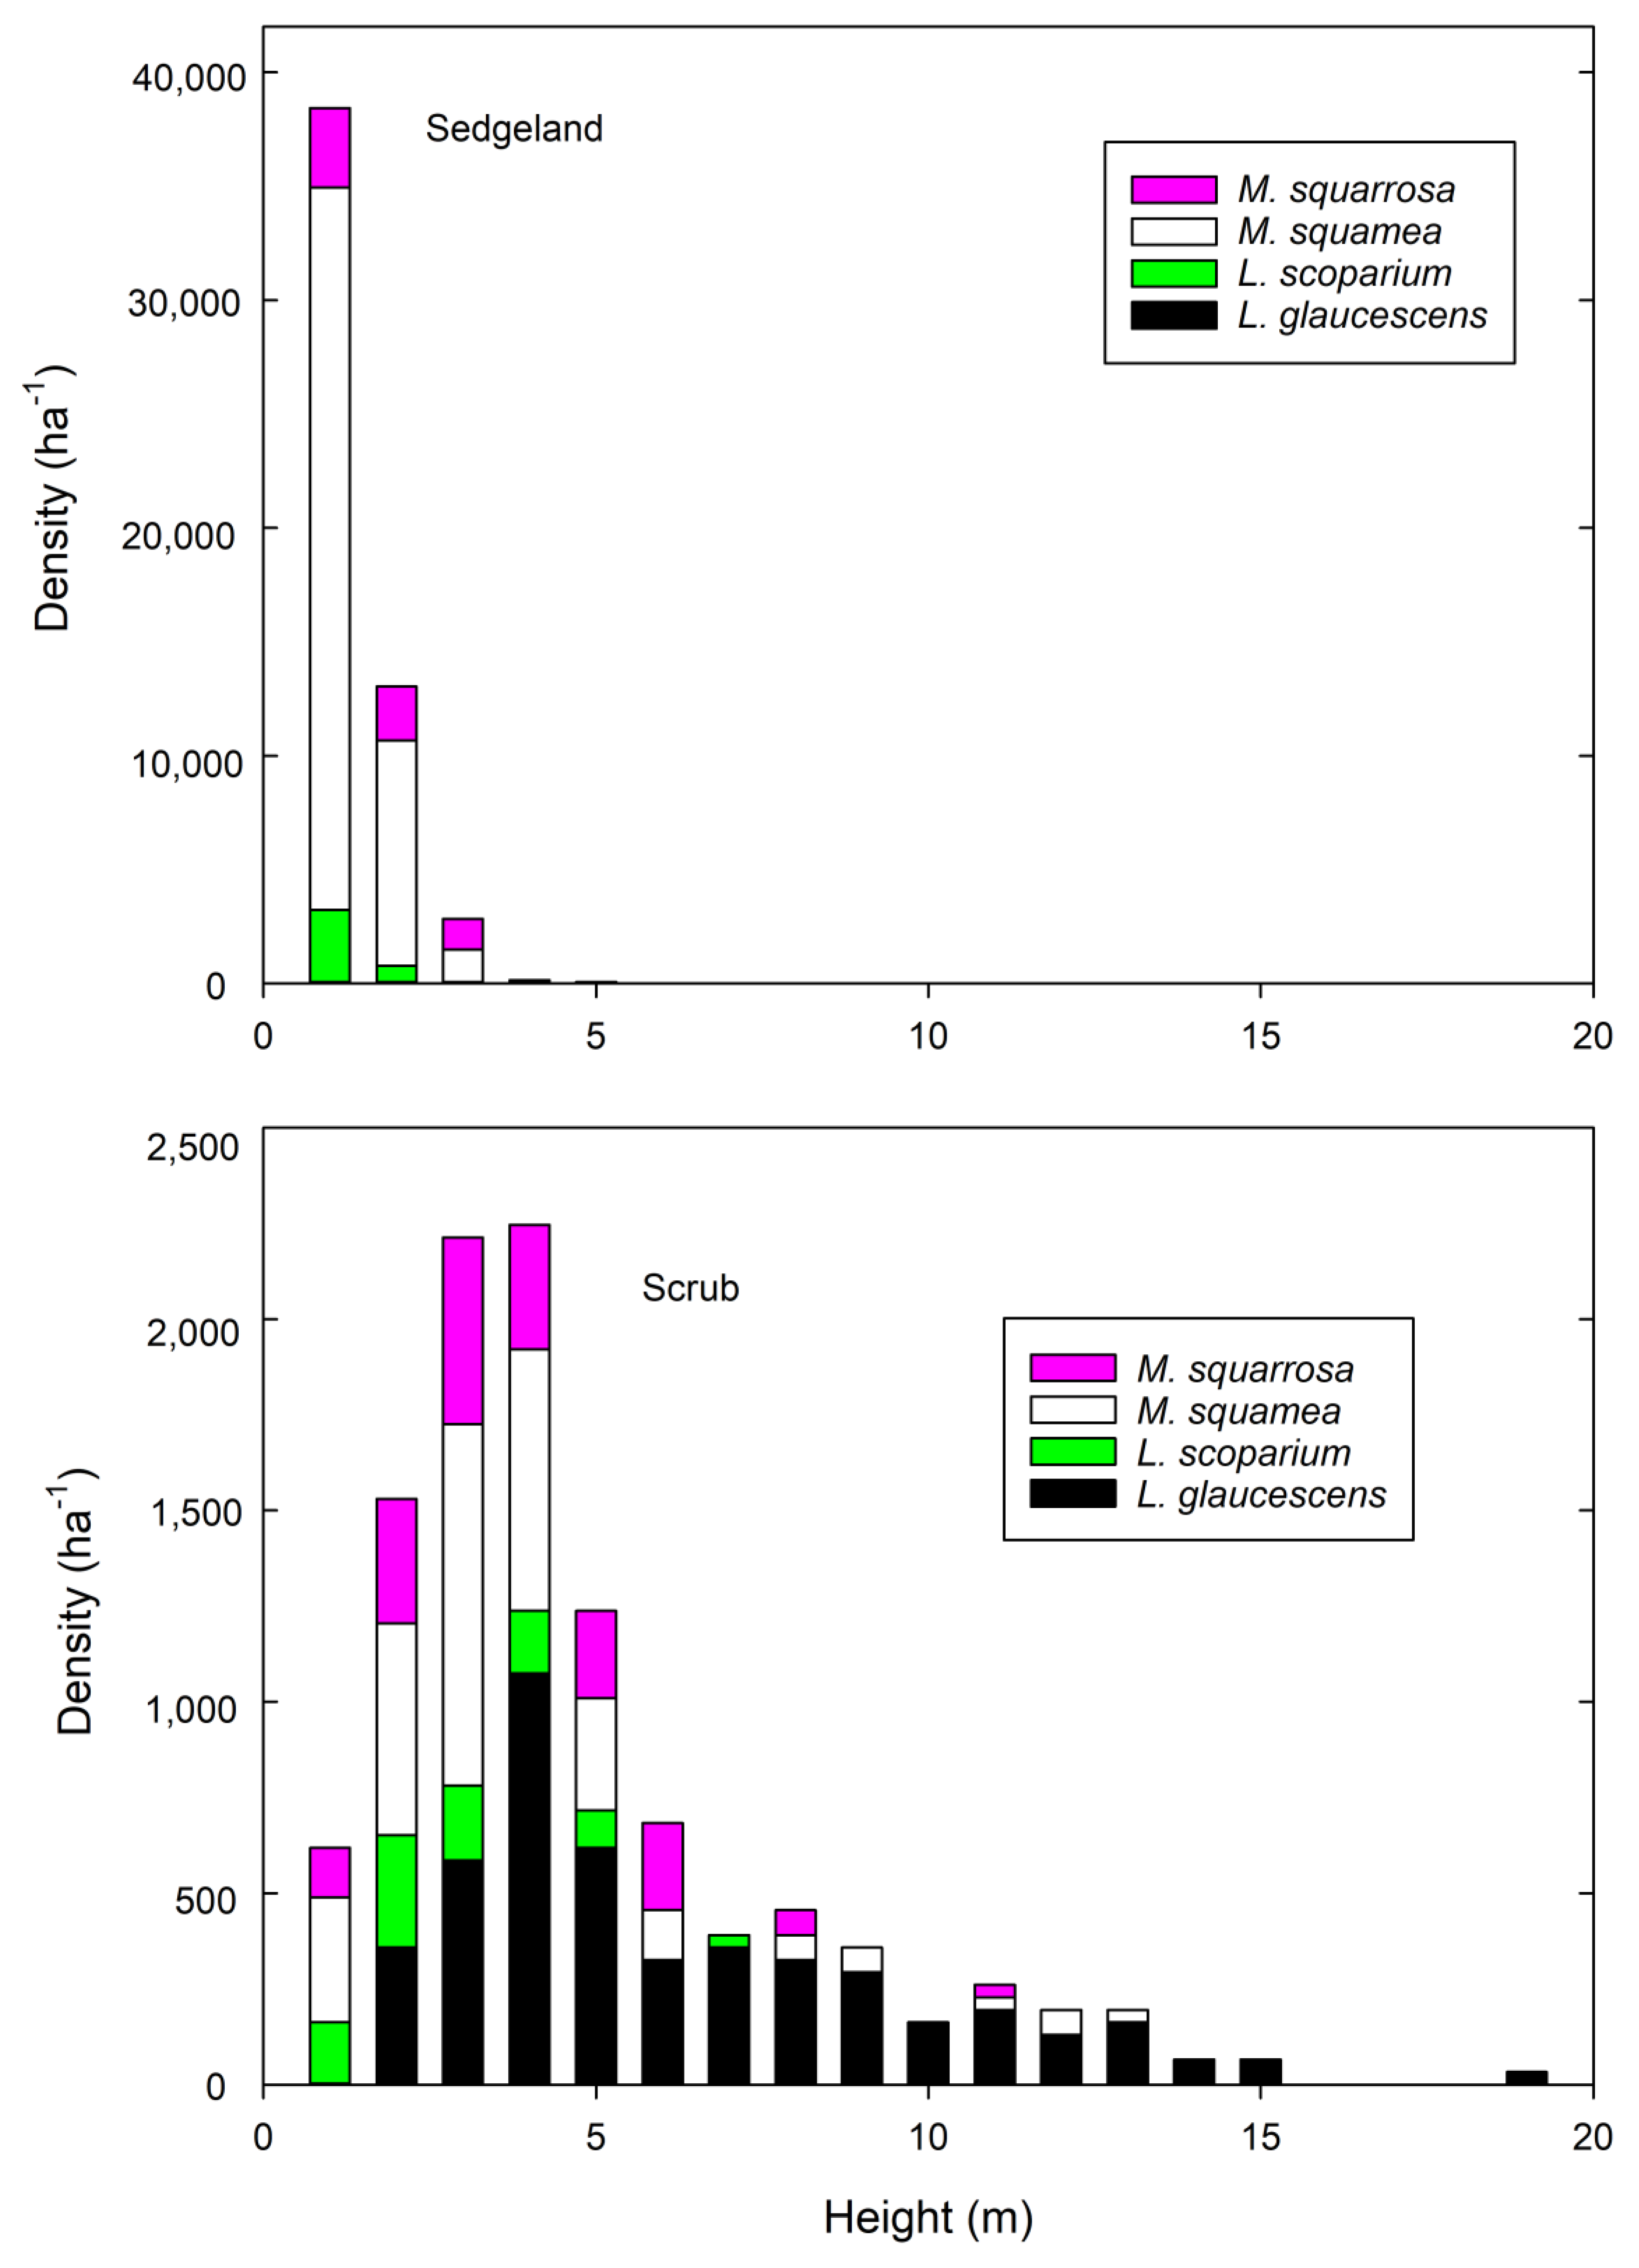
3.1. Shrub Height and Abundance

Reflecting the intergrading between these communities on their boundaries, there was some overlap between the Sedgeland and the Scrub in the 0–5 m size classes of the height distribution and in the abundance of the four myrtaceous shrubs top-killed by the fire (Figure 2). The shorter-statured Melaleuca squamea shrubs were most abundant in the Sedgeland, while the taller Leptospermum glaucescens were most abundant in the Scrub community. Linear modelling showed that the heights of the three species that occurred in both communities statistically differed between the communities, confirming that community differences were not simply a result of different species composition (Table 1).

3.2. Shrub Post-Fire Recovery

Only three shrubs were not top-killed by the 2019 fire, with marked differences in post-fire vegetative and seedling recovery amongst the four species. There were statistically significant differences in survival, with no recovery of Leptospermum glaucescens or M. squamea, but a strong post-fire resprouting response in Leptospermum scoparium and M. squarrosa (Table 1). All species except the resprouter M. squarrosa had post-fire seedling establishment. M. squamea, found in both Sedgeland and Scrub communities, achieved the highest overall densities, with L. glaucescens in the Sedgeland having the lowest density (Table 2). Combined, these results show that M. squamea can be considered a Sedgeland post-fire obligate seeder, Leptospermum glaucescens can be considered a Scrub post-fire seeder, and the other two species are habitat generalist post-fire resprouters.

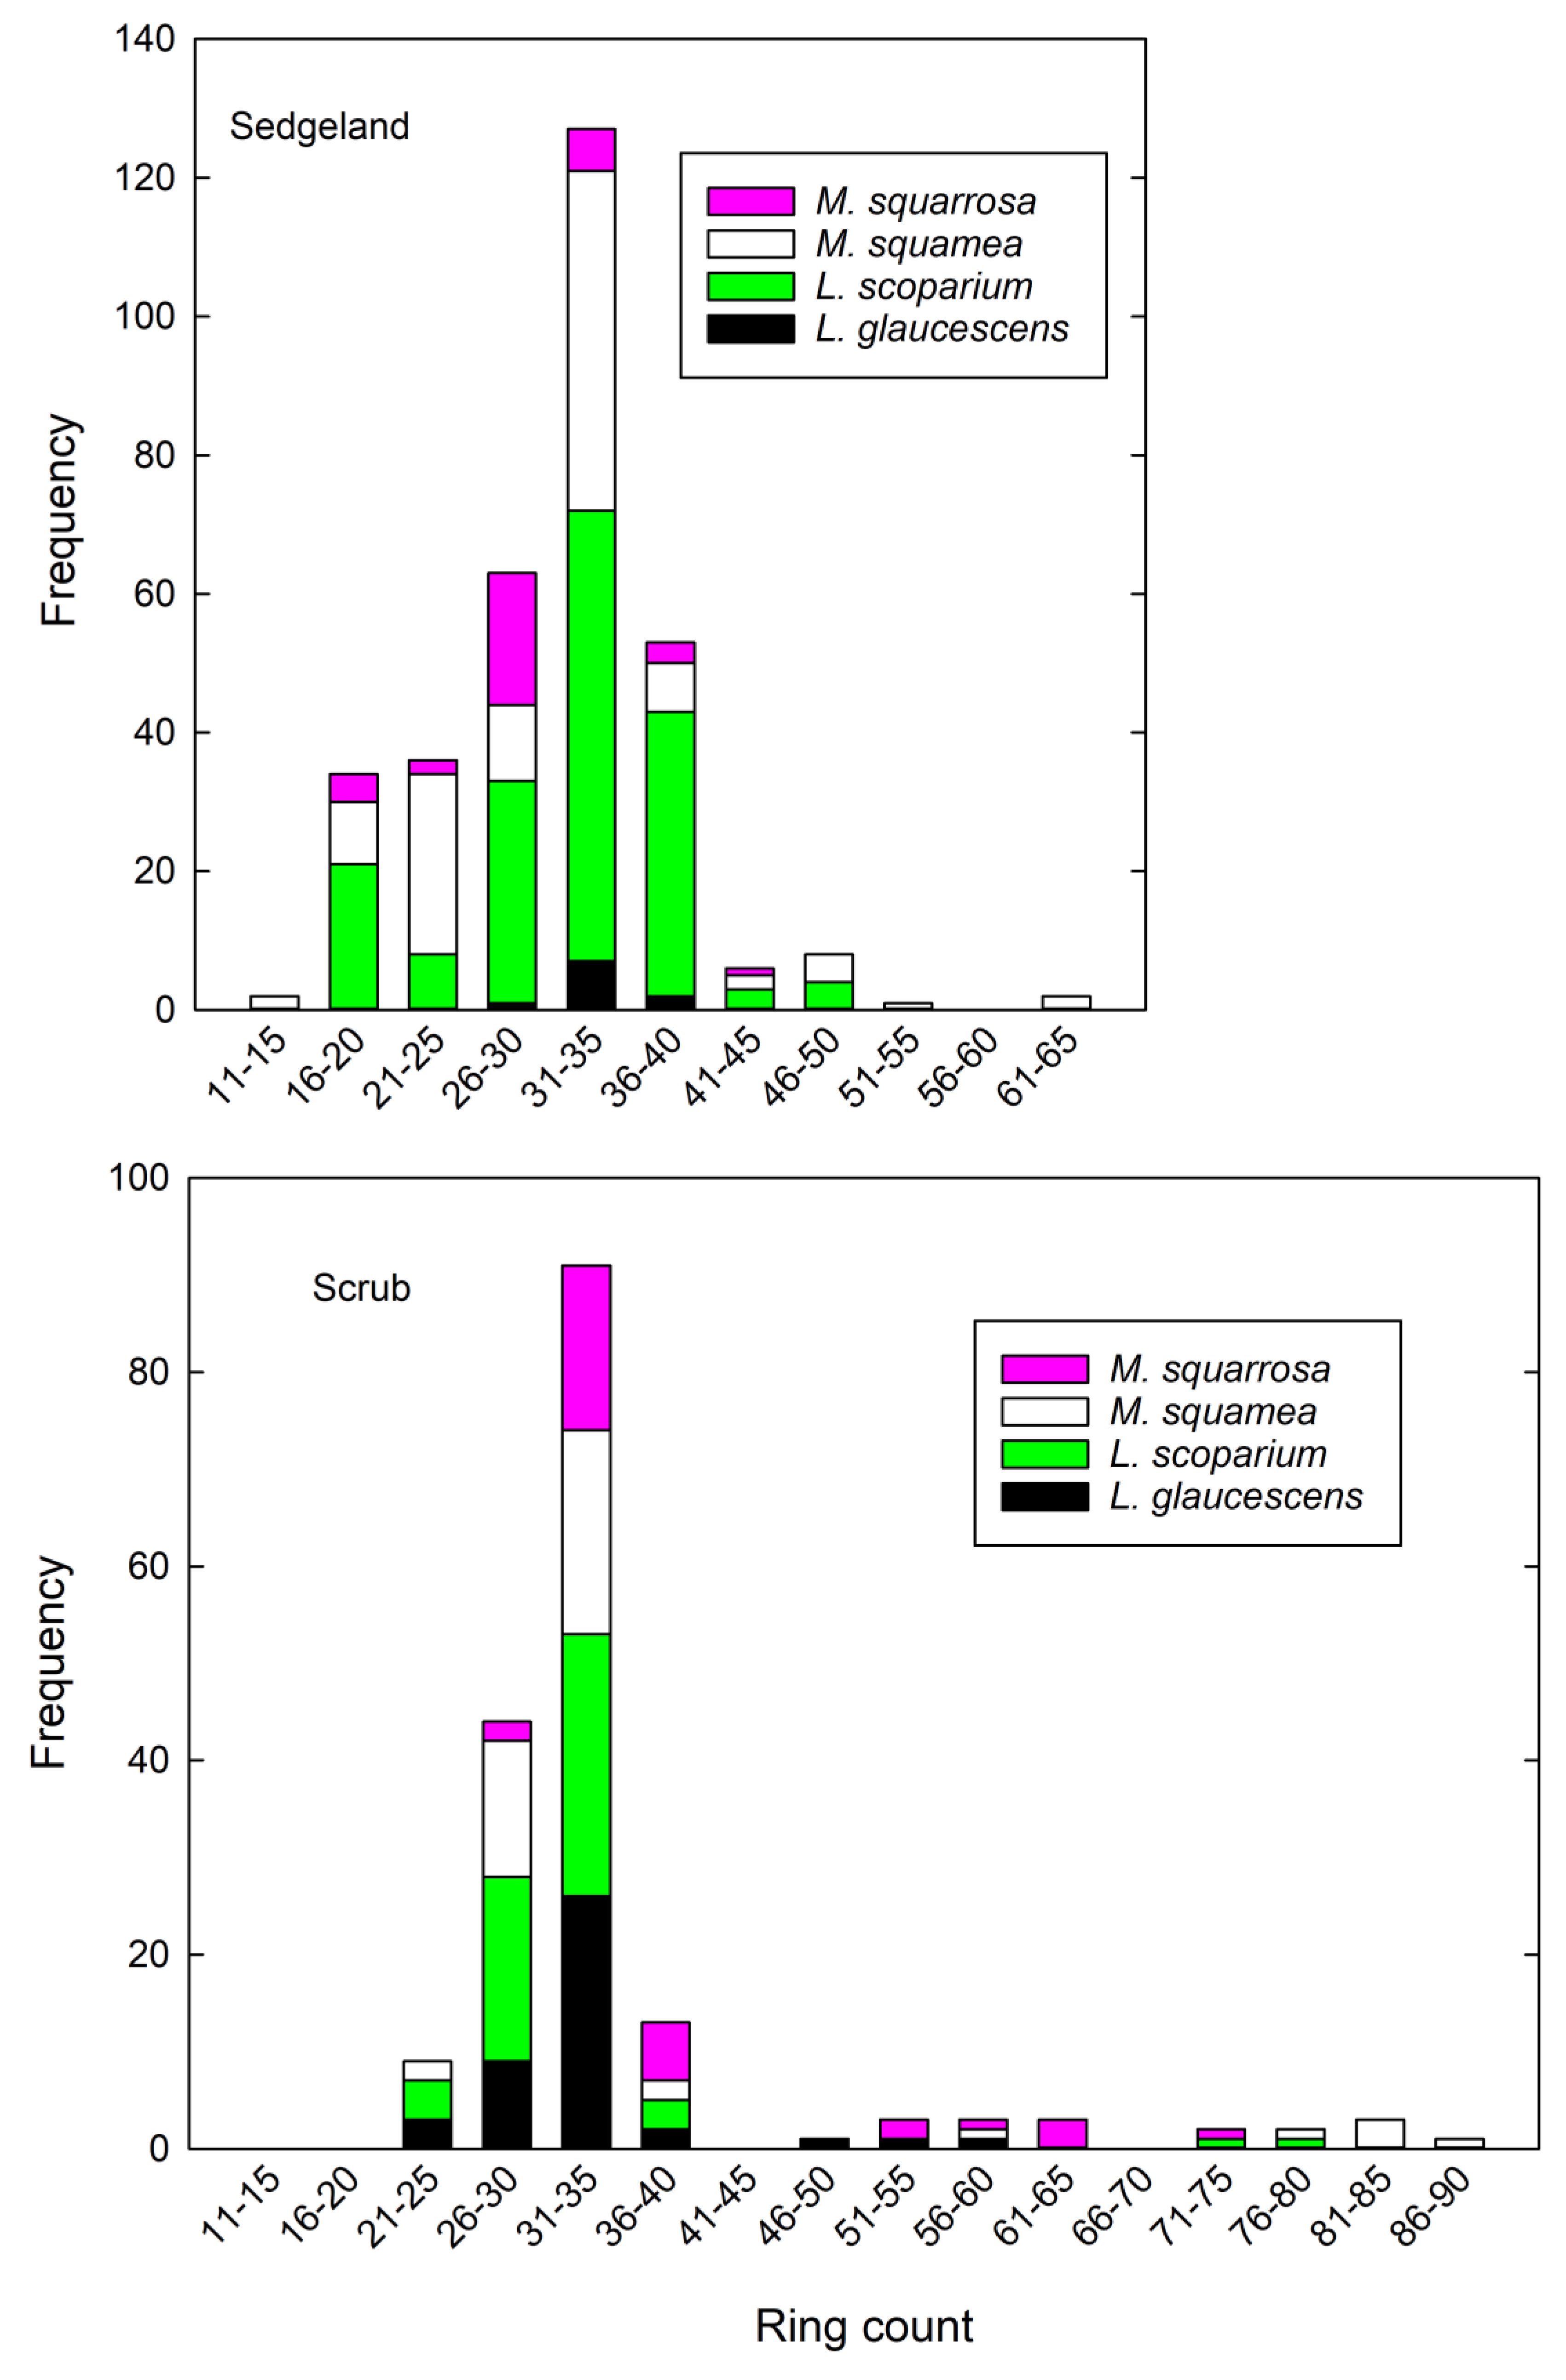
3.3. Dendrochronology
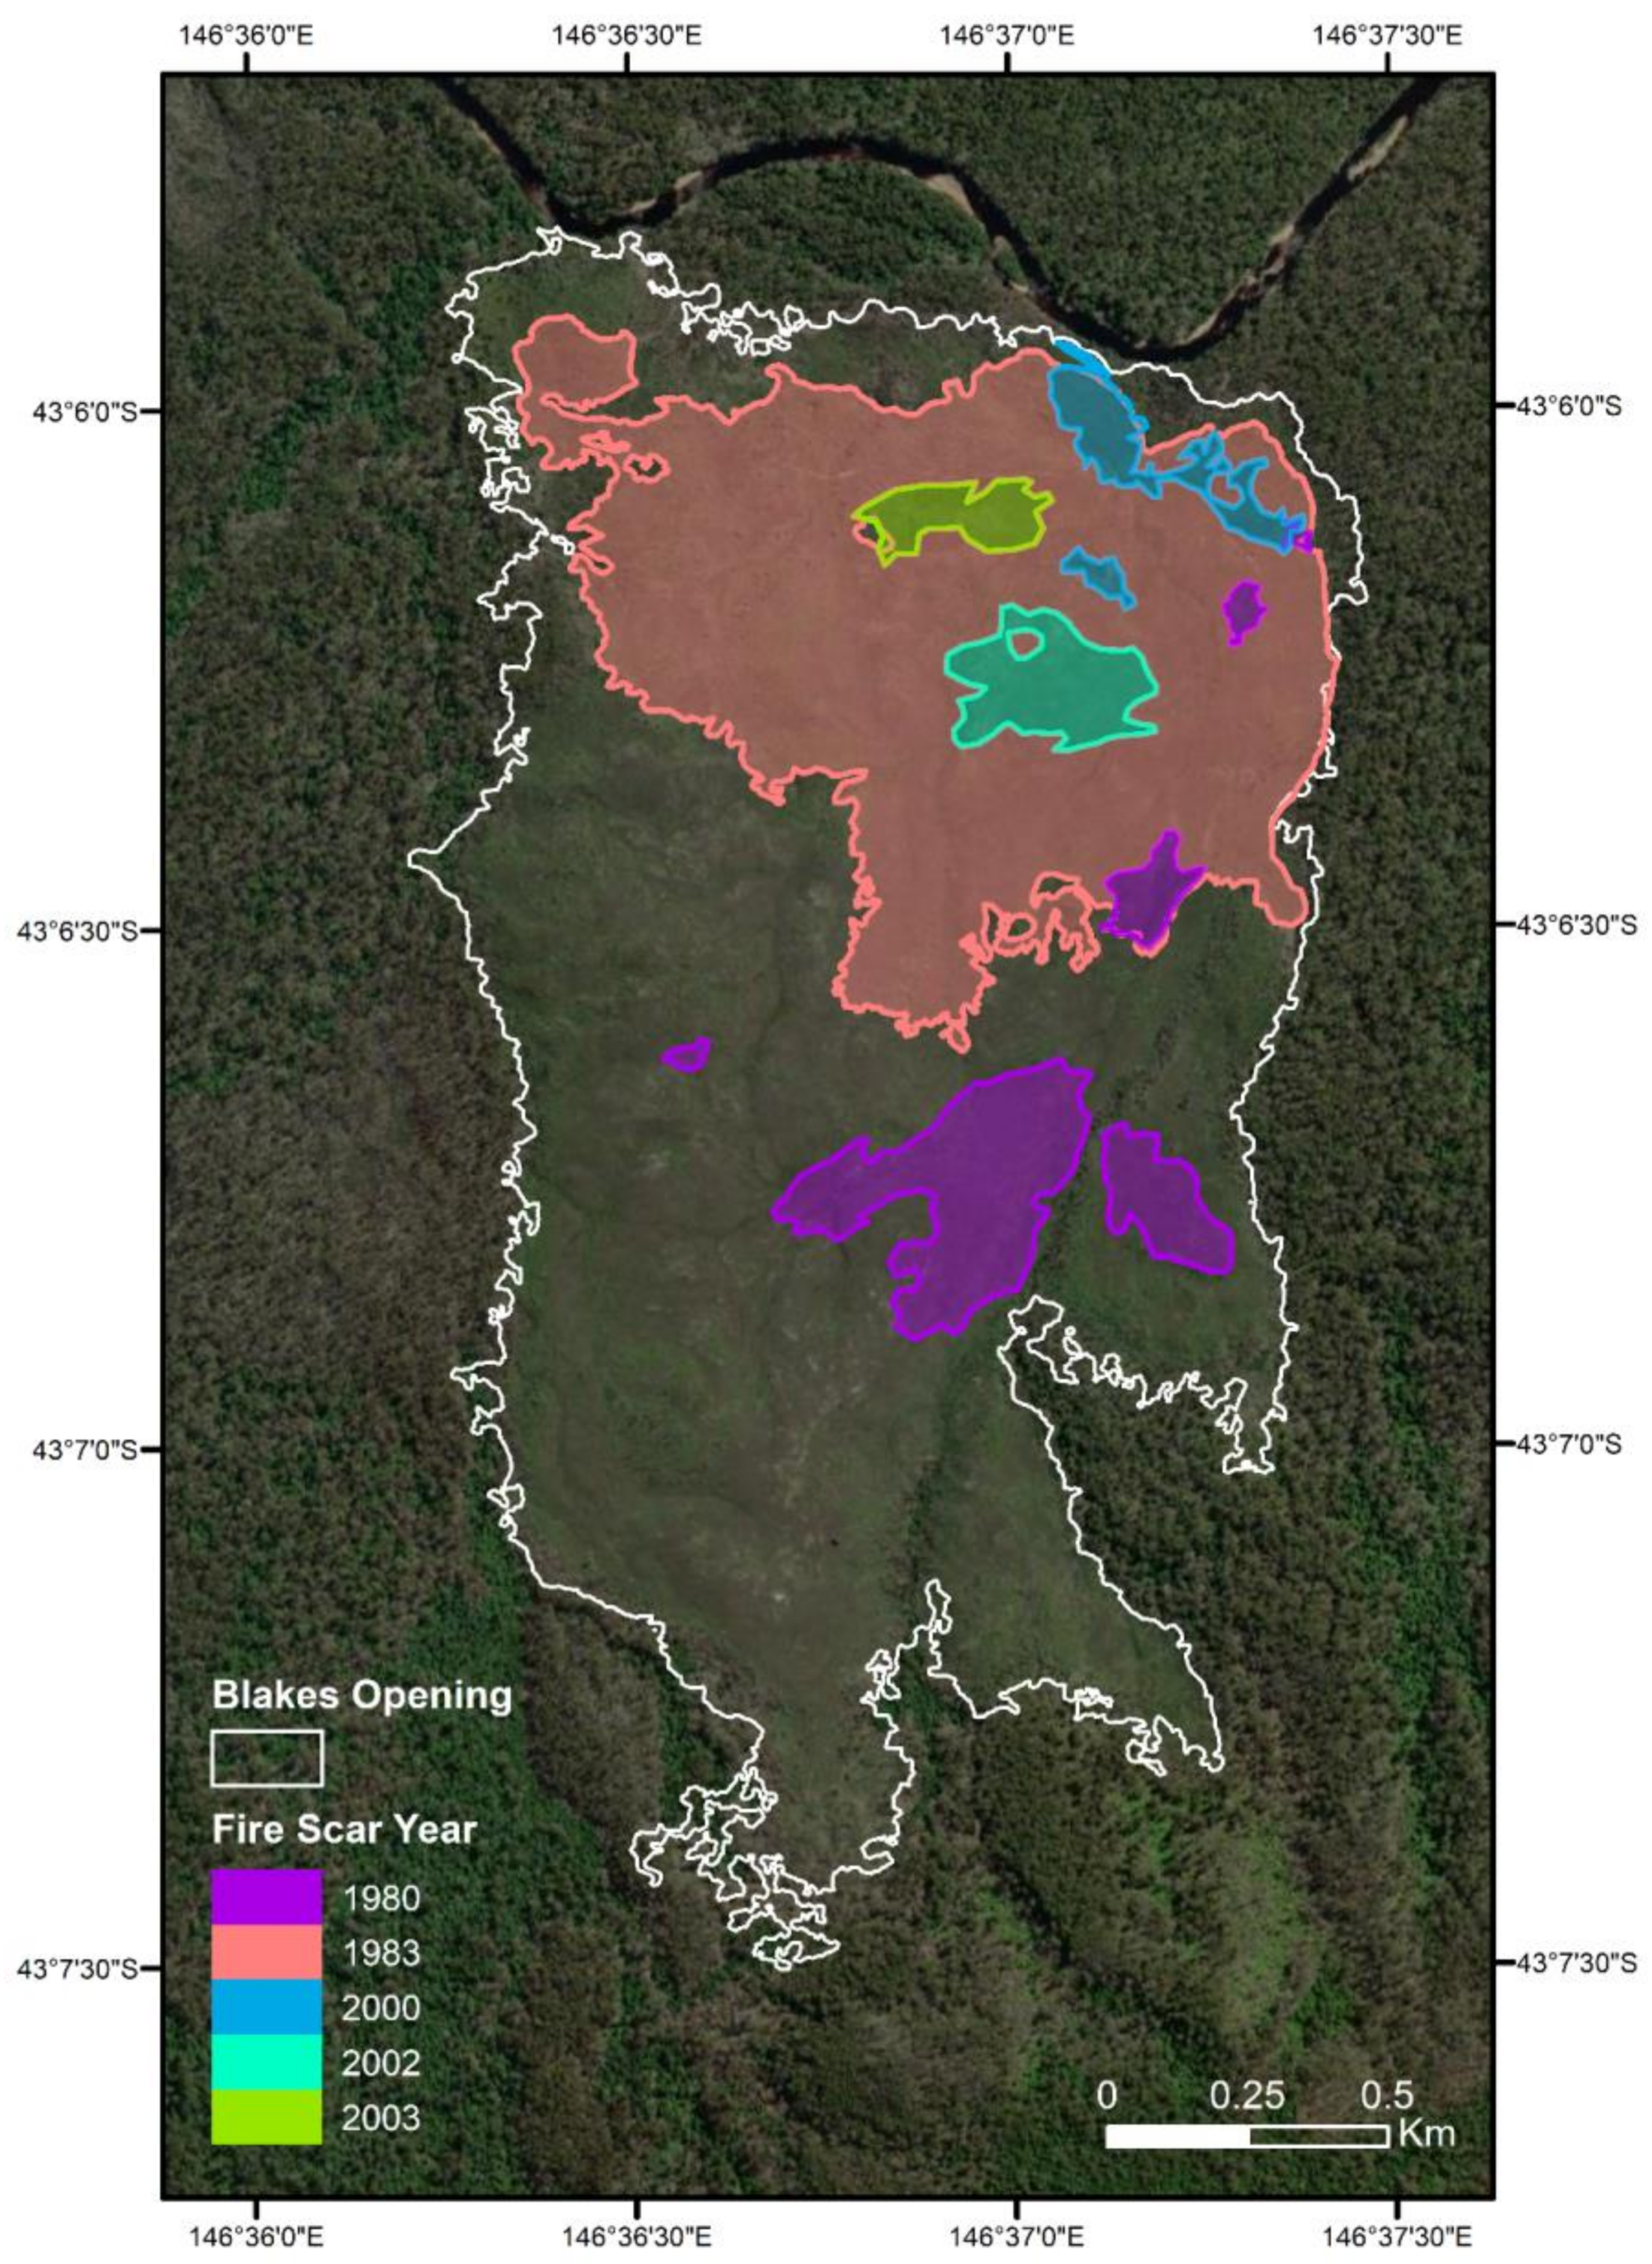
Aging of the stems revealed that these shrubs form a distinct cohort that was initiated approximately 40 years ago. There are also cohorts of younger stems (between 15 and 30 years) in the Sedgeland, and much less so in the Scrub community, with a very low density of much older stems (up to 90 years old) (Figure 3). Fire scars were apparent in stems from 28% of the 39 transects, with fire recorded in the early 1980s (15% of the transects) and early 2000s (13% of the transects); more precise resolution dates are impossible given the quality of the fire scars.

3.4. Fire History

The inclusion of imagery from 1984, not previously analyzed in Bowman et al. [12], showed the presence of a fire scar of 109 ha, covering most of the northern half of Blakes Opening (Figure 4). This was the only large fire scar recorded in the area prior to 2019. Since the 1984 photograph was taken in January and the previous image, taken in January 1982, did not show signs of fire, we assumed that the large fire occurred in either 1982 or 1983. We henceforth call that fire the ‘1983 fire’. As shown in Bowman et al. [12], all other detected fires that occurred between 1980 and 2010 were much smaller in size, ranging from 0.1 to 13 ha (mean 3 ha; Figure 4).

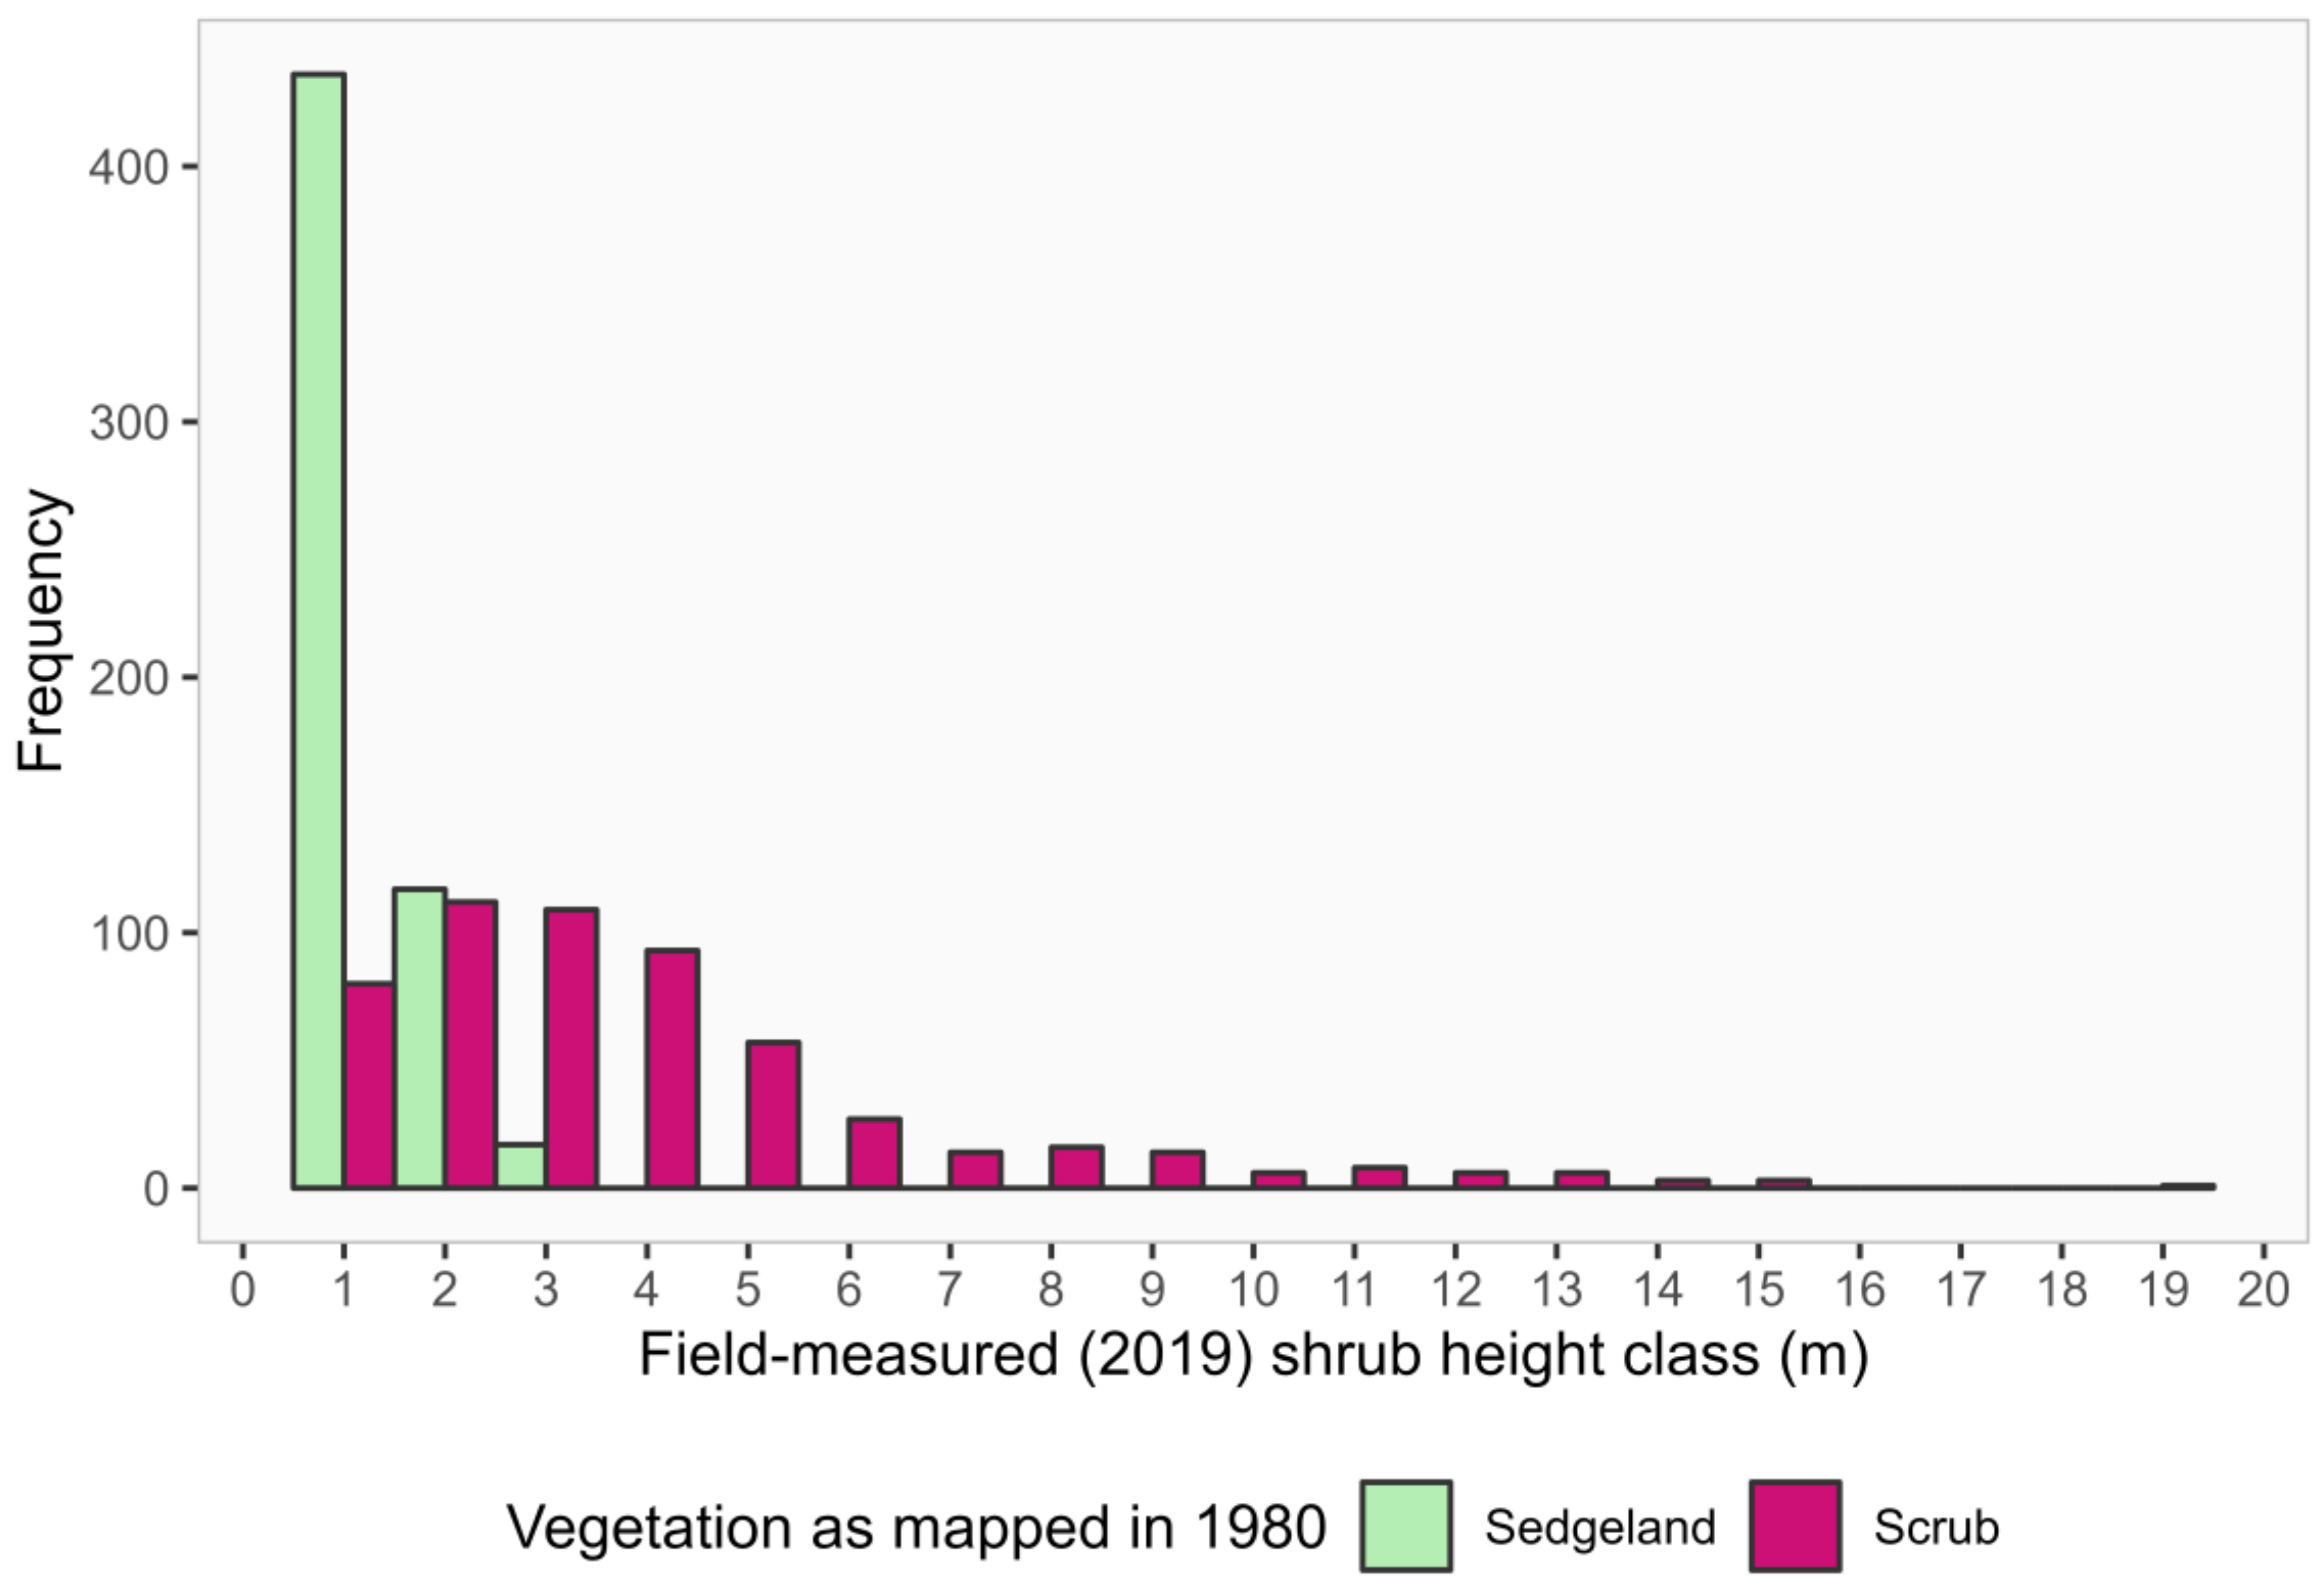
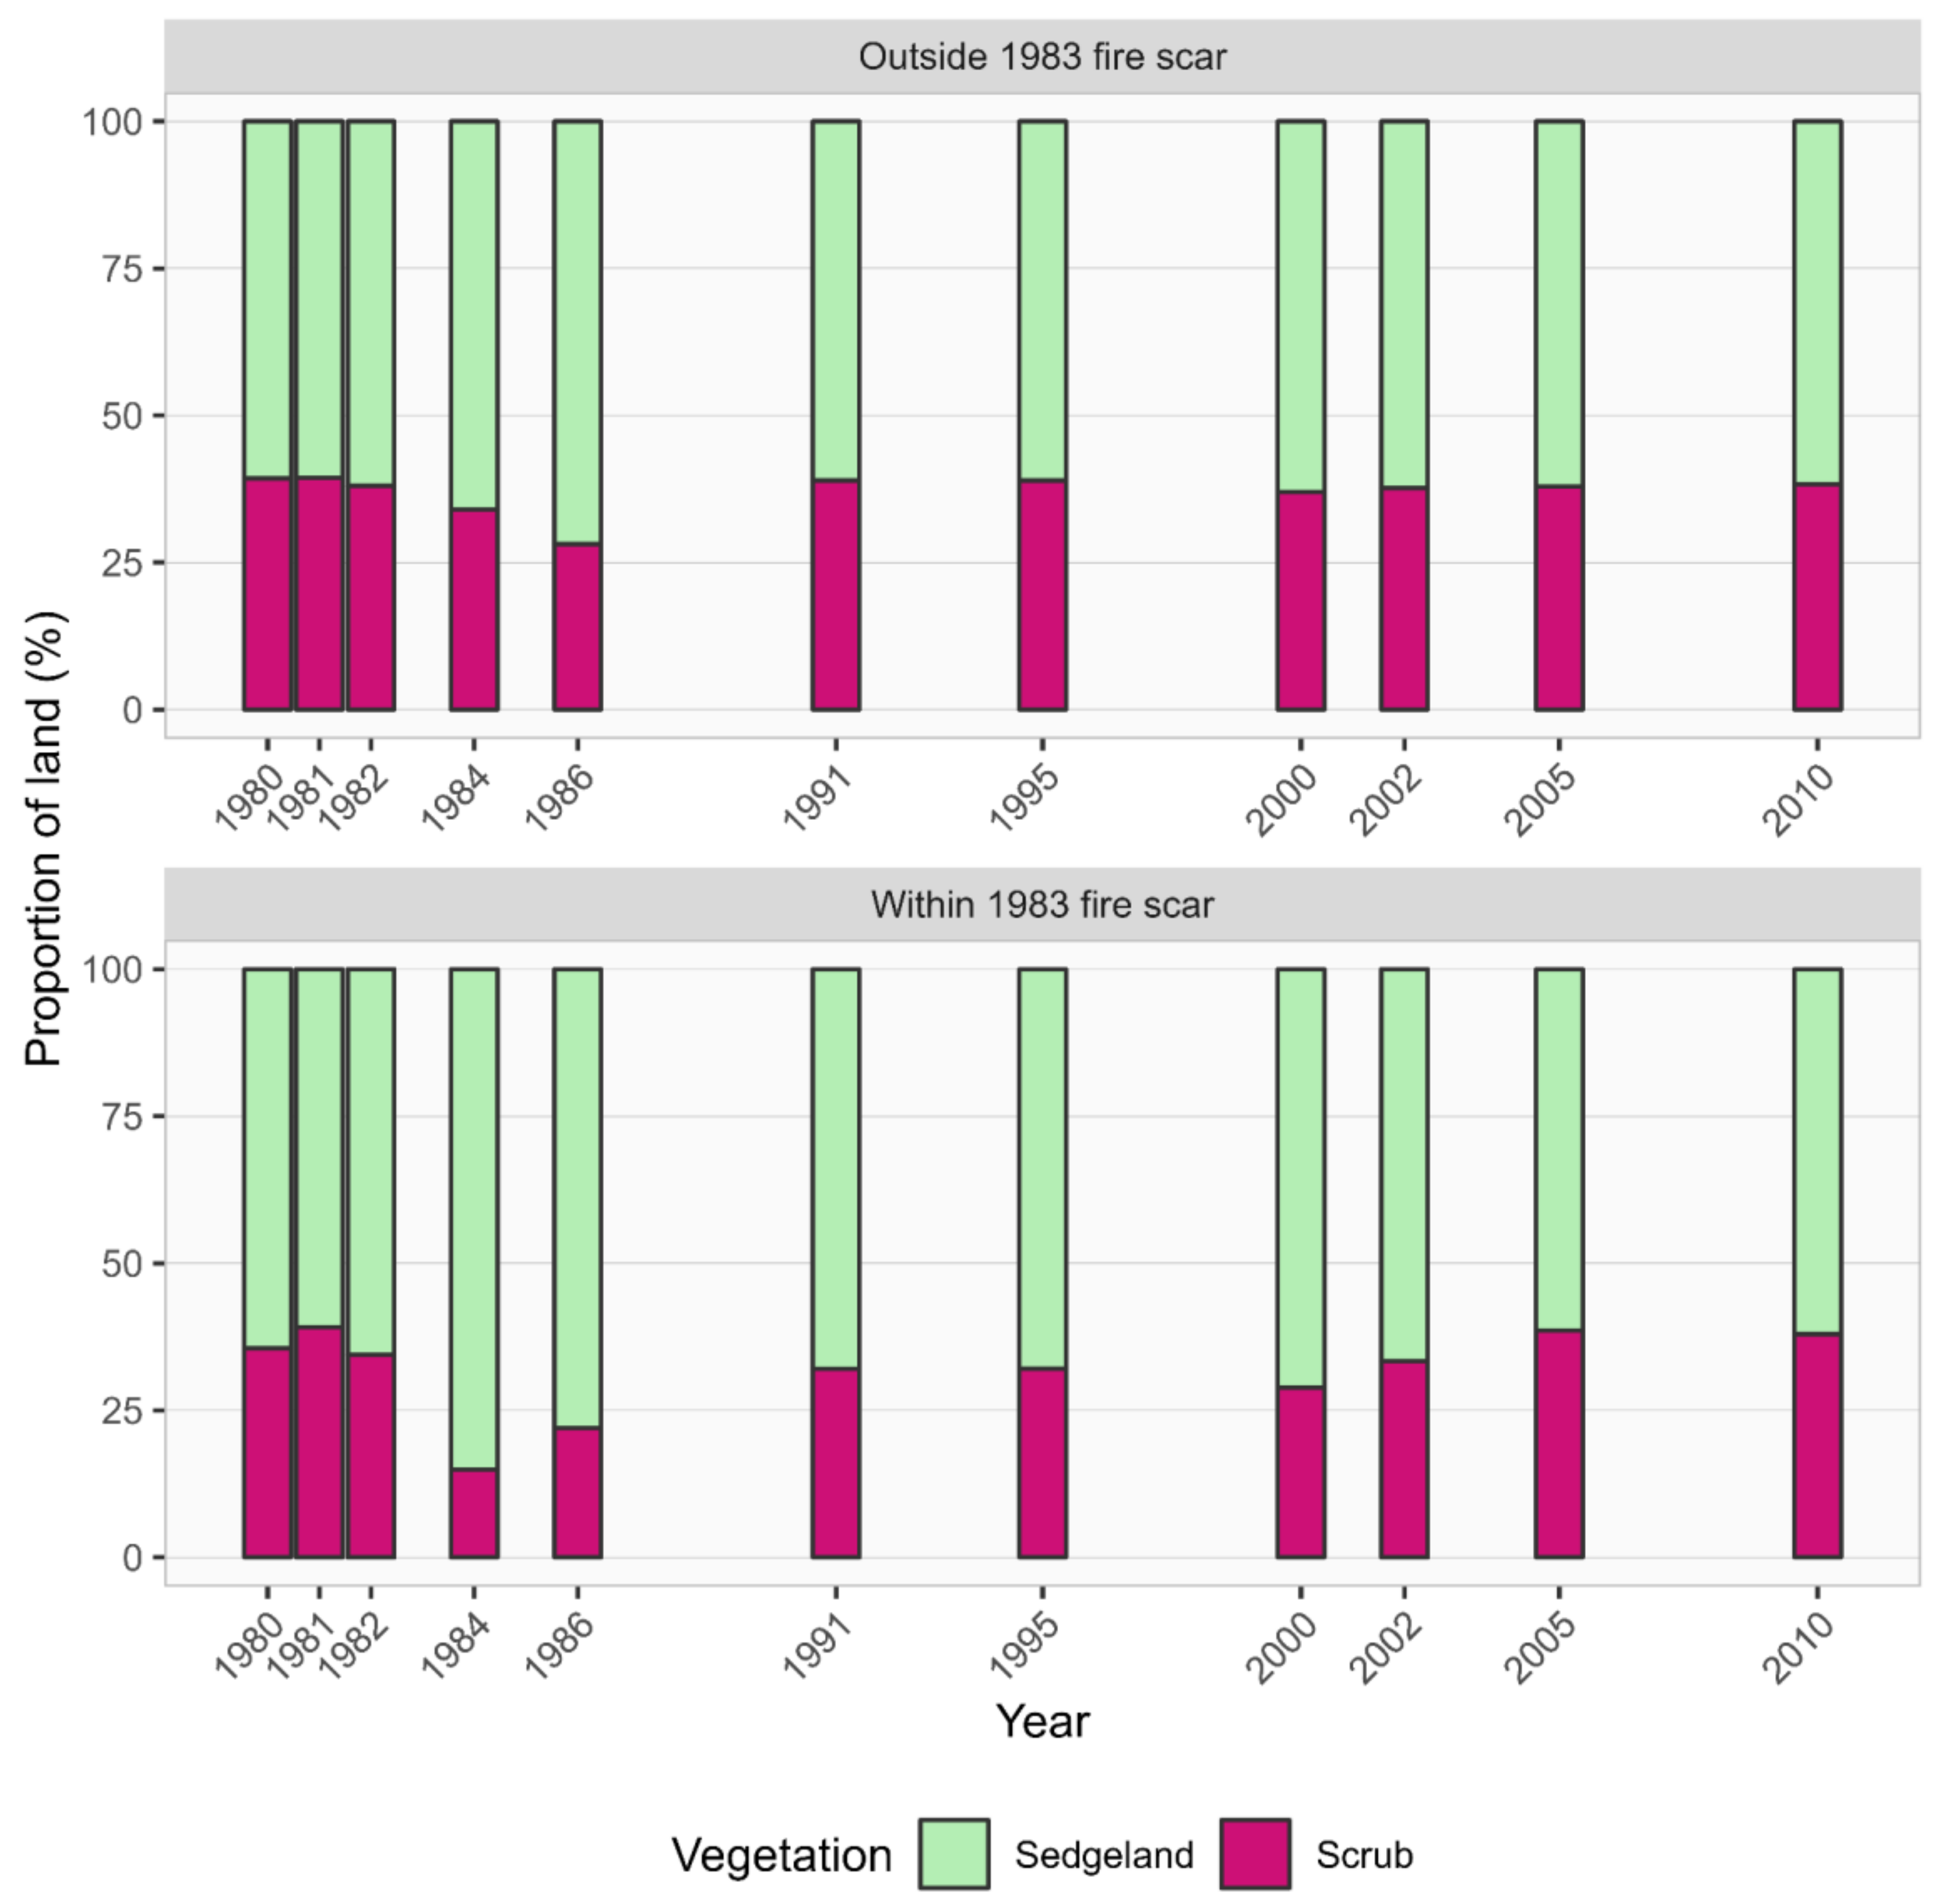
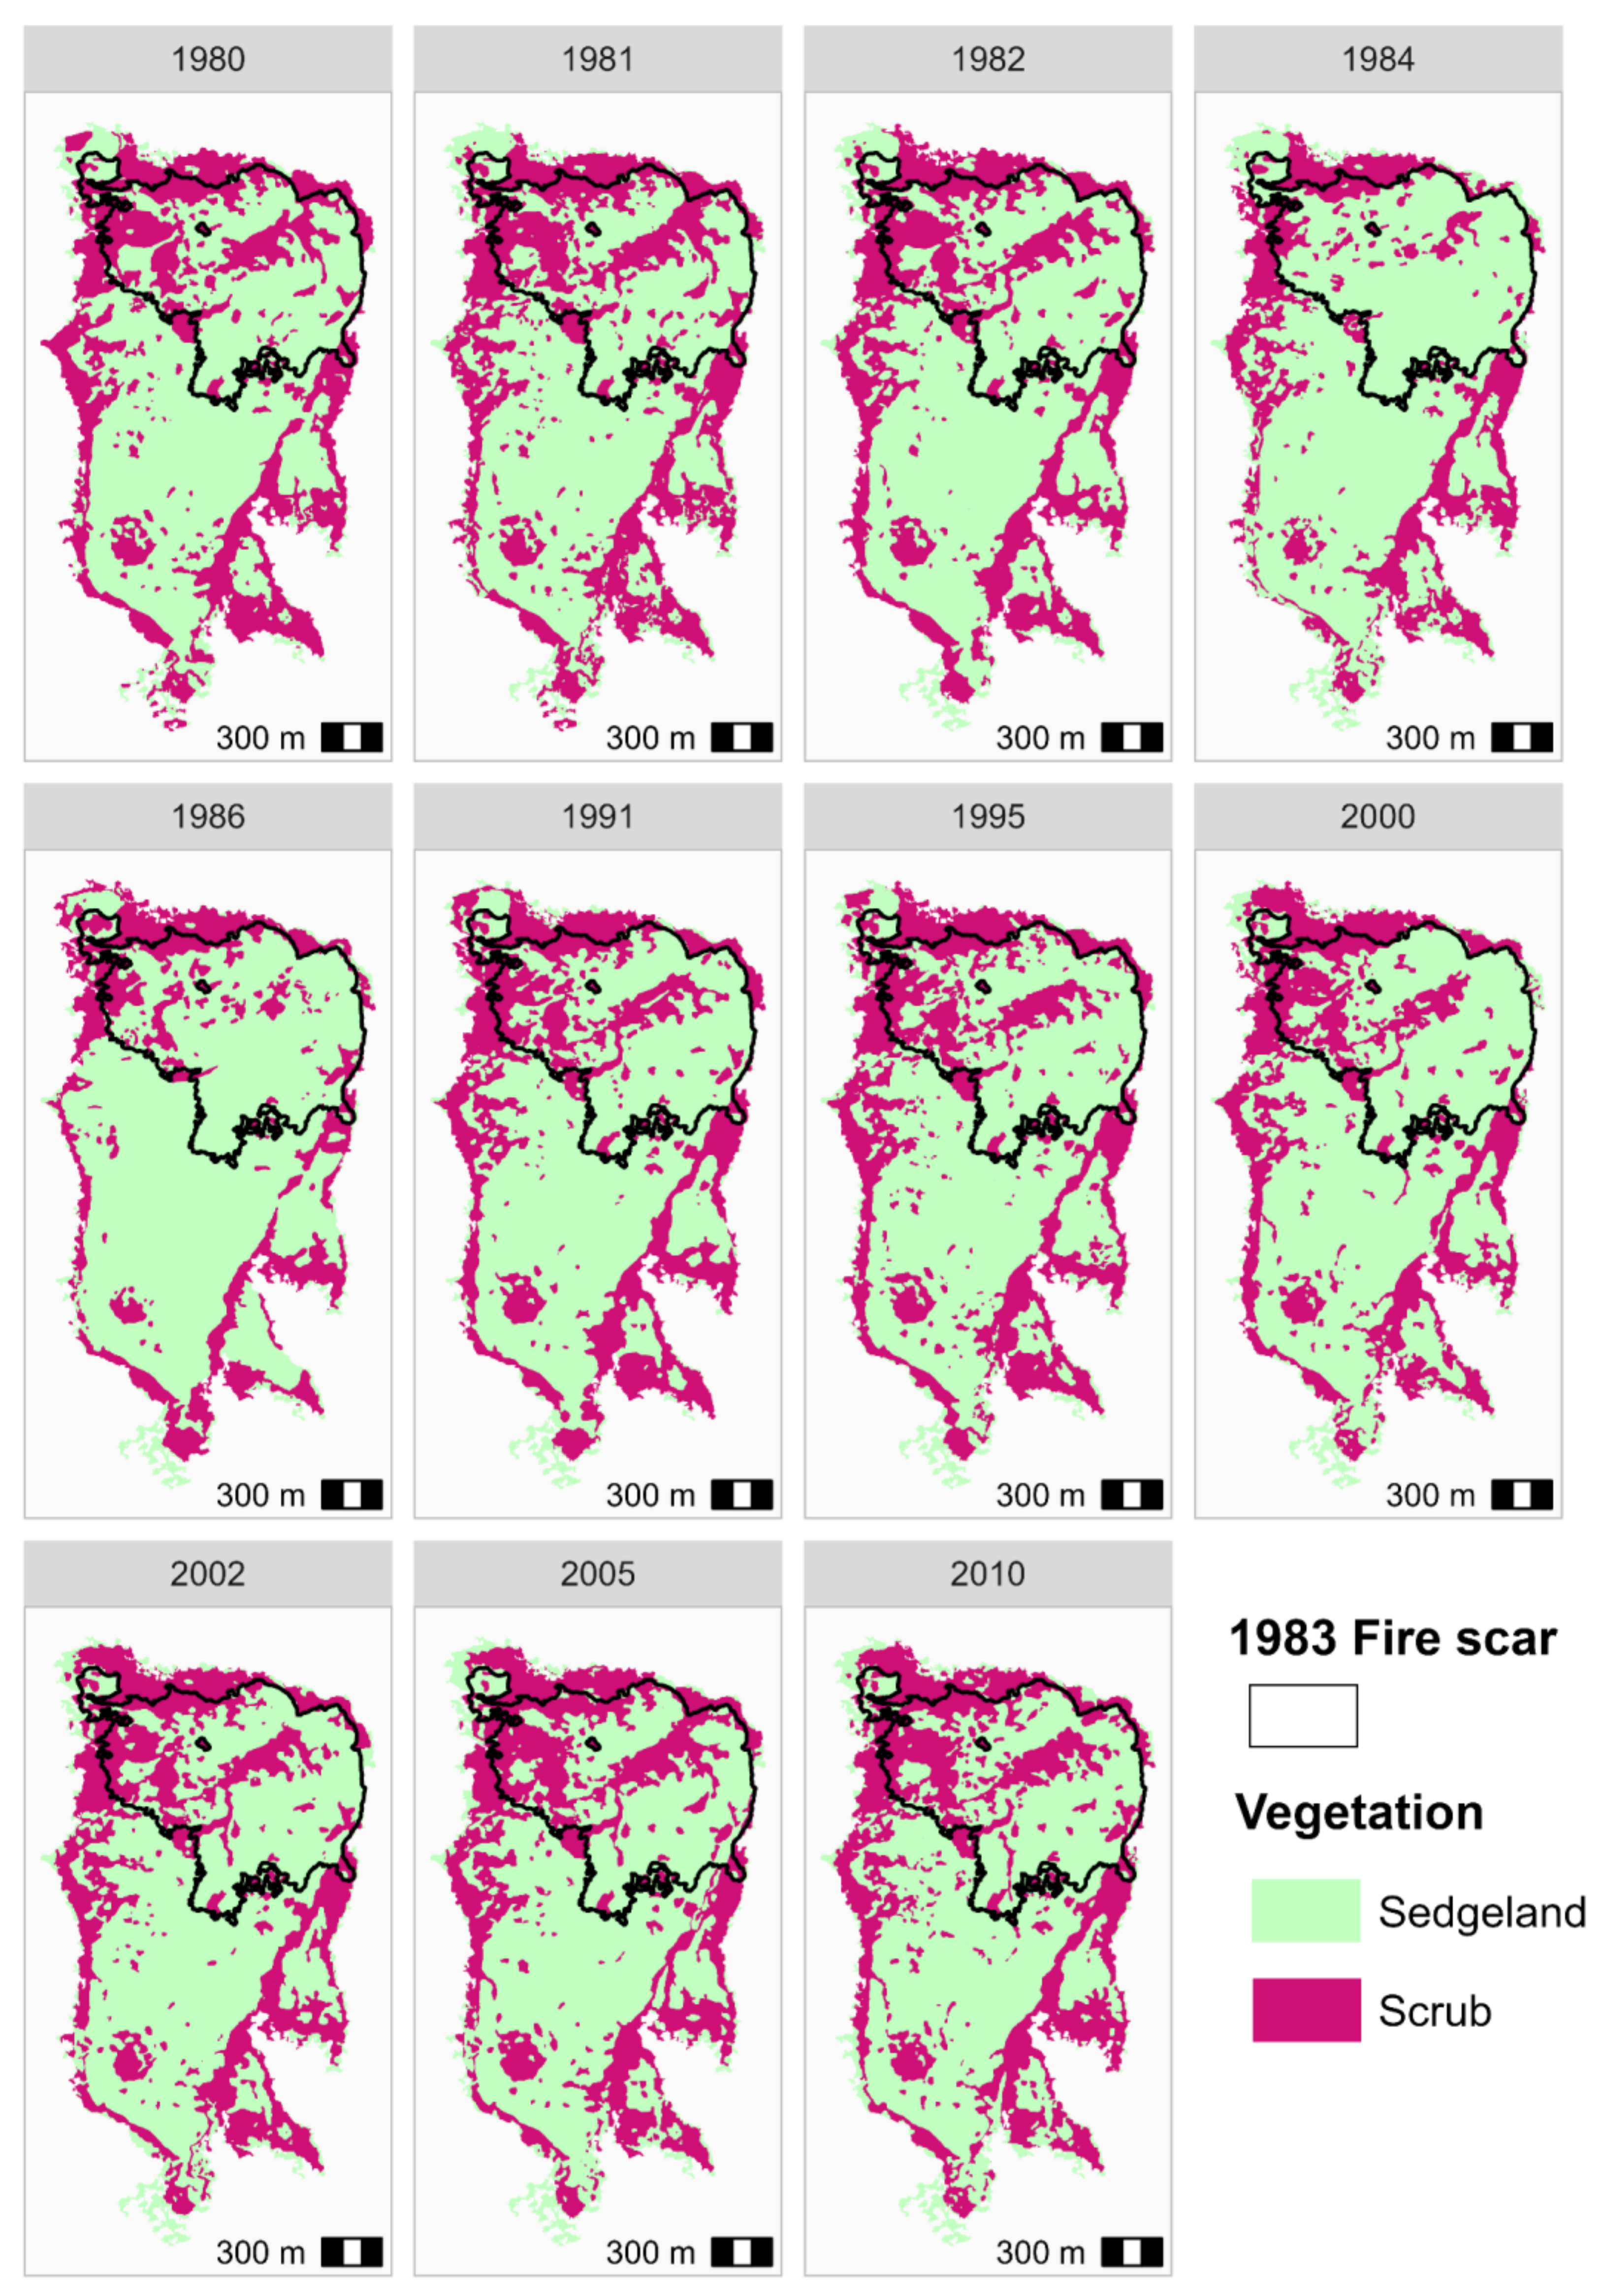
3.5. Historical Vegetation Trends

Shrubs measured in the field in 2019 were taller on transects that were classified as Scrub than on those classified as Sedgeland according to our analysis of the 1980 aerial photography (Figure 5). The average height was 0.9 m (range 0.5–2.9 m) for Sedgeland transects compared with 3.5 m (range 0.5–19 m) for Scrub transects, according to the 1980 classification.
The analysis of historical aerial photographs showed that the Scrub–Sedgeland mosaic underwent minimal changes in both (a) the proportion of vegetation classified as Scrub between 1980 and 2010 (Figure 6) and (b) the spatial distribution of these communities (Figure 7). The only substantial change in vegetation occurred in 1984, when a sharp decline in Scrub vegetation cover (from 34% to 15%) was observed within the extent of the large 1983 fire scar. This was followed by rapid recovery, and by 1991 Scrub cover returned to levels comparable with those pre-fire (32%; Figure 6 and Figure 7). Only minor fluctuations in Scrub vegetation cover and location occurred throughout the rest of the investigated time period, either inside or outside the 1983 fire scar (Figure 6 and Figure 7).

4. Discussion

The findings of this study suggest that the Scrub and Sedgeland experienced only minor changes between 1980 and 2019, with the exception being a fire that likely occurred in 1983 and burned the north half of Blakes Opening. Dendrochronology suggests that the 1983 fire caused substantial die-off with a subsequent cohort of shrub regeneration in the areas of Blakes Opening that were burned. The occurrence of shrub stems older than 36 years reflects areas that were either not burned or burned mildly in 1983. Indeed, there was a concordance between the dated fire-scarred shrubs and the areas mapped as having been burned in approximately the same years (early 1980s and early 2000s), showing that some stems can withstand some fires. However, field surveys showed near-uniform stem death of shrubs following the 2019 fire, highlighting that this fire was more severe than the previous fires in 1983 and the early 2000s (Figure 4). The fire triggered a regeneration event through prolific seedling establishment and strong post-fire resprouting. A comparison of aerial photography between 1980 and 2010 shows similar patterns in Scrub extent. The lack of aerial imagery after 2010 meant that we were unable to analyze the more recent period, including after the 2019 fire, using the same approach adopted for the available imagery between 1980 and 2010. Nonetheless, the 2019 field survey instils confidence in the historical mapping, because shrub height patterns were closely related to the classification of Scrub and Sedgeland in 1980 (Figure 2 and Figure 5). The survey also demonstrated that prolific regeneration of shrubs occurred after the 2019 fire, thereby explaining the rapid recovery of Scrub after the 1983 fire.
The overall stability in the distribution of Scrub and Sedgeland over the last 40 years is in concordance with the study by Bowman et al. [12], which demonstrated that at Blakes Opening, the forest rapidly recovered following the 2019 fire, and the boundary has remained unchanged for at least 70 years. Combined, these studies broadly support the fire cycle model [8] and highlight some of the complexities and limitations of the ecological drift model [7], which are discussed below.
The ecological drift model posits a successional sequence from Sedgeland to Heathland to Scrub to Eucalyptus forest to Mixed Forest to Rainforest in response to changes in fire frequency [7,22]. It is important to note here that the ecological drift model is based on crude estimates of fire return intervals, whereas this study is one of the few that provide a precise determination of fire intervals for the Scrub and Sedgeland communities in Tasmania. According to the ecological drift model, shrubs should have invaded the Sedgeland during the comparatively long (40 and 70 years) fire-free intervals, yet our study demonstrated that this did not happen. It is true that our survey data found some overlap of shrub heights in Sedgeland and Scrub communities consistent with shrub invasion (Figure 2). Previously published transect studies have also described the intergrading of Scrub and Sedgeland boundaries to provide evidence of boundary dynamics, such as Gymnoschoenus sphaerocephalus clumps overtopped by shrubs in long-unburnt Sedgeland. However, consistent with the overall stability of the boundaries, the spatial extent of these structural transitions is very localized to narrow boundaries with only minor changes to the floristic composition of both the Sedgeland and Scrub communities [4,22,23,24].
The stability of the Scrub and Sedgeland communities no doubt reflects the strong resilience of these communities to fire. We found that the 2019 fire did not alter the geographic distribution of the Scrub and Sedgeland because of the rapid post-fire recovery. This finding is consistent with previous studies, which have also documented rapid post-fire recovery of Sedgeland and Scrub plant species by resprouting or seedling establishment [12,24], as well as differences between these communities in the growth rates of woody plants [25,26].
We also suspect that the stability of the vegetation boundaries could, at least in part, be due to the limited capacity of shrubs characteristic of the Scrub community to invade and overtop Sedgeland. For example, we found very few L. glaucescens plants in the Sedgeland. The cause of this boundary control is unclear but could be related to edaphic factors influencing shrub establishment and growth rates. Marsden-Smedley et al. (2010), for example, found that shrub growth rates in the greenhouse were much slower in Sedgeland than Scrub soils (noting that their Sedgeland soils were also kept saturated, so it is unclear whether this was due to nutrient limitations or waterlogging). Similarly, the dendrochronological study by Wood et al. (2012) showed a much slower growth rate of Leptospermum lanigerum in Sedgelands with increasing distance from the Eucalyptus forest edge. The hypothesis that the communities are controlled by edaphic factors requires detailed field, greenhouse, and laboratory testing [22].
One important management implication of this study is that it corroborates findings that the Scrub–Sedgeland system is temporally stable, with cycles of expansion of shrubs into Sedgeland, followed by contraction associated with infrequent fire events [22,24]. Related to this, because of the abundance of strict obligate seeders (Melaleuca squamea and Leptospermum glaucescens) in the Sedgeland and Scrub, care must be taken to avoid local population collapse by burning before a post-fire cohort has achieved sexual maturity [24]. Shrub population collapse would have little effect on Sedgeland, which is dominated by a resprouter sedge [12], but could cause the loss or contraction of the Scrub community. More research is required to determine the post-fire period when obligate-seeder woody plants are vulnerable to population collapse. Caution is also required in avoiding deep burning of the organic soils, which can kill some plants, removes the soil seedbanks of some plant species and destroys the substrate for woody plant establishment [23,27]. Finally, we see little evidence that Sedgeland and Scrub communities could convert to tall Eucalyptus forest or rainforests under current or future climate conditions, given the temporal stability of the investigated vegetation, the slow growth rates, and the increasing occurrence of lightning ignition in the TWWHA [22]. A bigger threat to the integrity of the TWWHA is the increased frequency of fires, which will degrade fire-sensitive rainforest and alpine vegetation [28,29].

Author Contributions

D.M.J.S.B. conceived, designed, and directed the study, led the writing, participated in the field programs, and contributed to the data analyses; S.O. led the analysis of the aerial photography and contributed to the writing; S.C.N. undertook the dendrochronological collection, preparation, and analysis and contributed to writing; S.M.F. led the vegetation survey and contributed to writing; L.D.P. led the analysis of the field data and contributed to the writing. All authors have read and agreed to the published version of the manuscript.

Funding

Australian Research Council grant DP200102395 awarded to D.M.J.S.B.

Institutional Review Board Statement

Not applicable.

Informed Consent Statement

Not applicable.

Data Availability Statement

Not applicable.

Acknowledgments

This research was conducted with permission from Natural Resources and Environment Tasmania. We thank Frank Bird for help in the field and Tasmanian National Parks and Wildlife Service, particularly Andy Ryan, and Helicopter Resources for their logistic support.

Conflicts of Interest

The authors declare no conflict of interest.

References

  1. Pausas, J.G.; Bond, W.J. Alternative biome states in terrestrial ecosystems. Trends Plant Sci. 2020, 25, 250–263. [Google Scholar] [CrossRef] [PubMed]
  2. Staver, A.C.; Archibald, S.; Levin, S.A. The global extent and determinants of savanna and forest as alternative biome states. Science 2011, 334, 230–232. [Google Scholar] [CrossRef] [PubMed] [Green Version]
  3. Flores, B.M.; Fagoaga, R.; Nelson, B.W.; Holmgren, M. Repeated fires trap Amazonian blackwater floodplains in an open vegetation state. J. Appl. Ecol. 2016, 53, 1597–1603. [Google Scholar] [CrossRef]
  4. Wood, S.W.; Bowman, D.M. Alternative stable states and the role of fire–vegetation–soil feedbacks in the temperate wilderness of southwest Tasmania. Landsc. Ecol. 2012, 27, 13–28. [Google Scholar] [CrossRef]
  5. Bowman, D.M.; Perry, G.L. Soil or fire: What causes treeless sedgelands in Tasmanian wet forests? Plant Soil 2017, 420, 1–18. [Google Scholar] [CrossRef]
  6. Bowman, D.M.; Wood, S.W. Fire-driven land cover change in Australia and WD Jackson’s theory of the fire ecology of southwest Tasmania. In Tropical Fire Ecology; Springer: Cham, Switzerland, 2009; pp. 87–111. [Google Scholar]
  7. Jackson, W.D. Fire, air, water and earth-an elemental ecology of Tasmania. Proc. Ecol. Soc. Aust. 1968, 3, 9–16. [Google Scholar]
  8. Mount, A. Natural regeneration processes in Tasmanian forests. Search 1979, 10, 180–186. [Google Scholar]
  9. Brown, M.; Podger, F. Floristics and fire regimes of a vegetation sequence from sedgeland-heath to rainforest at Bathurst Harbour, Tasmania. Aust. J. Bot. 1982, 30, 659–676. [Google Scholar] [CrossRef]
  10. Fletcher, M.-S.; Wood, S.W.; Haberle, S.G. A fire-driven shift from forest to non–forest: Evidence for alternative stable states? Ecology 2014, 95, 2504–2513. [Google Scholar] [CrossRef] [Green Version]
  11. Prior, L.D.; Foyster, S.M.; Furlaud, J.M.; Williamson, G.J.; Bowman, D.M. Using permanent forest plots to evaluate the resilience to fire of Tasmania’s tall wet eucalypt forests. For. Ecol. Manag. 2022, 505, 119922. [Google Scholar] [CrossRef]
  12. Bowman, D.M.; Ondei, S.; Lucieer, A.; Foyster, S.; Prior, L.D. Forest-sedgeland boundaries are historically stable and resilient to wildfire at Blakes Opening in the Tasmanian Wilderness World Heritage Area, Australia. Landsc. Ecol. 2023, 38, 205–222. [Google Scholar] [CrossRef]
  13. Burnham, K.P.; Anderson, D.R. Kullback-Leibler information as a basis for strong inference in ecological studies. Wildl. Res. 2001, 28, 111–119. [Google Scholar] [CrossRef] [Green Version]
  14. Stokes, M.A. An Introduction to Tree-Ring Dating; University of Arizona Press: Tucson, AZ, USA, 1996. [Google Scholar]
  15. LandTasmania. Available online: https://nre.tas.gov.au/land-tasmania (accessed on 31 March 2022).
  16. Adeleye, M.A.; Haberle, S.G.; Ondei, S.; Bowman, D.M. Ecosystem transformation following the mid-nineteenth century cessation of Aboriginal fire management in Cape Pillar, Tasmania. Reg. Environ. Change 2022, 22, 99. [Google Scholar] [CrossRef]
  17. Zvoleff, A. glcm: Calculate Textures from Grey-Level Co-Occurrence Matrices (GLCMs); R Package Version 1.6.5; R Core Team: Vienna, Austria, 2020. [Google Scholar]
  18. R Core Team. R: A Language and Environment for Statistical Computing: R Foundation for Statistical Computing; R Core Team: Vienna, Austria, 2021. [Google Scholar]
  19. Haralick, R.M.; Shanmugam, K.; Dinstein, I.H. Textural features for image classification. IEEE Trans. Syst. Man Cybern. 1973, 6, 610–621. [Google Scholar] [CrossRef] [Green Version]
  20. Julesz, B. Visual pattern discrimination. IRE Trans. Inf. Theory 1962, 8, 84–92. [Google Scholar] [CrossRef]
  21. Leutner, B.; Horning, N.; Schwalb-Willmann, J.; Hijmans, R. RStoolbox: Tools for Remote Sensing Data Analysis; R Package Version 0.2; R Core Team: Vienna, Austria, 2019; Volume 6. [Google Scholar]
  22. Marsden-Smedley, J.B.; Brown, M.J.; Reid, J.B. The dynamics of the boundary between lowland buttongrass moorland and wet-eucalypt forest in southwest Tasmania. In Proceedings of the Buttongrass Moorland Management Workshop, Sandy Bay, TAS, Australia, 4–6 July 2007; p. 52. [Google Scholar]
  23. Brown, M.; Balmer, J.; Podger, F. Vegetation change over twenty years at Bathurst Harbour, Tasmania. Aust. J. Bot. 2002, 50, 499–510. [Google Scholar] [CrossRef]
  24. Balmer, J.; Storey, D. A review of vegetation responses to fire in buttongrass moorland. In Proceedings of the 2007 Buttongrass moorland Management Workshop, Sandy Bay, TAS, Australia, 4–6 July 2007; Nature Conservation Report, 2010. pp. 22–29. [Google Scholar]
  25. French, B.J.; Prior, L.D.; Williamson, G.J.; Bowman, D.M. Cause and effects of a megafire in sedge-heathland in the Tasmanian temperate wilderness. Aust. J. Bot. 2016, 64, 513–525. [Google Scholar] [CrossRef]
  26. Wood, S.; Hua, Q.; Allen, K.; Bowman, D. Age and growth of a fire prone Tasmanian temperate old-growth forest stand dominated by Eucalyptus regnans, the world’s tallest angiosperm. For. Ecol. Manag. 2010, 260, 438–447. [Google Scholar] [CrossRef]
  27. Prior, L.D.; French, B.J.; Storey, K.; Williamson, G.J.; Bowman, D.M. Soil moisture thresholds for combustion of organic soils in western Tasmania. Int. J. Wildland Fire 2020, 29, 637–647. [Google Scholar] [CrossRef]
  28. Bowman, D.M.; Rodriguez-Cubillo, D.; Prior, L.D. The 2016 Tasmanian wilderness fires: Fire regime shifts and climate change in a Gondwanan biogeographic refugium. In Ecosystem Collapse and Climate Change; Springer: Cham, Switzerland, 2021; pp. 133–153. [Google Scholar]
  29. Fox-Hughes, P.; Harris, R.; Lee, G.; Grose, M.; Bindoff, N. Future fire danger climatology for Tasmania, Australia, using a dynamically downscaled regional climate model. Int. J. Wildland Fire 2014, 23, 309–321. [Google Scholar] [CrossRef]
Figure 1. Location of Blakes Opening, a treeless Sedgeland surround by wet Eucalyptus forests in south-eastern Tasmanian and on the eastern fringe of the Tasmanian Wilderness World Heritage Area. Study location in Tasmania showing (a) the boundary of the Tasmanian Wilderness World Heritage Area (TWWHA) and (b) the extent of the Riveaux Road fire that occurred in 2019. (c) Location of the four sampling areas and the transects. (d) Terrestrial and (e) aerial views of the Scrub–Sedgeland mosaic. Photo credits: Stefania Ondei.
Fire 06 00232 g001
Figure 2. The density of stems according to height class of four myrtaceous shrubs exposed to the 2019 fires at Blakes Opening in the Tasmanian Wilderness World Heritage Area. Stems were all >0.5 m tall and binned into 1 m height classes. Note the very different Y−axis scales, reflecting much higher shrub densities in the Sedgeland compared to the Scrub community.
Fire 06 00232 g002
Figure 3. The number of shrubs of our four focal species with the specified ring count (binned into 5–ring classes) in Sedgeland and Scrub communities.
Fire 06 00232 g003
Figure 4. Fire history of Blakes Opening between 1980 and 2010, showing the newly identified fire that likely occurred in 1983. The white line represents the forest border in 1980, as mapped using aerial photographs. The 2019 fire is not shown, as it would cover the entire area displayed in this map (Figure 1b). Basemap from Esri, DigitalGlobe, GeoEye, i-cubed, USDA FSA, USGS, AEX, Getmapping, Aerogrid, IGN, IGP, swisstopo, and the GIS User Community.
Fire 06 00232 g004
Figure 5. Frequency of shrub height classes measured in 2019 on transects located in vegetation classified as Scrub or Sedgeland using aerial photography taken in 1980.
Fire 06 00232 g005
Figure 6. Time series showing changes in the proportion of vegetation classified as Scrub or Sedgeland within and outside the extent of the 1983 fire. Scrub and Sedgeland vegetation was mapped using available historical aerial photography.
Fire 06 00232 g006
Figure 7. Scrub and Sedgeland vegetation at Blakes Opening between 1980 and 2010, as classified using historical aerial photographs. The extent of the 1983 fire is shown by the black outline.
Fire 06 00232 g007
Table 1. Average heights and post-fire survival rates of shrubs of our focal species in the Sedgeland and Scrub transects. The number of each species in the Sedgeland and Scrub communities is indicated. Linear modelling showed that all height differences were statistically supported (AICc for the intercept-only model relative to the Community model was >45 higher for all). Differences in survival were important only for M. squarrosa (AICc for the intercept-only model was 7.9 higher than that for the Community model; for other species, the intercept-only model received more support).
SpeciesCountHeight (m)% Alive
SedgelandScrubSedgelandScrubSedgelandScrub
L. glaucescens1146-5.800
L. scoparium53290.92.58376
M. squamea545980.93.30.20
M. squarrosa91561.33.410091
Table 2. Post-fire seedling densities (per m2) of our four focal species in the Sedgeland and Scrub transects.
SpeciesSedgelandScrub
L. glaucescens0.082.09
L. scoparium0.841.62
M. squamea18.104.62
M. squarrosa00
Disclaimer/Publisher’s Note: The statements, opinions and data contained in all publications are solely those of the individual author(s) and contributor(s) and not of MDPI and/or the editor(s). MDPI and/or the editor(s) disclaim responsibility for any injury to people or property resulting from any ideas, methods, instructions or products referred to in the content.

