Article

Flashover in Aircraft Cargo Compartment at Different Pressures: Experimental and Modeling Study

1
Department of the Civil Aviation Safety Engineering, Civil Aviation Flight University of China, Guanghan 618307, China
2
Civil Aircraft Fire Science and Safety Engineering Key Laboratory of Sichuan Province, Guanghan 618307, China
*
Author to whom correspondence should be addressed.
Fire 2023, 6(11), 415; https://doi.org/10.3390/fire6110415
Submission received: 5 September 2023 / Revised: 18 October 2023 / Accepted: 25 October 2023 / Published: 27 October 2023
(This article belongs to the Special Issue Compartment Fire and Safety)

Abstract

:
The increasing incidence of aircraft cargo compartment fires in recent years has caused heavy losses and drawn attention to understanding the combustion process, especially under low pressure. The present paper aims at exploring the conditions of flashover at different pressures. Experiments were conducted in Guanghan (96 kPa) and Kangding (60 kPa), which are located at different altitudes. Five different sizes of pool fires were tested and smoke temperature and heat flux were measured for flashover criteria analysis. Corresponding simulations were performed using a commercial software FDS to examine the pressure effect on the flashover phenomenon and to validate the simulation results. The critical conditions for the onset of flashover in a 1/4 MPS compartment were found to be (1) an average upper layer temperature of about 450 °C at 96 kPa or about 550 °C at 60 kPa, and (2) radiant heat flux at floor level of about 10 to 15 kW/m2 at 96 kPa or 20 to 25 kW/m2 at 60 kPa. By using the average upper layer temperature as a criterion in modeling, a relatively accurate prediction of flashover onset time could be obtained at 96 kPa and a delay of about 25 s was found at 60 kPa.

1. Introduction

Over the past twenty years, five aircraft cargo fires have happened in China and three of them occurred in the last five years [1]. The increase in the frequency of aircraft cargo fires over the years in China is presenting significant danger to the safety of aircrafts, cargoes, passengers and crews on board. A Boeing 747-400 freighter belonging to Asiana Airlines crashed into the ocean on the way to Shanghai after an in-flight fire was detected on 28 July 2011. The hydraulic system was soon destroyed by a large uncontained fire. On 27 August 2019, a fire broke out in the front cargo compartment of an Air China Airbus 330-343 passenger plane while boarding at Beijing Airport. The fuselage was severely damaged and the aircraft was beyond repair. On 22 July 2020, a Boeing 777-200F freighter operated by EgyptAir caught fire while loading cargo at Pudong airport, Shanghai. The fire escalated rapidly and lasted for over an hour. The aircraft cargo compartment, which can typically be treated as a confined space, features low in-flight pressure, limited ventilation, and contains diverse combustibles and high fire loads. Flashover occurs with high probability in the cargo compartment as the fire grows, resulting in casualties and property damage. Therefore, understanding the combustion process in the aircraft cargo compartment, especially under low pressure, has become an urgent issue in the civil aviation field.
The National Fire Protection Association (NFPA) defines flashover as the transient phase in the development of a compartment fire in which surfaces exposed to thermal radiation reach their ignition temperature almost simultaneously and the fire spreads rapidly throughout the space [2]. Many combustion experiments have been carried out in small enclosures (<20 m2, most are ISO 9705 [3]-sized with dimensions of 2.4 m × 3.6 m × 2.4 m) and compared to computer simulations for the validation of accurate numerical modelling. Among all the types of numerical simulation tools, the Fire Dynamics Simulator (FDS) version 3.01, based on a computational fluid dynamics (CFD) model, is a free software which has been widely applied in the simulation of various fire scenarios. Zou and Chow [4] conducted a series of full-scale experiments to study the accuracy of FDS 3.01 in simulating the flashover phenomenon. Khalil and Othman [5] obtained simulation results from FDS which were consistent with the full-scale experiment on a C-133 conducted by the Federal Aviation Administration (FAA) and succeeded in predicting the occurrence time of the flashover. Zong et al. [6] compared the predictions of CFAST and FDS to the experimental data and found that FDS performed better in describing the building compartment flashover. Li et al. [7] carried out a reduced-scale experiment and a comparison of the use of FDS and SIMTEC on flashovers in the typical compartment of an extra-high building construction. They concluded that both simulators were capable of accurate prediction. Han et al. [8] evaluated the reliability of the large-eddy simulation (LES) technique and calculated the smoke temperature when flashover occurred using FDS.
The flashover criteria have also been investigated [9,10,11,12,13,14,15]. It is generally agreed that flashover can occur when the upper smoke layer temperature is higher than 600 °C or heat flux at floor level is higher than 20 kW/m2 [16,17,18]. Certainly, flashovers may vary with material, construction structures, etc. [19,20,21,22,23,24,25]. However, there is limited research focusing on aircraft cargo compartments, especially at high altitudes. The combustion behavior of a compartment fire in flight possesses special characteristics due to the low pressure and low oxygen concentration and thus it is worth further investigation. Despite a few combustion tests conducted on the plateau [26,27] and modellings associated with low pressure [27,28,29,30], the flashover characteristics and the onset criteria in this specific condition have not been determined.
In this paper, an experimental study of a compartment fire was carried out at different pressures (96 kPa and 60 kPa). Five different sizes of pool fires were tested and smoke temperature and heat flux were measured for flashover criteria analysis. Then, corresponding simulations were conducted using FDS to examine the mechanism of pressure effect on flashover phenomenon.

2. Experiment and Numerical Simulation

2.1. Experimental Setup

Due to safety considerations in igniting actual cargo fire inflight, a reduced-size aircraft cargo compartment (4.16 m × 2.03 m × 1.67 m), similar in size to a 1/4 minimum performance standard (MPS) [31] compartment (Figure 1) of the FAA (Federal Aviation Administration) with a 3 cm thermal-resistant calcium silicate finish, was constructed in Guanghan (altitude: 470 m, environmental pressure: 96 kPa) and Kangding (altitude: 4290 m, environmental pressure: 60 kPa), respectively. There was a vent at a height of 0.8 m and a width of 1.2 m, as shown in Figure 2. A KM-11 electronic balance was located at the center of the cargo compartment under a square pan with 1-cm deep n-heptane as the fuel, because this fire source produces heat and gases resembling those generated in actual fires inflight [32]. The recorded mass loss of n-heptane was used for calculation of the heat release rate (HRR), which was used as the input in the simulation. Two MPS standardized single-wall corrugated cardboard boxes (45.7 cm × 45.7 cm × 45.7 cm) were placed 50 cm to the left of the pan with a distance of 40 cm between them. Two TS-34 C heat flux sensors, R1 and R2, were situated on either side of the boxes to measure the radiant heat flux received by the floor. Eight thermocouple trees (T1–T8), each consisting of six thermocouples, were placed inside the space, with a distance of 10 cm between the adjacent thermocouples for measuring the upper hot gas layer temperature. They were high-accuracy K-type thermocouples of diameters 1 mm and measuring range −100 °C to 1300 °C. One tree (T5) was immediately above the pan while the others -were 10 cm from the walls. The data set collected by thermocouples was used to calculate the average temperature for the upper zone with the following equations [33]:
T a v = H r H i H i H r 1 T d y
where Tav refers to the average temperature for the upper zone; Hr refer to the height of the thermocouples at the top; Hi refer to the height of the thermocouples at the bottom. Through discretization, Equation (1) can be converted into the expression below:
H i H r 1 T d y = j = 1 L h j + 1 h j T j + 1 T j ln 1 + T j + 1 T j T j
More experimental details are available in an earlier publication [34].
Five sizes (20 cm, 30 cm, 40 cm, 50 cm, 60 cm) of square n-heptane pool fires were ignited to provide different HRR at 96 kPa and 60 kPa, respectively. Because of the uncertain flashover onset criteria, especially at low pressure, it would be inappropriate to loosely determine the beginning of this phenomenon according to an upper smoke temperature over 600 °C or heat flux at floor level over 20 kW/m2. Therefore, the occurrence of flashover was identified when the boxes started to burn in this study, according to the definition of flashover from the NFPA [2]. In this case, the simultaneous ignition of multiple boxes should be observed when flashover occurs. Due to space limitations, two boxes would be suitable in the 1/4 MPS compartment. A cell phone was used to obtain videos of the whole process of flashover.

2.2. Numerical Simulation

A FDS model was established based on the experimental setup. The computing domain was 4.16 m × 3.03 m × 1.67 m with 36,000 cells and open boundaries. The cell size was calculated using the following equations [35]:
D * 16 δ x D * 4
D * = ( Q ˙ ρ C p T g ) 2 5
where δ x refers to the nominal size of a mesh cell; D * refers to a characteristic fire diameter; Q ˙ refers to the total heat release rate of the fire; ρ refers to air density which is 1.2 k g m 3 ;   C p refers to the specific heat capacity of air which is 1.02 k J k g K ;   T refers to ambient temperature which is 298 K; and g refers to gravitational acceleration which is 9.8 m s 2 .
D * was calculated to be 1.01 m. According to Equation (3), the range of δ x was determined to be 0.063 m to 0.253 m. Since the distance between adjacent thermocouples is 10 cm and the cell size should be smaller than that, several different values within the range of 0.063 m to 0.1 m (0.09, 0.083, 0.075, 0.07, 0.065) were tested to perform a mesh independence study. The average upper layer temperature and simulation time of each run were plotted in Figure 3. The result shows insignificant differences (≤5.6%). By balancing accuracy and simulation time, 0.083 m was selected to be the appropriate cubic cell length.
The heptane reaction was available in the data library. The settings of burner vent size and environmental pressure were adjusted to resemble the lab implementation. As mentioned previously, the HRR was experimentally measured for input. HRR curves are plotted in Figure 4 and Figure 5. Material properties were entered according to Table 1. Devices such as thermocouples and heat flux sensors were set as shown in Figure 6.
Material properties such as density, specific heat capacity, and thermal conductivity were collected by conducting characterization experiments and instrumental analysis. The values of these properties are presented in Table 1 and they do not change with pressures. Simulations were performed on a personal computer with a processor of 3.2 GHz, 16 GB RAM, and a hard disk of 512 GB. The computing time required was 30 min approximately.

3. Results and Discussion

The visualization program Smokeview is capable of displaying the change in HRR over time which can to some extent represent the combustion status. Figure 7 shows several moments of the combustion process in reality and in simulation. However, catching the moment of transition to flashover from just Smokeview is difficult and unreliable. Therefore, in this study, flashover was supposed to occur when the critical conditions for the onset of flashover in the experiments were reached. The flashover onset times for all cases are summarized in Table 2 and are also labeled by dashed lines in the following figures. Obviously, it requires more heat and time for flashover at lower pressure.
Since “burn away” is allowed in simulation, the disappearance of the boxes will be observed if they are completely burnt out. This function can simply be an aid to the determination of the occurrence of flashover, not the exact onset time.

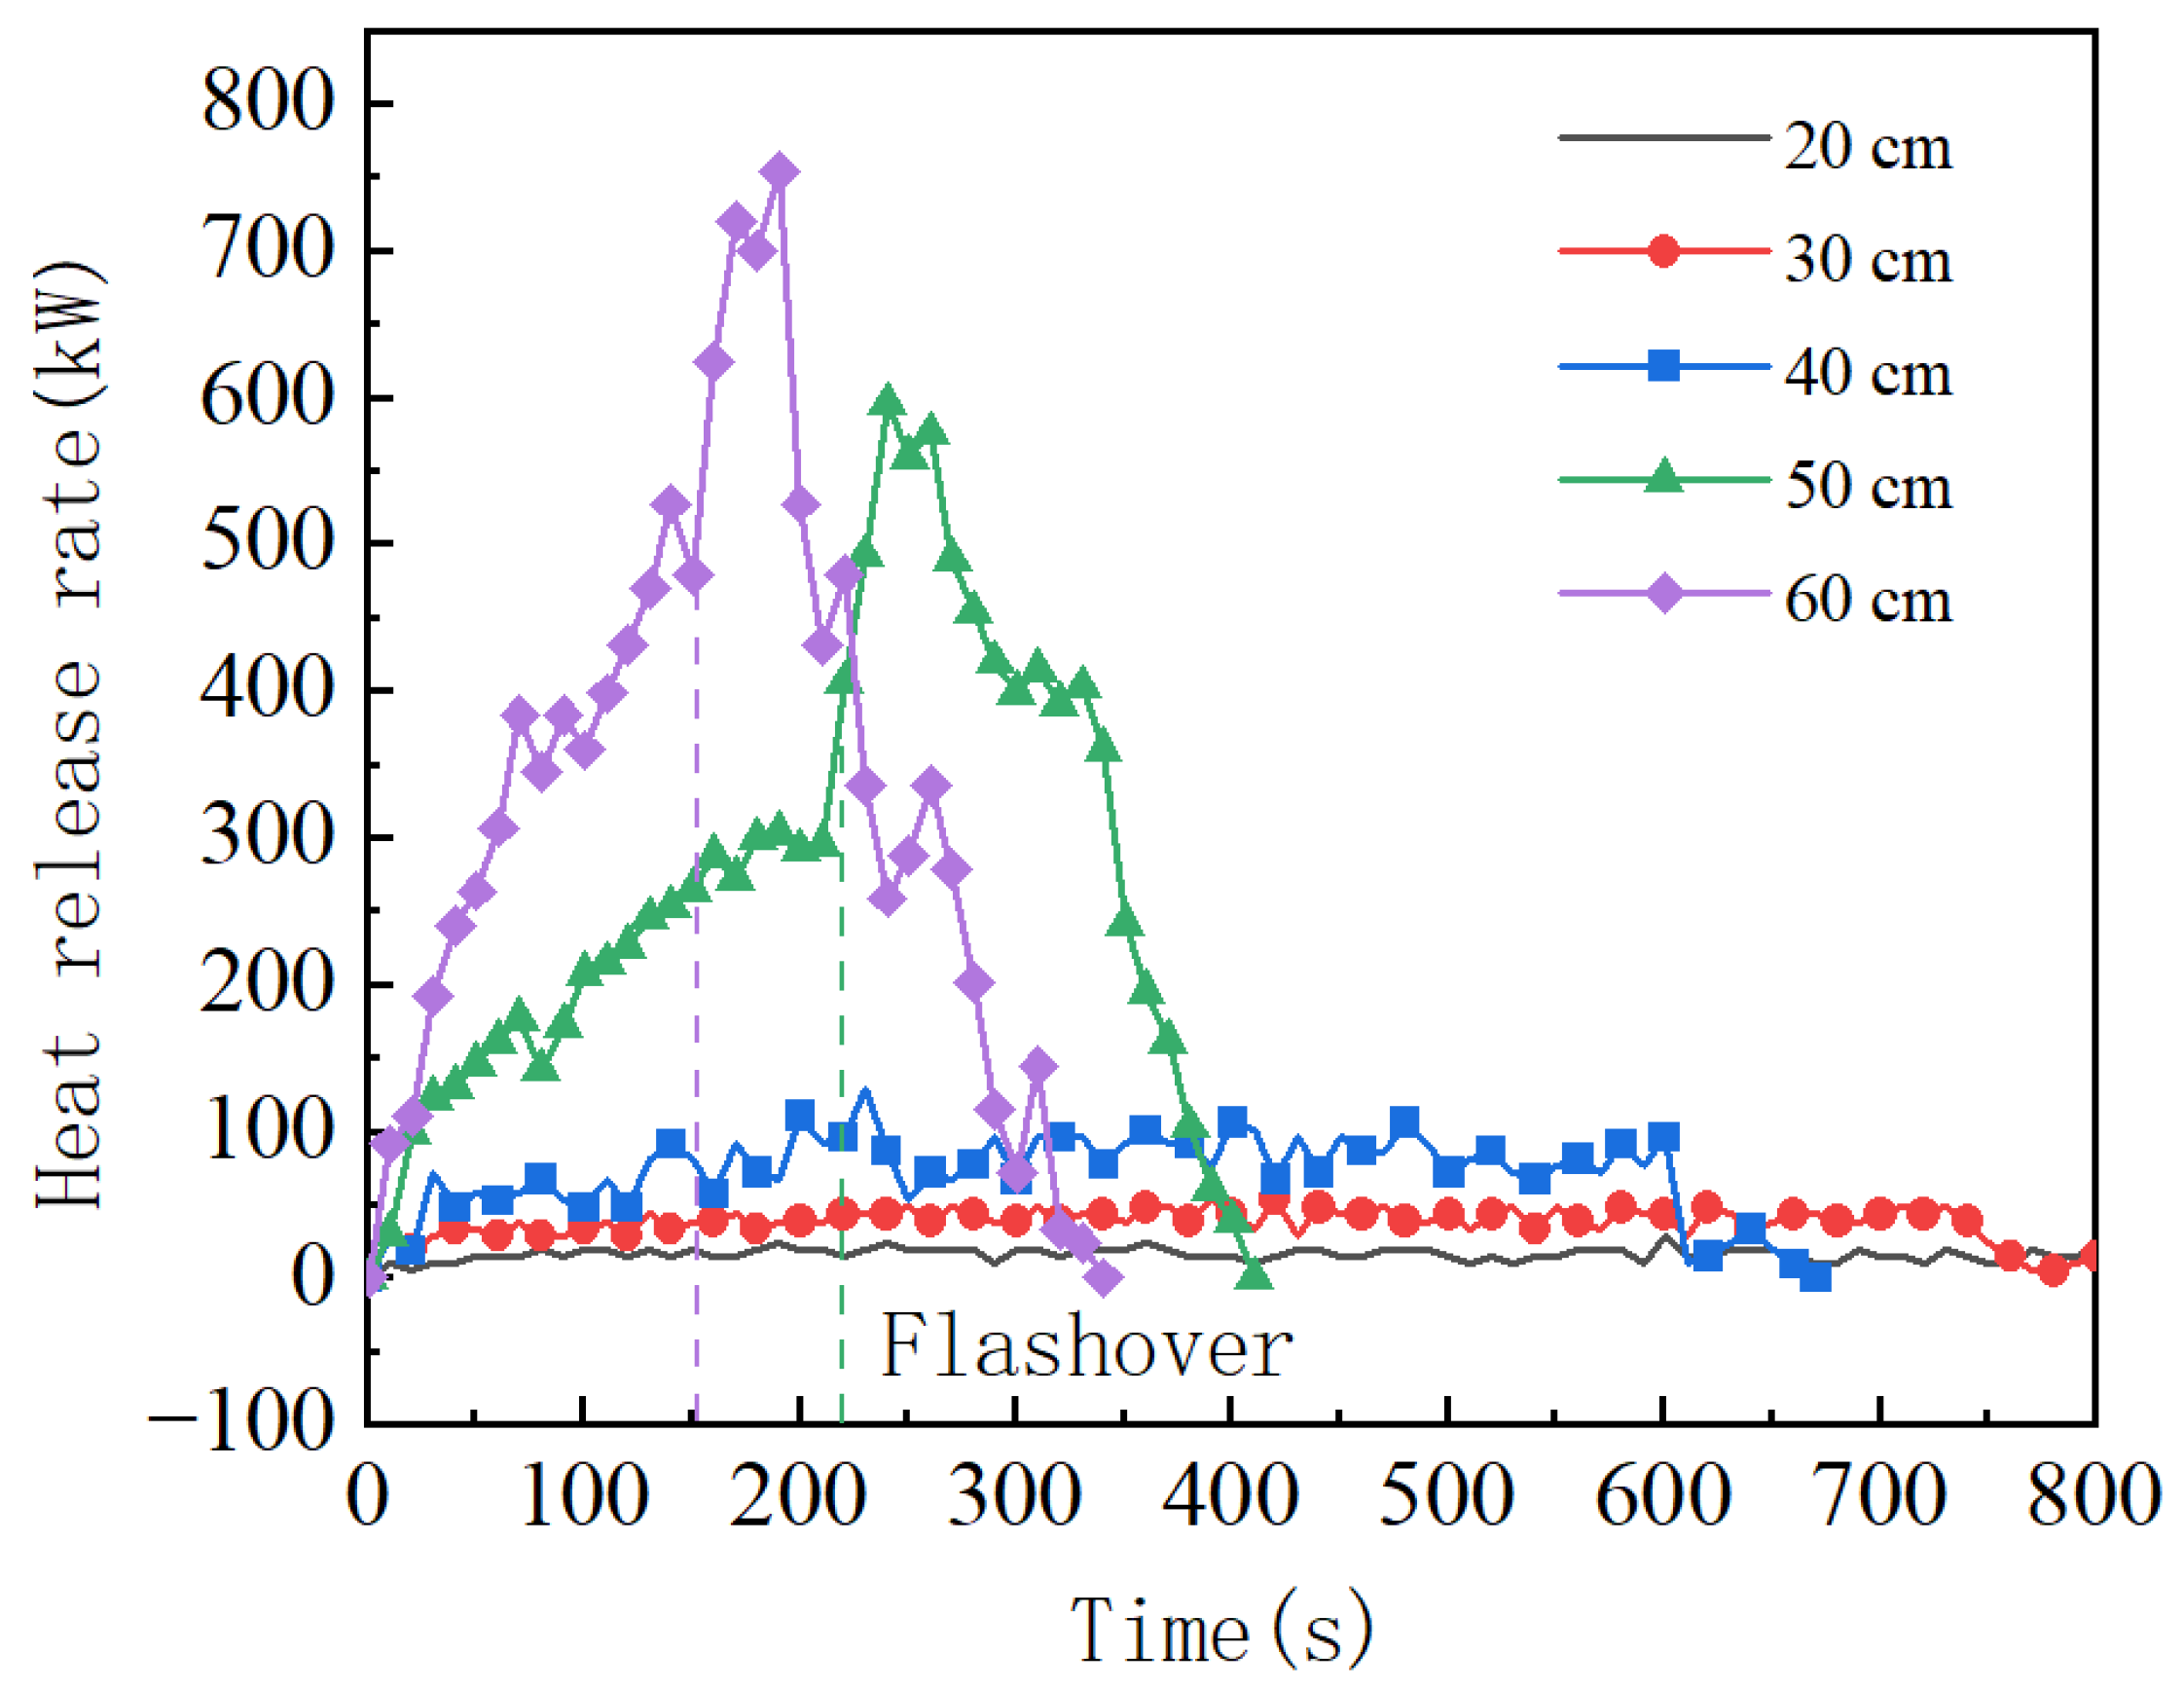
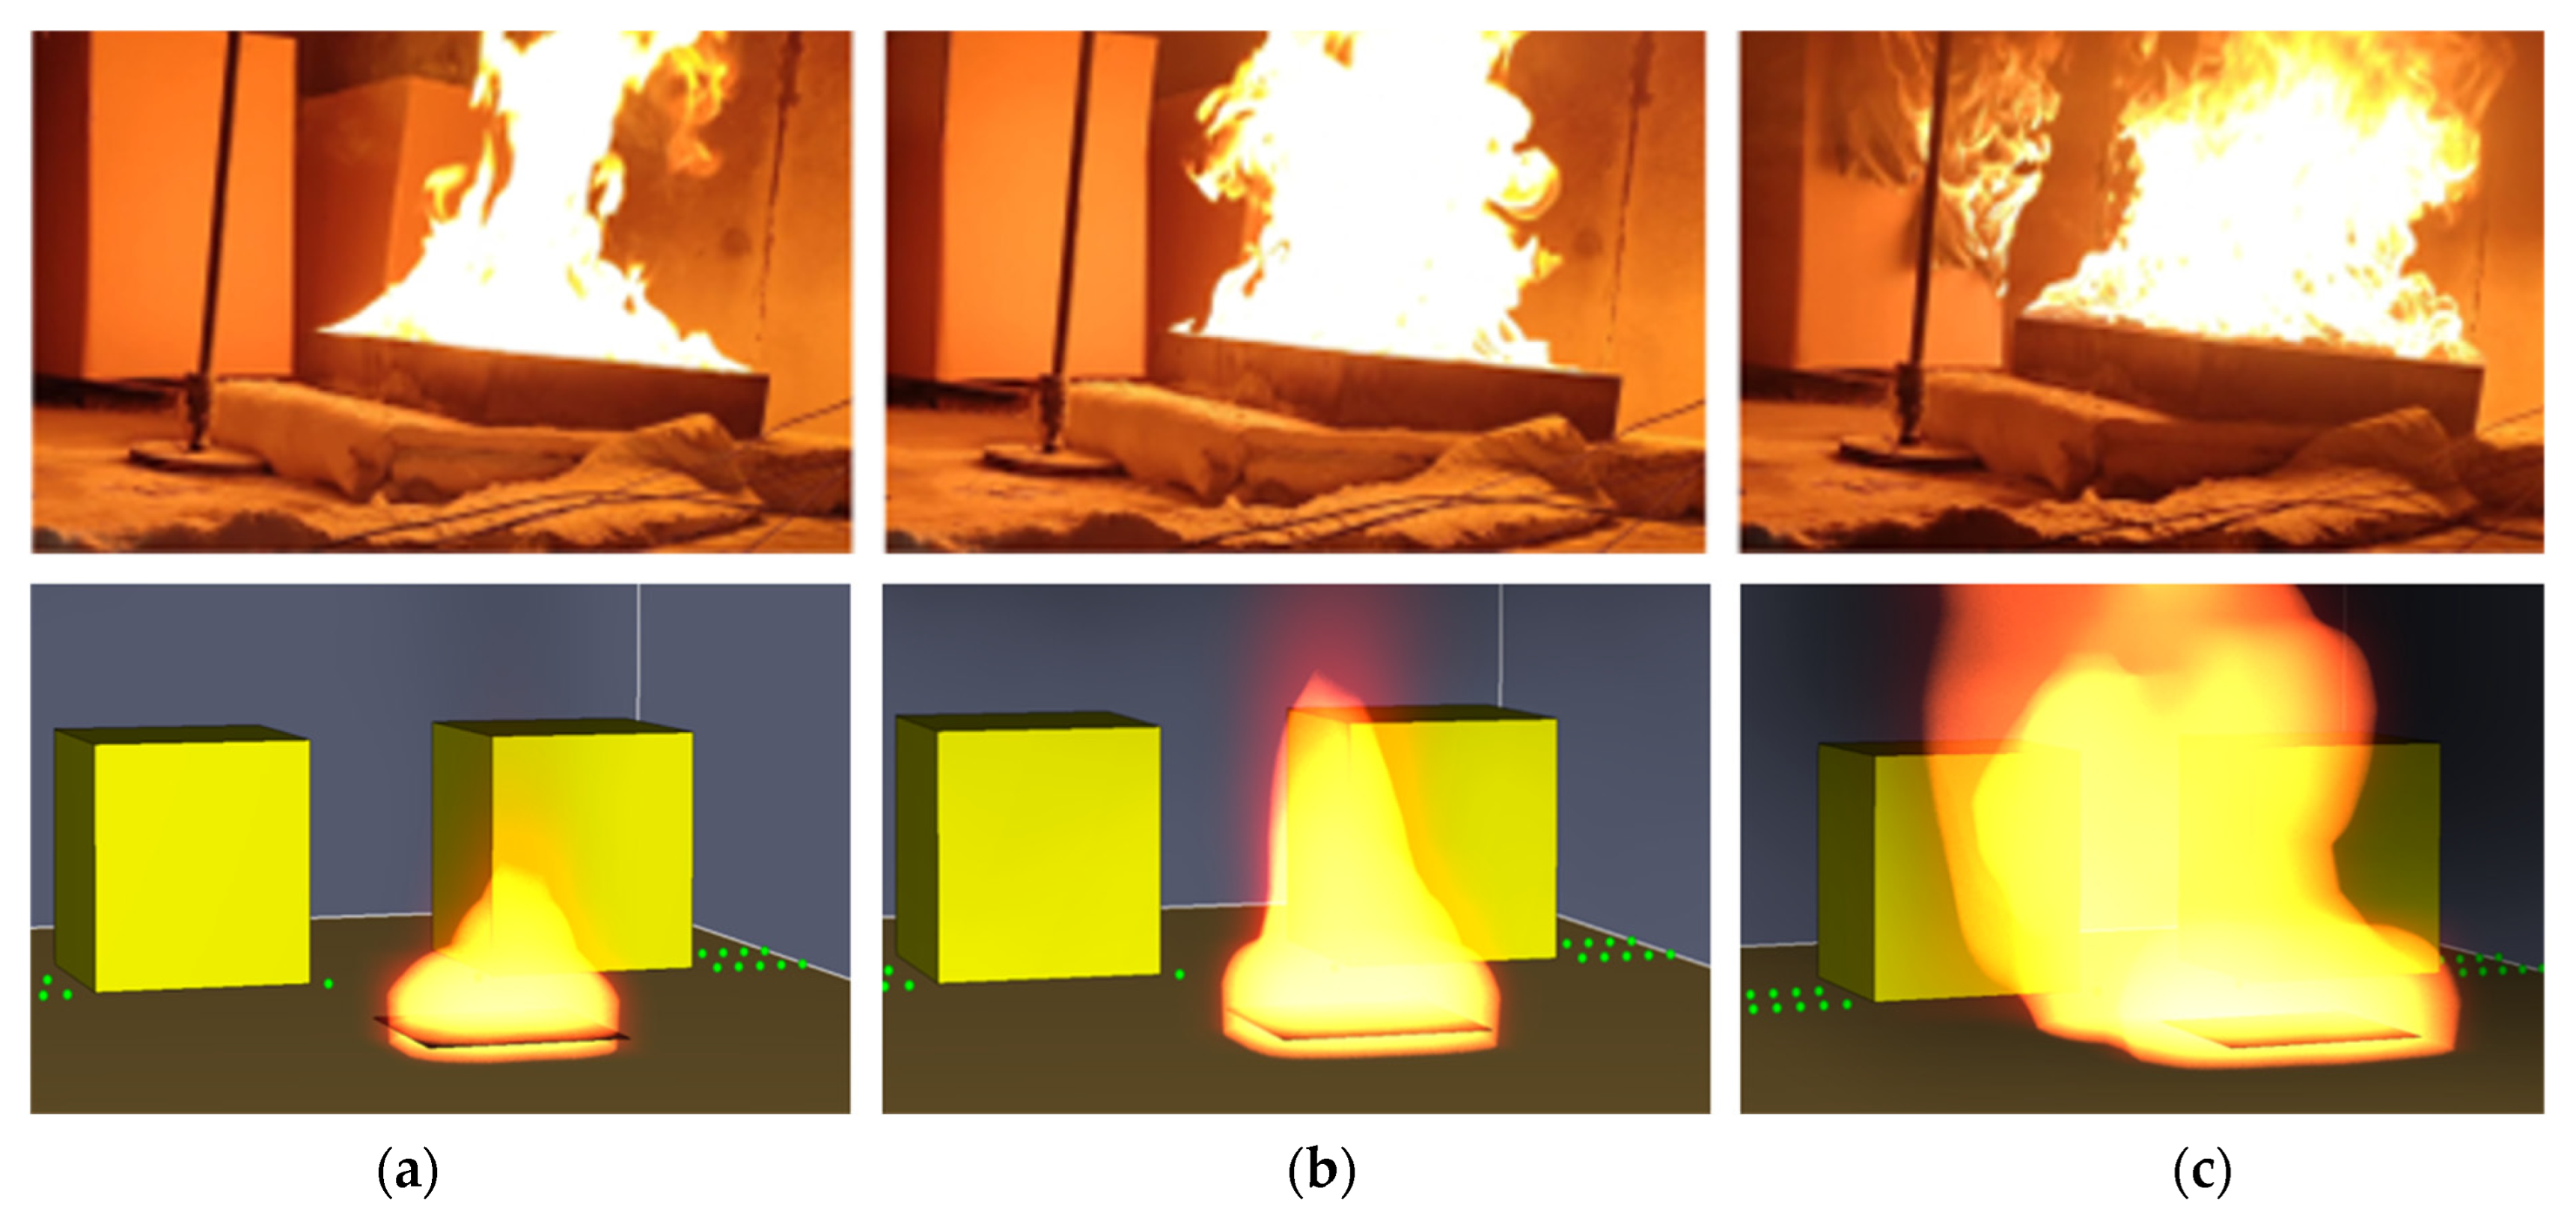
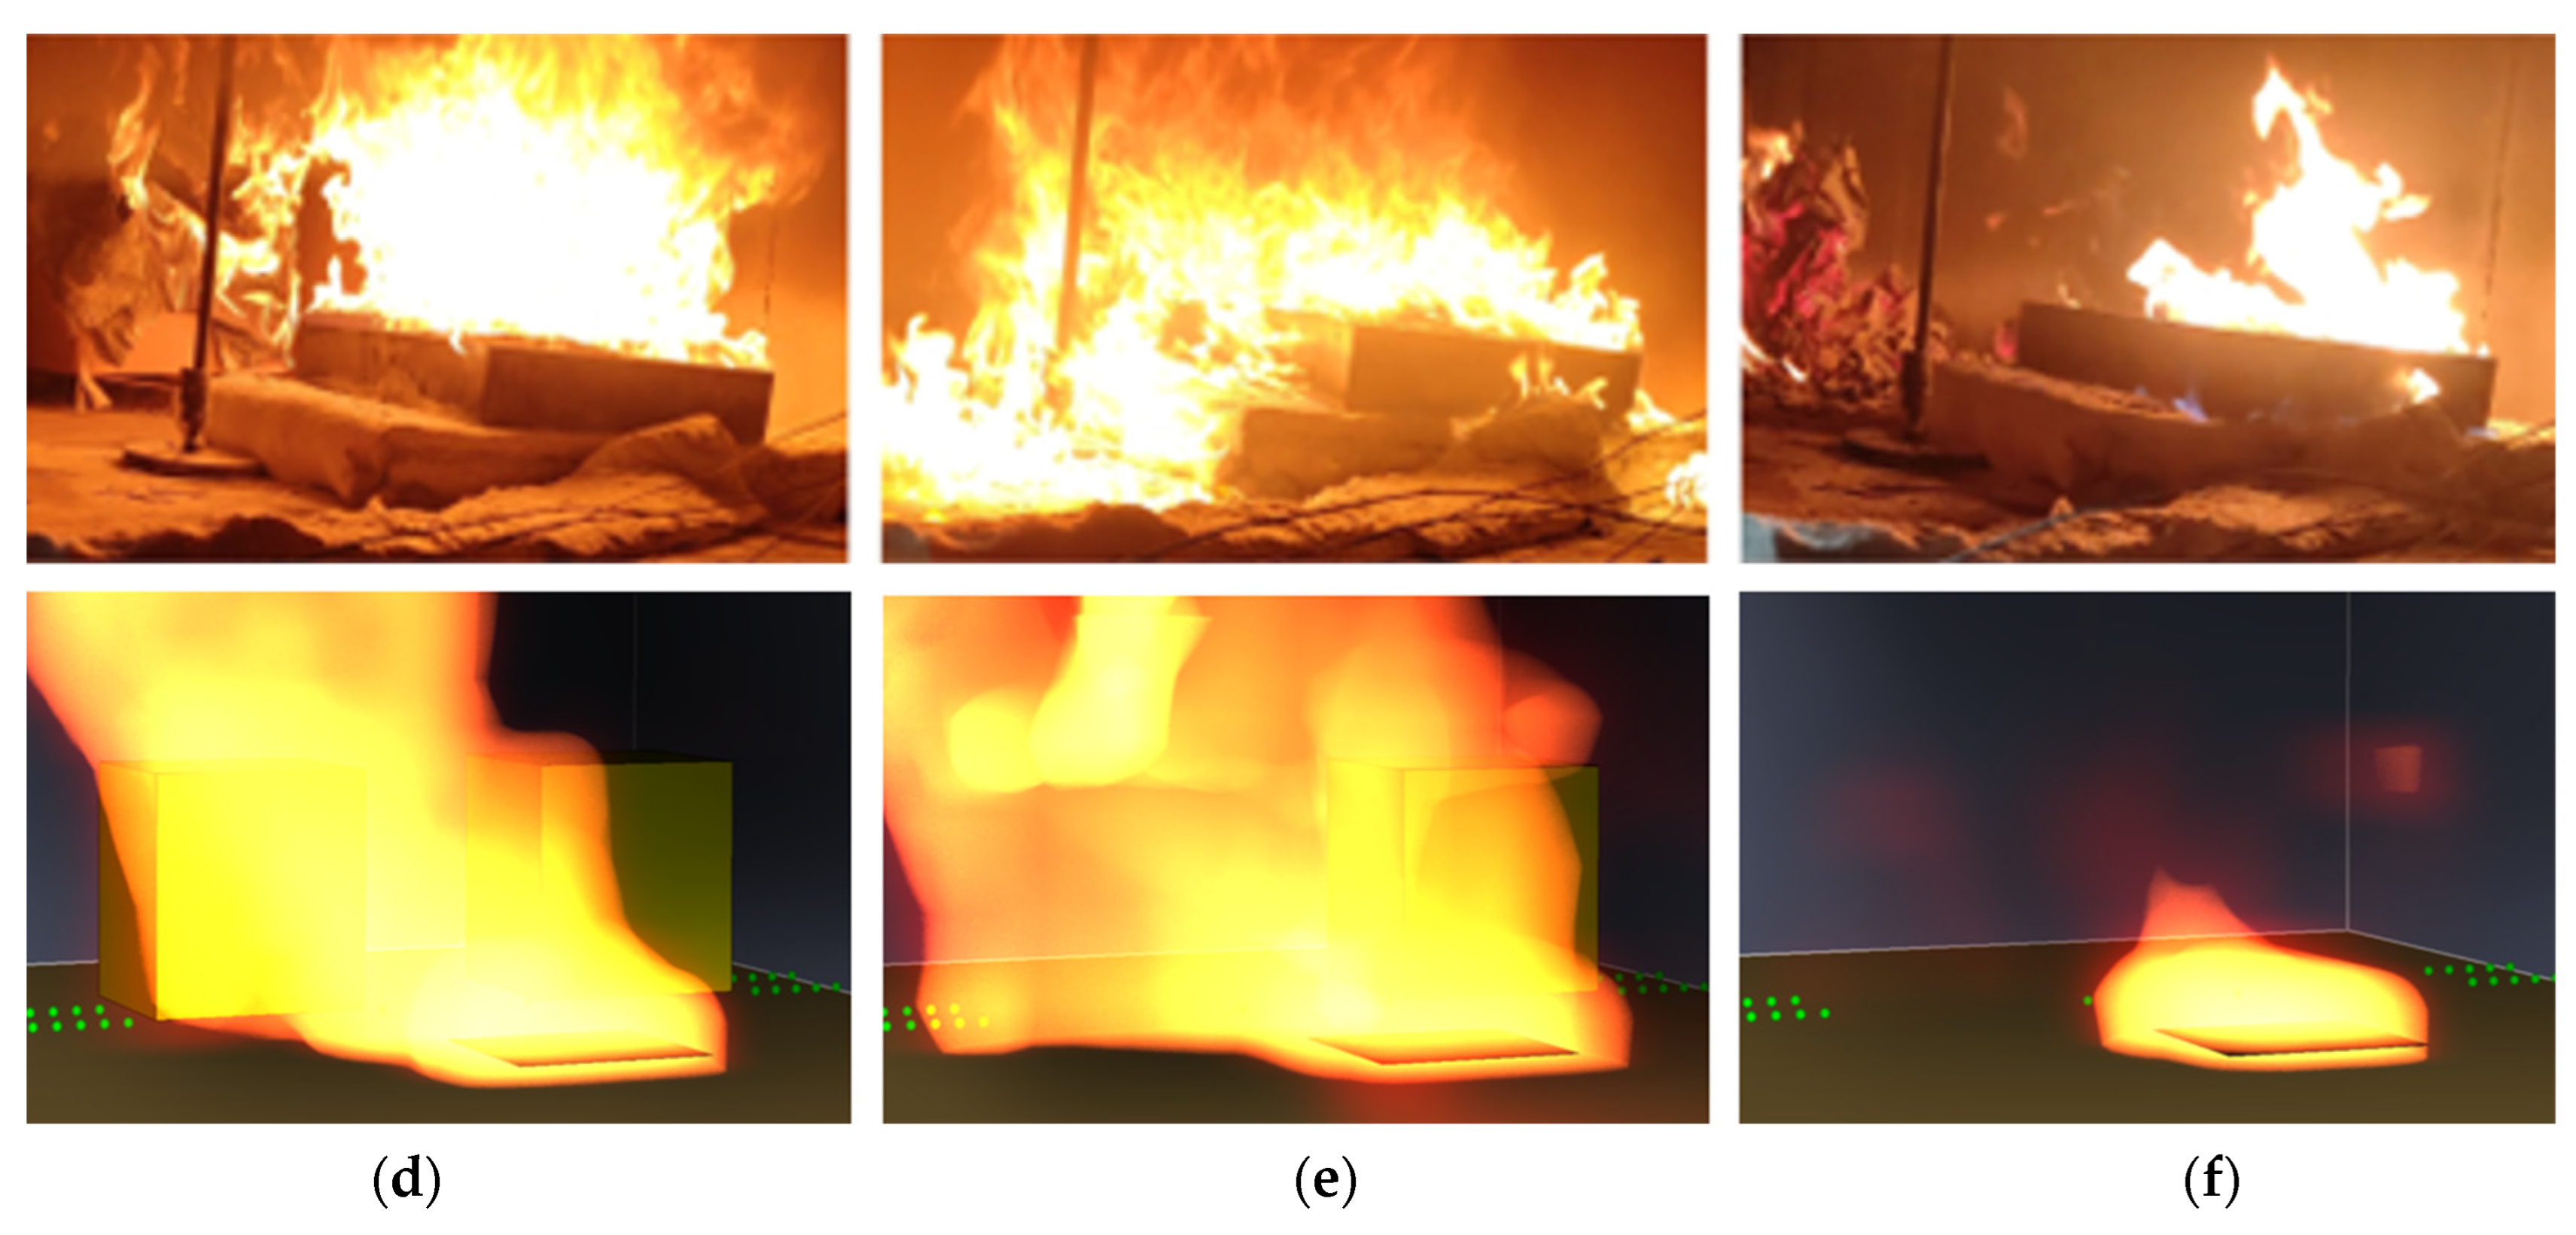
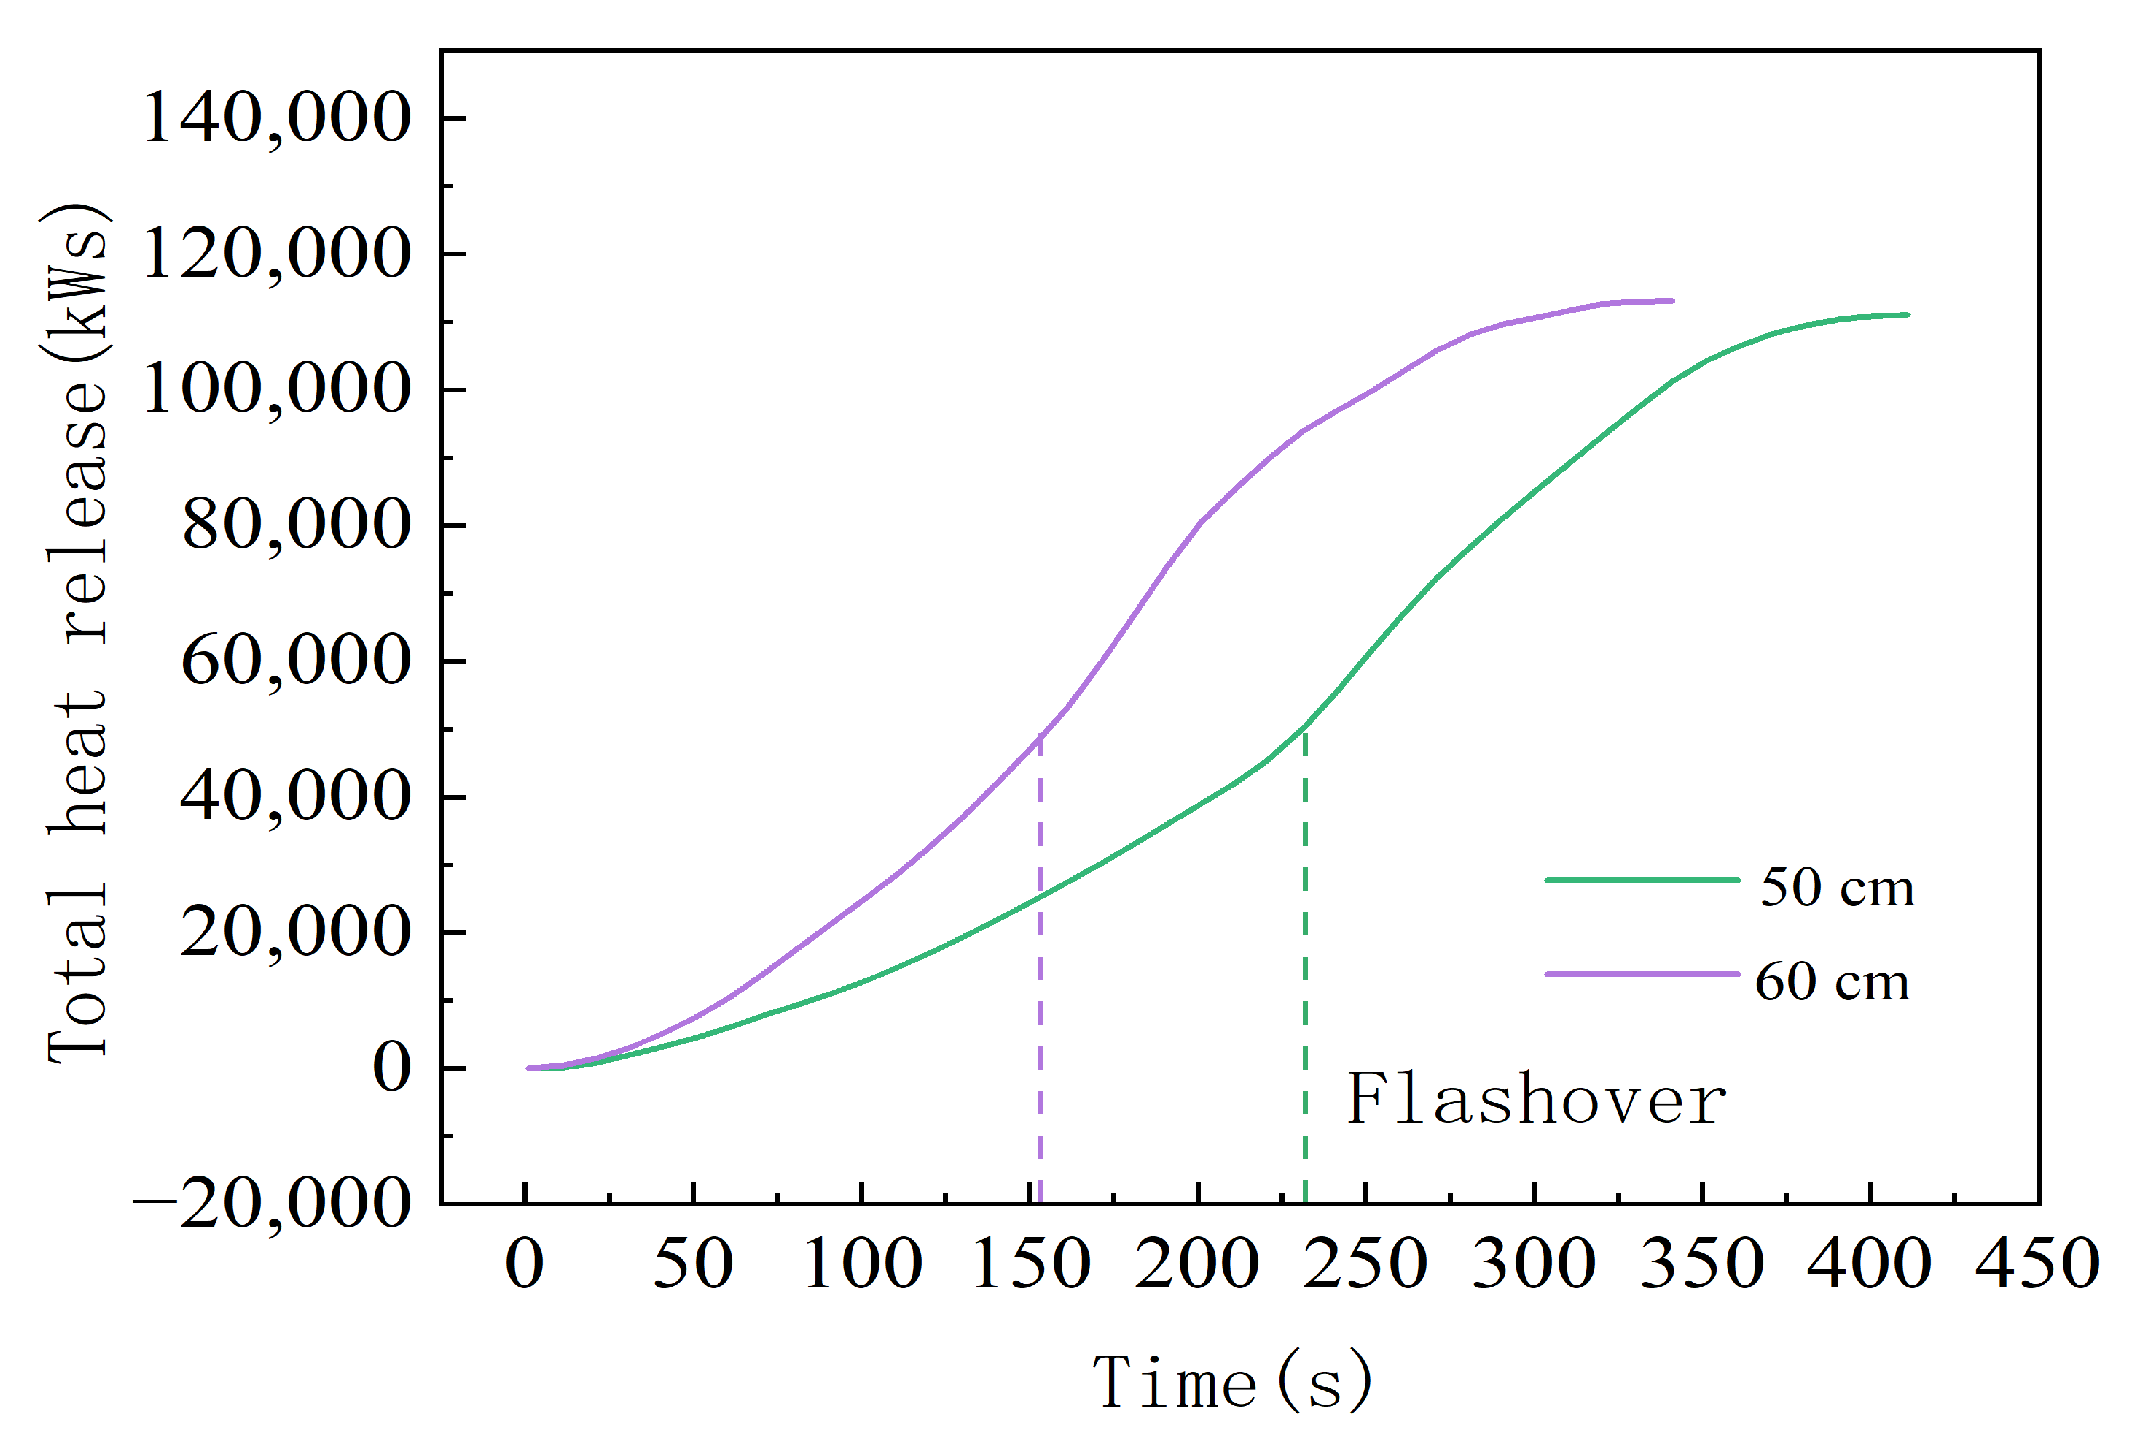
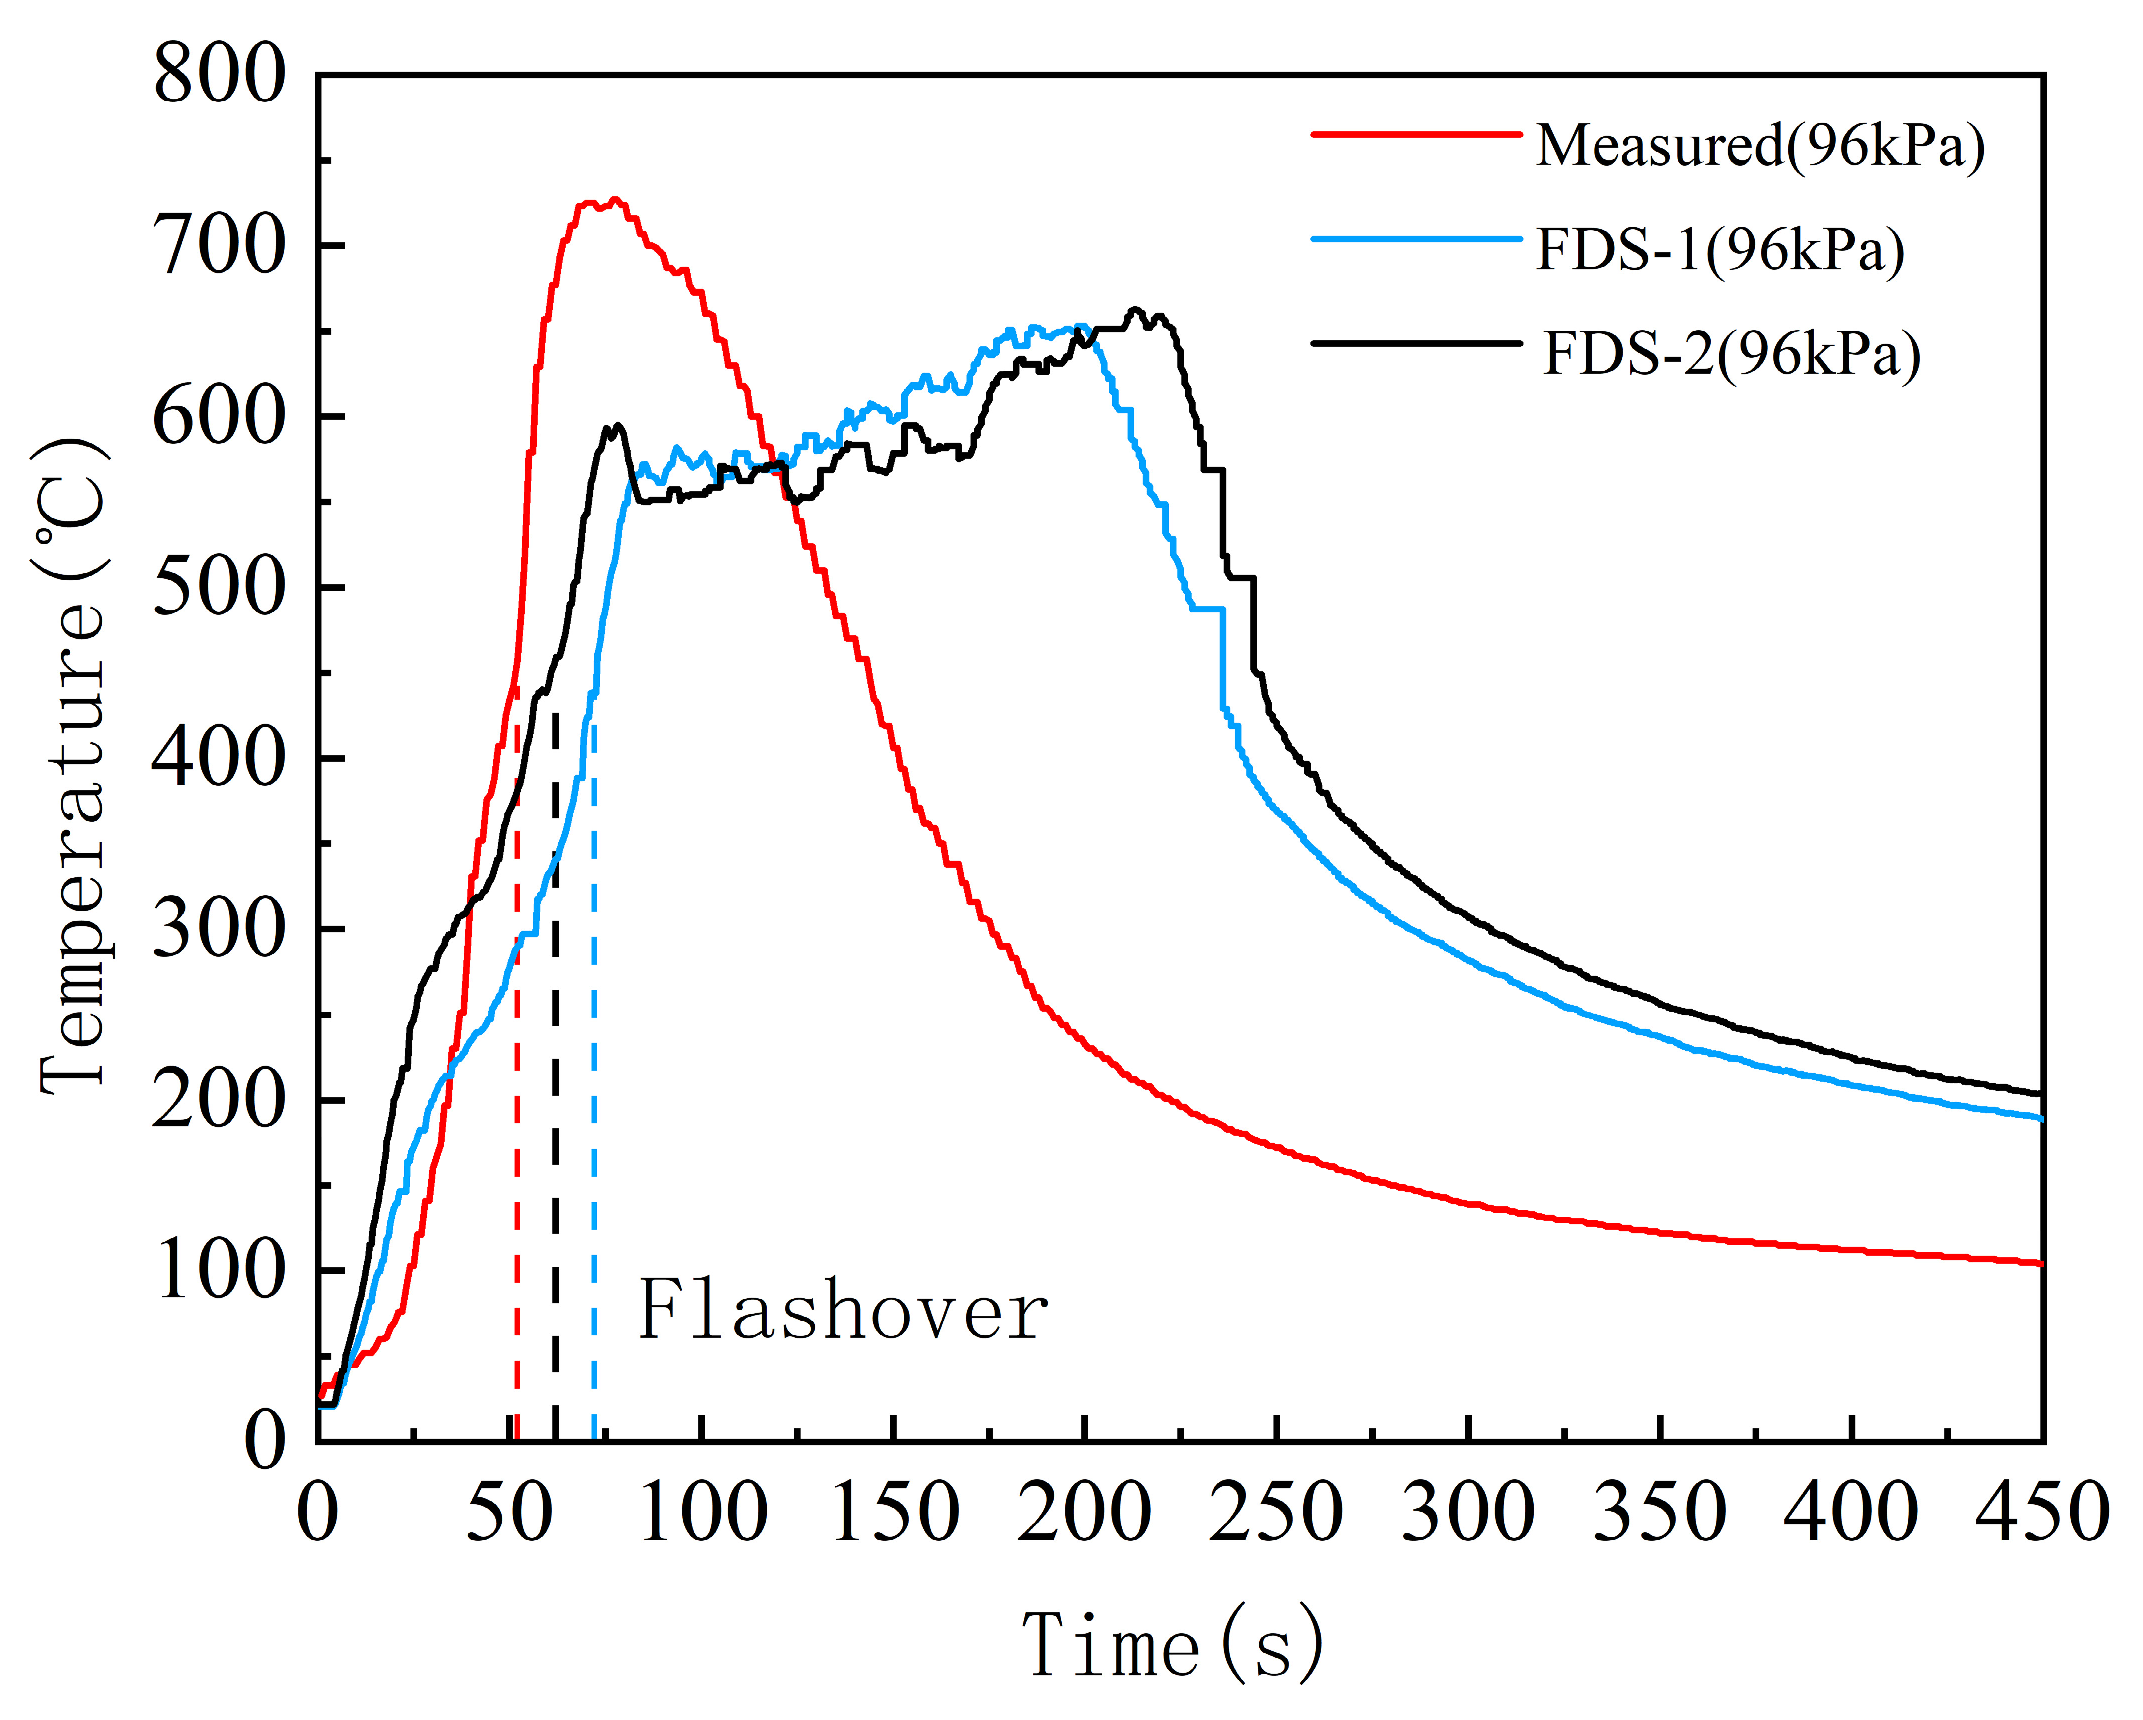
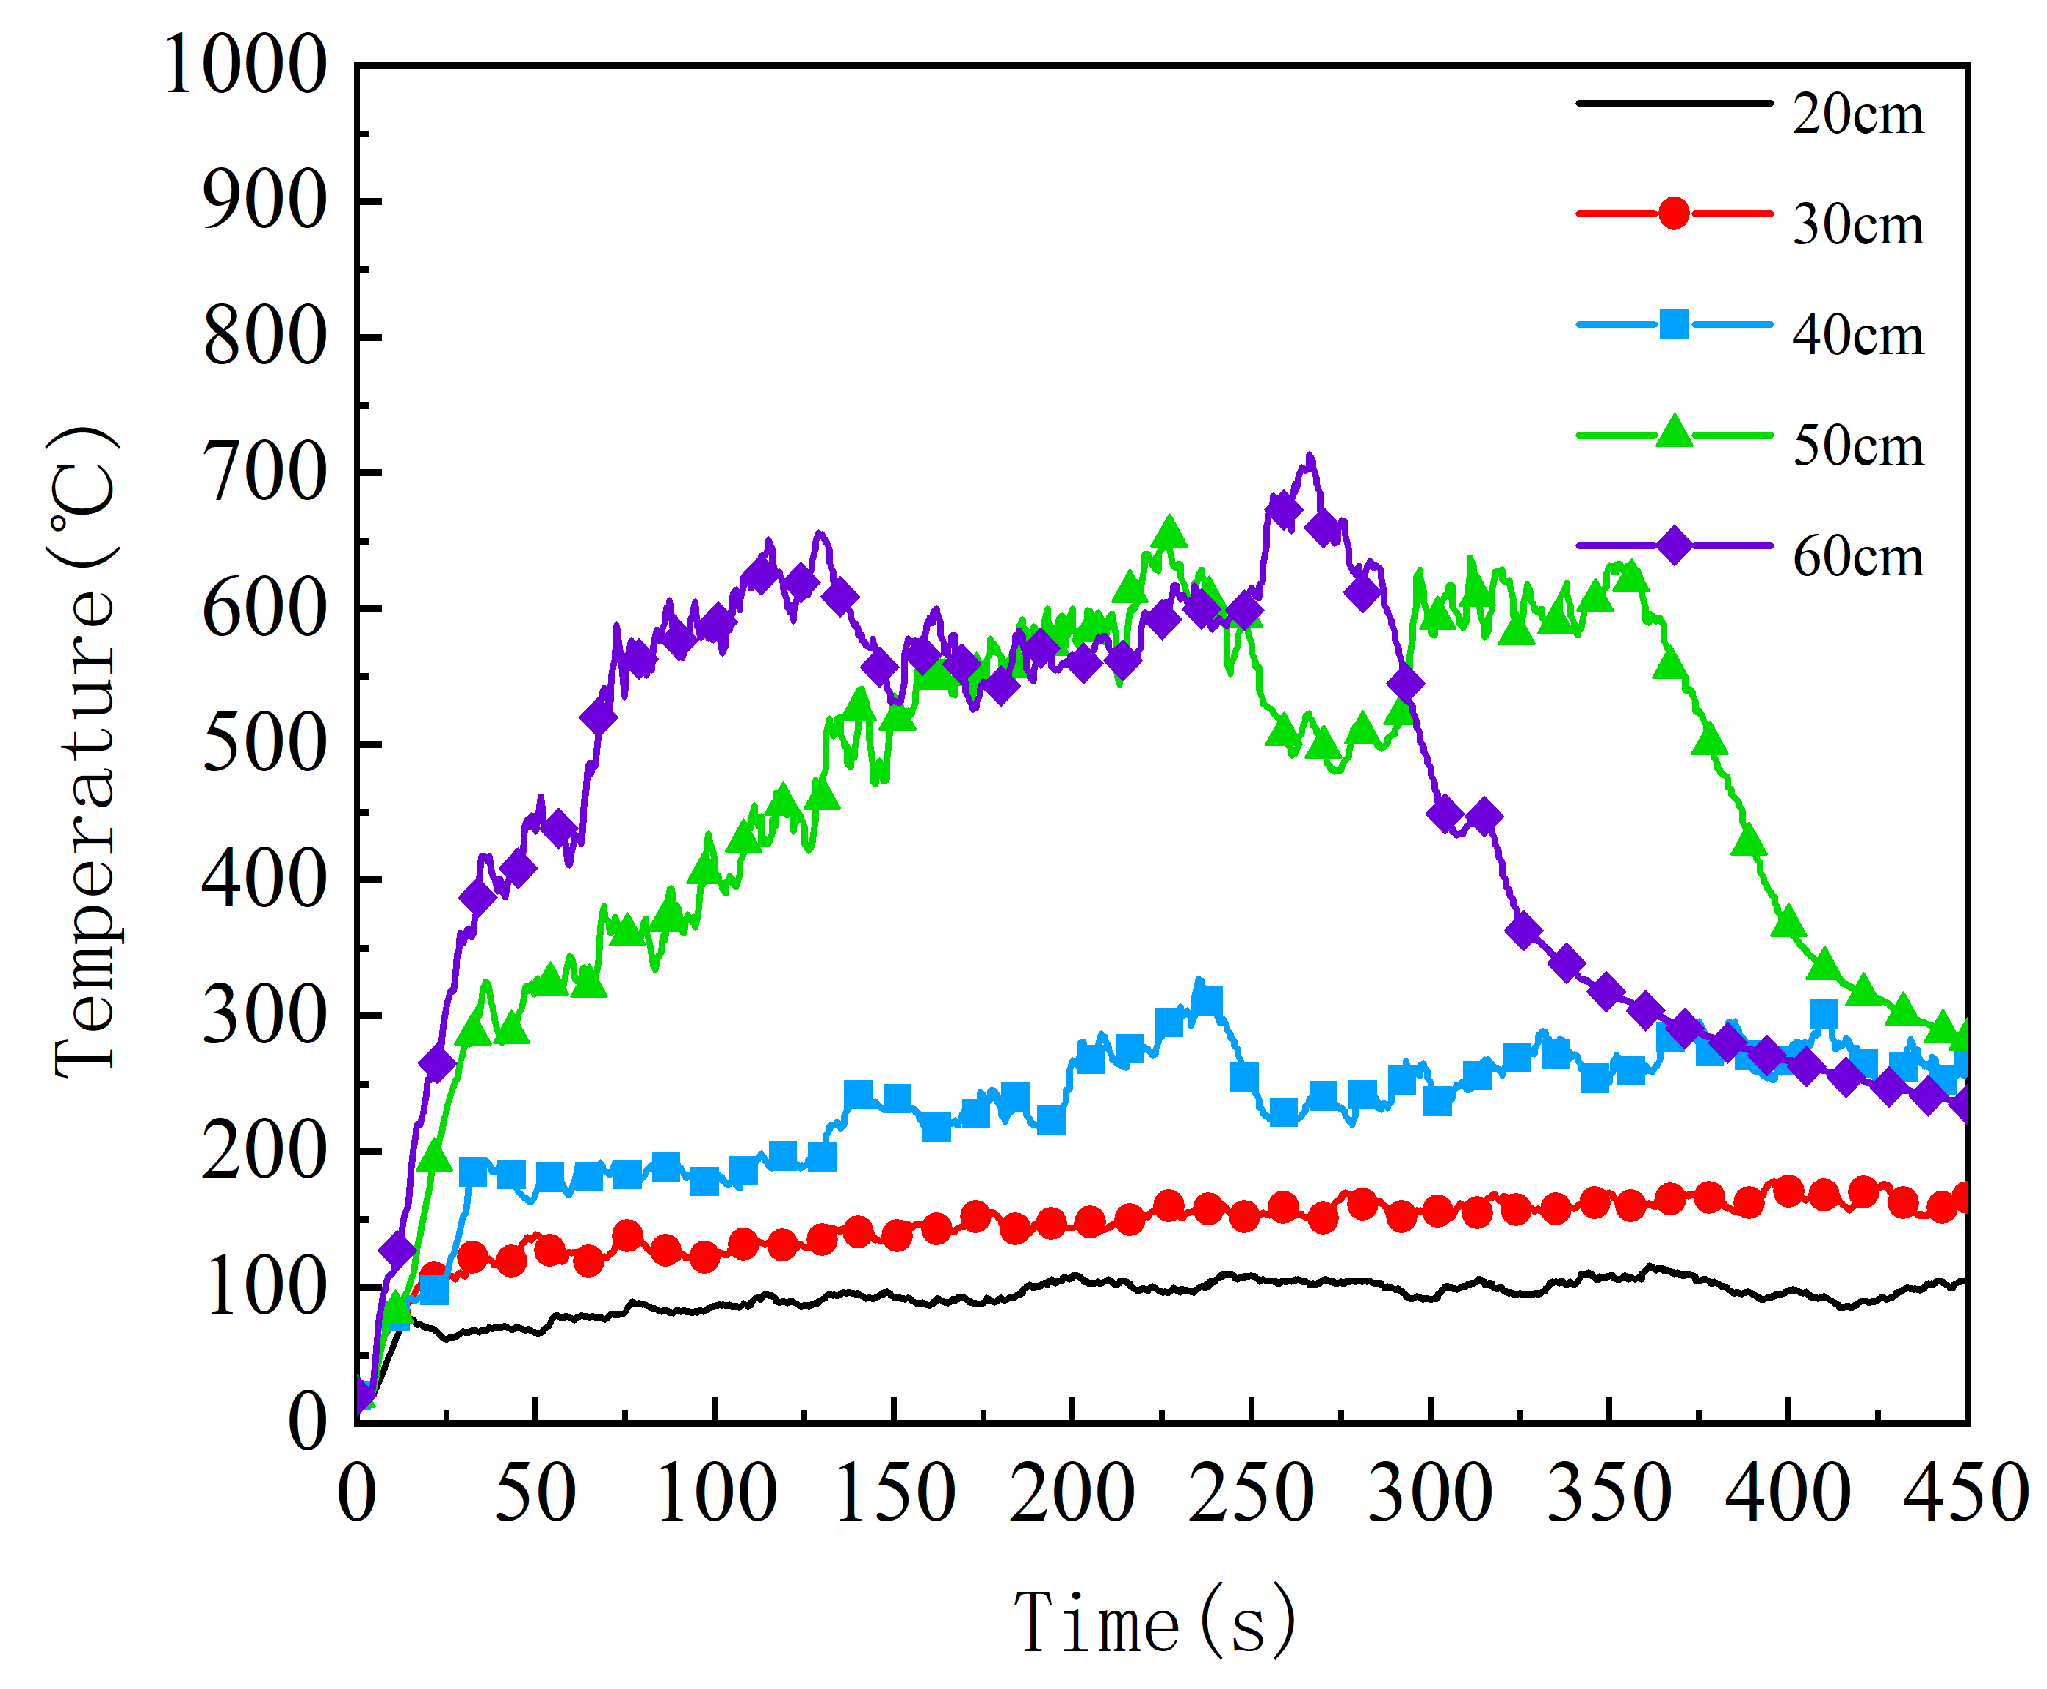
3.1. Effects of Pressure

Burning rates or mass loss rates are shown in the form of HRR in Figure 4 and Figure 5. The fuel lost weight much slower on the plateau due to the low oxygen partial pressure. The combustion reaction rate was limited due to the quantity of oxygen molecules. The time from ignition to flashover at high altitude was about three times as much as that near sea level. The whole burning process also lasted longer, especially for those cases in which flashover did not occur. Curiously, fuels all burnt out about 200 s after the onset of flashover, no matter whether at low or atmospheric pressure. A possible reason could be that the combustion is not complete in the low-pressure case, though the fuel is vaporized.
The HRRs at the moments when flashover occurred are about 400 kW, 500 kW, and 300 kW for the 40-cm, 50-cm, and 60-cm pool fires at 96 kPa; 350 kW and 500 kW for 50-cm, and the 60-cm pool fire at 60 kPa. No strong relationship was found between HRR and pressure probably due to the experimental errors since HRR changed rapidly in seconds. HRR curves were integrated to plot the total heat release over time (Figure 8 and Figure 9). It was observed that the total heat releases at the flashover onset time in Kangding were about three times more than those in Guanghan. The total heat releases in Kangding were both around 50,000 kWs and in Guanghan were between 15,000 kWs and 20,000 kWs. The occurrence of flashover requires a higher heat on the plateau because of the slower heat release rate, longer duration and larger amount of heat loss. There may be an association between the total heat release, flashover onset time and pressure. However, the current data are insufficient to support this hypothesis.
According to the pressure model [36] derived by De Ris et al., the steady mass burning rate m ˙ can be written as a function of the Grahof number (Gr):
m ˙ D = f G r = f g P 2 L 3 μ R 2 T 2 T f T T ~ f ( P 2 L 3 )
where characteristic length L is usually represented by the pool dimensions D , therefore:
m ˙ D ~ f ( P 2 D 3 )
Zhou et al. [37] specified a quasi-steady burning stage of n-heptane from which the mean burning rate was calculated. The m ˙ / D was found to be correlated with P 2 D 3 by the power of 0.45. In this study, the quasi-steady burning stage is distinguished as 40 s to 60 s before flashover. Figure 10 shows that the fitting powers are 0.48 for Guanghan and 0.58 for Kangding. The results are close although the pool size in the experiments were smaller (10–25 cm) and no flashover occurred. Thus, there was a relatively longer steady stage. Peak burning rate m ˙ m a x is also correlated with P 2 D 3 , shown in Figure 11, by powers of 0.76 for Guanghan and 0.86 for Kangding. Therefore, the peak burning rate of n-heptane can be estimated through this relationship even if flashover occurs.
Yin et al. [38] derived a linear relationship between radiant heat flux and pressure:
( Q ˙ r P 2 ) 1 4 ~ ( P Q ˙ ) 2 3
where Q ˙ r is the radiant heat flux and Q ˙ is the total heat release.
A good fit is not found in this study (Figure 12), probably due to the difference in measuring position. They measured the radiant heat flux 60 cm above the pan instead of the radiant heat flux on floor.

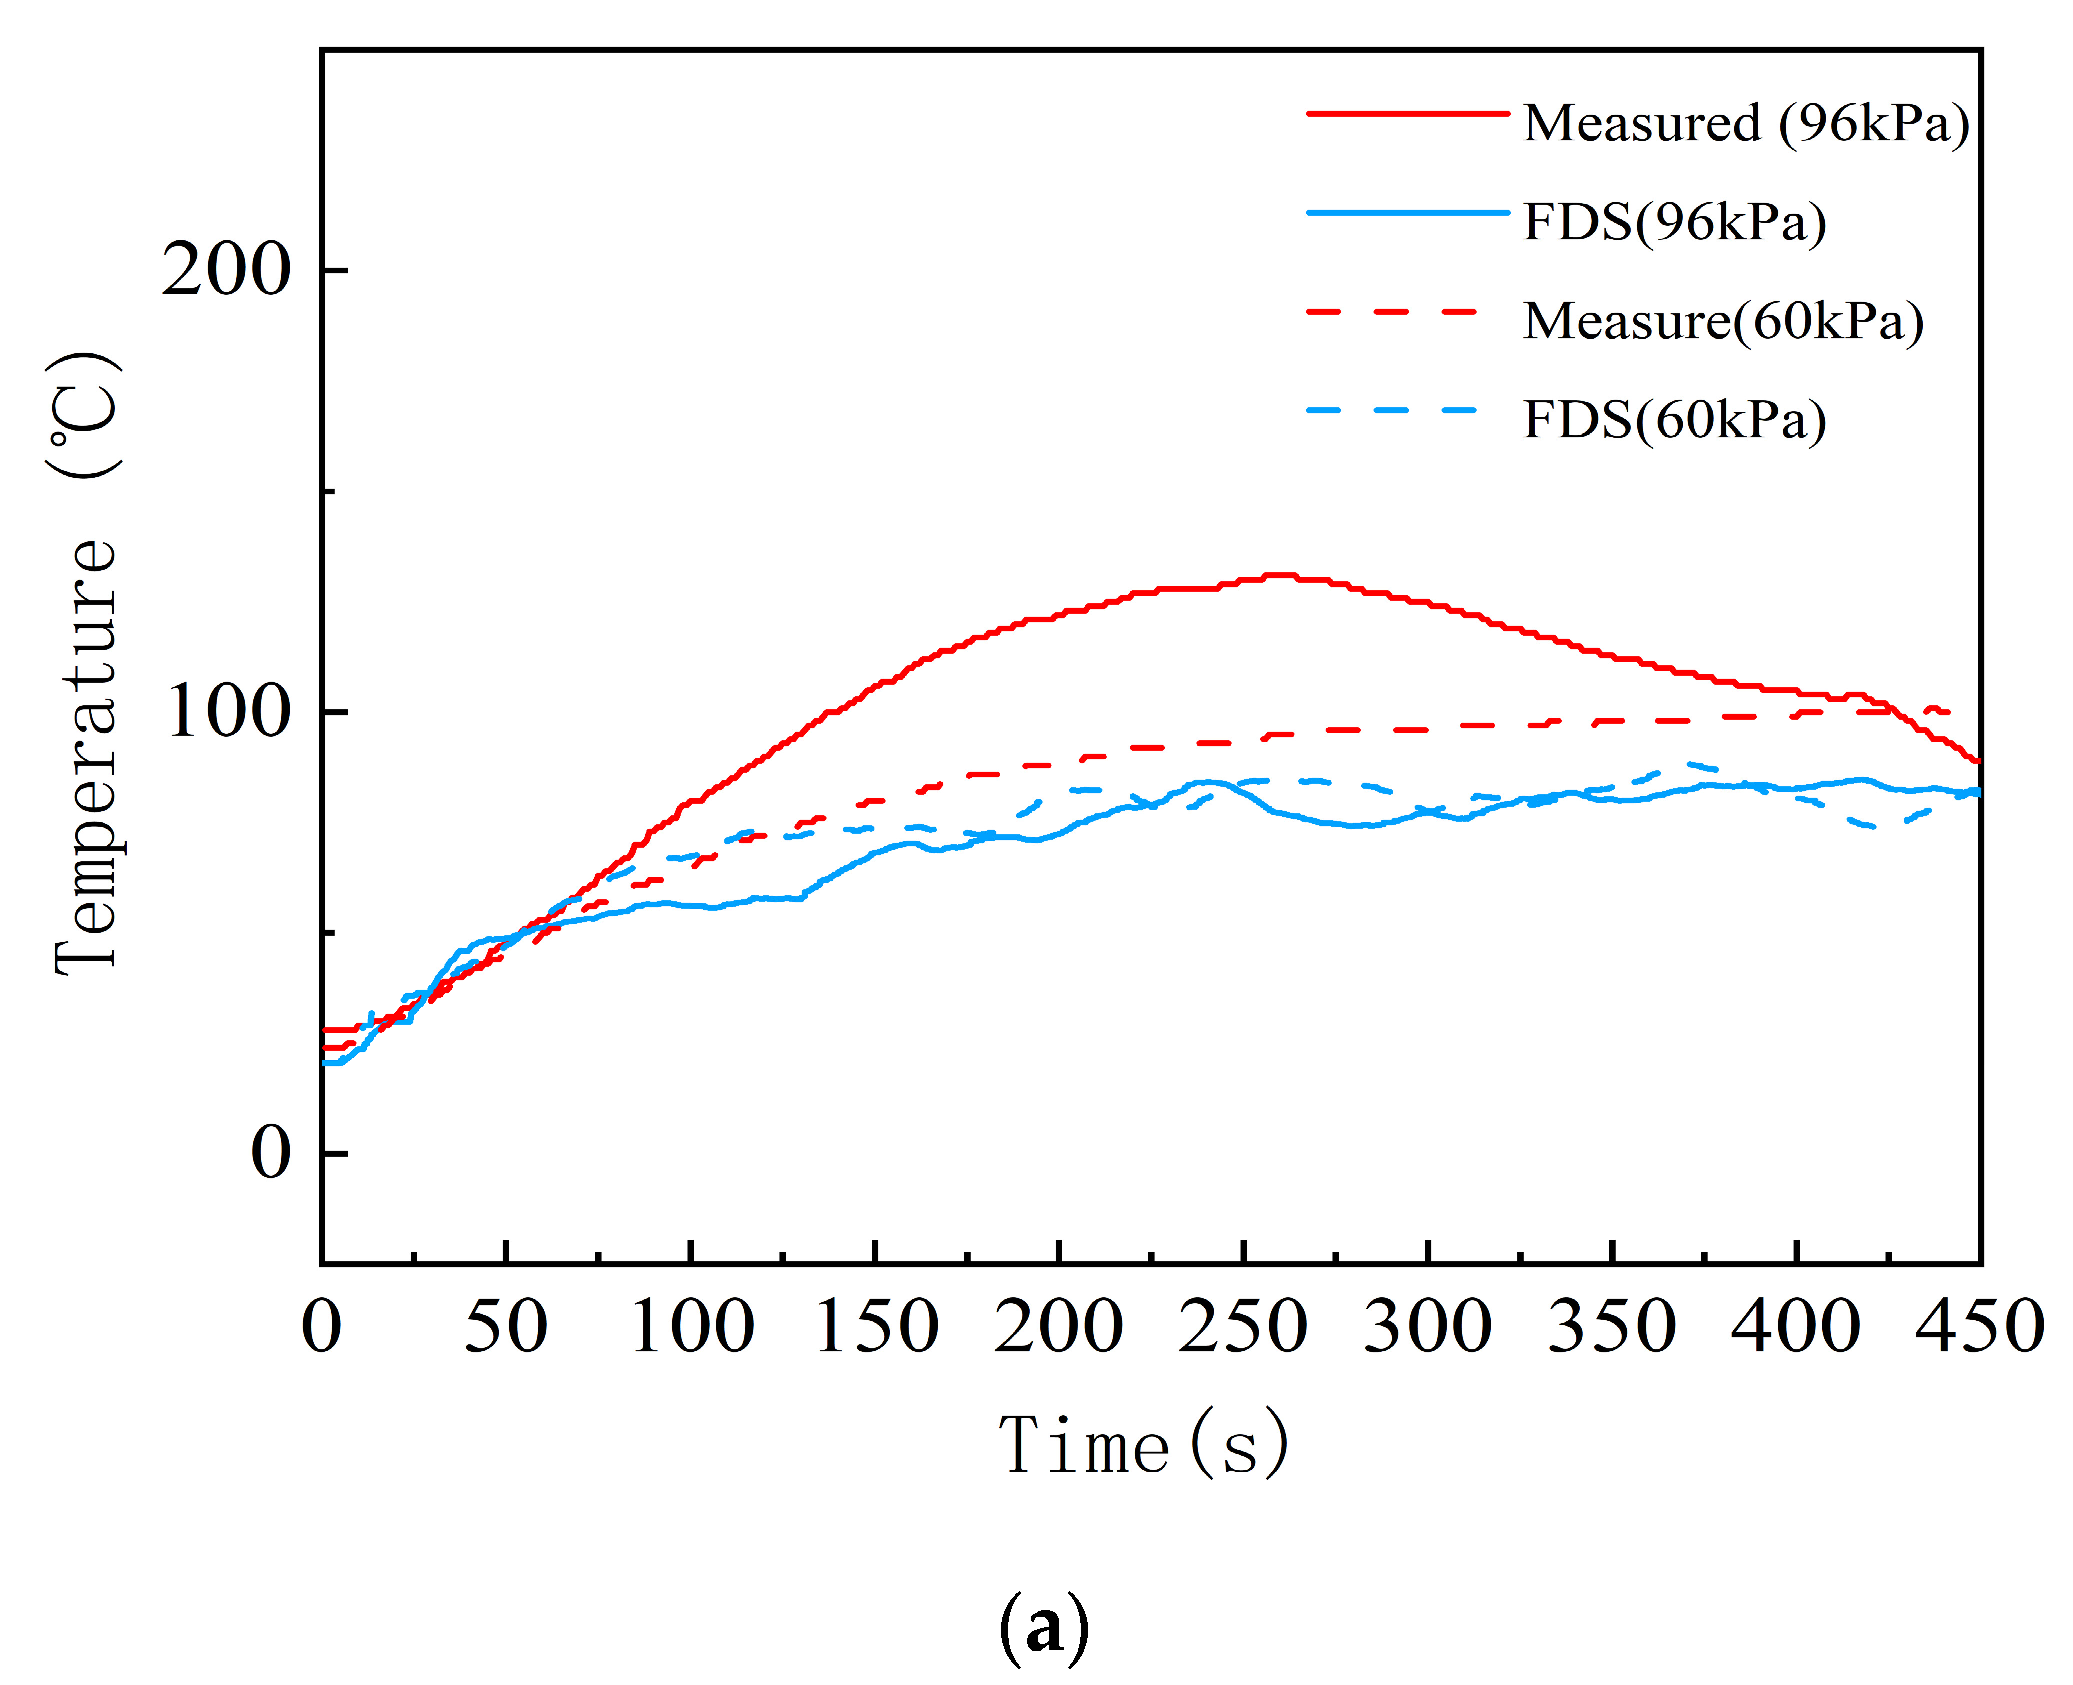
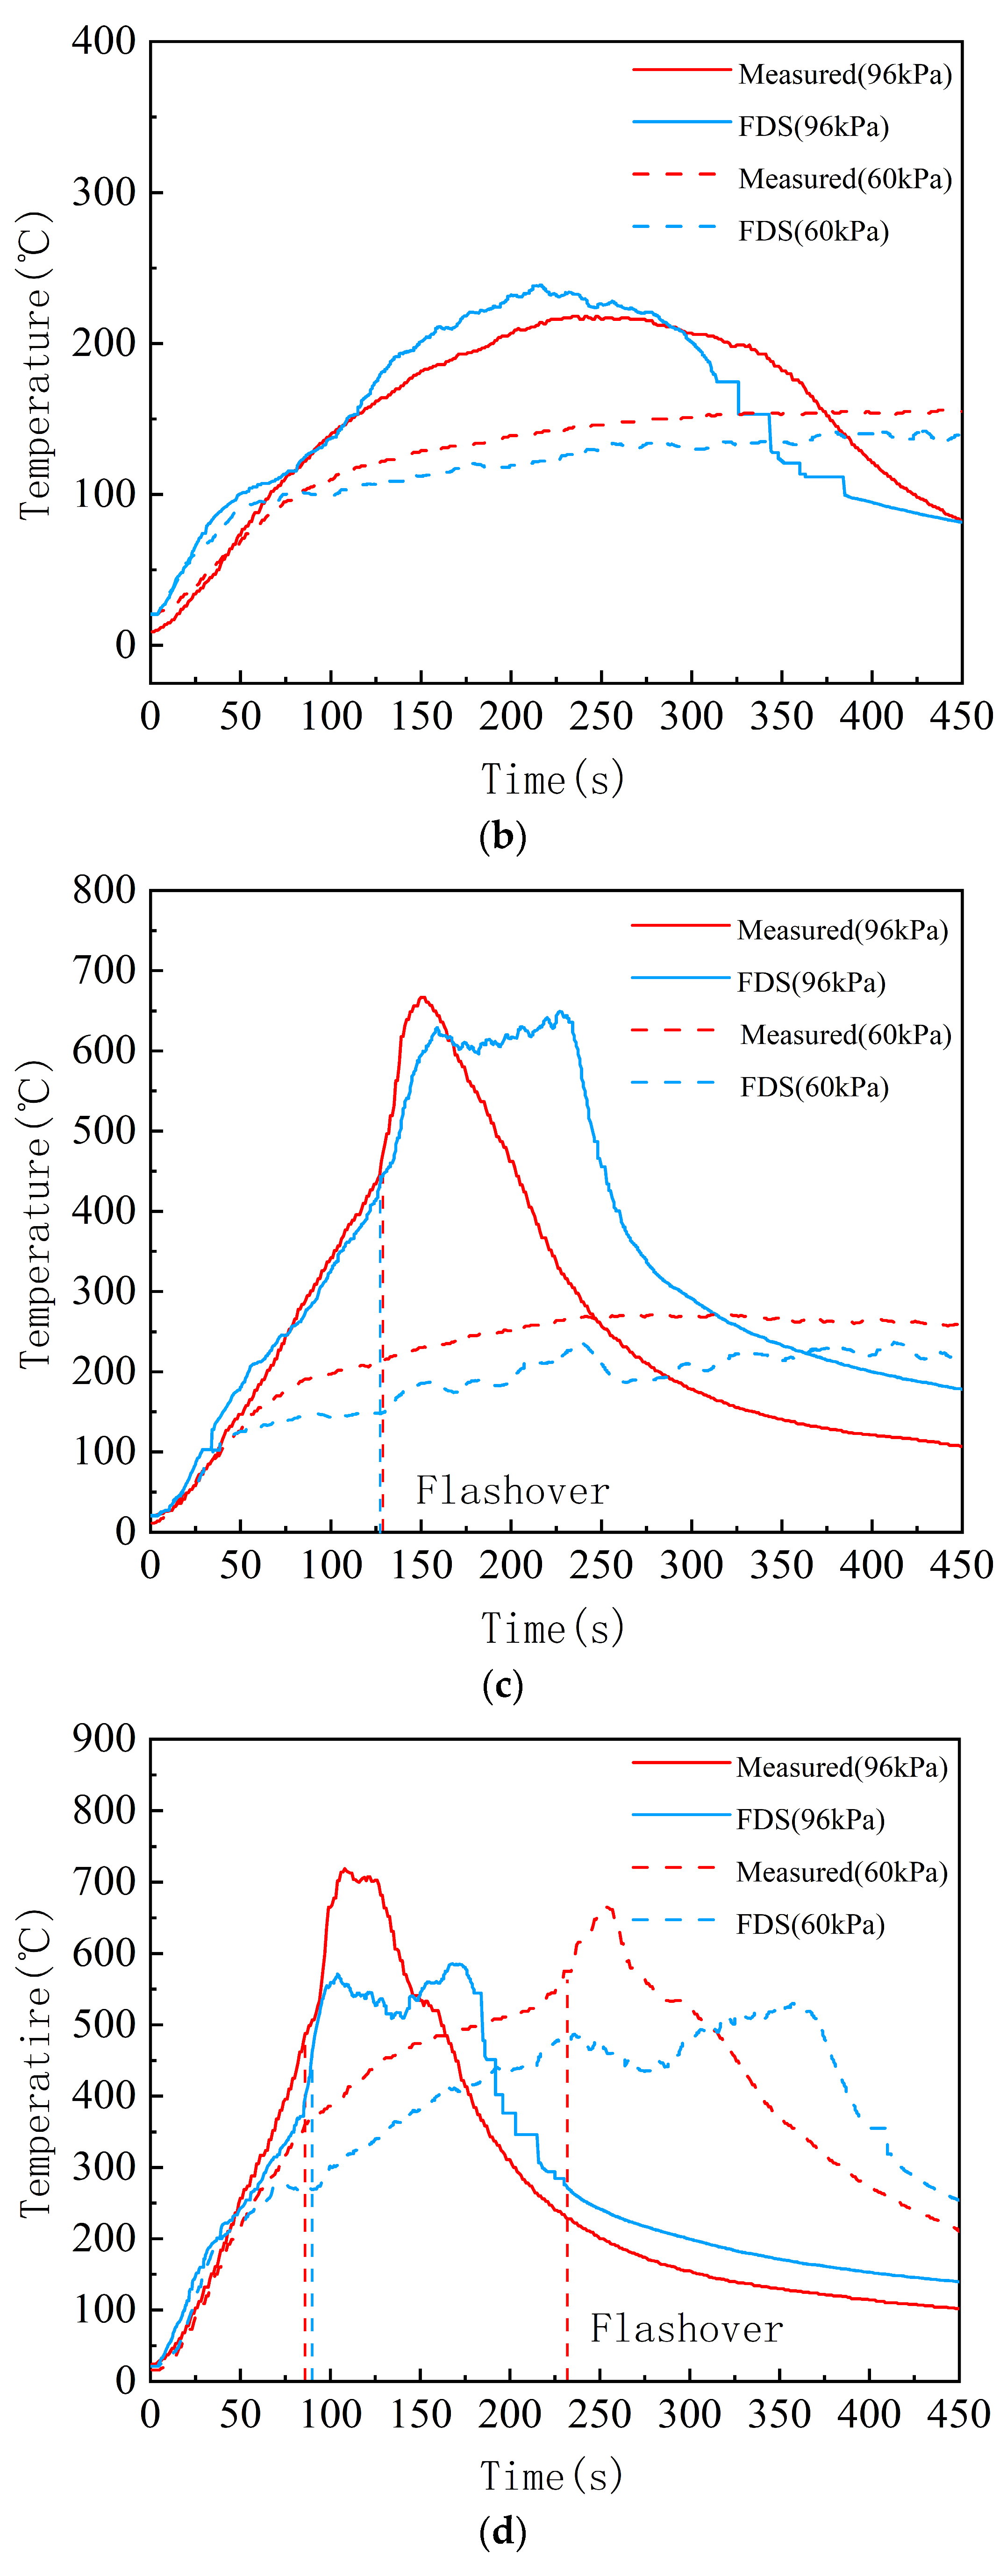
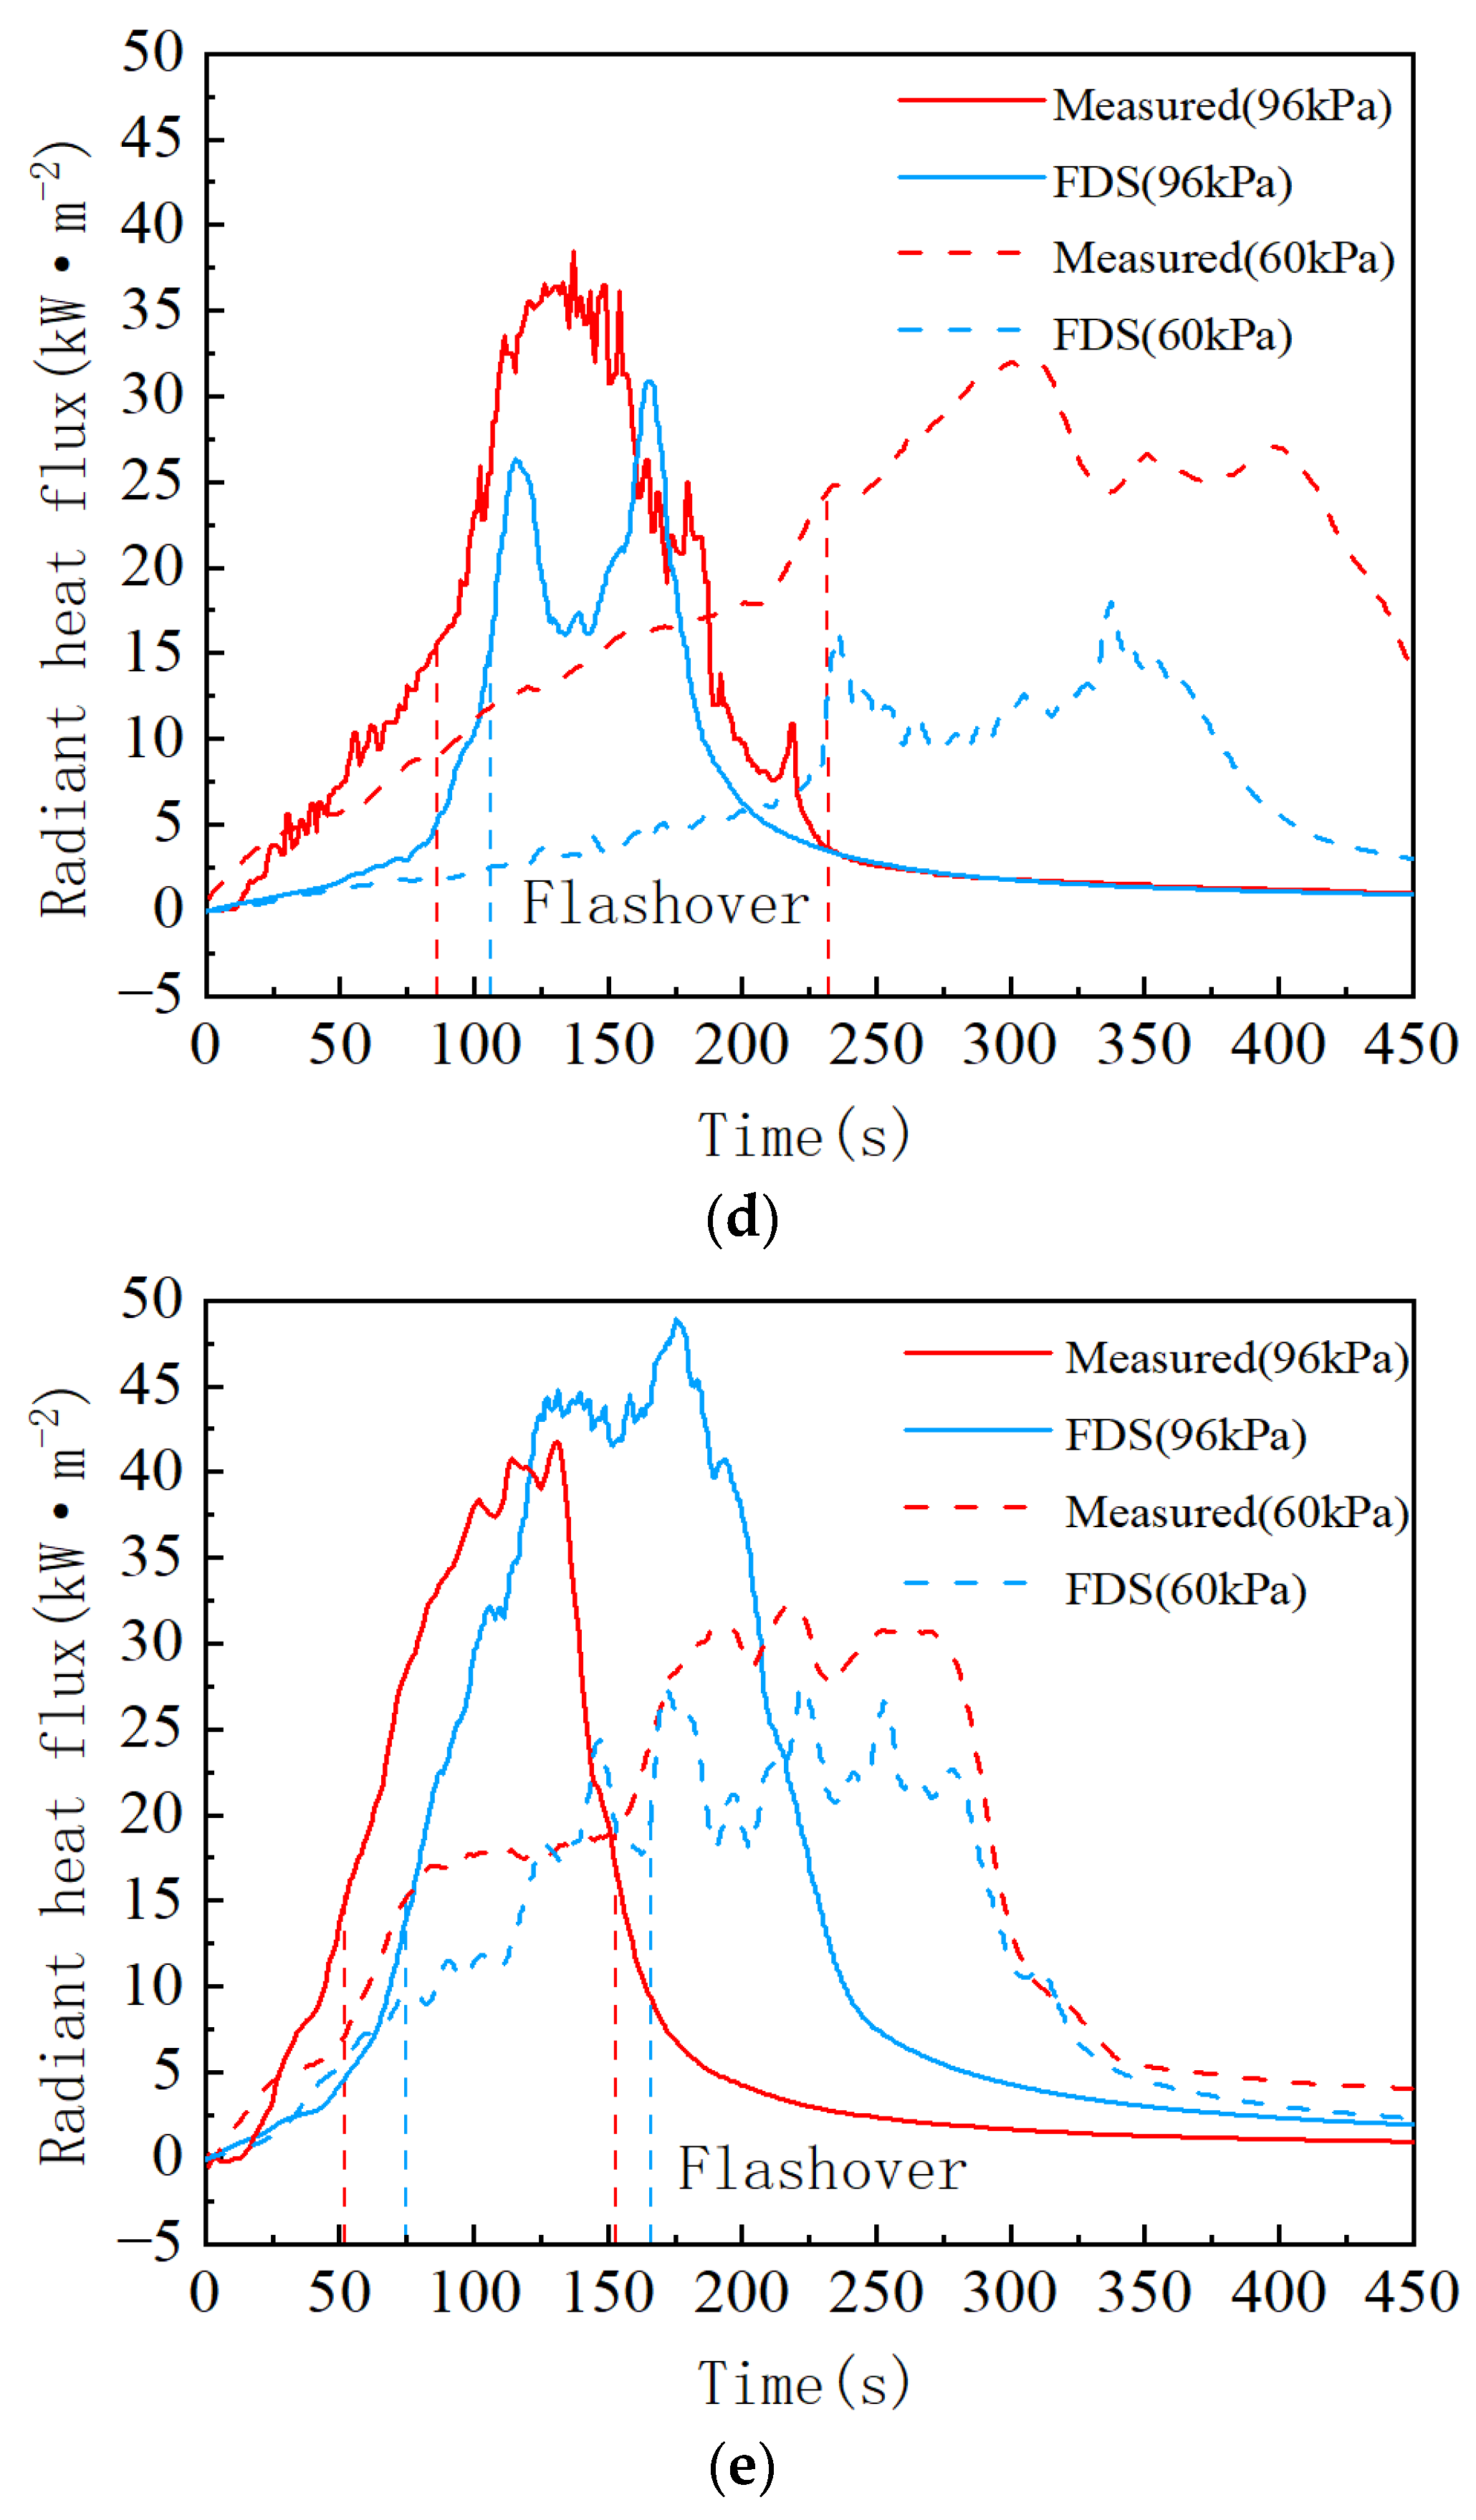
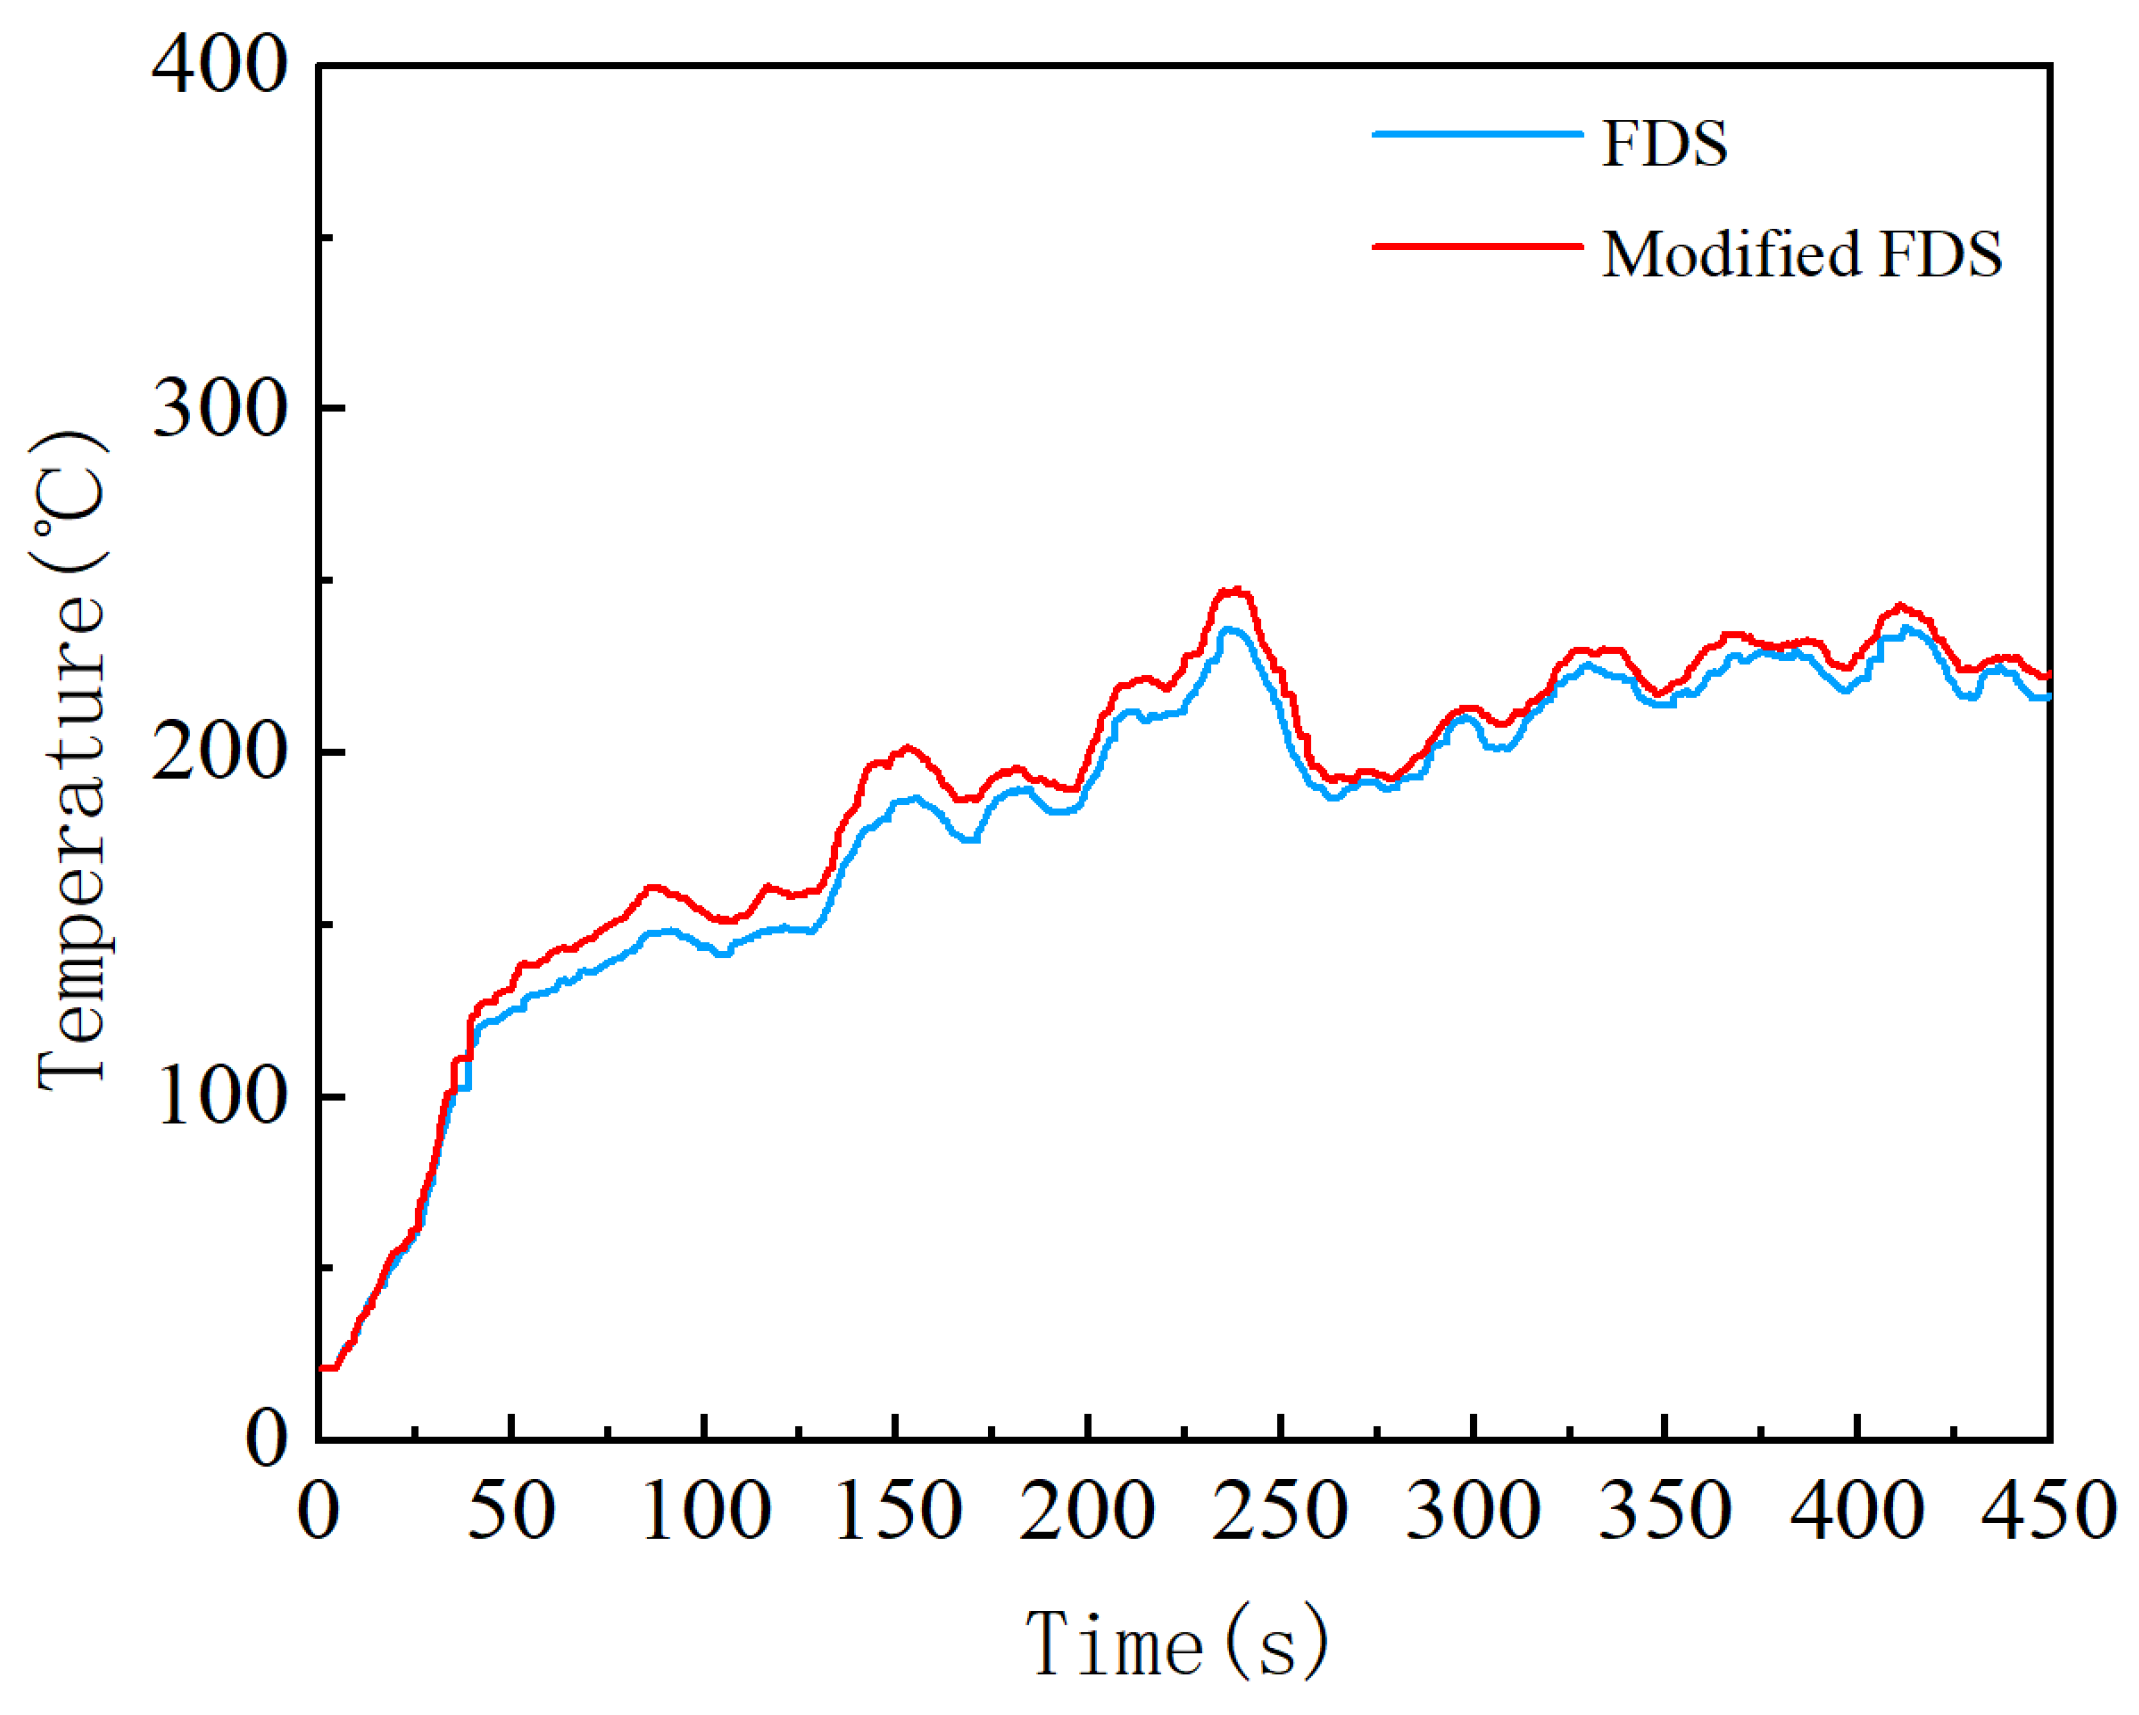
3.2. Comparison of Average Upper Layer Temperatures between Experiments and Simulations

Figure 13 shows a comparison of the simulated and experimental average upper layer temperature at different fire sizes and pressures. Flashover was not observed when the pool size was smaller than 40 cm both in Guanghan and Kangding, and also did not take place at 40 cm in Kangding. The predictions agree with the experimental results. In Guanghan, at a pressure of 96 kPa, flashover from the 40-cm pool fire occurred at 127 s after ignition. The average upper layer temperature then peaked at 667 °C in 23 s. The pre-flashover temperature by FDS stayed highly aligned with the measured temperature and the flashover onset times almost overlapped. There is a difference of about 50 °C between the curves. Moreover, rather than an obvious single peak, the simulated temperature curve seems to have multiple small peaks or more likely a platform which results in the retention at peak level and the later decline in temperature. When the pool fire size was increased to 50 cm, flashover occurred in both places, but 138 s later in Kangding (221 s) than in Guanghan (83 s). The trend of temperature change is alike except for the multiple peaks and delayed temperature decrease. The predicted occurrence of flashover at 96 kPa was close to the measurement which is 7 s later. However, the difference between the experimental temperature and the predicted temperature is up to about 150 °C.
Such a temperature difference of up to 200 °C also exists in the case of 60 kPa. As a consequence, the predicted average upper layer temperature did not reach the critical temperature although the boxes were actually “burnt away” in Smokeview. For the 60 cm pool fire, similar results were found. A simulated 96 kPa flashover took place at 73 s which is 19 s later than the experimental observation. Despite a very good agreement between the measured and predicted average upper layer temperature, the latter did not reach the critical temperature. Again, the boxes disappeared in Smokeview.
In all cases, the onset average upper layer temperature for flashover is about 450 °C at 96 kPa and about 550 °C at 60 kPa experimentally. Generally, there is very good agreement between the measurement and simulation in the early stages. Thus, the onset time of flashover can be accurately predicted. With regard to the differences in magnitudes or the delay in simulated results, they could be caused by various factors which will be discussed in Section 3.4.

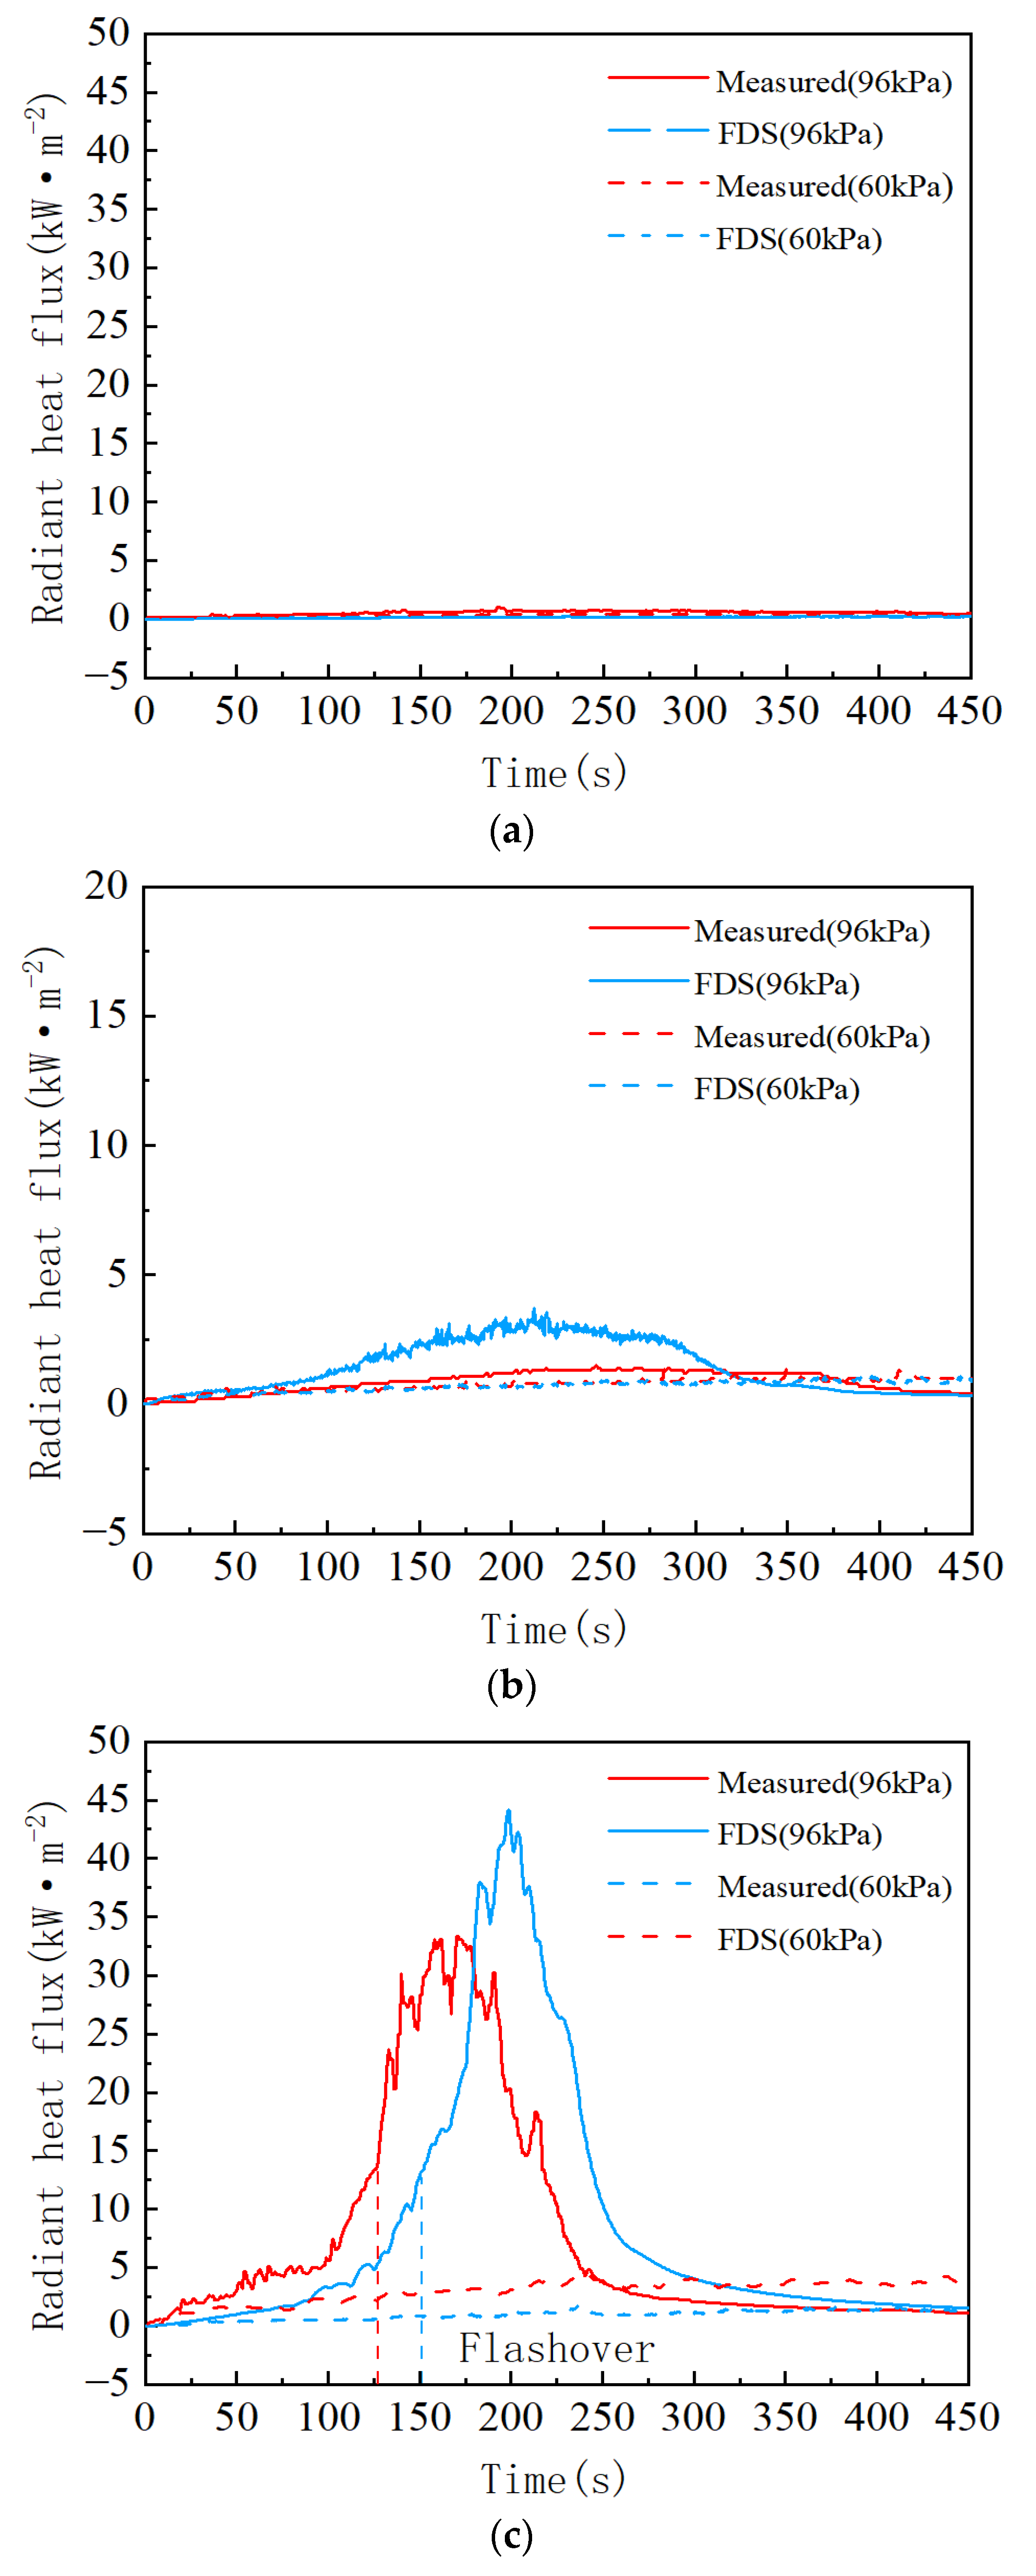
3.3. Comparison of the Radiant Heat Flux at Floor Level between Experiments and Simulations

The radiant heat flux at floor level from experiments and FDS for different sizes of pool fire and pressures are plotted in Figure 14. When the pool size was smaller than 50 cm at which flashover did not take place, the maximum radiant heat flux at floor level did not exceed 5 kW/m2 at both 96 kPa and 60 kPa, and only a slight deviation between experimental and simulated curves was observed. The experimental results show that the critical conditions are about 10 to 15 kW/m2 for 96 kPa and 20 to 25 kW/m2 for 60 kPa. In the case of the 40-cm pool fire at 96 kPa, the predicted heat flux rose later and has a higher peak than the measured data. The same findings were discovered in the case of the 60-cm pool fire at 96 kPa. When it comes to the 50-cm pool fire at 96 kPa, there was also a delay of flashover onset time but with lower peaks. All the deviations were about 25 s which is somewhat regular and larger than in the average upper layer temperature.
At 60 kPa, FDS usually provides low predictions on heat flux, especially for the 50-cm pool fire. As with the average upper layer temperature, the simulated radiant heat flux at floor level fails to reflect the flashover onset time of the 50-cm pool fire since it cannot reach the critical value. But, unlike the average upper layer temperature, it matches the experimental data of the 60-cm pool fire fairly well and the prediction of flashover onset is 13 s later than experimental observation.

3.4. Uncertainty and Error Analysis

There are multiple possible reasons for the differences between experimental and predicted results.
Firstly, due to the difficulty in experimenting on the plateau, material characterization was performed in Guanghan. This might be the primary factor influencing the accuracy of prediction at low pressure. In addition, experimental errors during sampling, measuring, or analyzing always exist. For example, the heat release rate per unit area (HRRPUA) for one fuel burning in the same environment should be constant theoretically, as well as the total heat release. The values of total heat release can be obtained by calculating the area under the heat release rate curves (Table 3). Apparently, they are not the same. As an important input parameter, HRRPUA fatally impacts the results. Suppose case 5 was run with a higher HRRPUA such as that of case 3, the average upper layer temperature curve would be the black one in Figure 15, which could indicate a flashover onset time that was 10 s earlier.
The differences in the shape of the curves have been reported in many previous research studies. In the large-scale fire tests reported in [39], FDS temperature predictions were found to be within 15% of the measured temperatures. The accuracy usually decreased with the distance from the fire source and the ceiling according to previous studies [4,40], which means that the simulated temperature right above the fuel pan and close to the ceiling should be closest to the experimental data (Figure 16 and Figure 17). The temperature at other positions would contribute to the deviations when the average temperature is calculated.
It was also found that the prediction of temperature in the early stage of a fire was usually closer to the experiment results. If the primary interest is in the onset of flashover, the post-flashover period should not be of much importance.
A modified FDS suitable for a low pressure situation [27] has also been applied in this study. However, the change is not significant. A comparison of the average upper layer temperature of the 40-cm pool fire is shown in Figure 18 as an example.

4. Conclusions

In this study, experiments on flashover characteristics of different sizes of n-heptane pool fires were carried out on sea-level plain (96 kPa) and on plateau (60 kPa) areas. From the analysis of the experimental data, the main conclusions are as follows:
  • The critical conditions for the onset of flashover phenomena in a 1/4 MPS compartment were found to be (1) an average upper layer temperature of around 450 °C at 96 kPa and around 550 °C at 60 kPa, and (2) radiant heat flux at floor level of about 10 to 15 kW/m2 at 96 kPa and 20 to 25 kW/m2 at 60 kPa.
  • For the same size of pool, fires were less likely to occur at lower pressure and the flashover phenomena occurred much later.
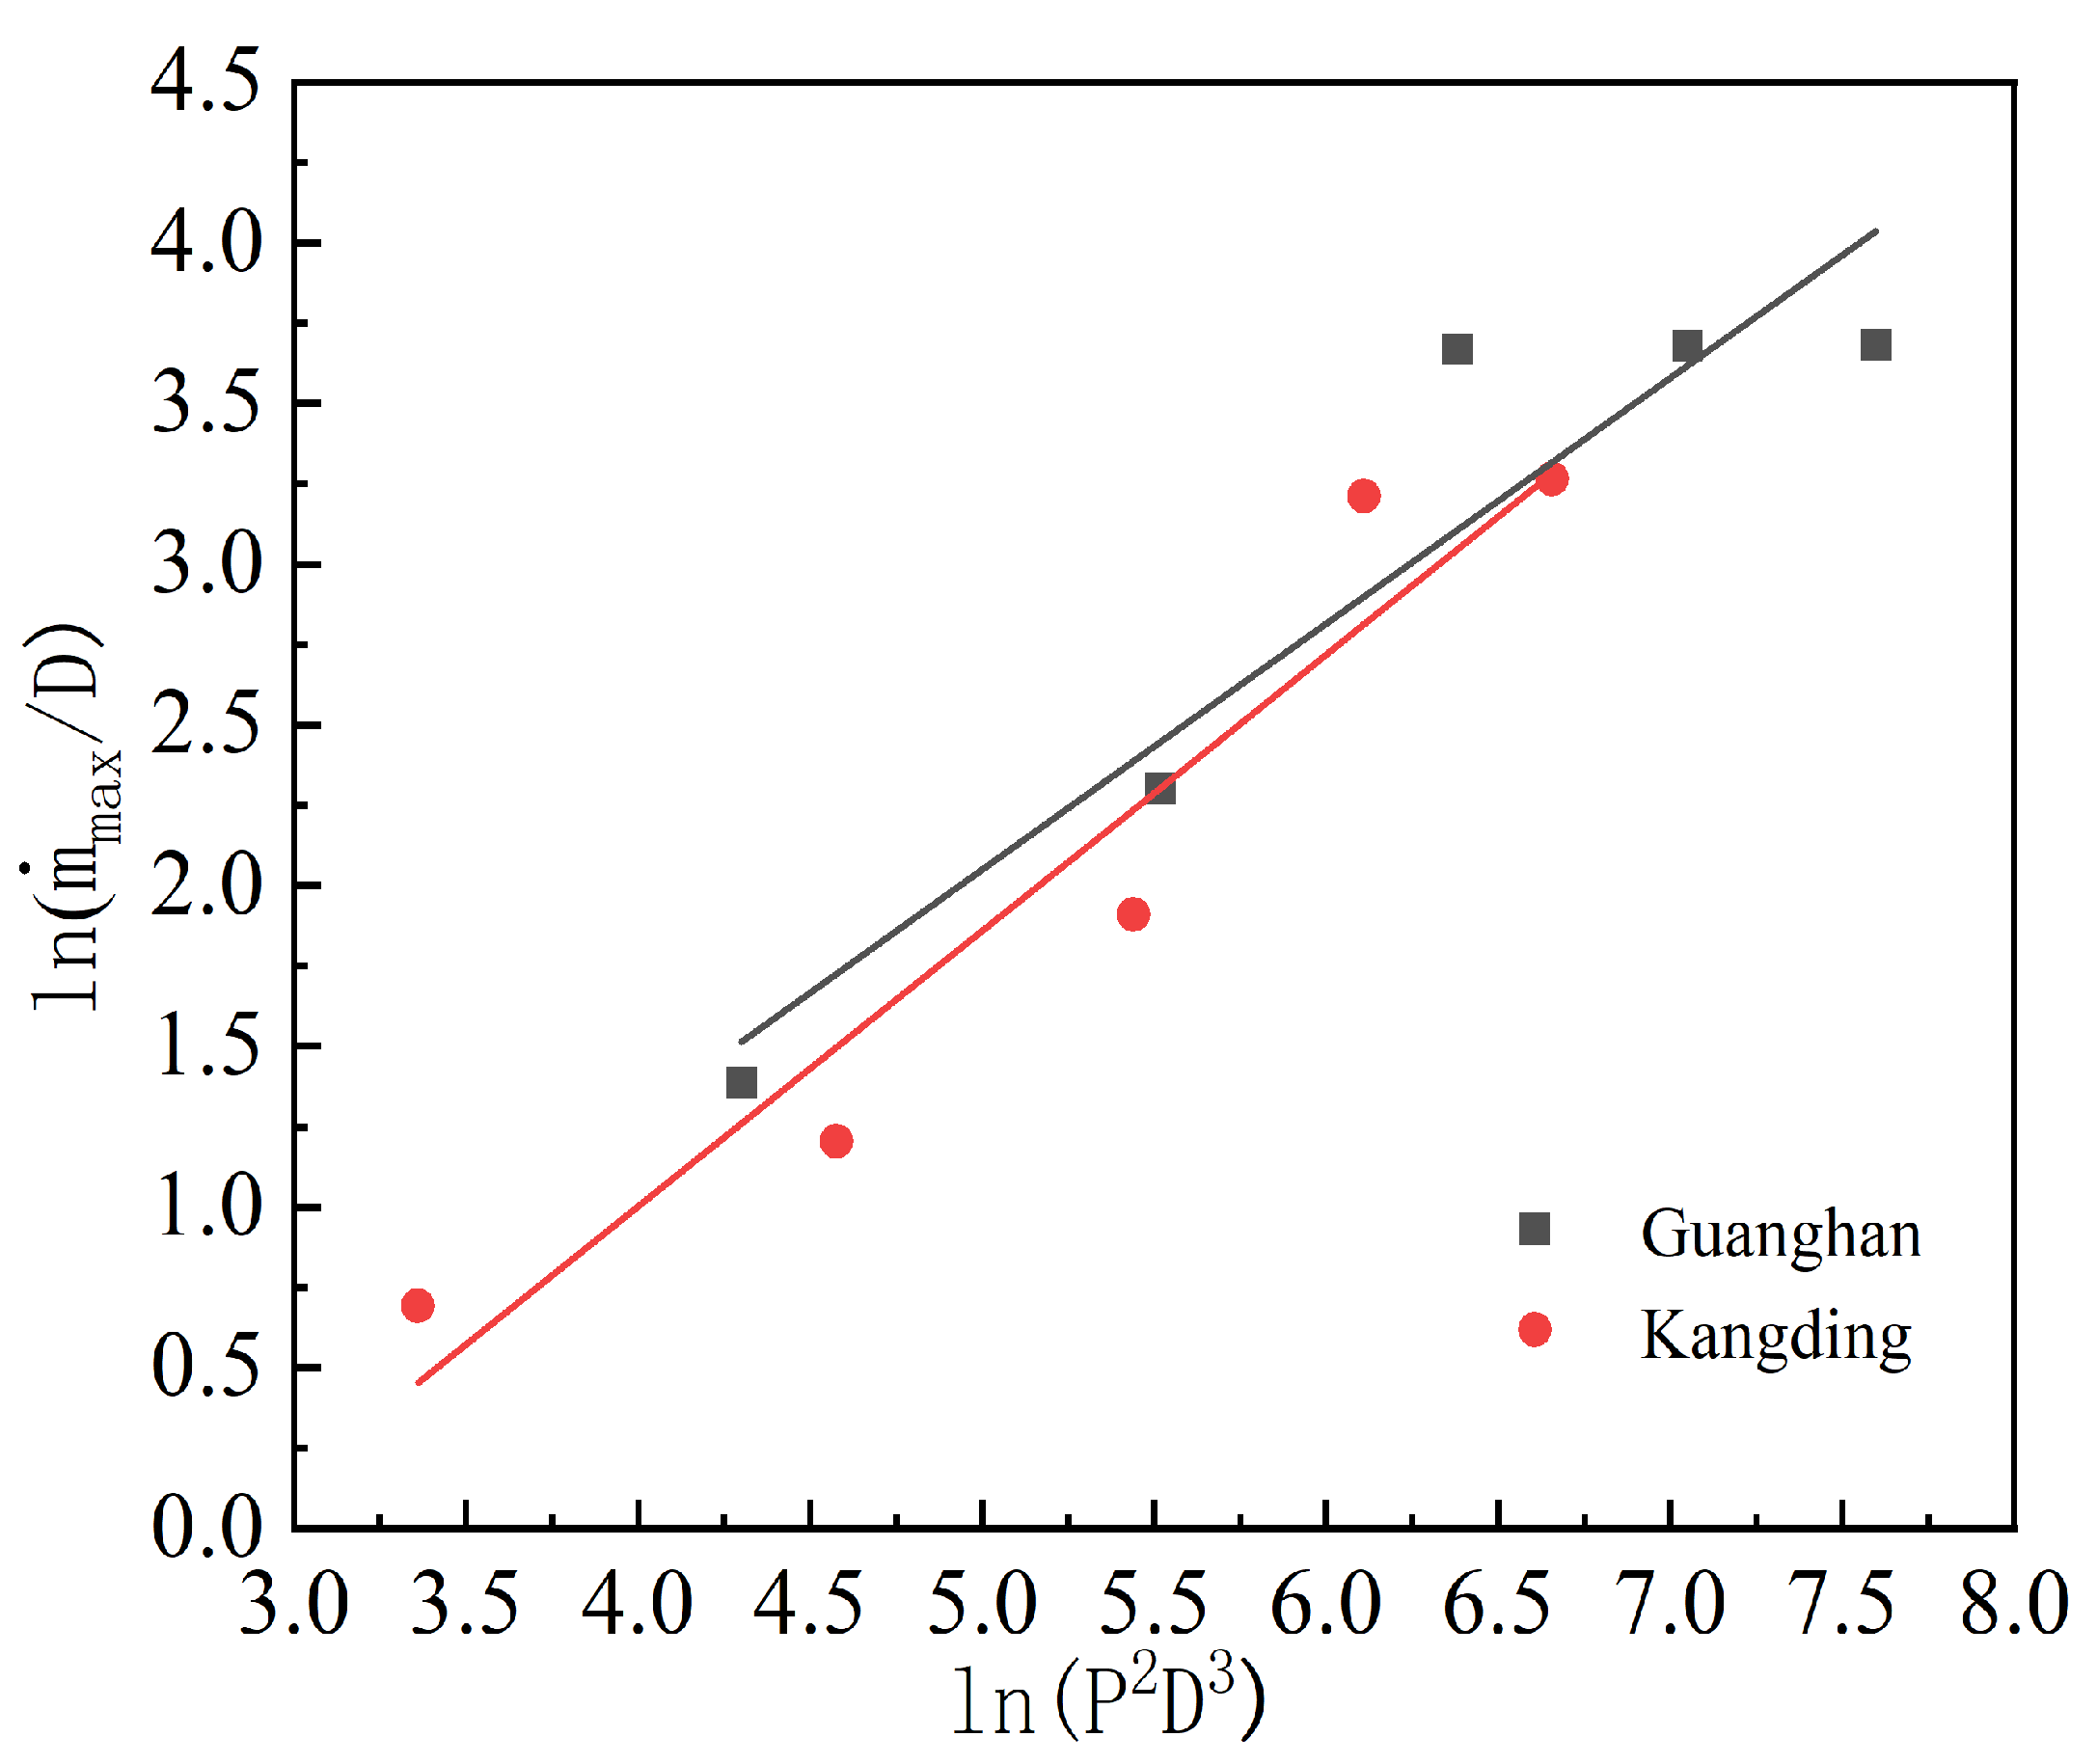
  • The dimensionless burning rate of n-heptane is correlated by P 2 D 3 to the power of 0.48 in Guanghan and 0.58 in Kangding. They are only valid in the quasi-steady burning stage.
  • Peak burning rate can be scaled with P 2 D 3 as m ˙ D ~ f ( P 2 D 3 ) 0.76 in Guanghan and m ˙ D ~ f ( P 2 D 3 ) 0.86 in Kangding.
  • When FDS was applied to predict flashover, the average upper layer temperature criterion usually performed better than heat flux at floor level as a criterion. This agrees with the statement made by the developers in [41], that the prediction of heat flux is less accurate. However, the heat flux may sometimes be referred to when the average upper layer temperature malfunctions. It would be wise to analyze both of them simultaneously. The prediction of flashover onset time was less accurate at low pressure with a delay of about 25 s.
It would be desirable to perform experiments at other altitudes and to better reveal the effect of pressure. However, building experimental platforms at different locations is difficult at present and will be attempted in future planned research.

Author Contributions

Conceptualization, M.L.; methodology, M.L.; software, Y.C.; validation, Y.C.; formal analysis, Y.C.; investigation, M.L.; resources, Y.Z.; data curation, J.W.; writing—original draft preparation, Y.C.; writing—review and editing, M.L.; visualization, Y.Z.; supervision, M.L.; project administration, M.L.; funding acquisition, M.L. All authors have read and agreed to the published version of the manuscript.

Funding

The authors would like to express their gratitude to Wan-ki Chow for his valuable suggestions on this paper. This research was funded by the Civil Aviation Education Talent Foundation of CAAC (¥1,900,000, No. MHJY2022013), the Autonomous Project of Sichuan Key Laboratory of Civil Aircraft Fire Science and Safety Engineering (¥850,000, No. MZ2022JB03), the Civil Aviation Safety Capacity Construction Foundation of CAAC (¥3,900,000, No. MHAQ202275 and ¥2,150,000, No. MHAQ2023030), the Higher Education Talent Cultivation Quality and Teaching Reform Project of Sichuan Science and Technology Agency, 2021–2023 (¥0, No. JG2021-316), and the Special Funds for Higher Education Reform of the Central Government (¥100,000, No. E2022053).

Institutional Review Board Statement

Not applicable.

Informed Consent Statement

Not applicable.

Data Availability Statement

Not applicable.

Conflicts of Interest

The authors declare no conflict of interest.

References

  1. Aviation Safety Network. Available online: https://aviation-safety.net/ (accessed on 22 September 2023).
  2. Willey, A.E. NFPA 921 Guide for Fire and Explosion Investigations, 2004th ed.; National Fire Protection Association: Quincy, MA, USA, 2021. [Google Scholar]
  3. International Organization for Standardization. Fire Tests. Full-Scale Room Test for Surface Products, Designation ISO 9705: 1993(E); American National Standards Institute: Boston, MA, USA, 1993. [Google Scholar]
  4. Zou, G.W.; Chow, W.K. Evaluation of the field model, fire dynamics simulator, for a specific experimental scenario. J. Fire Prot. Eng. 2005, 15, 77–92. [Google Scholar] [CrossRef]
  5. Khalil, E.E.; Othman, M.A. On the Computations of Aircraft Postcrash Fires. In Proceedings of the 54th AIAA Aerospace Sciences Meeting, San Diego, CA, USA, 4–8 January 2016; p. 0994. [Google Scholar]
  6. Zong, R.; Li, S.; Wei, T.; Zhi, Y.; Liao, G. The Simulation and Reconstruction of Flashover in the Confined Space. In Proceedings of the Eleventh Annual Conference of China Association for Science and Technology on Independent Innovation and Sustained Growth, Chongqing, China, 8 September 2009. [Google Scholar]
  7. Li, S.; Zong, R.; Liao, G. Experimental and Modeling Study on Flashover in the Typical Compartment of Extra-high Building Construction. In Proceedings of the 2010 International Forum on Fire Safety and Comprehensive Disaster Prevention Technology of Extra-high Buildings, Guangzhou, China, 20 November 2010. [Google Scholar]
  8. Han, R.; Zhu, G.; Zhang, G.; Zhang, L. Reliability study on characteristics of flashover based on large eddy simulation. Fire Sci. Technol. 2013, 32, 499–507. [Google Scholar]
  9. Bishop, S.R.; Holborn, P.G.; Beard, A.N.; Drysdale, D.D. Nonlinear dynamics of flashover in compartment fires. Fire Saf. J. 1993, 21, 11–45. [Google Scholar] [CrossRef]
  10. Chow, W.K. New inspection criteria for flashover in compartmental fires. Fire Mater. 1999, 23, 13–15. [Google Scholar] [CrossRef]
  11. Chow, W.K. Predictability of flashover by zone models. J. Fire Sci. 1998, 16, 335–350. [Google Scholar] [CrossRef]
  12. Chow, W.K. Do standard fire curves include flashover? J. Appl. Fire Sci. 1998, 7, 353–359. [Google Scholar] [CrossRef]
  13. Hasemi, Y. Thermal Theory of Flashover, Report 111; Building Research Institute: Tsukuba, Japan, 1986. [Google Scholar]
  14. Chow, W.K. Study on the flashover criteria for compartmental fires. J. Fire Sci. 1997, 15, 95–107. [Google Scholar] [CrossRef]
  15. Chow, W.K. Study of flashover using a single zone model. J. Appl. Fire Sci. 1998, 8, 159–175. [Google Scholar] [CrossRef]
  16. Waterman, T.E. Room flashover—Criteria and synthesis. Fire Technol. 1968, 4, 25–31. [Google Scholar] [CrossRef]
  17. Thomas, P.H.; Bullen, M.L.; Quintiere, J.G.; McCaffrey, B.J. Flashover and instabilities in fire behavior. Combust. Flame 1980, 1, 159–171. [Google Scholar] [CrossRef]
  18. Thomas, P.H. The growth of fire-ignition to full involvement. In Combustion Fundamentals of Fire; Academic Press: London, UK, 1995; pp. 275–296. [Google Scholar]
  19. Fang, J.B. Fire Buildup in a Room and the Role of Interior Finish Materials; TN879; US Department of Commerce, National Bureau of Standards: Gaithersburg, MD, USA, 1975.
  20. Heselden, A.J.; Melinek, S.J. The early stages of fire growth in a compartment a co-operative research programme of the international du batiment (commission w 14). first phase. Fire Res. Note 1975, 1029, 1. [Google Scholar]
  21. Lee, B.T.; Breese, J.N. Submarine Compartment Fire Study Performance Evaluation of Hull Insulation; National Institute of Standards and Technology: Gaithersburg, MD, USA, 1979.
  22. Quintiere, J.G.; Mccaffrey, B.J. The burning of wood and plastic cribs in an enclosure. Final. Rep. 1980, 1, 2–4. [Google Scholar]
  23. Parker, W.J.; Lee, B.T. Fire Build-Up In Reduced Size Enclosures. In Fire Safety Research: Proceedings of a Symposium Gaithersburg, MD, USA, 22 August 1973; National Bureau of Standards: Gaithersburg, MD, USA, 1974; p. 139. [Google Scholar]
  24. Klopovic, S.; Turan, O.F. Flames venting externally during full-scale flashover fires: Two sample ventilation cases. Fire Saf. J. 1998, 31, 117–142. [Google Scholar] [CrossRef]
  25. Peacock, R.D.; Reneke, P.A.; Bukowski, R.W. Defining flashover for fire hazard calculations. Fire Saf. J. 1999, 32, 331–345. [Google Scholar] [CrossRef]
  26. Niu, Y.; He, Y.; Hu, X.; Zhou, D.; Lin, C.H.; Yin, J.; Yao, W.; Wang, J. Experimental study of burning rates of cardboard box fires near sea level and at high altitude. Proc. Combust. Inst. 2013, 34, 2565–2573. [Google Scholar] [CrossRef]
  27. Zhou, R.; Zhao, H.; Ye, J.; Zhang, H. A new approach based on the modified FDS to numerically simulate cardboard box combustion under low pressure. Fire Mater. 2019, 43, 1010–1021. [Google Scholar] [CrossRef]
  28. Liu, Q.; Yao, W.; Yin, J.; Yang, R.; Zhang, H. Modeling on n-Heptane pool fire behavior in an altitude chamber. In Proceedings of the ASME International Mechanical Engineering Congress and Exposition, San Diego, CA, USA, 15–21 November 2013. [Google Scholar]
  29. Wang, Z.; Zhu, J. Fire and smoke law of A320 cabin in low pressure environment. Fire Sci. Technol. 2022, 41, 468. [Google Scholar]
  30. Xu, L.; Zheng, W. Numerical simulation on the influence of low air pressure upon smoke spread and fire alarm process. Case Stud. Therm. Eng. 2021, 26, 101004. [Google Scholar] [CrossRef]
  31. U.S. Department of Transportation Federal Aviation Administration. Minimum Performance Standard for Aircraft Cargo Compartment Halon Replacement Fire Suppression Systems (2012 Update); National Technical Information Services: Springfield, VA, USA, 2012.
  32. Blake, D.; Suo-Anttila, J. Aircraft cargo compartment fire detection and smoke transport modeling. Fire Saf. J. 2008, 43, 576–582. [Google Scholar] [CrossRef]
  33. He, Y. On experimental data reduction for zone model validation. J. Fire Sci. 1997, 15, 144–161. [Google Scholar] [CrossRef]
  34. He, Y.; Li, J.; Wang, J.; Wang, K. Experimental study on Flashover Law of Aircraft Cargo Hold in Low Pressure Environment. Fire Sci. Technol. 2022, 41, 1030–1035. [Google Scholar]
  35. McGrattan, K.B.; Hostikka, S.; McDermott, R.; Floyd, J.; Weinschenk, C.; Overholt, K. NIST Special Publication 2019 sixth Edition Fire Dynamics Simulator User’s Guide; National Institute of Standards and Technology: Gaithersburg, MD, USA, 2019.
  36. De Ris, J.; Kanury, A.M.; Yuen, M.C. Pressure modeling of fires. Symp. (Int.) Combust. 1973, 14, 1033–1044. [Google Scholar] [CrossRef]
  37. Zhou, Z.; Yao, W.; Hu, X.; Yuen, R.; Wang, J. Experimental study of the burning behavior of n-heptane pool fires at high altitude. Fire Mater. 2016, 40, 80–88. [Google Scholar] [CrossRef]
  38. Yin, J.; Yao, W.; Liu, Q.; Wu, N.; Zhou, Z.; Wu, Y.; Zhang, H. Experimental Study of N-Heptane Pool Fire Behaviors under Dynamic Pressures in an Altitude Chamber. Procedia Eng. 2013, 52, 548–556. [Google Scholar]
  39. McGrattan, K.B.; Baum, H.R.; Rehm, R.G. Large eddy simulations of smoke movement. Fire Saf. J. 1998, 30, 161–178. [Google Scholar] [CrossRef]
  40. Zhang, W.; Hamer, A.; Klassen, M.; Carpenter, D.; Roby, R. Turbulence statistics in a fire room model by large eddy simulation. Fire Saf. J. 2002, 37, 721–752. [Google Scholar] [CrossRef]
  41. McGrattan, K.B.; Peacock, R.; Overholt, K. Fire model validation–eight lessons learned. Fire Saf. Sci. 2014, 11, 958–968. [Google Scholar] [CrossRef]
Figure 1. Experiment setup: (a) inside and (b) outside of the 1/4 MPS compartment.
Fire 06 00415 g001
Figure 2. Schematic diagram of the confined space experiment and the arrangement of measuring points.
Fire 06 00415 g002
Figure 3. Mesh independence study with five different mesh sizes.
Fire 06 00415 g003
Figure 4. Heat release rate curves of n-heptane pool fires at different diameters in Guanghan (96 kPa).
Fire 06 00415 g004
Figure 5. Heat release rate curves of n-heptane pool fires at different diameters in Kangding (60 kPa).
Fire 06 00415 g005
Figure 6. Computing domain (Yellow part represents inert surface and green part represents open boundary).
Fire 06 00415 g006
Figure 7. Flashover process in reality and in simulation (96 kPa, 40-cm pool fire); (a) t = 10 s, (b) t = 20 s, (c) t = 127 s flashover occurred, (d) t = 140 s, (e) t = 160 s, (f) t = 250 s (Green dots in the figure represent heat flux sensors).
Fire 06 00415 g007aFire 06 00415 g007b
Figure 8. Total heat release of n-heptane pool fires at different diameters in Guanghan (96 kPa).
Fire 06 00415 g008
Figure 9. Total heat release of n-heptane pool fires at different diameters in Kangding (60 kPa).
Fire 06 00415 g009
Figure 10. Logarithmic relationship curve of m ˙ / D and P 2 D 3 .
Fire 06 00415 g010
Figure 11. Logarithmic relationship curve of m m a x ˙ / D and P 2 D 3 .
Fire 06 00415 g011
Figure 12. Radiant heat flux vs. pressure.
Fire 06 00415 g012
Figure 13. Comparison of the measured and predicted average upper layer temperature at different pressures. (a) The average upper layer temperature of 20-cm n-heptane pool fires; (b) the average upper layer temperature of 30-cm n-heptane pool fires; (c) the average upper layer temperature of 40-cm n-heptane pool fires; (d) the average upper layer temperature of 50-cm n-heptane pool fires; (e) the average upper layer temperature of 60-cm n-heptane pool fires.
Fire 06 00415 g013aFire 06 00415 g013bFire 06 00415 g013c
Figure 14. The radiant heat flux on the floor of n-heptane pool fire with different oil pan sizes. (a) The radiant heat flux on the floor of a 20-cm n-heptane pool fire; (b) the radiant heat flux on the floor of a 30-cm n-heptane pool fire; (c) radiation heat flux on the floor of a 40-cm n-heptane pool fire; (d) the radiant heat flux on the floor of a 50-cm n-heptane pool fire; (e) the radiant heat flux on the floor of a 60-cm n-heptane pool fire.
Fire 06 00415 g014aFire 06 00415 g014b
Figure 15. The average upper layer temperature of 60-cm n-heptane pool fires.
Fire 06 00415 g015
Figure 16. The temperature measured by the top thermocouple of T5 at 96 kPa.
Fire 06 00415 g016
Figure 17. The temperature measured by the top thermocouple of T5 at 60 kPa.
Fire 06 00415 g017
Figure 18. The average upper layer temperature of 40 cm n-heptane pool fires at 60 kPa.
Fire 06 00415 g018
Table 1. Material properties measured for modelling input.
Calcium SilicateCorrugated Cardboard
Density, kg/m3720323.5
Specific heat, kJ/(kg·K) 1.25~1.55 10.87~3.04 1
Conductivity, W/(m·k)0.120.08~0.1 1
Heat of combustion, kJ/kgN/A 216,460
Heat of reaction, kJ/kg N/A171.88
Reference temperature, °CN/A338.6
Heating rate, K/minN/A5
Pyrolysis range, °CN/A200
1 This property is a function of temperature. 2 This property is not available as pyrolysis does not take place.
Table 2. Flashover onset time in experiments and simulations.
Pressure, kPaPool Size, cmExperimental, sSimulated (Average Upper Layer Temperature as Criterion), sSimulated (Average Upper Layer Temperature as Criterion), s
9620N/A 1N/AN/A
30N/AN/AN/A
40127129152
508690107
60527374
6020N/AN/AN/A
30N/AN/AN/A
40N/AN/AN/A
50232N/AN/A
60153N/A166
1 Flashover did not take place.
Table 3. Total heat release in all testing conditions.
CasePressure, kPaPool Size, cmTotal Heat Release, kWh/m2
1962095.3
2963092.5
39640150.2
4965093.9
59660106
6602093.6
7603093.4
8604083.5
96050123.4
10606087.2
Disclaimer/Publisher’s Note: The statements, opinions and data contained in all publications are solely those of the individual author(s) and contributor(s) and not of MDPI and/or the editor(s). MDPI and/or the editor(s) disclaim responsibility for any injury to people or property resulting from any ideas, methods, instructions or products referred to in the content.

