1. Introduction
Computational fluid dynamics (CFD) simulations have become a powerful analysis tool to evaluate fire behavior and its consequences on people’s safety and building integrity. Currently, there are several numerical methods to analyze the real behavior of the fire and the structural response. Khan et al. [
1] and de Silva et al. [
2] have evaluated different methods to define the temperature of hot gases. A fundamental aspect is the evaluation of the structural integrity based on the development of the fire. With this aim, authors such as Feenstra et al. [
3] have developed methodologies that allow CFD fire simulations and thermo-mechanical models to be coupled in two ways. Currently, methodologies based on machine learning are also being developed to include the use of CFD models in the structural analysis of fire [
4], as well as the use of building information modeling (BIM) in the development of three-dimensional models and the management of all building information [
5].
However, the use of these computational simulations requires a thorough validation and evaluation process of results.
The accuracy of the characterization of the turbulence by means of computational simulations depends on several factors; among them, it is worth highlighting the following:
The spatial resolution used to solve the physical problem that is simulated numerically;
The discretization of the partial differential equations (PDE) into algebraic equations by means of the integration of the terms and considering explicit or implicit time discretization;
The numerical scheme used for the discretization of the terms in the mathematical model;
The correct characterization of turbulent phenomena that govern the hot gas movement in closed spaces with significant thermal gradients.
The obtained result must be calibrated and validated properly by means of experimental tests or by means of numerical simulations previously verified and validated that are taken as a reference. The calibration and validation must be performed individually for each one of the parameters considered in the model. In [
6], Oberkampf and Trucano detail the concept of CFD model verification and validation. In [
7], Hees analyses the procedure to develop the validation and verification of fire models.
As it is defined by the mathematician Kevin McGrattan [
8], it is possible to compare the three main types of existing turbulence simulations with three painting styles and their most representative artists. For example, the time-averaged simulation Reynolds averaged Navier–Stokes (RANS) is comparable to a Picasso painting, provided the degree of simplification and abstraction of the painting in relation to a turbulence reality. In this case, all the scales of the turbulence are modeled, and it means that the computational cost of these mathematical models is reduced. The LES method can be compared to a Van Gogh painting. In this case, the scales of the turbulence are simulated until a previously defined dimension, characterizing the real behavior. The smallest scales are filtered in the simulation, and they are modeled. Finally, DNSs can be compared to the realism of Rembrandt’s paintings. DNSs simulate all the turbulence scales. It is the reason why direct numerical simulation (DNS) can solve every aspect of the fluid dynamic [
9]. However, its high computational resource demand makes it almost impossible to use in the resolution of three-dimensional flow problems that are common in fire engineering.
There are situations in which the flow of turbulent movements can be analyzed by means of two-dimensional turbulence simulations without distortion of their real behavior. Although the reality is that two-dimensional flow does not exist in nature, there are certain behaviors that can be approximated to a two-dimensional movement.
In these specific cases, it is important to indicate that, although the flux can have a strong bidimensional behavior, the turbulence in the interior of these fluxes keeps being a three-dimensional structure. However, it is possible that bidimensional structures are generated. An example of this is the combustion mechanism that happens in diffuse flames. Chen et al. [
10] identify experimentally two types of instabilities, each one related to different vortex patterns in a methane diffusion flame with an initial value Re = 2390. The small vortex structures inside the flame are the result of the Kelvin–Helmoltz instability and develop into discrete coherent vortexes. From a value of Re, around 4000 three-dimensional instabilities appear next to the flame base. It generates a cascade of vortexes that are more and more small in the mixture layer of the diffusion flame, producing the transition toward a completely turbulent flux with three-dimensional structures. This structure is analyzed afterward by means of numerical simulations by several authors, and the results are summarized by Liñan et al. in [
11].
Since the first theories about two-dimensional turbulence were exposed in 1968, and especially in the 1980s, many studies have been carried out in this field of physics. However, most of them have analyzed its application to soap film flows, with a large aspect ratio of the flux [
12] and atmosphere flows, considered as incompressible [
13]. A general review of the two-dimensional turbulence has been carried out by Boffetta G. and Robert E. in [
14].
Some of the most relevant active research lines in this field have focused on the physical behavior of two-dimensional turbulence. Boffeta [
15] and Chen et al. [
16] have developed relevant research in the field of direct enstrophy cascade. In [
17], it is described how energy and entropy are conserved in two-dimensional turbulence, producing two different cascades, an inverse cascade for energy (toward larger scales) and another for enstrophy, toward smaller scales. It makes it possible to explain the coherent structures that are identified in this type of two-dimensional turbulence (Rivera et al. in [
17]). The concept of the conformal invariance of the two-dimensional turbulence, suggested by Polyakov, A.M. in 1993 [
18], has been investigated by several authors, such as Bernard, D. et al. [
19] and recently by Wacławczyk, M. et al. [
20]. Another concept that is currently being investigated is the irreversibility. Bragg, A.D. et al. [
21] analyze the irreversibility in two-dimensional turbulence. In [
22], Iacobello, G. et al. study the coherent structures, characteristics of two-dimensional turbulence, and the time irreversibility in wall turbulence.
This research work analyses the capabilities of the two-dimensional fire models to study the behavior of hot gases and diffusion flames in the field of fire engineering, with viscous flows and with a noticeable dilatable behavior. The study can be applied to the analysis of the dynamics of turbulent fire plumes. It is also extensible to the behavior of hot gases that are confined in the ceiling of large closed spaces due to the geometric constraints and the flow density gradients. An example of that is the hot gases that accumulate in ceilings, where the relationship between the horizontal and vertical dimensions of the vortex can be assimilated to soap film flows.
For that, correlations are carried out between two-dimensional DNSs on a small scale and LESs with various methods to close the subgrid-scale tensor in the Navier–Stokes (NS) equations to evaluate the possibility of extending the two-dimensional simulations to LESs.
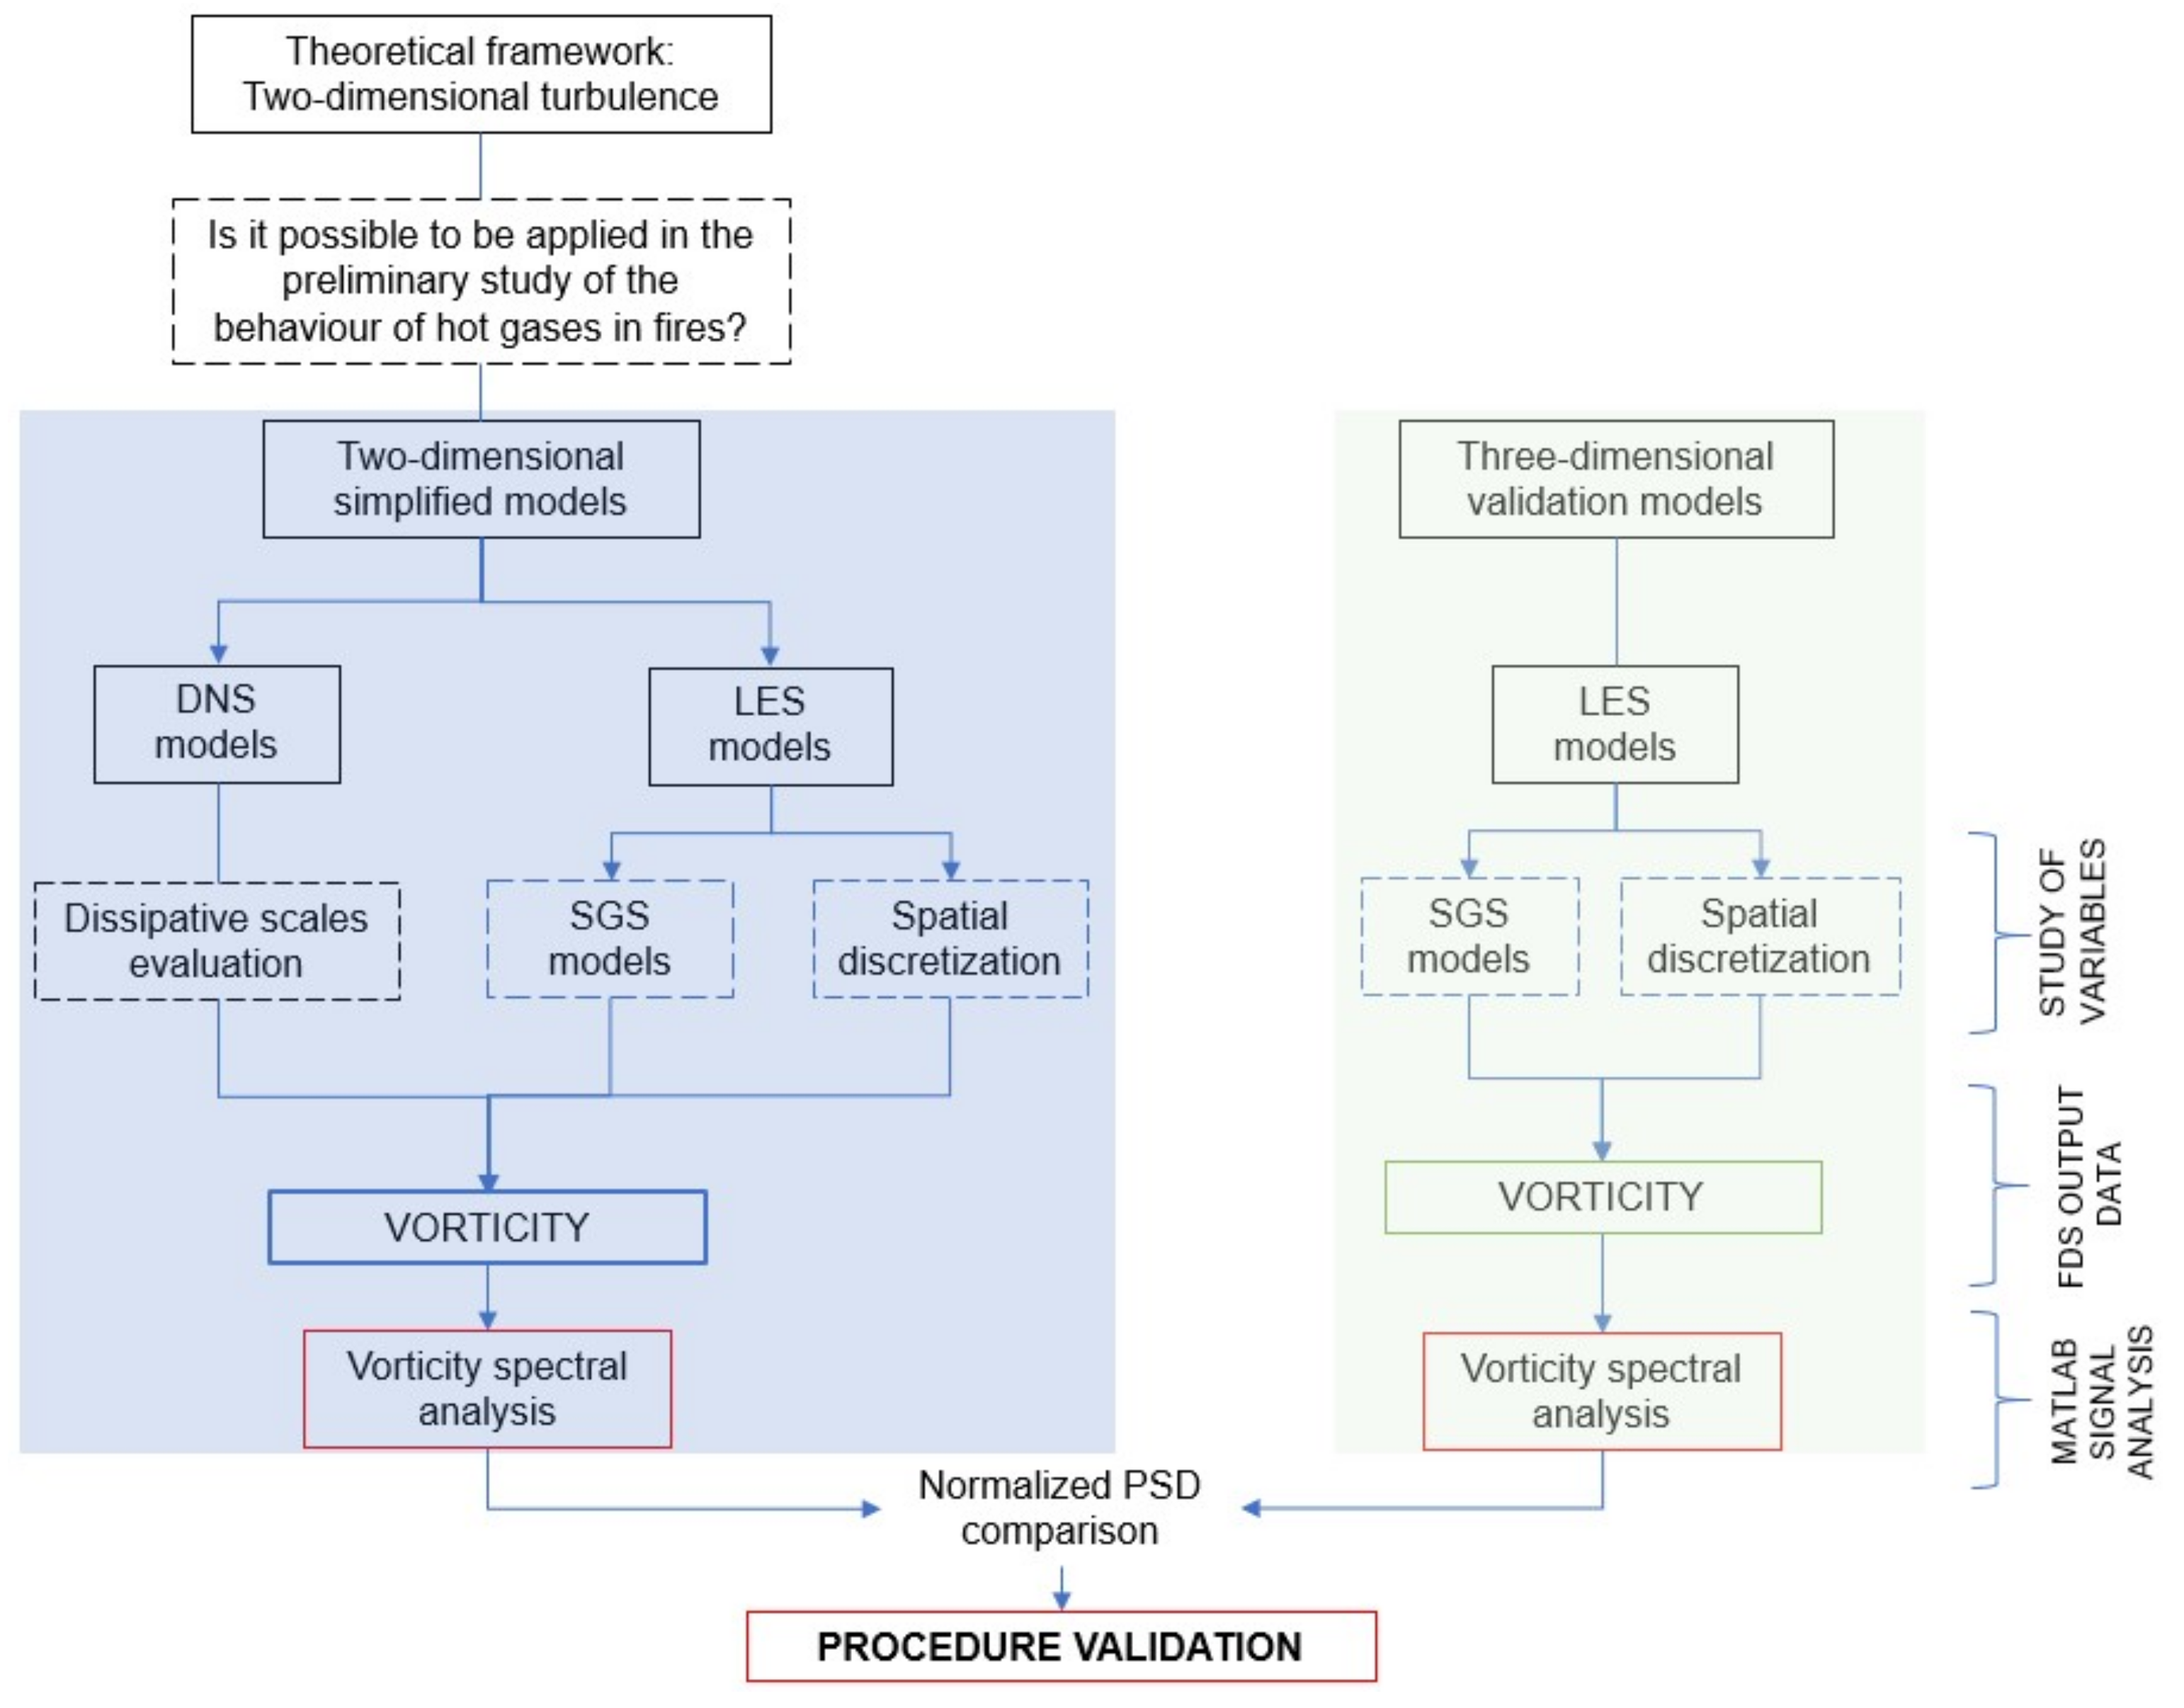
Afterward, and with the aim to evaluate the suitability of the different simulations in the two-dimensional field, it is proposed the analysis of vorticity and dissipation by means of the spectral frequency analysis. The results have been compared with several three-dimensional LES models in order to validate, in a qualitative manner, the analysis (see
Figure 1).
The use of two-dimensional fire models in the initial phases of fire engineering studies allows fire engineers to develop a relevant number of case studies to understand, in a qualitative manner, the behavior of the fire in a specific scenario. After that, more complex 3D simulations can be processed. This procedure reduces the global computational cost of a fire study.
2. Materials and Methods
Fire models are very complex due to the intrinsic complexity of the phenomena that they represent. Fire models can be classified into two main groups: the zone models and the field models.
Zone models essentially discretize the space into one, two, or sometimes three zones where the mass and energy equations are solved. These models provide uniform temperatures (e.g., a cool lower zone at ambient temperature, covered by a hot upper zone) and distribution of smoke and gaseous combustion products during a fire defined by the user. These models have been successfully used to simulate:
The average temperatures of hot gases in the fire domain;
The incident heat flux in the structural elements, considering the Heskestad and Hasemi analytical methods;
The transition study from a localized fire model to fully developed fires/post-flashover phenomena in a domain.
Considering its lower computational cost, these models are also used to carry out the numerical calibration of a relevant number of cases, which is necessary in complex fire engineering studies.
However, these models have several limitations due to different approximations. A relevant limitation is the diameter of the fire that can accurately be simulated, considering that radiation from fires is modeled with a simple point source approximation. They cannot accurately take into account re-radiation from the surroundings. The combustion process cannot be defined (the heat release rate cannot be calculated as an output value). Moreover, there are several geometric limitations to simulating the fire domain, i.e., the dimension and proportions of the domain, the quantity of fire load, etc.
The field models, based on CFD, include complex sub-models such as turbulence, combustion, radiation, and pyrolysis models. The greater importance that has been given to these models in recent years is a result of their increased ability to solve practical, real-world problems in the field of fire safety engineering and to allow a more in-depth study of the fundamentals of fire dynamics.
The simulation software Fire Dynamics Simulator (FDS) (
https://pages.nist.gov/fds-smv/ accessed on 15 September 2023) has been used for the analysis development of the two-dimensional flow fields in the fires that happen in closed spaces [
23,
24]. FDS has been developed by researchers from the National Institute of Standards and Technology (NIST). The software solves numerically NS equations adapted to low-velocity flows, focusing on the smoke behavior and heat transport that happen during fires.
The most general aspect of the code FDS is that it can handle buoyancy-dominated flows (e.g., fire plumes and associated smoke transport), including turbulent combustion, radiation, and multi-phase phenomena. The main objective of FDS is to solve fire engineering problems and provide a numerical tool to study fundamental fire behavior and combustion processes. It is a finite differences-based code that solves numerically a form of NS equations, considering low-speed thermally driven flows. The core algorithm is an explicit predictor-corrector scheme, second-order accurate in space and time.
The combustion model is based on, for most applications, a single-step, mixing-controlled chemical reaction. This reaction uses three lumped species, air, fuel, and products, and considers an infinitely fast reaction of these species. Radiative heat transfer is included in the solution of the radiation transport equation (RTE) for a gray gas.
The NS equations govern the behavior of any viscous fluid. For a viscous dilatable flow, as the one that must be considered in fire simulation, the momentum equation is determined as follows in (1):
Regarding the energy conservation equation, it is written in terms of the sensible enthalpy (2),
where
is the rate of heat release (RHR) per unit volume from a chemical reaction, and
is the conductive, diffusive, and radiative heat fluxes.
However, Equation (2) is not resolved explicitly. The combustion and radiation are introduced into the governing equations based on the source terms in the energy transport equation.
With the equation of the conservation of the mass for a flow considered as dilatable (3):
In the case of the state equation (ideal gases law), Rehm and Baum [
25] determined that for low-velocity fluxes, as is the case of fires (with flux velocities of approximately 10–15 m/s), the spatial and temporal resolution of pressure can be divided into two terms: the background pressure,
, and pressure perturbation,
(4).
It is observed in (4) that background pressure is the function of gravity and depends on the spatial coordinate z. It means that the variation is very small in domains with heights that are common in buildings. Due to the fact that the background pressure is almost constant during a fire, it can be established an inversely proportional relation between temperature and air density through the state equation, which allows for closing the system (5):
where
is the air density,
T is the temperature,
R is the gas constant, and
W is the gas molecular weight.
The flow vorticity is defined in (6) for a two-dimensional flow:
where the right term of the equation is the diffusion of vorticity, which only occurs in viscous fluids.
Richardson established for the first time in 1922 that the turbulent flow has a dissipative nature, thanks to the cascade theory applied to the meteorology field, where he stated that: “big whirls have little whirls, that feed on their velocity; and little whirls have lesser whirls, and so on to viscosity” [
26]. Afterward, in 1941, this theory was developed in more detail by Kolmogorov [
27].
Kolmogorov scales theory, applicable to three-dimensional flows, describes how the energy that is contained in turbulences is transferred from those with a larger dimension toward the smaller ones. It also establishes the amount of energy that is in each turbulence dimension, as well as the percentage that can be dissipated in each vortex size.
It is important to differentiate three main sizes of the vortex (see
Figure 2): (a) the integral size (vortex with a larger size), (b) Taylor microscales, and (c) Kolmogorov vortex (that corresponds to the smaller scales). In a three-dimensional flow, the energy transfer process between the different vortexes begins in the larger ones, which are unstable, breaking and transferring their energy to the ones with an immediately inferior scale. The second ones, which are still unstable, break again, continuing with the energy transfer process toward the ones that have a size even smaller than the second ones. The energy transfer process continues until the molecular viscosity of the fluid is representative enough to be able to dissipate the existing kinetic energy. Within this energy dissipation process, kinetic energy is transformed into heat.
Nevertheless, the physical mechanism, which explained for the first time the singular behavior of the two-dimensional turbulent flow, is due to Kraichnan, Barchelor, and Leith [
28,
29,
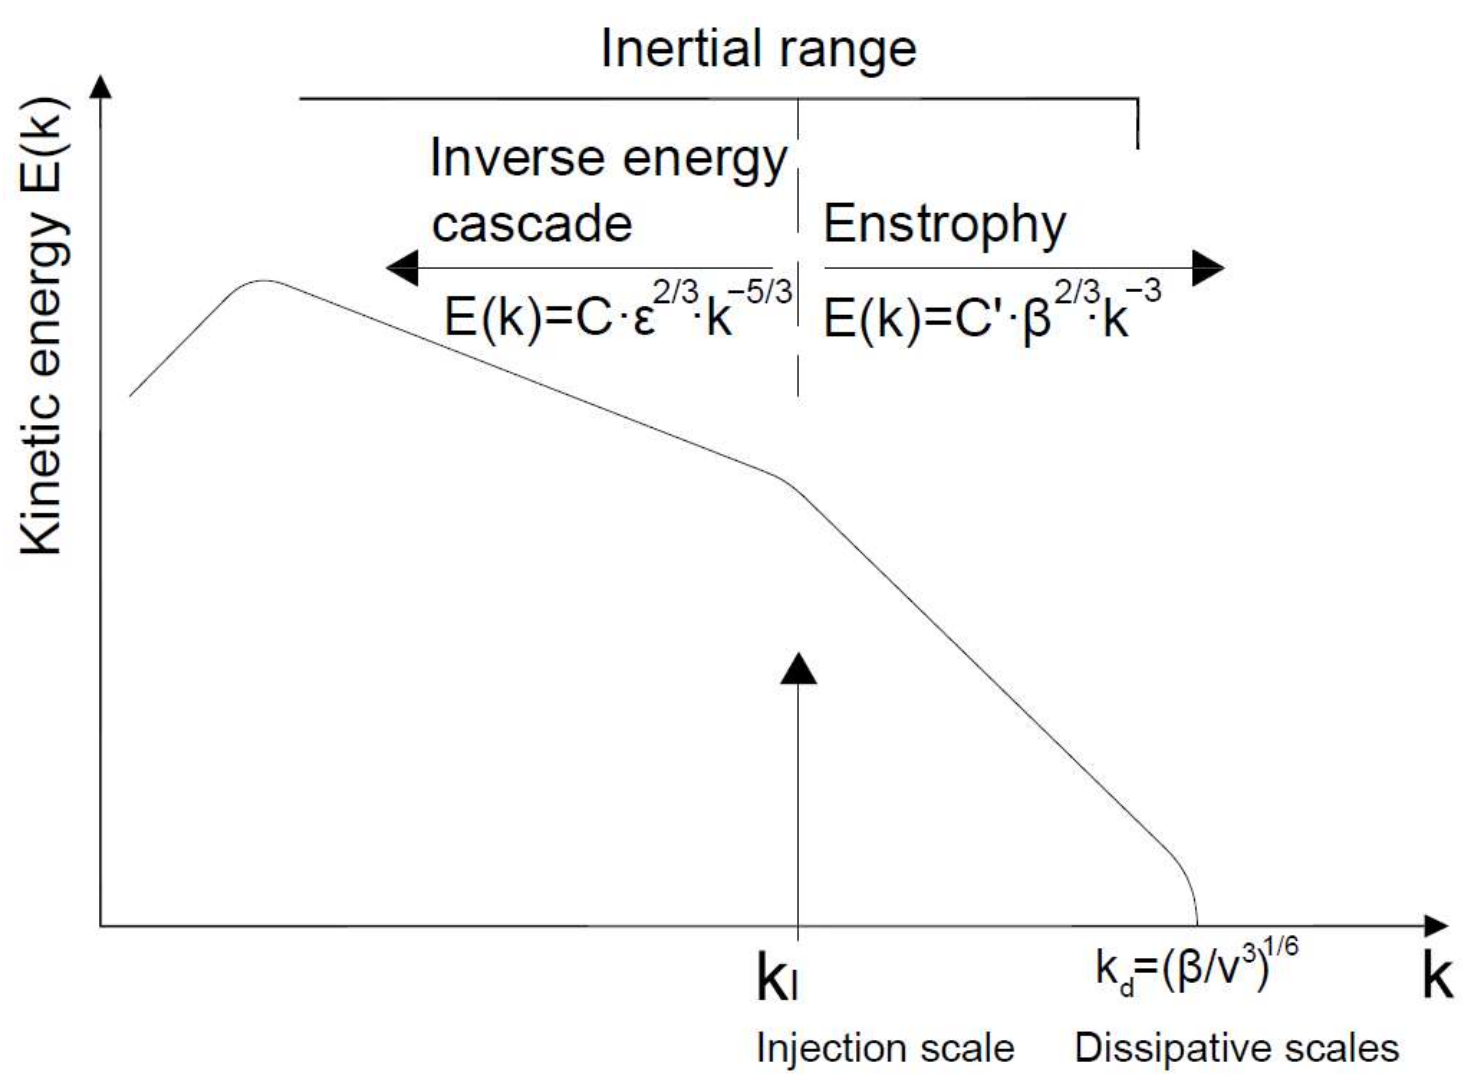
30], who proposed in 1968 the existence of a dual turbulent cascade that was afterward confirmed experimentally. In two-dimensional turbulence, a singularity takes place, compared with the three-dimensional flows, which are two inertial sub-ranges, which is to say, there are two flow structures, each one with its own dynamics, injected in a determined wavelength. These two sub-ranges are determined as follows:
In the inertial sub-range of the inverse energy cascade, it can be defined that Equation (7) determines the energy transfer between the different vortex scales from the dissipation ratio,
ε, and a constant,
C.
Equation (7) describes the energy transfer between the different scales in the inertial sub-range in the same way as the Kolmogorov minus five-thirds power law.
Equation (8) describes the energy spectrum in the inertial sub-range of the enstrophy direct cascade. It depends on the rate of enstrophy dissipation, β, varying the kinetic energy in accordance with the minus third power.
C′ is a dimensionless constant, and its value is of the order of the unity.
The inverse energy cascade is displaced toward smaller wavelengths, and it is controlled by Ekman friction, whereas the direct cascade of enstrophy is displaced toward larger wavelengths, up to the dissipative scale,
kd. The dissipative scale,
kd, is equivalent to Taylor microscales in three-dimensional flows defined by Kolmogorov (see
Figure 3).
There are two important magnitudes that have a fundamental role in the two-dimensional turbulent flows. The first is mean energy , with . The second is enstrophy , with . Whereas energy is considered a robust invariant, where in the case that viscosity goes to 0, the enstrophy is considered a fragile invariant, where does not necessarily go to 0. In addition, it is important to indicate that flow viscosity only determines the dissipative scale of the enstrophy but not the ratio with which it is produced.
2.1. Two-Dimensional Structural Turbulence
There is a first-order structure that is identified because of the rotation of the vortex solid part. This structure corresponds with the inverse energy cascade toward lower values of
k. It is the level where coherent structures are identified, which modify the Kolmogorov classic theory of cascade [
31]. These coherent structures are characterized as an elliptic flow, with a clear predominance of its rotation against deformation.
This first-level coherent structure can be affected by two processes: vortex fusion and axisymmetry of the vortex.
In a two-dimensional field, the presence of two similar vortexes can progress toward their fusion into one of a larger size; such an effect can happen from a certain critical distance (see
Figure 4). This phenomenon was shown in 1988 by Melander et al. [
32]. From this moment, this fusion effect has been widely studied by several authors [
33,
34,
35].
It is also relevant to highlight that elliptic-shaped vortexes are not stable. When initially an elliptic vortex is generated, and due to the difference in rotation velocity between the interior and exterior zones of the vortex, the edges tend to filamentary scheme, adopting finally a circular shape. This effect is called vortex axisymmetrization [
36].
The second-level structure corresponds with the characteristic filamentary structures that are shaped in the two-dimensional flow [
37]. These filamentary structures are associated with the dissipation direct cascade of kinetic energy and are exclusive from two-dimensional flows. In three dimensions, this kind of structure is unstable and does not appear. They are hyperbolic flows, where fluid deformation prevails against rotation.
A fundamental issue in the analysis of the transport in two-dimensional turbulent flows is the capacity to divide the vorticity field between the hyperbolic flow and the elliptic flow, depending on what prevails in the topological classification of the flow, deformation, or rotation, respectively.
2.2. Computational Simulations
The open-source software FDS is used in this work to carry out the simulations. The type of event that is considered is an accidental fire, especially those localized fires that are usually produced in large spaces (i.e., sports centers, markets, shopping center malls, etc.). One of the main characteristics of this type of fire is that the flash-over is not produced.
It is the reason why, firstly, it is applied to DNSs, which are necessary to capture the spectral reality of the smallest scale turbulences, that is to say, the Kolmogorov dissipative scales. LESs are carried out to evaluate the suitability of different closing methods for the NS equations and the viability of the use of these simulation methods in the field of fire engineering to simulate two-dimensional behavior flows. Afterward, the numeric calculation software Matlab [
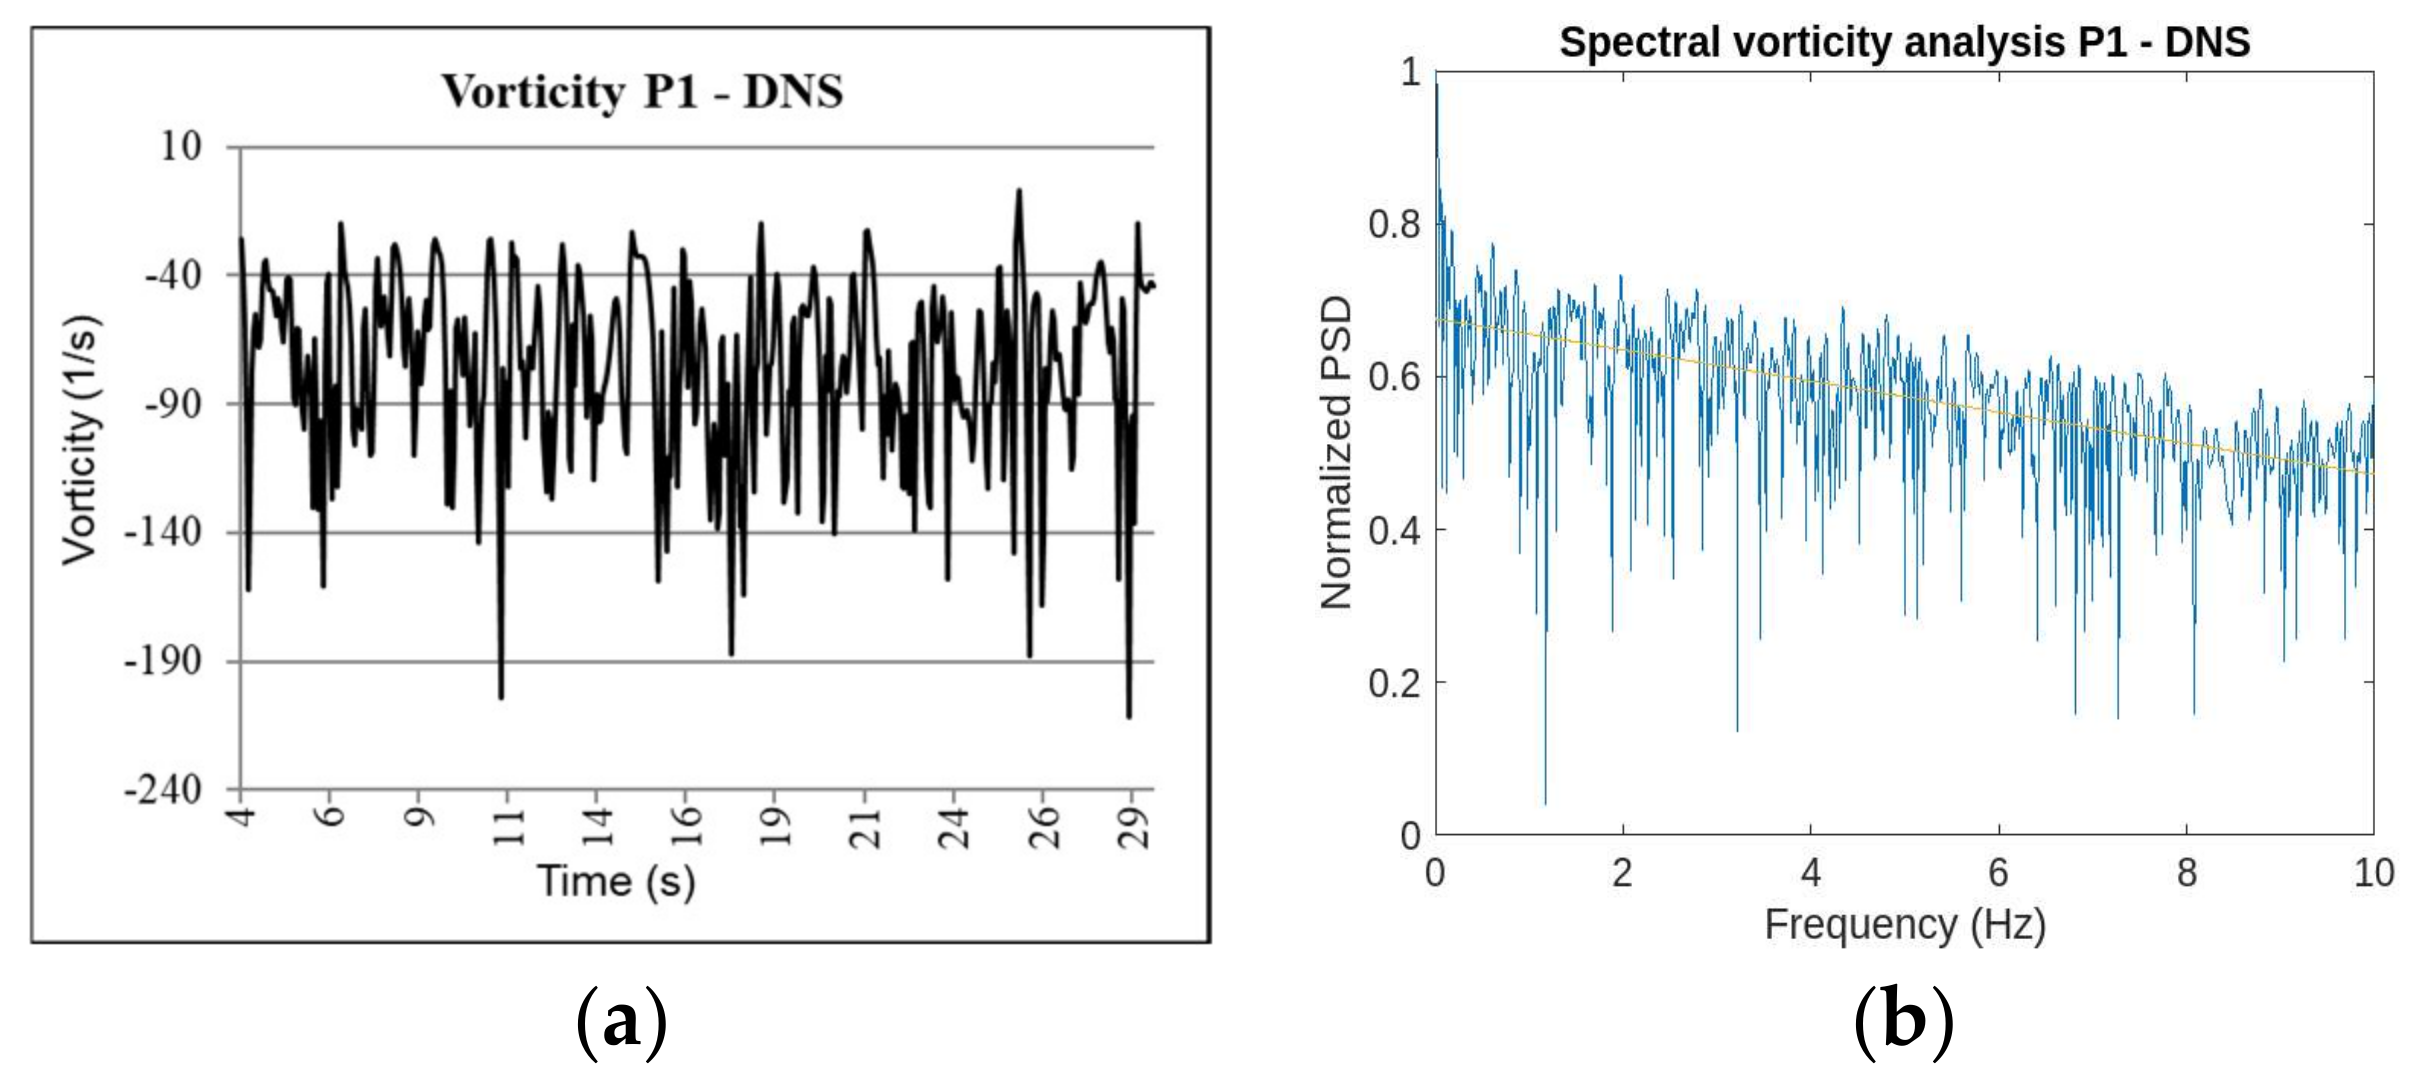
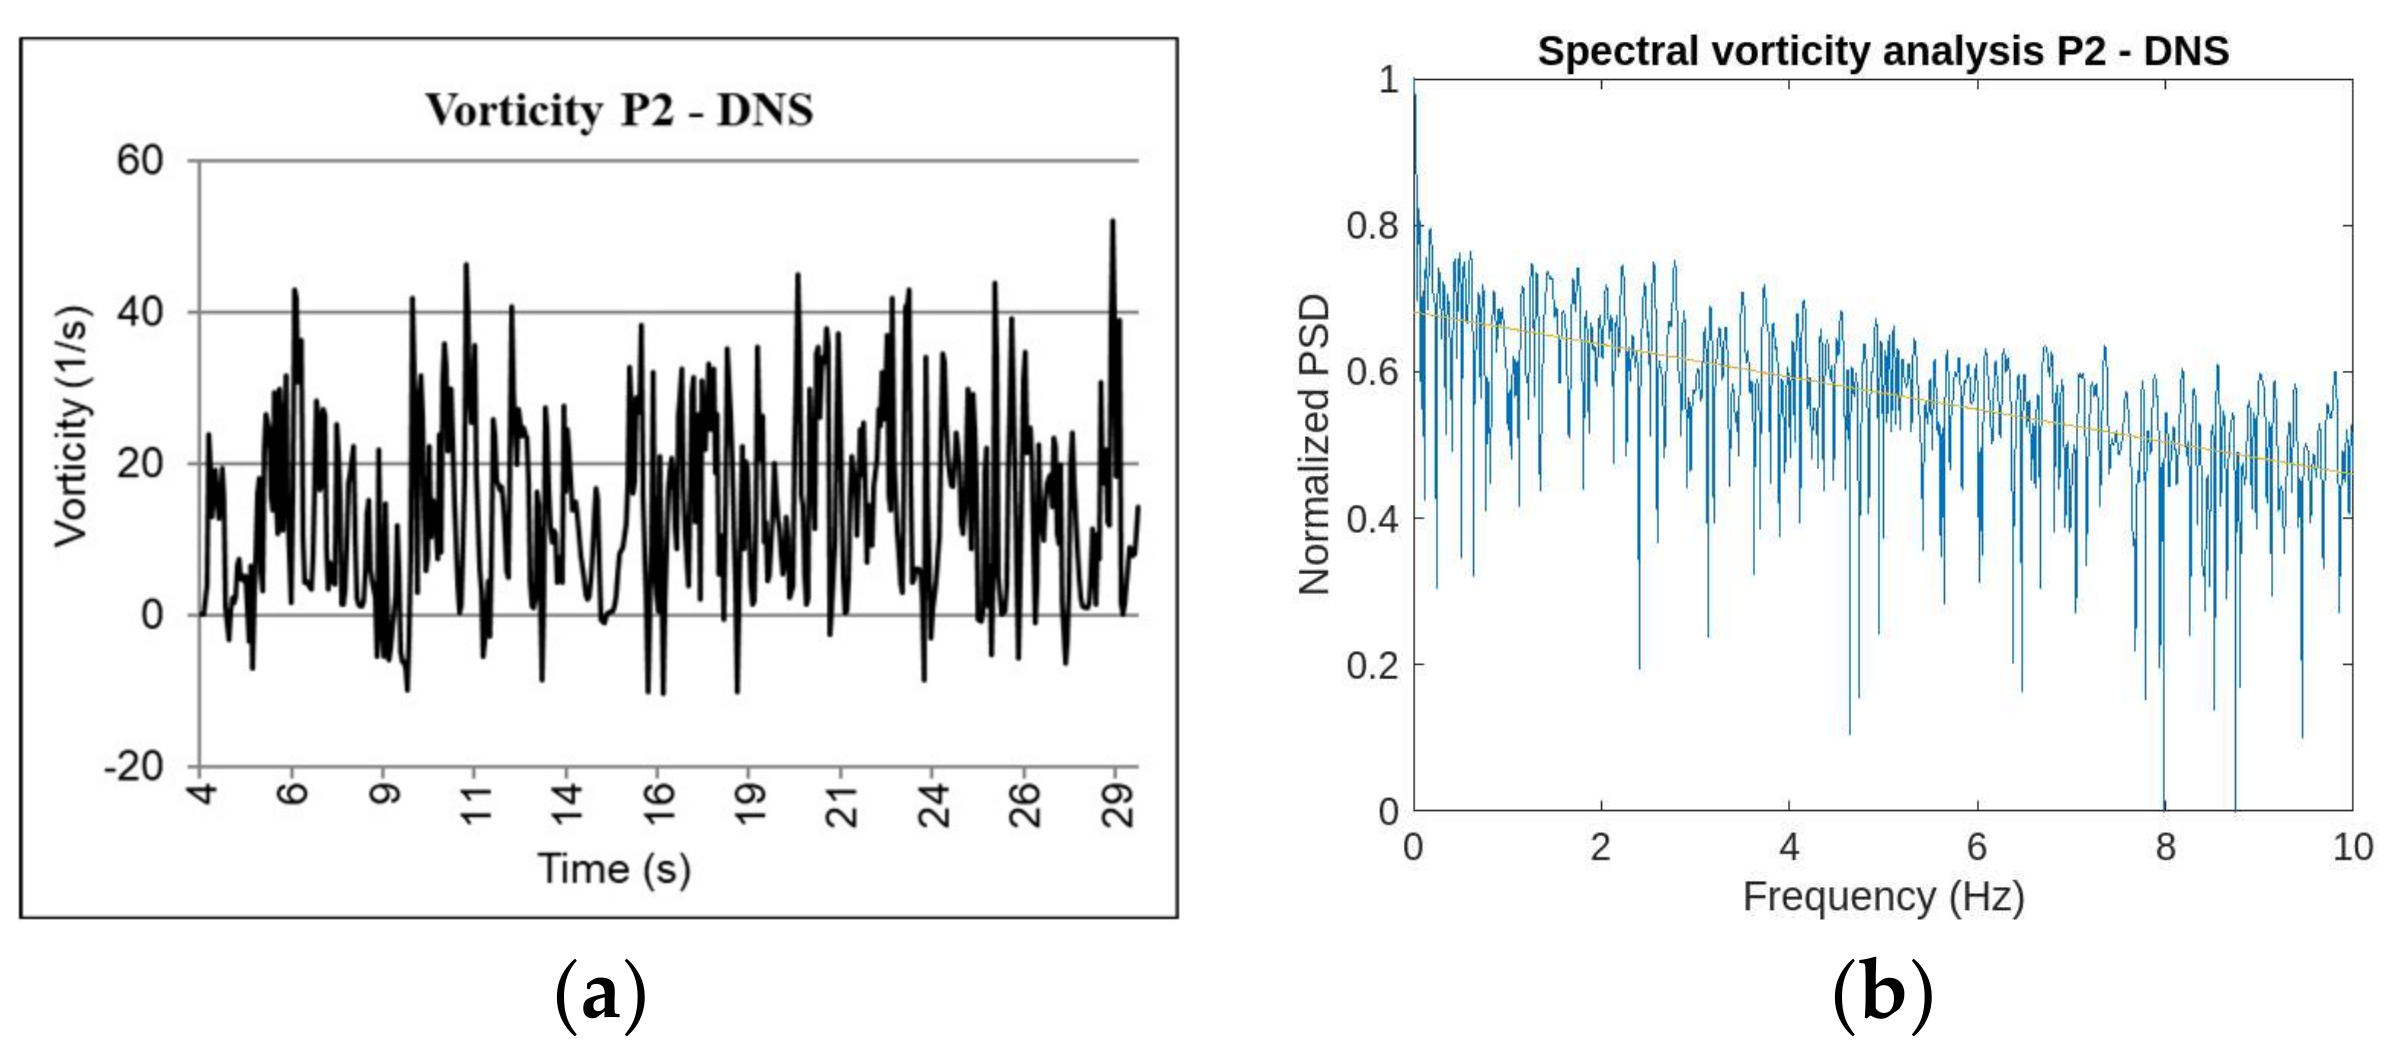
38] allowed the development of the turbulence spectral analysis by means of the application of the algorithm of the fast Fourier transform (FFT) to sets of discrete data that define the rotational of the flow field. The comparison between the trendline of the frequency spectrum of the DNSs and the LESs has allowed us to evaluate the capacity that each model has to capture correctly the behavior of the two-dimensional turbulent flow.
2.2.1. Direct Numerical Simulation
The turbulence is simulated by means of the DNS method with the aim of evaluating accurately which must be the behavior of the frequency spectrum associated with two-dimensional vorticity that is more suitable for the reality of the smallest scale turbulence in dilatable flows [
39].
DNSs have allowed us to reproduce with the maximum possible accuracy the two-dimensional turbulent phenomenon in a discontinuity zone where vorticity is generated. It allows us to simulate every one of the turbulent scales independently of its dimension. It is considered that DNSs are even more accurate and powerful than laboratory tests [
40].
Geometry and Boundary Conditions
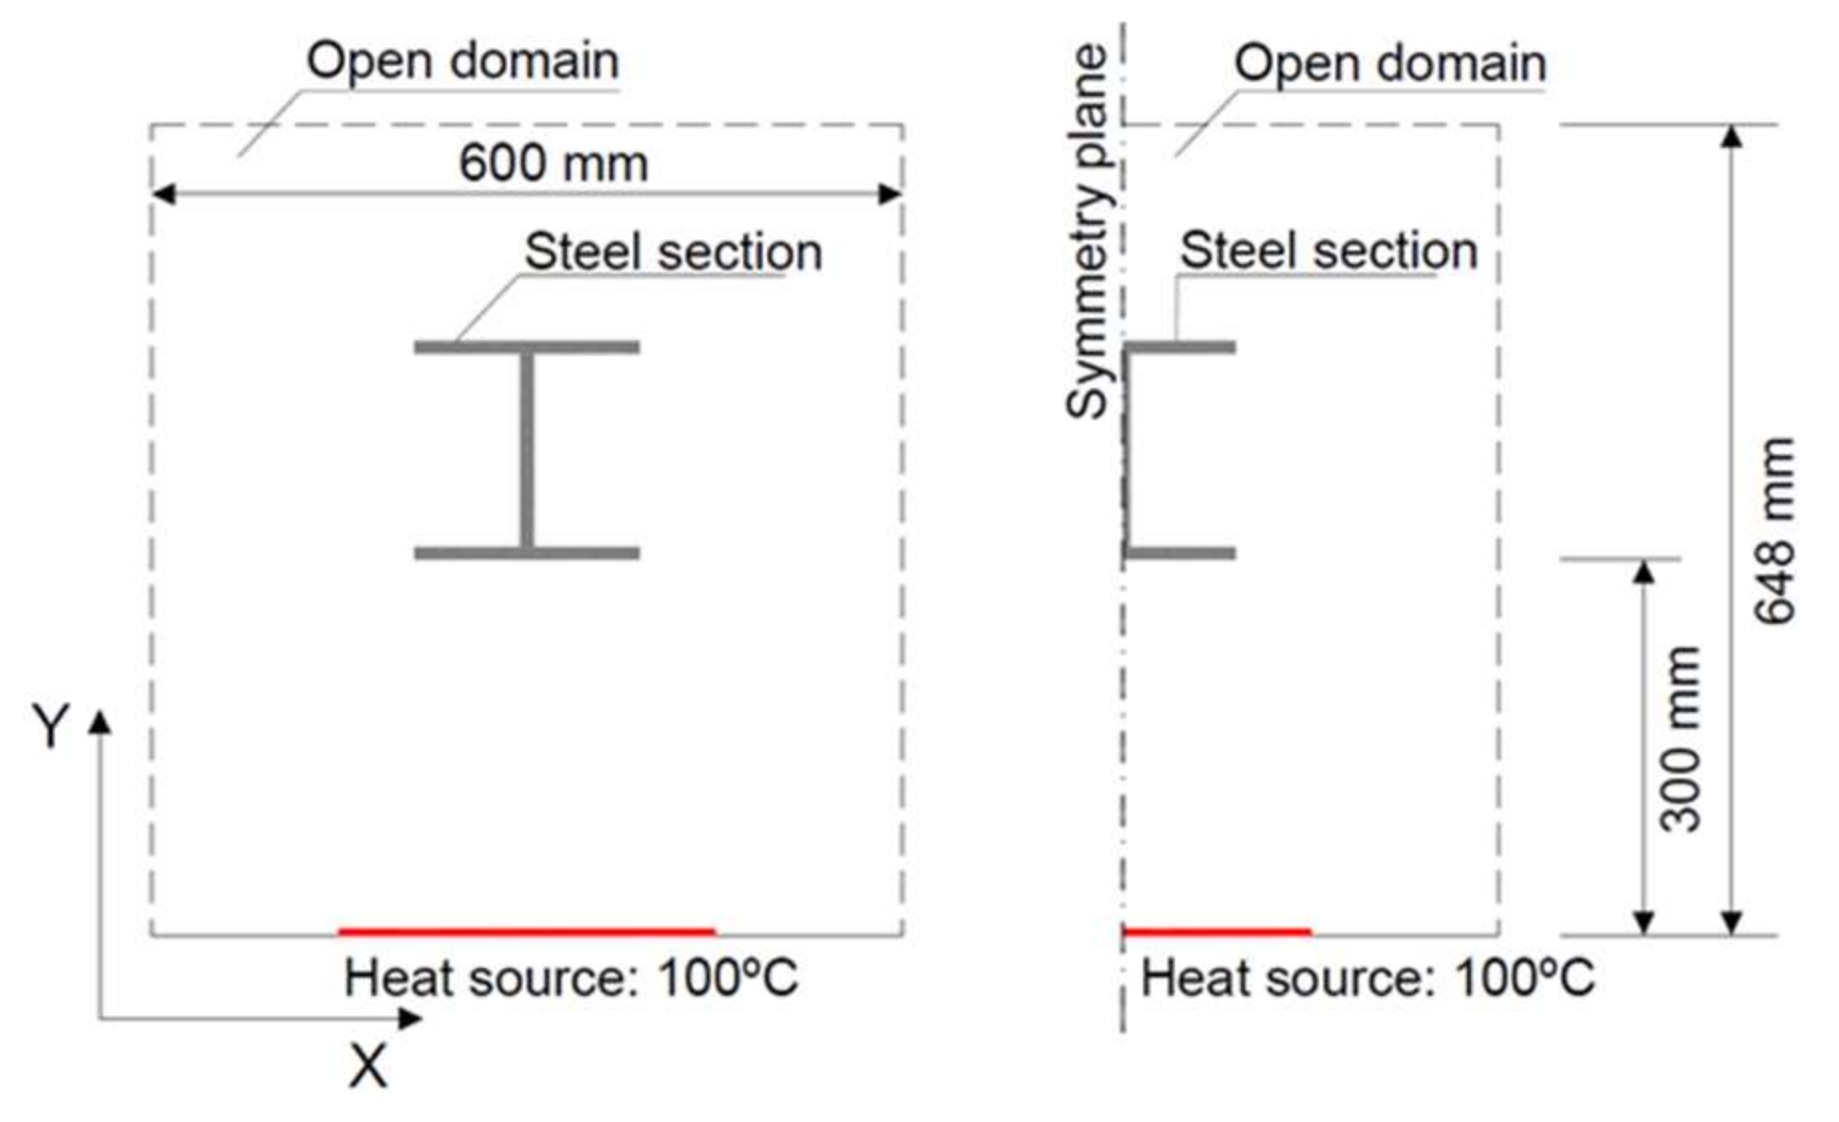
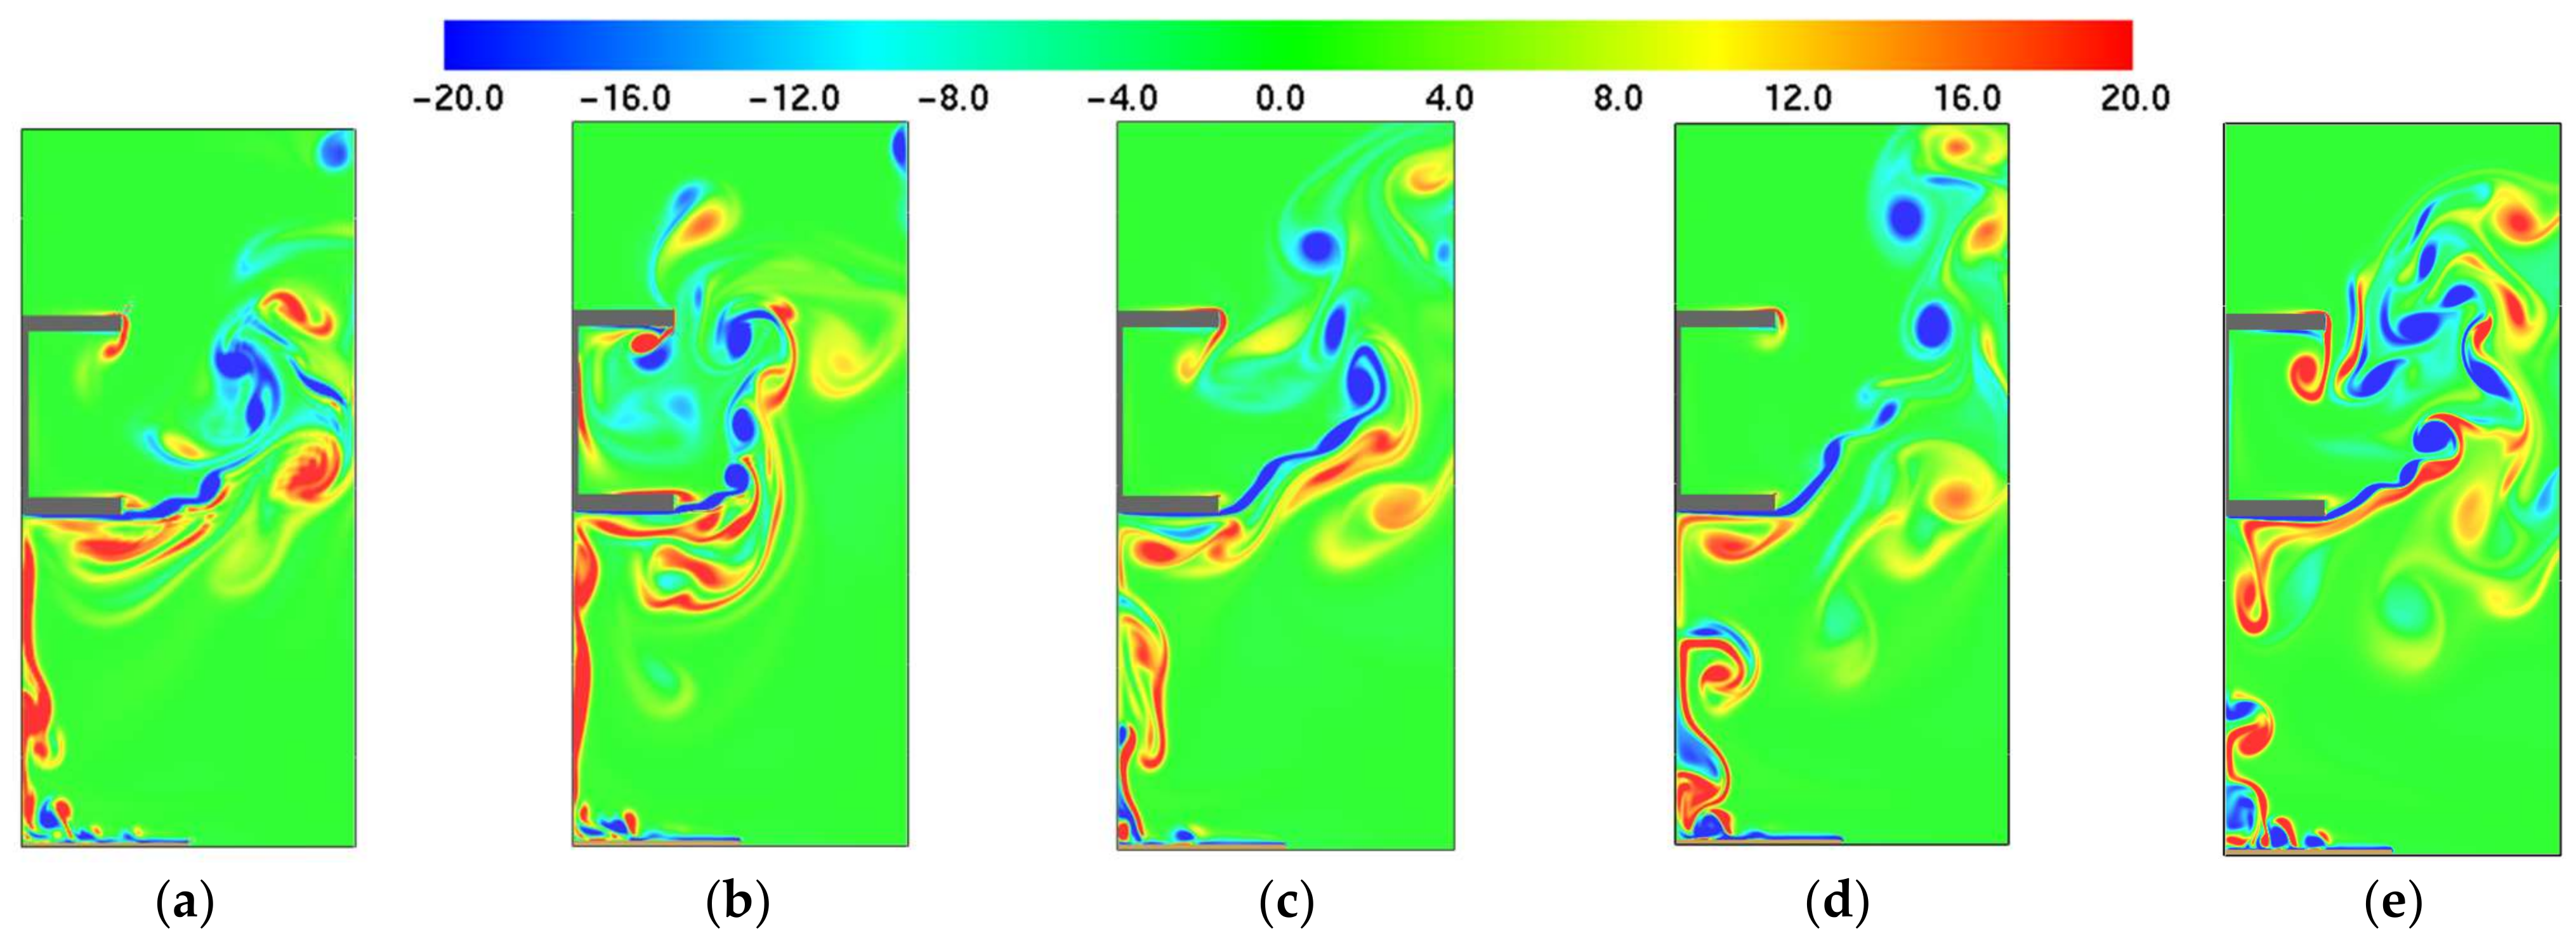
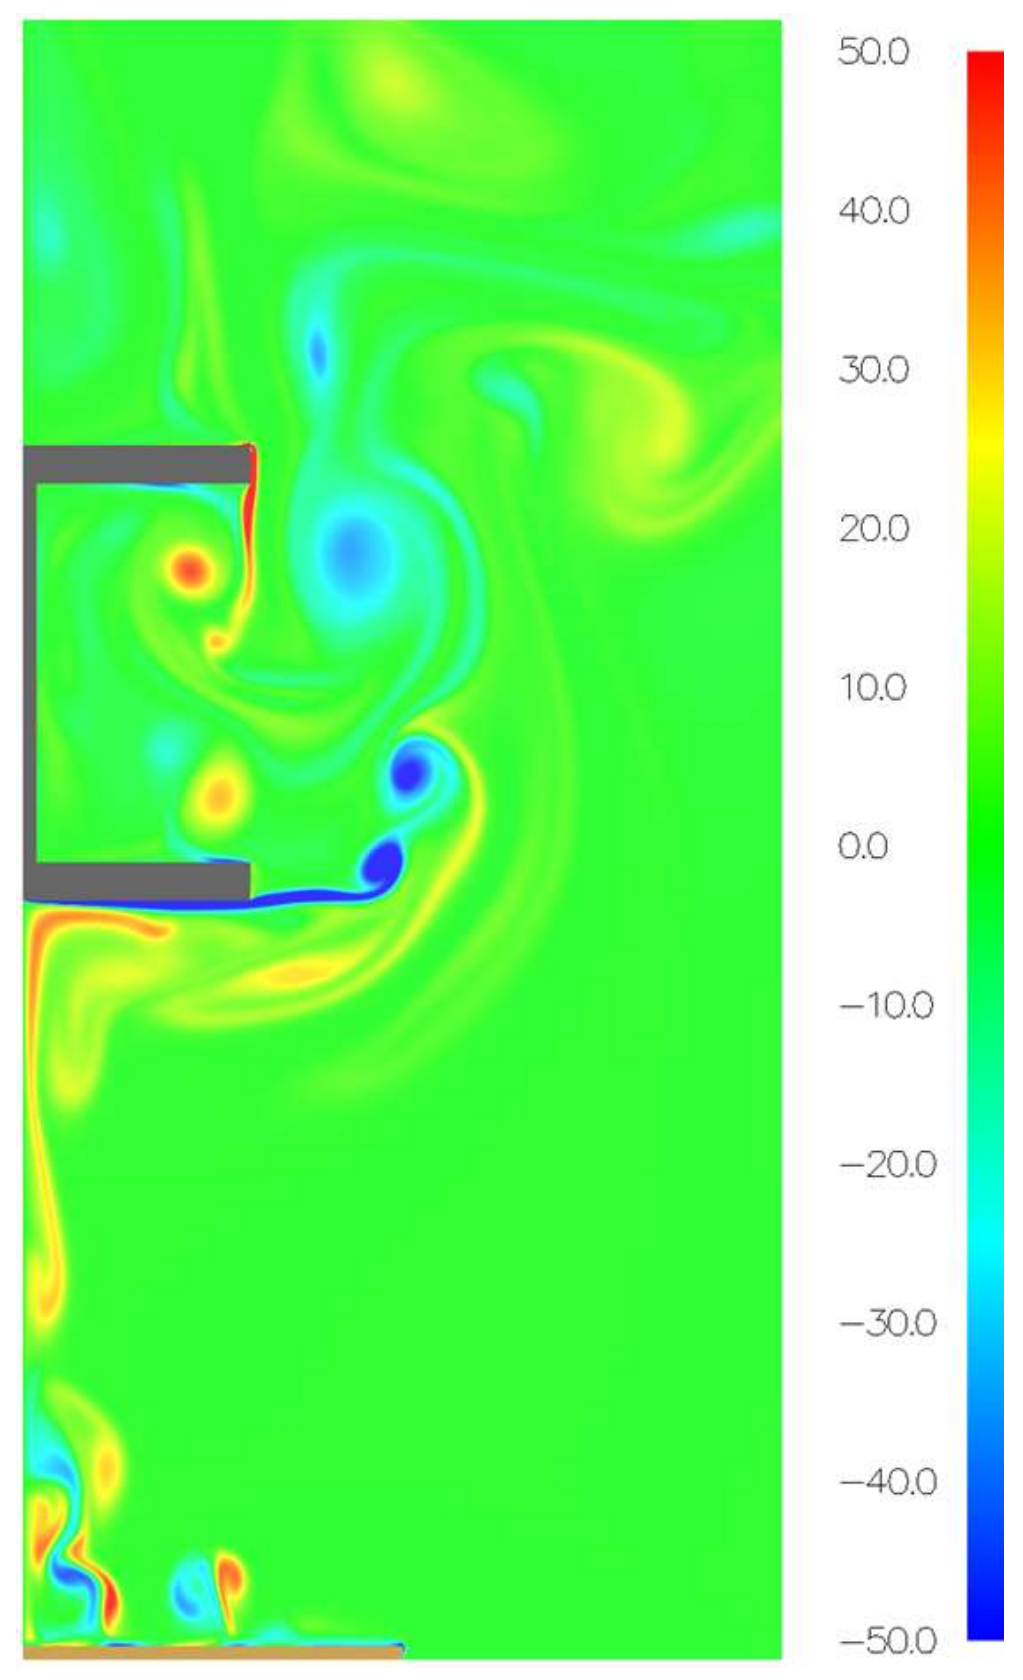
A DNS is developed considering an open domain of 600 mm × 648 mm (see
Figure 5). The geometry that is considered reproduces the typical case of a fire that occurs in a large closed space, with a large-span steel structure in the roof with trusses. This spatial configuration allows us to study the turbulence that occurs in the fire plume when hot gases reach the structural elements.
Regarding the external boundary conditions, an “open” boundary is defined. It implies that ambient conditions are produced beyond the external limits of the model. In the coordinate x = 0 m, a symmetry plane condition is included. It is a non-flux, free slip boundary condition. The steel section, placed at y = 300 mm, is defined with thermal solid boundaries. These boundaries include the thermal properties of the material (density, specific heat, and conductivity), depending on temperature. A heat source has been added at the coordinate Y = 0 mm.
Spatial and Temporal Resolution
The grid resolution is determined based on the evaluation of the dissipative scales of the turbulence. These scales are calculated considering the ratio that exists between the dissipative scales,
Kd, and the larger integral scales,
L. This ratio depends on the Reynolds number,
Re, according to Equation (9):
The main velocity of the fluid,
U, generated by density differences is defined based on Equation (10),
where
D is the source size.
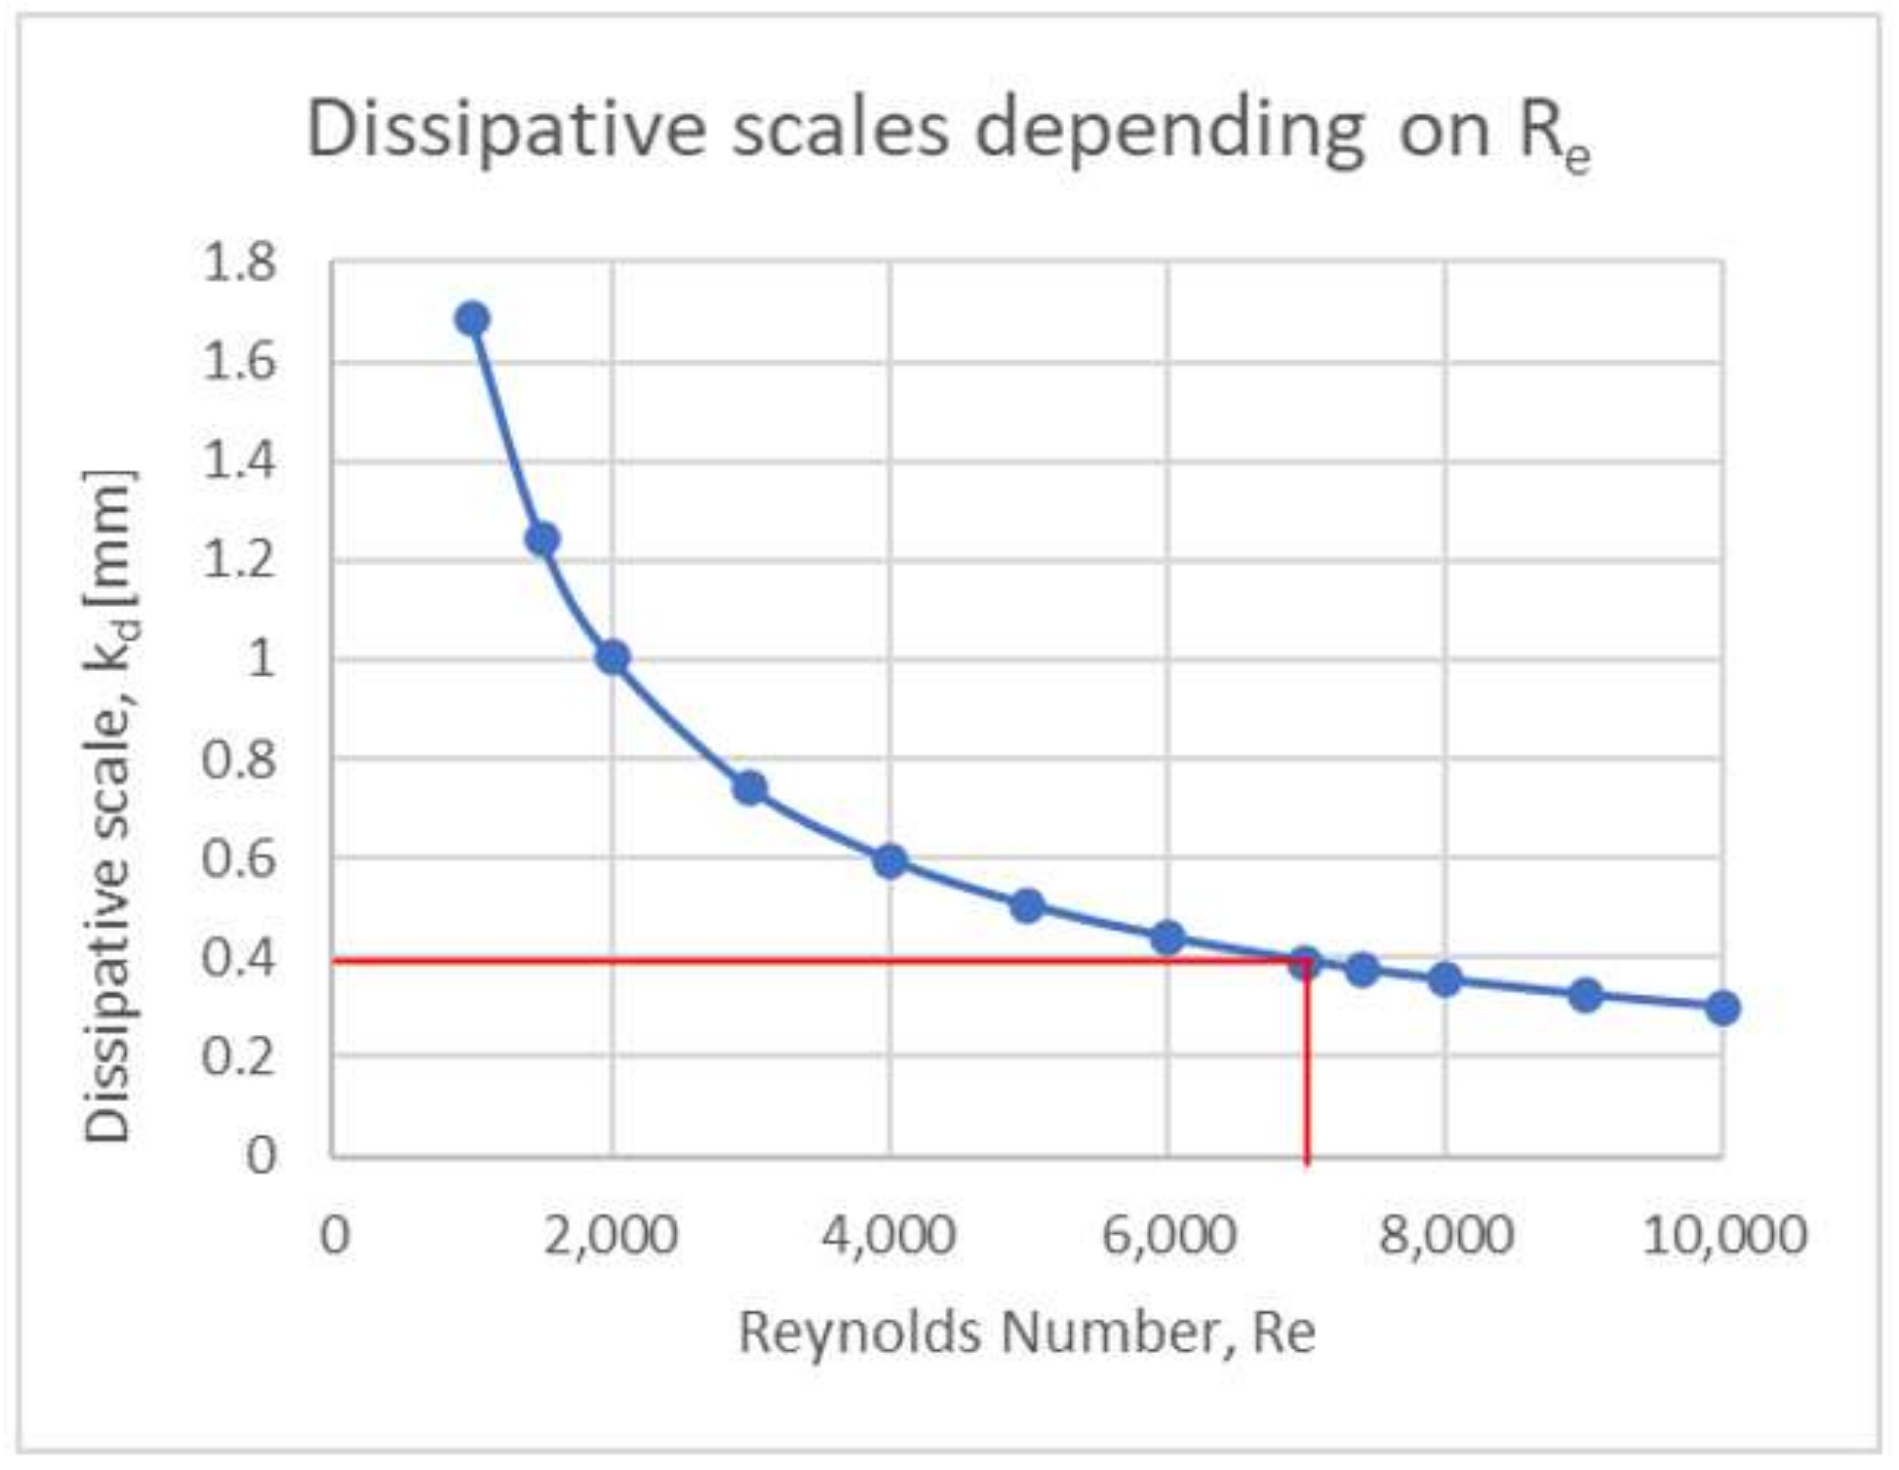
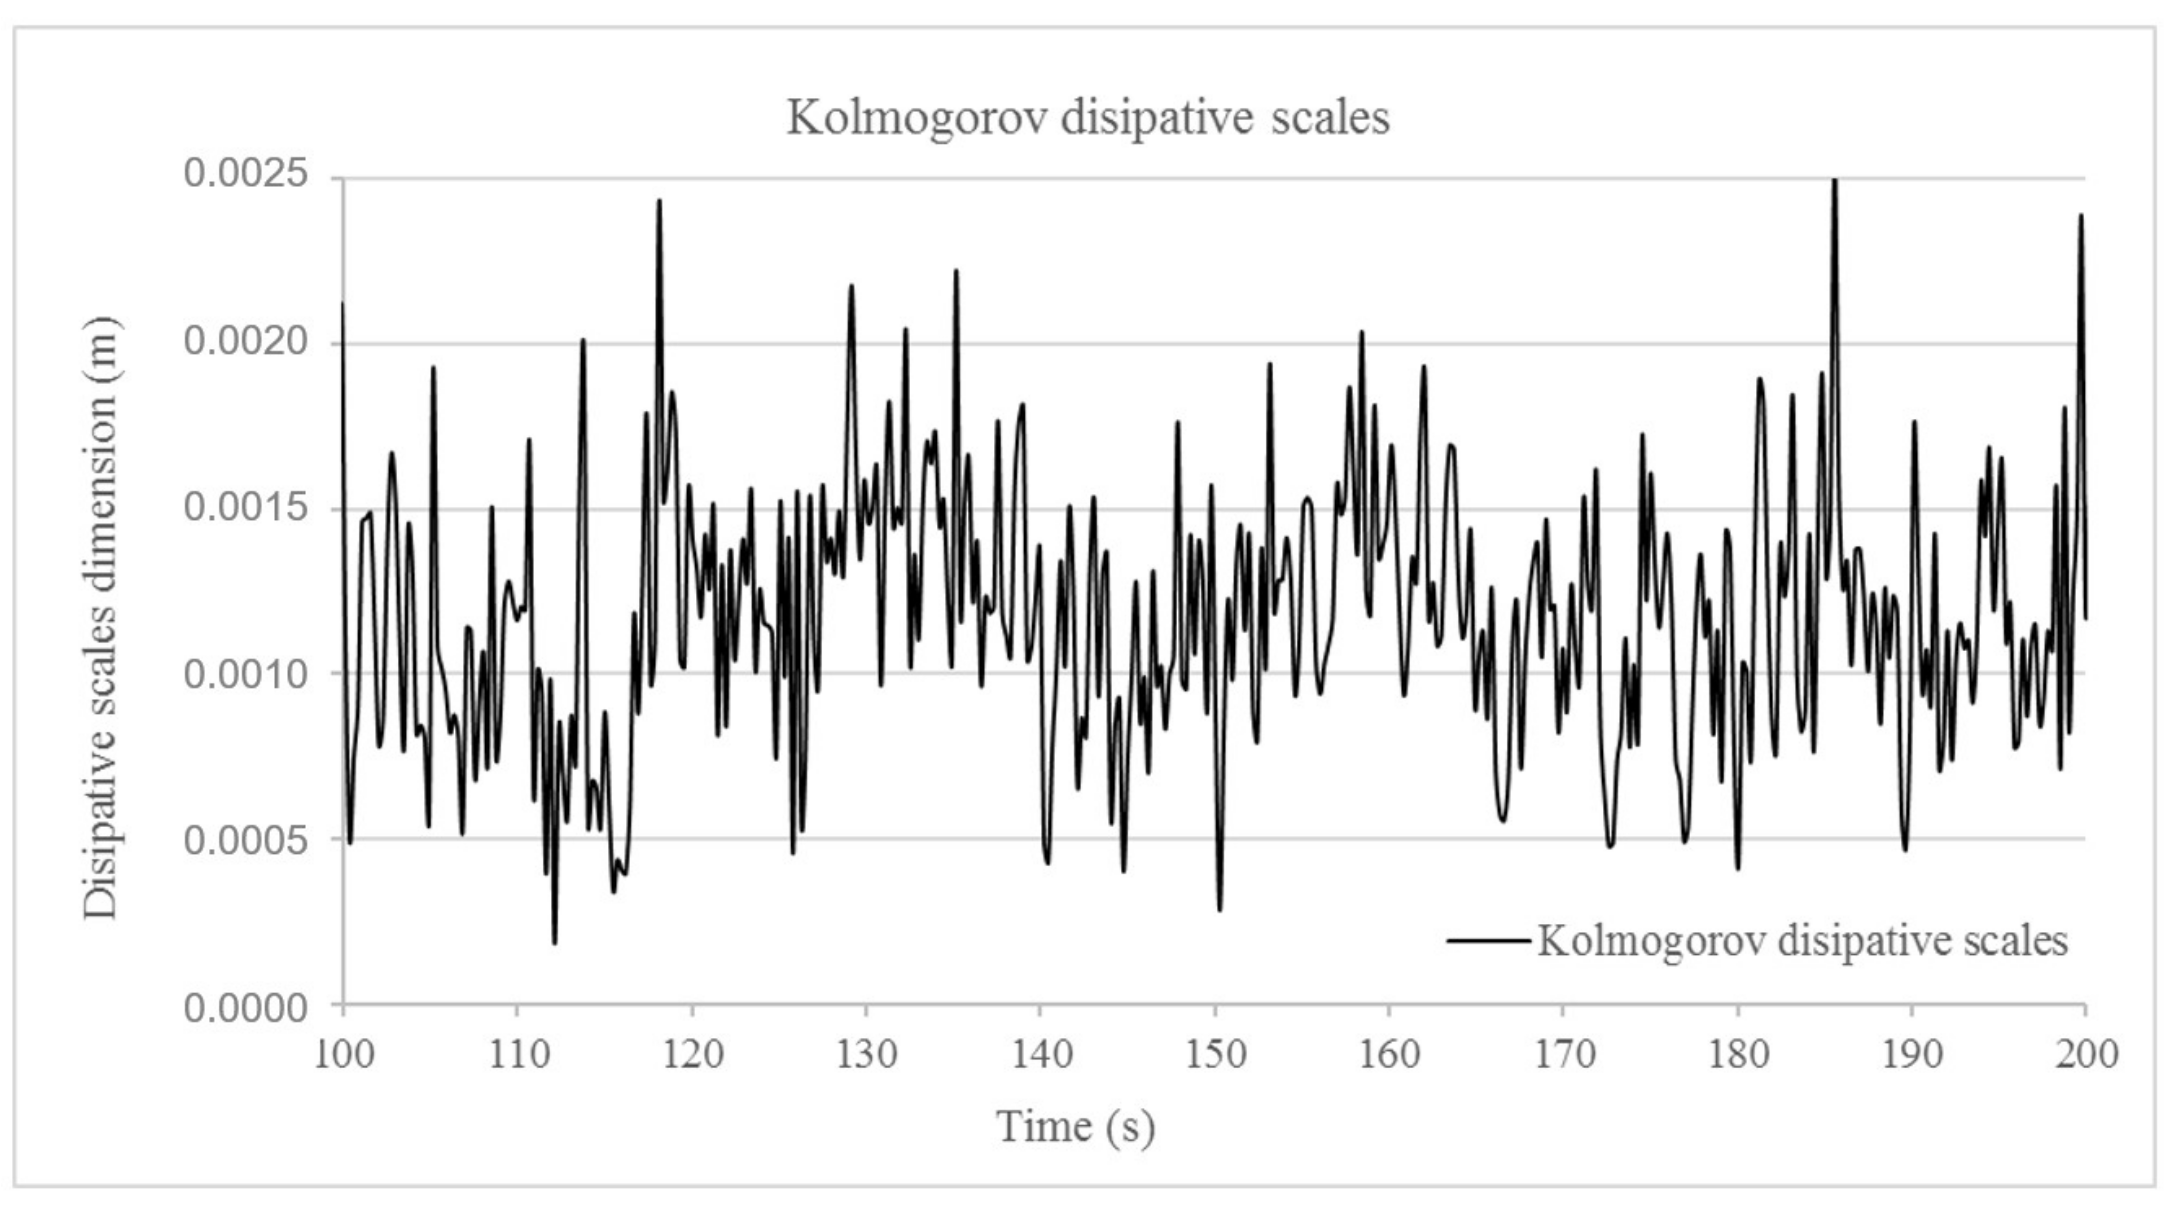
In this case, this main velocity is around 0.7 m/s. This velocity determines a Reynolds number, Re, of 7400. Based on the largest integral turbulence scales that are considered, 300 mm, the smallest dissipative scales have a dimension of 0.38 mm.
It is determined that a dimension of the dissipative scales of approximately 0.4 mm (see
Figure 6 and
Figure 7) should be considered in the DNSs developed in the research. Hence, a 100% resolution of the turbulent scales and the kinetic energy can be obtained without modeling any fraction of the Kolmogorov turbulent scales. It is a fundamental issue to obtain adjusted results to flow reality in DNSs.
Another important aspect of DNSs is the time increment that is considered. It must comply with the Courant–Friedrichs–Lewy (CFL) convergence condition. The convergence of the equations that describe hyperbolic flows is only obtained if Equation (11) is satisfied. It is necessary to guarantee the relationship between the fluid velocity and time increment and the mesh size on each dimension [
41].
Considering that the Courant number must have a value under one to guarantee the convergence of NS equations, for a mesh size of 0.4 mm and a maximum flow velocity of 0.7 m/s, the smallest time increment considered on each numeric iteration is 0.00057 s.
Initial Conditions
The initial reference temperature of the simulation is 20 °C, with an atmospheric pressure of 101,324 Pa. The heat source emits a temperature on its surface of 100 °C during all the DNSs. No initial disturbance that may disturb the initial signal is considered.
2.2.2. Two-Dimensional Large Eddy Simulations
Besides the development of DNSs, the capacity of several LESs to capture correctly the two-dimensional flow turbulence is analyzed.
Geometry and Boundary Conditions
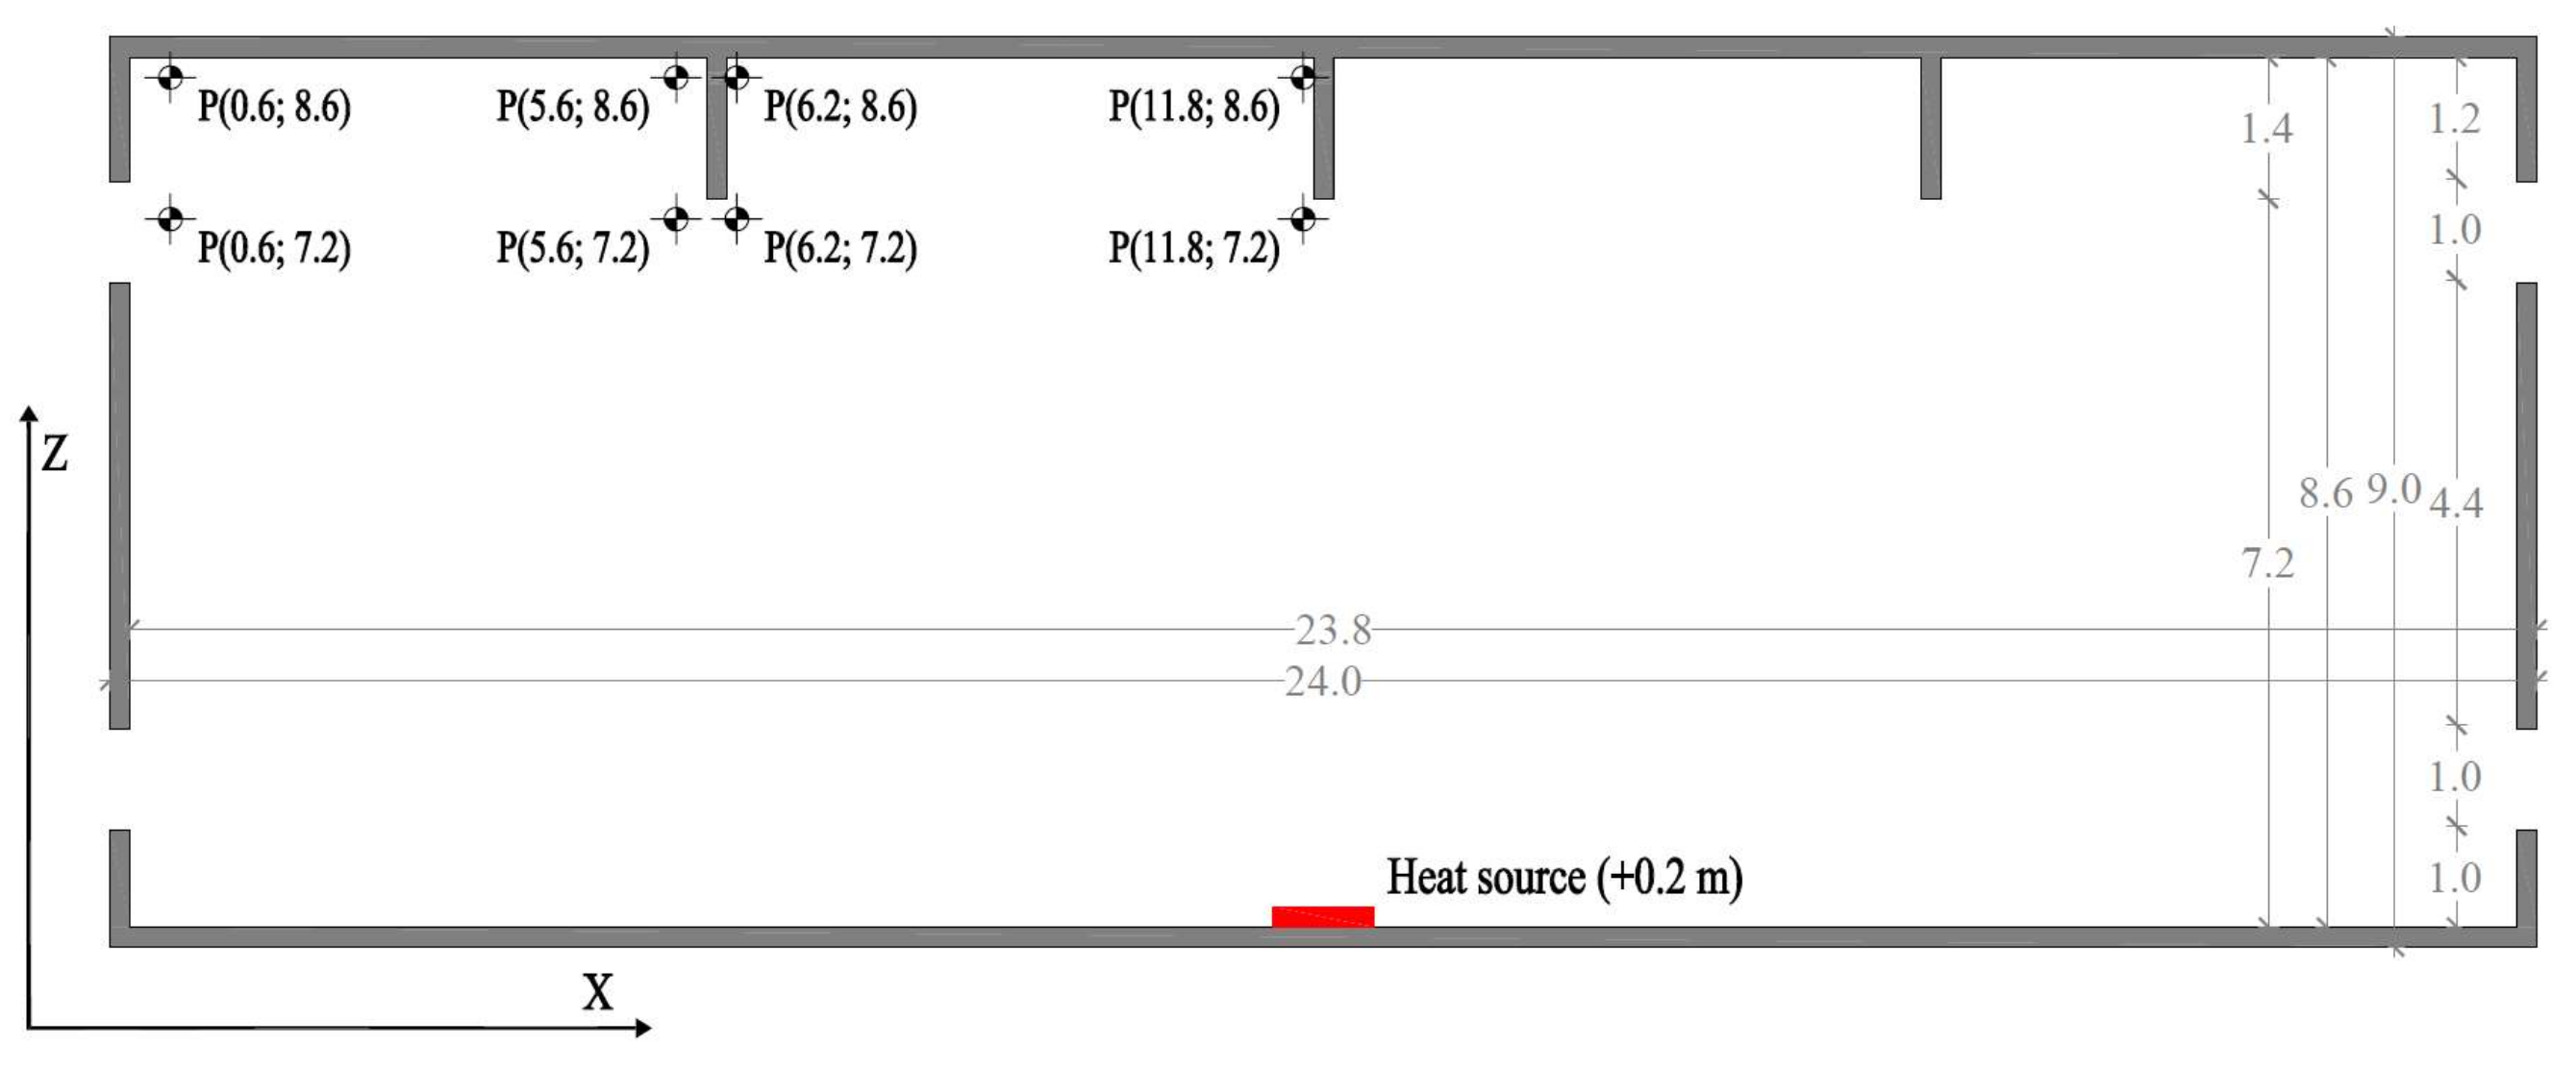
The geometry that is considered in the present work corresponds to a typical large closed space with a large-span roof. This benchmark represents, for example, a sports center, in which the most common fire event is a localized fire without flash-over. With this aim, a two-dimensional model of 24 m × 9 m is developed. Its geometry is symmetric, and it is limited to concrete walls 200 mm thick. Three linear elements are added in the domain with the aim of increasing the turbulent movement of hot gases (see
Figure 8).
Regarding the external boundary conditions, the concrete walls are defined by applying thermal solid boundaries. These boundaries, as in the case of the DNS models, include the thermal properties of the material (density, specific heat, and conductivity), depending on temperature. At the same time, two free boundary conditions on each side of the model are introduced to achieve the gas exchange between the interior and exterior (“opens”). A heat source is added in the center of the floor. Its rate of heat release (RHR) has varied from 250 kW/m2 to 1000 kW/m2.
Spatial and Temporal Resolution
The grid resolution of the LES models is defined based on the non-dimensional parameter plume resolution index (
PRI), according to Equation (12),
where D* is the characteristic fire diameter (see Equation (13)), and ∆
x is the dimension of the cell of the grid. PRI ratios close to 4 correspond to coarse meshes, while values close to 16 are associated with a fine grid resolution.
Three different grid resolutions are used in the work: 200 mm, 100 mm, and 50 mm.
Table 1 includes the
PRI values corresponding to each one of the grid resolutions.
In fire models, the grid resolution must be adapted to the physics that must be resolved and the variables under study. In the LES models that are developed in this work, it is necessary to characterize with a high level of detail the dynamics of the fire plume, as well as the behavior of hot gases. The Sandia 1 m methane pool N° 14 fire test [
42] and the validation model corresponding to this fire test [
43] are considered to validate the grid resolution and the PRI of the LES fire models of the work. This validation model, corresponding to a low flow rate, considers a grid resolution of 60 mm for a D* value of 1.191. This implies a PRI of 20, very close to the value used in this work for an RHR of 1000 kW and a grid resolution of 50 mm.
The dynamic method of Germano and the method of Smagorinsky–Lilly are used for the NS equations closing [
44,
45]. Considering the entry parameters (mesh sizes, RHRs, and closing methods of NS equations), the total number of simulations is 27.
Initial Conditions
Initial ambient conditions, as in the case of DNSs, correspond to an air temperature of 20 °C and an atmospheric pressure of 101,325 Pa. To avoid possible mathematic symmetries due to the geometric configuration of the model, an initial disturbance in all LESs has been considered.
2.2.3. Three-Dimensional Large Eddy Simulations (Validation Models)
Several three-dimensional LES models have been developed to compare and validate the results obtained in the two-dimensional LES models. These 3D models allow us to compare the spectral analysis of two- and three-dimensional models. This is the objective of the model described in
Section 2.2.2, which is considered a reference model that includes the Y-dimension in the analysis.
Geometry and Boundary Conditions
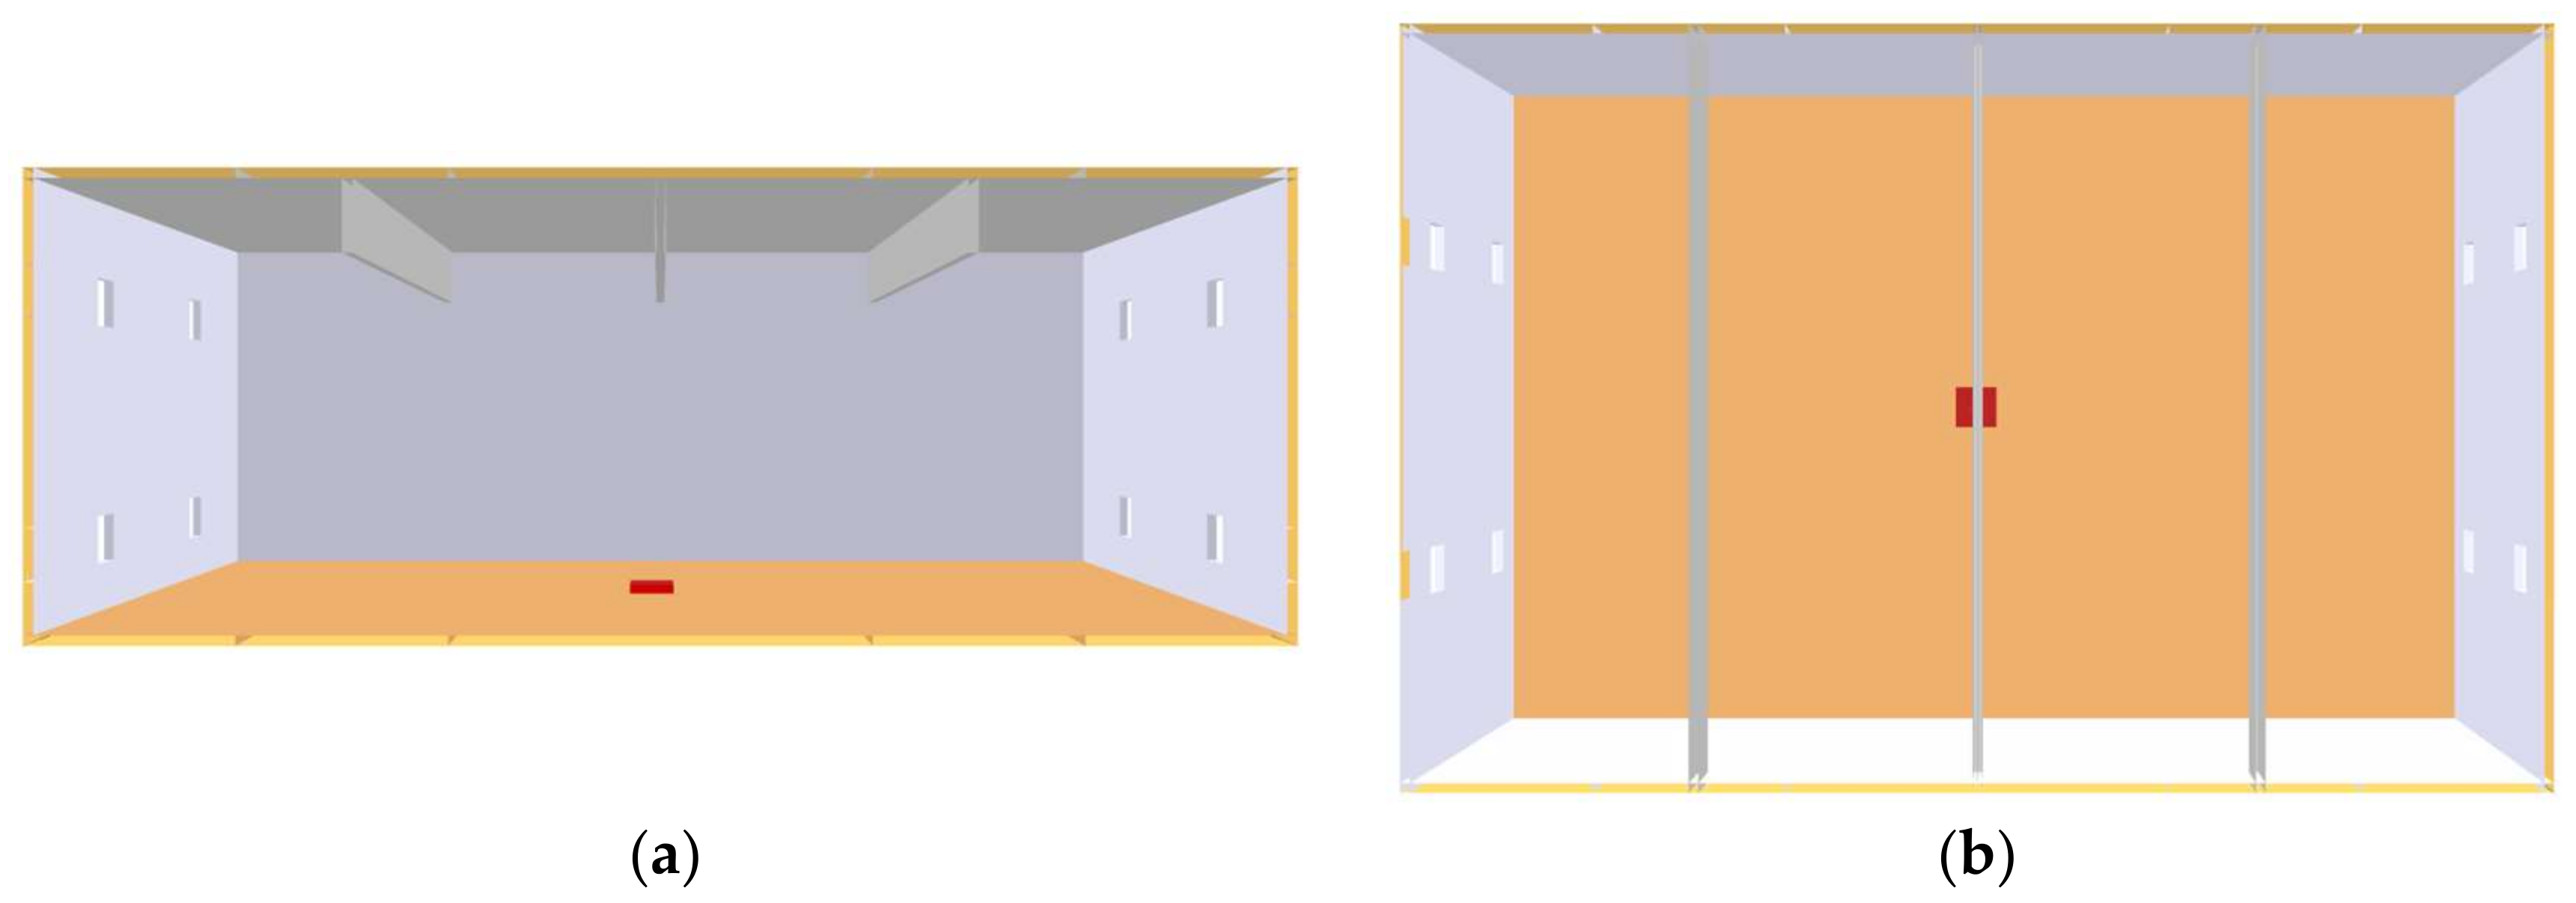
The geometry of the validation models corresponds to a typical large closed space with a large-span roof, as in the previous case. A three-dimensional model of 24 m × 16 m × 9 m is developed. Its geometry is symmetric, and it is limited to 200 mm thick RC walls. Three linear elements (beams) are added to the domain with the aim of increasing the turbulent movement of hot gases (see
Figure 9).
Boundary conditions in the three-dimensional LES simulations are the same as in the two-dimensional ones. These boundaries, as in the case of the previous models, include the thermal properties of the material (density, specific heat, and conductivity), depending on temperature. At the same time, four one-square-meter free boundary conditions on each side of the model are introduced to allow the gas exchange between the interior and exterior (“opens”). A heat source is added in the center of the floor. The rate of heat release (RHR) has been 1000 kW/m2.
2.2.4. Spectral Analysis of Turbulent Vorticity
The spectral analysis that has been developed has allowed us to identify which frequencies have been correctly simulated and which ones are outside the two-dimensional simulation. With the aim to develop the analysis of the fluid behavior from the output obtained from simulations, it is proposed the transformation of the kinetic law of the flow rotational in the function of time, for it does not depend on time but on frequency.
The flow rotational obtained in DNSs and LESs is in direct relation with flow velocity in both directions. The equation that governs the flow behavior depends only on the velocity in u and w for the evaluated rotation in the simulations developed in two dimensions (14).
The transformation of the function
F(
t) to
F(
ω), called the Fourier transform, is defined as follows (15):
Thus, a function that was initially defined as a function of time can become a function of frequency that is easier to operate. At the end of the process, the inverse transform is performed in a similar way (16):
In the specific case of the numeric simulations that are performed, the output corresponds to a series of discreet values. Therefore, the discreet Fourier transform (DFT) is applied. The algorithm that is used for the calculation is the FFT by means of the software Matlab R2023b.
Hence, a law with one variable is obtained in function of frequency. A minimum value of sampling of that frequency is defined,
fs, to guarantee that the results are correct (17).
Being Bx the maximum frequency of x.
The criteria of the minimum sampling frequency when the Fourier transform is applied to a function of type x(t) means to analyze frequencies of double the maximum value registered in the analysis, complying with the Nyquist criteria, thus avoiding the possible aliasing effects, understanding it as the impossibility to differentiate two continuous signals of different frequency when are digitally evaluated [
46].
One dataset reproduced the kinetic law in the function of time in a point P of the space and performed the spectral analysis of the frequencies that are associated with those values. A time increment is considered between the sampling points of 0.05 s, representing it a sampling frequency of 20 Hz.
The FFT is developed by means of 32,768 analysis points. Provided the mathematic algorithm that is used, it is optimal that the number of sampling points is in the power of two for the management of large entry datasets and to obtain the function (
f(
ω)). The consideration of values of 2 × 10
15 allows us to develop the FFT with mathematical accuracy, and at the same time, a resolution efficiency larger by several orders of magnitude is obtained. The number of sampling points considered in the research is 512, depending on the time increment and the sampling duration (see
Table 2).
The most relevant data regarding the spectral frequency are defined in
Table 2. A relevant aspect regarding the application of the frequency spectral analysis is the duration of the evaluated sample. Periods ranging between 1.6 s and 25.6 s are analyzed during the research. The shortest periods are not able to identify the turbulence dissipation that is produced in the two-dimensional simulation of vorticity. The shortest periods only reproduce the number of points defined for the sampling frequency of 20 Hz.
5. Conclusions
Most studies in the field of two-dimensional turbulence are developed considering incompressible flows. This is probably due to the fact that two-dimensional turbulence has traditionally been applied to large-scale movements of the atmosphere and the oceans.
In contrast with the ocean and atmosphere flows, which can be considered as incompressible flows, in the field of fire engineering, they must be considered as dilatable flows. This fact generates the buoyancy of the gases because of the thermal gradients. The use of two-dimensional fluid dynamic simulations, applying NS equations for viscous dilatable flows for the characterization of several aspects of fire behavior, means an innovative aspect in the field of fire engineering. Some aspects that can be analyzed with this type of simulation are as follows:
- ▪
Small coherent structures in the diffusion flames;
- ▪
Interaction between 2D coherent structures and 3D turbulences;
- ▪
Influence of the filamentary structures in the buoyancy of thermal plumes.
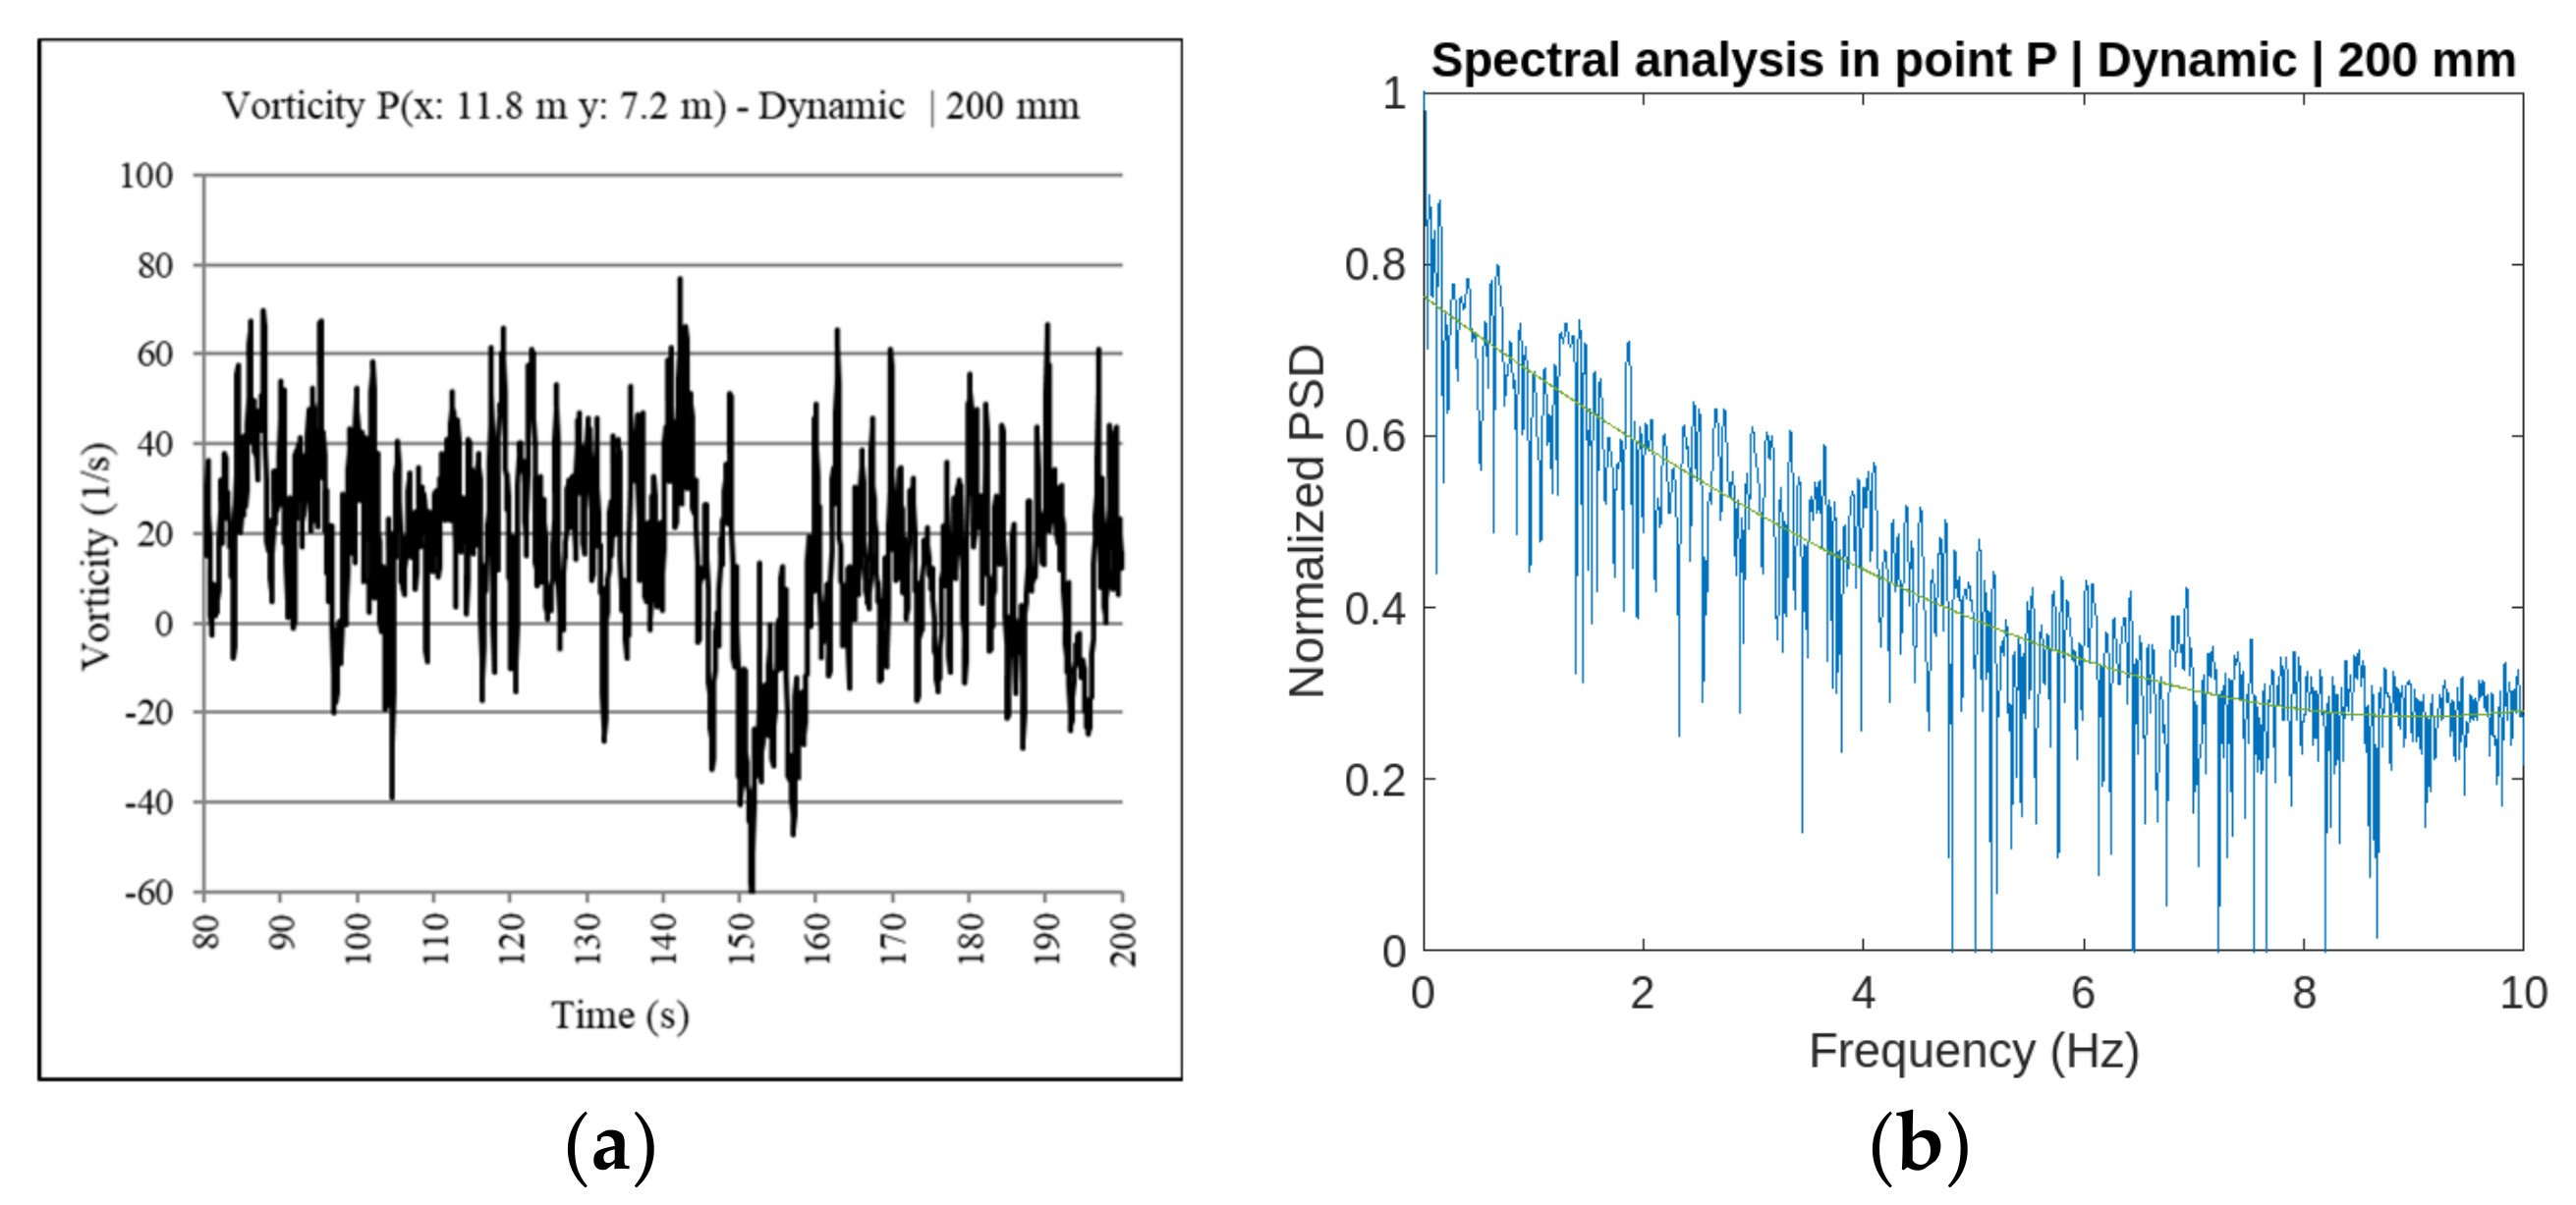
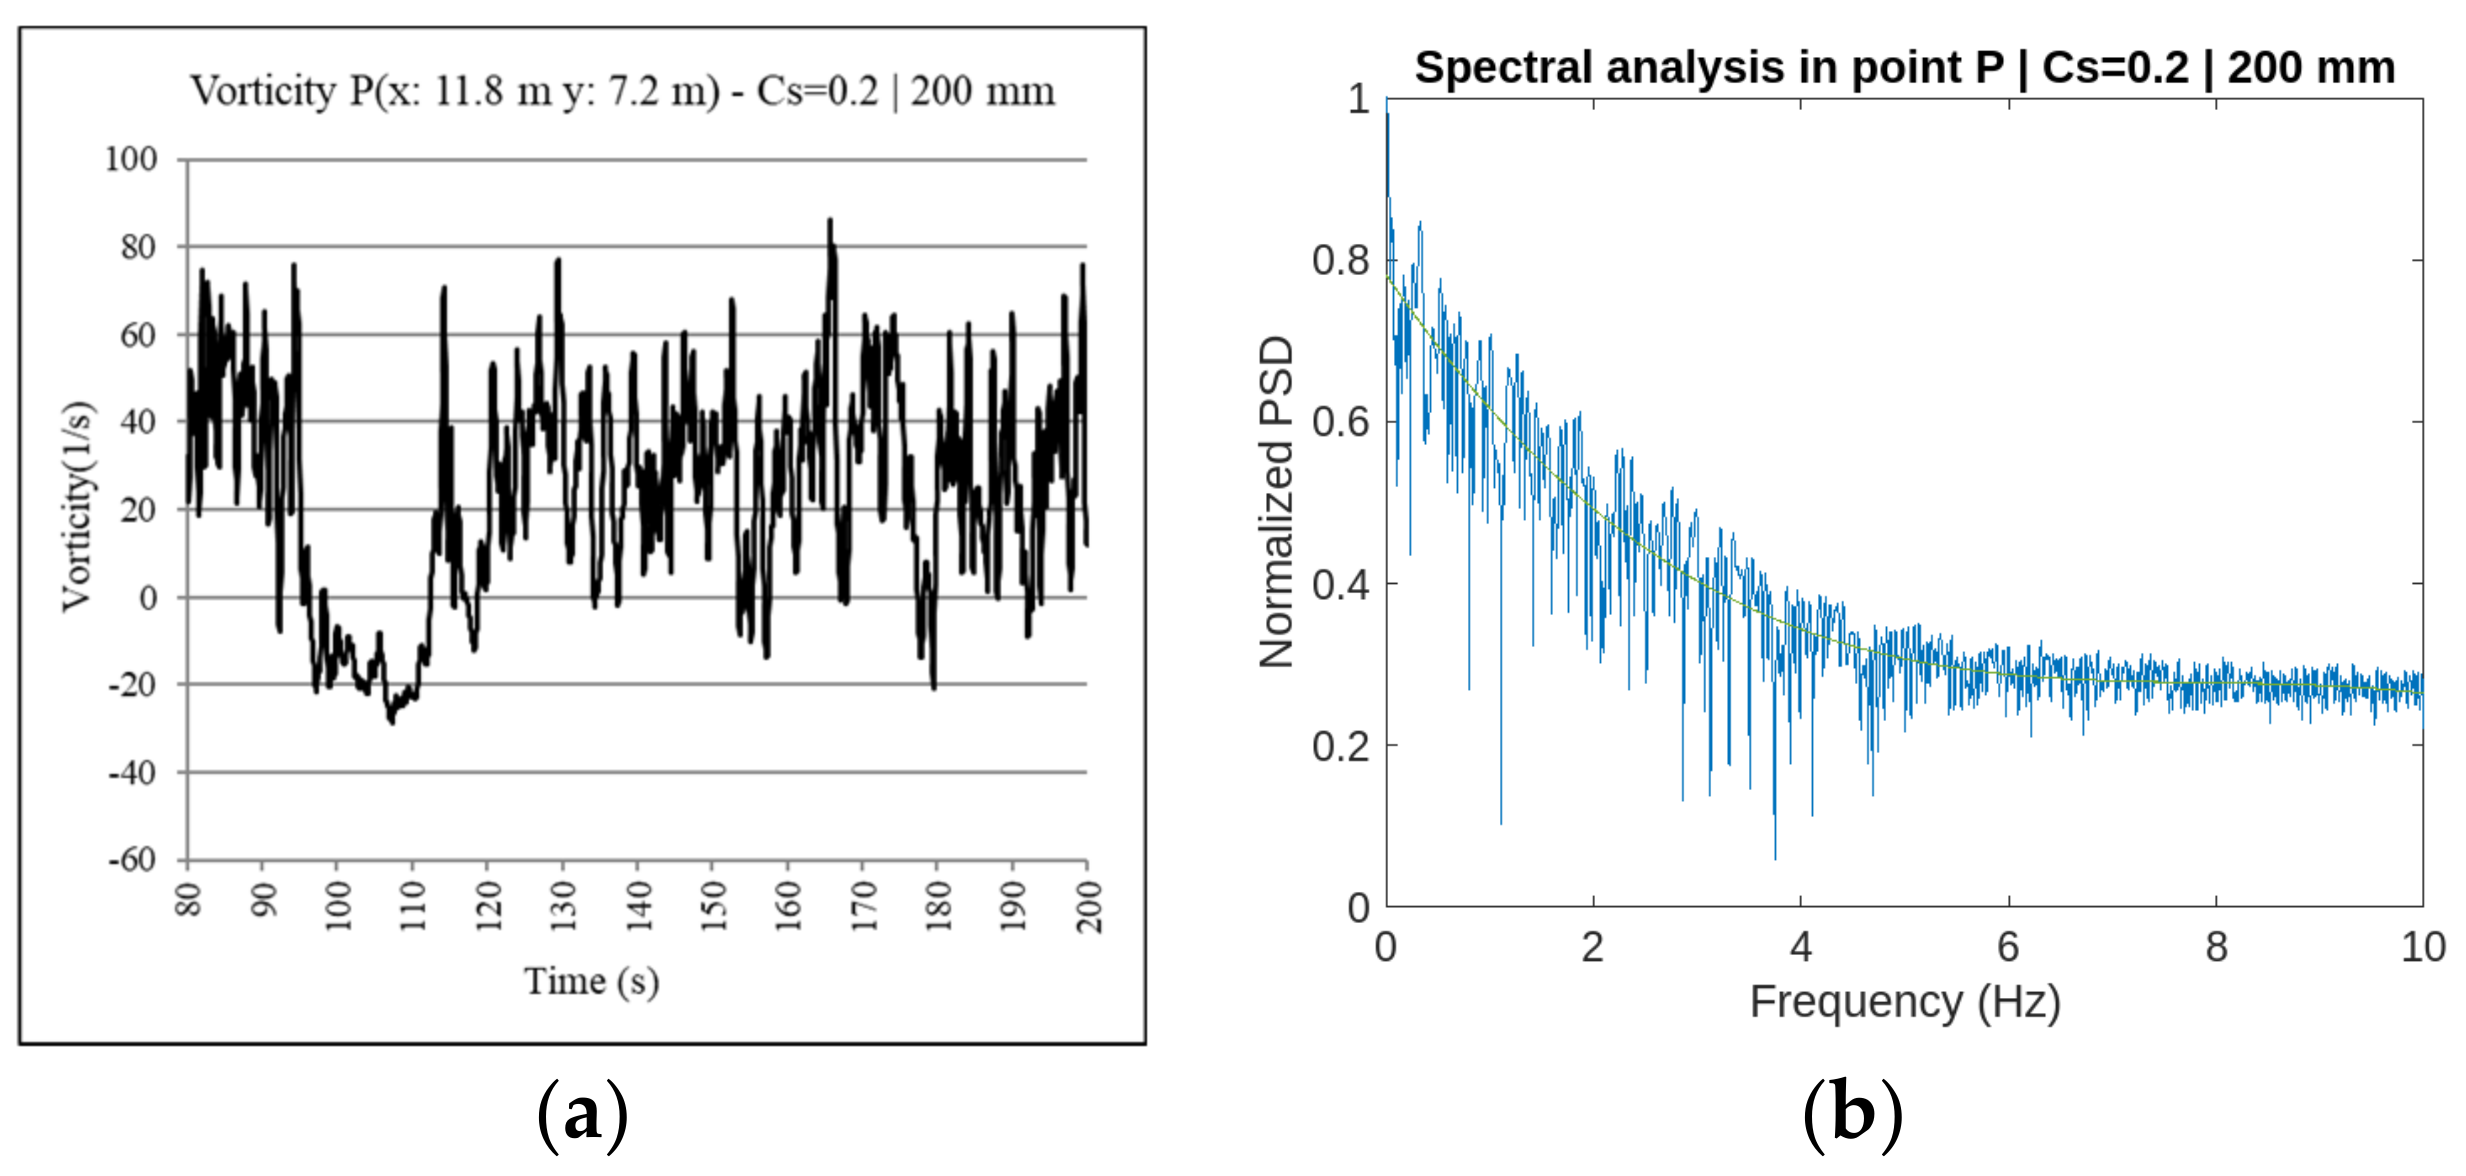
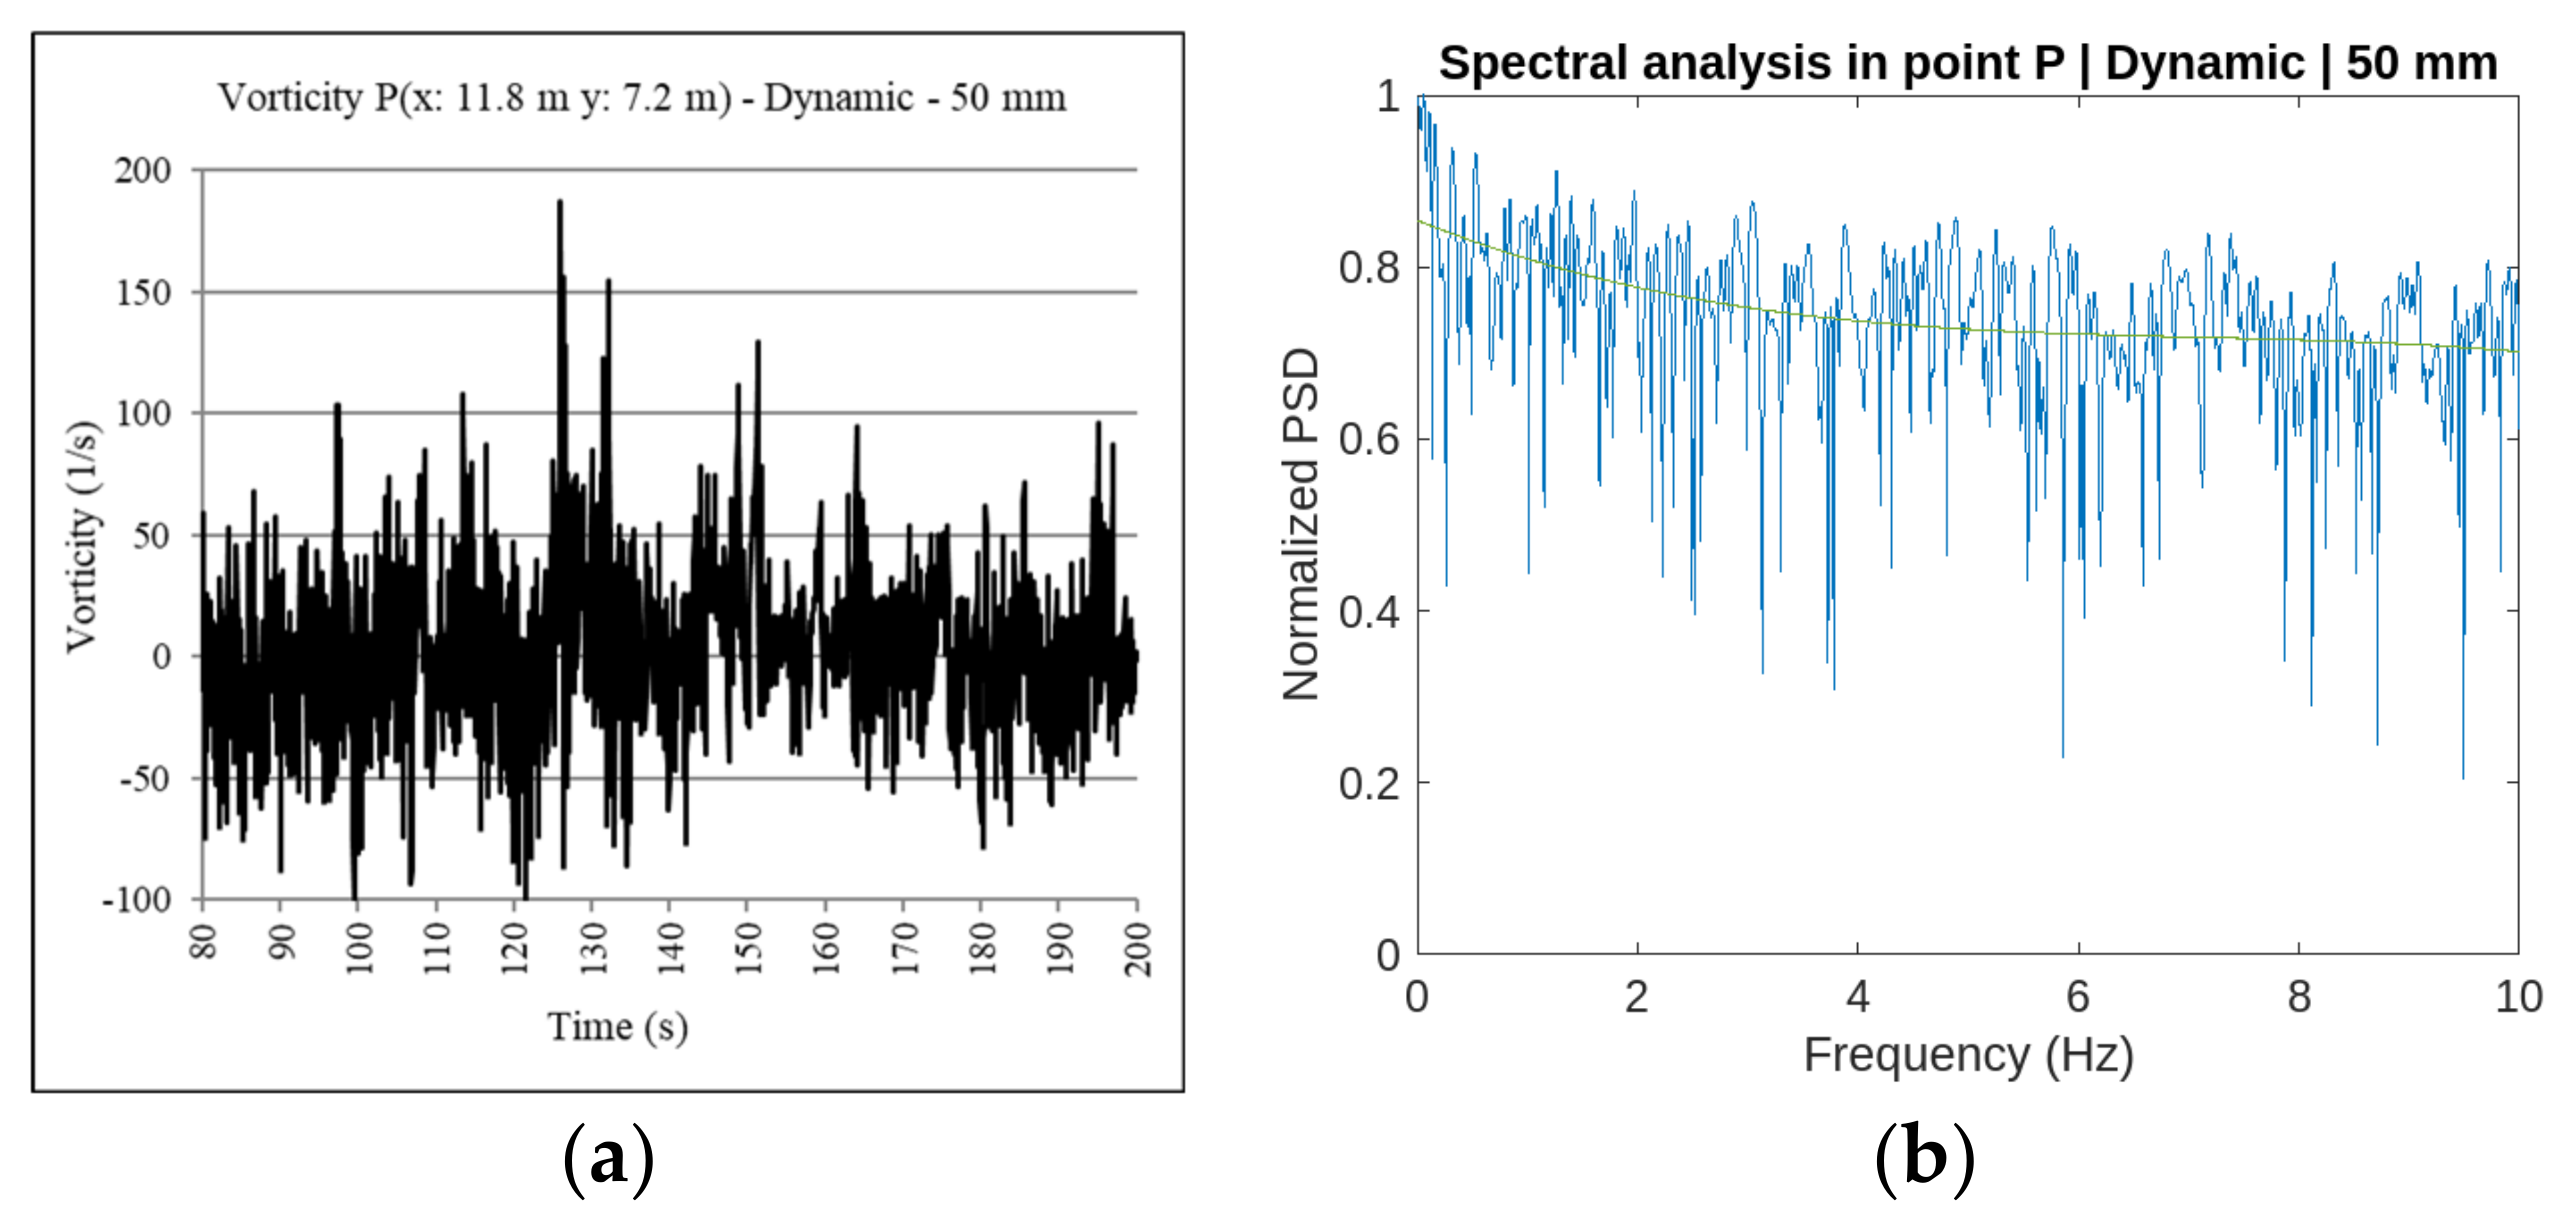
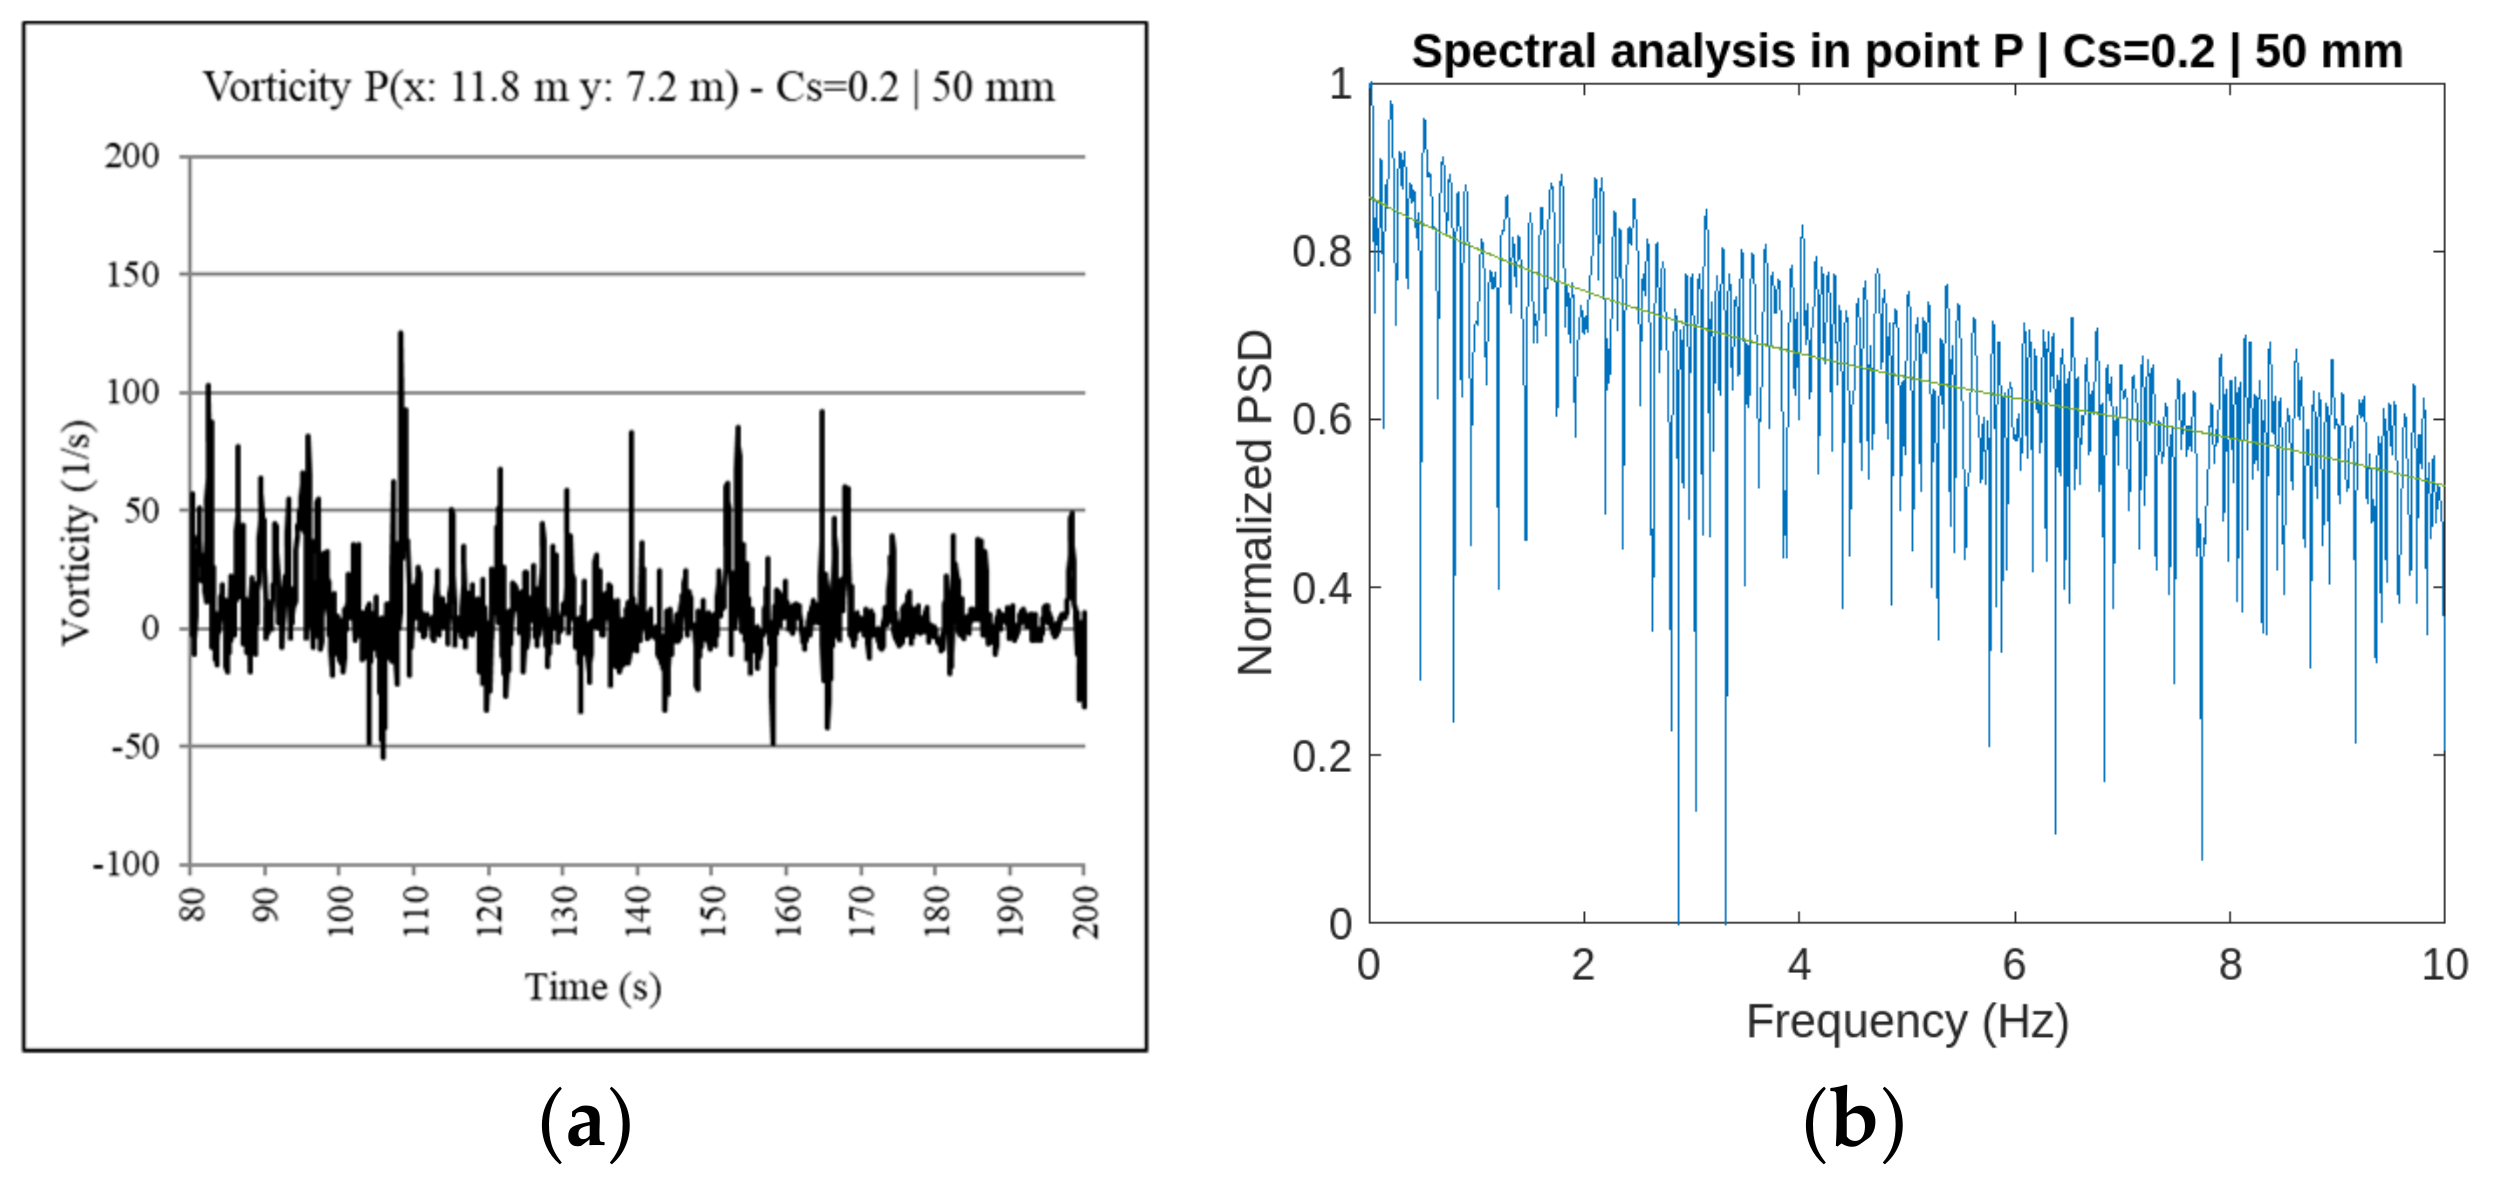
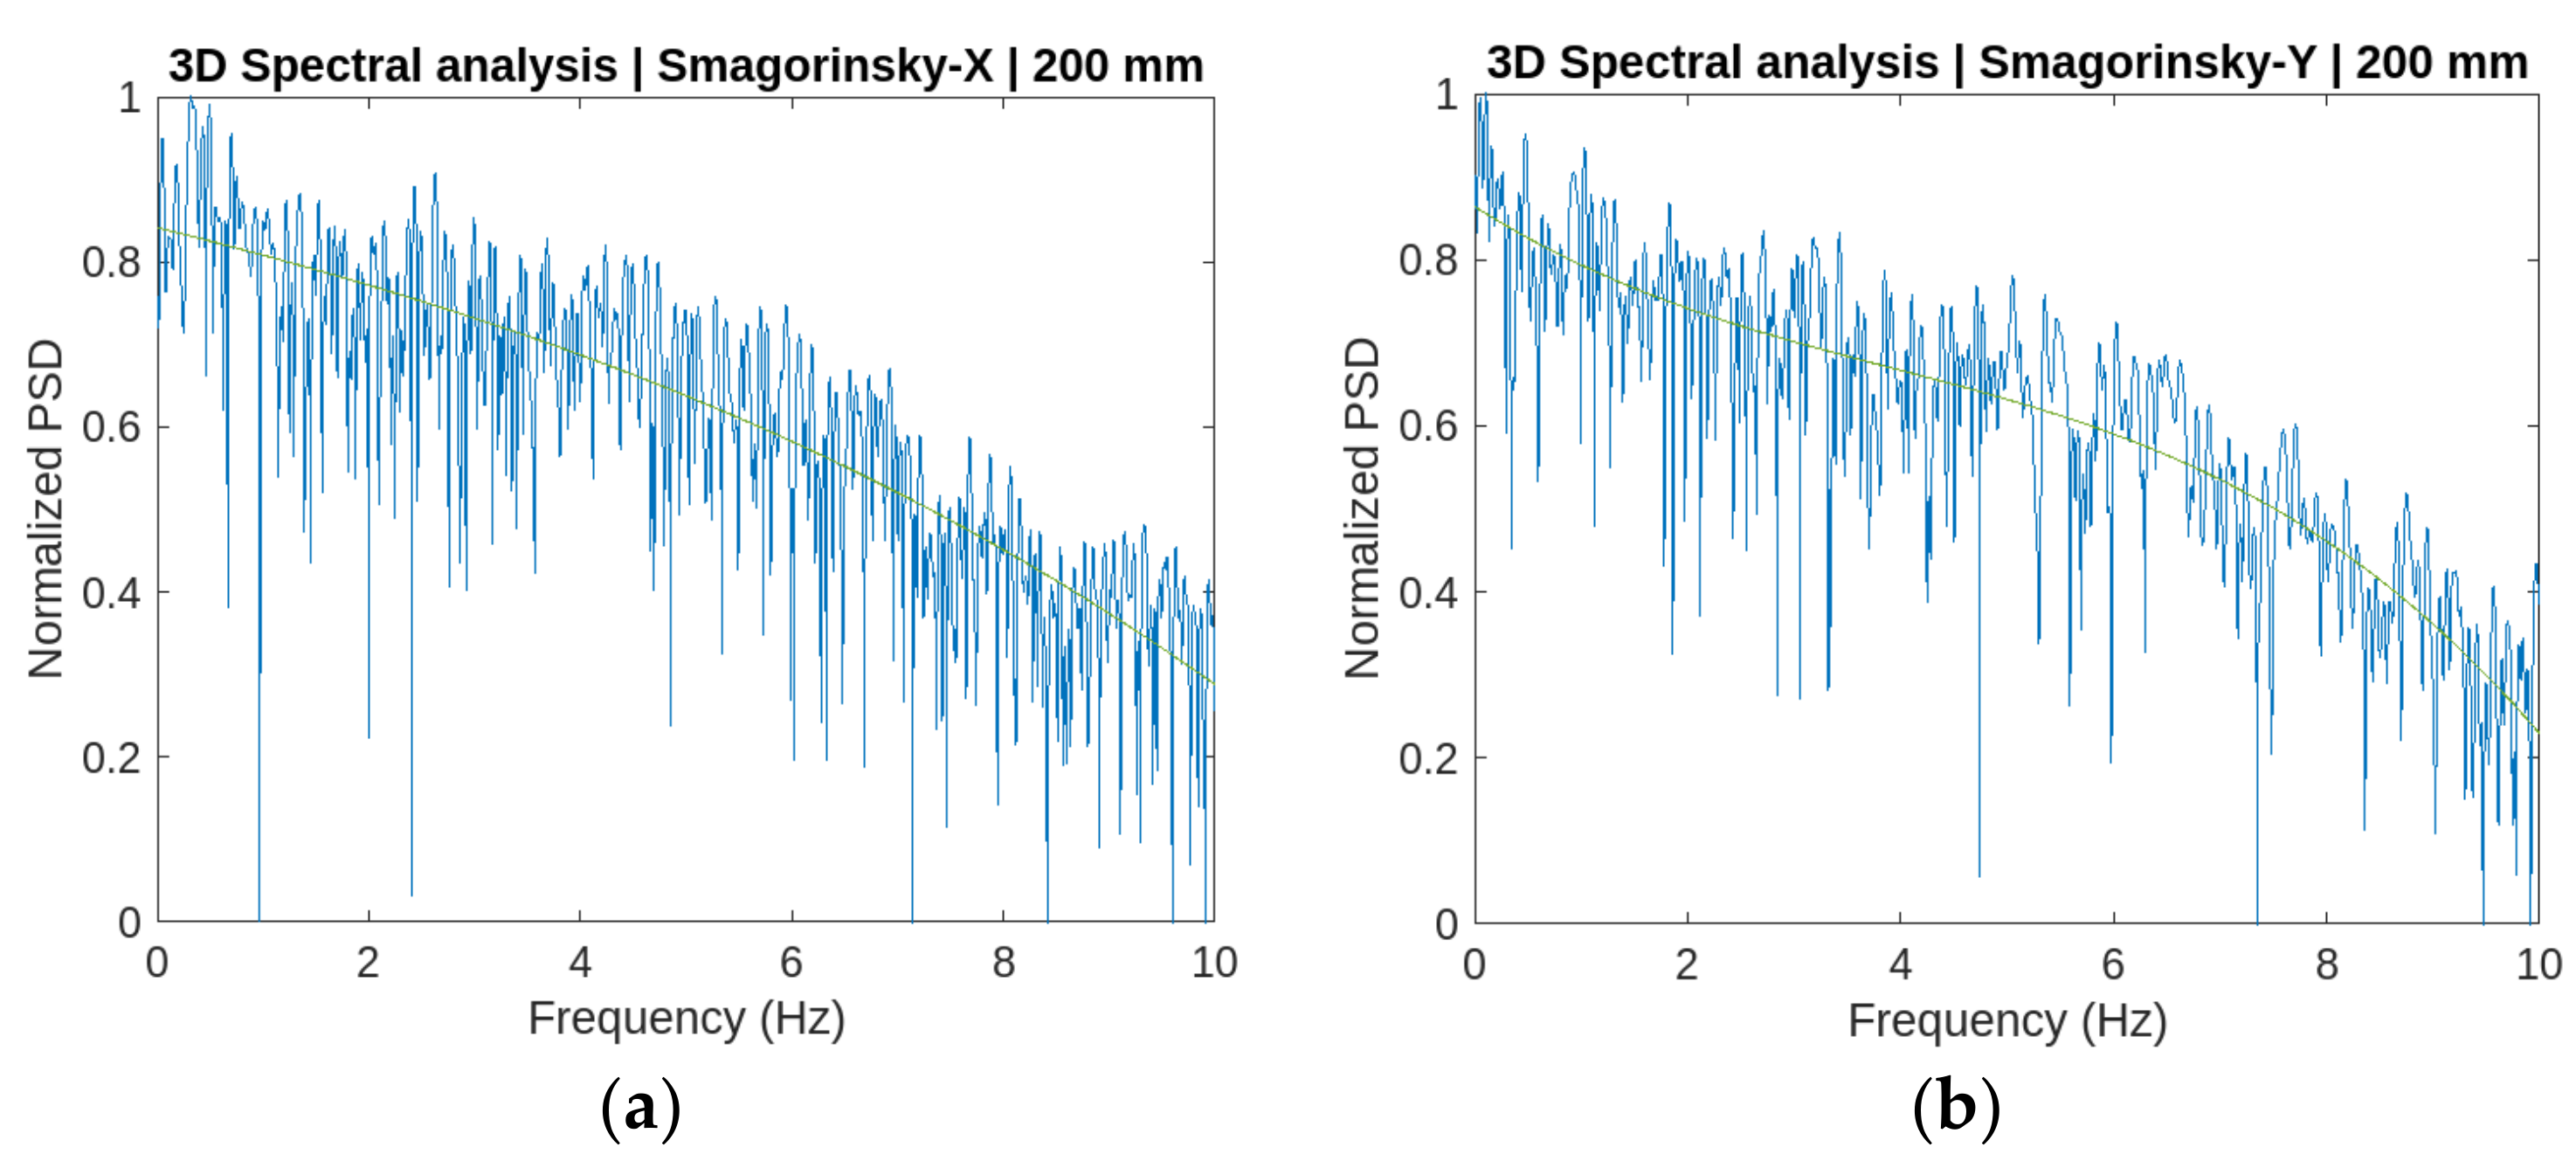
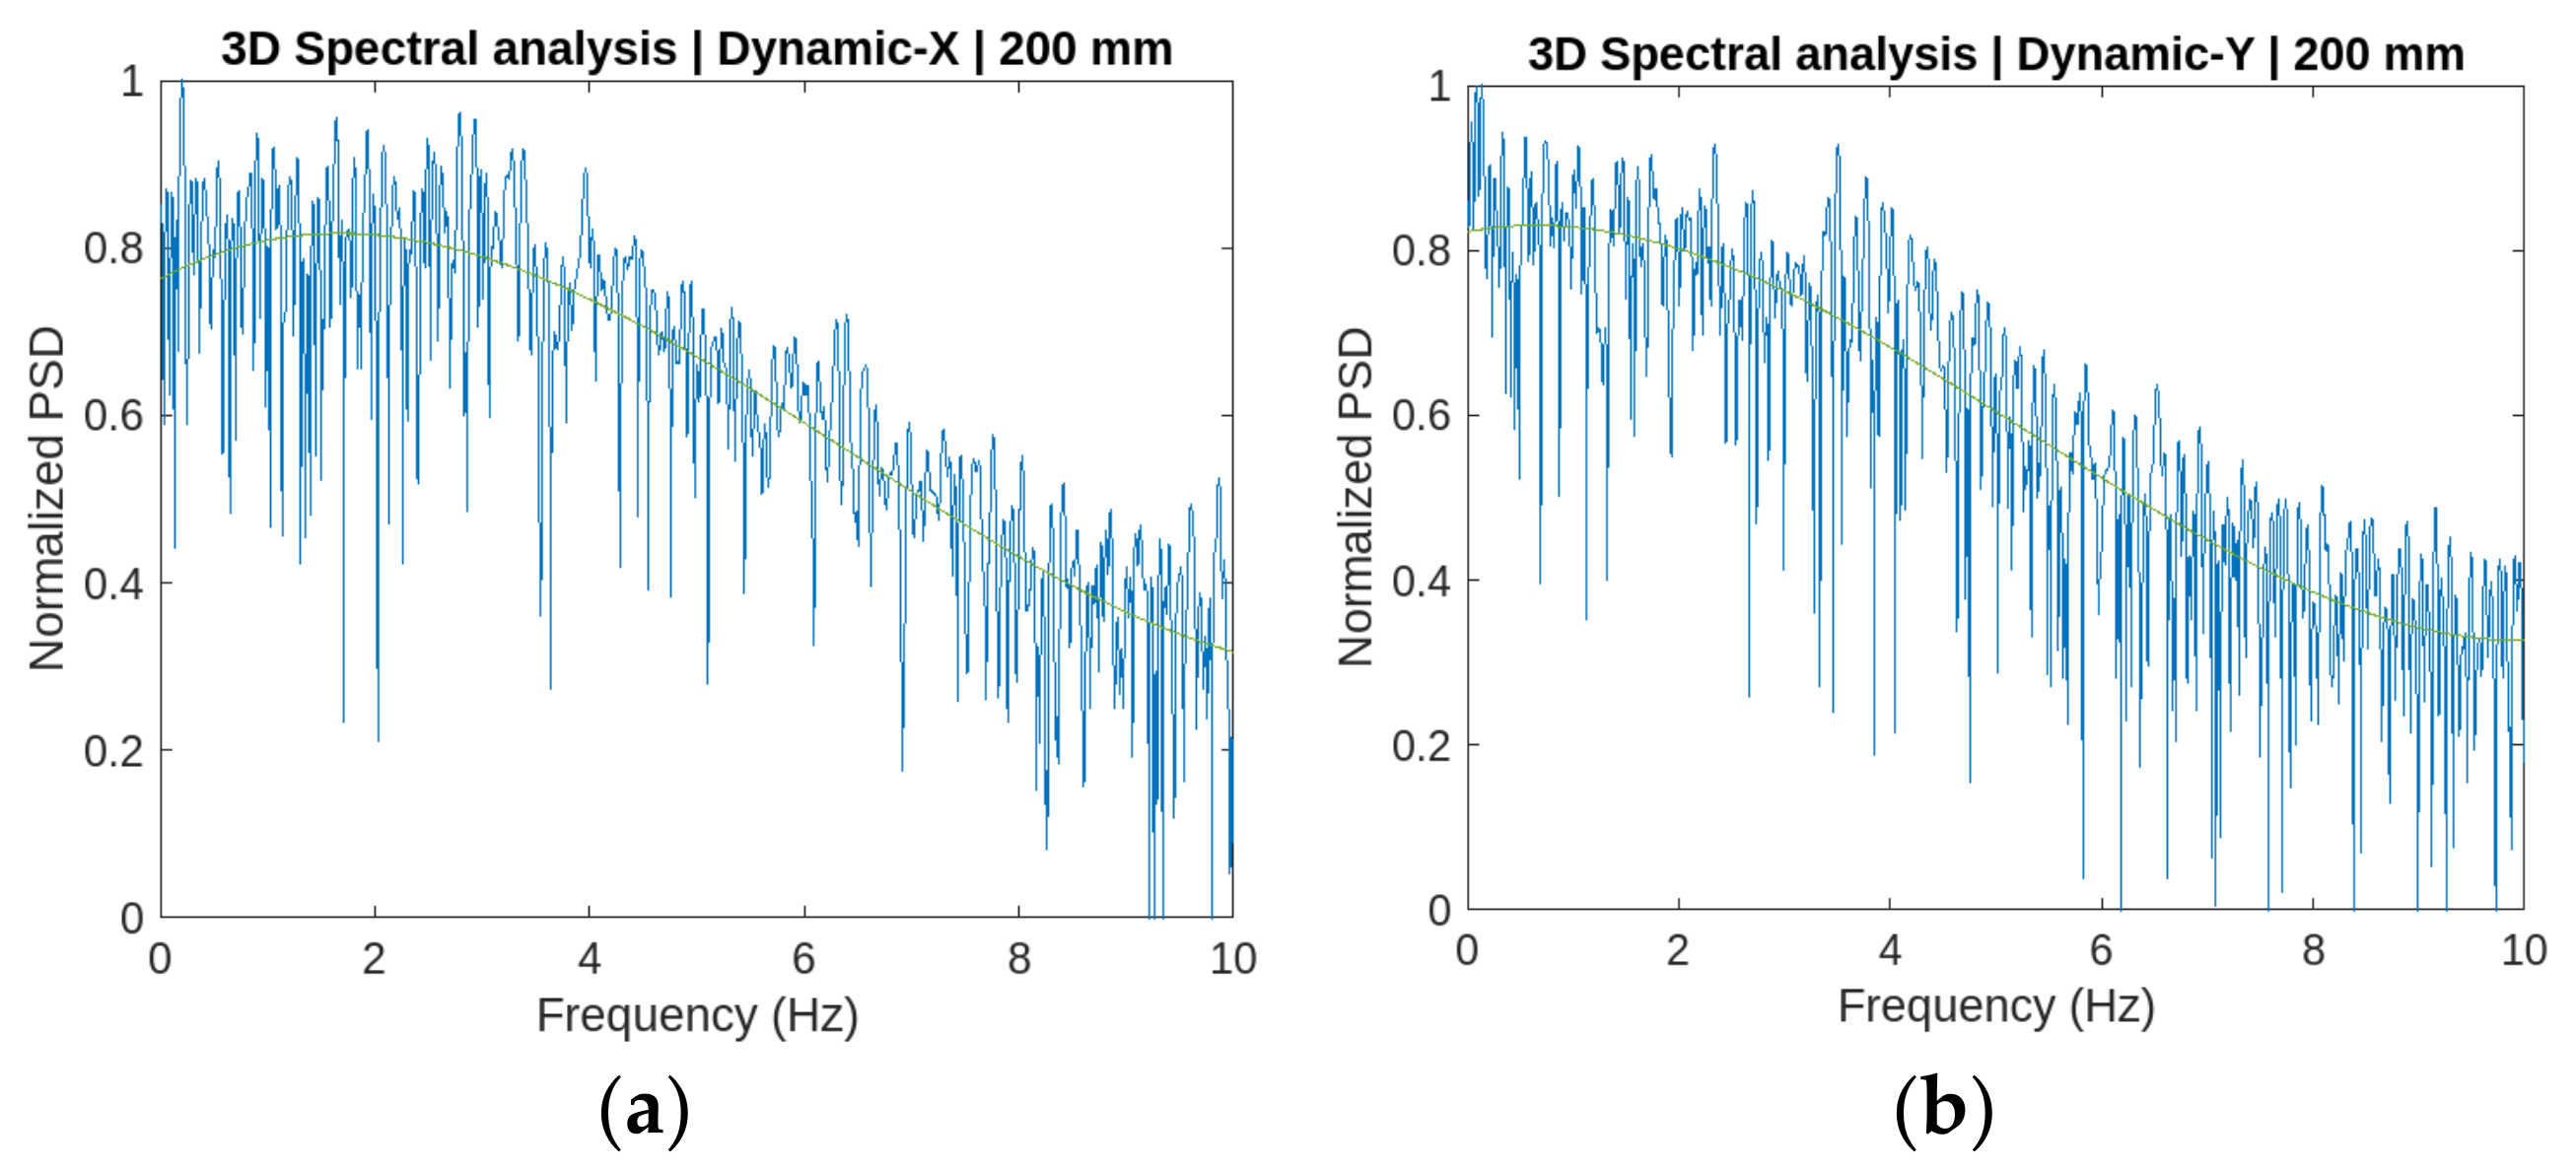
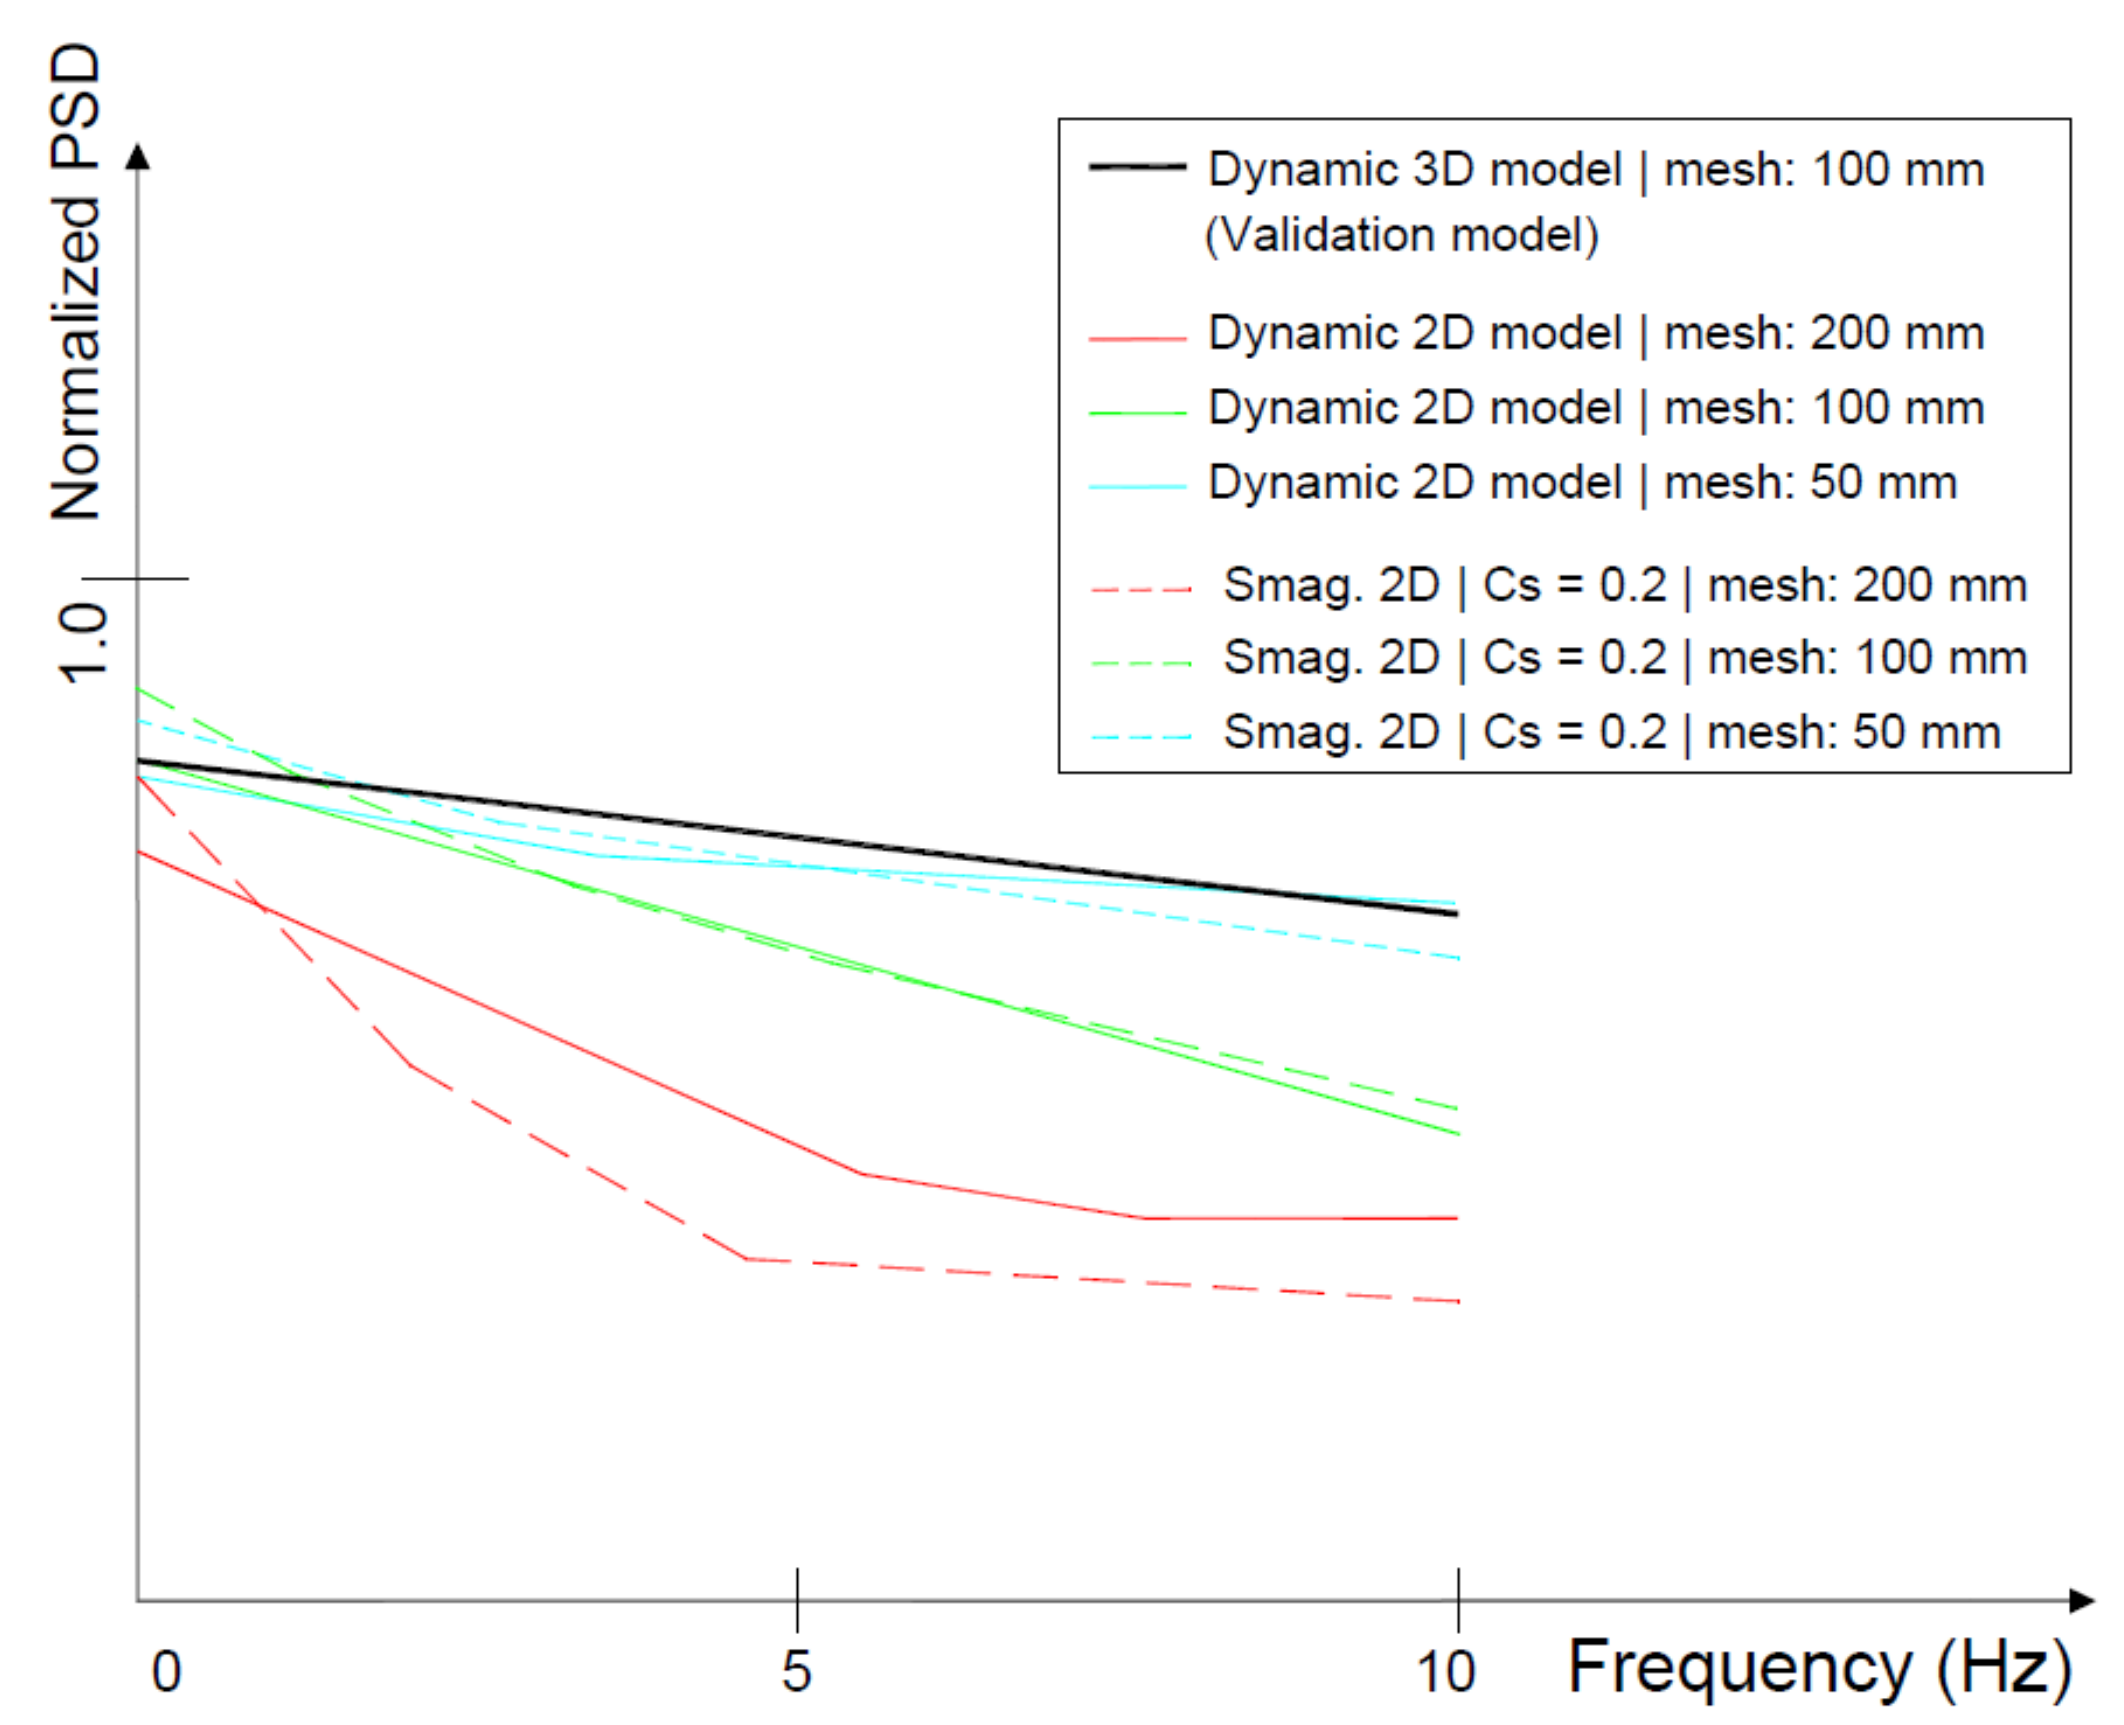
It has been proved that, thanks to the development of DNSs and 3D LES validation models, the correct simulation of all the turbulent scales in the two-dimensional field implies that the trendline associated with the frequency spectral analysis is characterized by a negative and soft slope. In the case of the 3D validation model, this slope is around values of −1/8.5 in the normalized spectrum (see
Figure 24a,b), very close to the behavior of the trendline in the 2D LES models with the dynamic SGS model. There are occasions in which the industry can obtain the benefit of two-dimensional DNSs, for example, in the numerical simulation of diffusion flames.
Those methods in which the vorticity with a minor dimension is not simulated but is modeled, thanks to the use of different closing methods of the NS equations, must be validated to guarantee that they can be used in the engineering field. All the vorticity analysis process that is presented can be used by the industry to evaluate the quality of the two-dimensional simulation in the case of using different methods from the DNSs.
In conclusion, the results obtained in the research confirm that two-dimensional fire models can be used in the initial phases of fire engineering studies to develop a relevant number of case studies to understand, in a qualitative manner, the behavior of the fire in a specific scenario. This procedure reduces the global computational cost of a fire study.
To obtain a suitable correlation in the spectral analysis of the vorticity between two- and three-dimensional LES models, the grid resolution considered in 2D models must be very fine, with a plume resolution index close to 20.
