Article

A Field Study of Coal Fire Areas Re-Burning Behavior Assessment and Related Carbon Emissions

School of Emergency Management and Safety Engineering, China University of Mining and Technology-Beijing, Beijing 100083, China
*
Author to whom correspondence should be addressed.
Fire 2022, 5(6), 186; https://doi.org/10.3390/fire5060186
Submission received: 26 September 2022 / Revised: 25 October 2022 / Accepted: 3 November 2022 / Published: 4 November 2022
(This article belongs to the Special Issue Mine Fires and Explosions)

Abstract

:
The re-burning of coal seams still occurs in coal fire areas after firefighting projects. A large amount of spontaneous combustion gas products is released from the surface fissure, which can cause air pollution and even threaten the production of surrounding mining areas. However, the distribution characteristics of fissure channels in the re-burning coal fire areas are local and scattered. Therefore, we developed a system for the in situ monitoring of spontaneous combustion gas emissions from fissure channels to conduct field investigations on the re-burning behavior of coal seams to explore the degree of re-burning in the coal fire area. The results showed that re-burning of the coal fire area induced fissure channels with different shapes. The CO2 concentrations are always higher than the CO concentrations among the spontaneous combustion gas products discharged from the fissure channels. The degree of re-burning of coal seams at different study locations was comprehensively determined using simplified MCE and CO2/CO ratios. The comprehensive factor α was obtained using the generalized principal component analysis (GPCA) by taking into account spontaneous combustion gas, meteorological factors, and the thermal physical characteristics of fissures. A carbon emission model for local fissure channels in the coal fire area was established, and the daily average carbon emissions at the study location were 2.56 t. Therefore, this provides essential theoretical support for taking corresponding fire extinguishing measures according to the degree of re-burning of the coal fire area.

1. Introduction

Coalfield fire refers to the phenomenon of coal seam combustion in coal seam outcrops or mining-affected areas under the influence of natural or human factors [1]. Coal field fires occur in various coal-producing countries worldwide, especially in China, the United States, and India [2,3,4]. In China, coalfield fires are mainly concentrated in Inner Mongolia, Xinjiang, Ningxia, and Shanxi Province [5,6,7,8]. Coal field fires not only destroy valuable coal resources but also threaten the safety of coal mining production due to their spread to the vicinity of production mines [9].
Coalfield fires are divided into three types: the outcrop type, the large mine goaf type, and small coal kiln type. Among them, the large mine goaf type and small coal kiln type of coal fire are mainly caused by human factors [10]. The Wuda coalfield fires are mainly induced via spontaneous combustion in the goafs of large coal mines or in small coal kilns [11]. The first coal fire was reported in the Wuda coalfield in 1961, and a total of 26 surface fire areas were reported up to 2004, covering an area of 4 km2 [12]. Special treatment for the Wuda coal fires began to be implemented in 2011. The prevention measures mainly included cover fire extinguishing methods, grouting fire extinguishing methods, stripping fire extinguishing methods, and comprehensive fire extinguishing methods. The special treatment project had achieved remarkable results, and the area of shallow and visible coal fires is estimated to be reduced by about 60% [13]. Although it is covered by yellow sand and loess, because the underground fire source has not been completely removed, the fissures and smoke points generated by the surface heating can be vaguely observed [14]. Therefore, exploring the re-burning behaviors of coalfield fires is also necessary.
The resupply of oxygen mainly causes the re-burning behavior of coalfield fires. Implementing the cover fire extinguishing method can gradually control the combustion degree of the coal seam so that the coal seam gradually evolves from normal oxygen-enriched combustion to oxygen-lean combustion. However, coverings such as yellow sand loess have specific pore-fissure characteristics. Part of the fresh oxygen penetrates the coal seam through the covering, causing secondary oxidation of the coal seam and re-burning [15,16]. Currently, most experts and scholars have studied the secondary oxidation spontaneous combustion characteristics of coal in the form of experiments. Niu et al. [17] used thermogravimetric experiments to study the spontaneous combustion characteristics of coal samples with different pre-oxidation temperatures during the secondary oxidation process. The pre-oxidized coal is more prone to spontaneous combustion when the pre-oxidation temperature is lower than 160 °C. Deng et al. [18] used temperature-programmed experiments to explore the secondary oxidation spontaneous combustion characteristics of four different rank coal samples and found that the risk of spontaneous combustion of coal after secondary oxidation is more serious. Wang et al. [19] used temperature-programmed experiments; they found that pre-oxidation positively affects coal spontaneous combustion parameters in the gas out of the coal-oxygen mixed reaction and has an inhibitory effect in the late stage of the coal-oxygen oxidation reaction. However, coal produces many gaseous products (CO2, CO, and CH4) during secondary oxidation [20,21]. The combustion state of coal’s spontaneous combustion can be characterized according to the changes in gaseous products. In the coal fire area that reignited after the fire extinguishing project, the gas products released by the spontaneous combustion of coal were mainly CO2 and CO. Therefore, the variation trend of CO2 and CO may be a good indicator for characterizing the combustion state of coal [22].
The spontaneous combustion gases produced by re-burning coalfield fires are mainly discharged through surface fissures, vents, or other openings. Currently, the methods of monitoring spontaneous combustion gas emissions in coalfield fire areas are mainly divided into indirect and direct measurements. The indirect methods mainly include unmanned aerial vehicle (UAV) low-altitude detection and satellite remote sensing, and the spontaneous combustion gas emissions are estimated by calculating the coal consumption in the study area obtained by the heat flux of the surface fissure channel [23,24,25]. The direct measurement is in situ monitoring, and the spontaneous combustion gas emissions are obtained by directly measuring the intuitive combustion gas in the fissure channel [26,27,28,29]. Continuous monitoring of gas emissions in the fissure channel is not possible due to the variability and randomness of the fissure channel caused by coal seam re-burning, and in situ monitoring is the best way to assess the re-burning behaviors of coal fire areas.
However, in situ monitoring of gas emissions in the fissure channel is easily affected by meteorological factors (temperature, relative humidity, wind speed, and air pressure), resulting in the inability to maintain data continuity, which seriously affects the accuracy of spontaneous combustion gas emissions. Therefore, this paper proposes a system for the in situ monitoring of spontaneous combustion gas emissions in fissure channels, and uses this system to monitor fractured channels to obtain in situ monitoring data sets. Second, the simplified MCE and CO2/CO ratios are used to comprehensively evaluate the coal fire re-burning behaviors at the study location, and the GPCA to determine the carbon emission comprehensive factor α. Finally, a carbon emission model for local fracture channels in the coal fire area is established, and the daily average carbon emission at the study location is quantified. This provides essential theoretical support for taking corresponding fire-fighting measures based on the understanding the degree of re-burning in coal fire areas.

2. Materials and Methods

2.1. Study Area

The selected research area is located in the Wuda coalfield in the Wuda District, Wuhai City, Inner Mongolia Autonomous Region. The Wuda coalfield is adjacent to the Yellow River in the east, the Gobi Desert in the northwest, the Helan Mountains in the southwest, and the Badain Jaran Desert in the north. The specific locations are shown in Figure 1. The Wuda coalfield fire is one of the largest coalfield fires in the world [28]. This area has three coal mines: Wuhushan, Suhaitu, and Huangbaici. The main coal-bearing strata are the Carboniferous Taiyuan Formation and Shanxi Formation, which belong to the shallow buried and gently inclined coal seam groups. The region has a temperate continental climate, and the annual evaporation (3500 mm) is about 20 times the precipitation (168 mm) [30]. Low mountains and hills dominate the terrain, and the environment is extremely hot and dry.
The area of this investigation is the backfill area of Wuhu Mountain and Suhaitu Coal Mine. According to the field investigation results, the fire in the Wuda coalfield has been controlled by a special fire-fighting project. Most of the terrain is relatively flat, the surface is covered with sandy soil and gravel, and there is no visible fire. However, due to the excavation measures taken in the fire-fighting project, the landscape has been damaged, resulting in a large number of ventilation channels on the surface, which has promoted the diffusion of air to the coal seam and caused the coal seam to reignite. As a result, some areas are affected by the re-ignition of coal seams, and geological features such as fissures, cracks, and ventilation holes appear on the surface. Therefore, combined with the temperature characteristics observed using a thermal imaging camera (Fortric220s, Shanghai, China), a representative fissure channel (i.e., temperature anomaly with smoke) was selected as the study location, as shown in Figure 1b–e. The shape of the fracture channel at research point 1# is linear, with a length of about 45 cm and a maximum temperature of 68.6 ℃. The shape of the fissure channel of research point 2# is a round hole. The length is about 25 cm, the diameter is about 7 cm, and the maximum temperature is 62.0 ℃.

2.2. System Overview

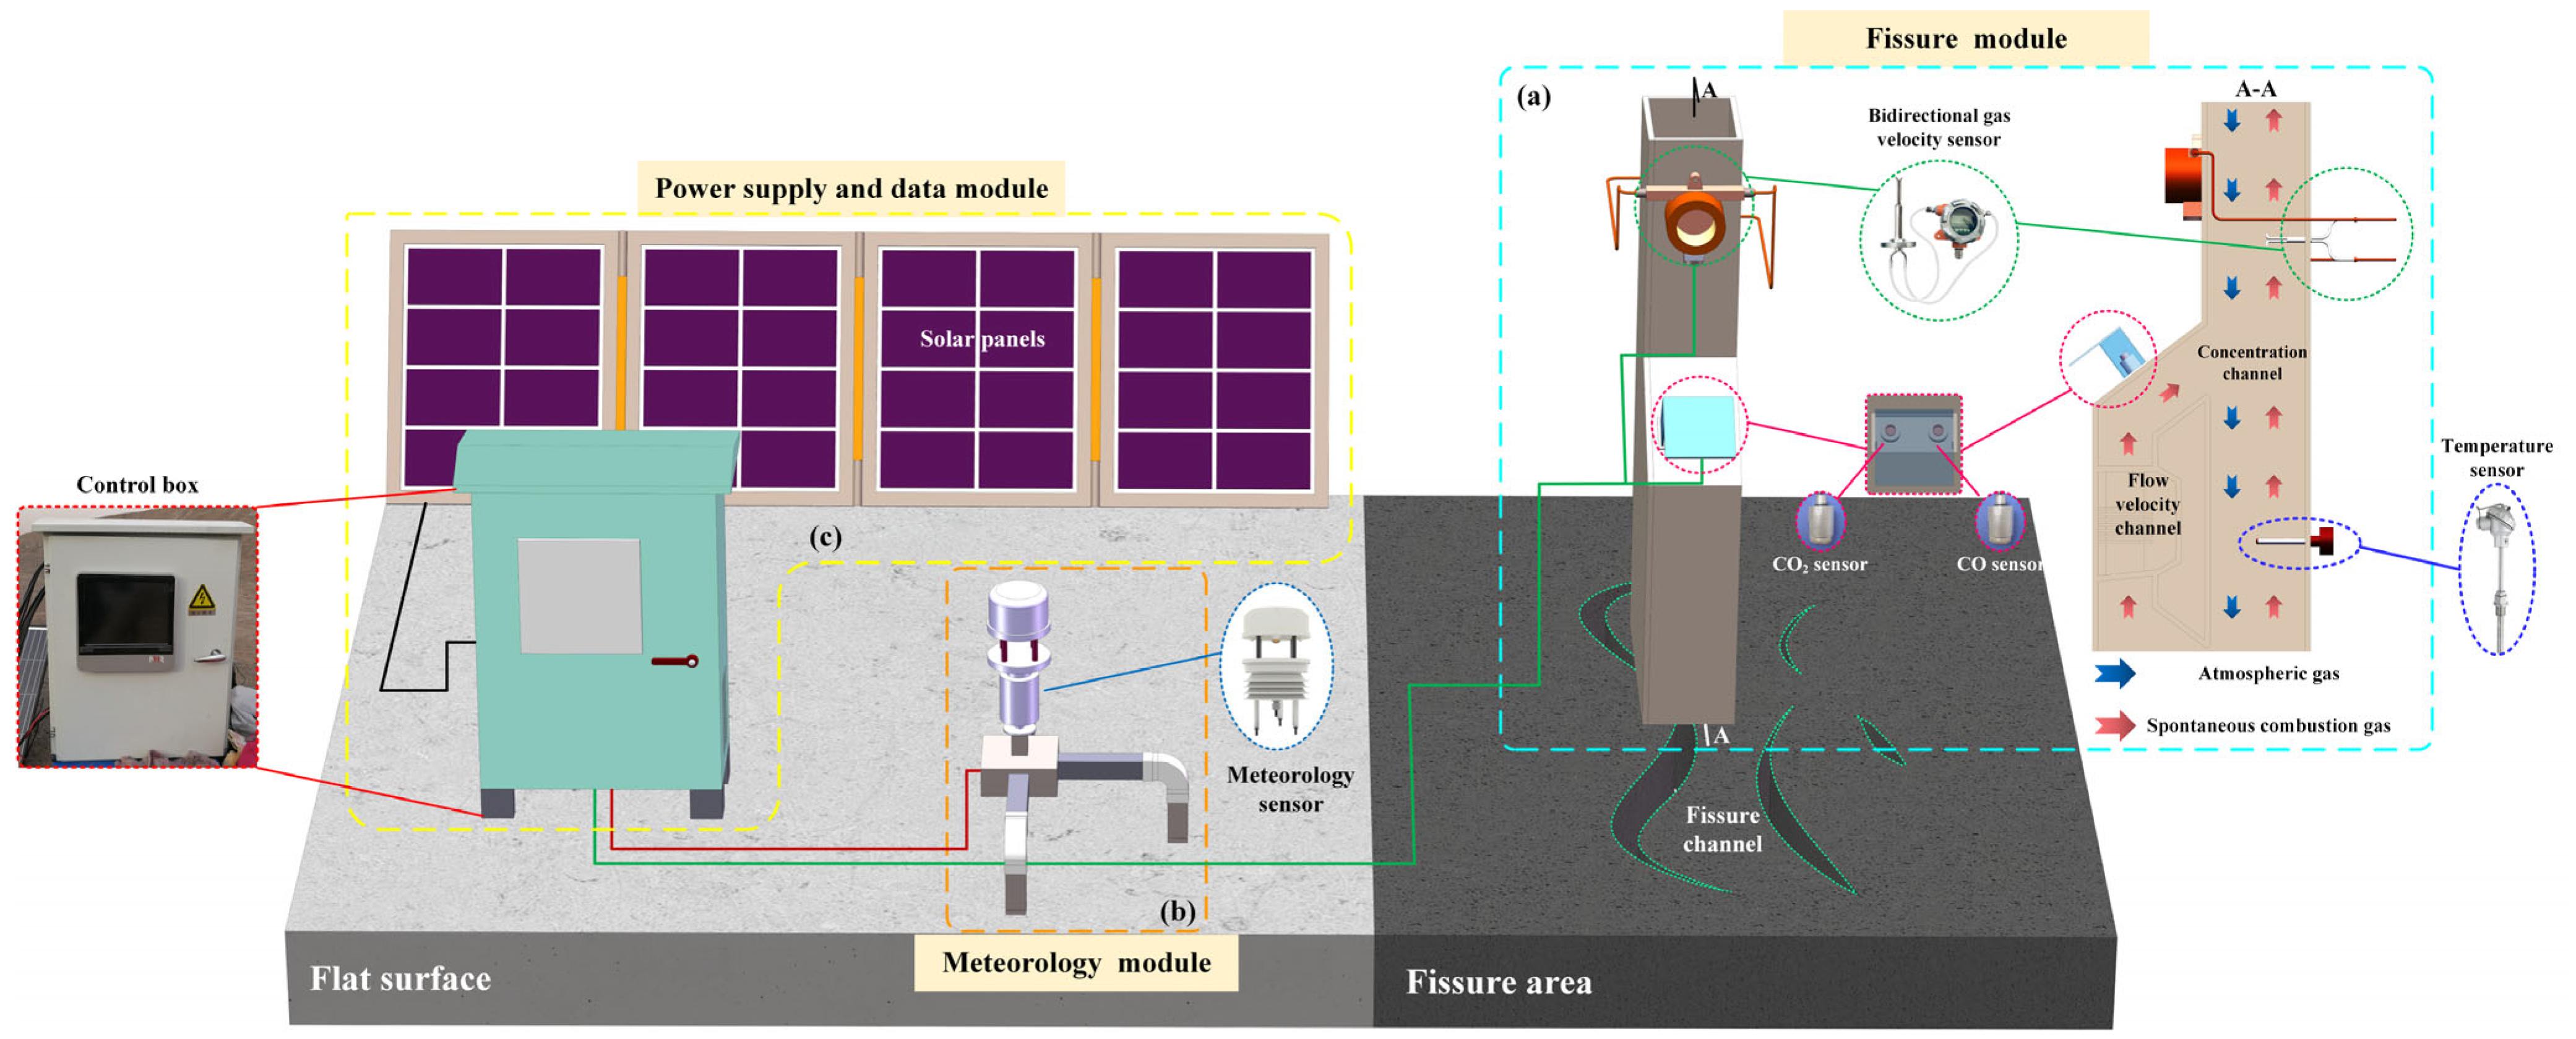
According to the structural characteristics of the fissure channel in the re-burning coal fire area, a relatively simple and convenient system that can continuously monitor day and night is proposed. The system is divided into three parts: fissure module, meteorological module, power supply and data module, as shown in Figure 2.
The overall shape of the fissure module is similar to a “vertical chimney,” divided into two parts: the flow velocity channel and the concentration channel. When the flue gas in the fissure channel emerges, the flue gas diffuses into the atmospheric space through the flow velocity and concentration channels, respectively. At this time, the monitoring data of the bidirectional gas flow velocity sensor are positive numbers. When the gas in the atmospheric space is affected by meteorological factors, part of the gas will be backfilled into the fissure channel through the flow velocity channel. At this time, the monitoring data of the two-way gas flow velocity sensor are negative. The concentration channel has a cooling structure to prevent the high-temperature gas from causing damage to the sensor. The main function of fissure module is to monitor the temperature, flow rate, and concentration of spontaneous combustion gas in the fissure channel. The main function of the meteorological module is to monitor the daily variation characteristics of meteorological factors (atmospheric temperature, relative humidity, air pressure, and wind speed). The power supply and data module can provide 24 V power support for each module sensor, to ensure the normal operation of the system modules, and to store the data monitored by the sensors. Therefore, the system and device proposed in this paper have the following advantages compared with existing systems and devices: (1) Powered by solar panels, the monitoring time and duration can be preset, effectively alleviating the continuous monitoring problem caused by the insufficient power supply of the system, and realizing 24-h automatic monitoring. (2) Using the principle of module design, it is divided into multiple modules, which can be easily disassembled, replaced, and have modules of similar types added, which is convenient for the overall packaging, transportation, and installation of the system. (3) The parameters monitored by the system are various, which can realize the online synchronous coupling of the spontaneous combustion gas, meteorological factors, and thermophysical properties of fissure channels. The system had a total of five sensors, whose details are provided in Table 1.

2.3. System Arrangement

According to the results of the on-site investigation, the monitoring system was arranged as follows.
(1) Selection of the arrangement point
Within the study area, a thermal imaging camera (Fortric220s, Shanghai, China) was used to observe the temperature of surface fissures. Fissure channels with high temperature and flue gas were selected as study points.
(2) System arrangement
The parts of each power supply and data module, fissure module, and meteorological module are formed to form a whole module. Each module is placed in the corresponding position. First, the fissure module is placed above the fissure channel. The specific steps are: Use the surface where the temperature sensor of the fissure module is located as the direction surface. Observe the trend of the research point of the fissure channel so that the direction plane of the fissure module is parallel to the trend of the fissure channel. Place the flow velocity channel of the fissure module directly above the position where the flue gas emerges from the fissure channel to ensure that the flue gas is located in the center of the flow velocity channel. The concentration channel is located just above the remaining part of the fissure channel along the strike of the fissure channel. Second, taking the fissure channel as the starting point, and at intervals of 5 m and 10 m to the west, respectively, place the meteorological module and the power supply and data module on the flat surface. Finally, unfold the solar panel and face the sun, and use wires to connect the power supply and data module, the fissure module, and the meteorological module to form the whole system.
(3) Sensor calibration
The power supply and data module switch were turned on, providing 24 V power supply for the system sensor, and the sensors of the system were calibrated. This ensured that the sensors operated appropriately and that the monitoring error was within a reasonable range.
(4) Data monitoring
To ensure the normal operation of various sensors, the system was run for 5 min, and we checked whether the data displayed by the power supply and data module met the monitoring requirements. After the monitoring conditions were met, the data-reading and data-saving intervals were set to 1 min each.
(5) Record keeping
To further ensure the normal operation of various sensors, the observation time was considered as 6 h to check the system to prevent monitoring suspension and sensor damage, and another 6 h to ensure the continuity of data.

2.4. Data Pre-Processing and Analysis

(1) Data pre-processing
The data obtained from system monitoring were pre-processed to improve their validity. First, missing (null) and abnormal values in the system-monitoring data were selected for rejection or supplementation. Second, the average data every 15 min were obtained using the arithmetic averaging method based on the data of every min. Finally, the data obtained from different modules were aggregated in chronological order to form a complete system-monitoring dataset.
(2) Discrete wavelet transform (DWT)
The discrete wavelet decomposition method can use Equation (4) to decompose the time series signal into high-frequency and low-frequency parts [31]. The high-frequency signal can effectively reflect the mutation characteristics of the signal sequence. The low-frequency signal can effectively reflect the trend of the signal. The low-frequency signals are gradually retained by removing the high-frequency signals with a continuous increase in the decomposition scale, which truly reflects the overall changes of the time series.
s ( n ) = j k c j k Ψ ( a 0 j n T k )
where s(n) represents the original time series, cjk is a set of wavelet coefficients, Ψ ( a 0 j n T k ) denotes the wavelet on jth scale shifted by k samples, a0 is a constant, and normally it takes the value of 2 (Dyadic wavelet).
(3) Pearson correlation analysis
The Pearson correlation coefficient method measures the degree of linear correlation between two variables, X and Y, with a value of between −1 and 1, denoted by r. The calculation result is 1, indicating that X and Y are positively correlated. If the parameters are entirely negatively correlated, the calculation result is −1. The larger the absolute value of r, the stronger the correlation. It is generally considered that |r| > 0.6 is a strong correlation. Calculated as follows:
r = i 1 n ( x i x ¯ ) ( y i y ¯ ) i = 1 n ( x i x ¯ ) 2 i = 1 n ( y i y ¯ ) 2
where r is the Pearson correlation coefficient, X and Y are the data aggregations of variables and dependent variables, and n is the number of variables.
(4) Generalized principal component analysis (GPCA)
GPCA is a method for reducing the dimensionality of data while preserving information about the data’s most significant contributions to the variance. This method mainly constructs the index panel data divided according to the time series by combining principal component analysis and time series, and extracts the main feature components of the data through a linear transformation [32,33].
(1) Establish a time series stereo dataset and standardization.
Suppose that n sample points are counted and that each sample point has the same m index variables. In that case, the original data table is denoted as X = (Xij)n×m. Therefore, in the t time range, there are t time series stereo data tables, a Tn×m matrix is formed according to the time sequence, and this matrix is defined as a global data table, denoted as X = (Xij)Tn×m. The Z-Score method is used for global standardization. The standardized matrix Z = (Zij)Tn×m is obtained to eliminate the dimension’s influence. The specific steps are shown in Equations (3)–(7).
X = ( x T 1 1 x T 1 2 x T 1 m x T 2 1 x T 2 2 x T 2 m x T n 1 x T n 2 x T n m )
Z i j = x i j x ¯ j D ( x j ) , ( i = T 1 , T 2 , T n ; j = 1 , 2 , , m )
x ¯ j = i = 1 n x i j n
D ( x j ) = i = 1 n ( x i j x ¯ j ) 2 n 1
The normalized mean of the variable is 0, and the variance is 1. The normalized matrix is shown in Equation (4).
Z = ( Z i j ) T n × m = ( Z 1 , Z 2 , , Z m )
(2) Calculate the eigenvalues and eigenvectors of the correlation coefficient matrix.
The eigenvector linear transformation coefficients correspond to the correlation coefficient matrix. The eigenvalues are the variances of the principal components. The contribution rate of variance decreases with the order of eigenvalues. The correlation matrix R of Z is established as:
R = ( r 11 r 12 r 1 m r 21 r 22 r 2 m r m 1 r m 2 r m m )
r i j = cov ( Z i , Z j ) D X i D X j ( i , j = 1 , 2 , , m )
The eigenvalue λi is obtained by |λER| = 0, and then the obtained λi are sorted in the order of magnitude λ1λ2λ3 ≥ … ≥ λm ≥ 0. The eigenvector ai is obtained by (λERZ = 0.
Then, the principal component Fi is shown in Equation (10).
F i = a 1 i Z 1 + a 2 i Z 2 + + a m i Z m ( i = 1 , 2 , , m )
The contribution rate of the principal component is shown in Equation (11).
n i = λ i / k = 1 m λ k ( i = 1 , 2 , , m )
The cumulative contribution rate of the main components in the future is shown in Equation (12).
M e = i = 1 e λ i k = 1 p λ k ( e < p )
Generally, the cumulative contribution rates Me ≥ 75% of the e principal components ahead are selected.

3. Result Analysis

3.1. Emission Characteristics of Spontaneous Combustion Gas

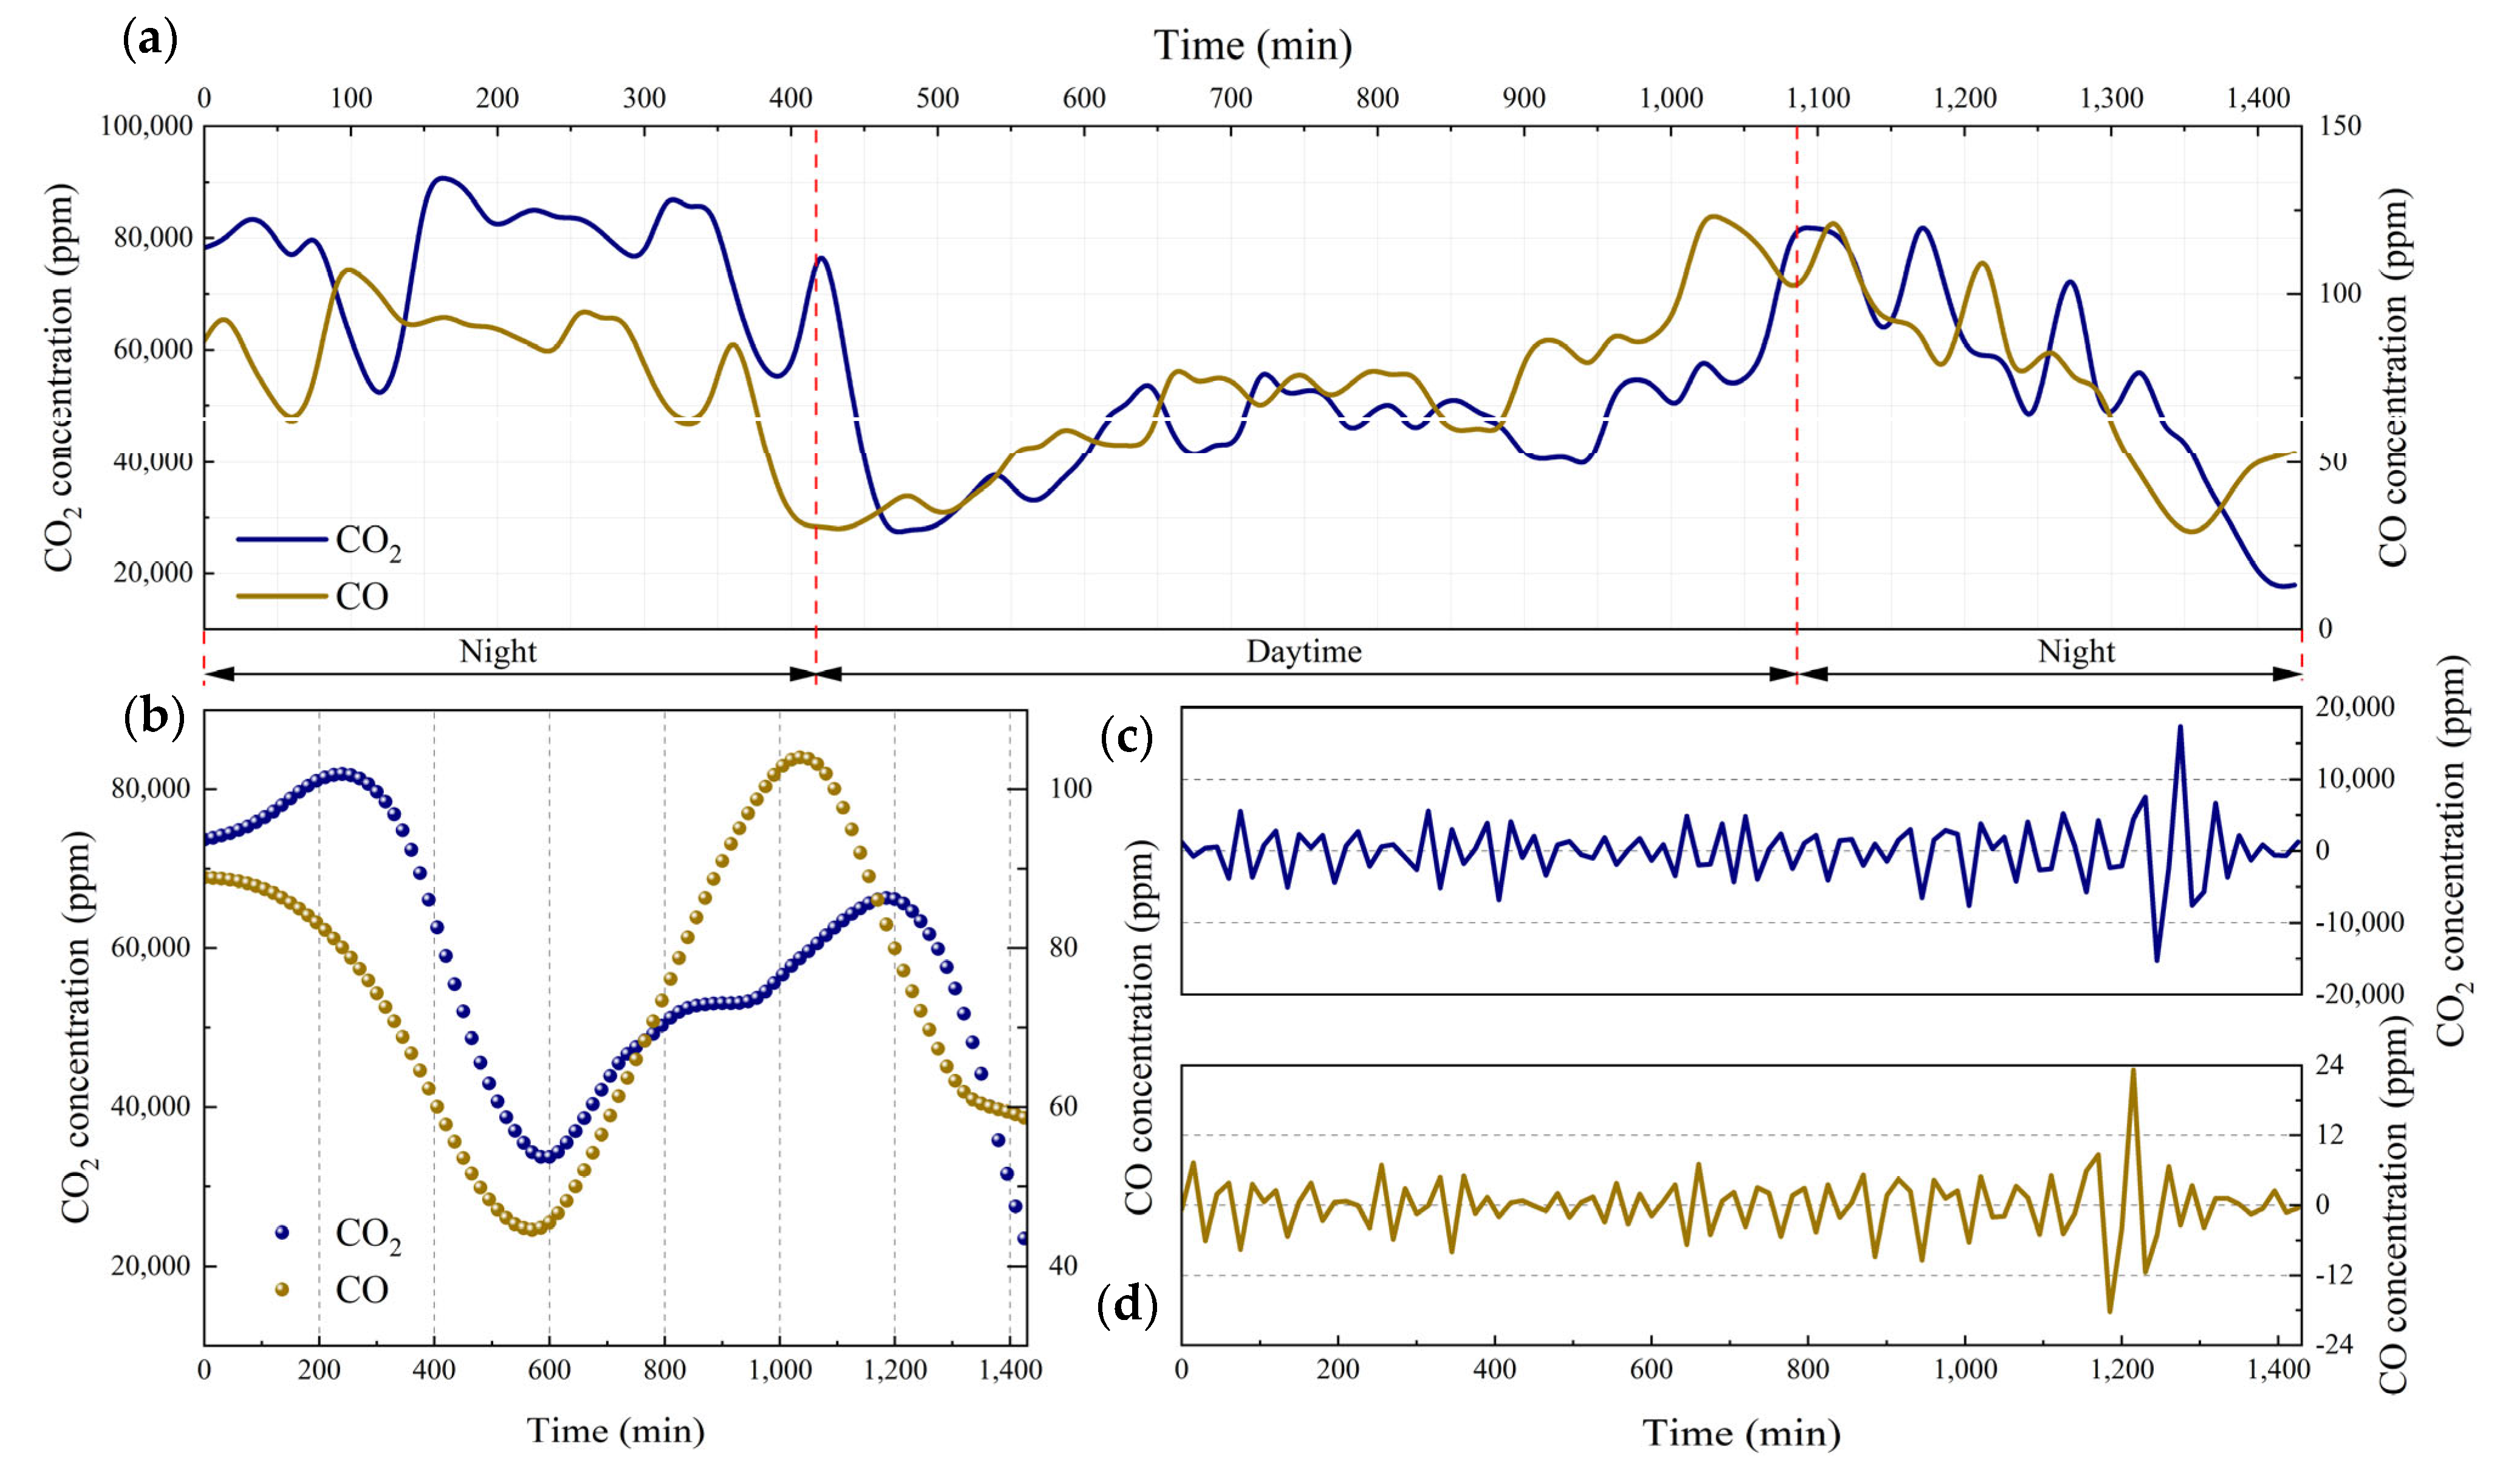
Discrete wavelet transform was used to analyze the characteristics of spontaneous combustion gas emission in fissure channels. Select the db wavelet function as the wavelet basis function. When the rank scale is set to 6 and the decomposition scale is set to 4, this method can effectively extract the trend and residual features of the combustion gases (CO2 and CO) [34]. The analysis results are shown in Figure 3 and Figure 4.
The actual situation of on-site monitoring shows that within 0–420 min and 1080–1425 min, it belongs to the state of darkness and no sunlight. Within 420–1080 min, it belongs to the daytime state, and there is direct sunlight.
Figure 3 is a comprehensive graph of the time-series curve change characteristics of spontaneous combustion gas (CO2 and CO) emissions at research point 1#. The research point 1# fissure channel is linear. Figure 3a shows that the time series curves of CO2 and CO concentrations have the same change rule in the same time interval. Figure 3b shows that the trend characteristics of CO2 and CO concentrations in the linear fissure channel increase first, then decrease, then increase and fall again. The CO2 and CO concentration changes showed a downward trend in the dark time interval without light. The CO2 and CO concentration changes showed an upward trend during the daytime interval with light. It showed that the lighting conditions influenced the emission of spontaneous combustion gas in the linear fissure channel. Figure 3c,d show the residual characteristics of CO2 and CO concentrations in the linear fissure channel (i.e., the increase and decrease in intensity characteristics), respectively. During 0–400 min and 600–1425 min, the CO2 and CO concentration high-frequency eigenvalues fluctuated strongly. Especially around 1200 min, the fluctuation changes were the strongest. During 400–600 min, the CO2 and CO concentration high-frequency eigenvalues changed gently.
Figure 4 is a comprehensive graph of the time-series curve change characteristics of spontaneous combustion gas (CO2 and CO) emissions at research point 2#. The fissure channel shape of research point 2# is a round hole. Figure 4a shows that the time series curves of CO2 and CO concentrations have the same variation law in the same time interval. Figure 4b shows that the trend characteristics of CO2 and CO concentrations in the round hole fissure channel were first decreased and then increased, and then they fell and then rose again. During the transition from no light to light and from night to day, the CO2 and CO concentrations changes all showed a downward trend. During the illumination, the changes in CO2 and CO concentrations showed a trend of rising first and then falling. During the transition from light to no light and from day to night, the CO2 and CO concentrations changes all showed an upward trend. This shows that light conditions also influence the gas emission of the round hole fissure channel. Figure 4c,d show that the high-frequency eigenvalues of CO2 and CO concentrations fluctuated strongly within the ranges of 0–400 min and 600–1425 min. Especially around 1200 min, the fluctuation changes are the strongest. During 400–600 min, the CO2 and CO concentration high-frequency eigenvalues changed gently.
To sum up, CO2 has a time lag compared to the CO concentration change. The reason for this is that the monitoring principles of CO2 sensors (infrared principle) and CO sensors (electrochemical principle) are different. The CO sensor is more sensitive to the gas concentration. The CO2 concentration is always higher than the CO concentration in spontaneous combustion gas emissions from fissure channels with different shapes. The CO2 and CO concentration high-frequency eigenvalues fluctuated strongly, indicating that there was a coal seam burning at the bottom of the fissure channel, and the spontaneous combustion gas emission process was affected by other factors (such as meteorological factors).
In addition, the light conditions significantly affect the round hole channel more than the linear fissure channel. During the transition period from no light to light, and from night to day, the change rules of the CO2 and CO concentrations in the linear fissure channel and the round hole fissure channel are similar. During the transition from light to no light, and from day to night, the changes in the high-frequency eigenvalues of CO2 and CO concentrations in linear fissure channels decreased. In contrast, those in round hole fissure channels increased, and there were apparent differences between the two. The reason for this may be that exposure to light affects the change in surface temperature. The surface temperature gradually decreases during the transition from light to no light and from day to night. Due to the small pore structure and the poor permeability of the linear fissure channel, the temperature dissipation capability is weaker than that of the round hole fissure channel, resulting in a more significant obstacle to the emission of spontaneous combustion gases.

3.2. Variation Characteristics of Meteorological Factors

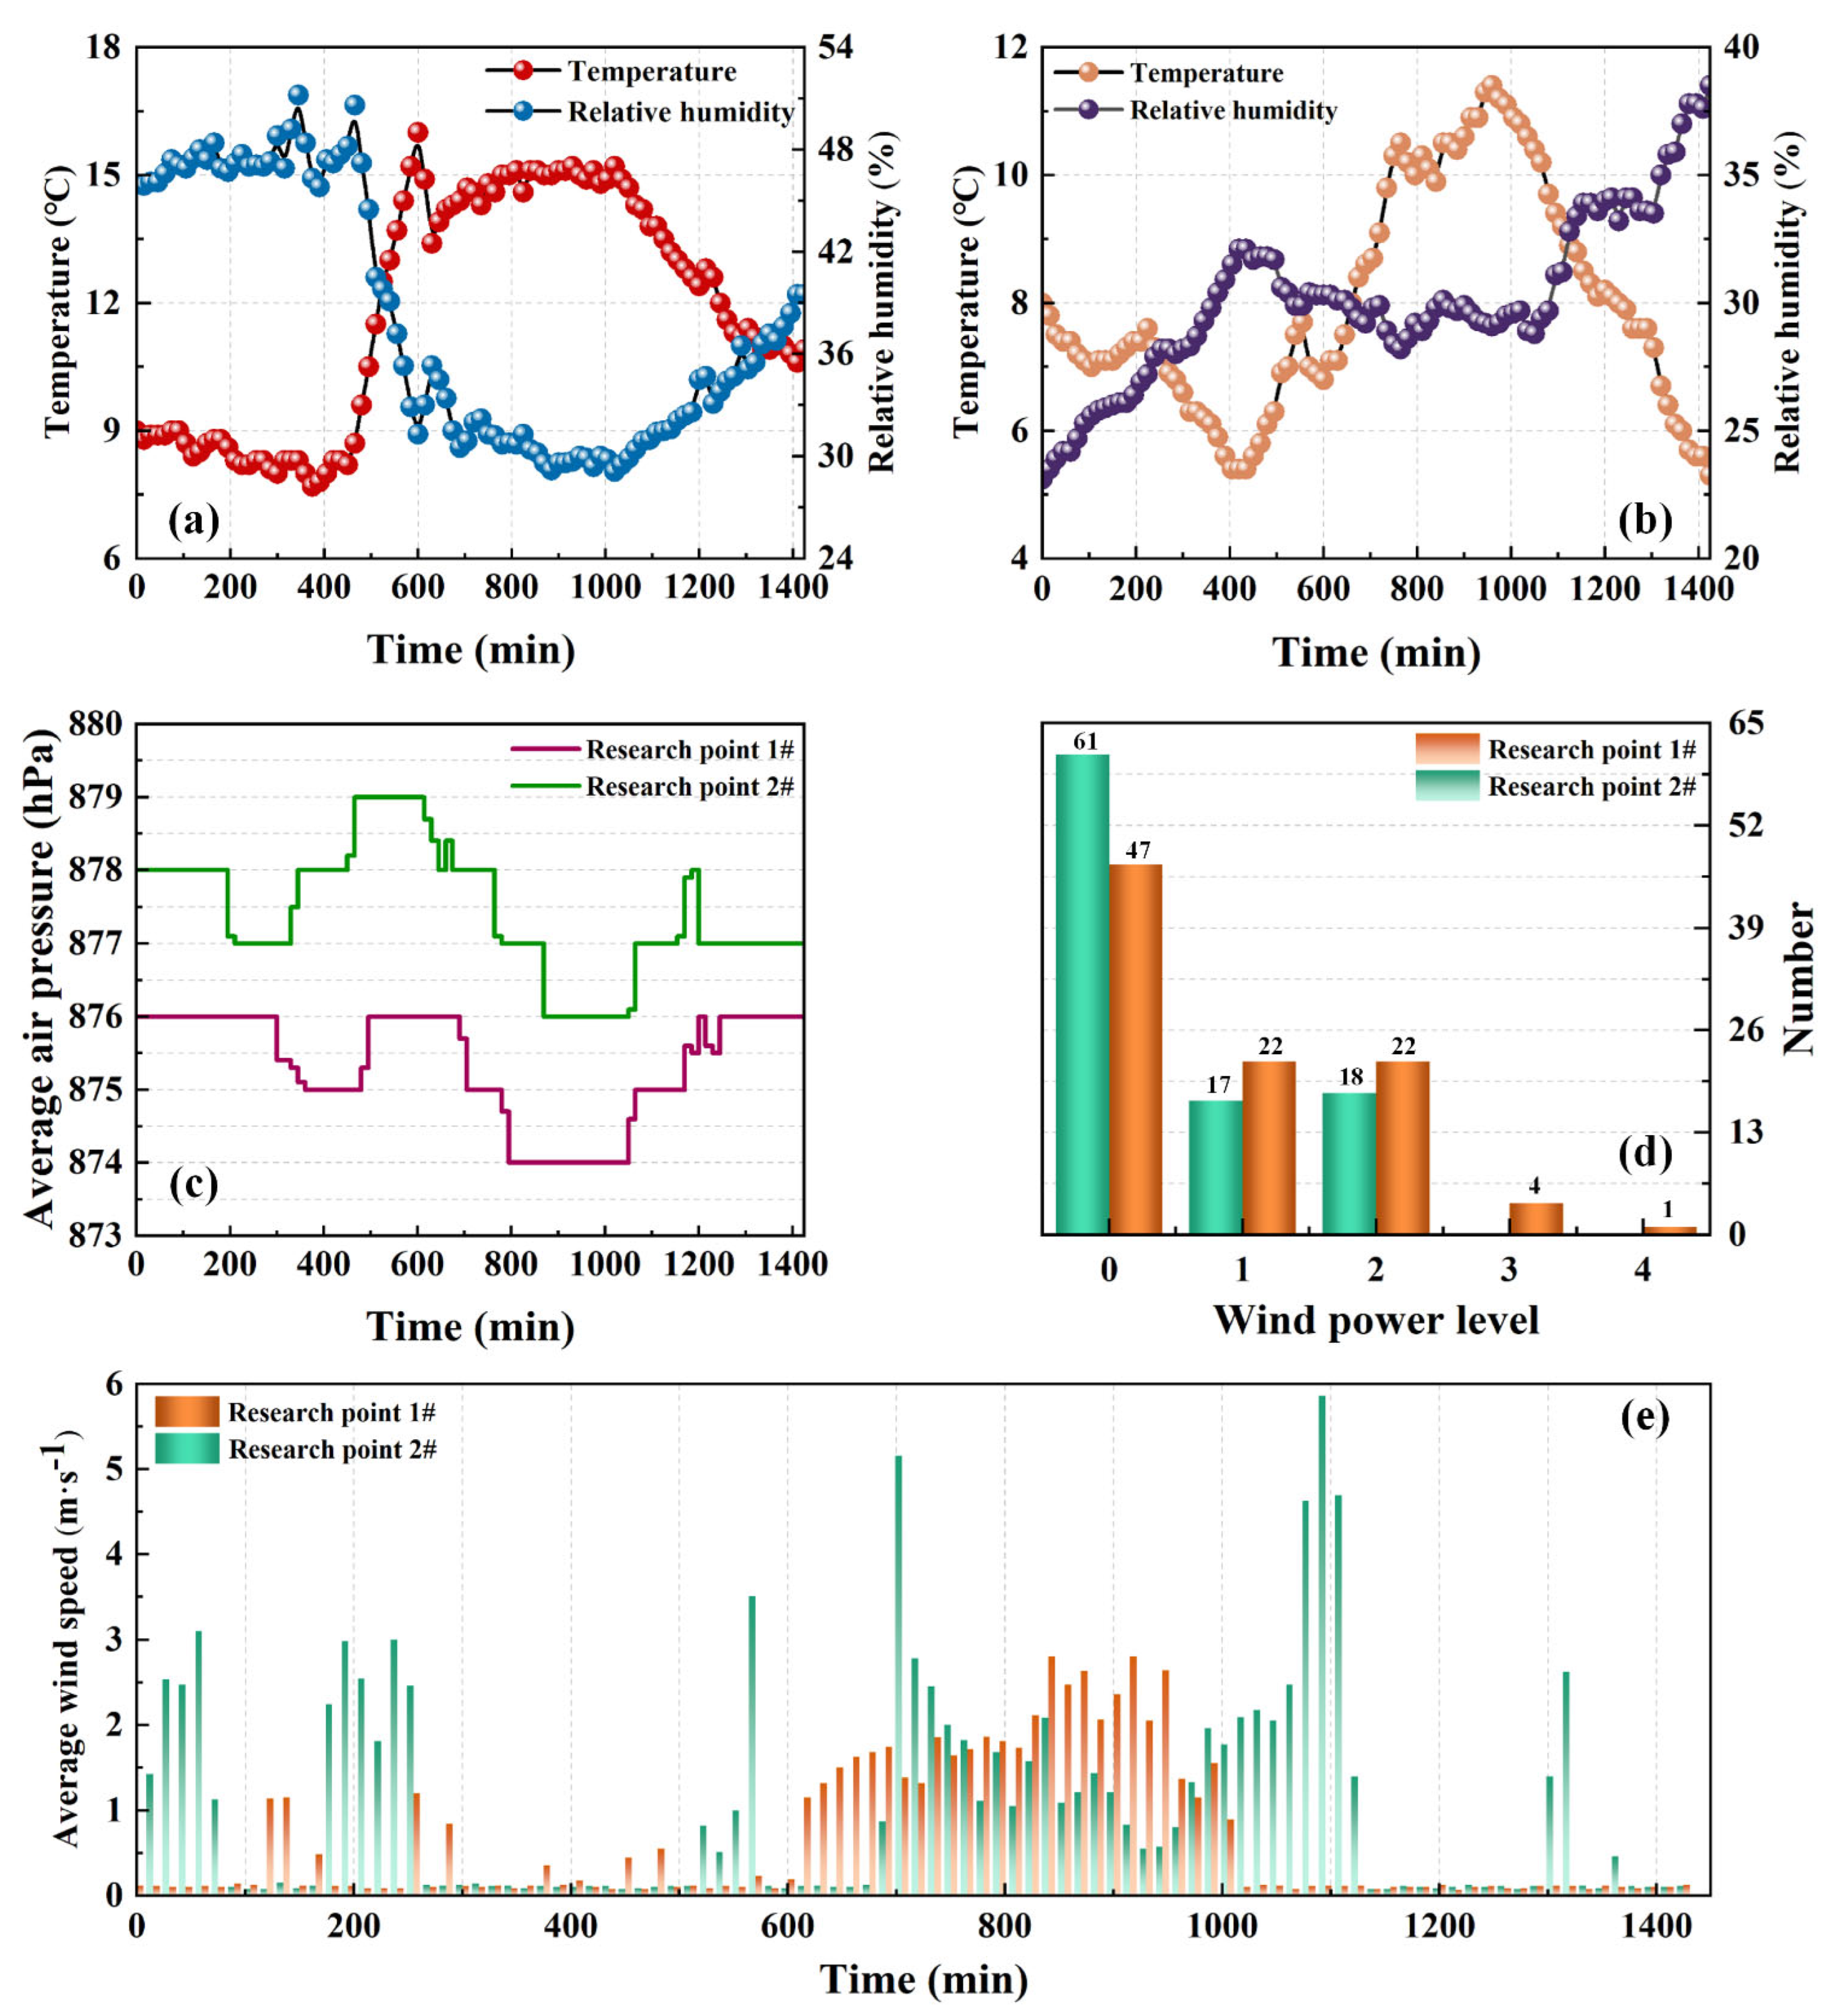
Figure 5 is the time characteristic diagram of meteorological factors monitored at research points 1# and 2#. According to Figure 5a,b, the change trends of the time characteristic curves of temperature and humidity are opposite to each other, and they both show an “S-shaped” change. The changing trend of temperature is a process of first decreasing, then increasing, and then decreasing, while humidity is a process of first rising, then falling, and then growing. Affected by sunlight, the temperature during the day is always higher than at night, and the humidity shows the opposite trend. However, during monitoring at research point 2#, the sunlight disappeared after 1080 min, and foggy weather gradually appeared, resulting in the humidity increasing and reaching the maximum value for one day after 1080 min.
Figure 5c represents the atmospheric pressure variation characteristics of research points 1# and 2#. Because the topographical altitude of research point 1# is higher than that of research point 2#, the pressure variation range between the two points is different, and the primary change trend is a gradient variation. The pressure variation range of research point 1# was maintained at 873 hPa–876 hPa. The pressure variation range of research point 2# was kept at 876 hPa–879 hPa. The air pressure of research sites 1# and 2# both decreased significantly during the daytime with light.
Figure 5d,e represent the number of wind grades and the time-varying characteristics of wind speed at research points 1# and 2#, respectively. As shown in Figure 5d, during the monitoring time, there are level 3–4 winds at research point 1#, and there are many time points with the no wind state (level 0 wind) at research point 2#. The wind speed at the research site is mainly 1 and 2 winds. Combined with Figure 5e, there is a certain randomness in the wind speed variation. The wind speed changes more sharply during the daytime interval, when there is light. The maximum wind speed of research point 1# is 5.9 m/s, and the maximum wind speed of research point 2# is 2.8 m/s.

3.3. Variations in Thermophysical Characteristics of the Fissure

The thermophysical characteristics of the fissure channel are divided into the fissure temperature and the flow rate of gas in and out. The change of velocity for gas in and out can effectively reflect the condition of spontaneous combustion gas emission (i.e., the “breathing” phenomenon), as shown in Figure 6.
As shown in Figure 6, at 210 min, the gas inflow and outflow phenomenon occurred for the first time at research point 1#. During the whole monitoring time, a total of 40 time points at study point 1# belonged to the outgassing stage (v < 0), 39 time points belonged to the intake stage (v > 0), and 17 time points belonged to the equilibrium stage (v = 0). At 765 min, gas inflow and outflow change occurred for the first time at research point 2#. Over the entire monitoring interval, a total of 31 time points at research point 2# belonged to the intake phase (v > 0), and 65 time points belonged to the exhaust phase (v < 0).
There is a certain relationship between the fissure temperature and the light intensity. The variation trend of fissure temperature at research points 1# and 2# is consistent. During 0–420 min, the fissure temperature gradually decreased but remained higher than the ambient temperature due to lack of sunlight exposure. Under the influence of light at 420 min, the fissure temperature began to rise gradually. Within 870–900 min, the fissure temperature at different fracture channel positions reached the maximum value. During 900–1425 min, the illumination gradually weakened to disappear, and the fissure temperature also gradually decreased to the minimum value.
To sum up, the main reason for the phenomenon of gas in and out at the research point is the difference between the external air pressure and the fissure channel pressure. Considering the influence of the fissure temperature, when the fracture temperature increases, the fissure channel pressure increases. The external air pressure is less than the fissure channel pressure at this time, which belongs to the intake stage. When the temperature of the fissure decreases, the pressure of the fissure channel decreases. At this time, the external air pressure is greater than the pressure of the fissure channel, which belongs to the gas outlet stage. In addition, the frequency of gas in and out gas at research point 1# is higher than that at research point 2#, and the fissure temperature is higher than that at research point 2#. Therefore, it is preliminarily analyzed that the combustion degree of the coal seam at the bottom of research point 1# is greater than that of research point 2#.

4. Discussion

4.1. Correlation ansalysis

The Pearson linear correlation matrix describes and quantitatively explores the relationship between spontaneous combustion gas, and meteorological factors and fissure thermophysical characteristics. The results are shown in Figure 7.
As shown in Figure 7, there is a significant negative correlation between CO2 and CO concentration in the spontaneous combustion gas, and the correlation coefficient is −0.59.
The fissure thermophysical characteristics show a significant negative correlation between the fissure temperature (FT) and the bidirectional gas flow rate (BG), and the correlation coefficient is −0.63. There was a significant positive correlation between FT and CO2 concentration with a correlation coefficient of 0.57, and a significant negative correlation with CO concentration, with a correlation coefficient of −0.55. The increased FT makes the fissure channel discharge more CO2, and the CO2 is relatively reduced. There is a negative correlation between BG and CO2 concentration, and a positive correlation with CO concentration.
Among the meteorological factors, according to the numerical value of the correlation coefficient with CO2 and CO, the order is pressure (P), relative humidity (RH), temperature (T), and wind speed (W). T, RH, and P all showed a positive correlation with CO2 concentration, and a negative correlation with CO concentration. However, there is a negative correlation between W and CO2 concentration, and a positive correlation with CO concentration. The correlation coefficients between W and CO2 and CO concentrations were −0.26 and 0.12, respectively, which is far smaller than the correlation coefficients between other meteorological factors and CO2 and CO. Therefore, when other meteorological factors change significantly, the effect of W on CO2 and CO emissions is minor, indicating that W is not the main factor affecting spontaneous combustion gas emissions.

4.2. Coal Seam Re-Burning Status Assessment

(1) Combustion efficiency
CE describes the intrinsic properties of combustion and is used to quantitatively analyze two types of coal seam combustion and smoldering at the bottom of fractured channels [35]. Assuming that the volume fraction of carbon used in coal seam combustion is completely converted to CO2, the gas products are mainly CO2, CO, and CH4. The calculation formula is shown in Equation (13).
C E = Δ C C O 2 Δ C C O 2 + Δ C C O + Δ C C H 4
where Δ is the difference between the emission measurement and the background value.
The gas detector (SKY6000-M2, Guangdong, China) was used in this area to obtain a CO2 background value of about 431 ppm, and a CO background value of about 20.7 ppm.
However, in the actual exploration process, the concentrations of CO2 and CO at research point 1# and 2# are much higher than CH4. Therefore, only considering CO2 and CO as the total amount of carbon emissions, CE is simplified to MCE [1]. The calculation formula is shown in Equation (14).
M C E = Δ C C O 2 Δ C C O 2 + Δ C C O
MCE refers to the completeness of coal seam combustion. According to the monitoring of spontaneous combustion gas in the fissure channel, the MCEs of different fissure channels at different times are obtained. The η-squared mean of each hour of MCE was used as the discriminant indicator.
(2) CO2/CO ratio
Combined with the analysis in Figure 7, meteorological factors influence the concentration of spontaneous combustion gases (CO2 and CO). Using a single indicator gas (such as CO), it is difficult to judge the re-burning state of the coal seam at the bottom of the fissure channel. The CO2/CO ratio is not affected by meteorological factors. It is an excellent tool for evaluating the re-burning state of the coal seam [36]. Therefore, the CO2/CO ratio is used to judge the status of coal seam re-ignition, reducing the influence of meteorological factors on spontaneous combustion gas emissions.
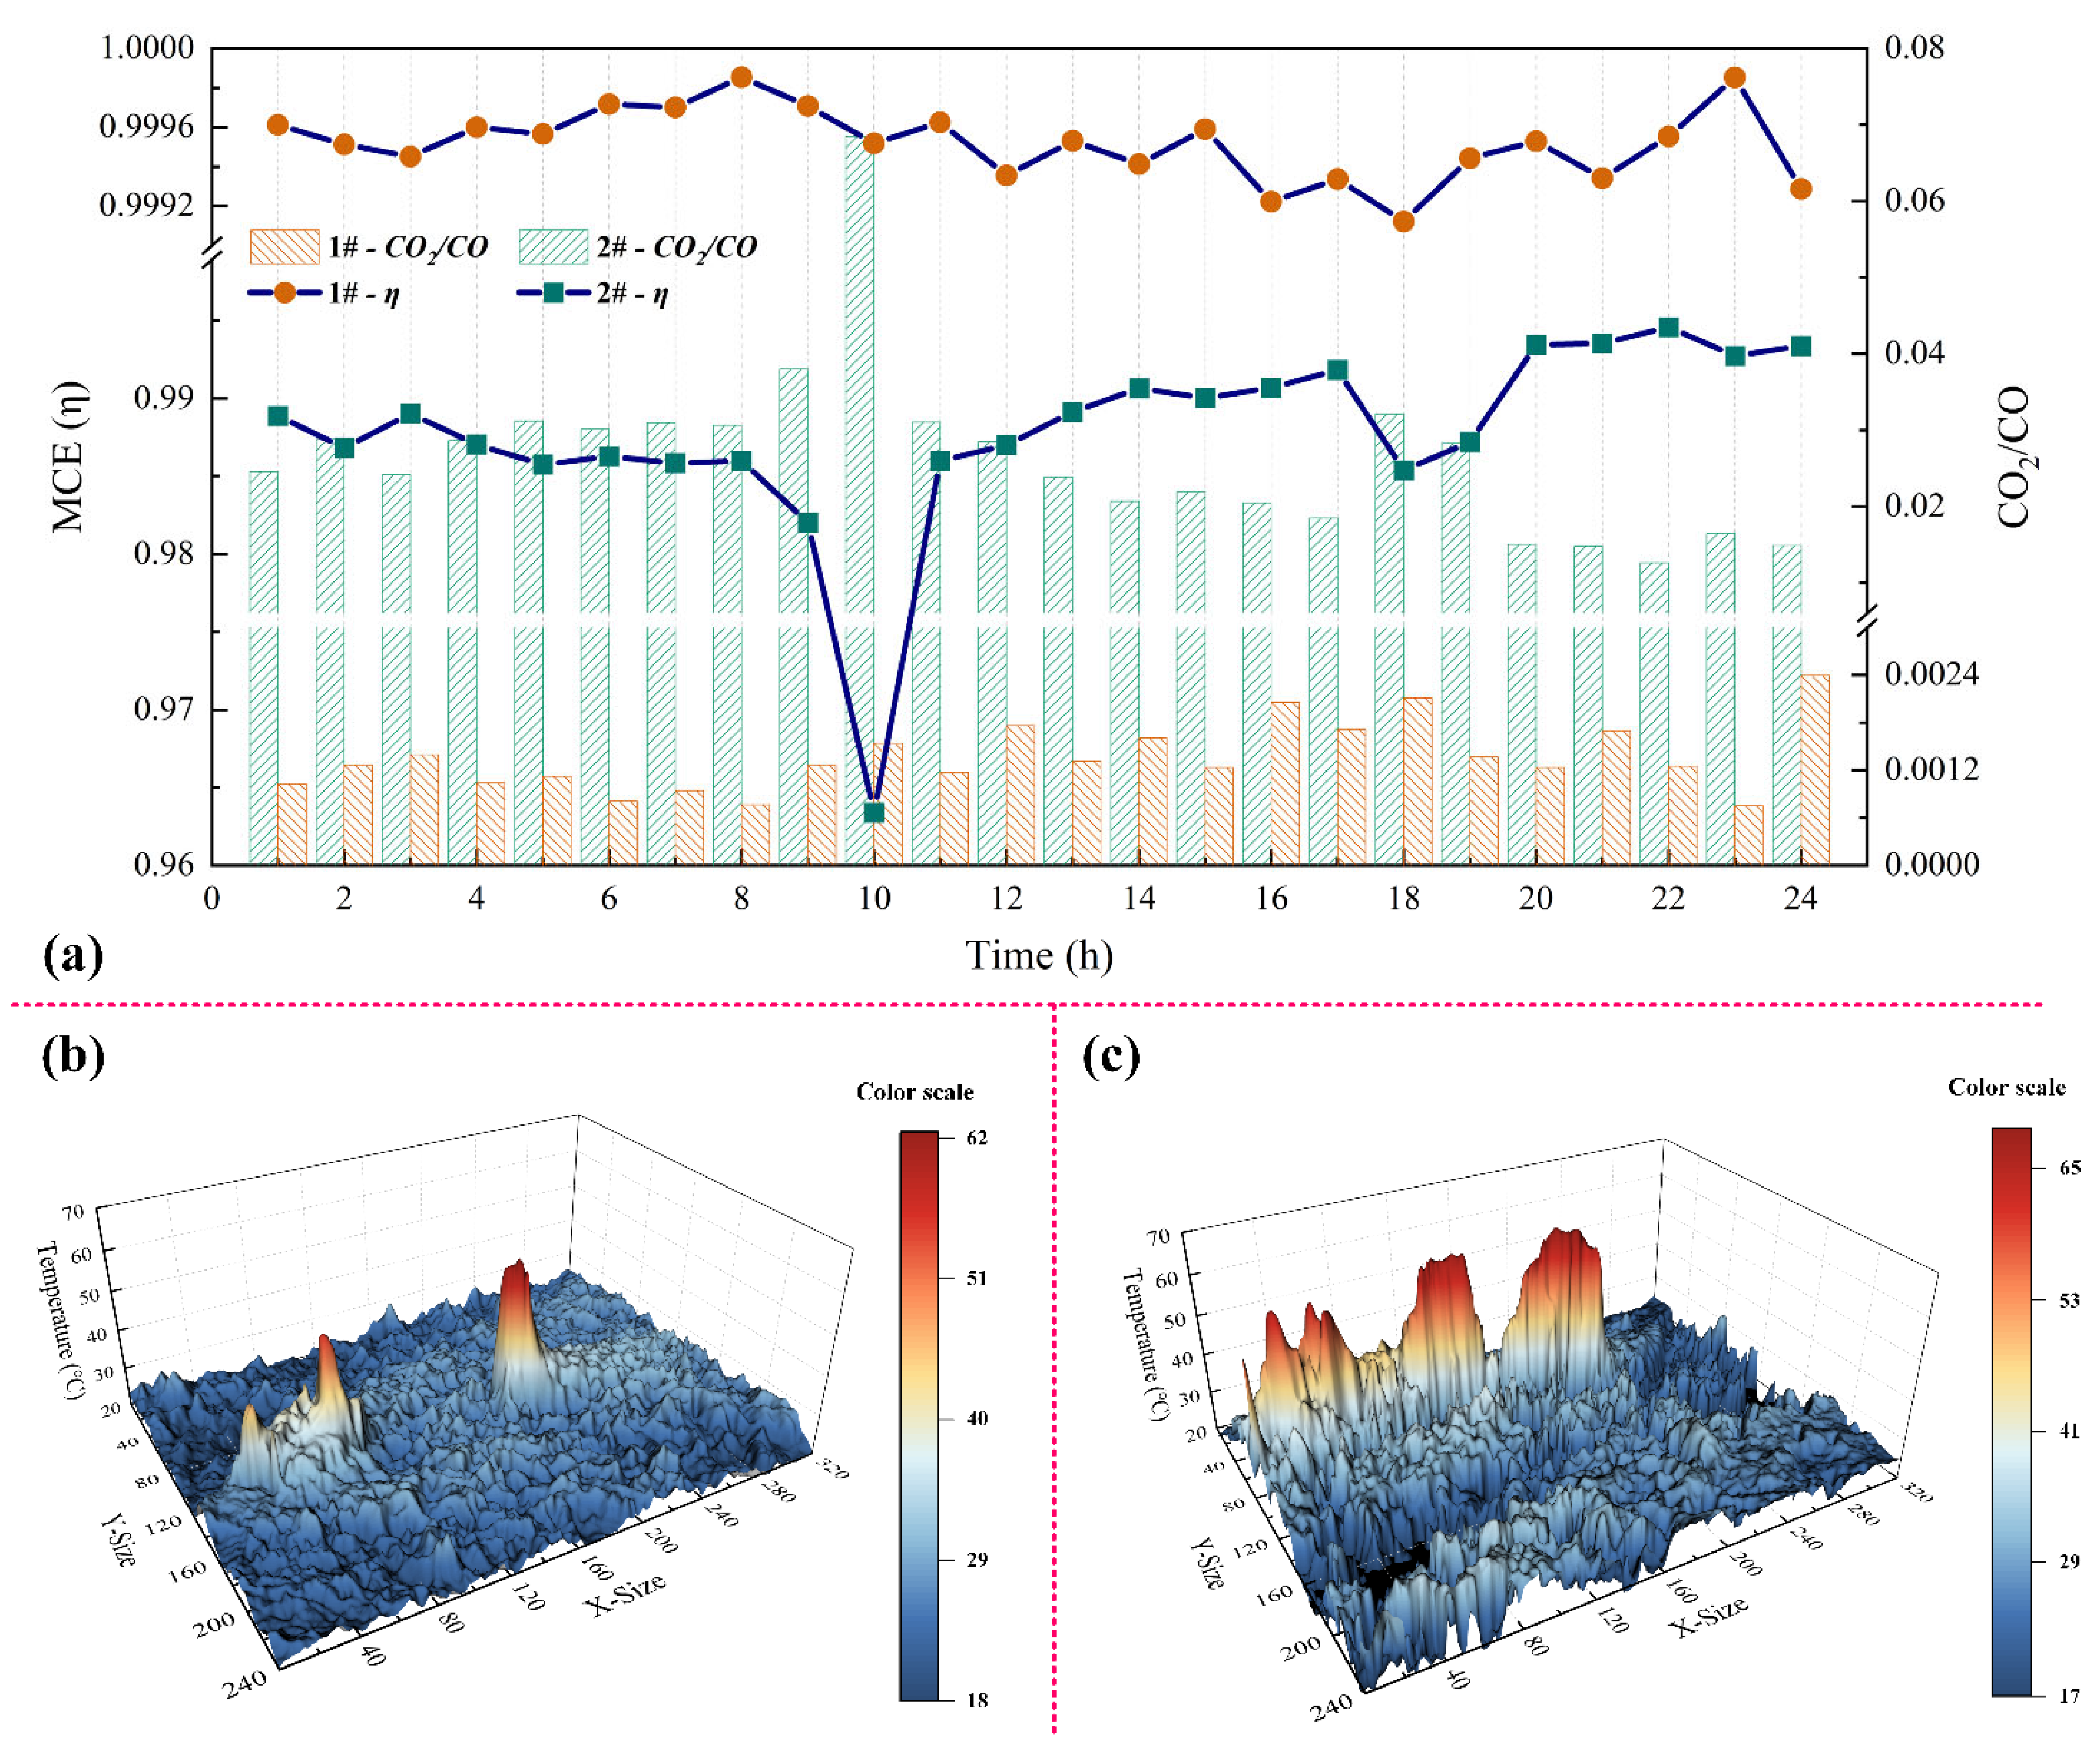
Figure 8 shows the analysis diagram of the coal seam combustion condition at the bottom of the fissure channel. As shown in Figure 8a, the η values of the fissure channels at research points 1# and 2# are both above 0.9. Therefore, it is estimated that the combustion stage of the coal seam at the bottom of the fissure channel at the research points 1# and 2# belongs to the flammable combustion stage (that is, the combustion is intense) [34], rather than the smoldering combustion stage. Further analysis was carried out using the ratio of CO2/CO [22]. The combustion degree of the coal seam at the bottom of the fracture channel at research point 1# is more significant than that at research point 2#. With time, the CO2/CO ratio of the research point 1# fissure channel changes with periodic fluctuations. The change of the CO2/CO ratio of the research point 2# fissure channel showed a decreasing trend. It shows that the combustion stage of research point 2# is earlier than that of research point 1#. Finally, combined with the thermal imaging temperature information shown in Figure 8b,c, it is obtained that the temperature difference between the fissure channels of the research points 1# and 2# is slight. To sum up, the combustion degree of the coal seam at the bottom of the fissure channel of research point 1# is greater than that of research point 2#, and the degree of re-burning of the coal seam at research point 1# is greater than that of the research point 2#.

4.3. Estimated Carbon Emissions

(1) Carbon emissions model
With the continuous development of re-burning coal fire, under the combined action of pressure and buoyancy, the spontaneous combustion gas is finally discharged into the atmospheric space through the fissure channel. The primary transport mechanism of spontaneous combustion gases is convection and advective movement outward from surface fracture channels [37,38]. According to the geological characteristics of the study location and the size and number of fissure channels, the content of spontaneous combustion gases released by other emission routes is lower. Therefore, assuming that the diffusion gas emissions through the soil are ignored, the carbon emission model of the fissure channel is preliminarily established, and the lowest estimated value of the carbon emission of the fissure channel in the re-burning coal fire area is obtained. The calculation Equation (15) of the emission (E) of the spontaneous combustion gas discharged from the fracture channel is [39]:
E = D i A v
where E is the emission of spontaneous combustion gas. Di is the concentration of the spontaneous combustion gas component i in the fissure channel, as shown in Equation (16). v is the gas velocity perpendicular to the vent (here, the velocities of each gas component are assumed to be equal). A is the cross-sectional area of the fissure channel.
D i = i = 1 n M 1 C 1 + M 2 C 2 + + M n C n M 1 + M 2 + + M n
where C is the concentration of the spontaneous combustion gas component i. M is the relative molecular mass of the spontaneous combustion gas component i.
According to the results of previous studies [28], the combined actions of meteorological factors (W, T, RH, and P) and fissure thermophysical characteristics (FT and BG) change the concentration and flow rate of spontaneous combustion gas in the fissure channel. Therefore, Equation (15) can be rewritten as Equation (17):
E = D i A v t α
where t is time, h. α is a comprehensive factor, which is a dimensionless impact factor.
(2) Comprehensive factor α
Consider using the GPCA to determine the synthesis factor α. The data for the spontaneous combustion gas (CO2 and CO) concentration, meteorological factors, and fissure thermophysical characteristics of research sites 1# and 2# are summarized, and the calculation formula of the comprehensive factor α is obtained.
Before using GPCA, it is necessary to judge whether GPCA can determine the comprehensive factor α. Therefore, the KMO and Bartlett sphericity tests were performed on the data sets of research points 1# and 2#, KMO = 0.579 > 0.5, and the P value of Bartlett’s significance test (sig.) was lower than 0.01, indicating that each parameter data point belongs to one Normal distribution. An analysis can be performed using GPAC. Combined with the correlation between the parameters shown in Figure 8, a common factor variance table is obtained, as shown in Table 2.
Table 2 shows that, except W, the other extracted principal components have better explanations for the original variables (extraction rate > 0.7). Secondly, from the variance contribution rate among the components shown in Table 1, the variance eigenvalues of the first three principal components are all greater than 1, and the cumulative variance contribution rate exceeds 70%, which can meet the interpretation requirements (60–90%). Therefore, the first three principal components have the conditions to satisfy the extraction, and the Table 3 component matrix table is obtained.
However, the factor loading matrix Aij obtained using SPSS 22.0 is the loading matrix, not the coefficient matrix of the principal components Cij. Therefore, the coefficient matrix of each component is obtained using Equation (18), as shown in Table 2.
C i j = A i j λ i , i = 1 - 3 , j = 1 - 8
where λ is the initial eigenvalue. i is the number of extracted principal components. j is the number of independent variables.
It can be known from Table 2 that GPCA has extracted three principal components (PC1, PC2, and PC3). In PC1, the CO2, CO, and RH load coefficients are more significant, all being greater than 0.7. This shows that PC1 can better reflect the information of the three indicators, and it reflects the information of the spontaneous combustion emission products of the fissure channel, which is interpreted as the product factor. In PC2, the FT, BG, T, and P load coefficients are relatively large, all being approximately 0.6 and above. This shows that PC2 can better reflect the information of the four indicators, which reflects the intensity of spontaneous combustion product emissions in the fissure channel, which can be interpreted as a fluctuation factor. In PC3, the load factor of W is more than 0.6. This shows that PC3 can better reflect the information of this index, and reflects the random variation law of spontaneous combustion product emission in the fissure channel, which is interpreted as a random factor. The fluctuation factor (PC2) and the random factor (PC3) both highlight the influence of external factors on the emission of spontaneous combustion gas products.
The quantitative expression of the GPCA model is constructed through three principal components, and the expression of the comprehensive factor α is obtained as (19):
α = D i j Z [ x 1 , x 2 , x 3 , x 4 , x 5 , x 6 , x 7 , x 8 ] T
where Z[] is the data matrix set formed by each parameter after standardizing the original data.
Therefore, combined with the calculation formula of each principal component obtained from Table 3:
PC1:
F 1 = 0.208 x 1 0 .186 x 2 + 0.045 x 3 + 0.089 x 4 0.072 x 5 + 0.089 x 6 + 0.171 x 7 + 0.1 x 8
PC2:
F 2 = 0.022 x 1 + 0.016 x 2 + 0.222 x 3 0.181 x 4 + 0.081 x 5 + 0.173 x 6 0.114 x 7 + 0.145 x 8
PC3:
F 3 = 0.028 x 1 0.256 x 2 0.014 x 3 + 0.327 x 4 + 0.595 x 5 + 0.385 x 6 0.116 x 7 0.42 x 8
Summarize (20), (21), and (22) into a total component, and obtain the comprehensive factor α, as shown in Equation (23).
α = 0.424 F 1 + 0.405 F 2 + 0.171 F 3
Combining Equations (15) and (23), the carbon emission model of the fissure channel in the re-burning coal fire region is finally obtained, as shown in Equation (24):
E = D i A v T i ( 0.424 F 1 + 0.405 F 2 + 0.171 F 3 )
where Di only considers CO2 and the C content in CO.
(3) Estimated results
In this paper, according to the field investigation results, the fissure channel of research point 1# is linear, and the fissure channel of research point 2# is a round hole. The daily average carbon emission of the fracture channel at the research point is calculated by Equation (24), as shown in Table 4.
According to Table 4, re-burning a coal fire is a dynamic process, and the emission intensity of spontaneous combustion gas may differ in different fissure channels. The daily average carbon emission of research point 1# is about 2.69 t, the daily average carbon emission of research point 2# is about 2.42 t, and the total daily average carbon emission is about 2.56 t. Combined with the previous conclusions, the degree of re-burning of research point 1# is greater than that of research point 2#, indicating that the content of C in the spontaneous combustion gas of research point 1# is more than that of research point 2#. Moreover, there is a direct relationship between carbon emissions and the degree of re-burning.

5. Conclusions

In order to timely understand the degree of re-burning of coalfield fires, this paper proposes a system and equipment for the in situ monitoring of spontaneous combustion gas emissions from fissure channels. It uses this system to investigate the degree of re-burning in some areas of the Wuda coal fire. The following conclusions are obtained.
(1) The in situ monitoring system and equipment realize the synchronous coupling of spontaneous combustion gas concentration, meteorological factors, and fissure thermophysical, enabling the continuous and continuous monitoring of fissure channels, day and night. The monitoring data have different changing laws over the day and night intervals.
(2) The time-varying characteristics of spontaneous combustion gas (CO2 and CO) concentrations in the fissure channels indicate re-burning behavior in the coal seam at the bottom of the fissure channel. Both the light conditions and the shape of the fissure channel will affect the emissions of spontaneous combustion gases (CO2 and CO) in the fissure channel.
(3) There is a certain relationship between the inflow and outflow phenomena of the fissure channel, and the meteorological factors (T, RH, W, and P). When the meteorological factors change significantly, W is not the main factor affecting the spontaneous combustion gas emission.
(4) Combining the MCE and CO2/CO ratio can assess the degree of re-burning at the study site. According to the comprehensive factor α, the carbon emission model of the fissure channel is established, and the carbon emission of the fissure channel can be obtained. The degree of re-burning and carbon emissions of research point 1# are higher than those of research point 2#, indicating a direct relationship between carbon emissions and the degree of re-burning.

Author Contributions

Conceptualization, H.W. and C.F.; methodology, C.F.; software, C.F. and J.L.; validation, C.F., J.L. and Y.W.; formal analysis, S.X.; investigation, C.F., J.L. and W.W.; data curation, J.L.; writing—original draft preparation, C.F.; writing—review and editing, H.W. and C.F.; visualization, Y.W. and S.X.; supervision, H.W.; project administration, H.W.; funding acquisition, H.W. All authors have read and agreed to the published version of the manuscript.

Funding

This research was funded by the National Natural Science Foundation of China grant number [51874313].

Conflicts of Interest

The authors declare no conflict of interest.

References

  1. Deng, J.; Ge, S.; Qi, H.; Zhou, F.; Shi, B. Underground coal fire emission of spontaneous combustion, Sandaoba coalfield in Xinjiang, China: Investigation and analysis. Sci. Total Environ. 2021, 777, 146080. [Google Scholar] [CrossRef] [PubMed]
  2. Dindarloo, S.R.; Hood, M.M.; Bagherieh, A.; Hower, J.C. A statistical assessment of carbon monoxide emissions from the Truman Shepherd coal fire, Floyd County, Kentucky. Int. J. Coal Geol. 2015, 144, 88–97. [Google Scholar] [CrossRef]
  3. Wang, S.F.; Li, X.B.; Wang, D.M. Mining-induced void distribution and application in the hydro-thermal investigation and control of an underground coal fire: A case study. Process Saf. Environ. 2016, 102, 734–756. [Google Scholar] [CrossRef]
  4. Singh, N.; Chatterjee, R.S.; Kumar, D.; Panigrahi, D.C. Spatio-temporal variation and propagation direction of coal fire in Jharia Coalfield, India by satellite-based multi-temporal night-time land surface temperature imaging. Int. J. Min. Sci. Technol. 2021, 31, 765–778. [Google Scholar] [CrossRef]
  5. Du, B.; Liang, Y.T.; Tian, F.C. Detecting concealed fire sources in coalfield fires: An application study. Fire Saf. J. 2021, 121, 103298. [Google Scholar] [CrossRef]
  6. Melody, S.M.; Johnston, F.H. Coal mine fires and human health: What do we know? Int. J. Coal Geol. 2015, 152, 1–14. [Google Scholar] [CrossRef] [Green Version]
  7. Shao, Z.L.; Wang, D.M.; Wang, Y.M.; Zhong, X.X.; Tang, X.F.; Hu, X.M. Controlling coal fires using the three-phase foam and water mist techniques in the Anjialing Open Pit Mine, China. Nat. Hazards 2015, 75, 1833–1852. [Google Scholar] [CrossRef]
  8. Kuenzer, C.; Stracher, G.B. Geomorphology of coal seam fires. Geomorphology 2012, 138, 209–222. [Google Scholar] [CrossRef]
  9. Kus, J. Impact of underground coal fire on coal petrographic properties of high volatile bituminous coals: A case study from coal fire zone No. 3.2 in the Wuda Coalfield, Inner Mongolia Autonomous Region, North China. Int. J. Coal Geol. 2017, 171, 185–211. [Google Scholar] [CrossRef]
  10. Zhang, J. Underground Coal Fires in China: Origin, Detection, Fire-Fighting,and Prevention; China Coal Industry Publishing House: Beijing, China, 2008. [Google Scholar]
  11. Wang, H.Y.; Zhang, J.P.; Zhang, L.; Wang, J.L.; Xu, Z.H. Gas Emission and Soil Chemical Properties Associated with Underground Coal Fires, Wuda Coalfield, Inner Mongolia, China. Nat. Resour. Res. 2020, 29, 3973–3985. [Google Scholar] [CrossRef]
  12. Li, C.H.; Liang, H.D.; Liang, M.; Chen, Y.; Zhou, Y. Soil surface Hg emission flux in coalfield in Wuda, Inner Mongolia, China. Environ. Sci. Pollut. Res. 2018, 25, 16652–16663. [Google Scholar] [CrossRef]
  13. Wang, H.; Zhang, J.; Zhang, L.; Wang, J.; Xu, Z. A survey on the gas emissions and soil properties near the surface in a coal fire area. Arab. J. Geosci. 2021, 14, 1–14. [Google Scholar] [CrossRef]
  14. Hong, X.P.; Liang, H.D.; Lv, S.; Jia, Y.R.; Zhao, T.C.; Liang, W.L. Mercury emissions from dynamic monitoring holes of underground coal fires in the Wuda Coalfield, Inner Mongolia, China. Int. J. Coal Geol. 2017, 181, 78–86. [Google Scholar] [CrossRef]
  15. Tang, Y.B.; Wang, H.A. Experimental investigation on microstructure evolution and spontaneous combustion properties of secondary oxidation of lignite. Process Saf. Environ. 2019, 124, 143–150. [Google Scholar] [CrossRef]
  16. Querol, X.; Zhuang, X.; Font, O.; Izquierdo, M.; Alastuey, A.; Castro, I.; van Drooge, B.L.; Moreno, T.; Grimalt, J.O.; Elvira, J.; et al. Influence of soil cover on reducing the environmental impact of spontaneous coal combustion in coal waste gobs: A review and new experimental data. Int. J. Coal Geol. 2011, 85, 2–22. [Google Scholar] [CrossRef]
  17. Niu, H.Y.; Yang, Y.X.; Bu, Y.C.; Li, S.P. Study on Spontaneous Combustion Characteristics of Coal Samples with Different Pre-oxidized Temperatures in Secondary Oxidation Process. Combust. Sci. Technol. 2021, 1–14. [Google Scholar] [CrossRef]
  18. Deng, J.; Li, Q.W.; Xiao, Y.; Shu, C.M. Experimental study on the thermal properties of coal during pyrolysis, oxidation, and re-oxidation. Appl. Therm. Eng. 2017, 110, 1137–1152. [Google Scholar] [CrossRef]
  19. Wang, G.; Liu, Q.Q.; Sun, L.L.; Song, X.; Du, W.Z.; Yan, D.C.; Wang, Y. Secondary Spontaneous Combustion Characteristics of Coal Based on Programed Temperature Experiments. J. Energy Resour. Technol. 2018, 140, 082204. [Google Scholar] [CrossRef]
  20. Wen, H.; Yu, Z.J.; Fan, S.X.; Zhai, X.W.; Liu, W.Y. Prediction of Spontaneous Combustion Potential of Coal in the Gob Area Using CO Extreme Concentration: A Case Study. Combust. Sci. Technol. 2017, 189, 1713–1727. [Google Scholar] [CrossRef]
  21. Song, J.J.; Deng, J.; Zhao, J.Y.; Zhang, Y.N.; Wang, C.P.; Shu, C.M. Critical particle size analysis of gas emission under high-temperature oxidation of weathered coal. Energy 2021, 214, 118995. [Google Scholar] [CrossRef]
  22. Ma, L.; Zou, L.; Ren, L.F.; Chung, Y.H.; Zhang, P.Y.; Shu, C.M. Prediction indices and limiting parameters of coal spontaneous combustion in the Huainan mining area in China. Fuel 2020, 264, 116883. [Google Scholar] [CrossRef]
  23. Engle, M.A.; Radke, L.F.; Heffern, E.L.; O’Keefe, J.M.K.; Smeltzer, C.D.; Hower, J.C.; Hower, J.M.; Prakash, A.; Kolker, A.; Eatwell, R.J.; et al. Quantifying greenhouse gas emissions from coal fires using airborne and ground-based methods. Int. J. Coal Geol. 2011, 88, 147–151. [Google Scholar] [CrossRef]
  24. Van Dijk, P.; Zhang, J.Z.; Jun, W.; Kuenzer, C.; Wolf, K.H. Assessment of the contribution of in-situ combustion of coal to greenhouse gas emission; based on a comparison of Chinese mining information to previous remote sensing estimates. Int. J. Coal Geol. 2011, 86, 108–119. [Google Scholar] [CrossRef]
  25. Mohalik, N.K.; Lester, E.; Lowndes, I.S.; Singh, V.K. Estimation of greenhouse gas emissions from spontaneous combustion/fire of coal in opencast mines-Indian context. Carbon Manag. 2016, 7, 317–332. [Google Scholar] [CrossRef]
  26. Kuenzer, C.; Zhang, J.; Tetzlaff, A.; van Dijk, P.; Voigt, S. Uncontrolled coal fires and their environmental impacts: Investigating two arid mining regions in north-central China. Appl. Geogr. 2007, 27, 42–62. [Google Scholar] [CrossRef]
  27. Wang, Y.M.; Li, X.Q.; Wang, W.Z.; Guo, Z.X. Experimental and in-situ estimation on hydrogen and methane emission from spontaneous gasification in coal fire. Int. J. Hydrogen Energy 2017, 42, 18728–18733. [Google Scholar] [CrossRef]
  28. Wang, H.; Zhang, J.; Cheng, H.; Yang, Y.; Wang, L.; Sun, X. Surface-Based CO2 Detection to Identify and Monitor Underground Coal Fires. Nat. Resour. Res. 2022, 31, 551–569. [Google Scholar] [CrossRef]
  29. Ide, S.T.; Orr, F.M. Comparison of methods to estimate the rate of CO2 emissions and coal consumption from a coal fire near Durango, CO. Int. J. Coal Geol. 2011, 86, 95–107. [Google Scholar] [CrossRef]
  30. Kuenzer, C.; Zhang, J.Z.; Sun, Y.L.; Jia, Y.R.; Dech, S. Coal fires revisited: The Wuda coal field in the aftermath of extensive coal fire research and accelerating extinguishing activities. Int. J. Coal Geol. 2012, 102, 75–86. [Google Scholar] [CrossRef]
  31. Feng, X.; Li, Q.; Zhu, Y.J.; Hou, J.X.; Jin, L.Y.; Wang, J.J. Artificial neural networks forecasting of PM2.5 pollution using air mass trajectory based geographic model and wavelet transformation. Atmos. Environ. 2015, 107, 118–128. [Google Scholar] [CrossRef]
  32. Scharf, F.; Widmann, A.; Bonmassar, C.; Wetzel, N. A tutorial on the use of temporal principal component analysis in developmental ERP research-Opportunities and challenges. Dev. Cogn. Neurosci. 2022, 54, 101072. [Google Scholar] [CrossRef] [PubMed]
  33. Xu, Y.P.; Wu, Z.Y. Parameter identification of unsaturated seepage model of core rockfill dams using principal component analysis and multi-objective optimization. Structures 2022, 45, 145–162. [Google Scholar] [CrossRef]
  34. Cheng, Y.; Zhang, H.; Liu, Z.H.; Chen, L.F.; Wang, P. Hybrid algorithm for short-term forecasting of PM2.5 in China. Atmos. Environ. 2019, 200, 264–279. [Google Scholar] [CrossRef]
  35. Garcia-Hurtado, E.; Pey, J.; Baeza, M.J.; Carrara, A.; Llovet, J.; Querol, X.; Alastuey, A.; Vallejo, V.R. Carbon emissions in Mediterranean shrubland wildfires: An experimental approach. Atmos. Environ. 2013, 69, 86–93. [Google Scholar] [CrossRef]
  36. Li, J.L.; Lu, W.; Liang, Y.T.; Qi, G.S.; Kong, B.; Hu, X.M. Variation of CO2/CO ratio during pure-oxidation of feed coal. Fuel 2020, 262, 116588. [Google Scholar] [CrossRef]
  37. O’Keefe, J.M.K.; Henke, K.R.; Hower, J.C.; Engle, M.A.; Stracher, G.B.; Stucker, J.D.; Drew, J.W.; Staggs, W.D.; Murray, T.M.; Hammond, M.L.; et al. CO2, CO, and Hg emissions from the Truman Shepherd and Ruth Mullins coal fires, eastern Kentucky, USA. Sci. Total Environ. 2010, 408, 1628–1633. [Google Scholar] [CrossRef]
  38. Hower, J.C.; Copley, G.C.; O’Keefe, J.M.K.; Hower, J.M. The further adventures of Tin Man: Vertical temperature gradients at the Lotts Creek coal mine fire, Perry County, Kentucky. Int. J. Coal Geol. 2012, 101, 16–20. [Google Scholar] [CrossRef]
  39. O’Keefe, J.M.K.; Neace, E.R.; Hammond, M.L.; Hower, J.C.; Engle, M.A.; East, J.; Geboy, N.J.; Olea, R.A.; Henke, K.R.; Copley, G.C.; et al. Gas emissions, tars, and secondary minerals at the Ruth Mullins and Tiptop coal mine fires. Int. J. Coal Geol. 2018, 195, 304–316. [Google Scholar] [CrossRef]
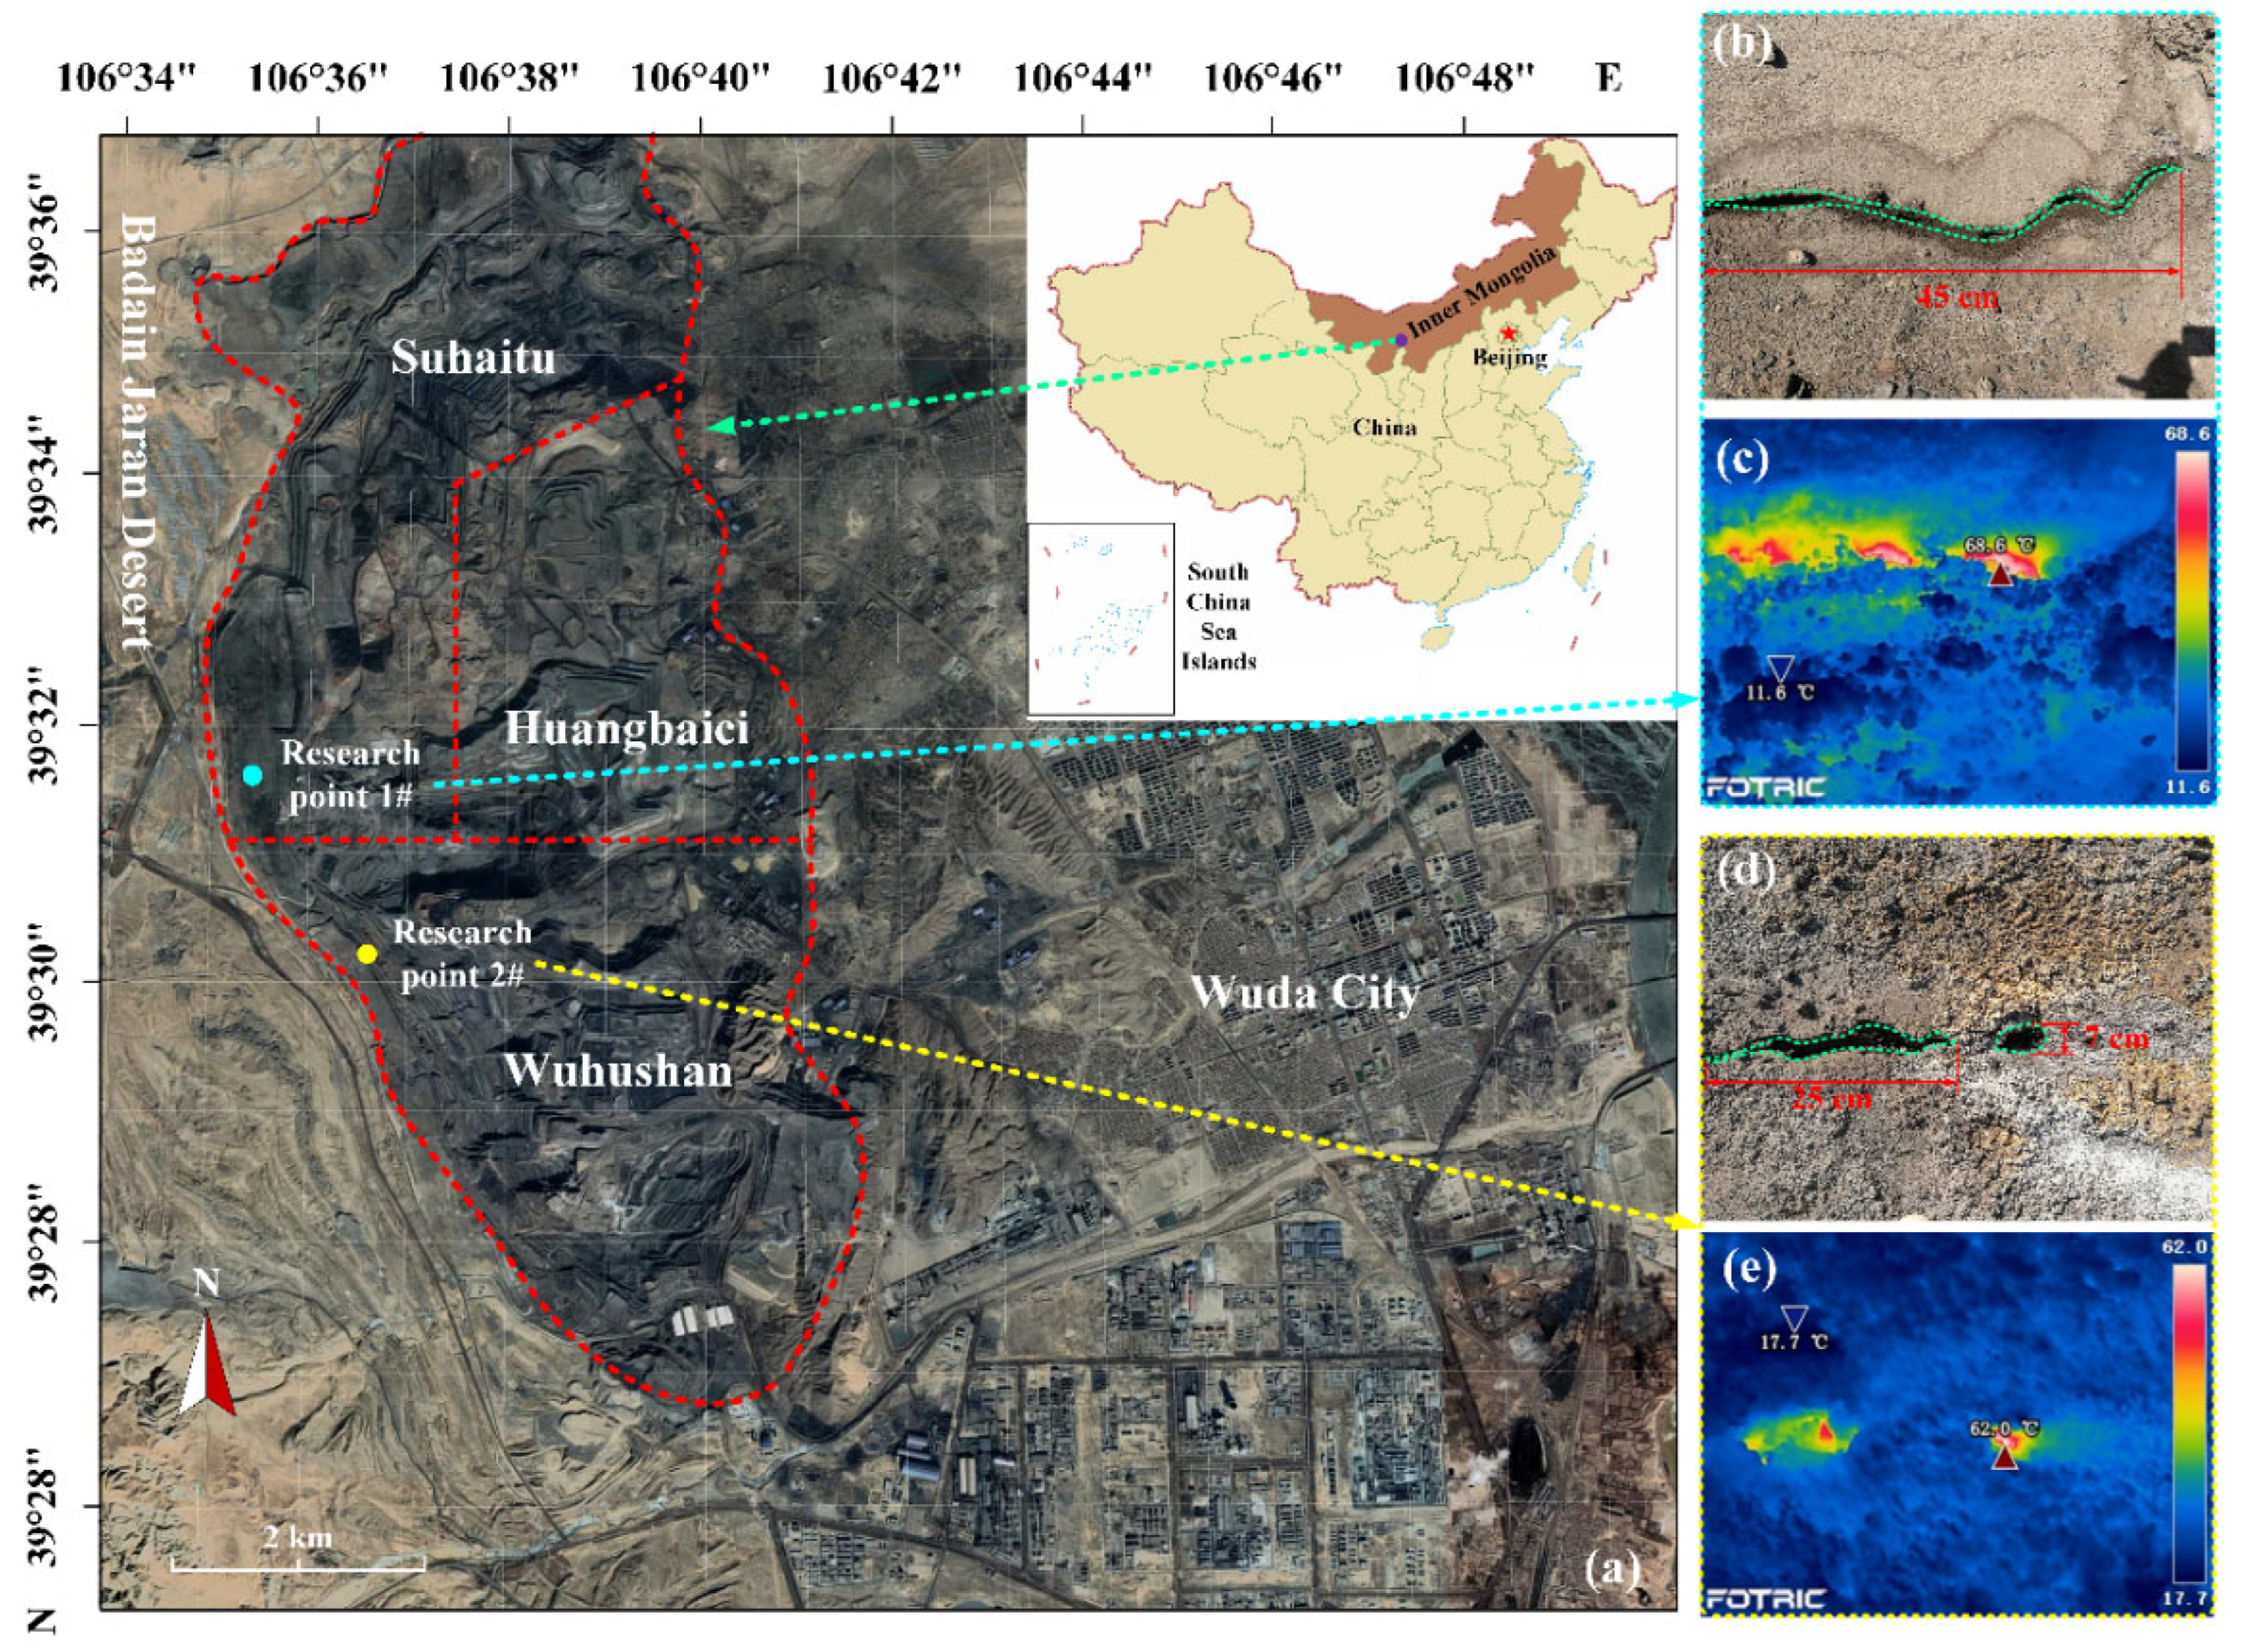
Figure 1. Location map of research points. (a) Research location; (b) Research point 1# fissure channel; (c) Research point 1# fissure temperature; (d) Research point 2# fissure channel; (e) Research point 2# fissure temperature.
Fire 05 00186 g001
Figure 2. Schematic diagram of the in situ fissure channel monitoring system. (a) Fissure module; (b) Meteorological module; (c) Power supply and data module.
Fire 05 00186 g002
Figure 3. Characteristic diagram of spontaneous combustion gas variation in fissure channel 1# of research point. (a) Concentration time change rule; (b) Variation characteristics of low−frequency eigenvalues; (c) Variation characteristics of high−frequency eigenvalues of CO2; (d) Variation characteristics of high−frequency eigenvalues of CO.
Fire 05 00186 g003
Figure 4. Characteristic diagram of spontaneous combustion gas variation in fissure channel 2# of research point. (a) Concentration time change rule; (b) Variation characteristics of low−frequency eigenvalues; (c) Variation characteristics of high−frequency eigenvalues of CO2; (d) Variation characteristics of high-frequency eigenvalues of CO.
Fire 05 00186 g004
Figure 5. Time variation characteristic map of meteorological factors. (a) Temperature and humidity of research point 1#; (b) temperature and humidity of research point 2#; (c) air pressure; (d) wind level; (e) wind speed.
Fire 05 00186 g005
Figure 6. Time variation of the fissure channel’s thermophysical characteristics, which are divided into fissure temperature and bidirectional gas flow rate. (a) Research Site 1#; (b) Research Site 2#.
Fire 05 00186 g006
Figure 7. Pearson correlation coefficient matrix between spontaneous combustion gases (CO2 and CO), meteorological factors, and thermophysical characteristics. FT: fracture temperature; BG: bidirectional gas velocity; W: wind velocity; T: temperature; RH: relative humidity; P: air pressure. Correlation coefficients: no correlation (0 ≤ |r| < 0.2); weak correlation (0.2 ≤ |r| < 0.4); moderately significant correlation (0.4 ≤ |r| < 0.6|); strong correlation (0.60 ≤ |r | < 0.80); very strong correlation (0.80 ≤ |r| < 1.0). Positive correlations are displayed as brown balls, and negative correlations are shown as green balls. The larger and darker ball corresponds to two factors, indicating a stronger correlation between them, and the smaller and lighter ball corresponds to two factors, indicating a weaker correlation between them.
Fire 05 00186 g007
Figure 8. Analysis of coal seam re-burning degree. (a) Time variation law of MCE and CO2/CO ratio; (b) temperature characteristic diagram of fissure 1# in research point; (c) temperature characteristic diagram of fissure 2# in research point.
Fire 05 00186 g008
Table 1. Details of the sensors used in the proposed monitoring system.
ModuleSensorModelRangeAccuracyVoltage
Fissure moduleCO2 sensorDCO2-TF20–120,000 ppm±200 ppmDC 24V
CO sensorBSA/QT-ZN (CO)0–2000 ppm±2%FS
Bidirectional gas flow sensorKV621P0– ± 10 m/s0.2 m/s
Temperature sensorCWDZ33−50–300 °C0.5%FS
Meteorological moduleMeteorological integrated sensorRS-FSXCSWind speed0–60 m/s±0.2 m/s ± 0.02 × v
Pressure0–120 kPa±0.15 kPa
Temperature−40 °C–+80 °C±0.5 °C
Humidity0%RH–99%RH±3%RH
Notes: v is the real reading.
Table 2. Factor loading matrix of GPCA.
CommunitiesTotal Variance Explained
FactorInitialExtractionFactorEigenvalue
ValueVariance ContributionCumulative %
CO21.0000.83312.67333.41733.417
CO1.0000.74722.55431.92165.338
FT1.0000.85931.07513.43578.773
BW1.0000.83140.7309.12287.895
W1.0000.64750.4475.59393.488
T1.0000.83160.2713.38196.869
RH1.0000.79370.1581.97898.847
P1.0000.76080.0921.153100.000
Note: Extraction: PCA. The significance of bold type shows that the eigenvalues in the tables are greater than 1 and can be considered and extracted for the result analysis.
Table 3. Factor loading matrix of GPCA.
FactorLoading Matrix (Aij)Coefficient Matrix (Cij)
PC1PC2PC3PC1PC2PC3
x1 (CO2)0.9080.091−0.0310.2080.022−0.028
x2 (CO)−0.8140.064−0.285−0.1860.016−0.256
x3 (FT)0.1950.906−0.0160.0450.222−0.014
x4 (BW)0.389−0.7400.3640.089−0.1810.327
x5 (W)−0.3130.3300.663−0.0720.0810.595
x6 (T)0.3880.7040.4290.0890.1730.385
x7 (RH)0.747−0.467−0.1290.171−0.114−0.116
x8 (P)0.4380.592−0.4680.10.145−0.42
Note: Extraction: PCA. The significance of bold type shows that the coefficients in tables are large enough to be considered and extracted for analysis in results.
Table 4. Fissure channel carbon emission.
Research PointShape TypeSize (m)Cross-Section Area (m2)Value (t)Daily Average Value (t)
1#Line typeLength: 45; Width: 0.030.01352.692.56
2#Round hole typeLong axis: 0.125; Short axis: 0.0350.01372.42
Publisher’s Note: MDPI stays neutral with regard to jurisdictional claims in published maps and institutional affiliations.