Article

Fire Regime Analysis in Lebanon (2001–2020): Combining Remote Sensing Data in a Scarcely Documented Area

by
Georgia Majdalani
1,2,
Nikos Koutsias
3,
Ghaleb Faour
4,
Jocelyne Adjizian-Gerard
2 and
Florent Mouillot
1,*
1
Centre d’Ecologie Fonctionnelle et Evolutive CEFE, UMR 5175, CNRS, Université de Montpellier, EPHE, IRD, 1919 Route de Mende, CEDEX 5, 34293 Montpellier, France
2
CREEMO Laboratory, Department of Geography, Saint-Joseph University, Damascus Street, Mar Mickael, Beirut 1104 2020, Lebanon
3
Department of Environmental Engineering, University of Patras, G. Seferi 2, GR-30100 Patras, Greece
4
National Center for Remote Sensing, National Council for Scientific Research (CNRS), Riad al Soloh, Beirut 1107 2260, Lebanon
*
Author to whom correspondence should be addressed.
Fire 2022, 5(5), 141; https://doi.org/10.3390/fire5050141
Submission received: 9 July 2022 / Revised: 9 September 2022 / Accepted: 19 September 2022 / Published: 21 September 2022
(This article belongs to the Topic Recent Breakthroughs in Forest Fire Research)

Abstract

:
Fire is a recurrent disturbance in Mediterranean ecosystems. Data assemblage from forest fire services can provide useful information for understanding climate controls on daily fire hazard or long term trends. Located at the driest range of the Mediterranean bioclimate, and with contrasting socio-political systems compared to the European area, the southern Mediterranean ecosystems are subjected to more extreme climate and social events. This could potentially lead to unique fire regimes and trends worth being characterized for prevention plans and ecosystem management. However, the region is far less documented, due to missing or inhomogeneous fire records, leaving local authorities with no management strategies when large fires happen. We filled this knowledge gap for Lebanon by combining high spatial resolution Landsat data with high temporal resolution VIIRS (S-NPP and NOAA-20) and MODIS (MCD14ML) hotspots to characterize the seasonal and interannual fire regime over the 2001–2020 period. Numerous small fires were hardly detected by global remote sensing. We estimated that 2044 ha burn annually, representing 0.58% of the wildland cover, with no significant trend over the period, but with non climate-related fires detected during the year experiencing socio-political troubles. The spatial and temporal resolution of this dataset identified a particular prolonged fire season up to November, and an unusual bimodal fire season peaking in July and November. We related these features to the prolonged autumnal soil drought and high August air humidity in the region. This updated fire regime in Lebanon illustrates the benefits of this combined approach for data-scarce regions and provides new insights on the variability of fire weather types in the Mediterranean basin.

1. Introduction

Wildfire is among the main shaping factors of Mediterranean ecosystems [1], affecting between 700,000 and 1 million hectares of Mediterranean forests worldwide each year [2]. Due to the particularly fire-prone conditions of the Mediterranean climate [3], fires are intrinsic to the functioning of Mediterranean forests. The rainy and cool winter season positively affects biomass production and therefore increases the fuel load and fire frequency [4], while the long, dry summer season, with high evaporation and low precipitation, causes the live fuel to be at its lowest moisture content and optimum flammability [5].
In addition to climate forcings, changes in traditional land use, as well as population movements and lifestyles where humans are responsible for the ignition of more than 95% of all fires [6], lead forest fires to increase after the 1970s in the Mediterranean basin (MB) [7,8,9], causing adverse impacts on economic, social and ecological assets [7,9]. Changes in fire suppression strategies or firefighting also led to a recent decrease in the European area of the basin since the 1990s in France [10] and the 2000s in Spain, Italy, and Portugal. Therefore, national and international research has been addressing this natural disturbance, but is mostly focused on the European area of the MB (France, Greece, Italy, Portugal, and Spain) where fire events have been registered since the 1970s [11], an obligate prerequisite for studying fire regimes, defined as a list of the measurable components of frequency, intensity, type and seasonality of fires [12].
Studies conducted in the Eastern and Southern areas of the MB are more limited, and systematic uniform documentation of fires is still lacking [13,14,15]. However, Mediterranean synthesis actively relies on these national databases to extrapolate future fire hazards over the whole region [16], benefiting from southern MB case studies where particular local fire-prone climates, such as extreme heat waves [17], already happen and could spread more frequently on the northern Mediterranean ridge in the future.
When looking at the Eastern area of the MB, to date, there are no complete scientific studies to provide proper wildfire regimes over long periods, as several non-homogenous and low-accuracy statistics are available [18,19,20,21]. Getting a clear picture of the long-term spatially explicit fire regime in the region would help to understand future threats on forest sustainability as a response to climate, but mostly social conflicts affecting the region [22].
As part of this effort, tentative maps of fire risk, fire-prone areas, fire occurrence, and fire potential have been previously generated for Lebanon, located at the Eastern ridge of the MB [18,19,23,24,25,26], but hardly capture the full and precise picture of fire seasonal timing, surface burnt and the location of fire contours.
To fill this knowledge gap in the region, and more generally in scarcely documented areas such as Lebanon, we proposed an approach combining freely accessible global BA products derived from coarse and moderate spatial resolution sensors available since the early 2000s, such as the MODIS-derived Fire Products (MCD45A1, MCD14ML) (500–1000 m) [27,28] and the ESA FireCCI51 (250 m) [29,30]. However, they often fail to accurately capture small fires [31,32,33], with the smallest reliably detectable fire size with MODIS products being 120 ha [34]. We then proposed to rely on using available medium spatial resolution sensors such as the Landsat-OLI and the Sentinel-2 MSI (respectively, 30 and 20 m) [35,36,37], requiring more time-consuming processing chains to derive BA and visual checking to limit commission errors and reach international standards [37,38]. Landsat data have, however, a long return interval (15 days), not allowing for precise dating of the fires, limiting further analysis on daily fire hazards. We proposed to use fire hotspots as MCD14ML data, widely used as a surrogate to date fire patches and internal fire spread [39,40,41,42,43], compensating for the temporal weakness of Landsat.
Based on the local need for fire regime analysis in the Middle East, which has been subjected to recent socio-political issues affecting forest resources, the lack of local reliable fire data and the panel of available tools for fire detection, the aims of this study were (a) to assemble a multisource and multi-method remote-sensing fire information for a GIS database of visually checked and dated wildfire events in Lebanon for the last 20 years, (b) assess this database by comparison with previous fire inventories, in order to (c) characterize the fire regime (extent, seasonality, and interannual variability) and trend in regard to the main fire weather.

2. Materials and Methods

2.1. Study Area

The study area included the wildland areas (forests, shrublands, and grasslands) over Lebanon (between latitudes 33° and 35° N and longitudes 35° and 37° E) (Figure 1). According to Köppen’s classification, Lebanon is within the Mediterranean climatic zone (Csa) characterized by a typical Mediterranean climate, with hot and dry summers and mild, wet winters [44]. The country’s particular geography, topography, and demography make it an important biodiversity hotspot [45].
Located on the eastern shore of the Mediterranean Sea, Lebanon has a total surface area of 10,452 km2, with two parallel north-to-south mountain ranges, called the Lebanon and Anti-Lebanon, extending throughout the length of the country and separated by the Beqaa valley. Most of Lebanon’s forests are aggregated within the Lebanon mountain range, and its wettest western slope is the most ecologically diverse [46] and the most fire-prone [26]. Lebanon is covered by two main ecoregions, the Eastern Mediterranean conifer–sclerophyllous–broadleaf forests and the Southern Anatolian montane conifer and deciduous forests (source: Terrestrial Ecoregion of the World TEOW, [47]).
Wildland vegetation (forests, shrublands, and grasslands) covers 33.33% of the Lebanese territory, or about 348,440 ha, of which 87.8% are forests and shrublands and 12.18% are grasslands [48]. Lebanon’s forests are rich in various coniferous and oak species, including Pinus brutia, Pinus halepensis, Pinus pinea, Cedrus libani, Abies cilicica, Juniperus excelsa, Quercus calliprinos, and Quercus infectoria among others. Pine forests represent 14.91% of the forests and are the most inflammable species [49], followed by oak forests [50], which are the most abundant, occupying the largest forest area (52.42%), and the emblematic cedar (Cedrus libani), occupying 0.83% of the country [51].
The country is divided into 8 governorates: Akkar, Baalbek-Hermel, Beqaa, Mount-Lebanon, Beirut, Nabatiyeh, North, and South.
Based on the land cover/land use map of 2017 [48], the governorates with the highest forest and shrubland cover are Mount-Lebanon, Baalbek-Hermel, and North, with, respectively, 80.1 103 ha, 71.5 103 ha, and 40.2 103 ha, followed by Nabatiyeh, South, Beqaa, and Akkar, with, respectively, 29.3 103 ha, 28.8 103 ha, 28.3 103 ha and 27.2 103 ha, while the governorate of Beirut is considered as totally covered by urban land (Table 1).
Figure 1. (a) Location of Lebanon within the Mediterranean basin; (b) administrative units overlayed with (c) the forests/shrublands and grasslands (adapted from [48]), and ecoregions (adapted with permission from [47], 2022, World Wildlife Fund).
Fire 05 00141 g001

2.2. Data

2.2.1. Active Fire Data: NASA FIRMS

In the absence of exhaustive fire registration in Lebanon, we considered the precise dates and locations of fires based on NASA’s Fire Information for Resource Management System (FIRMS) detecting soil surface temperature anomalies captured by the middle and thermal infrared sensors [52,53], as widely used as a seed for automated fire perimeter detections in global remotely sensed burnt area (BA) mapping algorithms [54].
NASA’s FIRMS distributes near real-time (NRT) active fire locations of satellite observation from NASA’s Moderate Resolution Imaging Spectroradiometer (MODIS) and Visible Infrared Imaging Radiometer Suite (VIIRS). MODIS active fire/thermal hotspot locations, available since 2000, represent the center of a 1 km pixel that is flagged by the algorithm as containing one or more fires within the pixel [55]. VIIRS active fire/thermal hotspot locations, available since 2012, have an improved spatial resolution of 375 m with better nighttime performance [56]. Data were freely downloaded from https://firms.modaps.eosdis.nasa.gov/download/create.php (accessed on 1 July 2021).
We used the MODIS Collection 6 MCD14ML product (2001–2011), VIIRS S-NPP (2012–2019), and VIIRS NOAA-20 (2020) datasets as setting dating and location to further target Landsat processing chains for the semi-automated analysis (described in Section 2.2.3).

2.2.2. Burnt Area Data

As hotspots can still miss some small fires, due to their return time of 12 h, we also assembled BA from global remote sensing, not captured by thermal anomalies during fire spread, but by difference in the reflectance between pre- and post-fire images. This information was used for both Landsat fire location identification as a supplementary information, and as a final comparison dataset for an evaluation purpose. We downloaded and used the following information:
  • ESA FireCCI51: this database is developed as part of the ESA Climate Change Initiative (CCI) Program. FireCCI51 is a monthly global BA product available for 2001–2019 with a spatial resolution of 250 m based on MODIS red and near-infrared reflectance and thermal anomaly data (full description of the product is found in [29,30]). The data was downloaded from https://climate.esa.int/en/projects/fire/data/ (accessed on 1 July 2021);
  • MCD64A1: This monthly global BA product is available from November 2000 to present with a spatial resolution of 500 m based on MODIS data (Terra and Aqua). This new version has a refined algorithm, allowing it to capture smaller fires compared to older versions (e.g., MCD45A1) (full description of the product is found in [28]). The data was downloaded from https://modis-land.gsfc.nasa.gov/burn.html (accessed on 1 July 2021);
  • National fire inventory: The available national fire records were provided by the National Center for Remote Sensing of the CNRS-L (National Council for Scientific Research, Beirut, Lebanon). Fire information was gathered from many sources: the Al-Nahar newspaper (1983–2003), Lebanese Civil Defense (2002 and 2003), the Ministry of Environment (1994–1998), the Ministry of Agriculture (1996–2002), and Beirut fire stations (1998). These fire records (in paper form) were treated and provided by the CNRS-L as Excel tables describing the location, date, and type of vegetation burnt (database described in [19]);
  • The University of Balamand and the Ministry of Environment technical fire reports: Yearly fire technical reports are produced, since 2008, through collaborative work between the Institute of the Environment at the University of Balamand (UOB) and the Ministry of Environment (MoE) within the USAID-PEER project. They provide monthly BA extent and numbers based on fire ID cards filled by the Internal Security Forces and copied to the Ministry of Environment (adapted from http://ioe-firelab.balamand.edu.lb/pages/ProfileCountryAnnex5.aspx, accessed on 1 July 2021).

2.2.3. Landsat Data Processing

We processed Landsat 7 (ETM +) and 8 (OLI) (from 2001 to 2015) and Sentinel-2 (MSI) (from 2016 to 2020) atmospherically corrected and orthorectified images within the BAMTs freeware to generate fire contours over Lebanon’s wildland areas, using the Google Earth Engine (GEE) version of the Burned Area Mapping Software (BAMS) [57] as a semi-automated tool for BA detection.
BAMTS calculates the three spectral indexes NDVI [58], NBR [59] and NBR2 [60] (full description of the tool is found in [61]). The user has to define the date of burning to determine a pre- and post-burn period, and the target area where the 3 indices are represented in an RGB color scale. The user then defines a burnt and unburnt area, used as a training zone for a random forest classifier [62] for a supervised classification via change detection of the NDVI, NBR, and NBR2 composites.
Each fire was first located using NASA’s FIRMS, national registration, ESA FireCCI51, or MCD64A1, to target a BAMTs processing zone. Finally, each produced fire polygon was visually interpreted and manually refined until the desired visual accuracy was obtained, so that commission errors (fire polygons being detected in agricultural lands, for example) were removed manually, and omitted BAs were reprocessed by enlarging and multiplying the training zones. The procedure is time-consuming but ensures a visual validation hardly provided by automated methods.
In addition to this semi-automated method (requiring fire dates for setting pre- and post-fire reflectance), we used an additional rule-based method [63,64], as FIRMS’ fire signal might miss some small fires lasting less than 6 h. This rule-based method allowed the detection of BAs following the application of 5 valid rules based on the spectral properties of BAs as compared to the pre-fire unburnt vegetation and to the spectral signatures of other LC types found in post-fire satellite scenes with no omission errors. Fires overlapping with previously detected fire polygons were removed, and newly identified fires were all visually checked to keep only wildland fires occurring on forests, shrubs, and grasslands, and for which visual changes in reflectance were observed to prevent commission errors.

2.2.4. Climatic Data

To assess the consistency of the identified fire regime (seasonality and interannual variability) with the fire weather in the region, we computed the widely used Fire Weather Index (FWI). The FWI and DC (Drought Code) were computed using the “fwi” function of the “cffdrs” R-cran package, and from midday 10-m height wind speed (km.h−1), air relative humidity (%), temperature (C), and 24-h rainfall (mm).
After finding many gaps in the climatic data obtained from various meteorological stations in Lebanon, we used the Era5-Land dataset [64]. Era5-Land is an open-source climatic dataset with a global spatial resolution of 9 km, simulated hourly by global high-resolution numerical integrations of the ECMWF land surface model driven by the downscaled meteorological forcing from the ERA5 climate reanalysis, including an elevation correction for the thermodynamic near-surface state. The climatic variables downloaded over Beirut (33.68° N, 35.5° E), representative of the coastal mountain ecosystem where most fires occur, were air temperature (K) at 2 m, dew point (K) at 2 m, eastward (u) and northward (v) components of the 10 m wind (m.s−1), and total precipitation (m) for the period 2001–2020 to compute the subsequent climatic variables of relative humidity and wind speed. Relative humidity (%) was computed using the “RH” function of the “humidity” R-cran package from temperature and dew point. Wind speed (m.s−1) was computed using the “uv2ds” function of the “rWind” R-cran package from u and v components of the wind.

2.2.5. Statistical Analysis

From the newly generated wildfire database of fire polygons, we provided the main descriptors of the fire regime in Lebanon. We calculated the fire numbers, the annual and monthly BA, and the temporal trend of BA within the 2001–2020 period. All the analysis was performed with the R-cran freeware (https://www.r-project.org/, accessed on 1 July 2021).
We first provided a fire size distribution analysis as an indicator of fire size threshold accuracy according to the self-organized criticality hypothesis (SOC) [65,66]. According to this hypothesis, the fire size distribution follows a linear decrease, and any disruption might reflect missing fires, particularly smaller ones [13]. For the fire size distribution analysis, we fitted a linear regression between the log10-scaled fire number (Nfires) and the log10-scaled fire size class (Sfire) according to Equation (1):
Nfires = a + k Sfire,
where a is a constant and k is the slope of the regression, as an indicator of the dominance of small fires compared to large fires.
The Shapiro–Wilk test of normality was performed using the “shapiro.test” function in R to test the normality of our data [67,68,69].
FWI, DC, climatic variables (relative humidity, wind speed, temperature, and precipitation), and fire regime (fire-size seasonality and interannual variability) analysis were investigated using the boxplot tools [70,71,72] to compute the median, standard deviation interval and the 95% upper and lower confidence interval, including outliers. Seasonality, interannual variability of BA, and fire number were also calculated.
The temporal trend of BA over time was performed using a bootstrapped Theil–Sen test [73] for the significance of the trend by evaluating the slope and intercept confidence interval on a selection of 100 random samples of data within our data. The Theil–Sen test is robust to outliers and tends to yield accurate confidence intervals even with non-normal data and non-constant error variance. The Theil–Sen test is used in temporal trend analysis, including fire data (e.g., in [30,74]). The Theil–Sen test was computed with the “TheilSen” function of the “Openair” R-cran package (https://cran.r-project.org/web/packages/openair/openair.pdf, accessed on 1 July 2021).
To better understand the temporal trend, breakpoints (or cut-offs) occurring in the time series were tested. Breakpoints were identified when the mean and standard deviation of a given period significantly exceeded the mean and standard deviation of another period. To evaluate the number of breakpoints, the relative sum of squares (RSS) within each period is evaluated, as well as the Bayesian index criteria (BIC) for breakpoints varying from 0 to 5. We retained the number of breakpoints when the BIC was minimum and the RSS was no longer decreasing when increasing the breakpoint number. This test is used in climate data analysis to test for the temporal accuracy of the datasets and detect any potential changes in sensors or meteorological stations, for example. It was used here to detect potential breakpoints in the BA time series following abrupt changes due to non-climatic events [75,76]. Breakpoints in BA can happen during changes in firefighting policies, wars, or abrupt social events. The breakpoint analysis was performed using the “breakpoints” function of the “strucchange” Rcran package (https://cran.r-project.org/web/packages/strucchange/strucchange.pdf, accessed on 1 July 2021).

3. Results

3.1. Burnt Area in Lebanon: General Information

We generated a new GIS BA database (vector map with polygons) for Lebanon (Figure 2) for the period 2001–2020. A total of 1585 fires were detected, burning an estimated surface of 40.9 103 ha for the period 2001–2020, meaning that 2.05 103 ha.year−1 (±75.4 ha) were burnt (of which 59.28% occurred in forests and shrubs), representing 11.76% of the wildland areas in Lebanon. With 347.4 103 ha of burnable wildlands, 0.58% of this area was then burnt each year in Lebanon, leading to a mean fire return interval of 172.4 years. This average rate varied from 1.75% in the governorate of Akkar to 0.08% in the governorates of Baalbek-Hermel and Beqaa (Table 2). Wildfires burnt the most in the Nabatiyeh governorate, with a total of 13.1 103 ha burnt (representing 32.1% of the total BA detected), followed by the governorate of Akkar, with a total of 10.5 103 ha burnt (representing 25.8% of the total BA) (Table 2). At the eco-region level, the majority of BA occurred in the Eastern Mediterranean conifer–sclerophyllous–broadleaf forests (83.9%), while only a small fraction (16.1%) occurred in the Southern Anatolian montane conifer and deciduous forests.
Over the 20 year period, 62.3% of the BA burnt once, 21.6% burnt twice, and 9%, 3.8%, 2%, 0.7%, 0.4%, and 0.1% burnt, respectively, three to eight times (Figure 3).
A total of 35.07% (556 out of 1585) of the fire polygons and 60.7% (24.8 103 ha out of 40.9 103 ha) of the BA could be dated based on the MCD14ML and VIIRS hotspots with a minimum (ignition date) and maximum (extinction date) burn date. The remaining 1029 fires were only dated yearly based on the acquisition date of post-fire Landsat scenes. A total of 330 dated fires had individual sizes larger than 10 ha. All polygons had a calculated surface area (ha) and were used to calculate the fire size distribution, the temporal trend and breakpoints, and the interannual variability, while only daily dated polygons were used for the calculation of seasonal variability. Fires detected had a size range varying between 0.03 ha and 789.4 ha. As the fire detection threshold was equal to 5 ha in the rule-based tool [63], only fires ≥ 5 ha (1441 fires out of which 412 fires are dated) were then considered for the fire number analysis.

3.2. Data Quality Checking

Fire number is critical information, highly dependent on the minimum fire size considered [77] and the resolution of satellite information. To define the minimum fire size properly captured by our method, Figure 4 represents the fire size distribution for the whole of Lebanon. The observed breakpoint at 0.8 (log10 scale) indicates incomplete data due to missing fires below the threshold of 6.3 ha (=0.8 on a log scale). The fire number for fires larger than 6.3 ha is then considered only as complete information. When comparing national reports previously published, we found large discrepancies in the total fire number (Table 3). None of the available datasets (National inventories, UOB/MoE) were consistent, neither on the mean fire number nor on its interannual variability, highlighting the need for cautious use of this information when fire types (vegetation affected) and minimum fire size are not specified.
As a quality assessment of our dataset, yearly BA compared to previous studies or global remote sensing is provided in Table 4. We observed an overall high underestimation (84%) of yearly BA in MCD64A1 for the period 2004–2019, with no BA captured for half of the study period. ESA FireCCI51 and UOB/MoE also showed an underestimation of the yearly BA, respectively, by 25.16% (2002–2019) and 37.1% (2008–2019). There were discrepancies between high resolution and global dataset, as ESA FireCCI51 resulted mostly in missing small fires, but also, as in the years 2006 and 2010, some large fires in ESA FireCCI51 appeared as scattered smaller fires when using finer resolution Landsat data (Figure 5).
In conclusion, our database, from a consistent and homogeneous fire identification method and by being visually checked for every single fire over the 2001–2020 period, can be considered reliable for fires larger than 6.3 ha, with acknowledged missing fires below this threshold compared to the national census. The fine resolution data generated significantly more BA than global remote sensing data in this region dominated by small-to-medium-size fires.

3.3. Annual Burnt Area and Fire Number

As a major description of the fire regime, we first tested the temporal trend and breakpoints of the 20-year period. Figure 6a represents the yearly BA and the number of fires for the period 2001–2020 in Lebanon for each vegetation type (forest/shrublands and grasslands). The average annual fire number (≥5 ha) was estimated to be 72.05 fires.year−1 (±47.18 fires). The years with the highest number of fires were 2007 and 2002 with, respectively, 204 and 143 fires detected. The years with the highest BA were 2007, 2006, and 2010 with, respectively, 5.76 103 ha (4.19 103 ha in forests and shrublands), 4.30 103 ha (3.39 103 ha in forests and shrubs), and 4.29 103 ha (1.90 103 ha in forests and shrublands) burnt.
The interannual variability of BA in forests/shrublands and grasslands was similar, with a constant distribution between these two vegetation types. We did not find any significant trend in BA (p = 0.54, slope = −31.76) nor a breakpoint during the study period.
Figure 6b represents the yearly median, standard deviation, 95% confidence interval, and outliers of fire sizes (Log10 ha) in Lebanon. A strong interannual variability of fire sizes is observed. The years 2005, 2006, 2012, and 2020 experienced the highest median fire size values. Even though a small number of fires occurred during these years, the median size of the fires was larger than those of the years with the highest yearly BA, 2007 and 2010. The largest fire events were observed in 2019 (789.4 ha), 2006 (674.6 ha), and 2013 (598.7 ha), corresponding to high-fire years, illustrating the high contribution of large fires in the interannual variation of the total BA. Very small fires (below 0.1 ha) were detected after 2016 when using Sentinel-2 data and should be removed for temporal consistency.

3.4. Fire Seasonality
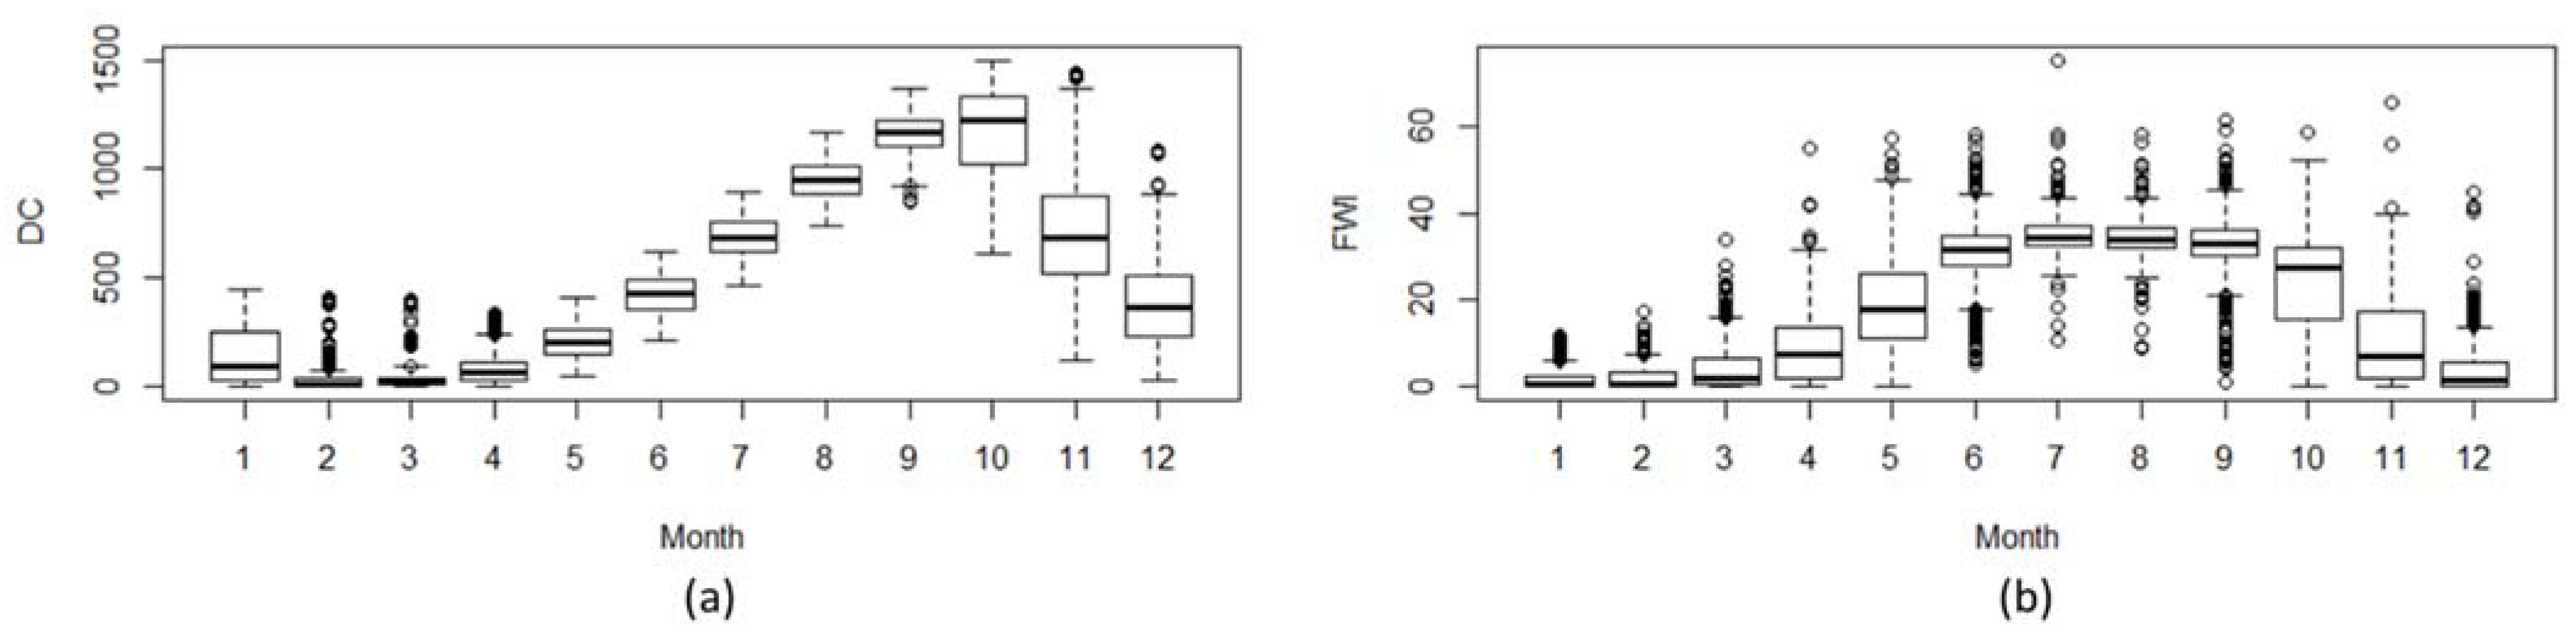
We also investigated the seasonal fire distribution based on the dated fires as an additional component of the fire regime. Figure 7a represents the monthly pattern of average BA and the average number of fires in Lebanon for the period 2001–2020. We identified the main fire season to cover June to November. The months with the highest average number of fires detected were September, July, and June with, respectively, 5.6 (±5.4), 5.5 (±5.3), and 5.3 (±8.3) fires. However, the highest average monthly surface burnt was detected in November, July, and October with, respectively, 64.3 (±125.2), 61 (±105.7), and 57.4 (±106) ha (Table 5). The seasonality of BA then showed a bimodal distribution with two distinct peaks. During the fire season, the lowest monthly BA values were observed in August 30.2 ha (±46.7), quite unusual for a Mediterranean climate. When looking at vegetation types affected by fires, we observed this bimodal distribution for forest/shrublands with 67.2 ha and 61.5 ha in November and October, and 39.6 ha and 58.4 ha in June and July, respectively. In grasslands, the month of July was the most fire-prone at 67.5 ha, while in other months a constant burnt area of ~37 ha was observed.
We investigated further how the high-burning months were driven by larger fires. Figure 7b, representing the monthly fire size distribution as a boxplot, shows that the months with the highest average BA (November, July, and October), correspond to the months with the highest median and the upper 95% confidence interval of the fire size distribution. This illustrates the same process as observed for the interannual variability, where the seasonal course of large fires drove the seasonal course of the total BA.

3.5. Fire Weather

To strengthen our findings on the temporal trend and seasonal variation of BA in Lebanon, we finally investigated if the particular interannual and seasonal variations in BA were related to the fire weather representative of the coastal region where most fires occur. We provided the monthly and interannual FWI, drought code (DC) and major climate variables in Figure 8, Figure 9 and Figure 10.
DC appeared to increase from May to September with low interannual variability (thin boxplot), then decreased from October to December (Figure 8a). However, extremely high DC values (upper boxplot 95% confidence and outliers) were maintained up to November for some years, suggesting the potential maintenance of drought until late in November for some extreme years, but with high interannual variability. The resulting FWI (Figure 8b) experienced the highest medians for the driest period of July to September period, while extreme daily FWI values could be observed from April to November, supporting the observed fire season extending to November. No major decrease in median FWI for August was observed, however, the most extreme values were more often observed in July, September, October and November, rather than August, supporting our earlier result on the bimodal seasonal BA distribution.
When investigating the climatic variables individually (Figure 9), we observed a strong seasonality in temperatures with the highest median values in July and August, but extreme values above 25 °C occurred over the whole dry season from April to early November, with no significant differences between months. Throughout the year, stable seasonality of median relative humidity (varying around 70%) and wind speed (varying around 2 m.s−1) were observed. However, we identified that the most extreme values of air dryness and high wind speed, acknowledged to promote fires, were absent in August. November, July, and October were actually the months that combined the highest DC and the occurrence of extremely high wind speed, high temperature extremes, and low RH.
When looking at the interannual variability of the FWI (Figure 10) and testing its relationship with the interannual BA, we identified the years 2002, 2007, 2010 and 2019 as demonstrating the highest peaks. This corresponded to the highest fire years, except for the years 2006 and 2020, which demonstrated high BA but rather low FWI values, suggesting additional controls as human impacts prevailed in some years.

4. Discussion

4.1. Data Quality Assessment

Our bibliographical review did not find any homogeneous, classified or organized national records on wildfires in Lebanon, as previously reported [18,78,79], thus motivating our full reconstruction from a standardized method. Previous studies mostly described the extent and numbers of wildfires based on coarse resolution MODIS global fire products, or inconsistent information provided by different national authorities (such as the ministry of Agriculture, the Ministry of Environment, Civil Defense, etc.) [23,24,78,79]. Our results present the advantage of generating a BA database derived from an objective and homogeneous methodology using medium resolution sensors (Landsat ETM+ and OLI, and Sentinel-2 MSI) for the 2001–2020 period in Lebanon.
The semi-automated BAMTS [61] and the rule-based method [63] used in our approach relied on a fine visual validation step of each fire polygon, thus minimizing commission errors. BAMTs additionally allowed the manual modification of the polygons to minimize omission errors, these errors being usually high with global fire products (e.g., MODIS products) [32,61]. The combination of the two tools allowed for an estimated accurate detection for fires ≥6.3 ha. This threshold was higher than the 1 ha threshold obtained when forest services were available, as in Tunisia [13], or the 0.5 to 3 ha threshold observed in European datasets [66]. In the absence of accurate national statistics, our study still improved the detection of small fires compared to the 120 ha minimum fire size reliably captured by global fire products such as MODIS [34]. Moreover, the high temporal resolution of MODIS and VIIRS hotspots allowed the precise dating of fires [54,80] representing more than 60% of the total BA, and provided enough data for daily fire weather assessment. Around 40% of the actual BA was not detected by fire hotspots, in accordance with previous studies [41] where 50% of fires referenced from crowdsourcing were not captured by fire hotspots. Further efforts in performing remote sensing analysis based on ignition reports from forest services should be developed.

4.2. A Unique Bimodal Fire Seasonality in the Mediterranean Basin

From this BA database, we could provide a thorough analysis of the fire regime in Lebanon. Our results revealed a strong seasonality of BA in forests/shrublands characterized by a bimodal distribution over the fire season extending from June to November, consistent with previous studies in the region [79]. The BA was minimal in August (11.32% of the BA in the FS) whilst peaks appeared in the early and late fire season, in July (20.17% of the total BA in the FS) and October–November (44.43% of the total BA in the FS). The high fire activity observed in the early fire season was mostly in shallow-rooted grasslands, as they dry out faster than deep-rooted trees and shrubs at the beginning of the fire season and burn in July. A high intra-annual variability is expected in a Mediterranean-type climate characterized by successions of wet-mild and dry-hot seasons affecting the availability of fuel biomass and water status [4], and consequently fire activity [81]. We could highlight here, however, a particular fire seasonality in Lebanon when compared to the MB. Our first original result was the late end of the fire season, until the end of October or even November, rarely observed in the MB. For example, a standard fire season from June to September is usually assumed for the whole MB [16], omitting these late fires. When looking at country levels across the MB, a fire season from June to September was observed in Tunisia on the southern ridge of the MB [13], extending to October in the most southern part of the country, and from July to August in Italy [82,83], Greece [84], Bulgaria [85], or the Iberian Peninsula [86]. Our main result was the bimodal seasonal fire distribution and the reduced fire activity in August, hardly ever observed in the MB. The largest burnt area is usually observed during August in neighboring countries such as Turkey [87], countries on the Southern MB such as Tunisia [13], Algeria [15], and Morocco, and European Mediterranean countries such as Spain [14]. Similarly to Lebanon, a high fire activity and BA were observed during the late fire season (September–October) in Mediterranean Southern California, driven by the very hot and dry Santa Ana winds blowing during autumn when live vegetation moisture content is minimal [88,89]. Summer fog can also be hypothesized as a potential high-air humidity constraint limiting plant desiccation during summer [90]. In Lebanon, the summer season is the season with the less frequent dry relative air humidity value [79], lowering the fire weather danger that should be carefully investigated in further fire weather analysis.
In line with other previous studies in the Mediterranean region [91,92], we found that the fire activity in Lebanon was driven by severe climatic conditions occurring during the dry season. The relative air humidity seasonality, more so than the FWI, was a good predictor of fire seasonality. A low number of days with dry RH values occurred during August, compared with October–November, during which more days had lower RH values combined with high temperatures, high wind speed, and high DC. Consistent with previous studies in the region [93], we found that the prevailing conditions during October–November caused the occurrence of the largest wildfires over the fire season. At the end of the dry season, the fire weather was intensified by the low moisture content of the forest litter reduced to below 5% [94]. When coupled together, low RH with high WS and drought conditions drove large wildfires [95]. These results could complement the existing current efforts in early fire alert systems: the “RISICO system”, relying on the Fire Weather Index (FWI) [96], implemented in 2011 at the CNRS Remote Sensing center, and the “Fire Danger Forecast” at the University Of Balamand (FireLab, Institute of the Environment) [97] computed from a cross-tabulation between the FWI forecast data provided by the EFFIS (coarse spatial resolution 10–16 km) and Lebanon’s fire risk map [26].

4.3. Interannual Burnt Area and Trends

Based on our data, between 2001 and 2020, we could provide the keystone information that, on average, 0.58% of the wildland cover burnt annually in Lebanon, similarly to France (0.53%) and Greece (0.57%) [98], which is higher than the value observed in Tunisia (0.19%) [13] but considered on the lower range of percentage of wildland burnt in other MB countries such as Algeria (0.85%) [99], Portugal (3.31%), Spain (0.84%), and Italy (1.14%) [98]. We could also conclude on the absence of a significant BA trend, as observed in other non-European Mediterranean countries such as Tunisia, Algeria, and Morocco [13,14,15], but in contrast with the general decreasing BA trend in the Southern European Mediterranean region (Portugal, Spain, Greece, France, Italy) [77,100]. With generally increasing drought conditions [101], the negative trend can be explained by the increasing efforts invested in fire management and prevention in most European Mediterranean countries [10,77,102]. The absence of a trend in Lebanon could be caused by an absence of trend in climatic conditions when the national strategy for forest fire management has not yet been fully implemented [79,103,104]. Fire activity drivers in Lebanon should be further analyzed in future studies, especially as climate change projections in the MB forecast an increase in temperatures and drought conditions, leading to a higher fire risk and larger fires [16,105,106,107], and ongoing social troubles may affect fire hazard more than the climate itself.
In addition to this general result, we could show that Lebanon experienced a high interannual variability of BA, common in MB countries such as Tunisia [13] and neighboring Syria [108]. Extreme fire years were 2007, 2006, and 2019 as previously reported [79]. The high fire activity can be associated with both climatically and anthropogenically unusual events. In 2007, the average conditions in Southern Europe and the Middle East region were warmer (1–2 °C) [109]. During the summer, the region was affected by an intense drought episode well documented in the literature [110], causing major wildfire breakouts not only in North African countries such as Algeria [15] but also in European Mediterranean countries including France, Italy, and Greece [100]. The most documented forest fires were in Greece, and were reported to be the most extensive and destructive in its recent history [111], due to a combination of extreme meteorological events including the intense drought and three consecutive heat waves [112]. While previous studies have shown a significant correlation between BA and summer drought in Mediterranean countries [113], FWI extremes were also high during the high fire activity in 2007 in Lebanon. In the Mount Lebanon governorate, the 2007 fires were reported to destroy as many trees as the total amount burnt during the Lebanese 15 year-long civil war (1975–1990) [103], which gave rise to Lebanon’s National Strategy for Forest Fire Management in 2009, currently being updated for a more efficient application [94]. Beside these climate considerations, the high fire activity in 2006 was accompanied by political and social conflicts and a series of protests and sit-ins that began on 1 December 2006, followed by the “July war of 2006” that lasted about a month from July 12th to August 14th. The July war caused major environmental damages, including direct damage to the Lebanese forests, especially in Southern Lebanon where bombing incineration caused the majority of the forest fire outbreaks as previously reported [114,115,116]. It is interesting to note that in areas of conflict, the use of intended fire as a political means to dislocate civilian populations and military forces, resulting in increased forest fires, has recently been documented (Turkish Kurdistan, Syria, Iraq) [117,118,119,120]. During the July war of 2006, the main bombing locations in Lebanon were the South (South and Nabatiyeh governorates) and the Beqaa valley (Baalbek-Hermel and Beqaa governorates); together they accounted for about 52% of the BA observed. During 2006, the fires were also the largest, reaching more than 670 ha in size. On one hand, the ongoing conflicts caused a shortage in labor supply and the inaccessibility of several agricultural fields, which increased, directly and indirectly, the risk of fires as a result of a change in land use and land cover [121]. On the other hand, firefighting efforts were re-directed towards helping the internal displacement of the population [122]. Ineffective intervention and decreased fire suppression efforts in times of conflict lead to the burning of larger areas [108].

5. Conclusions

The goals of this study were to create an objective and fine-resolution GIS database of fire events, and to date these events by merging satellite sensors and processing tools. We aimed to characterize the fire regime (extent, trend, seasonality, and interannual variability) in Lebanon, a data-scarce area mostly affected by small fires. Our results show that we could improve and reconstruct, with a standardized reproductible method (providing the requested international standards on the data quality), the fire history since 2001 with a precision close to countries with fire service reports, and precising the previous fire reports delivered for the country. This method is potentially transferable to other data-scarce areas, even if ignitions leading to very small fires < 6.3 ha are still missing. Based on this positive experience for the efficiency of semi-automated tools to reconstruct the fire regime for regional studies, this analysis could be extended back to 1984 with the rule-based automated method, and provide yearly updates with higher resolution Sentinel for a long-term observatory in the region. The combination of remote sensing with ground information on the dating and reporting of fire events from fire services should also be enhanced to increase the spatial and temporal accuracy in small fire identification, still poorly represented by global remote sensing datasets, even in fire hotspots.
The release of this database could first reveal the particular fire regime of Lebanon, with a bimodal seasonality and an extended fire season, quite unique in the MB. To strengthen and support this finding, we showed that the seasonality of air-relative humidity and wind speed individually, combined with rare but recurrent prolonged droughts until November, could mostly explain this unusual seasonal fire distribution. The database is available to the scientific community and local institutions for management planning, further understanding and modelling of the spatial-temporal fire hazard, and early warning systems.

Author Contributions

G.M. performed the data acquisition, analysis and writing of the manuscript. N.K. provided Landsat-based semi-automated fire identification. F.M. performed statistical analysis and corrections on the manuscript. G.F. provided national information on fire data. J.A.-G. supervised the climate data acquisition and quality checking. F.M., G.F. and J.A.-G. initiated the study and supervised G.M.’s work. All authors contributed to the final version of the manuscript. All authors have read and agreed to the published version of the manuscript.

Funding

The authors acknowledge the National Council for Scientific Research of Lebanon (CNRS-L) and the University of Montpellier (UM) for granting a doctoral fellowship to Georgia Majdalani. This work was supported by the fire information system in the OSU OREME and IRD MENAFIS specific grant and the ESA FireCCI climate change initiative.

Data Availability Statement

The data presented in this study are available on request from the corresponding author.

Acknowledgments

Landsat data were freely obtained from the U.S. Geological Survey (USGS). The authors acknowledge the use of data from NASA’s Fire Information for Resource Management System (FIRMS), part of NASA’s Earth Observing System Data and Information System (EOSDIS).

Conflicts of Interest

The authors declare no conflict of interest.

References and Note

  1. Paula, S.; Arianoutsou, M.; Kazanis, D.; Tavsanoglu, Ç.; Lloret, F.; Buhk, C.; Ojeda, F.; Luna, B.; Moreno, J.M.; Rodrigo, A. Fire-Related Traits for Plant Species of the Mediterranean Basin. Ecology 2009, 90, 1420. [Google Scholar] [CrossRef]
  2. Dimitrakopoulos, A.P.; Mitsopoulos, I.D. Global Forest Resources Assessment 2005—Report on Fires in the Mediterranean Region; Fire Management Working Papers; FAO: Rome, Italy, 2006; p. 38. [Google Scholar]
  3. Le Houérou, H.N. Fire and Vegetation in the Mediterranean Basin; FAO: Rome, Italy, 1973. [Google Scholar]
  4. Clark, J.S.; Grimm, E.C.; Donovan, J.J.; Fritz, S.C.; Engstrom, D.R.; Almendinger, J.E. Drought Cycles and Landscape Responses to Past Aridity on Prairies of the Northern Great Plains, USA. Ecology 2002, 83, 595–601. [Google Scholar] [CrossRef]
  5. Pellizzaro, G.; Cesaraccio, C.; Duce, P.; Ventura, A.; Zara, P. Relationships between Seasonal Patterns of Live Fuel Moisture and Meteorological Drought Indices for Mediterranean Shrubland Species. Int. J. Wildland Fire 2007, 16, 232–241. [Google Scholar] [CrossRef]
  6. Alexandrian, D.; Esnault, F.; Calabri, G. Forest Fires in the Mediterranean Area. Unasylva 2000, 50, 35–41. [Google Scholar]
  7. Gill, A.M.; Stephens, S.L.; Cary, G.J. The Worldwide “Wildfire” Problem. Ecol. Appl. 2013, 23, 438–454. [Google Scholar] [CrossRef]
  8. Pausas, J.G. Changes in Fire and Climate in the Eastern Iberian Peninsula (Mediterranean Basin). Clim. Chang. 2004, 63, 337–350. [Google Scholar] [CrossRef]
  9. Xanthopoulos, G.; Nikolov, N. Wildfires and Fire Management in the Eastern Mediterranean, Southeastern Europe, and Middle East Regions. Fire Manag. Today 2019, 77, 29–38. [Google Scholar]
  10. Ruffault, J.; Mouillot, F. How a New Fire-Suppression Policy Can Abruptly Reshape the Fire-Weather Relationship. Ecosphere 2015, 6, art199. [Google Scholar] [CrossRef]
  11. San-Miguel-Ayanz, J.; Schulte, E.; Schmuck, G.; Camia, A.; Strobl, P.; Liberta, G.; Giovando, C.; Boca, R.; Sedano, F.; Kempeneers, P. Comprehensive Monitoring of Wildfires in Europe: The European Forest Fire Information System (EFFIS). In Approaches to Managing Disaster Assessing Hazards, Emergencies and Disaster Impacts; Intech Open: London, UK, 2012; p. 176. ISBN 978-953-51-0294-6. [Google Scholar]
  12. Gill, A.M. Fire and the Australian Flora: A Review. Aust. For. 1975, 38, 4–25. [Google Scholar] [CrossRef]
  13. Belhadj-Khedher, C.; Koutsias, N.; Karamitsou, A.; EI-Melki, T.; Ouelhazi, B.; Hamdi, A.; Nouri, H.; Mouillot, F. A Revised Historical Fire Regime Analysis in Tunisia (1985–2010) from a Critical Analysis of the National Fire Database and Remote Sensing. Forests 2018, 9, 59. [Google Scholar] [CrossRef]
  14. Chergui, B.; Fahd, S.; Santos, X.; Pausas, J.G. Socioeconomic Factors Drive Fire-Regime Variability in the Mediterranean Basin. Ecosystems 2018, 21, 619–628. [Google Scholar] [CrossRef]
  15. Aini, A.; Curt, T.; Bekdouche, F. Modelling Fire Hazard in the Southern Mediterranean Fire Rim (Bejaia Region, Northern Algeria). Environ. Monit. Assess. 2019, 191, 747. [Google Scholar] [CrossRef] [PubMed]
  16. Ruffault, J.; Curt, T.; Moron, V.; Trigo, R.M.; Mouillot, F.; Koutsias, N.; Pimont, F.; Martin-StPaul, N.; Barbero, R.; Dupuy, J.-L. Increased Likelihood of Heat-Induced Large Wildfires in the Mediterranean Basin. Sci. Rep. 2020, 10, 13790. [Google Scholar] [CrossRef]
  17. Belhadj-Khedher, C.; El-Melki, T.; Mouillot, F. Saharan Hot and Dry Sirocco Winds Drive Extreme Fire Events in Mediterranean Tunisia (North Africa). Atmosphere 2020, 11, 590. [Google Scholar] [CrossRef]
  18. Faour, G. Forest Fire Fighting in Lebanon Using Remote Sensing and GIS. 2004. Available online: https://www.researchgate.net/publication/310796768_FOREST_FIRE_FIGHTING_IN_LEBANON_USING_REMOTE_SENSING_AND_GIS (accessed on 1 July 2021).
  19. Faour, G.; Kheir, R.; Verdeil, E. Caractérisation Sous Système d’information Géographique Des Incendies de Forêts: L’exemple Du Liban. For. Méditerr. 2006, 27, 339–352. [Google Scholar]
  20. Giordano, G. The Mediterranean Region. In A World Geography of Forest Resources; Ronald Press Company: New York, NY, USA, 1956; pp. 317–552. [Google Scholar]
  21. Faour, G. Evaluating Urban Expansion Using Remotely-Sensed Data in Lebanon. Leban. Sci. J. 2015, 16, 23. [Google Scholar]
  22. Barrett, P.; Appendino, M.; Nguyen, K.; de Leon Miranda, J. Measuring Social Unrest Using Media Reports. J. Dev. Econ. 2020, 158, 102924. [Google Scholar] [CrossRef]
  23. Masri, T.; Khawlie, M.; Faour, G.; Awad, M. Mapping Forest Fire Prone Areas in Lebanon. In Proceedings of the EARSeL 23rd Symposium of “Remote Sensing in Transition–4th International Workshop on Remote Sensing and GIS Applications to Forest Fire Management, Ghent, Belgium, 5–7 June 2003; pp. 109–113. [Google Scholar]
  24. Mhawej, M.; Faour, G.; Abdallah, C.; Adjizian-Gerard, J. Towards an Establishment of a Wildfire Risk System in a Mediterranean Country. Ecol. Inform. 2016, 32, 167–184. [Google Scholar] [CrossRef]
  25. Mitri, G.; Jazi, M.; McWethy, D. Investigating Temporal and Spatial Variability of Wildfire Potential with the Use of Objectbased Image Analysis of Downscaled Global Climate Models. South-East. Eur. J. Earth Observ. Geomat. 2014, 3, 251–254. [Google Scholar]
  26. Mitri, G.; Jazi, M.; McWethy, D. Assessment of Wildfire Risk in Lebanon Using Geographic Object-Based Image Analysis. Photogramm. Eng. Remote Sens. 2015, 81, 499–506. [Google Scholar] [CrossRef]
  27. Giglio, L.; Schroeder, W.; Hall, J.V. MODIS Collection 6 Active Fire Product User’s Guide Revision B; Department of Geographical Sciences, University of Maryland: College Park, MD, USA, 2018; p. 64. [Google Scholar]
  28. Giglio, L.; Boschetti, L.; Roy, D.P.; Humber, M.L.; Justice, C.O. The Collection 6 MODIS Burned Area Mapping Algorithm and Product. Remote Sens. Environ. 2018, 217, 72–85. [Google Scholar] [CrossRef] [PubMed]
  29. Chuvieco, E.; Mouillot, F.; van der Werf, G.R.; San Miguel, J.; Tanase, M.; Koutsias, N.; García, M.; Yebra, M.; Padilla, M.; Gitas, I.; et al. Historical Background and Current Developments for Mapping Burned Area from Satellite Earth Observation. Remote Sens. Environ. 2019, 225, 45–64. [Google Scholar] [CrossRef]
  30. Silva, J.M.; Moreno, M.V.; Le Page, Y.; Oom, D.; Bistinas, I.; Pereira, J.M.C. Spatiotemporal Trends of Area Burnt in the Iberian Peninsula, 1975–2013. Reg. Environ. Chang. 2019, 19, 515–527. [Google Scholar] [CrossRef]
  31. Fornacca, D.; Ren, G.; Xiao, W. Performance of Three MODIS Fire Products (MCD45A1, MCD64A1, MCD14ML), and ESA Fire_CCI in a Mountainous Area of Northwest Yunnan, China, Characterized by Frequent Small Fires. Remote Sens. 2017, 9, 1131. [Google Scholar] [CrossRef]
  32. Roteta, E.; Bastarrika, A.; Padilla, M.; Storm, T.; Chuvieco, E. Development of a Sentinel-2 Burned Area Algorithm: Generation of a Small Fire Database for Sub-Saharan Africa. Remote Sens. Environ. 2019, 222, 1–17. [Google Scholar] [CrossRef]
  33. Nogueira, J.M.; Ruffault, J.; Chuvieco, E.; Mouillot, F. Can We Go beyond Burned Area in the Assessment of Global Remote Sensing Products with Fire Patch Metrics? Remote Sens. 2017, 9, 7. [Google Scholar] [CrossRef]
  34. Giglio, L.; Loboda, T.; Roy, D.P.; Quayle, B.; Justice, C.O. An Active-Fire Based Burned Area Mapping Algorithm for the MODIS Sensor. Remote Sens. Environ. 2009, 113, 408–420. [Google Scholar] [CrossRef]
  35. Anaya, J.A.; Chuvieco, E. Accuracy Assessment of Burned Area Products in the Orinoco Basin. Photogramm. Eng. Remote Sens. 2012, 78, 53–60. [Google Scholar] [CrossRef]
  36. Hawbaker, T.J.; Vanderhoof, M.K.; Beal, Y.-J.; Takacs, J.D.; Schmidt, G.L.; Falgout, J.T.; Williams, B.; Fairaux, N.M.; Caldwell, M.K.; Picotte, J.J. Mapping Burned Areas Using Dense Time-Series of Landsat Data. Remote Sens. Environ. 2017, 198, 504–522. [Google Scholar] [CrossRef]
  37. Padilla, M.; Stehman, S.V.; Chuvieco, E. Validation of the 2008 MODIS-MCD45 Global Burned Area Product Using Stratified Random Sampling. Remote Sens. Environ. 2014, 144, 187–196. [Google Scholar] [CrossRef]
  38. Franquesa, M.; Vanderhoof, M.K.; Stavrakoudis, D.; Gitas, I.Z.; Roteta, E.; Padilla, M.; Chuvieco, E. Development of a Standard Database of Reference Sites for Validating Global Burned Area Products. Earth Syst. Sci. Data 2020, 12, 3229–3246. [Google Scholar] [CrossRef]
  39. Benali, A.; Russo, A.; Sá, A.C.; Pinto, R.; Price, O.; Koutsias, N.; Pereira, J. Determining Fire Dates and Locating Ignition Points with Satellite Data. Remote Sens. 2016, 8, 326. [Google Scholar] [CrossRef]
  40. Chuvieco, E.; Englefield, P.; Trishchenko, A.P.; Luo, Y. Generation of Long Time Series of Burn Area Maps of the Boreal Forest from NOAA–AVHRR Composite Data. Remote Sens. Environ. 2008, 112, 2381–2396. [Google Scholar] [CrossRef]
  41. Çolak, E.; Sunar, F. The Importance of Ground-Truth and Crowdsourcing Data for the Statistical and Spatial Analyses of the NASA FIRMS Active Fires in the Mediterranean Turkish Forests. Remote Sens. Appl. Soc. Environ. 2020, 19, 100327. [Google Scholar] [CrossRef]
  42. Harrison, S.P.; Marlon, J.R.; Bartlein, P.J. Fire in the Earth System. In Changing Climates, Earth Systems and Society; Springer: Berlin/Heidelberg, Germany, 2010; pp. 21–48. [Google Scholar]
  43. Sá, A.C.; Benali, A.; Fernandes, P.M.; Pinto, R.M.; Trigo, R.M.; Salis, M.; Russo, A.; Jerez, S.; Soares, P.M.; Schroeder, W. Evaluating Fire Growth Simulations Using Satellite Active Fire Data. Remote Sens. Environ. 2017, 190, 302–317. [Google Scholar] [CrossRef] [Green Version]
  44. Köppen, W. Die Wärmezonen Der Erde, Nach Der Dauer Der Heissen, Gemässigten Und Kalten Zeit Und Nach Der Wirkung Der Wärme Auf Die Organische Welt Betrachtet. Meteorol. Z. 1884, 1, 5–226. [Google Scholar]
  45. Medail, F.; Quezel, P. Hot-Spots Analysis for Conservation of Plant Biodiversity in the Mediterranean Basin. Ann. Mo. Bot. Gard. 1997, 84, 112–127. [Google Scholar] [CrossRef]
  46. Zohary, M. Geobotanical Foundations of the Middle East; Fischer: Ried im Innkreis, Austria, 1973; ISBN 90-265-0157-9. [Google Scholar]
  47. Olson, D.M.; Dinerstein, E.; Wikramanayake, E.D.; Burgess, N.D.; Powell, G.V.N.; Underwood, E.C.; D’Amico, J.A.; Itoua, I.; Strand, H.E.; Morrison, J.C.; et al. Terrestrial Ecoregions of the World: A New Map of Life on Earth. Bioscience 2001, 51, 933–938. [Google Scholar] [CrossRef]
  48. CNRS-L 2017 Land Cover/Land Use Map of Lebanon Scale 1/20000 2019
  49. Ellair, D.P.; Platt, W.J. Fuel Composition Influences Fire Characteristics and Understorey Hardwoods in Pine Savanna. J. Ecol. 2013, 101, 192–201. [Google Scholar] [CrossRef]
  50. Williamson, G.B.; Black, E.M. High Temperature of Forest Fires under Pines as a Selective Advantage over Oaks. Nature 1981, 293, 643–644. [Google Scholar] [CrossRef]
  51. MOE. Lebanon Country Report on Biodiversity; MOE: Singapore, 2016. [Google Scholar]
  52. Giglio, L.; Van der Werf, G.R.; Randerson, J.T.; Collatz, G.J.; Kasibhatla, P. Global Estimation of Burned Area Using MODIS Active Fire Observations. Atmos. Chem. Phys. 2006, 6, 957–974. [Google Scholar] [CrossRef]
  53. Giglio, L.; Randerson, J.T.; Van der Werf, G.R.; Kasibhatla, P.S.; Collatz, G.J.; Morton, D.C.; DeFries, R.S. Assessing Variability and Long-Term Trends in Burned Area by Merging Multiple Satellite Fire Products. Biogeosciences 2010, 7, 1171–1186. [Google Scholar] [CrossRef]
  54. Pinto, M.M.; Trigo, R.M.; Trigo, I.F.; DaCamara, C.C. A Practical Method for High-Resolution Burned Area Monitoring Using Sentinel-2 and VIIRS. Remote Sens. 2021, 13, 1608. [Google Scholar] [CrossRef]
  55. Giglio, L.; Schroeder, W.; Justice, C.O. The Collection 6 MODIS Active Fire Detection Algorithm and Fire Products. Remote Sens. Environ. 2016, 178, 31–41. [Google Scholar] [CrossRef] [PubMed]
  56. Schroeder, W.; Oliva, P.; Giglio, L.; Csiszar, I.A. The New VIIRS 375 m Active Fire Detection Data Product: Algorithm Description and Initial Assessment. Remote Sens. Environ. 2014, 143, 85–96. [Google Scholar] [CrossRef]
  57. Bastarrika, A.; Alvarado, M.; Artano, K.; Martinez, M.P.; Mesanza, A.; Torre, L.; Ramo, R.; Chuvieco, E. BAMS: A Tool for Supervised Burned Area Mapping Using Landsat Data. Remote Sens. 2014, 6, 12360–12380. [Google Scholar] [CrossRef] [Green Version]
  58. Rouse, J.W.; Haas, R.H.; Schell, J.A.; Deering, D.W.; Harlan, J.C. Monitoring the Vernal Advancement and Retrogradation (Green Wave Effect) of Natural Vegetation; Texas A&M University Remote Sensing Center: College Station, TX, USA, 1973. [Google Scholar]
  59. Key, C.H.; Benson, N.C. The Normalized Burn Ratio (NBR): A Landsat TM Radiometric Measure of Burn Severity; United States Geological Survey, Northern Rocky Mountain Science Center: Bozeman, MT, USA, 1999. [Google Scholar]
  60. Garcia, M.J.L.; Caselles, V. Mapping Burns and Natural Reforestation Using Thematic Mapper Data. Geocarto Int. 1991, 6, 31–37. [Google Scholar] [CrossRef]
  61. Roteta, E.; Bastarrika, A.; Franquesa, M.; Chuvieco, E. Landsat and Sentinel-2 Based Burned Area Mapping Tools in Google Earth Engine. Remote Sens. 2021, 13, 816. [Google Scholar] [CrossRef]
  62. Belgiu, M.; Drăguţ, L. Random Forest in Remote Sensing: A Review of Applications and Future Directions. ISPRS J. Photogramm. Remote Sens. 2016, 114, 24–31. [Google Scholar] [CrossRef]
  63. Koutsias, N.; Pleniou, M. A Rule-Based Semi-Automatic Method to Map Burned Areas in Mediterranean Using Landsat Images—Revisited and Improved. Int. J. Digit. Earth 2021, 14, 1602–1623. [Google Scholar] [CrossRef]
  64. Muñoz-Sabater, J.; Dutra, E.; Agustí-Panareda, A.; Albergel, C.; Arduini, G.; Balsamo, G.; Boussetta, S.; Choulga, M.; Harrigan, S.; Hersbach, H.; et al. ERA5-Land: A State-of-the-Art Global Reanalysis Dataset for Land Applications. Earth Syst. Sci. Data 2021, 13, 4349–4383. [Google Scholar] [CrossRef]
  65. Bak, P.; Tang, C.; Wiesenfeld, K. Self-Organized Criticality. Phys. Rev. A 1988, 38, 364. [Google Scholar] [CrossRef] [PubMed]
  66. Ricotta, C.; Arianoutsou, M.; Dıaz-Delgado, R.; Duguy, B.; Lloret, F.; Maroudi, E.; Mazzoleni, S.; Moreno, J.M.; Rambal, S.; Vallejo, R. Self-Organized Criticality of Wildfires Ecologically Revisited. Ecol. Model. 2001, 141, 307–311. [Google Scholar] [CrossRef]
  67. Royston, J.P. An Extension of Shapiro and Wilk’s W Test for Normality to Large Samples. J. R. Stat. Soc. Ser. C Appl. Stat. 1982, 31, 115–124. [Google Scholar] [CrossRef]
  68. Royston, J.P. Algorithm AS 181: The W Test for Normality. J. Appl. Stat. 1982, 44, 176–180. [Google Scholar] [CrossRef]
  69. Royston, P. Remark AS R94: A Remark on Algorithm AS 181: The W-Test for Normality. J. R. Stat. Soc. Ser. C Appl. Stat. 1995, 44, 547–551. [Google Scholar] [CrossRef]
  70. Becker, R.A.; Chambers, J.M.; Wilks, A.R. The New S Language; Wadsworth & Brooks/Cole; CRC Press: Belmont, CA, USA, 1988; ISBN 978-1-351-09188-6. [Google Scholar]
  71. Chambers, J.M.; Cleveland, W.S.; Tukey, P.A.; Kleiner, B. Graphical Methods for Data Analysis, 1st ed.; Chapman and Hall/CRC: New York, NY, USA, 2017; ISBN 978-1-351-07230-4. [Google Scholar]
  72. Murrell, P. R Graphics; Chapman and Hall/CRC: New York, NY, USA, 2005; ISBN 978-0-429-19610-2. [Google Scholar]
  73. Sen, P.K. Estimates of the Regression Coefficient Based on Kendall’s Tau. J. Am. Stat. Assoc. 1968, 63, 1379–1389. [Google Scholar] [CrossRef]
  74. Catarino, S.; Romeiras, M.M.; Figueira, R.; Aubard, V.; Silva, J.; Pereira, J. Spatial and Temporal Trends of Burnt Area in Angola: Implications for Natural Vegetation and Protected Area Management. Diversity 2020, 12, 307. [Google Scholar] [CrossRef]
  75. Pausas, J.G.; Keeley, J.E. Epicormic Resprouting in Fire-Prone Ecosystems. Trends Plant Sci. 2017, 22, 1008–1015. [Google Scholar] [CrossRef]
  76. Syphard, A.D.; Keeley, J.E.; Pfaff, A.H.; Ferschweiler, K. Human Presence Diminishes the Importance of Climate in Driving Fire Activity across the United States. Proc. Natl. Acad. Sci. USA 2017, 114, 13750–13755. [Google Scholar] [CrossRef]
  77. Turco, M.; Bedia, J.; Di Liberto, F.; Fiorucci, P.; Von Hardenberg, J.; Koutsias, N.; Llasat, M.-C.; Xystrakis, F.; Provenzale, A. Decreasing Fires in Mediterranean Europe. PLoS ONE 2016, 11, e0150663. [Google Scholar] [CrossRef] [PubMed]
  78. Karouni, A.; Daya, B.; Bahlak, S. A Comparative Study to Find the Most Applicable Fire Weather Index for Lebanon Allowing to Predict a Forest Fire. J. Comput. Commun. 2013, 10, 1403–1409. [Google Scholar]
  79. Salloum, L.; Mitri, G. Assessment of the Temporal Pattern of Fire Activity and Weather Variability in Lebanon. Int. J. Wildland Fire 2014, 23, 503–509. [Google Scholar] [CrossRef]
  80. Boschetti, L.; Roy, D.P.; Justice, C.O.; Humber, M.L. MODIS–Landsat Fusion for Large Area 30m Burned Area Mapping. Remote Sens. Environ. 2015, 161, 27–42. [Google Scholar] [CrossRef]
  81. Bradstock, R.A. A Biogeographic Model of Fire Regimes in Australia: Current and Future Implications. Glob. Ecol. Biogeogr. 2010, 19, 145–158. [Google Scholar] [CrossRef]
  82. Bajocco, S.; Ferrara, C.; Guglietta, D.; Ricotta, C. Easy-to-Interpret Procedure to Analyze Fire Seasonality and the Influence of Land Use in Fire Occurrence: A Case Study in Central Italy. Fire 2020, 3, 46. [Google Scholar] [CrossRef]
  83. Michetti, M.; Pinar, M. Forest Fires across Italian Regions and Implications for Climate Change: A Panel Data Analysis. Environ. Resour. Econ. 2019, 72, 207–246. [Google Scholar] [CrossRef] [Green Version]
  84. Salvati, L.; Ranalli, F. ‘Land of Fires’: Urban Growth, Economic Crisis, and Forest Fires in Attica, Greece. Geogr. Res. 2015, 53, 68–80. [Google Scholar] [CrossRef]
  85. Nojarov, P.; Nikolova, M. Heat Waves and Forest Fires in Bulgaria. Nat. Hazards 2022, 1–21. [Google Scholar] [CrossRef]
  86. Calheiros, T.; Nunes, J.P.; Pereira, M.G. Recent Evolution of Spatial and Temporal Patterns of Burnt Areas and Fire Weather Risk in the Iberian Peninsula. Agric. For. Meteorol. 2020, 287, 107923. [Google Scholar] [CrossRef]
  87. Im, U.; Onay, T.; Yeniguin, O.; Anteplioglu, U.; Incecik, S.; Toppu, S.; Kambezidis, H.; Kaskaoutis, D.; Kassomenos, P.; Melas, D. An Overview of Forest Fires and Meteorology in Turkey and Greece. In Proceedings of the 2006 First International Symposium on Environment Identities and Mediterranean Area, Ajaccio, France, 10–13 July 2006; pp. 62–67. [Google Scholar]
  88. Keeley, J.E.; Safford, H.; Fotheringham, C.J.; Franklin, J.; Moritz, M. The 2007 Southern California Wildfires: Lessons in Complexity. J. For. 2009, 107, 287–296. [Google Scholar] [CrossRef]
  89. Keeley, J.E.; Fotheringham, C.J. Historic Fire Regime in Southern California Shrublands. Conserv. Biol. 2001, 15, 1536–1548. [Google Scholar] [CrossRef]
  90. Emery, N.C.; D’Antonio, C.M.; Still, C.J. Fog and Live Fuel Moisture in Coastal California Shrublands. Ecosphere 2018, 9, e02167. [Google Scholar] [CrossRef]
  91. Amraoui, M.; Liberato, M.L.R.; Calado, T.J.; DaCamara, C.C.; Coelho, L.P.; Trigo, R.M.; Gouveia, C.M. Fire Activity over Mediterranean Europe Based on Information from Meteosat-8. For. Ecol. Manage. 2013, 294, 62–75. [Google Scholar] [CrossRef]
  92. Pereira, M.G.; Trigo, R.M.; DaCamara, C.C.; Pereira, J.M.C.; Leite, S.M. Synoptic Patterns Associated with Large Summer Forest Fires in Portugal. Agric. For. Meteor 2005, 129, 11–25. [Google Scholar] [CrossRef]
  93. AUB-IFI Forest Fires in Lebanon: A Recurring Disaster. 2019. Available online: https://www.aub.edu.lb/ifi/Documents/publications/infographics/2019-2020/20191220_october_forest_fires.pdf (accessed on 1 July 2021).
  94. Mitri, G. Lebanon’s National Forest Fire Management Strategy; AFDC: Beirut, Lebanon, 2009. [Google Scholar]
  95. Ruffault, J.; Moron, V.; Trigo, R.M.; Curt, T. Daily Synoptic Conditions Associated with Large Fire Occurrence in Mediterranean France: Evidence for a Wind-Driven Fire Regime. Int. J. Climatol. 2017, 37, 524–533. [Google Scholar] [CrossRef]
  96. D’Andrea, M.; Fiorucci, P.; Gaetani, F.; Negro, D. RISICO: A Decision Support System (DSS) for Dynamic Wildfire Risk Evaluation in Italy. EGU Gen. Assem. 2010, 2010, 11102. [Google Scholar]
  97. Mitri, G. Advancing Lebanons Fire Danger Forecast; Limassol, Cyprus. 2015. Available online: https://scholarhub.balamand.edu.lb/handle/uob/967 (accessed on 1 July 2021).
  98. Sahar, O. Les Feux de Forêt en Algérie: Analyse du Risque, Etude des Causes, Evaluation du Dispositif de Défense et des Politiques de Gestion. Ph.D. Thesis, Université de Tizi Ouzou-Mouloud Mammeri, Tizi Ouzou, Algeria, 2014. [Google Scholar]
  99. Meddour-Sahar, O.; Derridj, A. Bilan des feux de forêts en Algérie: Analyse spatio-temporelle et cartographie du risque (période 1985-2010). Sci. Changements Planétaires/Sécheresse 2012, 23, 133–141. [Google Scholar] [CrossRef]
  100. San-Miguel-Ayanz, J.; Rodrigues, M.; de Oliveira, S.S.; Pacheco, C.K.; Moreira, F.; Duguy, B.; Camia, A. Land Cover Change and Fire Regime in the European Mediterranean Region. In Post-Fire Management and Restoration of Southern European Forests; Managing Forest Ecosystems; Springer: Dordrecht, The Netherlands, 2012; Volume 24, pp. 21–43. ISBN 978-94-007-2208-8. [Google Scholar]
  101. Gudmundsson, L.; Seneviratne, S.I. Anthropogenic Climate Change Affects Meteorological Drought Risk in Europe. Environ. Res. Lett. 2016, 11, 044005. [Google Scholar] [CrossRef]
  102. Moreno, M.V.; Conedera, M.; Chuvieco, E.; Pezzatti, G.B. Fire Regime Changes and Major Driving Forces in Spain from 1968 to 2010. Environ. Sci. Policy 2014, 37, 11–22. [Google Scholar] [CrossRef]
  103. AUB-IFI. A Case Study on Lebanon’s National Strategy for Forest Fire Management; AUB Issam Fares Institute for Public Policy and International Affairs: Beirut, Lebanon, 2011; p. 13. [Google Scholar]
  104. Kallab, A. Analyzing Lebanon’s Vulnerability Using the PAR Model Case Study: The October 2019 Forest Fires. Presented at the Course: DEVP005 Disaster Risk Reduction in Cities, Berlin, Germany. 2020. Available online: https://www.researchgate.net/profile/Antoine-Kallab/publication/338956235_Analyzing_Lebanon’s_vulnerability_using_the_PAR_model_Case_study_The_October_2019_forest_fires/links/5e34c477a6fdccd9657c04bb/Analyzing-Lebanons-vulnerability-using-the-PAR-model-Case-study-The-October-2019-forest-fires.pdf (accessed on 1 July 2021).
  105. Bedia, J.; Herrera, S.; San Martín, D.; Koutsias, N.; Gutiérrez, J.M. Robust Projections of Fire Weather Index in the Mediterranean Using Statistical Downscaling. Clim. Change 2013, 120, 229–247. [Google Scholar] [CrossRef]
  106. Dai, A. Increasing Drought under Global Warming in Observations and Models. Nat. Clim. Change 2013, 3, 52–58. [Google Scholar] [CrossRef]
  107. Sousa, P.M.; Trigo, R.M.; Pereira, M.G.; Bedia, J.; Gutiérrez, J.M. Different Approaches to Model Future Burnt Area in the Iberian Peninsula. Agric. For. Meteorol. 2015, 202, 11–25. [Google Scholar] [CrossRef]
  108. Zubkova, M.; Giglio, L.; Humber, M.L.; Hall, J.V.; Ellicott, E. Conflict and Climate: Drivers of Fire Activity in Syria in the 21St Century. Earth Interact. 2021, 25, 119–135. [Google Scholar] [CrossRef]
  109. Luterbacher, J.; Liniger, M.A.; Menzel, A.; Estrella, N.; Della-Marta, P.M.; Pfister, C.; Rutishauser, T.; Xoplaki, E. Exceptional European Warmth of Autumn 2006 and Winter 2007: Historical Context, the Underlying Dynamics, and Its Phenological Impacts. Geophys. Res. Lett. 2007, 34, 62–75. [Google Scholar] [CrossRef]
  110. Trigo, R.M.; Gouveia, C.M.; Barriopedro, D. The Intense 2007–2009 Drought in the Fertile Crescent: Impacts and Associated Atmospheric Circulation. Agric. For. Meteorol. 2010, 150, 1245–1257. [Google Scholar] [CrossRef]
  111. Koutsias, N.; Arianoutsou, M.; Kallimanis, A.S.; Mallinis, G.; Halley, J.M.; Dimopoulos, P. Where Did the Fires Burn in Peloponnisos, Greece the Summer of 2007? Evidence for a Synergy of Fuel and Weather. Agric. For. Meteorol. 2012, 156, 41–53. [Google Scholar] [CrossRef]
  112. Gouveia, C.M.; Bistinas, I.; Liberato, M.L.R.; Bastos, A.; Koutsias, N.; Trigo, R. The Outstanding Synergy between Drought, Heatwaves and Fuel on the 2007 Southern Greece Exceptional Fire Season. Agric. For. Meteorol. 2016, 218–219, 135–145. [Google Scholar] [CrossRef]
  113. Turco, M.; von Hardenberg, J.; AghaKouchak, A.; Llasat, M.C.; Provenzale, A.; Trigo, R.M. On the Key Role of Droughts in the Dynamics of Summer Fires in Mediterranean Europe. Sci. Rep. 2017, 7, 81. [Google Scholar] [CrossRef]
  114. FAO. FAO Achievements in Lebanon 1976–2011; FAO: Rome, Italy, 2011. [Google Scholar]
  115. MoE/UNDP/GEF National Greenhouse Gas Inventory Report and Mitigation Analysis for the Land Use, Land-Use Change and Forestry Sector in Lebanon. 2015. Available online: https://climatechange.moe.gov.lb/viewfile.aspx?id=223 (accessed on 1 July 2021).
  116. UNDP. UNDP’s Participation in Lebanon’s Recovery in the Aftermath of the July 2006 War; UNDP: New York, NY, USA, 2007. [Google Scholar]
  117. De Vos, H.; Jongerden, J.; Van Etten, J. Images of War: Using Satellite Images for Human Rights Monitoring in Turkish Kurdistan. Disasters 2008, 32, 449–466. [Google Scholar] [CrossRef]
  118. Mahfoud, I. The Impact of Syrian Crisis on the Forestry Areas in North Latakia Governorate. SJAR 2020, 7, 467–477. [Google Scholar]
  119. Rasul, A.; Ibrahim, G.R.F.; Hameed, H.M.; Tansey, K. A Trend of Increasing Burned Areas in Iraq from 2001 to 2019. Environ. Dev. Sustain. 2021, 23, 5739–5755. [Google Scholar] [CrossRef]
  120. Van Etten, J.; Jongerden, J.; de Vos, H.J.; Klaasse, A.; van Hoeve, E.C.E. Environmental Destruction as a Counterinsurgency Strategy in the Kurdistan Region of Turkey—ScienceDirect. Geoforum 2008, 39, 1786–1797. [Google Scholar] [CrossRef]
  121. Mitri, G.; Nader, M.; Van der Molen, I.; Lovett, J. Evaluating Fire Risk Associated with Repetitive Armed Conflicts; Spano, D., Bacciu, V., Salis, M., Sirca, C., Eds.; Faculty of Behavioural, Management and Social Sciences: Enschede, The Netherlands, 2012; pp. 205–210. [Google Scholar]
  122. Association for Forest, Development and Conservation. War Impact on Forest Resources and Olive Groves in South Lebanon: Final Report, May 2007; Association for Forest, Development and Conservation: Beirut, Lebanon, 2007; Available online: http://www.worldcat.org/title/788189860 (accessed on 1 July 2021).
Figure 2. Location of fire events in Lebanon for the period 2001–2020, presented in intervals of 5 years (2001–2005: yellow, 2006–2010: light brown, 2011–2015: red, and 2016–2020: dark brown).
Fire 05 00141 g002
Figure 3. Fire frequency in Lebanon for the period 2001–2020.
Fire 05 00141 g003
Figure 4. Fire size distribution plot for Lebanon comparing fire number (Y-axis, log10 scale) and fire size (X-axis, log 10 scale, ha). The fitted linear regression for fire size > 6.3 ha (=0.8 on a log scale) is represented in red.
Fire 05 00141 g004
Figure 5. A number of big fires as captured by ESA FireCCI51 (blue polygons) compared to our method (red polygons) in (a) 2006 and (b) 2010.
Fire 05 00141 g005
Figure 6. (a) the annual number of fires (blue) and burnt area (BA) (Y-axis) in forest/shrublands (dark green) and grasslands (light green); (b) boxplots representing the yearly median, standard deviation, 95% confidence interval and outliers of fire size (Y-axis, log10scale, ha) in Lebanon for the period 2001–2020.
Fire 05 00141 g006
Figure 7. (a) The average monthly number of fires (blue) and burnt area (ha) (Y-axis) in forests/shrublands (dark green) and grasslands (light green); (b) boxplots representing the monthly median, standard deviation, 95% confidence interval and outliers of fire size (Y-axis, log10 scale, ha) in Lebanon for the 2001–2020 period.
Fire 05 00141 g007
Figure 8. Median, standard deviation, 95% confidence interval, and outliers of monthly values of (a) DC and (b) FWI in Lebanon for the period 2001–2020.
Fire 05 00141 g008
Figure 9. Median, standard deviation, 95% confidence interval, and outliers of monthly values of (a) temperature (C), (b) relative humidity (%), (c) wind speed (m/s), and (d) total daily precipitation (mm) in Lebanon for the period 2001–2020.
Fire 05 00141 g009
Figure 10. Median, standard deviation, 95% confidence interval, and outliers of yearly values of FWI in Lebanon for the period 2001–2020.
Fire 05 00141 g010
Table 1. Forests/shrubland and grassland cover (103 ha) in Lebanon per governorate (adapted from [48]) and their respective percentage cover.
AkkarBaalbek-HermelBeqaaMount-LebanonNabatiyehNorthSouth
Total Area (103 ha)79.0285.3141.3197.3110.0118.792.4
Forests and Shrubs (103 ha)27.271.528.380.129.340.228.8
% of Forests and shrubs34.425.020.040.626.633.931.1
Grass (103 ha)2.92.76.29.411.43.56.1
% of Grass3.60.94.34.710.32.96.6
Table 2. Burnt area (BA 103 ha) and percentage of BA per year, per governorate and vegetation type for Lebanon for the period 2001–2020.
AkkarBaalbek-HermelBeqaaMount-LebanonNabatiyehNorthSouthTotal
BA (103 ha)10.51.210.729.4613.13.392.4540.9
% of BA25.82.91.823.132.18.36100
% wildland burnt.year−11.750.080.10.521.610.380.350.58
% forests and shrubs burnt.year−10.820.040.070.51.120.310.250.39
% grass burnt.year−110.670.920.220.752.861.190.81.97
Table 3. Yearly fire number for the period 2001–2020 in Lebanon from different sources: UOB/MoE (adapted from http://ioe-firelab.balamand.edu.lb/pages/ProfileCountryAnnex5.aspx, accessed on 1 July 2021) and the national fire inventory (Adapted from [18]) compared to our new database. NA: unavailable data.
Dataset2001200220032004200520062007200820092010
This study (all fires)96146716411642063960130
This study (fires ≥ 5 ha)94143596010612043859125
UOB/MoENANANANANANANA179157295
National fire inventory39326542075569675666675507370578
Dataset2011201220132014201520162017201820192020
This study (all fires)54311144459114316811568
This study (fires ≥ 5 ha)5222106415110322429851
UOB/MoE5395501528519979855NA
National fire inventory355429466NANANANANANANA
Table 4. Yearly burnt area (103 ha) for the period 2001–2020 in Lebanon from different sources: UOB/MoE (Adapted from http://ioe-firelab.balamand.edu.lb/pages/ProfileCountryAnnex5.aspx, accessed on 1 July 2021), ESA FireCCI51 [29,30], and MCD64A1 [28] compared to our new database. NA: unavailable data.
Dataset2001200220032004200520062007200820092010
This study1.653.301.491.130.254.305.761.151.344.29
ESA FireCC5101.080.911.240.217.404.700.111.673.57
UOB/MoENANANANANANANA0.830.774.31
MCD64A10000.2401.121.15000.59
Dataset2011201220132014201520162017201820192020
This study1.191.092.460.711.221.940.420.673.013.52
ESA FireCC510.130.880.850.230.511.500.240.431.04NA
UOB/MoE0.250.840.15 1.810.601.430.230.130.90NA
MCD64A100.100.3100.1400.1201.17NA
Table 5. Monthly average BA (±SD) (ha) and monthly average NBF (number of fires; ≥5 ha) (±SD) in Lebanon during the fire season for the period 2001–2020. SD: standard deviation.
Fire SeasonMonthly BA (ha)±SD (ha)Monthly NBF±SD
June38.174.25.38.3
July61105.75.55.3
August30.246.74.74.6
September36.364.55.65.4
October57.41064.75.9
November64.3125.21.22.3
Publisher’s Note: MDPI stays neutral with regard to jurisdictional claims in published maps and institutional affiliations.

