Article

In-Depth Assessment of Cross-Passage Critical Velocity for Smoke Control in Large-Scale Railway Tunnel Fires

by
Timothy Bo Yuan Chen
1,
Anthony Chun Yin Yuen
1,
Ivan Miguel De Cachinho Cordeiro
1,
Hengrui Liu
1,
Ruifeng Cao
2,
Amy Ellison
1 and
Guan Heng Yeoh
1,3,*
1
School of Mechanical and Manufacturing Engineering, University of New South Wales, Sydney, NSW 2052, Australia
2
Department of Architecture and Civil Engineering, City University of Hong Kong, 88 Tat Chee Avenue, Kowloon, Hong Kong
3
Australian Nuclear Science and Technology Organization (ANSTO), Lucas Heights, NSW 2234, Australia
*
Author to whom correspondence should be addressed.
Fire 2022, 5(5), 140; https://doi.org/10.3390/fire5050140
Submission received: 24 August 2022 / Revised: 8 September 2022 / Accepted: 14 September 2022 / Published: 20 September 2022
(This article belongs to the Special Issue Compartment Fire and Safety)

Abstract

:
Demand for underground railways has rapidly increased due to accelerated urbanisation and population growth. This has elevated the importance of tunnel designs with adequate fire safety and protection measures. However, due to intricate modern rail tunnel designs, prescriptive codes are often difficult to implement and lead to over-conservative design. In this study, the current state of tunnel fire analysis was reviewed with a focus on Australia. A large-eddy simulation (LES)-based fire model was applied to investigate the temperature and smoke dispersion from a 2 MW metro tunnel fire case scenario to the cross-passage. A total of 28 cases with various cross-passage ventilation settings were examined, including longitudinal tunnel velocity, cross-passage velocity, train location relative to the cross-passage and fire location. The modelling showed that a 0.84 m/s critical velocity was sufficient for smoke control in the cross-passage. Furthermore, two empirical methods for cross-passage critical velocity were performed, which showed utilisation of the Froude number produced a less conservative critical velocity (0.610 m/s) compared to the dimensionless method (0.734 m/s). Nevertheless, both numerical and empirical results were significantly lower than the standard 1.0 m/s minimum flow rate for smoke control (AS1668.1). The results provide preliminary evidence towards the need for revision of current tunnel fire standards and response protocols.

1. Introduction

Fire safety in underground rail tunnels has gained heightened interest in the past few decades because of catastrophic tunnel fires internationally and an increasing number of metropolitan rail tunnel projects [1,2]. For example, the Kaprun disaster in Austria (2000) killed 155 people when most occupants fled upward away from the fire. In Australia, recent rail tunnel projects include the now operational Sydney Metro Northwest and the 9-kilometre twin rail tunnel Melbourne Metro project, which is expected to be completed in late 2025. Therefore, the continual optimisation of fire safety strategies and ensuring the safe evacuation of passengers during an emergency scenario for rail tunnels is paramount. A primary aspect of passenger evacuation in tunnels is cross-passages connecting twin-bore tunnels and allowing safe passage from the incident to the non-incident bore during an emergency. In an underground rail tunnel fire emergency, it is essential that no smoke enters the cross-passages to ensure the safety of rail tunnel occupants during evacuation [3]. Therefore, understanding how smoke propagates throughout a cross-passage under different scenarios and, subsequently, the minimum velocity in a rail-tunnel cross-passage prevents smoke ingress (known as the critical velocity for a cross-passage) becomes imperative. If the airflow rate through the cross-passage in the direction from non-incident to incident bore is too low, smoke ingress in the cross-passage and into the non-incident bore occurs. Nevertheless, if the incoming ambient air velocity is too high, the ventilation strategy becomes too conservative, leading to excessive installations of jet fans and greater axial fan capacity associated with higher financial costs. Therefore, determining the correct critical velocity is critical for the design of optimal ventilation strategies.
In accordance with AS1668.1 [4], a cross-passage door of 1.0 m/s is required for tunnel designs. This ensures that no smoke and asphyxiant gases recirculate back to the cross-passage, which applies to the twin-bore tunnels typically found in Australia. An additional consideration is the pressure differentials between bores, which will influence the critical velocity in the cross-passage. As a rule of thumb, the incident bore will have a lower pressure than the non-incident bore during an emergency. The pressure gradient between the main tunnel and the cross-passage must not be too high; otherwise, rail tunnel occupants will be unable to open the cross-passage door. The incident tunnel pressure subtracted from the non-incident tunnel pressure is positive to prevent smoke from travelling into the non-incident bore. However, adopting a single critical velocity criterion for all underground transport designs is excessively conservative. Furthermore, recent papers have developed revised methods to calculate the minimum velocity across the cross-passage door to prevent smoke ingress into the cross-passage from the incident bore [5].
In this article, the current state of tunnel fire analysis is extensively reviewed. The primary objectives of this work are to (i) gain a deeper understanding of smoke behaviour in rail tunnel cross-passages under different fire scenarios and (ii) to determine whether Australia’s current standard (i.e., AS1668.1:2015) pertaining to the minimum flow rate for smoke control through a cross-passage door during a fire scenario is suitably applied and whether a revision of AS1668.1 is required. A large-eddy simulation (LES)-based fire field model will be utilised to model the smoke behaviour in a typical Australian rail tunnel with a cross-passage. A comprehensive parametric study will be performed on critical factors influencing the minimum smoke control velocity through the cross-passage. These include longitudinal tunnel velocity, cross-passage velocity, fire location and train head location with respect to the cross-passage. Furthermore, the results will be analysed in comparison to the required critical velocities calculated from well-established empirical methodologies.

2. Current State of Tunnel Fire Smoke Control

When a fire develops and smoke propagates in a tunnel, backlayering occurs when smoke travels upstream of the fire, as illustrated in Figure 1. In most cases, this will also be against mechanically driven ventilation (Figure 1b). The length of backlayering ( L b ) depends on the magnitude of the ventilation velocity. Backlayering adversely impacts the evacuation of occupants upstream of the incident tunnel and fire rescue efforts. Furthermore, project requirements usually state that no backlayering is to occur during a fire incident. Therefore, a sufficient air flow rate must be provided to prevent backlayering. This adequate airflow is known as critical velocity ( V c ) and is the most well investigated phenomenon in tunnel fire research [6]. Over the past three decades, extensive small and large-scale experiments have been conducted to study this phenomenon and establish mathematical correlations [7,8]. Some of the most well-documented fire tests include the Memorial tunnel fire tests [9,10], Runehamar tunnel fire tests [11,12,13], Yuanjiang tunnel fire tests [14] and the EUREKA programme [15,16]. These fire tests also provided the foundation for structural fire protection in tunnels and the establishment of fire curves to standardise fire resistance for tunnel lining [17]. It is another important aspect of tunnel fire safety that affects human safety as well as the social economic costs associated with traffic disruption and infrastructure resilience.
The critical velocity is primarily dependent on the fire size, tunnel dimensions (i.e., aspect ratio, cross-sectional area), slope of the tunnel and the Froude number ( F r ) [18]. Furthermore, as can be seen in Figure 1d, there is a certain velocity threshold (i.e., around 3 m/s) where no increase in ventilation would be required to control the smoke from fires with more significant heat release rates (HRR) [19]. Based on experimental data, many semi-empirical models have been developed to calculate the critical velocity. These methods will be further explored in Section 2.2.
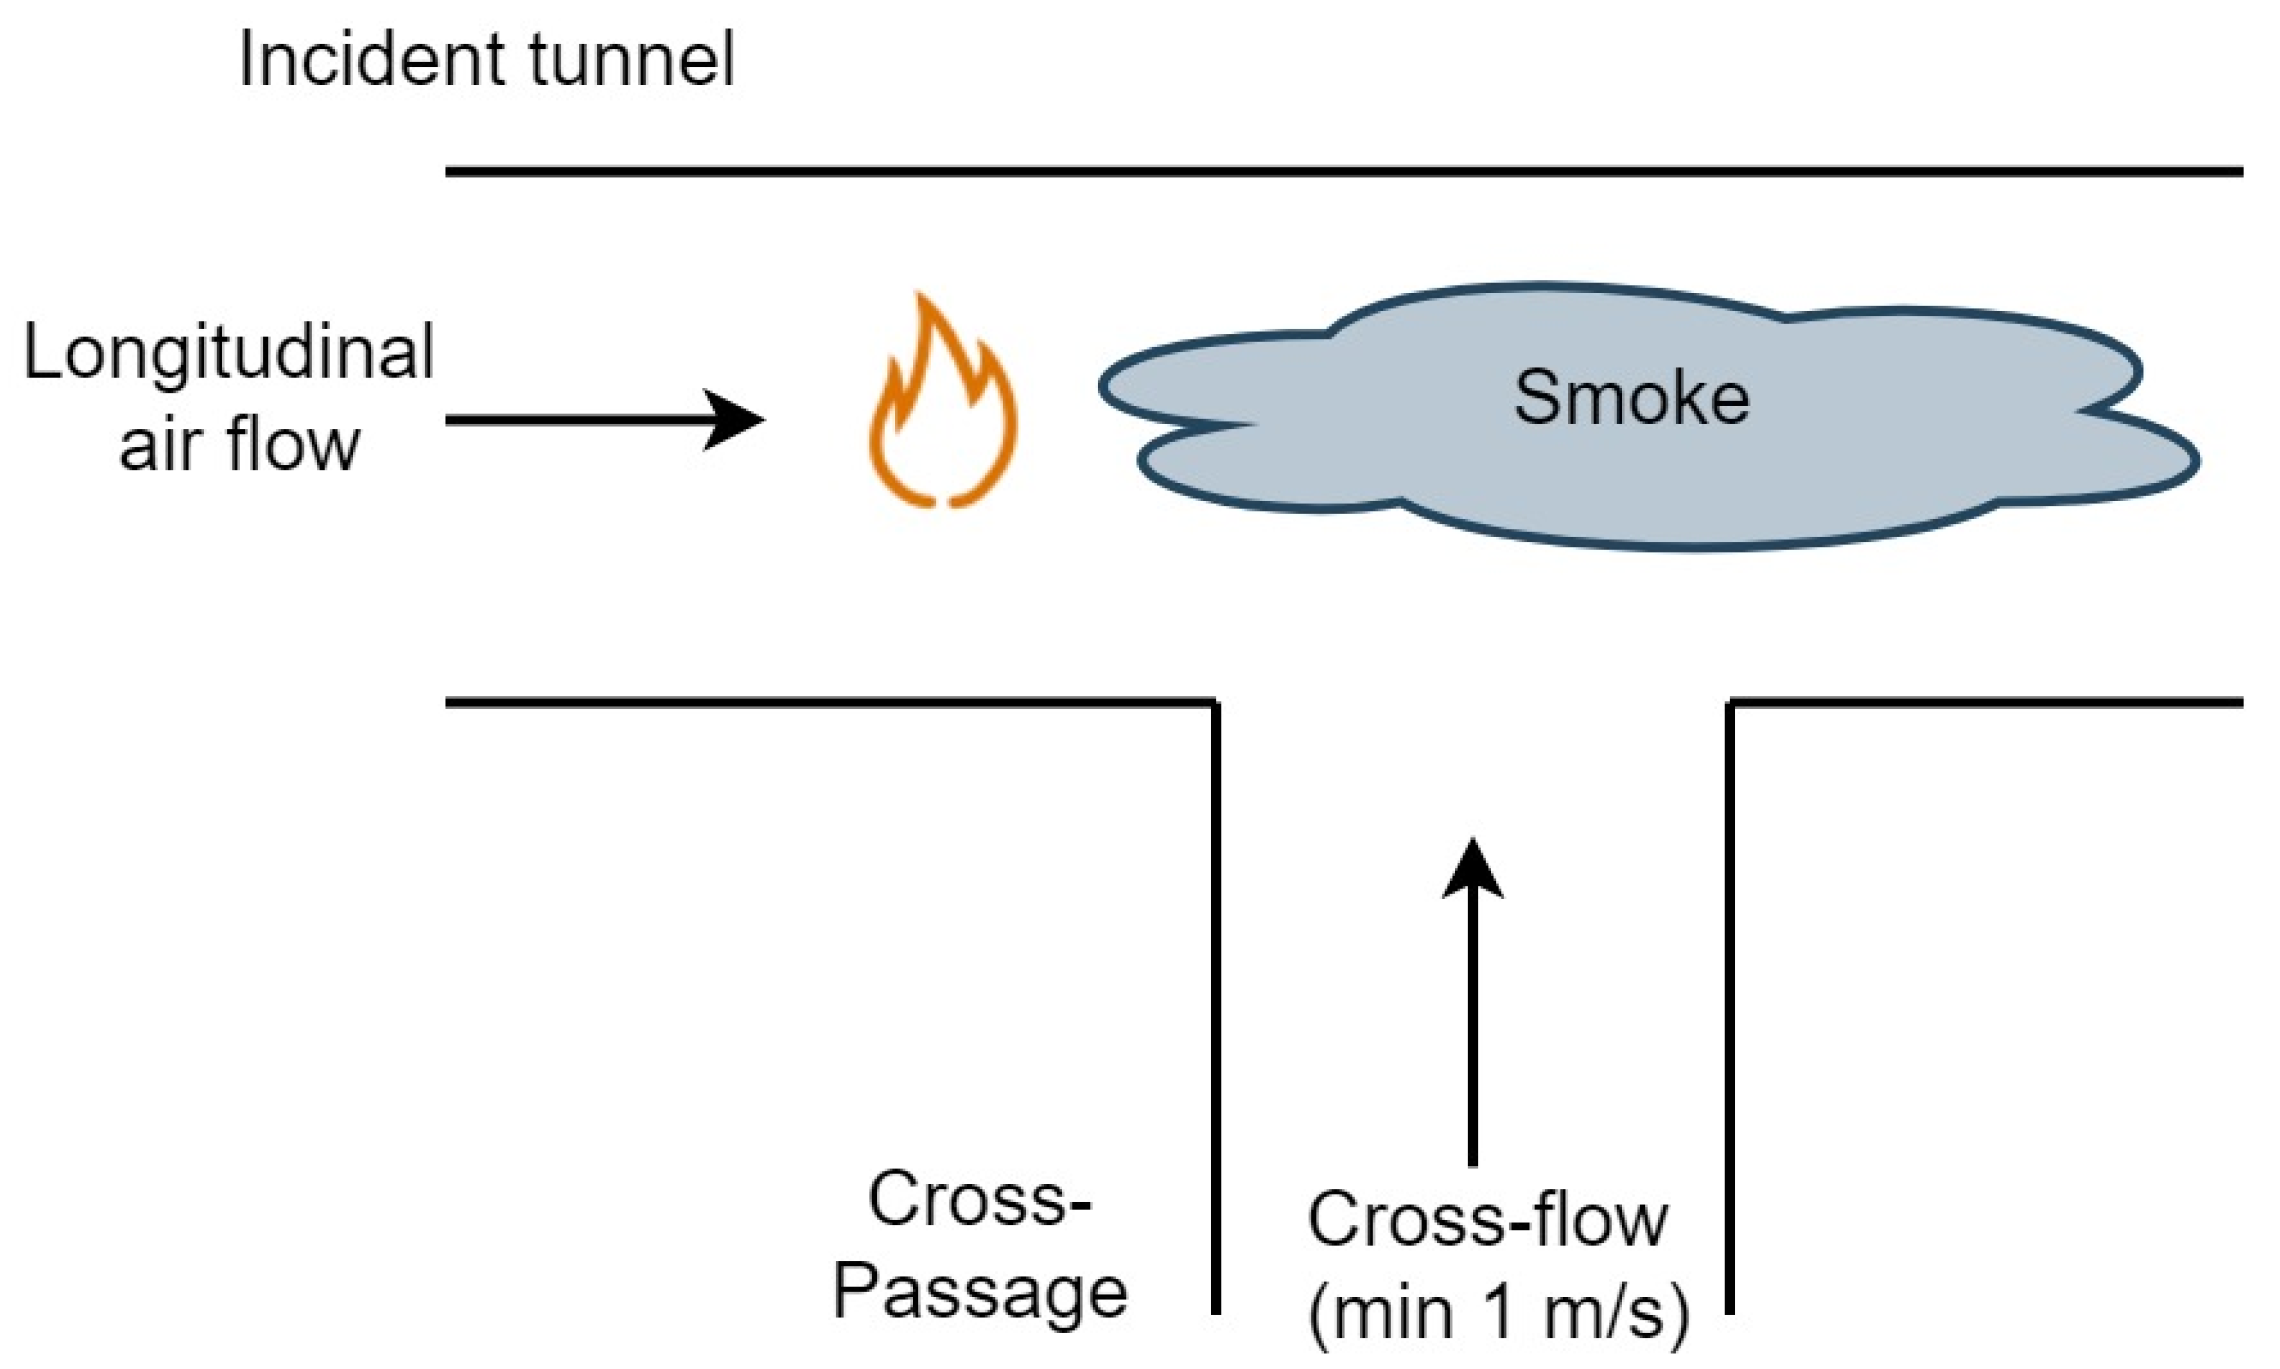
Regarding government regulations, Australian Standards allow national uniformity when designing and constructing infrastructure. As mentioned previously, AS1668.1:2015 states that the minimum airflow rate across a doorway leading into a fire-isolated exit shaft from a fire-affected compartment is no less than 1.0 m/s. For an underground rail tunnel, this means the minimum velocity (also referred to as the critical velocity) to prevent smoke ingress through an open cross-passage from a fire-affected rail tunnel bore is 1.0 m/s, as illustrated below in Figure 2. This requirement must be met during the most demanding scenario, usually in the early stages of a fire. This approach is straightforward and requires no calculations or standard fire testing. In contrast, the NFPA standards concerning fire safety for road tunnels, bridges and other limited-access highways (i.e., NFPA 502 [20]) provide an equation to calculate the required minimum velocity based on the tunnel geometry, fire size, Froude number factor and the fire site gas average temperature. The NFPA approach offers performance-based specifications, allowing for greater flexibility in fire safety designs. Control of hot smoke by ensuring critical velocity is also implemented in Asia, Africa and the Middle East via NFPA 502.
European approaches do not rely upon high tunnel air velocities to prevent any upstream propagation of a hot smoke layer. It adopts a ‘low velocity’ philosophy to reduce smoke propagation rates, the risk of fire spread and to allow tenable self-rescue conditions as far as possible, including downwind of the fire [21,22,23]. For example, the PIARC [21] (World Road Association) recommends applying a low velocity in the range of 1.0–1.5 m/s upstream of the fire for bi-directional tunnels and tunnels with unidirectional traffic. This approach is implemented in several national regulations, such as in Germany ((RABT, 2016 [24]), Switzerland (ASTRA 13001, 2008 [25]) and Austria (RVS 09.02.31, 2014 [26])). These velocities present an acceptable trade-off between backlayering and moderate smoke velocities downstream of the fire. Regarding cross-passage ventilation, the RWS (Rijkswaterstaat, Netherland Ministry of Infrastructure and Water Management) requires the average air velocity through emergency exit doors to be at least 0.75 m/s [27], similar to AS1668.1.

2.1. Critical Velocity in the Incident Tunnel and Cross-Passage

The past two decades have seen a gradual revision in calculating the critical velocity. The first and most widely used relationship to determine the critical velocity which prevents the backlayering of smoke in a tunnel is the non-dimensional Froude number analogy [7]. The critical Froude number F r c relates to the ratio of the fire’s buoyancy forces to the inertial forces from the applied ventilation airflow, as shown in Equation (1).
F r c = Δ ρ g H ρ V c 2
where ρ is the density, g is the gravity and H is the height of tunnel cross-section. Using this idealised relationship, the proposed critical velocity V c is shown in Equation (2).
V c = k ( g Q ˙ c H ρ c p T f A ) 1 3
T f = Q ˙ c ρ c p A V c + T o
where Q ˙ c is the convective heat release rate, c p is the specific heat of air, A is the tunnel cross-sectional area, T f is the average smoke temperature around the fire and T o is the ambient temperature. In the original work by Thomas [7], the formula was validated on fire testing in a horizontal, 30 × 30 cm cross-sectional scaled wind tunnel, and it was concluded that the critical Froude number F r c is 1. However, it is important to note that F r c = 1 cannot be applied universally because (i) it is biased towards the experimental conditions which were conducted at a significantly reduced scale, (ii) the relationship assumes the smoke to be fully mixed instantaneously, which will not occur for a wide tunnel but still may be applicable for the small cross-sectional area of rail tunnels and (iii) it does not account for the effect of tunnel geometry or tunnel aspect ratio on the critical velocity [28]. The Memorial Tunnel Fire Test [10] showed that the critical velocity predictions were underpredicted by 5–15% when the heat release rate was 50–100 MW.
Moving away from using F r c = 1 , Kennedy [29] proposed a revision of the critical velocity formula shown in Equation (4). Kennedy conservatively chose the critical Froude number to be 4.5 based on Lee et al.’s [28] small-scale duct experiments, which showed the number to range between 4.5 and 6.7.
V c = ( g Q ˙ c H ρ c p T f A F r c ) 1 3
The Kennedy [29] equation is known to underpredict critical velocity for low heat release rates (<15 MW) and is conservative for fires with high HRRs (100 MW and higher). Since its inception two decades ago, the 4.5 value as the critical Froude number remains the most widely used in tunnel fire engineering. Nevertheless, its adequacy is open to discussion and further research. Firstly, the 4.5 value derived from only one data set from Lee et al. [28] is questionable [30] and is not supported by the original work. Later works by Li et al. [8] have suggested that F r c is not constant and depends on the heat release rate and tunnel aspect ratio. The assumption of a constant F r c = 4.5 is only accurate for tunnels with an aspect ratio close to 1 (i.e., W/H = 1) and is not recommended for wider tunnels (i.e., W/H = 2).
Although the revised critical velocity equation (Equation (4)) can determine the minimum velocity for smoke control in the tunnel, it does not apply to cross-passages. It is unclear what heat release rate should be applied for the cross-passage because the fire occurs in the tunnel. Subsequently, an iterative-based method was developed by Tarada [31] to determine the cross-passage critical velocity, which considers an enthalpy balance for a control volume at the intersection between the tunnel and cross-passage, as shown in Equation (5).
( m ˙ c p T ) t   + ( m ˙ c p T ) d   + Q ˙ c = ( m ˙ c p T f ) t  
In Equation (5) m ˙ is the mass flow rate, and the subscripts t and d denote the incident tunnel and cross-passage, respectively. Subsequently, the critical Froude number (which is set at a constant value of 4.5) at the cross-passage door can be written as:
F r c = g H d ( ρ ρ f ) ρ V d 2 = 4.5
Computational fluid dynamics (CFD) simulations have shown that the formula values underestimate the cross-passage velocities [31]. Langner et al. [32] also performed various CFD simulations on a cross-passage tunnel fire scenario and found that a 2.0 m/s velocity was needed to prevent smoke propagation in the cross-passage for a 28 MW fire. The drawback of Tarada’s approach is its iterative nature, and a direct analytical solution to cross-passage critical velocity is often preferred.
Later, an analytical solution to calculate the critical velocity in a cross-passage ( V c c ) was developed by Tarada [33]. The mass flow rate terms in Equation (5) were replaced with the product of density, area and velocity. Equation (6) was then substituted into the expanded equation to form a cubic equation. The combined equations shown in Equations (7) and (8) were then solved by taking the discriminant as less than zero. The revised method was compared against Tarada’s previous iterative method to show that both approaches give the same solution to three decimal places.
V c c = S ^ + T ^ a 3
where
S ^ = ( R ^ + Q ^ 3 + R ^ 2 ) 1 / 3 T ^ = ( R ^ + Q ^ 3 + R ^ 2 ) 1 / 3 R ^ = 27 c 2 a 3 54 Q ^ = a 2 9 a = Q ˙ c + ρ A t V t c p T ρ c p A t T ,     c = g H d Q ˙ c F r c ρ c p A d T
Further to Tarada’s method, Li et al. [34] also considered the enthalpy equation using the same control volume as Tarada. Substituting the enthalpy equation in addition to the ideal gas law and continuity equation, Li, Lei and Ingason [34] developed an equation to calculate minimum velocity for smoke control in a cross-passage shown in Equation (9). In this approach, the hot gas temperature T f is calculated per Equation (10). If the Froude number for smoke control in a cross-passage is known, calculating the critical velocity in a cross-passage can be done quickly. However, no experimental data is available to confirm the critical Froude number.
V d = g H d Q ˙ c ρ a c p T f A d F r c V c 2 A t A d V t
T f = Q ˙ c ρ a c p ( V t A t + V c A d ) + T 0
In summary, all the above-mentioned methods assumed the critical Froude number to be 4.5 or used a prescribed critical Froude number. The validity of using the single value is questionable, given that it was derived from one data point and only applies to a rectangular tunnel with an aspect ratio of 1 [28]. The critical Froude number models assume that the critical velocity increases as the tunnel height increases and decreases with increasing tunnel width for a given heat release rate. Other critical velocity models have moved away from the critical Froude number and are considered dimensionless equations.
Oka and Atkinson [19] conducted scaled experimental fire testing using propane gas burners as the fuel source in a horizontal horseshoe-shaped tunnel. Based on the results, a dimensionless piecewise function was developed to determine the critical velocity as shown in Equation (11). The dimensionless critical velocity V c * and heat release rate Q * are shown in Equations (12) and (13), respectively. These equations show that the critical velocity decreases with increasing tunnel heights for small fires and increases with increasing tunnel heights for larger fires, as indicated by the piecewise function. The critical velocity is independent of the tunnel width.
V c * = { 0.7 Q ˙ * 1 3             Q ˙ * 0.124 0.35                     Q ˙ * > 0.124
V c * = V C g H
Q ˙ * = Q ˙ ρ a c p T o g 1 / 2 H 5 / 2
Li et al. [8] developed a tunnel critical velocity model (shown in Equation (14)) after performing theoretical tests and two experimental fire tunnel tests with aspect ratios of 1 and 1.15. The other dimensionless values are calculated the same as Equations (12) and (13) specified by Oka and Atkinson [19].
V c * = { 0.81 Q * 1 3             Q ˙ * 0.2 0.43                           Q ˙ * > 0.2
The model coefficients in Equation (14) are noticeably higher than the methods developed by Oka and Atkinson (Equation (11)) because the experimental tests had a water spray device above the fire source. The spray devices were implemented to cool down the tunnel walls, but this also led to significant heat losses through the walls and reduced convective heat of the smoke flow. Li’s equations [8] were later revised after performing fire tunnel tests and CFD full-scale simulations, which showed the tunnel width affected the critical velocity for fires with a heat release rate of less than 20 MW but not for fires greater than 20 MW [35]. This critical velocity model was adopted in NFPA 502 [20] and is shown in Equations (15)–(17).
u g H ¯ = { 0.81 ( Q ˙ ρ a c p T o g 1 / 2 H 5 / 2 ) 1 / 3 ( H W ) 1 / 2 e ( L b 18.5 H ) f o r   Q ˙ ρ a c p T o g 1 / 2 H 5 / 2 0.15 ( H W ) 1 / 4 0.43 e ( L b 18.5 H ) f o r   Q ˙ ρ a c p T o g 1 / 2 H 5 / 2 > 0.15 ( H W ) 1 / 4
V c * = V C g H ¯ = { 0.81 φ 1 12 Q ˙ * 1 3             Q ˙ * 0.15 φ 1 4 0.43                                             Q ˙ * > 0.15 φ 1 4
φ = W   H
In Equations (15)–(17), u is the horizontal gas velocity, W is the width of the tunnel, φ is the tunnel aspect ratio and L b is the backlayering length, where L b = 0 (i.e., no backlayering smoke) defines the critical velocity. Despite the well-established research on critical velocity in accident tunnels, few studies have focused on controlling smoke flow into tunnel cross-passage. Li, Lei and Ingason [34] developed an equation for cross-passage critical velocity by applying the same dimensionless methodology. From a parametric study considering the factors influencing the critical velocity in a cross-passage, a dimensionless equation was proposed and shown in Equations (18) and (19).
Q ˙ * = Q ρ a C p T 0 g 1 / 2 H t 5 / 2   V t * = V t g H t     H d * = H d H t
V c c * = 1.65 H d * ( Q ˙ * ) 1 / 3 exp ( V t * )
The model was based on a 1:20 model-scale tunnel with cross-passage experiments with propane as the fuel source. Additionally, various cross-passage fire-proof door shapes were considered to analyse their geometrical impact on the cross-passage critical velocity. The experimental analysis showed the Froude number ranged between 5 and 10 for 84% of values and 10–17 for 16% of values [34], suggesting the Froude number is not suitable for determining the cross-passage critical velocity. It was noted that a higher cross-passage critical velocity was required for the fire source upstream of the cross-passage compared to outside the cross-passage. Moreover, the cross-passage critical velocity increases as the cross-passage door height and heat release rate increase but decreases with increasing longitudinal velocity, as shown in Figure 3.
Contrary to the revised methodology for critical velocity, the cross-passage door width seems to have a negligible effect on the minimum velocity for smoke control in the cross-passage. Overall, the study provided important relationships between the cross-passage critical velocity, heat release rate, cross-passage door height and longitudinal tunnel velocity and laid a foundation for further study.

2.2. Computational Fluid Dynamics in Tunnel Fire Modelling

The application of computational fluid dynamics (CFD) modelling on building fire safety has become increasingly popular due to the rapid advancement of numerical methodologies and computational power [36,37,38,39,40]. In particular, the Fire Dynamics Simulator (FDS) is a widely used and well-established method to analyse compartment fire dynamics [41,42,43,44,45]. There are many successful FDS studies conducted on rail tunnels [46,47,48,49,50,51,52]. More specifically on cross-passages, Hou et al. [53] performed various FDS simulations considering different train locations upstream, in the middle of and downstream of the incident tunnel cross-passage door with a fire located 2 m upstream of the cross-passage. The train location in a tunnel is important when considering smoke control in a cross-passage. It was found that with a train crossing a cross-passage, the velocity of the cross door increases gradually and decreases when the middle of the train is at the cross-passage door.
More recently, Feng et al. [54] performed full-scale cold smoke test experimentation in a subway tunnel, using FDS modelling and theoretical analysis based on Li’s critical Froude model [34], Equation (9), to investigate smoke control in cross-passages. Each experimental test was repeated three times to increase reliability, and the train head was positioned in three locations with respect to the cross-passage: 100 m upstream (Case 1), 50 m upstream (Case 2) and 60 m downstream (Case 3). The fire was positioned between 5 and 11 m upstream from the cross-passage. A comparison between the theoretical calculations and full-scale modelling showed no agreement between the values, solidifying the idea that the Froude number is not suitable for critical velocity calculations. Additionally, it shows the train head location upstream of the fires and blocking the cross-passage (Case 3) as the most demanding scenario, with 2.58 m/s required to prevent smoke ingress into the cross-passage. However, FDS simulations showed only a maximum of 1.5 m/s being required for a 0.5 m/s tunnel velocity, suggesting the full-scale experimentation was too conservative. Similar to Hou, Li and Zhang [53], train location variations showed that decreasing the distance between the train head and cross-passage leads to increased critical velocity through the cross-passage.
Based on the literature review, considerable research has been done to develop a robust understanding of critical velocity in a tunnel. However, to date, fewer studies have been performed to develop an appropriate ventilation response for smoke control in underground tunnel cross-passages. CFD simulations are necessary to observe smoke behaviour in cross-passages under various fire scenarios. Nonetheless, from the literature review, most of these numerical works did not consider how the interaction between the applied longitudinal tunnel and cross-passage velocities impacts smoke behaviour. A comparison of the current cross-passage critical velocity theoretical calculation methods is necessary to see if these methods are conservative or not. The numerical study in the next sections aims to provide a preliminary foundation for determining the most demanding emergency scenario for underground rail tunnel cross-passage smoke control and consider whether AS 1668.1 is a suitable standard to be applied in underground rail tunnels.

3. Computational Methods

In this study, the Fire Dynamics Simulator (FDS) version 6.7.5 was applied to model the tunnel fire cases. It is a Large Eddy Simulation (LES) fire code for low-speed flows, with an emphasis on smoke and heat transport from fires [55]. In this model, the flow dynamics and property transports are governed by the governing equations based on CFD theories in the form of transport equations. Time advancement is handled by an explicit second-order predictor–corrector scheme with a variable time step based on a Courant–Friedrichs–Lewy (CFL) constraint of one.

3.1. Governing Equations

In FDS, the Favre-filtered transport equations for mass, momentum and energy of the fluid motion are resolved by the following equations:
ρ t + ( ρ   u ) = 0
t ( ρ ¯ u ) ρ + (   ρ ¯ u u ) = τ ¯ + ρ ¯ g
t ( ρ ¯ h s ) ρ + (   ρ ¯ h s u ) = D p - D t + q ˙ c o m b Δ q ˙
where h s is the enthalpy, p - is the pressure, τ ¯ is the stress tensor, q ˙ c o m b is the heat release rate per unit volume from a chemical reaction and q ˙ is sum of conductive, diffusive and radiative heat fluxes given by:
q ˙ = k T α h s , α ρ D α Z α + q r a d ˙
where k is the thermal conductivity and D α is the diffusivity of species α and q r a d ˙ is the radiation heat transfer.

3.2. Subgrid-Scale Turbulence Model

The Smagorinsky model [56] was adopted with a wall-damping function which considered the decay of Reynolds stresses approaching near a wall. The model assumes that the subgrid scale (SGS) eddy viscosity can be described in terms of the filter width and a velocity scale expressed as a product of the filter width and the average strain rate of the resolved flow.
μ T = ρ ( C s Δ ) 2 | S |                 ;                 | S | = ( 2 S ij S ij 2 3 ( Δ u )   2   ) 1 / 3
where C s is the Smagorinsky constant prescribed as 0.2 [57], Δ is the filtered width and S ij are the Reynolds stresses. In the simulation, both the turbulent Schmidt and Prandtl numbers are set to 0.5.

3.3. Combustion Model

FDS implements a simple chemistry combustion model, which assumes that the fuel burns instantaneously when mixed with the oxidizer. Accordingly, the combustion chemical source term, which appears in the energy equation, is calculated based on the eddy dissipation concept for non-premixed flames [58].
q ˙ c o m b = α m ˙ α Δ h f , α
where m ˙ α and Δ h f , α are the mass flux per unit volume and heat of formation for species α , respectively. In this study, a single step reaction for propane (C3H6) was adopted with a soot yield of 0.01 (defined as the mass of soot produced per mass of fuel), as specified in the SFPE Handbook [59].

3.4. Radiation Model

In tunnel fire studies, radiation heat transfer is essential as the hot gas and smoke layers can act as a radiative transfer medium, carrying heat within the enclosure. In this model, the radiation transport equation (RTE) for a non-scattering grey gas is resolved via a finite volume method (FVM). The narrow-band model Rad-cal [60] is applied to determine the mean absorption coefficient based on species composition and temperature.

3.5. Model Validation for Tunnel Fire Cases

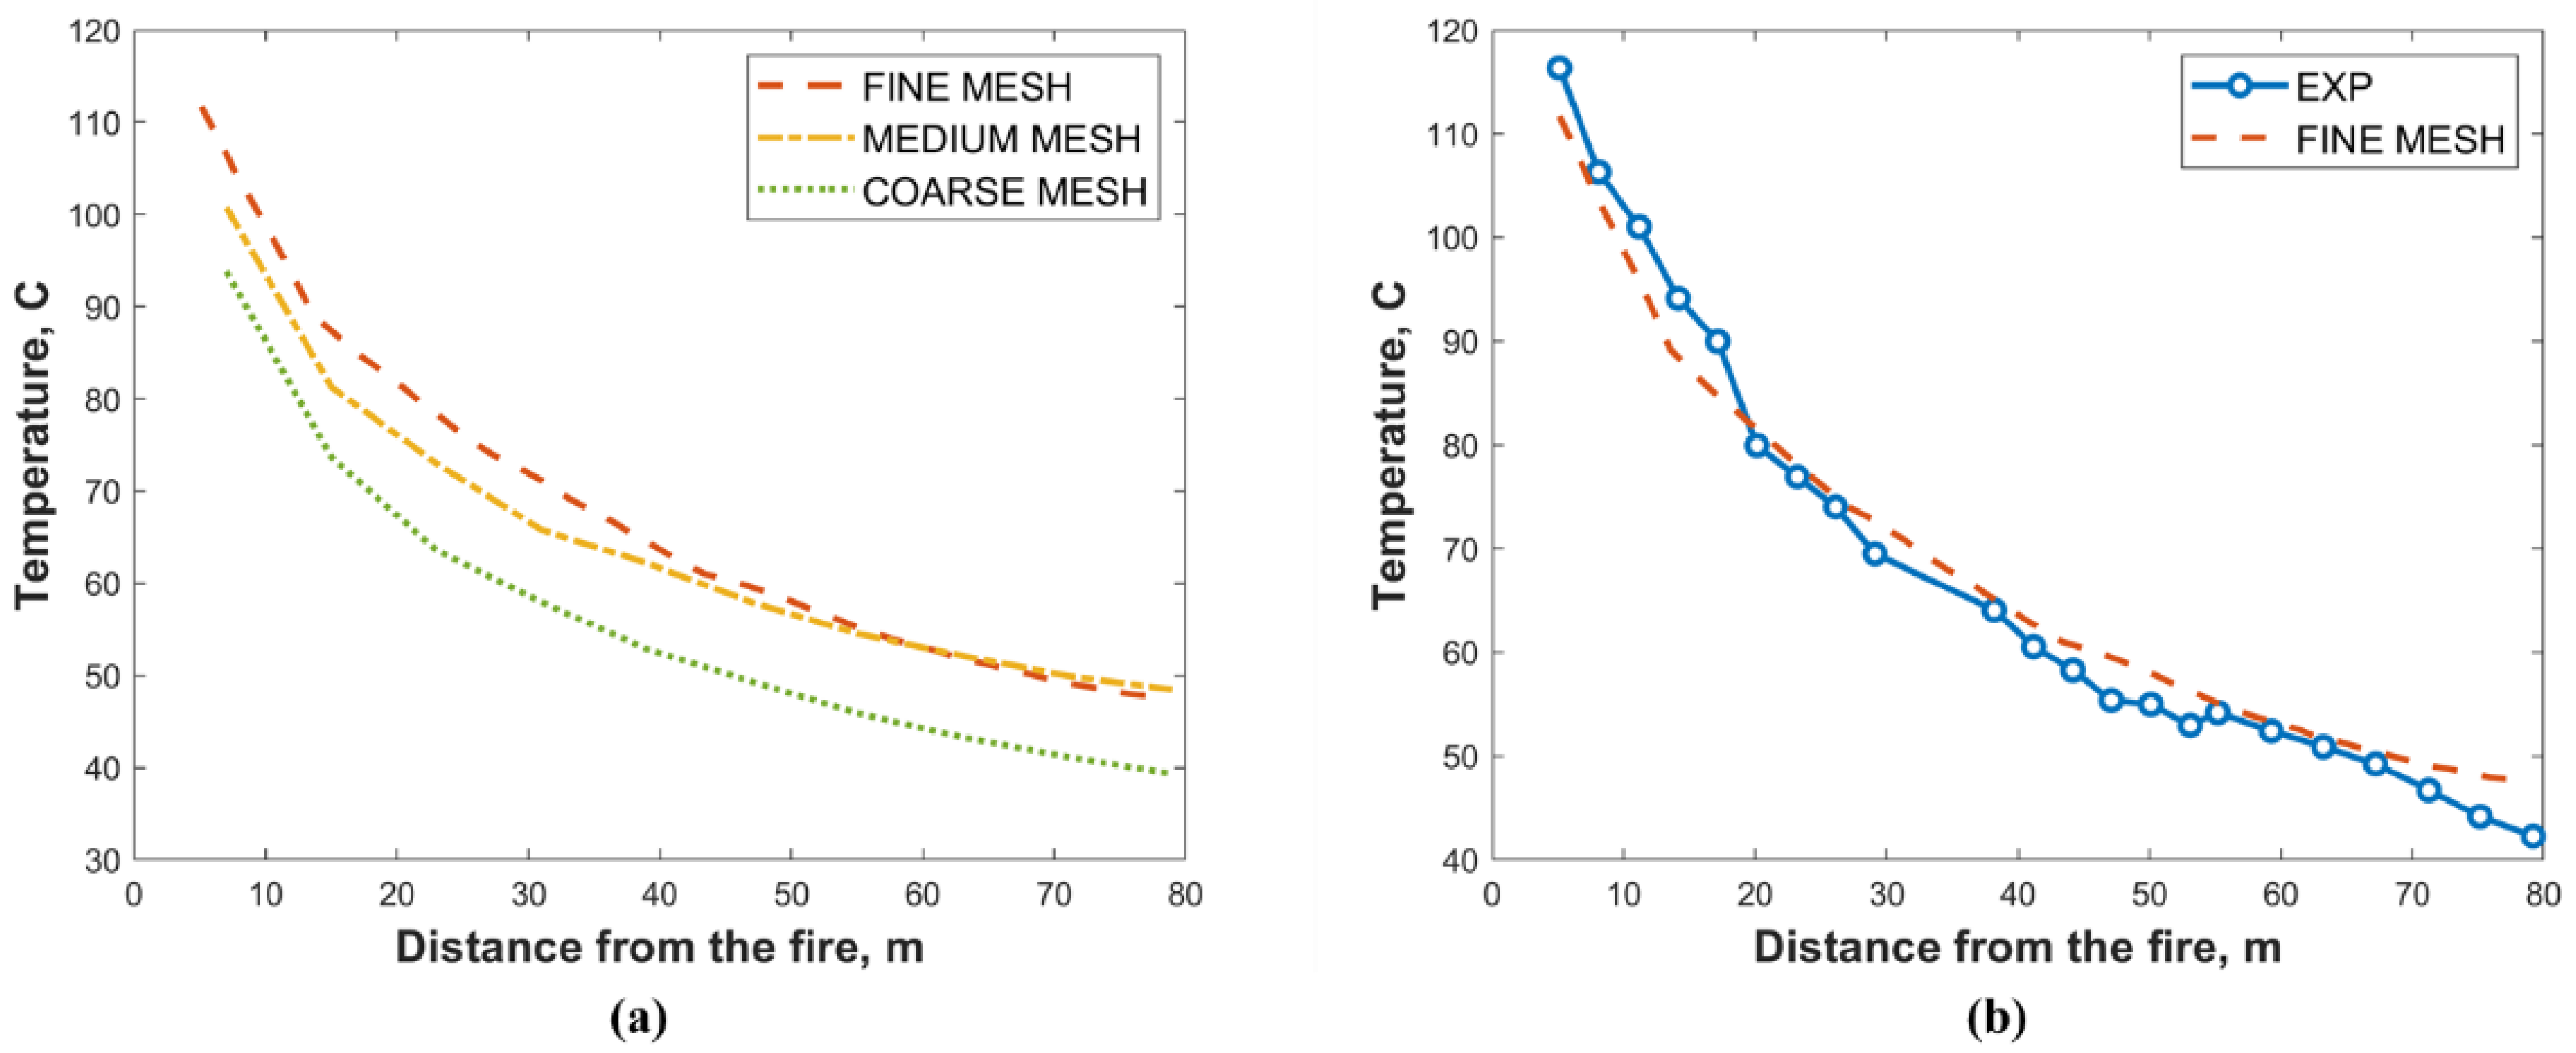
An FDS validation was performed based on the tunnel fire experiments conducted by Hu et al. [61], which resemble the actual rail tunnel geometry considered in this study. The experiments were conducted on an 88 m long, 8 m high and 2.7 m wide underground tunnel with a single 1 MW pool fire on one end. A series of thermocouples were used to measure the smoke temperature distribution along the length of the channel ceiling. A heat release rate curve matching the experimental data was imported into the FDS model, and temperature devices along the channel ceiling were compared against experimental data. Additionally, a mesh sensitivity study was performed on three mesh systems to determine the most appropriate mesh size for this large-scale fire simulation. The validation and mesh sensitivity results are presented in Figure 4. A good agreement between the experiment and simulation was noted and is shown below in Figure 5b. Figure 5a shows a comparison of the three mesh sizes comparing the ceiling temperature. These consist of a coarse mesh of 0.25 m × 0.25 m × 0.25 m, medium mesh size of 0.15 m × 0.15 m × 0.15 m and a finer mesh of 0.05 m × 0.05 m × 0.05 m. The results suggest that the fine mesh was the most optimal in terms of convergence and overall accuracy compared to experimental data. The 0.05 m element size corresponds to a characteristic length ratio (D*/dx) of 19 [62]. Therefore, the fine mesh system was utilised for all the case studies in this numerical assessment.

4. Model Configuration

The following section details the geometries of the rail tunnel, cross-passage and train. The aforementioned were all modelled in SolidWorks before being imported into FDS.

4.1. Rail Tunnel and Cross-Passage Geometry

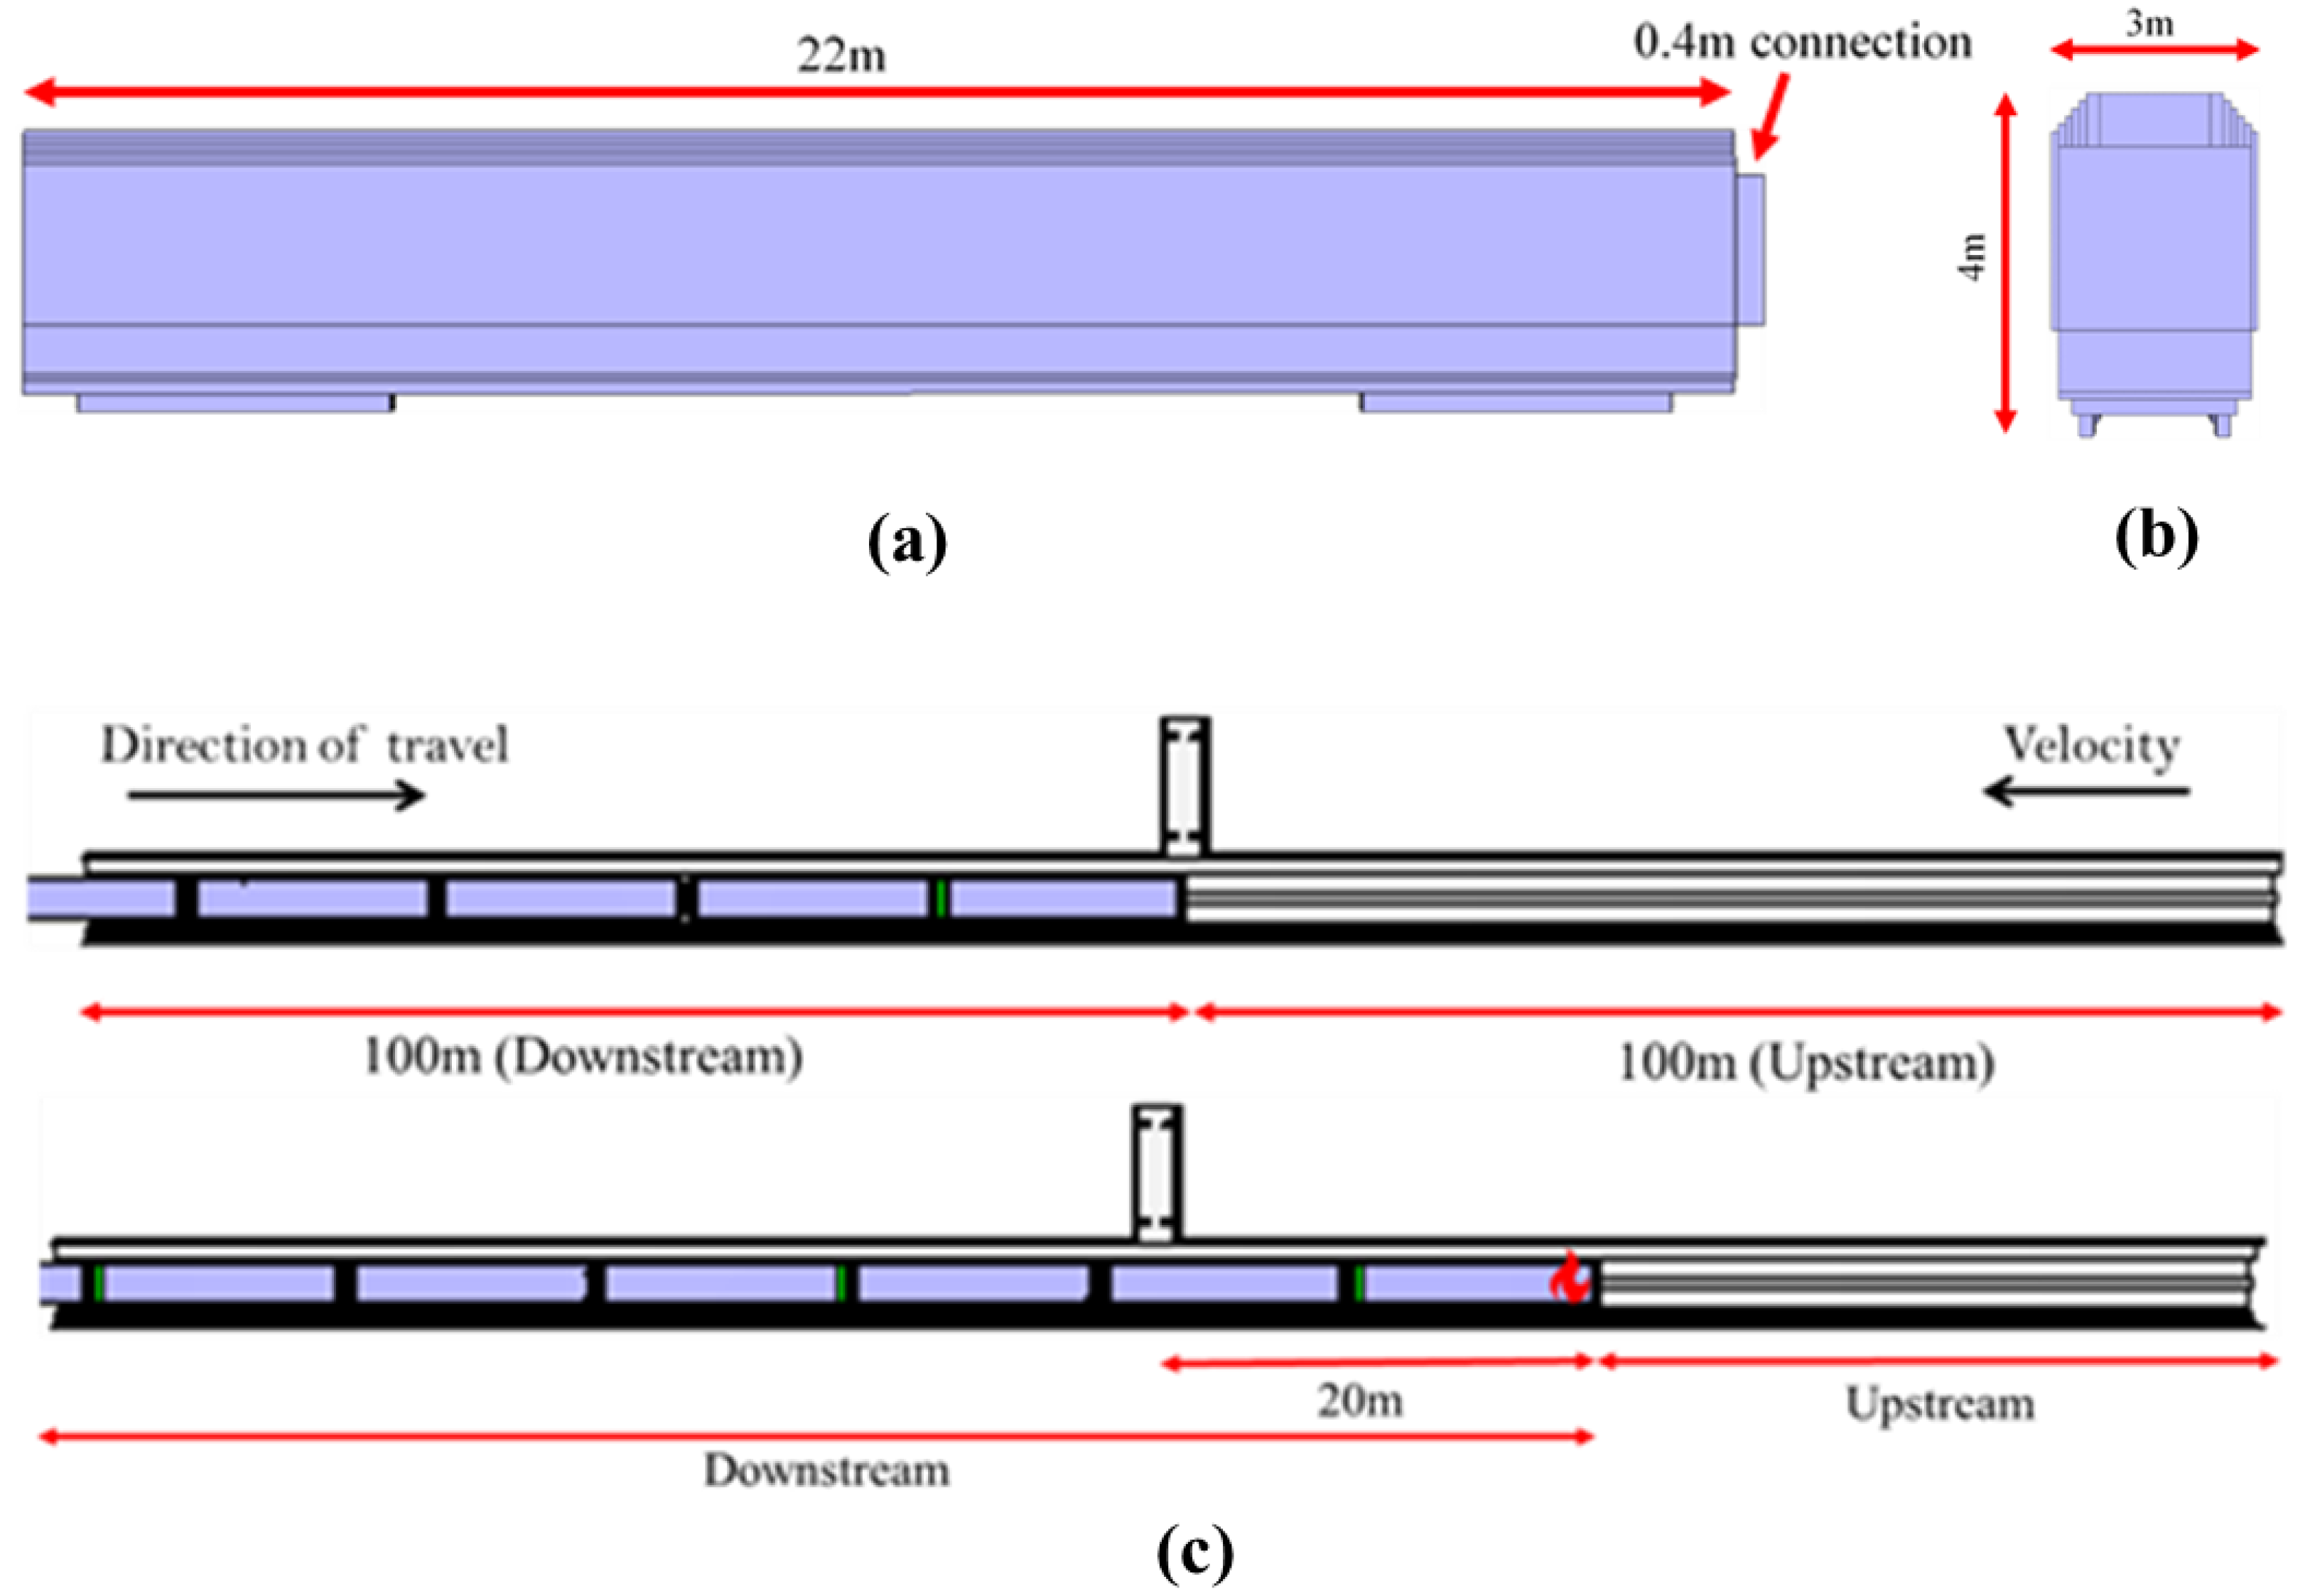
The geometry is based on an actual Australian rail tunnel design and is set at a 0% gradient. The geometry of the rail tunnel is as follows and is shown in Figure 5. The tunnel is 5.6 m high and round-shaped, with an effective diameter of 6.2 m. It is 1.2 m wide and consists of walkways of 1.743 m vertical height that are 1.8 m away from the centre. The trackway for the train is elevated at 0.2 m high. This adds up to a total of 36.34 m2 of tunnel-free area (i.e., not included in the cross-sectional area of the train). A 200 m length of the tunnel was modelled, which exceeds ten hydraulic diameters to ensure flow is not turbulent and a sufficient number of train carriages can be included in the computational domain. The geometry of the cross-passage is shown in Figure 6b, where the effective diameter is 3.95 m with a height of 3 m and 14.35 m2 of free area. In the computational domain, the passage is 10 m long with two open cross-passage doors measuring 1.2 m wide, 2.6 m high and 0.2 m thick. The cross-passage doors are set at 1.3 m from the closest tunnel side and are located 100 m along the tunnel (halfway).
Each train carriage measures 22 m long, with a 0.4 m connection on either end. The exceptions are the first and last carriages, with only one connection on the side of the adjacent carriage, as shown in Figure 6. The carriage measures 4 m high and 3 m wide, with sloped sides at the top. The side and front views of the train can be seen in Figure 6a,b, respectively. The train carriages outside the computational domain (i.e., 200 m tunnel length) were not considered as it is unlikely that additional carriages will impact the final results. In this study, two train locations (i.e., upstream and downstream of the rail tunnel) were considered, as indicated in Figure 6c. For convenience, the fire located directly outside the cross-passage is denoted as T0m and B0m for top and undercarriage, respectively, and similarly, T20m and B20m for the fire located 20 m upstream of the cross-passage.

4.2. Fire Location and Parameters

Fires external to the train carriage have been considered because they are more likely to disable a train in the tunnel compared to an in-carriage fire in its early stages because stopped train emergency scenarios are more applicable to this study. The external fires can be attributed to equipment failures occurring underneath the carriage (e.g., brake failure) or on the roof (e.g., condenser failure) and have a heat release rate of much smaller magnitude compared to an internal carriage fire (1–2 MW versus 15 MW) because mainly metal components are burning compared to internal furnishings. A polyurethane fuel will be used to model the emergency scenarios with the following properties: (i) heat of combustion of 17.2 MJ/kg; (ii) soot yield of 0.15 g/g and (iii) carbon monoxide yield of 0.03 g/g. These properties were based on the polyurethane combustion properties tabulated in the SPFE Handbook of Fire Protection Engineering [62]. Consequently, a 2 MW polyurethane fire measuring 1.6 m × 2.5 m (4 m2) with a heat release rate (HRR) profile prescribed according to Figure 8a was modelled at the top and bottom of the first train carriage as shown in Figure 7. The bottom and top fire locations are meant to reflect areas prone to failure, the top correlating to condensers and the bottom reflecting mechanical failure.

4.3. Boundary Conditions

If no velocity is applied at either of the three boundaries (inlet, outlet and cross-passage), an open boundary condition has been applied. Inlet velocities of 1.7 m/s were considered for both the main tunnel and the cross-passage. The 1.7 m/s corresponds to an annular velocity of 2.5 m/s (over the train) which is the determined critical velocity. In this case, smoke will be blown over the train with the applied longitudinal velocity, which is the most onerous scenario (compared to smoke being blown away from the train). This scenario may occur when another train is upstream of the incident train, so smoke must be blown in the other direction to leave the non-incident train unaffected. The velocity inlets act as the ventilation system response, and in practice, the ventilation system cannot instantly meet the expected airflow. Therefore, a 120 s t2 ramp-up time has been applied as a typical response time. The total simulation time is 400 s, with the initial tunnel and ambient temperatures prescribed as 30 °C. The ambient pressure is set to be 101.325 kPa.
In summary, a total of 28 different simulation cases were conducted, and the detailed velocity and fire/train location settings are summarised in Table 1.

4.4. Determining the Cross-Passage Critical Velocity Based on Empirical Calculations

The cross-passage critical velocity requirements were calculated using the empirical formulations described by Li et al. [34] and Tarada [33]. Input parameters are based on the simulated model geometry, and the fire size is assumed to be 80% convective in the calculations. It is important to note that Tarada’s method utilises the Froude number, which has been found to be unsuitable for critical velocity calculations based on experimental testing. Consequently, Li’s calculation method performs well on two fronts: (i) being a more conservative option ensures the ventilation response to emergency scenarios is sufficient and (ii) the absence of the Froude number.
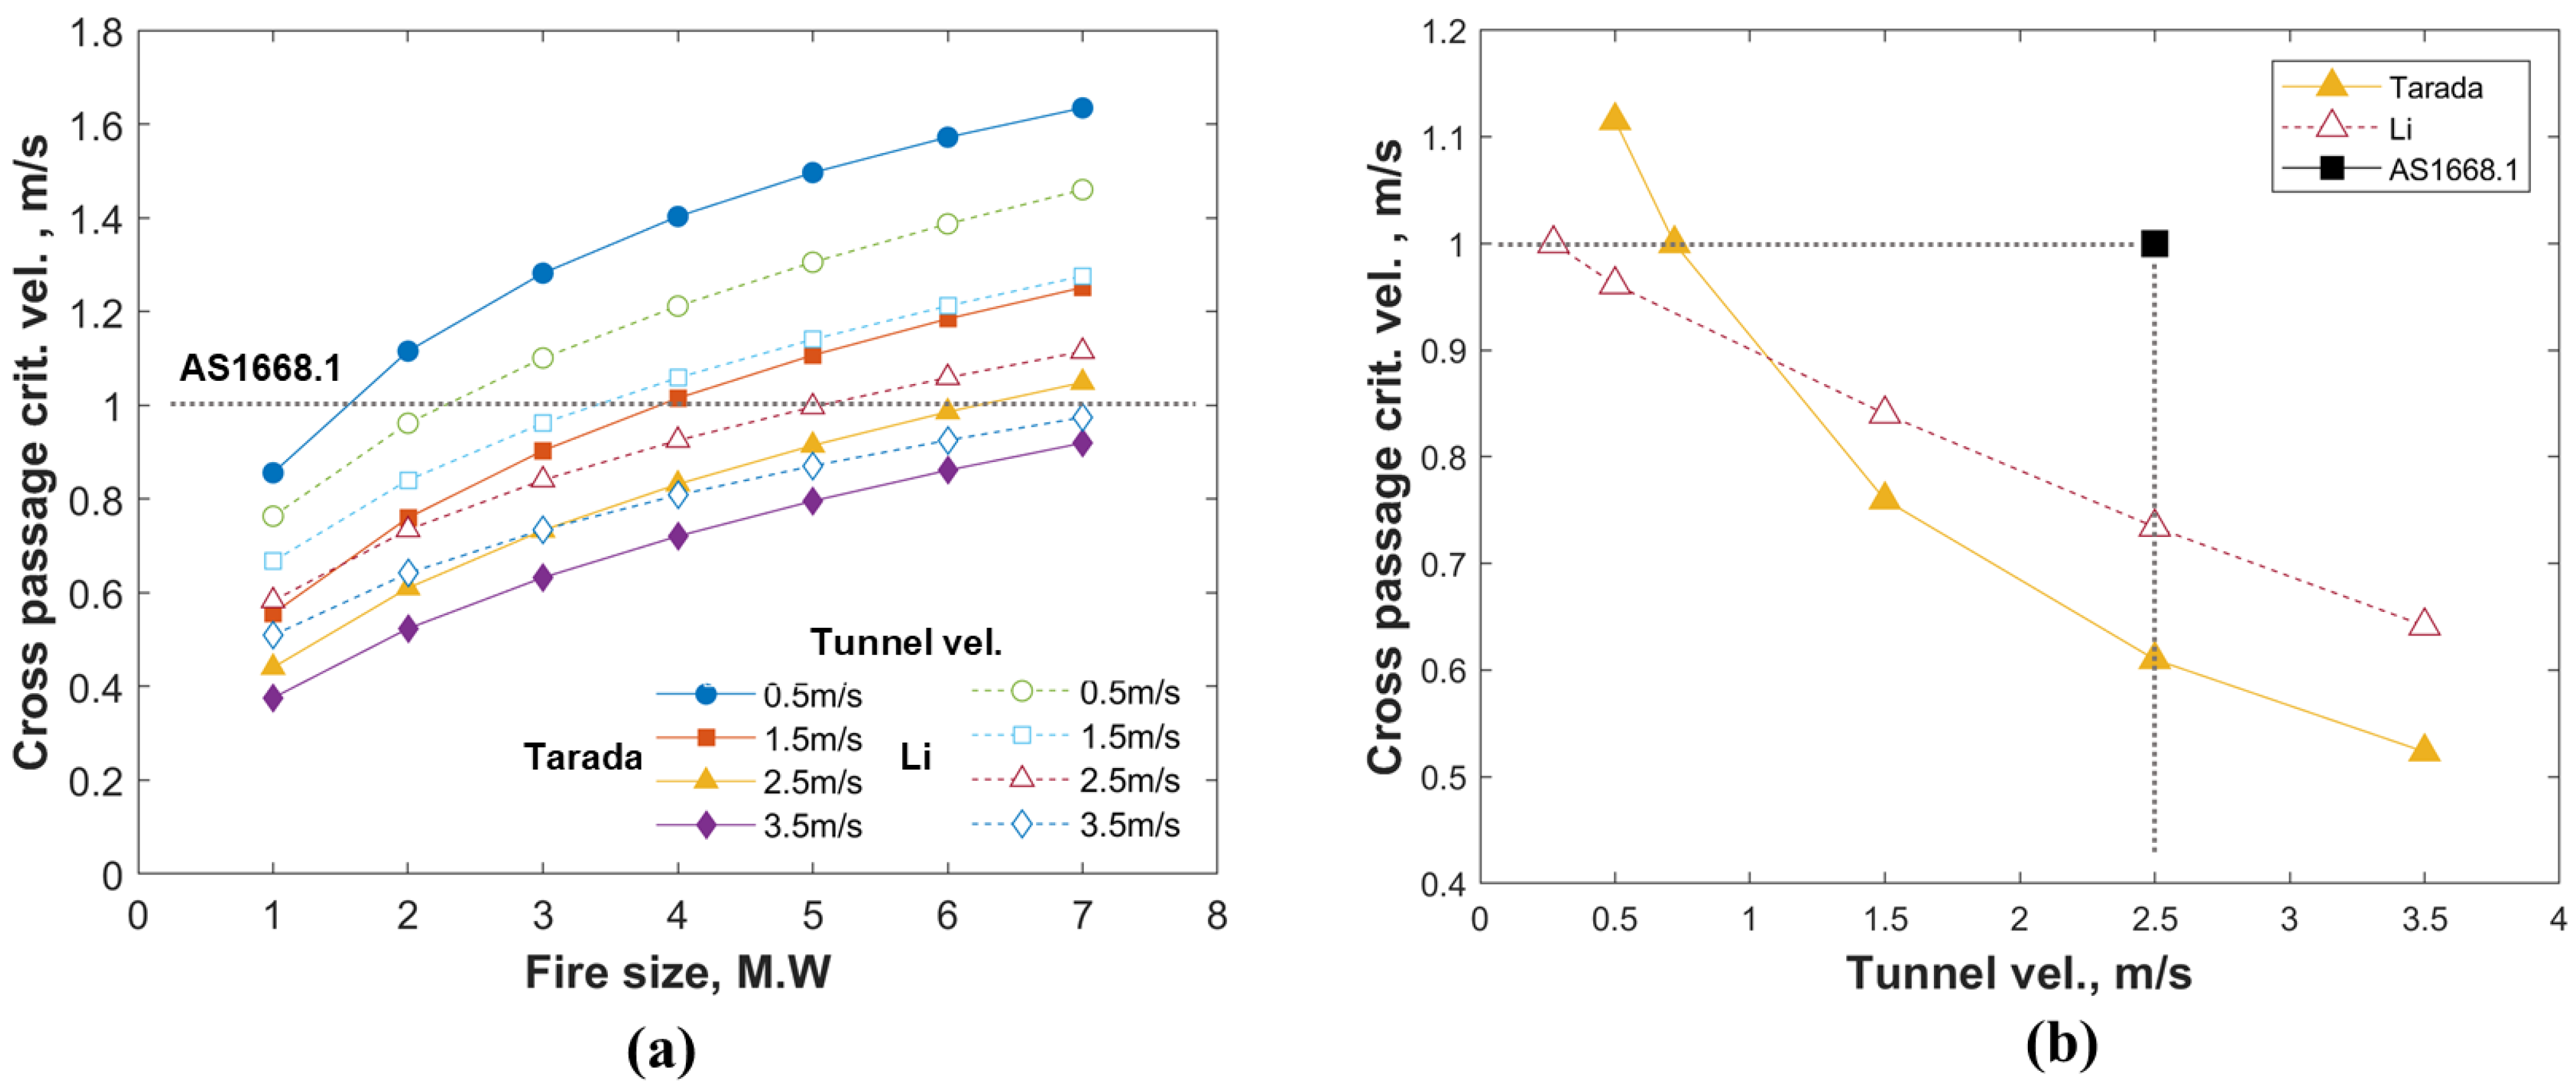
A comparison of the two different methods is shown in Figure 8. From Figure 8a, Li’s cross-passage critical velocity is consistently more conservative than Tarada’s analytical method across different fire sizes and tunnel velocity. A horizontal line was added to the figure to indicate the AS1668.1 requirement of 1 m/s. It can be observed that most of the data points with a tunnel velocity above 2.5 m/s (i.e., the required minimum velocity for the tunnel) are lower than the AS1668.1 requirement. The cross-passage critical velocity starts to increase above 1 m/s for fires larger than 6 MW. Focusing on the 2 MW fire scenario specified in the simulation cases, the Li method results in a cross-passage critical velocity of 0.734 m/s compared to 0.610 m/s from Tarada (20.3% difference). Note that both methods are substantially below the AS1668.1 standard of 1 m/s. Based on the calculations, a 1 m/s cross-passage critical velocity would require the tunnel velocity to be reduced from 2.5 m/s to 0.72 m/s and 0.217 m/s based on the Li and Tarada methods, respectively.

5. Results

This section presents a holistic summary of the simulation results from all the case studies while highlighting areas for improvement and the implications of the results. Table 2 collates all the cases and summarises the average temperature, u-velocity across the cross-passage doors and whether smoke enters the cross-passage. Overall, the cases reach a steady state at approximately 300 s, and the presented results are time-averaged from 350–400 s. The simulation ID abbreviates the modelled scenario and can be separated by the underscores into four terms. The first term denotes the fire location with respect to the first carriage. The second term describes the train head’s location upstream of the cross-passage. The third and fourth terms describe the longitudinal tunnel velocity and cross-passage velocity applied at their respective boundaries. For u-velocities, the positive direction points towards the outlet boundary of the cross-passage (i.e., negative velocity denotes velocity moving into the longitudinal tunnel). It is important to note that the cross-passage boundary velocities translate to averaged doorway u-velocities ranging from 0.56 m/s to 1.41 m/s, which appropriately covers both values above and below the 1 m/s specified in AS1668.1.
Overall, the cases where the train head was 20 m upstream of the cross-passage were noticeably more onerous than when the train head was at the cross-passage. The average temperatures at the cross-passage door are higher, and more velocity is required for smoke control. However, this trend is reversed for cases with a 1.7 m/s tunnel velocity. Because of the main tunnel velocity, all the smoke is forced to flow downstream towards the cross-passage, thus causing a higher critical velocity to be required for smoke control compared to the B0m fire.
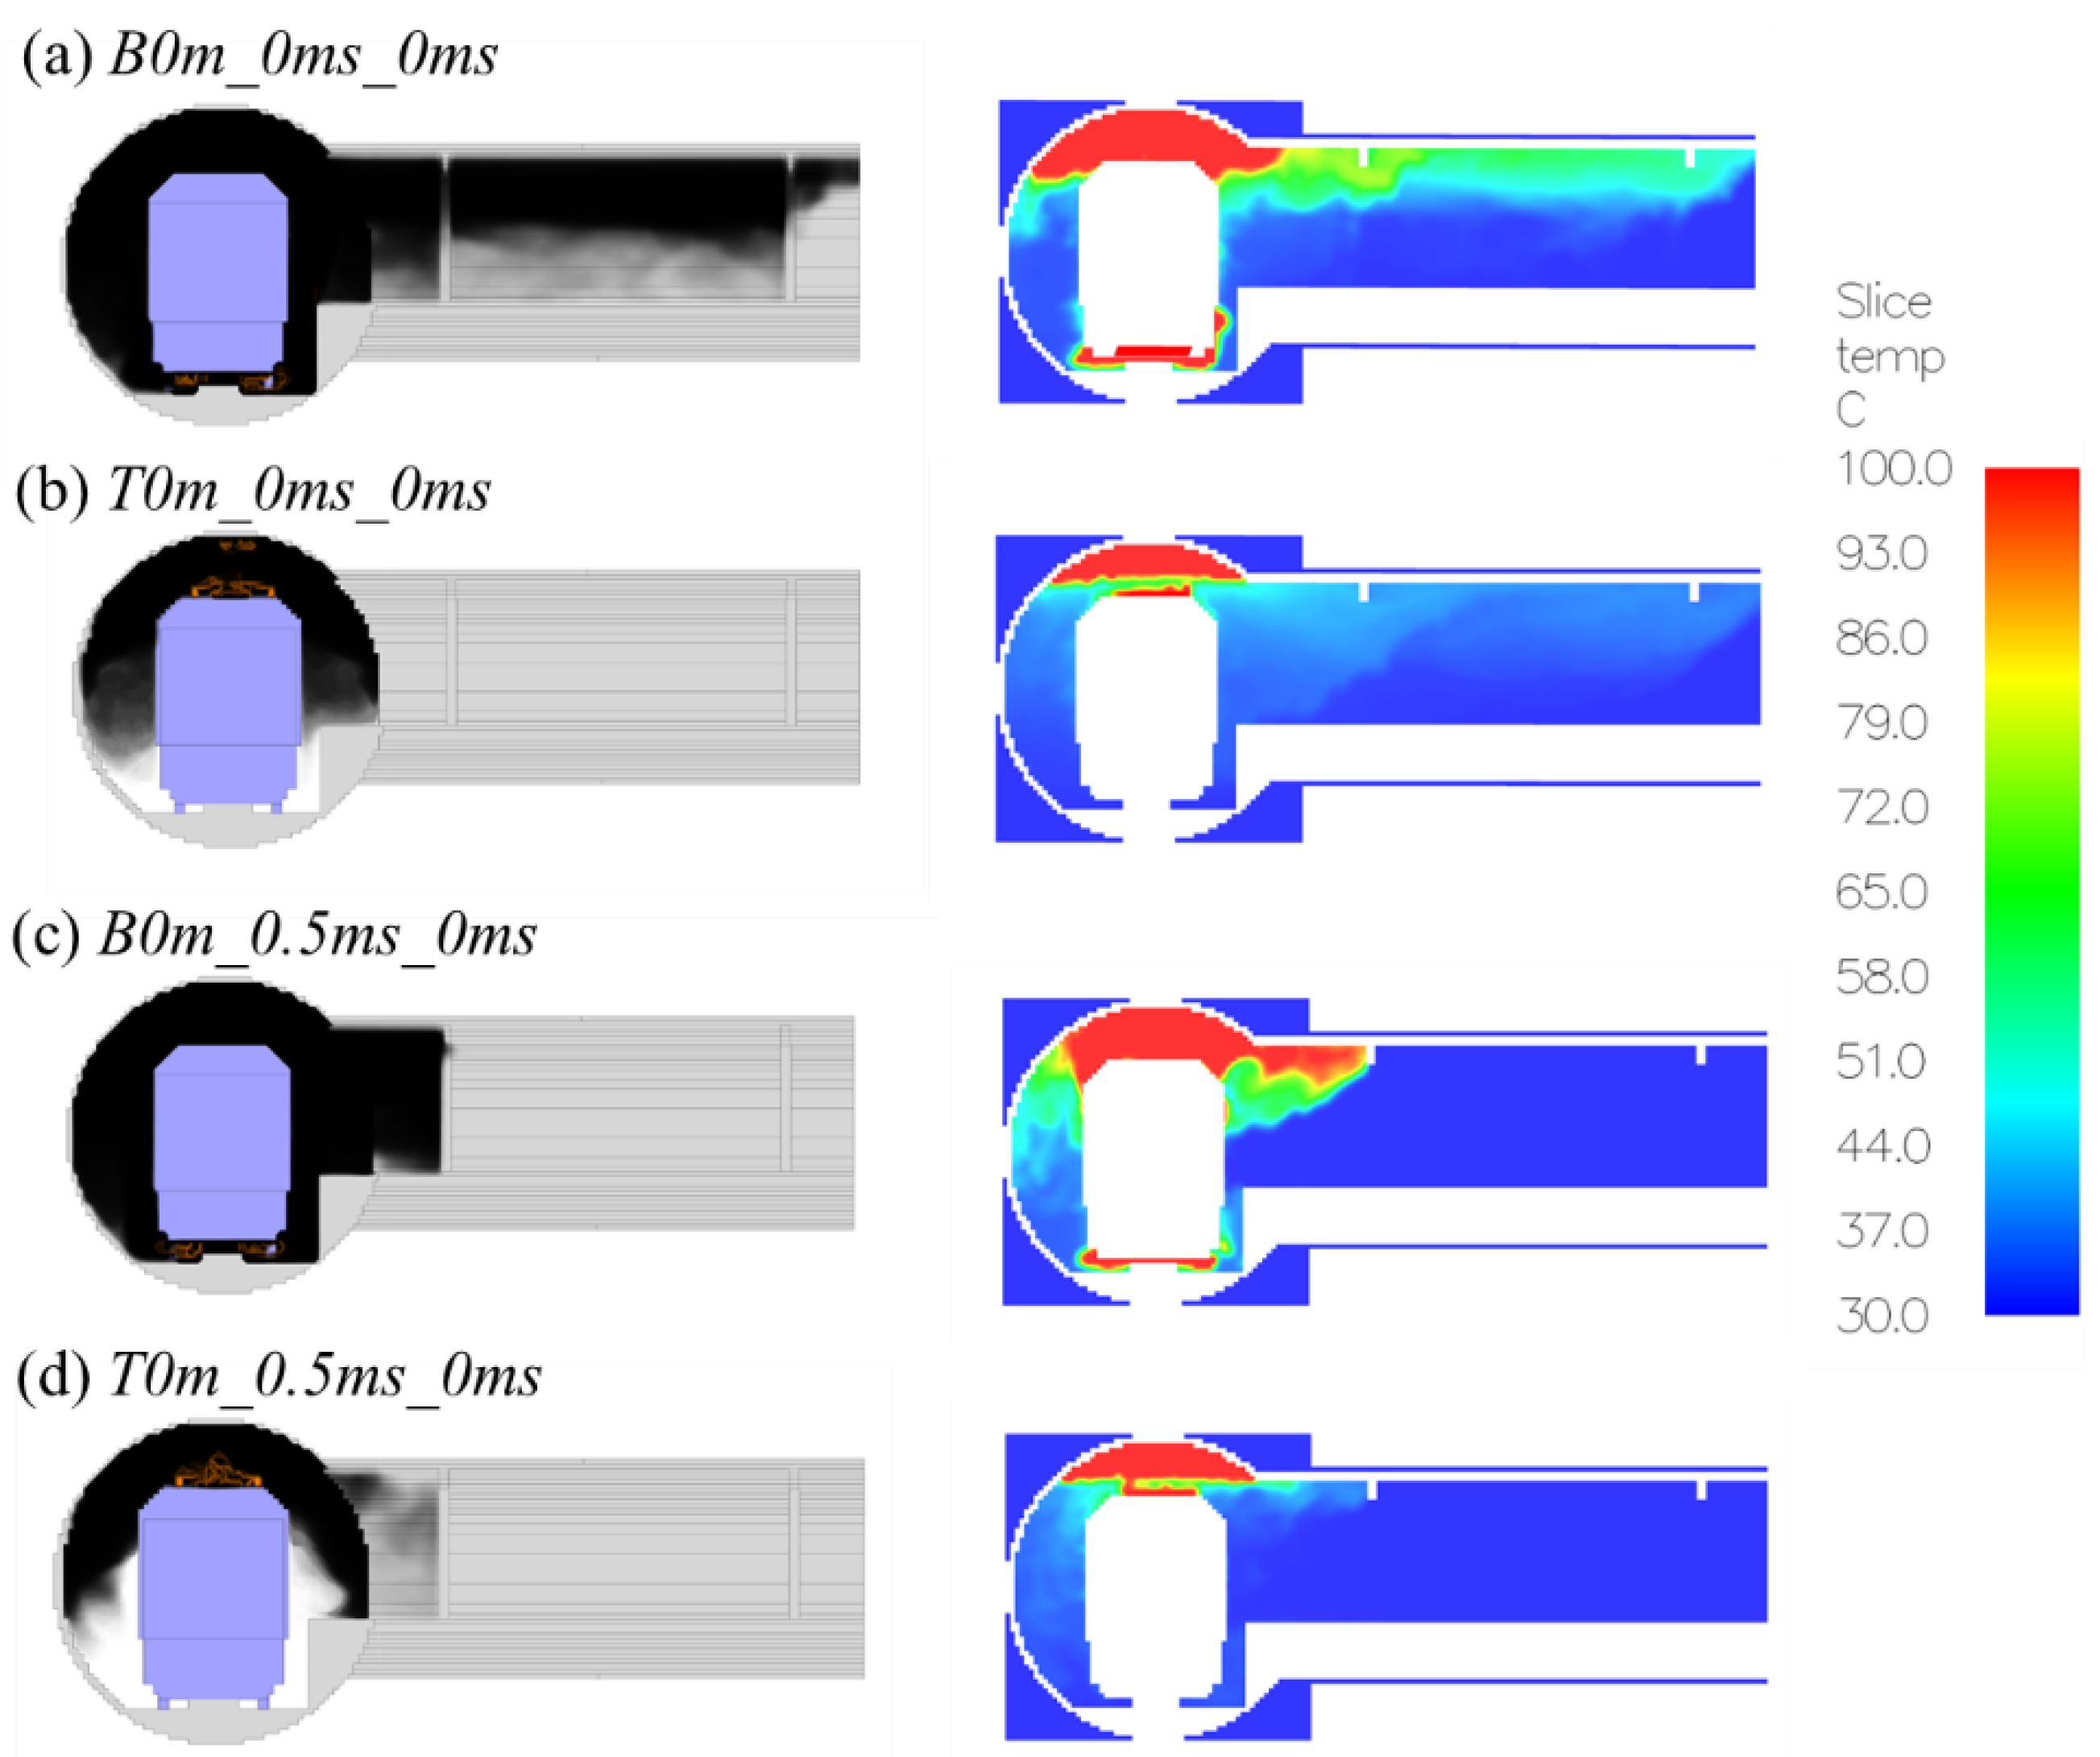
Furthermore, undercarriage fires were shown to be more onerous compared to top carriage fires. For undercarriage fires, the smoke rises from the bottom due to buoyancy and leads to a lower smoke layer height, while the smoke tends to remain at the tunnel crown for top carriage fires. The lower smoke layer also leads to higher ceiling temperatures for undercarriage fires. Figure 9 illustrates a comparison between top and undercarriage fires for two scenarios with (i) no ventilation (B0m_0ms_0ms) and (ii) 0.5 m/s cross-passage velocity (B0m_0ms_0.5ms).

5.1. Smoke Distribution at the Cross-Passage

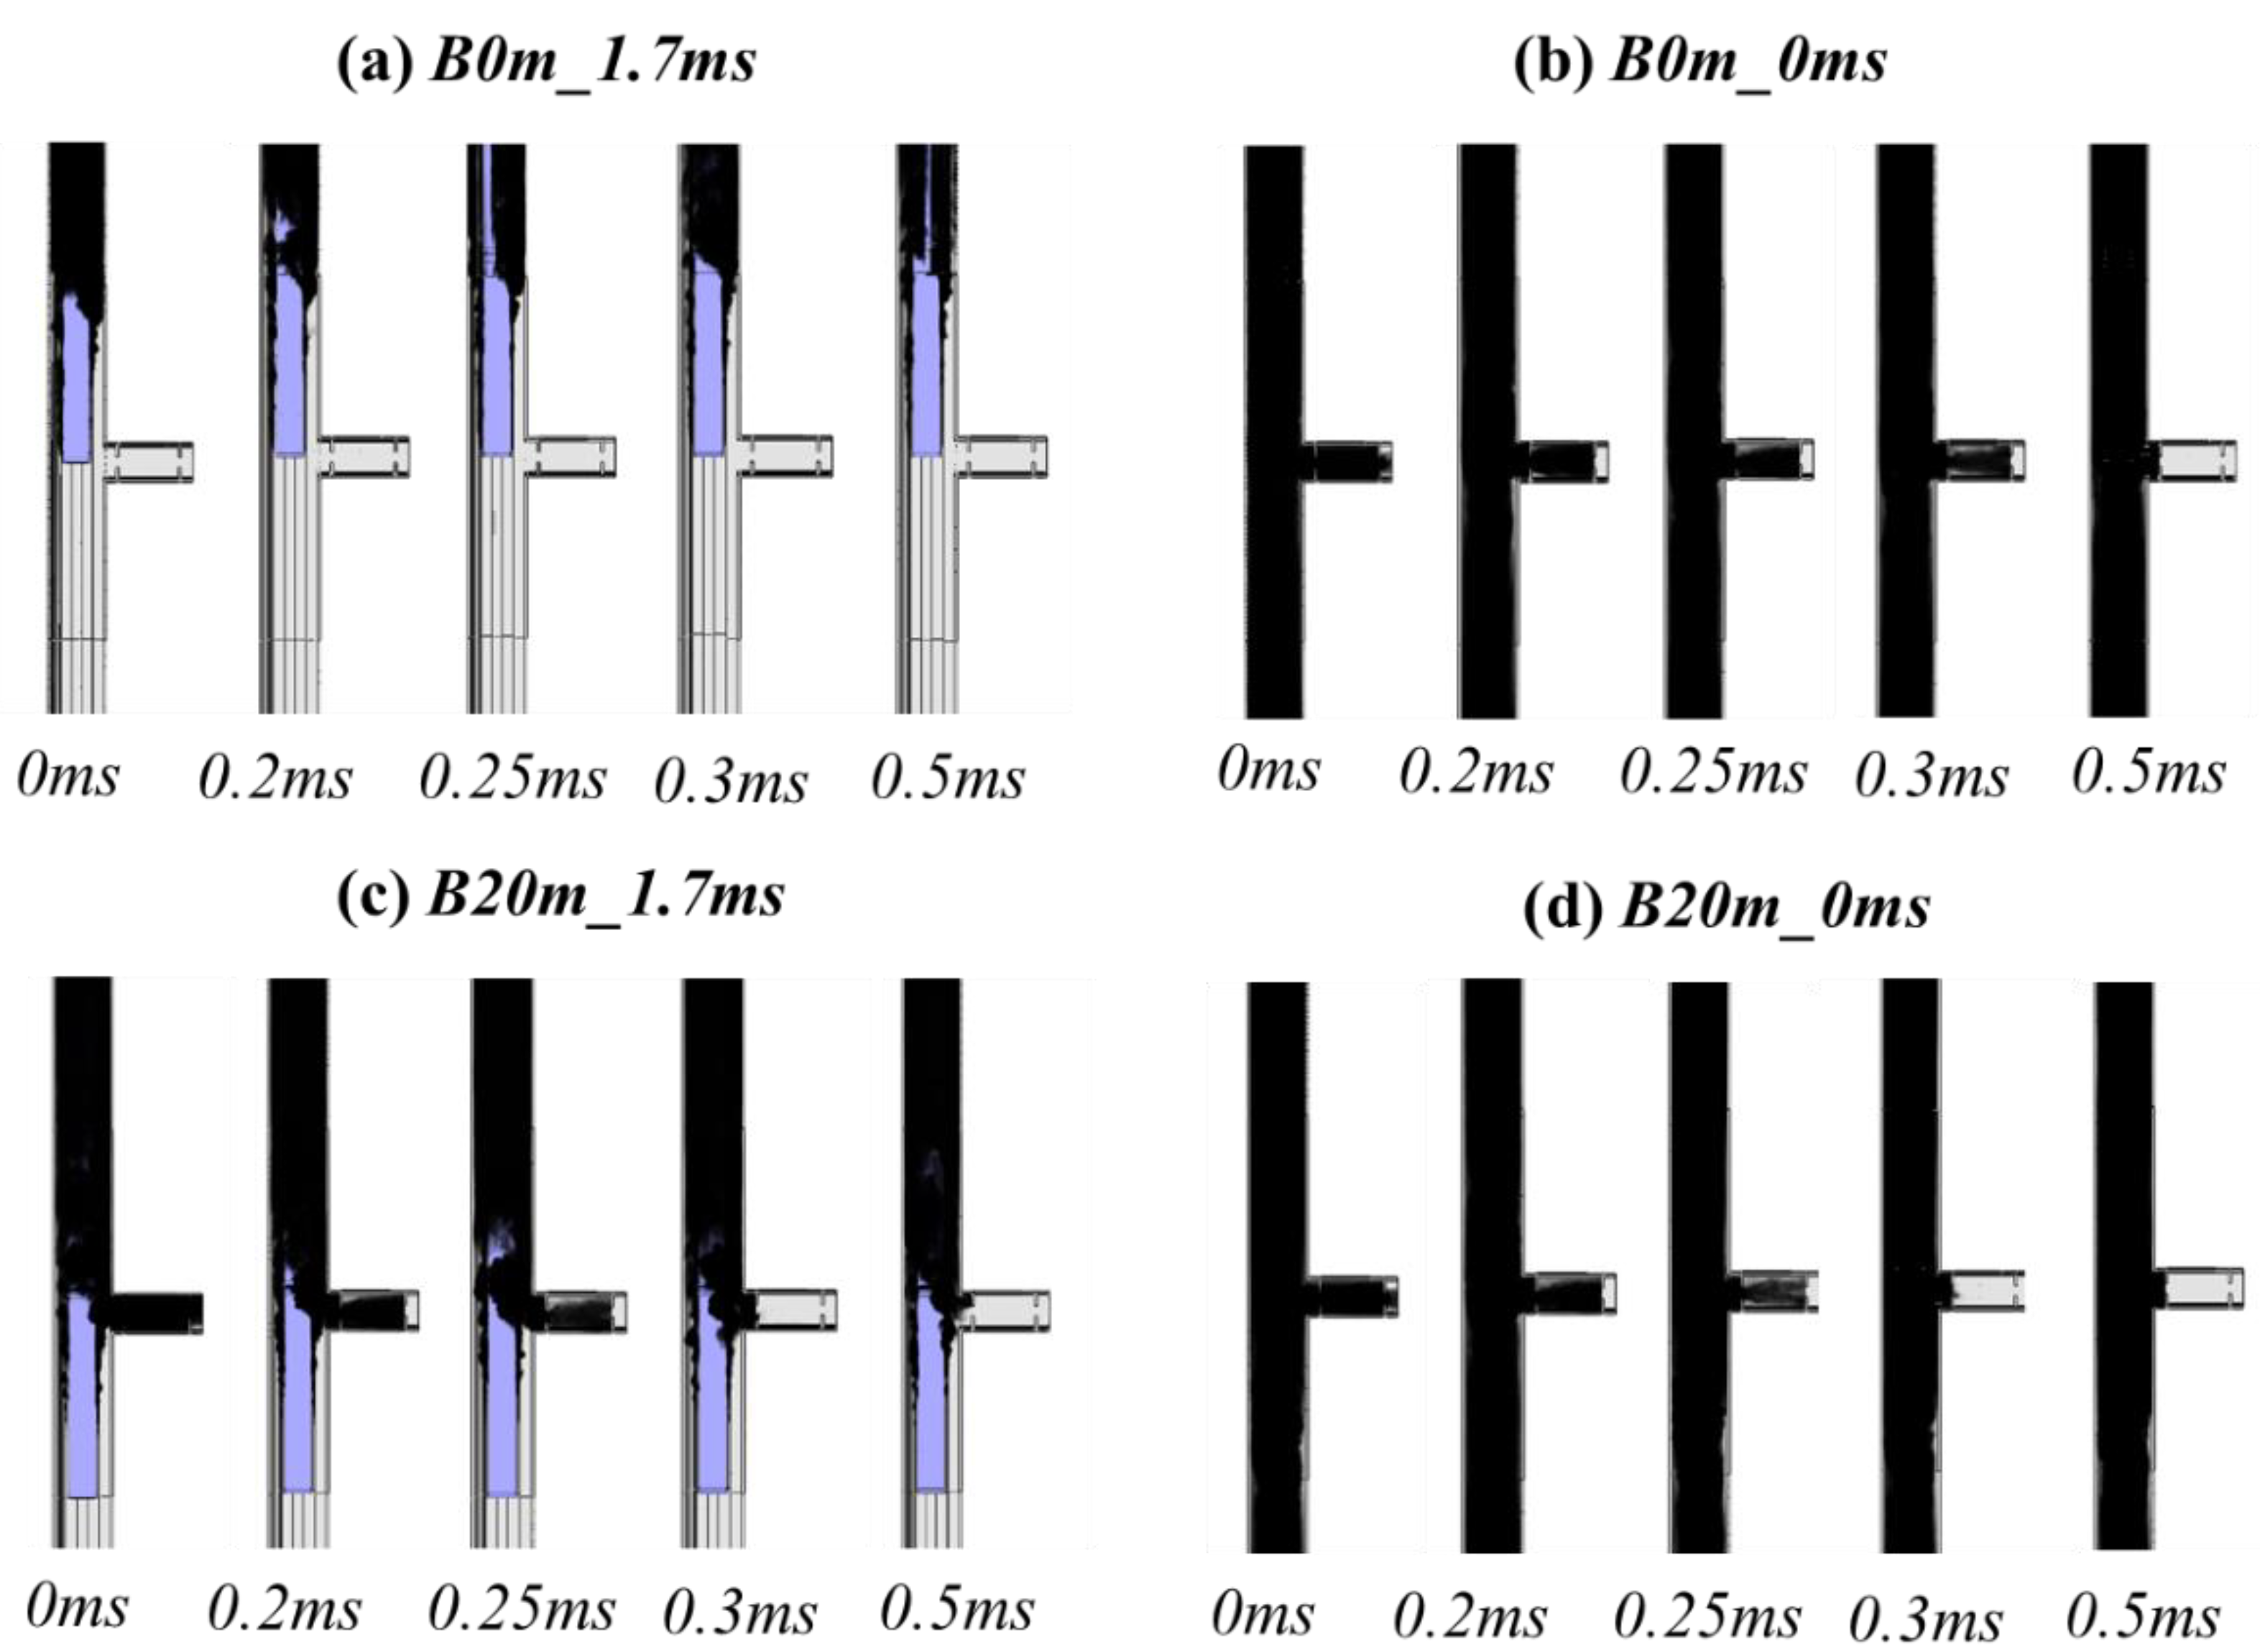
To further investigate the effects of fire location, tunnel and cross-passage velocities on the smoke movement, the 3D visualisation of the smoke distribution at the cross-passage main tunnel intersection for all the undercarriage fire cases is illustrated in Figure 10. The contours were extracted after 400 s of simulation time. For cases without ventilation in both longitudinal and cross-passage (i.e., Figure 10b,d), the smoke has significantly travelled along the cross-passage hallway, where the smoke layer has occupied the entire tunnel domain. As mentioned previously, there is a contrasting effect between the main tunnel critical velocity and fire/train location. When the fire/train is aligned with the cross-passage (Figure 11a), the cross-passage velocity was not necessary as the smoke was all driven downstream. Compared to the results in Figure 10c, where the train/fire is located 20 m upstream of the cross-passage, the main tunnel velocity has aggravated the smoke flow into the cross-passage until a 0.3 m/s cross-passage velocity is applied. On the other hand, if there is no tunnel velocity, the cross-passage velocity requirement is reduced for the B20m cases (0.3 m/s) compared to B0m (0.5 m/s) as the smoke layer velocities are reduced as the distance between the fire and the cross-passage door increases.
In summary, the results showed that with a 0.5 m/s cross-passage velocity, the smoke movement was restrained before travelling through the first cross-passage door regardless of the variety in train location and main tunnel velocity. It also showed that a 0.3 m/s cross-passage velocity is sufficient to prevent smoke at the first cross-passage door in most scenarios, except if there is no tunnel velocity and the fire is directly located at the cross-passage. If the smoke control criteria are focused on the second cross-passage door, only 0.2 m/s is required under all scenarios. Referring back to the results in Table 2, 0.5 m/s, 0.3 m/s and 0.2 m/s cross-passage velocities would correspond to an actual doorway velocity of approximately 1.41 m/s, 0.84 m/s and 0.57 m/s, respectively.

5.2. Temperature and Velocity Profile at the Cross-Passage Door

In cross-passage ventilation and smoke control studies, most works only focus on the critical velocity required to prevent smoke movement, and the fluid dynamics at the cross-passage doorway are rarely considered. For an enclosure fire scenario, the neutral plane is the surface where inflow and outflow are separated at the doorway. Because of the significant difference in thermal and toxicity concentration between inflow and outflow, the height of the neutral plane is one of the most crucial parameters for fire safety design and firefighting strategies [63,64]. Figure 11 shows the temperature and velocity profile along the height of the cross-passage doorway. The results are time-averaged from 350–400 s, and the cases with the same fire location (i.e., B0m and B20m) are plotted together where the solid line presents scenarios with no tunnel velocity and the broken line with markers presents the scenarios with a tunnel velocity of 1.7 m/s.
As expected, the temperature profile (Figure 11a,c) at the ceiling increases with decreasing cross-passage velocity as it corresponds to increasing smoke and hot gases entering the doorway. This is also reflected in the velocity profiles shown in Figure 11b,d, which show that for cases with sufficient cross-passage velocity, the velocity profiles are negative (i.e., travelling into the main tunnel), and the shape resembles the ideal profile for turbulent flow. When the cross-passage velocity decreases to below the threshold, the velocity at the ceiling shifts from negative to positive values (i.e., travelling into the cross-passage) and the neutral plane (i.e., the transition point where the velocity is 0) shifts down to lower door heights. It is interesting to note that reducing the cross-passage velocity did not cause a significant increase in the magnitude of the inflow velocity across datasets with the same fire location and tunnel velocity. The outlier case is when there is a combination of zero cross-passage velocity with 1.7 m/s tunnel velocity, resulting in a significantly larger positive inflow velocity than all the other cases. This phenomenon is hazardous if the fire is located upstream of the cross-passage. From Figure 11c, it can be seen that the temperature profile is significantly higher than all the rest of the cases, with a minimum temperature of 62.9 °C and a maximum temperature of 103 °C.

6. Discussion

In this numerical study, a total of 28 cases with various cross-passage ventilation settings were examined, including longitudinal tunnel velocity, cross-passage velocity, train location relative to the cross-passage and fire location. In summary, all cases where 0.5 m/s was applied at the cross-passage boundary showed no smoke present in the cross-passage for the duration of the simulation, even for cases with no tunnel velocity. However, it is important to note that the 0.5 m/s was applied at the connection between the cross-passage and the non-incident bore, so the velocity through the cross-passage door will be approximately proportional to the area change between the cross-passage and the door. This translates to an average velocity of 1.41 m/s across the transition doorway, which was above the AS1668.1 standard of 1 m/s. However, the above scenario is overly conservative as the safety standards also assume a critical velocity to be maintained at the main longitudinal tunnel and a near-zero velocity should always be avoided. Taking this into consideration, a cross-passage velocity of 0.3 m/s would be sufficient for all scenarios except when there is no tunnel velocity and the fire is directly located at the cross-passage. A 0.3 m/s cross-passage velocity translates into an average doorway velocity of 0.84 m/s and provides a more appropriate estimate for the cross-passage critical velocity.
In comparison to semi-empirical methods, the Li method results in a cross-passage critical velocity of 0.734 m/s compared to 0.610 m/s from Tarada, which are both lower than the simulation predictions. Nevertheless, both numerical and empirical results were significantly lower than the standard 1.0 m/s minimum flow rate for smoke control (AS1668.1) and are roughly in line with the RWS standard of 0.75 m/s. Higher requirements will increase the required ventilation power in tunnels and increase the capital and operational costs of the infrastructure.

7. Conclusions

Understanding smoke behaviour in rail tunnel cross-passages is important because it contributes to developing robust fire life safety and ensuring occupants can safely evacuate. Additionally, an accurately sized ventilation system can be designed, which can save cost. In this study, numerical simulations were performed using the Fire Dynamic Simulator (FDS) to investigate the smoke behaviour in an underground rail tunnel cross-passage under different applied velocities. A total of 28 cases were modelled, considering varying train locations, fire locations and combinations of applied and absent longitudinal and cross-passage velocities. The modelling showed that undercarriage fires were generally worse than top carriage fires because of buoyancy filling the tunnel and cross-passage cross-section with smoke. In particular, an undercarriage fire located on the first carriage 20 m upstream of the cross-passage was the most onerous, especially for cases with no cross-passage velocity. The combination of an upstream fire and tunnel velocity causes substantial inflow into the cross-passage, resulting in rapid smoke buildup and high temperatures at the cross-passage (62.9–103 °C from floor to ceiling).
The applied 0.3 m/s at the cross-passage boundary with the non-incident tunnel, corresponding to an average of 0.84 m/s through the first cross-passage door, was sufficient for smoke control. In comparison, two theoretical calculation methods for cross-passage door critical velocity were performed and showed that the utilisation of the Froude number produced a less conservative result (0.610 m/s) than a dimensionless method (0.734 m/s). Both methods gave values less than the 1.0 m/s standard in AS1668.1 based on the modelled geometry, which provides evidence for revising the standard for rail tunnels.

Author Contributions

Conceptualization, T.B.Y.C. and A.C.Y.Y.; data curation, T.B.Y.C. and H.L.; formal analysis, T.B.Y.C. and I.M.D.C.C.; funding acquisition, G.H.Y.; methodology, T.B.Y.C. and A.C.Y.Y.; project administration, G.H.Y.; resources, A.C.Y.Y.; software, T.B.Y.C., H.L., R.C. and A.E.; validation, T.B.Y.C. and A.E.; visualization, I.M.D.C.C.; writing—original draft, T.B.Y.C., A.C.Y.Y. and A.E.; writing—review & editing, A.C.Y.Y., R.C. All authors have read and agreed to the published version of the manuscript.

Funding

This research was funded by the Australian Research Council (ARC Industrial Training Transformation Centre, grant number: IC170100032) and the Australian Government Research Training Program Scholarship. All financial and technical supports are greatly appreciated.

Institutional Review Board Statement

Not applicable.

Informed Consent Statement

Not applicable.

Data Availability Statement

Not applicable.

Conflicts of Interest

The authors declare no conflict of interest.

Nomenclature

A Tunnel cross-sectional area (m2)
C p Specific heat capacity (J/kg K)
D * Characteristic length of the fire plume
g Acceleration due to gravity (m2/s)
F r c Critical Froude number
H Height of tunnel cross-section (m)
H ¯ Hydraulic diameter (m)
k thermal conductivity
L b Backlayering length (m)
m ˙ Mass flow rate (m)
Q c ˙ Convective heat release rate (kW)
Q ˙ Heat release rate
T Temperature
T o Ambient temperature (K)
T f Flame temperature (K)
u Horizontal gas velocity
V c Critical velocity (m/s)
W Width of tunnel (m)
Greek Symbols
ρ Density (kg/m3)
ρ f Smoke density (kg/m3)
ρ o Ambient density (kg/m3)
δ x Grid length
Subscripts
a Subscript for ambient
c c Subscript for cross-passage critical
d Subscript for cross-passage
t Subscript for tunnel
A S Australian Standard
C A D Computer-Aided Design
C F D Computational Fluid Dynamics
F D S Fire Dynamics Simulator
N I S T National Institute of Standards and Technology
N F P A National Fire Protection Association
wrtwith respect to
X P Cross-Passage

References

  1. Gehandler, J. Road tunnel fire safety and risk: A review. Fire Sci. Rev. 2015, 4, 2. [Google Scholar] [CrossRef]
  2. Barbato, L.; Cascetta, F.; Musto, M.; Rotondo, G. Fire safety investigation for road tunnel ventilation systems–an overview. Tunn. Undergr. Space Technol. 2014, 43, 253–265. [Google Scholar] [CrossRef]
  3. Capote, J.; Alvear, D.; Abreu, O.; Lázaro, M.; Cuesta, A. Evacuation Modelling of Fire Scenarios in Passenger Trains; Springer: Berlin, Heidelberg, 2010; pp. 705–711. [Google Scholar]
  4. Standards Australia. AS/NZS 1668.1:2015—The Use of Ventilation and Air Conditioning in Buildings Fire and Smoke Control in Buildings; Standards Australia: Sydney, NSW, Australia, 2015. [Google Scholar]
  5. Li, Y.Z.; Lei, B.; Ingason, H. Scale modeling and numerical simulation of smoke control for rescue stations in long railway tunnels. J. Fire Prot. Eng. 2012, 22, 101–131. [Google Scholar] [CrossRef]
  6. Ingason, H. State of the art of tunnel fire research. In Proceedings of the 9th International Symposium on Fire Safety Science, Karlsruhe, Germany, 21–26 September 2008. [Google Scholar]
  7. Thomas, P.H. The movement of smoke in horizontal passages against an air flow. Fire Res. Stn. 1968, 723. [Google Scholar]
  8. Li, Y.Z.; Lei, B.; Ingason, H. Study of critical velocity and backlayering length in longitudinally ventilated tunnel fires. Fire Saf. J. 2010, 45, 361–370. [Google Scholar] [CrossRef]
  9. Kile, G.W.; Gonzalez, J.A. The Memorial tunnel fire ventilation test program: The longitudinal and natural tests. Ashrae Trans. 1997, 103, 701. [Google Scholar]
  10. Brinckerhoff, B.; Brinckerhoff, P. Memorial Tunnel Fire Ventilation Test Report; Massachusetts Highway Department: Boston, MA, USA, 1995. [Google Scholar]
  11. Ingason, H.; Li, Y.Z.; Lönnermark, A. Runehamar tunnel fire tests. Fire Saf. J. 2015, 71, 134–149. [Google Scholar] [CrossRef]
  12. Ingason, H.; Lönnermark, A. Heat release rates from heavy goods vehicle trailers in tunnels. Fire Saf. J. 2005, 40, 22. [Google Scholar] [CrossRef]
  13. Lönnermark, A.; Ingason, H. Fire spread and flame length in large-scale tunnel fires. Fire Technol. 2006, 42, 283–302. [Google Scholar] [CrossRef]
  14. Hu, L.H.; Huo, R.; Chow, W.K. Studies on buoyancy-driven back-layering flow in tunnel fires. Exp. Therm. Fluid Sci. 2008, 32, 1468–1483. [Google Scholar] [CrossRef]
  15. Stahlanwendung, S. Fires in Transport Tunnels: Report on Full-Scale Tests; Eureka-Project EU 499: FIRETUN; Conducted by the Following 9 European Countries: Austria, Finland, France, Germany, Great Britain, Italy, Norway, Sweden, Switzerland; Verlag u. Vertriebsges. mbH: Düsseldorf, Germany, 1995. [Google Scholar]
  16. Haack, A. Fire protection in traffic tunnels: General aspects and results of the EUREKA project. Tunn. Undergr. Space Technol. 1998, 13, 377–381. [Google Scholar] [CrossRef]
  17. Saleheen, Z.; Krishnamoorthy, R.R.; Nadjai, A. A review on behavior, material properties and finite element simulation of concrete tunnel linings under fire. Tunn. Undergr. Space Technol. 2022, 126, 104534. [Google Scholar] [CrossRef]
  18. Ingason, H. Fire development in large tunnel fires. In Proceedings of the 8th International Symposium on Fire Safety Science, Beijing, China, 18–23 September 2005; pp. 18–23. [Google Scholar]
  19. Oka, Y.; Atkinson, G.T. Control of Smoke Flow in Tunnel Fires. Fire Saf. J. 1995, 305–322. [Google Scholar] [CrossRef]
  20. NFPA (National Fire Protection Agency). NFPA 502: Standard for Road Tunnels, Bridges, and Other Limited Access Highways, Annex D; NFPA: Quincy, MA, USA, 2019. [Google Scholar]
  21. PIARC Committee on Road Tunnels (C5). Technical Committee 5 Road Tunnels, Fire and Smoke Control in Road Tunnels; World Road Association (PIARC): La Défense, France, 1999. [Google Scholar]
  22. European Parliament, Council of the European Union, Directive 2004/54/EC of the European Parliament and of the Council on Minimum Safety Requirements for Tunnels in the Trans European Road Network. 2004. Available online: https://eur-lex.europa.eu/legal-content/EN/ALL/?uri=celex:32004L0054 (accessed on 8 September 2022).
  23. Sturm, P.; Beyer, M.; Rafiei, M. On the problem of ventilation control in case of a tunnel fire event. Case Stud. Fire Saf. 2017, 7, 36–43. [Google Scholar] [CrossRef]
  24. RABT 2016; Richtlinien fur die Ausstattung und den Betrieb von Strasentunneln [Guidelines for road tunnel equipment and operation]. RABT: Zella-Mehlis, Germany, 2016.
  25. ASTRA 13 001; Lüftung der Strassentunnel [Ventilation of Road Tunnels]. Bundesamt für Strassen (ASTRA): Ittigen, Switzerland, 2008.
  26. RVS 09.02.31; Tunnel, Tunnelausrüstung, Belüftung, Grundlagen, Österreich, [Tunnels, Tunnel Equipment, Ventilation, Basics, Austria]. Research Society Road—Rail—Transport (FSV): Vienna, Austria, 2014.
  27. Donald, M. Air Velocities Permitted in Road Tunnels, and Other Requirements for a Safe Escape Route in Case of Fire; World Road Association (PIARC): La Défense, France, 2018. [Google Scholar]
  28. Lee, C.K.; Chaiken, R.F.; Singer, J.M. Interaction Between Duct Fires and Ventilation Flow: An Experimental Study. Combust. Sci. Technol. 1979, 20, 59–72. [Google Scholar] [CrossRef]
  29. Kennedy, W.D. Critical Velocity: Past, Present and Future. In Proceedings of the One Day Seminar on Smoke and Critical Velocity in Tunnels, London, UK, 2 April 1996. [Google Scholar]
  30. Li, Y.Z.; Ingason, H. Discussions on critical velocity and critical Froude number for smoke control in tunnels with longitudinal ventilation. Fire Saf. J. 2018, 99, 22–26. [Google Scholar] [CrossRef]
  31. Tarada, F. Critical Velocities for Smoke Control in Tunnel Cross-Passages. In Proceedings of the First International Conference on Major Tunnel and Infrastructure Projects, Taipei, Taiwan, 22–24 May 2000. [Google Scholar]
  32. Langner, V.; Bopp, R.; Bailey, P.R. Minimum flow velocity through open cross passages in twin bore rail tunnels. In Proceedings of the 5th International Conference ‘Tunnel Safety and Ventilation’, Graz, Austria, 3–4 May 2010. [Google Scholar]
  33. Tarada, F. New Perspectives on the Critical Velocity for Smoke Control. In Proceedings of the Fourth International Symposium on Tunnel Safety and Security, Frankfurt am Main, Germany, 17–19 March 2010. [Google Scholar]
  34. Li, Y.Z.; Lei, B.; Ingason, H. Theoretical and Experimental Study of Critical Velocity for Smoke Control in a Tunnel Cross-Passage. Fire Technol. 2013, 49, 435–449. [Google Scholar] [CrossRef]
  35. Li, Y.Z.; Ingason, H. Effect of cross section on critical velocity in longitudinally ventilated tunnel fires. Fire Saf. J. 2017, 91, 303–311. [Google Scholar] [CrossRef]
  36. Yuen, A.C.Y.; Chen, T.B.Y.; Cordero, I.M.D.C.; Liu, H.; Li, A.; Yang, W.; Cheung, S.C.P.; Chan, Q.N.; Kook, S.; Yeoh, G.H. Developing a solid decomposition kinetics extraction framework for detailed chemistry pyrolysis and combustion modelling of building polymer composites. J. Anal. Appl. Pyrolysis 2022, 163, 105500. [Google Scholar] [CrossRef]
  37. De Cachinho Cordeiro, I.M.; Chen, T.B.Y.; Yuen, A.C.Y.; Wang, C.; Chan, Q.N.; Zhang, J.; Yeoh, G.H. Pyrolysis and combustion characterisation of HDPE/APP composites via molecular dynamics and CFD simulations. J. Anal. Appl. Pyrolysis 2022, 163, 105499. [Google Scholar] [CrossRef]
  38. Liu, H.; Cachinho Cordeiro, I.M.D.; Yin Yuen, A.C.; Chan, Q.N.; Kook, S.; Yeoh, G.H. Application of multi-parametric characterization to water-based fire suppression systems in compartment fire scenarios. Numer. Heat Transf. Part A Appl. 2022, 1–19. [Google Scholar] [CrossRef]
  39. Li, A.; Yuen, A.C.Y.; Wang, W.; Chen, T.B.Y.; Lai, C.S.; Yang, W.; Wu, W.; Chan, Q.N.; Kook, S.; Yeoh, G.H. Integration of Computational Fluid Dynamics and Artificial Neural Network for Optimization Design of Battery Thermal Management System. Batteries 2022, 8, 69. [Google Scholar] [CrossRef]
  40. Li, A.; Yuen, A.C.Y.; Wang, W.; Weng, J.; Yeoh, G.H. Numerical investigation on the thermal management of lithium-ion battery system and cooling effect optimization. Appl. Therm. Eng. 2022, 215, 118966. [Google Scholar] [CrossRef]
  41. Yuen, A.C.Y.; Chen, T.B.Y.; Yang, W.; Wang, C.; Li, A.; Yeoh, G.H.; Chan, Q.N.; Chan, M.C. Natural ventilated smoke control simulation case study using different settings of smoke vents and curtains in a large Atrium. Fire 2019, 2, 7. [Google Scholar] [CrossRef]
  42. Chen, T.B.Y.; Yuen, A.C.Y.; Yeoh, G.H.; Yang, W.; Chan, Q.N. Fire Risk Assessment of Combustible Exterior Cladding Using a Collective Numerical Database. Fire 2019, 2, 11. [Google Scholar] [CrossRef]
  43. Huo, Y.; Zou, G.W.; Gao, Y.; Li, S.S. Large eddy simulation of post-flashover room fires based on the Vreman subgrid-scale model. Int. J. Heat Mass Transf. 2015, 91, 872–884. [Google Scholar] [CrossRef]
  44. Sajid, Z.; Yang, Y.; You, P.; Deng, H.; Cheng, X.; Danial, S.N. An Explorative Methodology to Assess the Risk of Fire and Human Fatalities in a Subway Station Using Fire Dynamics Simulator (FDS). Fire 2022, 5, 69. [Google Scholar] [CrossRef]
  45. Cao, R.F.; Lee, E.W.M.; Yuen, A.C.Y.; Chen, T.B.Y.; De Cachinho Cordeiro, I.M.; Shi, M.; Wei, X.; Yeoh, G.H. Simulation of competitive and cooperative egress movements on the crowd emergency evacuation. Simul. Model. Pract. Theory 2021, 109, 102309. [Google Scholar] [CrossRef]
  46. Wang, W.; Zhu, Z.; Jiao, Z.; Mi, H.; Wang, Q. Characteristics of fire and smoke in the natural gas cabin of urban underground utility tunnels based on CFD simulations. Tunn. Undergr. Space Technol. 2021, 109, 103748. [Google Scholar] [CrossRef]
  47. Cheng, C.H.; Chow, C.L.; Chow, W.K. A simulation study of tenability for passengers in a railway tunnel with arson fire. Tunn. Undergr. Space Technol. 2021, 108, 103679. [Google Scholar] [CrossRef]
  48. Guo, X.; Pan, X.; Wang, Z.; Yang, J.; Hua, M.; Jiang, J. Numerical simulation of fire smoke in extra-long river-crossing subway tunnels. Tunn. Undergr. Space Technol. 2018, 82, 82–98. [Google Scholar] [CrossRef]
  49. Guo, X.; Zhang, Q. Analytical solution, experimental data and CFD simulation for longitudinal tunnel fire ventilation. Tunn. Undergr. Space Technol. 2014, 42, 307–313. [Google Scholar] [CrossRef]
  50. Tao, H.; Xu, Z.; Zhou, D. Investigation of the Temperature Beneath Curved Tunnel Ceilings Induced by Fires with Natural Ventilation. Fire 2022, 5, 90. [Google Scholar] [CrossRef]
  51. Li, Y.; Huang, F.; Ma, C.; Tang, K. A Simulation Study on the Smoke Control Effect with Different Smoke Exhaust Patterns and Longitudinal Air Supply for Ultra-Wide Tunnels. Fire 2022, 5, 72. [Google Scholar] [CrossRef]
  52. You, W.; Kong, J. Feasibility Analysis of Cross Passage Ventilation and Smoke Control in Extra-Long Submarine Tunnel. Fire 2022, 5, 102. [Google Scholar] [CrossRef]
  53. Hou, Y.-s.; Li, Y.-f.; Zhang, C. Influence of Train Location on Smoke Control in Tunnel Cross-passage. Procedia Eng. 2016, 135, 567–573. [Google Scholar] [CrossRef]
  54. Feng, S.; Li, Y.; Houc, Y.; Li, J.; Huang, Y. Study on the critical velocity for smoke control in a subway tunnel crosspassage. Tunn. Undergr. Space Technol. 2020, 97, 103234. [Google Scholar] [CrossRef]
  55. McGrattan, K.B.; McDermott, R.J.; Weinschenk, C.G.; Forney, G.P. Fire Dynamics Simulator Technical Reference Guide; National Institute of Standards and Technology: Gaithersburg, MD, USA, 2017.
  56. Smagorinsky, J. General circulation experiments with the primitive equations, i. the basic experiment. Mon. Weather Rev. 1963, 91, 99–164. [Google Scholar] [CrossRef]
  57. Lilly, D.K. The representation of small-scale turbulence in numerical simulation experiments. IBM Form. 1967, 320–1951, 195–210. [Google Scholar]
  58. Magnussen, B.F.; Hjertager, B.H. On mathematical modeling of turbulent combustion with special emphasis on soot formation and combustion. Symp. (Int.) Combust. 1977, 16, 719–729. [Google Scholar] [CrossRef]
  59. Khan, M.M.; Tewarson, A.; Chaos, M. Combustion characteristics of materials and generation of fire products. In SFPE Handbook of Fire Protection Engineering; Springer: Berlin/Heidelberg, Germany, 2016; pp. 1143–1232. [Google Scholar]
  60. Grosshandler, W.L. RadCal: A Narrow Band Model for Radiation Calculations in a Combustion Environment; National Institute of Standards and Technology: Gaithersburg, MD, USA, 1993.
  61. Hu, L.H.; Fong, N.K.; Yang, L.Z.; Chow, W.K.; Li, Y.Z.; Huo, R. Modeling fire-induced smoke spread and carbon monoxide transportation in a long channel: Fire Dynamics Simulator comparisons with measured data. J. Hazard. Mater. 2007, 140, 293–298. [Google Scholar] [CrossRef] [PubMed]
  62. McGrattan, K.; Miles, S. Modeling Fires Using Computational Fluid Dynamics (CFD). In SFPE Handbook of Fire Protection Engineering; Springer: New York, NY, USA, 2016; pp. 1034–1065. [Google Scholar] [CrossRef]
  63. Chen, Q.; Chen, T.B.Y.; Yuen, A.C.Y.; Wang, C.; Chan, Q.N.; Yeoh, G.H. Investigation of door width towards flame tilting behaviours and combustion species in compartment fire scenarios using large eddy simulation. Int. J. Heat Mass Transf. 2020, 150, 119373. [Google Scholar] [CrossRef]
  64. Chen, Q.; Yuen, A.C.Y.; Chen, T.B.Y.; Cao, R.F.; Liu, H.; Yeoh, G.H. A Large-Eddy Simulation study on the effect of fuel configuration and pan distance towards chemical species for under-ventilated compartment fire scenario. Int. J. Heat Mass Transf. 2022, 184, 122306. [Google Scholar] [CrossRef]
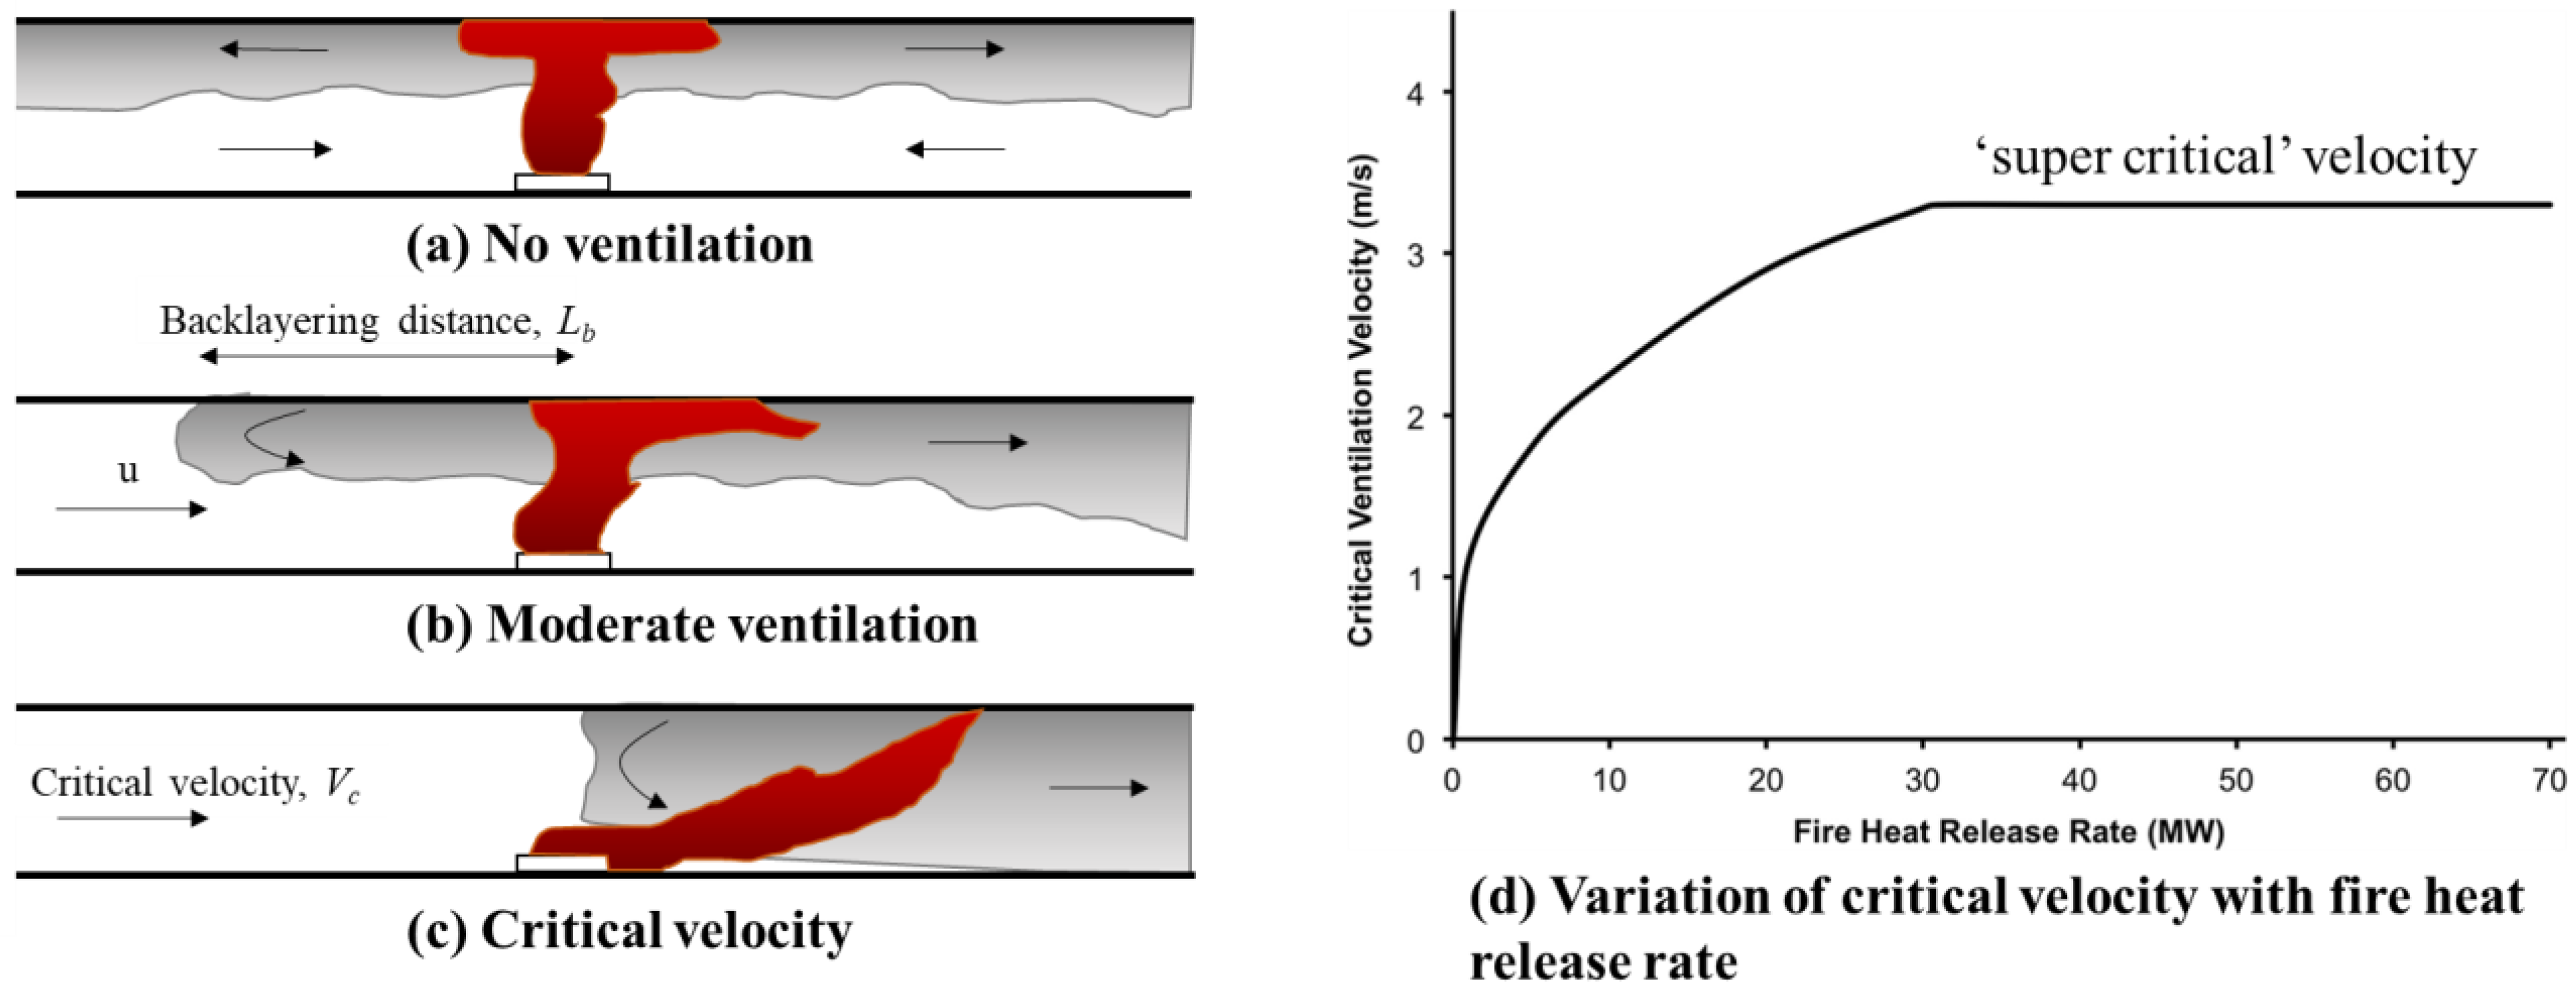
Figure 1. Illustration on (ac) the concept of backlayering of smoke in a longitudinal tunnel and (d) critical velocity for different fire sizes.
Fire 05 00140 g001
Figure 2. Smoke control in an underground rail cross-passage.
Fire 05 00140 g002
Figure 3. Critical velocity against tunnel ventilation velocity extracted from Li et al. [34]. Reprinted by permission from Springer Nature Ref [34], Copyright 2010.
Fire 05 00140 g003
Figure 4. (a) Mesh sensitivity study using the gas temperature profile and (b) gas temperature profile comparison between experimental and numerical predictions along the long channel for the 0.75 MW diesel pool fire case.
Fire 05 00140 g004
Figure 5. Geometry configuration and dimensions of (a) rail tunnel and cross-sectional view of (b) the cross-passage.
Fire 05 00140 g005
Figure 6. Side view of (a) train carriage with a connector and cross-sectional view of (b) train geometry front and top view of (c) two train locations with respect to the cross-passage.
Fire 05 00140 g006
Figure 7. Fire profile including (a) heat release rate over time and (b) designated fire locations on the train carriage.
Fire 05 00140 g007
Figure 8. Comparison of cross-passage critical velocity requirements calculated using Li et al. [19] and Tarada [18]. (a) shows the distribution of cross-passage critical velocity at different fire sizes and tunnel velocities and (b) shows the cross-passage critical velocity vs. tunnel velocity specifically for a 2 MW fire.
Fire 05 00140 g008
Figure 9. Comparison of temperature and smoke distribution of cross-passage between top and undercarriage fires: (a) B0m_0ms_0ms (b) T0m_0ms_0ms (c) B0m_0.5ms_0ms and (d) T0m_0.5ms_0ms.
Fire 05 00140 g009
Figure 10. Top view of the smoke distribution at the cross-passage main tunnel intersection for the undercarriage fire cases.
Fire 05 00140 g010
Figure 11. (a,c) Temperature and (b,d) doorway velocity distribution along the centre of the first cross-passage doorway of the undercarriage fires cases (B0m and B20m) for different tunnel and cross-passage velocities.
Fire 05 00140 g011
Table 1. Summary of the fire locations, train heat locations, longitudinal tunnel and cross-passage (XP) velocities of all case studies.
Fire Location Wrt Train CarriageTrain Head Location Wrt XP [m]Longitudinal Tunnel Velocity [m/s]XP Velocity
[m/s]
Bottom, Top0, 200, 1.70, 0.2, 0.25, 0.3, 0.5
Table 2. Summary of the smoke movement in cross-passages (XP) for different longitudinal tunnel and cross-passage velocities. Cases with cross-passage smoke are highlighted in orange, and the cases with no smoke are highlighted in green.
CaseSimulation IDAvg. XP Temperature [°C]Avg. XP U-Velocity [m/s]Smoke in XP
1B0m_0ms_0ms44.93−0.12Yes
2B0m_0ms_0.5ms34.47−1.41No
3B0m_1.7ms_0ms30.012.61No
4B0m_1.7ms_0.5ms30.00−1.41No
5T0m_0ms_0ms35.960.10No
6T0m_0ms_0.5ms30.71−1.40No
7T0m_1.7ms_0ms30.182.46No
8T0m_1.7ms_0.5ms30.05−1.41No
9B20m_0ms_0ms40.26−0.17Yes
10B20m_0ms_0.5ms32.59−1.40No
11B20m_1.7ms_0ms88.191.42Yes
12B20m_1.7ms_0.5ms30.58−1.40No
13T20m_0ms_0ms33.61−0.08Yes
14T20m_0ms_0.5ms30.92−1.41No
15T20m_1.7ms_0ms36.161.38Yes
16T20m_1.7ms_0.5ms30.02−1.41No
17B0m_0ms_0.2ms42.72−0.56Yes
18B0m_0ms_0.25ms41.31−0.70Yes
19B0m_0ms_0.3ms41.48−0.85Yes
20B0m_1.7ms_0.2ms30.00−0.56No
21B0m_1.7ms_0.25ms30.00−0.71No
22B0m_1.7ms_0.3ms30.00−0.84No
23B20m_0ms_0.2m37.70−0.57Yes
24B20m_0_ms_0.25m36.49−0.70Yes
25B20m_0ms_0.3m35.52−0.84No
26B20m_1.7ms_0.2m47.39−0.57Yes
27B20m_1.7ms_0.25m45.50−0.71Yes
28B20m_1.7ms_0.3m36.30−0.84No
Publisher’s Note: MDPI stays neutral with regard to jurisdictional claims in published maps and institutional affiliations.