
Factors Influencing Risk during Wildfires: Contrasting Divergent Regions in the US

Abstract
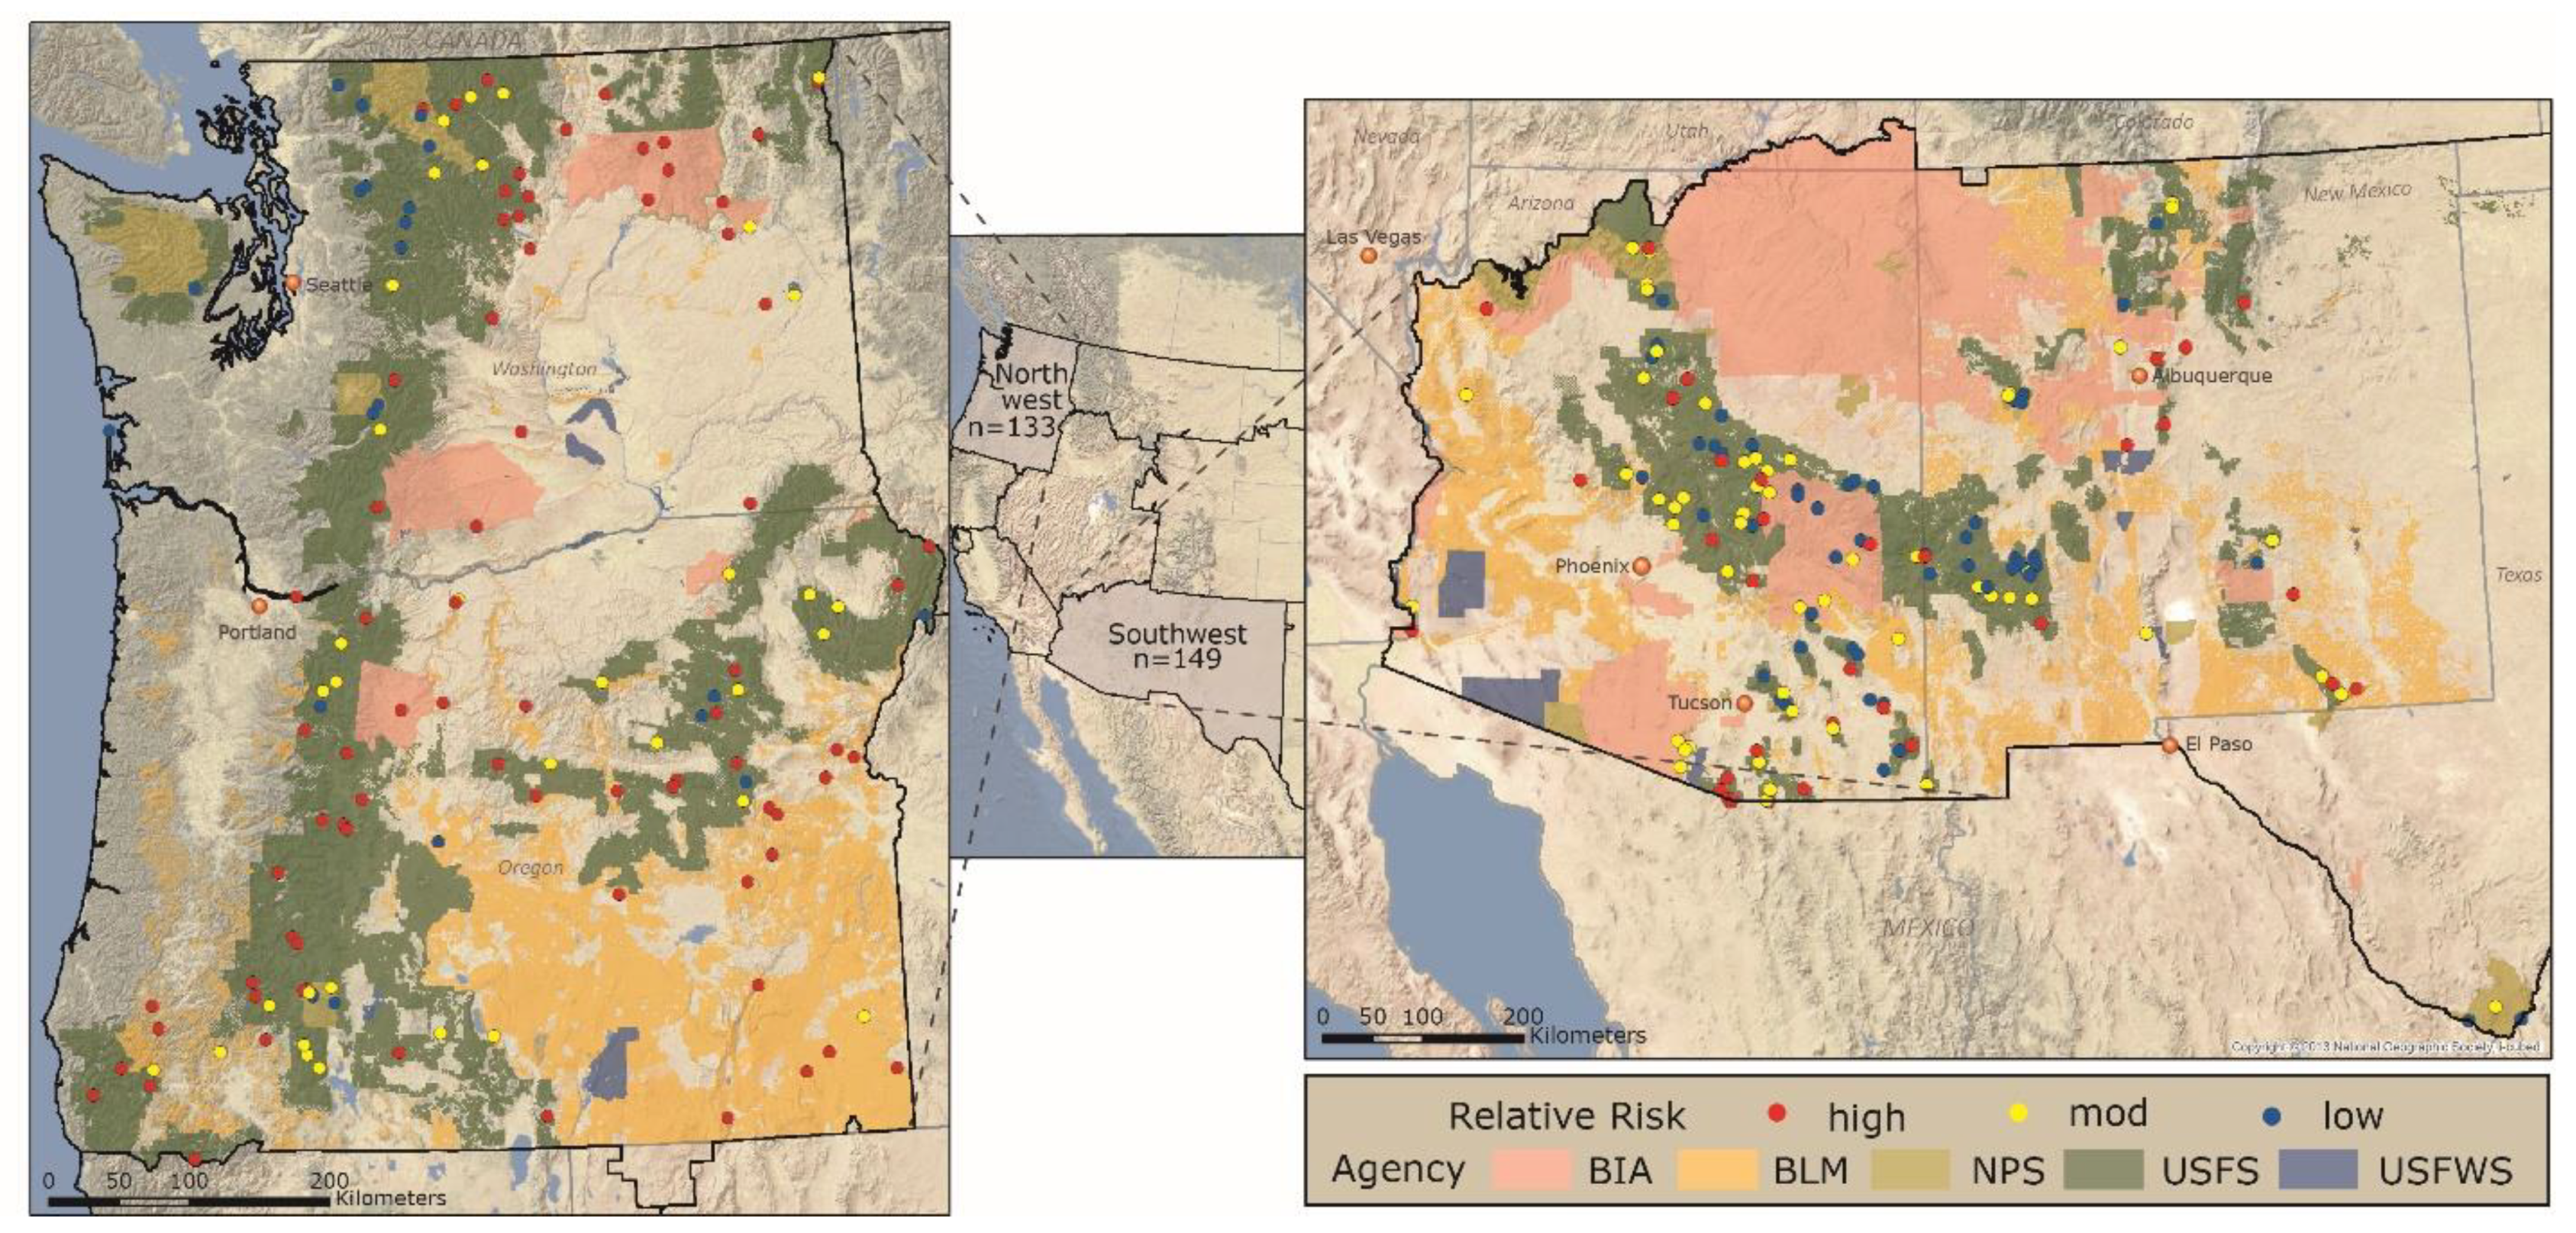
:1. Introduction
2. Materials and Methods
2.1. Data Collection
2.2. Coding
2.3. Data Analysis
3. Results
3.1. Themes and Codes Related to Wildfire Risk
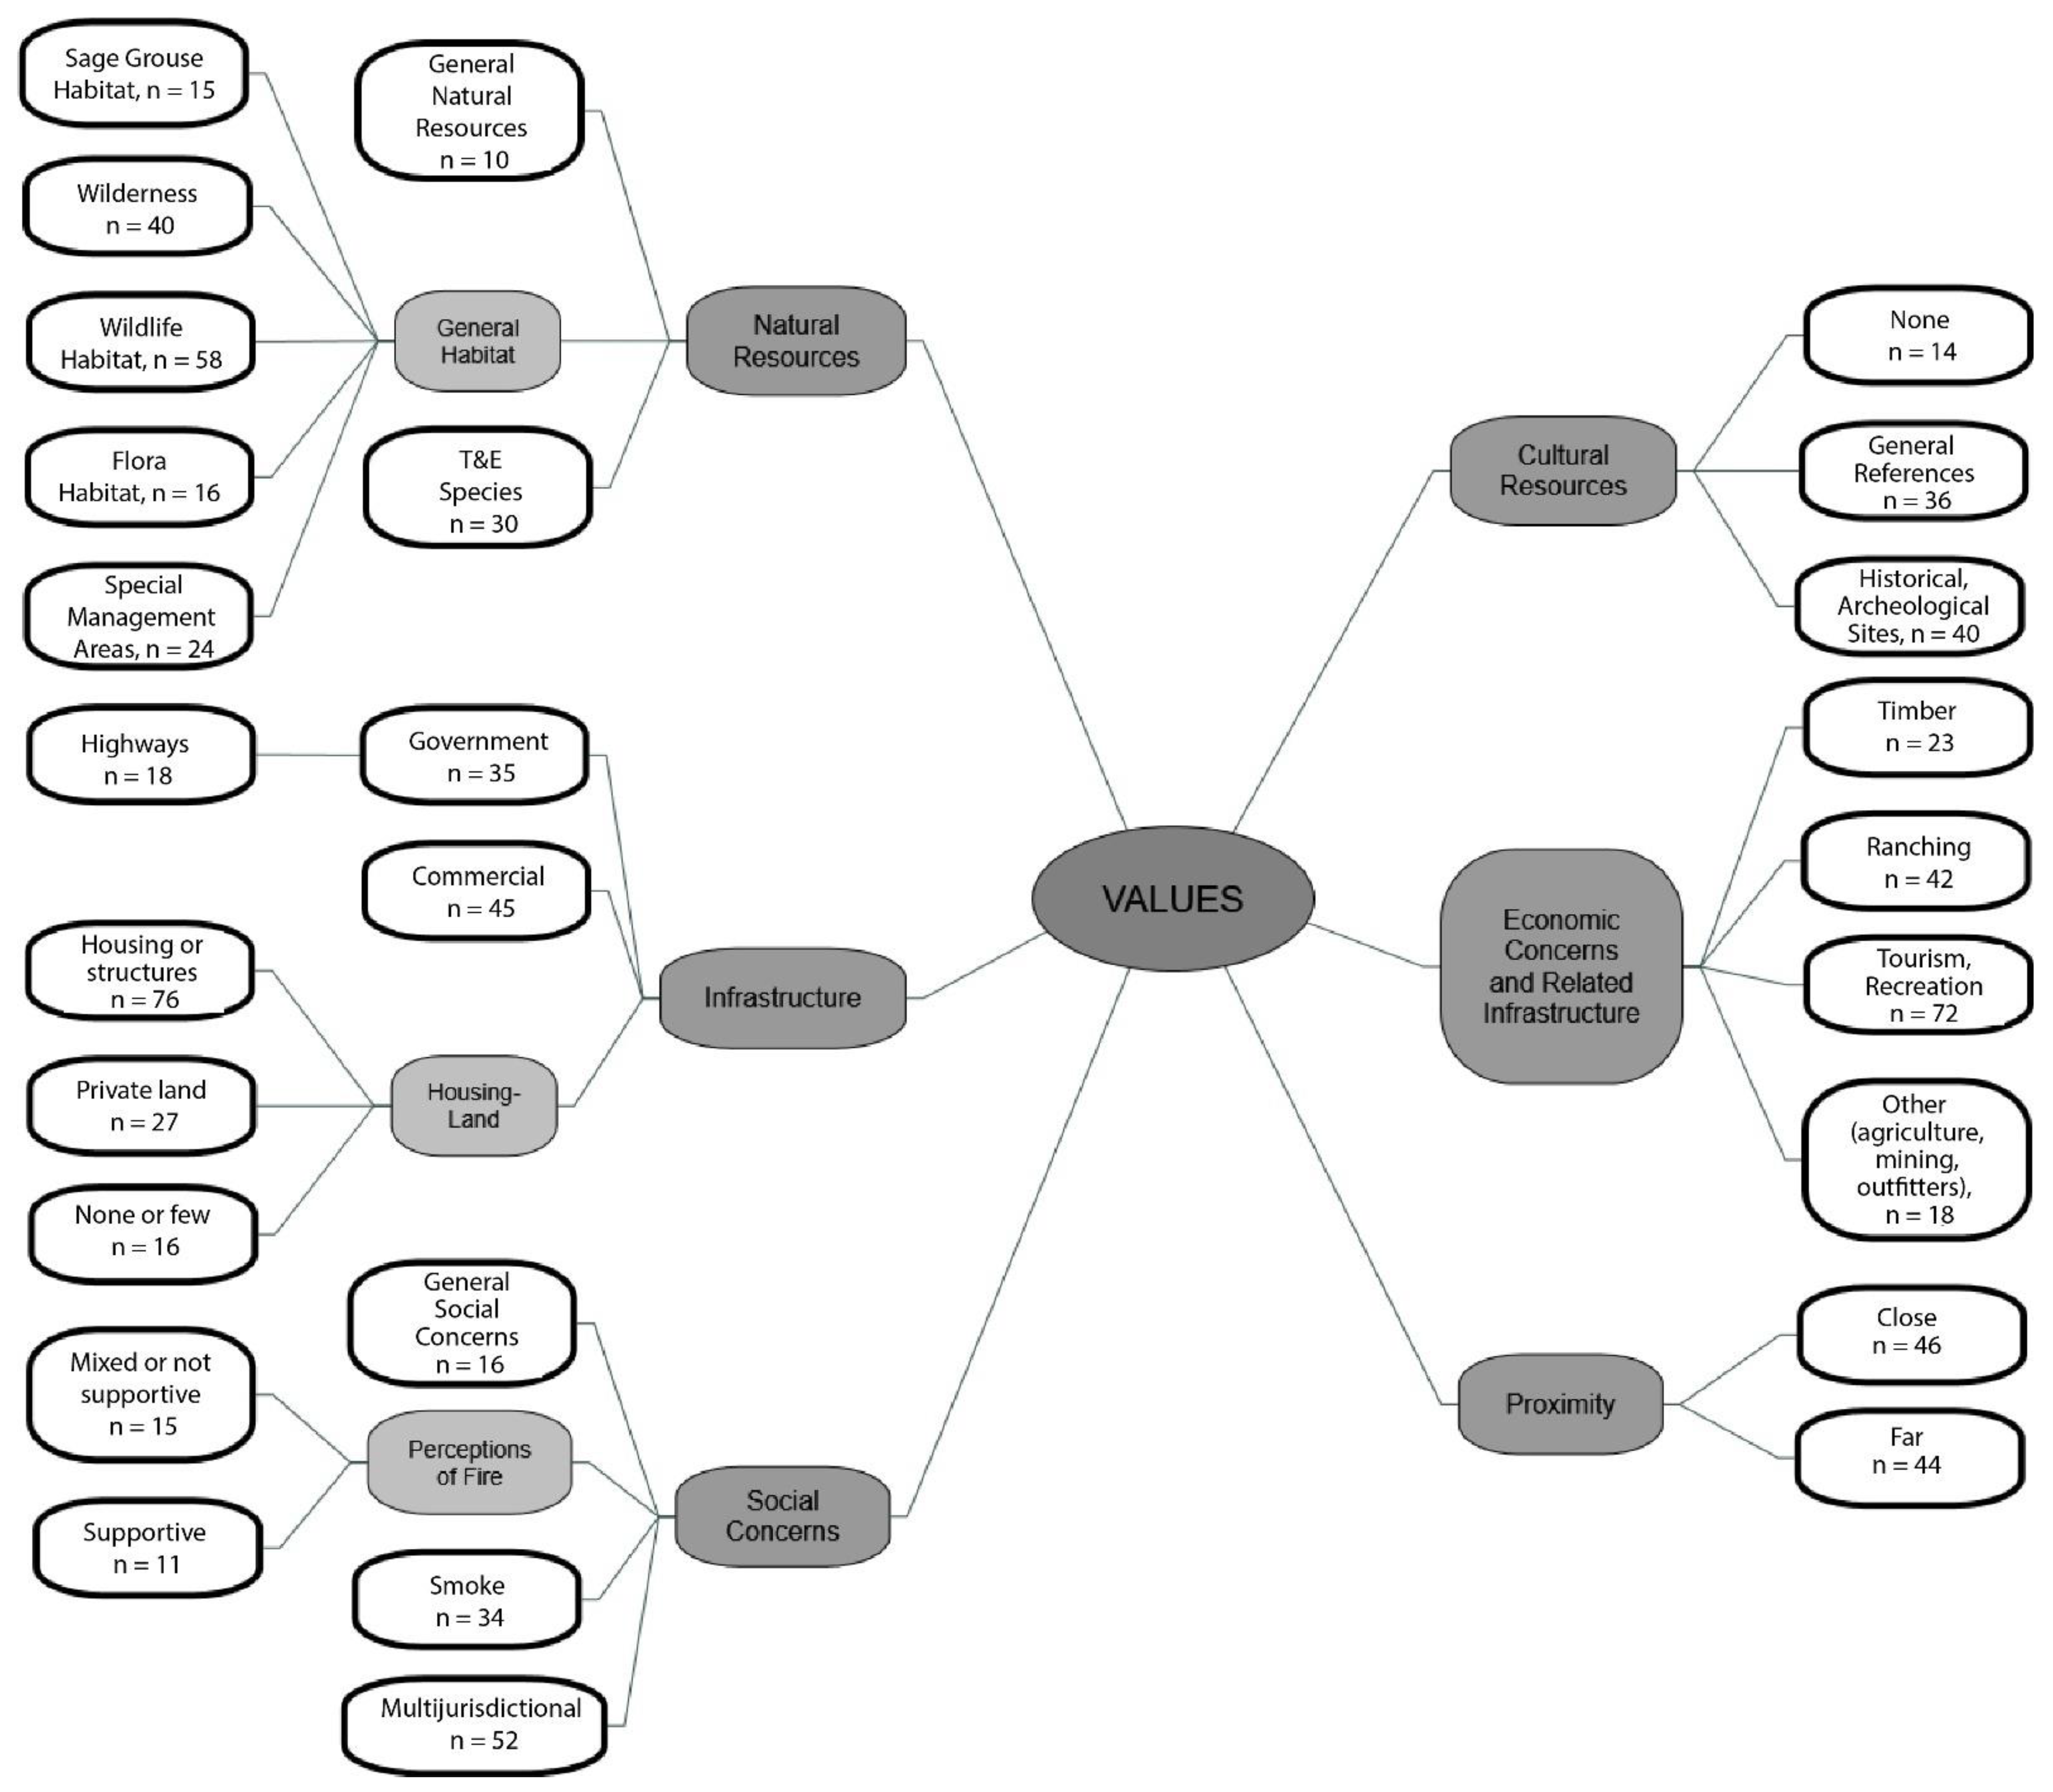
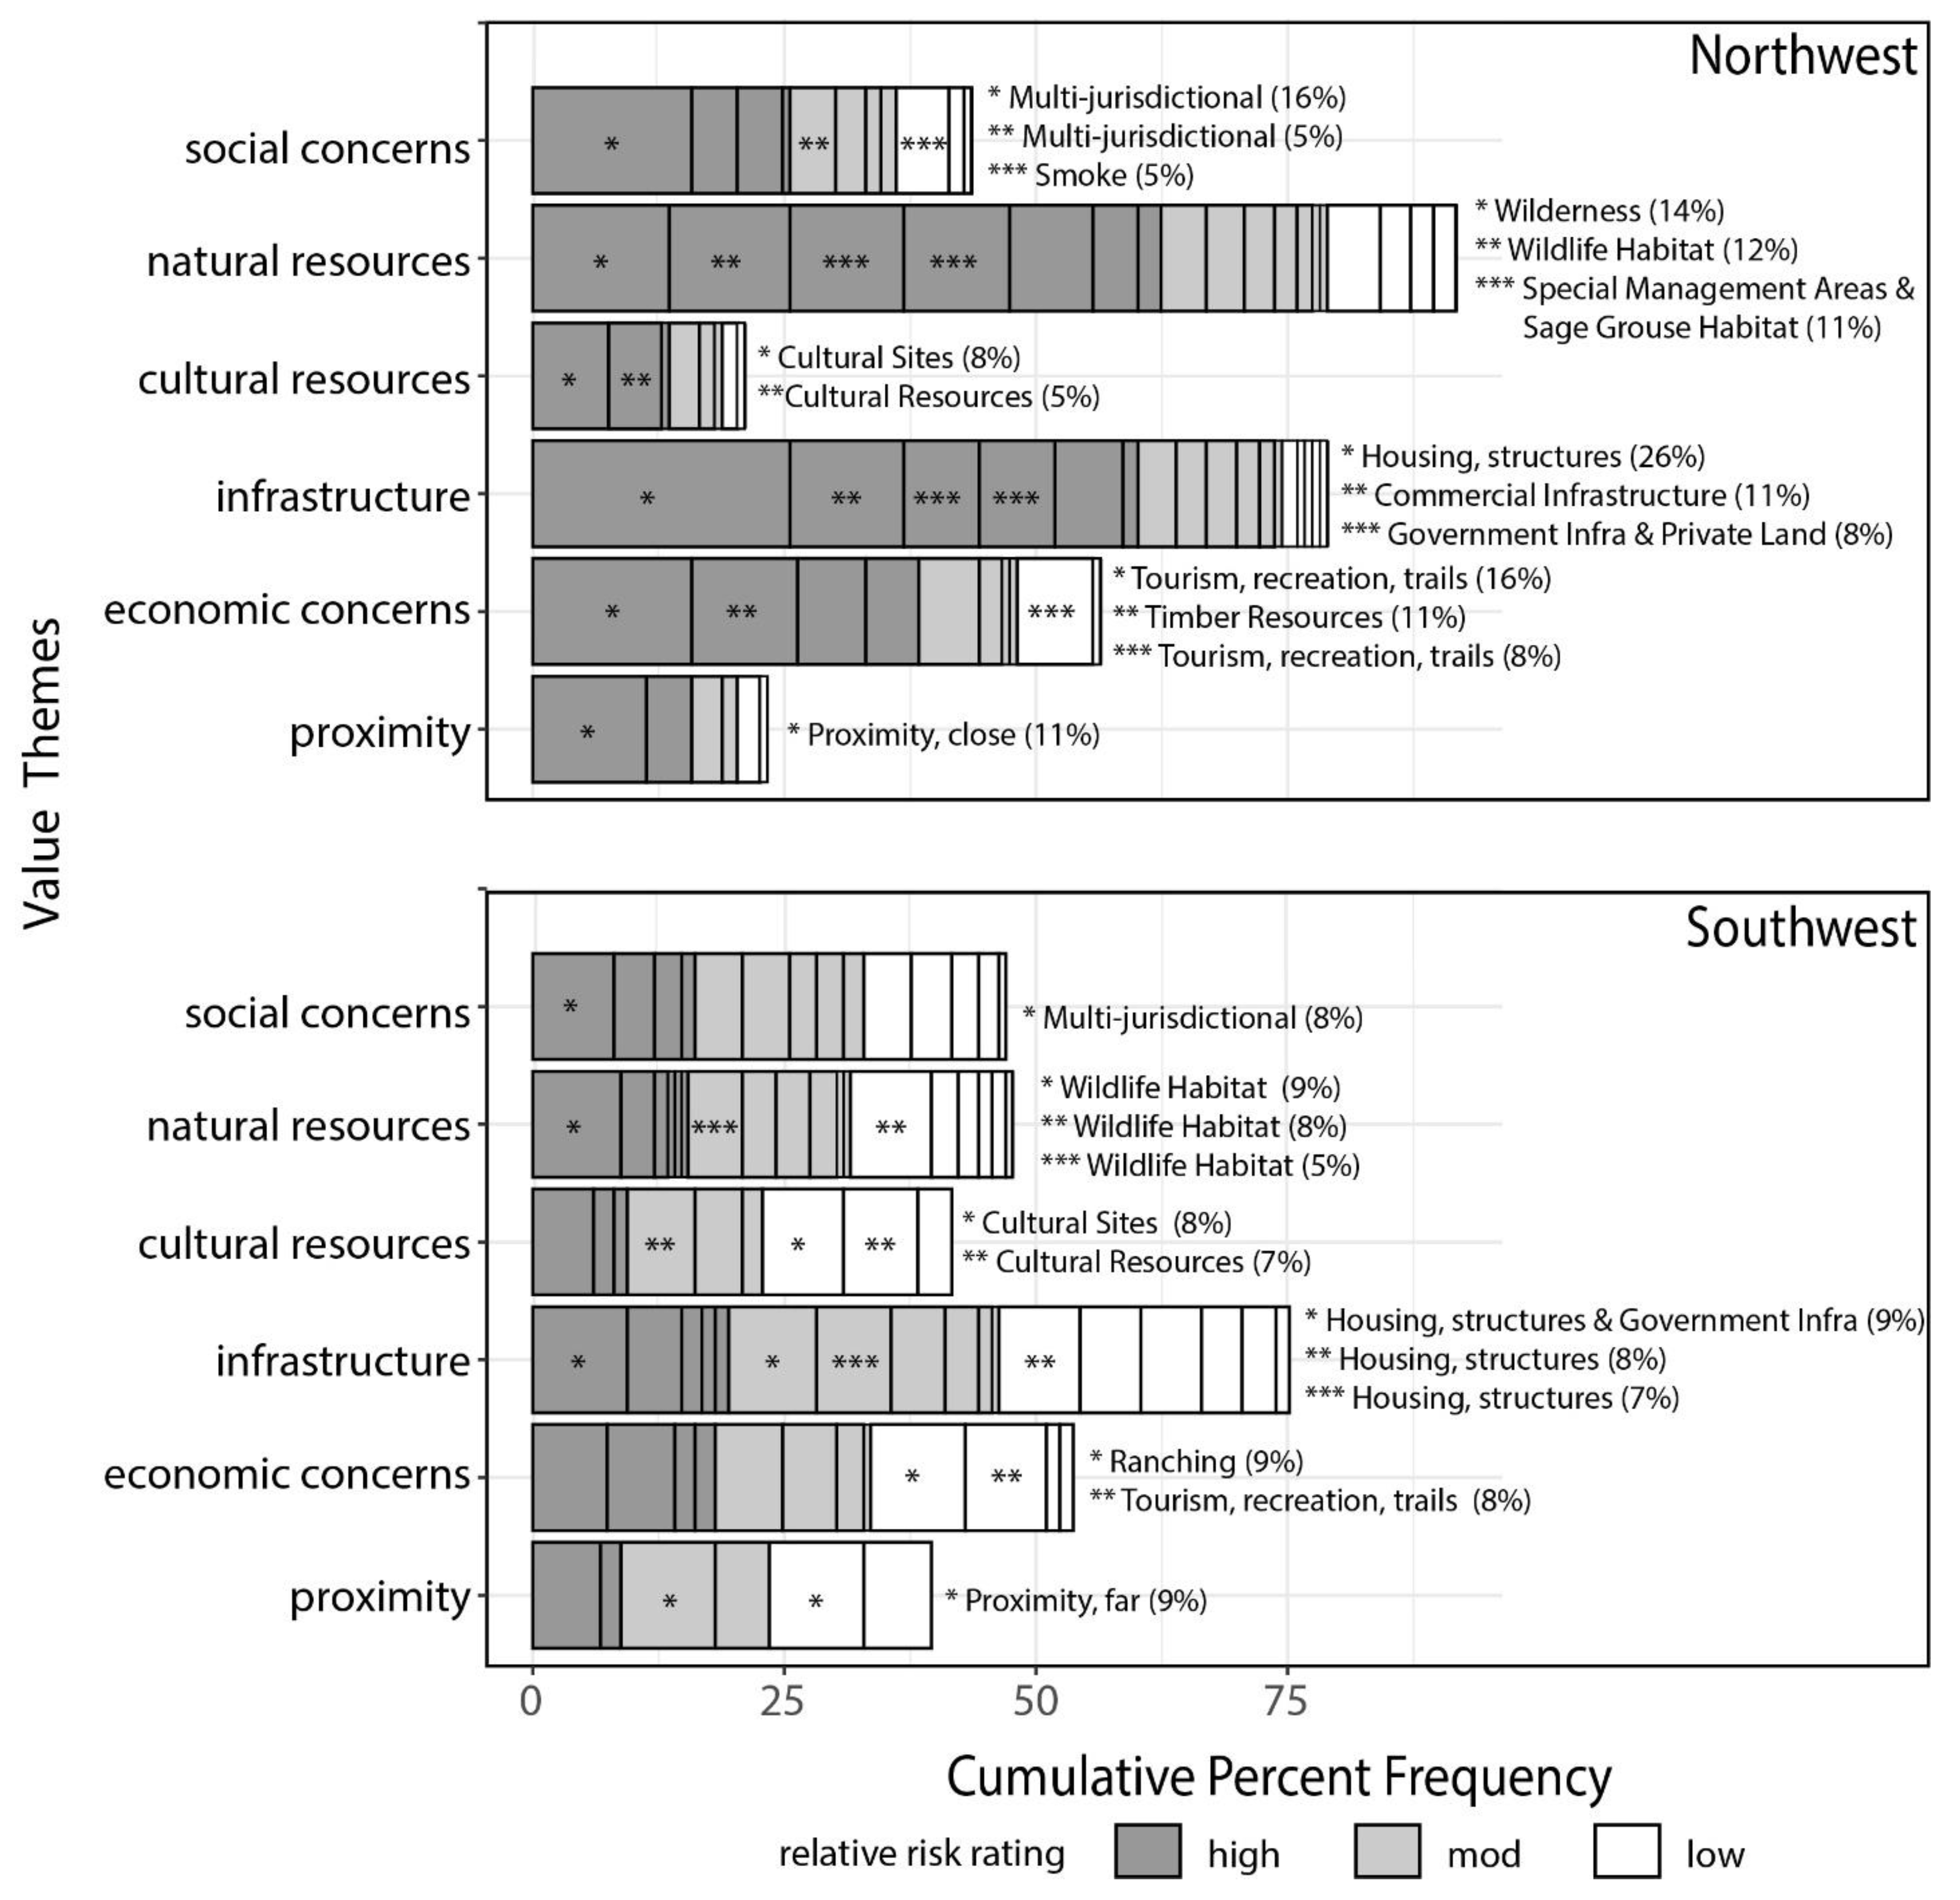
3.2. VALUES: Common Values at Risk Discussed by Land Managers on Wildfires
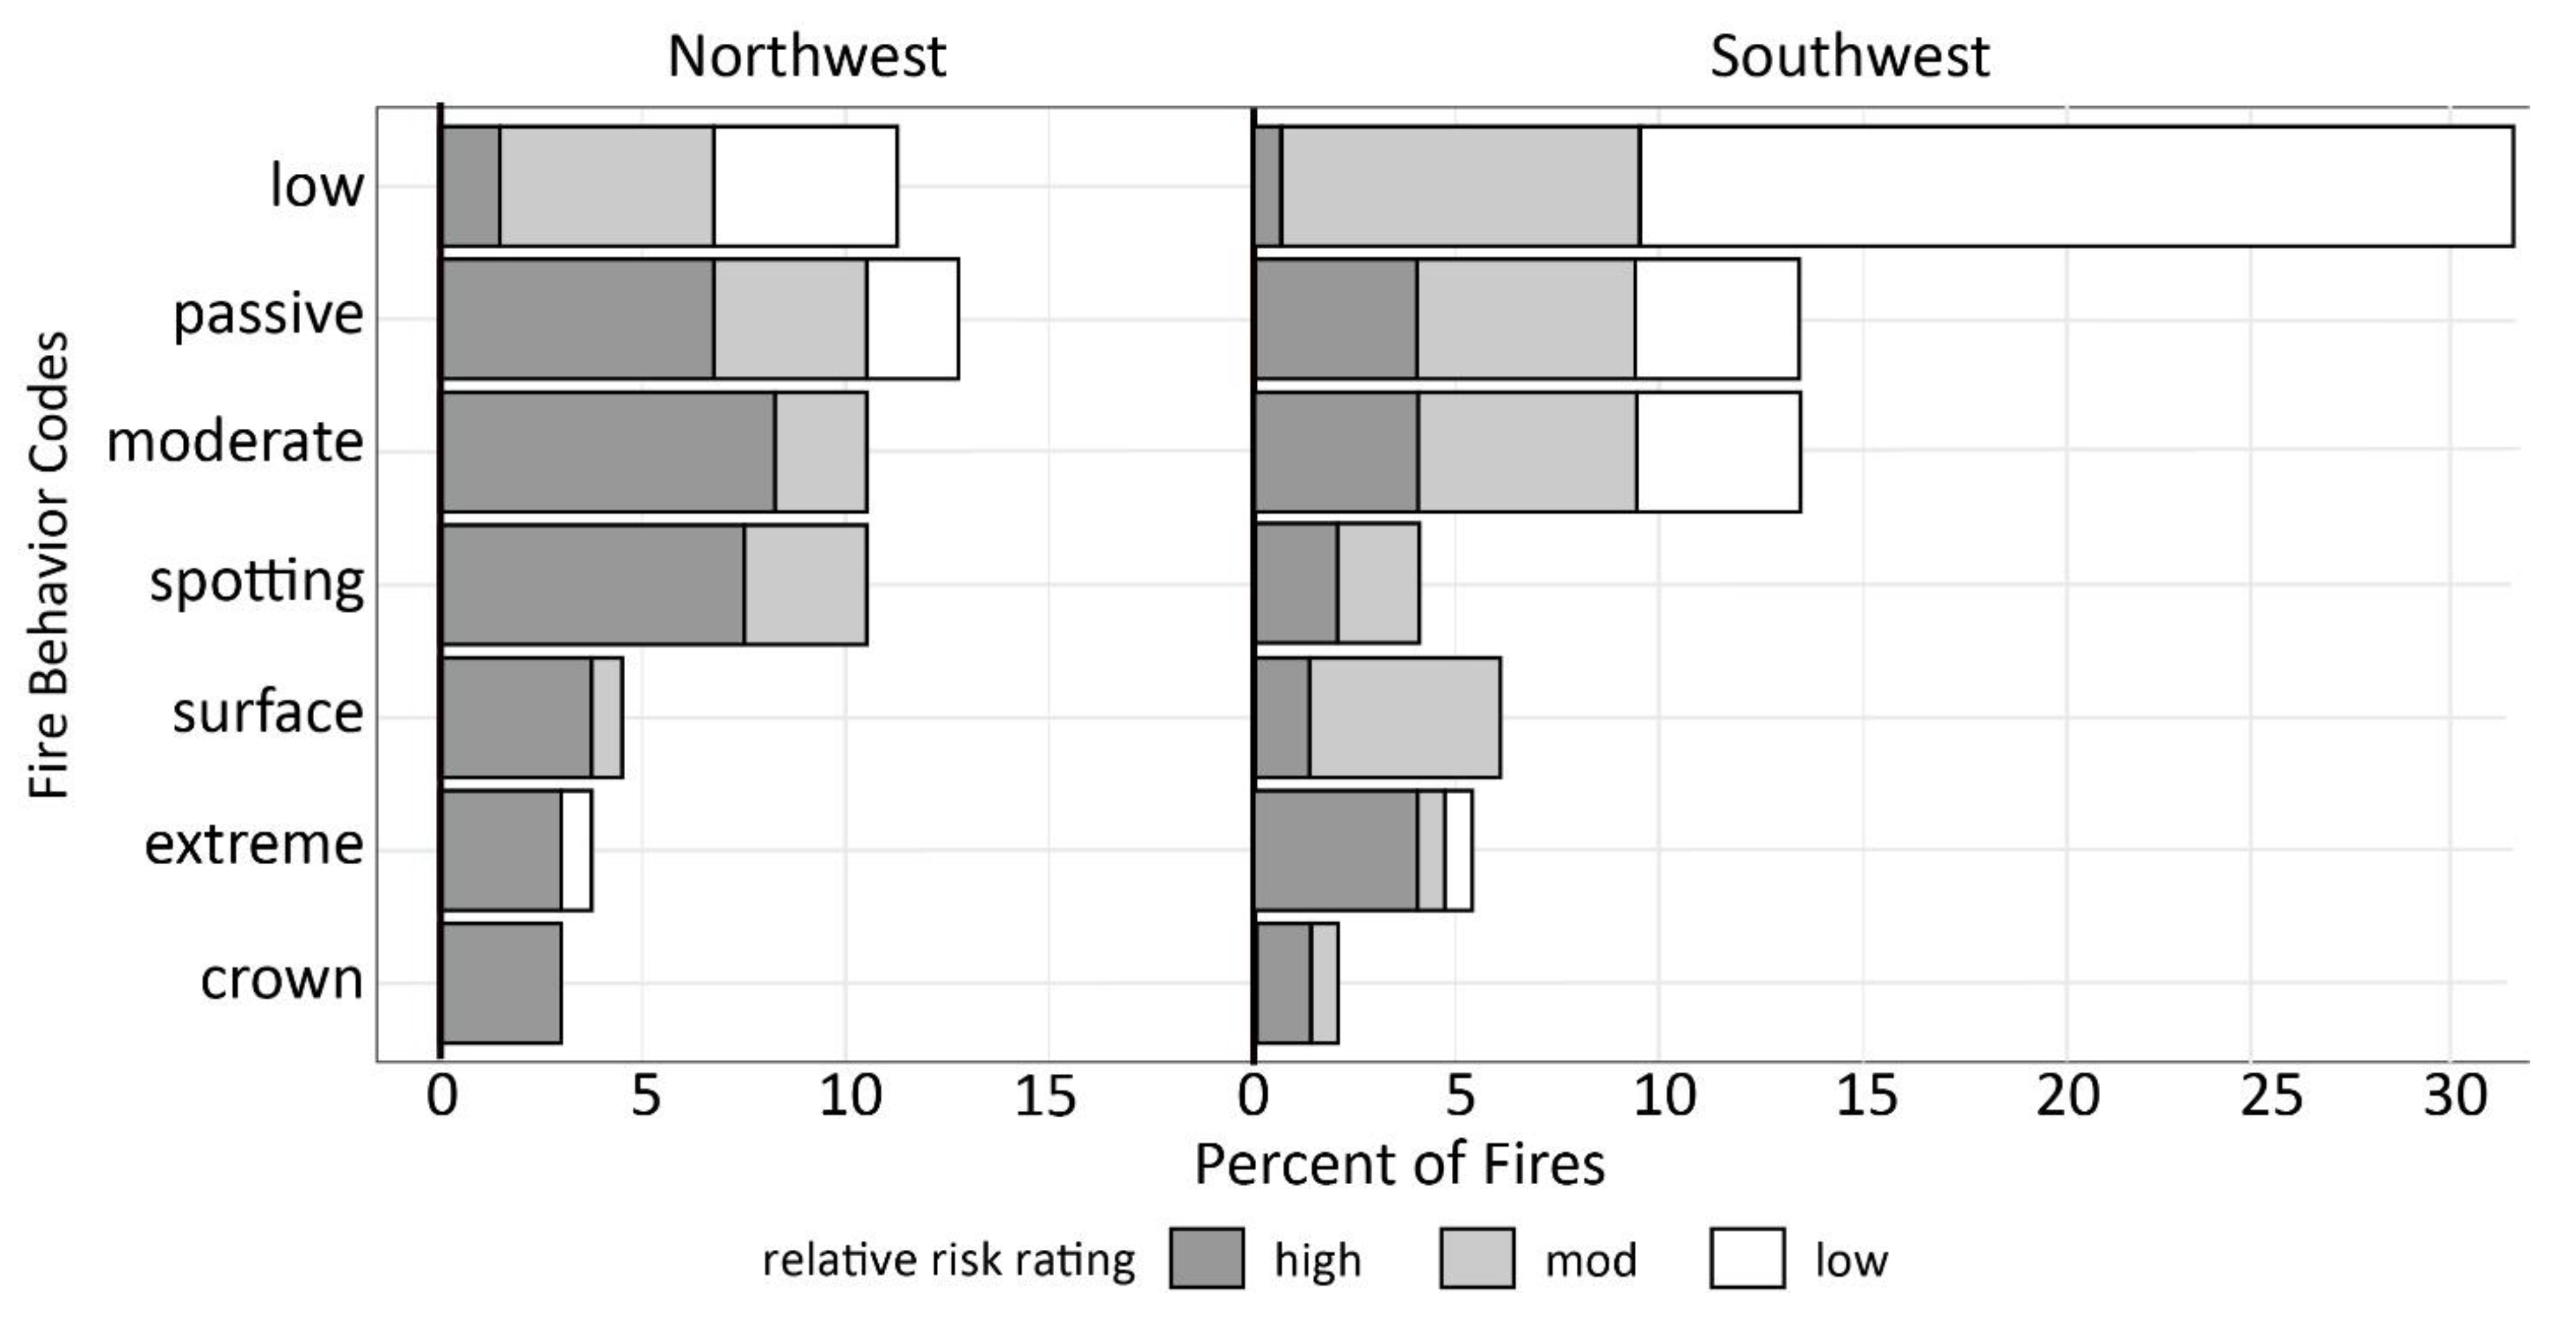
3.3. HAZARD: Conditions Amendable to Fire Spread
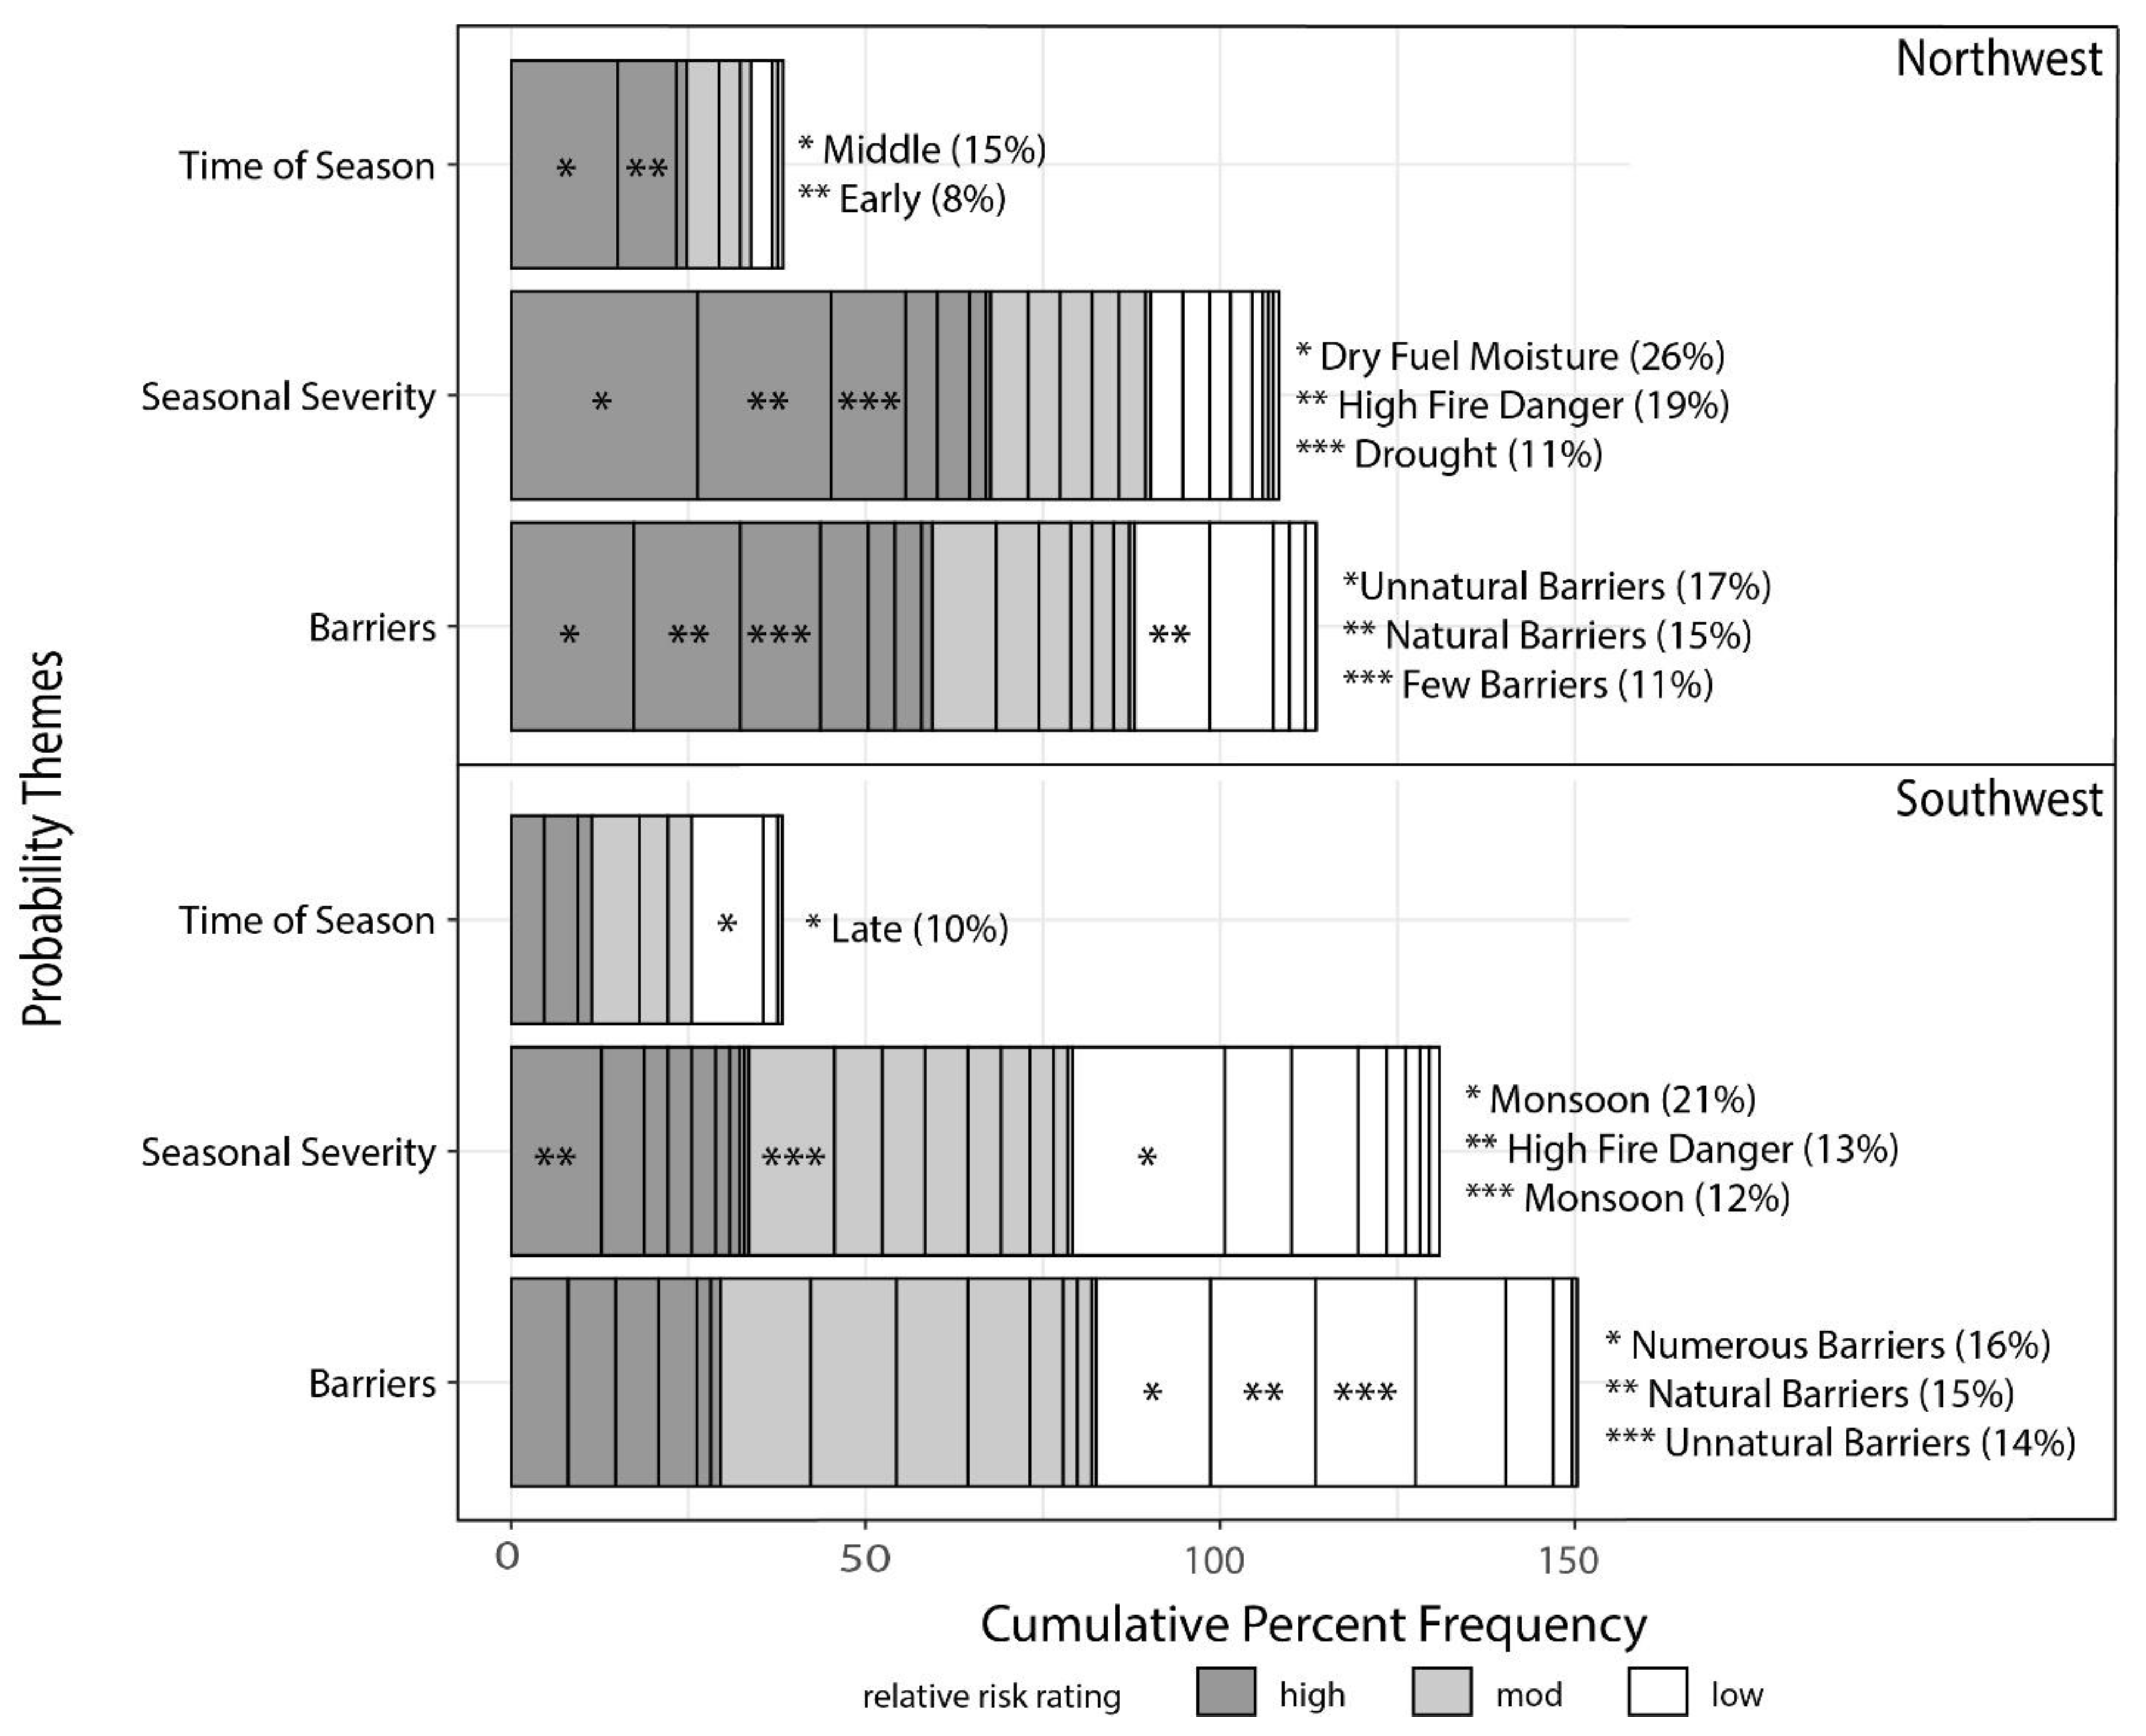
3.4. PROBABILITY: Codes Influencing the Likelihood of Active Fire
4. Discussion
4.1. Geographically Dependent Characteristics of Low-Risk Fires
“Given the recent and forecasted monsoonal moisture this fire is not expected to grow much, if at all and fire behavior is expected to be low” (Southwest, Low Relative Risk); or
“We are starting to see the onset of monsoon moisture which indicates the peak fire season is drawing to a close.” (Southwest, Low Relative Risk)
“Due to atypical monsoonal patterns, continued prolonged drought, and high temperatures, fuel moistures are very low and seasonal severity is extreme. Typically, the area would have already experienced green-up from monsoonal moisture and fire activity would be minimal” (Southwest, High Relative Risk); or
“Due to sustained drought, seasonal severity would rank higher than average. Monsoon storms have been inconsistent.” (Southwest, Moderate Relative Risk).
“Overall relative risk is low, primarily because of the time of the year and the fact that we have received good monsoon rain in the last three weeks. There are minimal values to protect in this area, and fire behavior is expected to be low. The fire area has not burned in recent history but is surrounded by numerous areas that have burned in wildfires or prescribed fires in the last 5 years.” (Southwest, Low Relative Risk).
“The fire is surrounded by rock on 3 sides, with a significant landslide on the 4th. Indices and fuels conditions are somewhere between average and slightly above average. At this time, only 3 smokes are showing between all 3, and there is no reason to believe, that this won’t happen on the Jumbo as well. Should significant growth occur, it is anticipated that it will be up drainage away from private values, further into the Boulder Creek Wilderness. We are entering the last week of August, with the historical season ending event taking place in the next 2–3 weeks.” (Northwest, Low Relative Risk)
4.2. Climate and Local Values Distinguish High Risk Fires
“The relative risk is high due primarily to the potential for a high rates of fire spread and large fire growth. Fire behavior indices are above normal for the time of year. Natural resource concerns include general and priority sage grouse habitat, ACEC, and noxious weeds. There are moderate social/political concerns due to the ranches and private land scattered throughout the planning area and impacts to grazing and wildlife habitat. Fuels are primarily grass. Topography is rough and access is limited. Even though early in the fire season, fuels are reaching critical stages. This area is experiencing a persistent drought conditions.” (Northwest, High Relative Risk)
“The fire is expected to involve several jurisdictions, cooperators, and special interest groups and agreements requiring significant negotiation need to be developed” (Northwest, High Relative Risk); or
“The western perimeter is 1.5 miles from the Forest Service boundary. The strategic direction for the fire is to prevent spread onto neighboring jurisdictions.” (Northwest, Moderate Relative Risk)
4.3. Climate Change
5. Conclusions
5.1. Limitations
5.2. Further Research
Author Contributions
Funding
Data Availability Statement
Acknowledgments
Conflicts of Interest
Appendix A
Hazard and Probability Coding Schema


Appendix B
Uncommon Codes

| Element | Theme | Code | Northwest | Southwest | ||||||||||||
|---|---|---|---|---|---|---|---|---|---|---|---|---|---|---|---|---|
| Frequency (%) | Chi-sq. | RF MIR, Rank | CART, Var. Imp., Rank | Frequency (%) | Chi-sq. | RF MIR, Rank | CART, Var. Imp., Rank | |||||||||
| H | M | L | T | p-Value | H | M | L | T | p-Value | |||||||
| Hazard | fire behavior | crown | 3% | 0% | 0% | 3% | 0.223 | NA | NA | 1% | 1% | 0% | 2% | 0.177 | NA | NA |
| Hazard | fuel condition | invasive species | 2% | 0% | 0% | 2% | 0.478 | NA | NA | 2% | 3% | 1% | 6% | 0.238 | NA | NA |
| Hazard | potential | low elevation | 2% | 0% | 0% | 2% | 0.478 | NA | NA | 1% | 3% | 0% | 3% | 0.114 | NA | NA |
| Hazard | potential | precipitation absent | 1% | 0% | 1% | 2% | 0.384 | NA | NA | 1% | 3% | 0% | 4% | 0.143 | NA | NA |
| Hazard | potential | high resistance | 3% | 0% | 0% | 3% | 0.223 | NA | NA | 1% | 2% | 1% | 4% | 0.557 | NA | NA |
| Hazard | potential | low resistance | 0% | 0% | 0% | 0% | N/A | NA | NA | 0% | 1% | 0% | 1% | 0.444 | NA | NA |
| Hazard | potential | high relative humidity | 1% | 0% | 1% | 2% | 0.384 | NA | NA | 0% | 4% | 4% | 8% | 0.125 | NA | NA |
| Hazard | potential | low temperature | 2% | 0% | 2% | 4% | 0.216 | NA | NA | 0% | 2% | 3% | 5% | 0.179 | NA | NA |
| Hazard | potential | aspect | 2% | 1% | 1% | 3% | 0.894 | NA | NA | 0% | 0% | 1% | 1% | 0.186 | NA | NA |
| Hazard | potential | slope | 2% | 2% | 2% | 5% | 0.392 | NA | NA | 1% | 0% | 1% | 2% | 0.176 | NA | NA |
| Hazard | potential | calm winds | 0% | 1% | 0% | 1% | 0.231 | NA | NA | 1% | 1% | 0% | 1% | 0.498 | NA | NA |
| Probability | barriers | ineffective | 4% | 0% | 0% | 4% | 0.151 | NA | NA | 1% | 2% | 0% | 3% | 0.210 | NA | NA |
| Probability | barriers | fuel treatment | 2% | 2% | 0% | 4% | 0.169 | NA | NA | 0% | 1% | 3% | 3% | 0.124 | NA | NA |
| Probability | seasonal severity | average fuel moisture | 1% | 1% | 2% | 3% | 0.168 | NA | NA | 2% | 1% | 2% | 5% | 0.330 | NA | NA |
| Probability | seasonal severity | moderate | 0% | 0% | 1% | 1% | 0.079 | NA | NA | 1% | 4% | 3% | 7% | 0.378 | NA | NA |
| Values | cultural resources | absent | 1% | 1% | 2% | 3% | 0.168 | NA | NA | 1% | 2% | 3% | 7% | 0.702 | NA | NA |
| Values | economic concerns | mining, outfitters, agriculture | 5% | 1% | 1% | 7% | 0.445 | NA | NA | 2% | 3% | 1% | 6% | 0.597 | NA | NA |
| Values | infrastructure | few or no houses | 2% | 3% | 1% | 5% | 0.135 | NA | NA | 1% | 1% | 3% | 6% | 0.477 | NA | NA |
| Values | infrastructure | highway | 7% | 2% | 1% | 9% | 0.447 | NA | NA | 2% | 1% | 1% | 4% | 0.284 | NA | NA |
| Values | natural resources | flora (whitebark pine, ecosystems) | 5% | 2% | 3% | 9% | 0.247 | NA | NA | 1% | 1% | 1% | 3% | 0.836 | NA | NA |
| Values | natural resources | general natural resources | 2% | 1% | 0% | 3% | 0.640 | NA | NA | 1% | 1% | 3% | 4% | 0.314 | NA | NA |
| Values | social concerns | negative perceptions of fire | 1% | 2% | 1% | 3% | 0.384 | NA | NA | 3% | 3% | 2% | 7% | 0.583 | NA | NA |
| Values | social concerns | positive perceptions of fire | 0% | 0% | 0% | 0% | N/A | NA | NA | 0% | 3% | 5% | 7% | 0.081 | NA | NA |
Appendix C
CART Results


References
- Calkin, D.E.; Ager, A.A.; Gilbertson-Day, J. (Eds.) Wildfire Risk and Hazard: Procedures for the First Approximation; Gen. Tech. Rep. RMRS-GTR-235; U.S. Department of Agriculture, Forest Service, Rocky Mountain Research Station: Fort Collins, CO, USA, 2010; 62p. [Google Scholar]
- Scott, J.H.; Thompson, M.P.; Calkin, D.E. A Wildfire Risk Assessment Framework for Land and Resource Management; Gen. Tech. Rep. RMRS-GTR-315; U.S. Department of Agriculture, Forest Service, Rocky Mountain Research Station: Fort Collins, CO, USA, 2013; 83p. [Google Scholar]
- NWCG. NWCG#042-2010: Wildfire Fire Risk and Complexity Assessment; National Wildfire Coordinating Group: Boise, ID, USA, 2010. [Google Scholar]
- Zimmerman, G.T. Fire Science Application and Integration in Support of Decision Making. In Proceedings of the 5th International Wildland Fire Conference, Sun City, South Africa, 9–13 May 2011. [Google Scholar]
- Noonan-Wright, E.K.; Opperman, T.S.; Finney, M.A.; Zimmerman, G.T.; Seli, R.C.; Elenz, L.M.; Calkin, D.E.; Fiedler, J.R. Developing the US Wildland Fire Decision Support System. J. Combust. 2011, 2011, 168473. [Google Scholar] [CrossRef]
- NWCG. Adoption and Release of the Risk and Complexity Assessment; National Wildfire Coordinating Group: Boise, ID, USA, 2013; 2p. [Google Scholar]
- NWCG. Risk and Complexity Analysis, PMS-236. Available online: https://www.nwcg.gov/sites/default/files/publications/pms236.pdf (accessed on 7 July 2022).
- Thompson, M.P.; Zimmerman, T.G.; Mindar, D.; Taber, M. Risk Terminology Primer: Basic Principles and a Glossary for the Wildland Fire Management Community; RMRS-GTR-349; U.S. Department of Agriculture, Forest Service, Rocky Mountain Research Station: Fort Collins, CO, USA, 2016; 13p. [Google Scholar]
- Taber, M.A.; Elenz, L.M.; Langowski, P.G. Decision Making for Wildfires: A Guide for Applying a Risk Management Process at the Incident Level; Gen. Tech. Rep. RMRS-GTR-298WWW; U.S. Department of Agriculture, Forest Service, Rocky Mountain Research Station: Fort Collins, CO, 2013; 59p. [Google Scholar]
- USDA/USDI. Guidance for the Implementation of Federal Wildland Fire Management Policy; U.S. Department of Agriculture, U.S. Department of Interior; Fire Executive Council, Ed.: Boise, ID, USA, 2009; p. 20. [Google Scholar]
- Parks, S.A.; Miller, C.; Parisien, M.A.; Holsinger, L.M.; Dobrowski, S.Z.; Abatzoglou, J. Wildland fire deficit and surplus in the western United States, 1984–2012. Ecosphere 2015, 6, 1–13. [Google Scholar] [CrossRef]
- Vaillant, N.M.; Reinhardt, E.D. An Evaluation of the Forest Service Hazardous Fuels Treatment Program—Are We Treating Enough to Promote Resiliency or Reduce Hazard? J. For. 2017, 115, 300–308. [Google Scholar] [CrossRef]
- North, M.P.; Collins, B.M.; Stephens, S.L.; Agee, J.K.; Aplet, G.; Franklin, J.F.; Fulé, P.Z. Reform forest fire management. Science 2015, 349, 1280–1281. [Google Scholar] [CrossRef]
- Coop, J.D.; Parks, S.A.; Stevens-Rumann, C.S.; Ritter, S.M.; Hoffman, C.M. Extreme fire spread events and area burned under recent and future climate in the western USA. Glob. Ecol. Biogeogr. 2022. Online Version of Record. [Google Scholar] [CrossRef]
- Prichard, S.J.; Hessburg, P.F.; Hagmann, R.K.; Povak, N.A.; Dobrowski, S.Z.; Hurteau, M.D.; Kane, V.R.; Keane, R.E.; Kobziar, L.N.; Kolden, C.A.; et al. Adapting western North American forests to climate change and wildfires: 10 common questions. Ecol. Appl. 2021, 31, e02433. [Google Scholar] [CrossRef]
- Davis, K.T.; Dobrowski, S.Z.; Higuera, P.E.; Holden, Z.A.; Veblen, T.T.; Rother, M.T.; Parks, S.A.; Sala, A.; Maneta, M.P. Wildfires and climate change push low-elevation forests across a critical climate threshold for tree regeneration. Proc. Natl. Acad. Sci. USA 2019, 116, 6193–6198. [Google Scholar] [CrossRef]
- Schultz, C.A.; Thompson, M.P.; McCaffrey, S.M. Forest Service fire management and the elusiveness of change. Fire Ecol. 2019, 15, 13. [Google Scholar] [CrossRef]
- Thompson, M.P.; MacGregor, D.G.; Dunn, C.J.; Calkin, D.E.; Phipps, J. Rethinking the Wildland Fire Management System. J. For. 2018, 116, 382–390. [Google Scholar] [CrossRef]
- Calkin, D.E.; Thompson, M.P.; Finney, M.A. Negative consequences of positive feedbacks in US wildfire management. For. Ecosyst. 2015, 2, 2–10. [Google Scholar] [CrossRef] [Green Version]
- Yoe, C. Primer on Risk Analysis: Decision Making under Uncertainty; CRC Press: Boca Raton, FL, USA, 2011. [Google Scholar]
- Tversky, A.; Kahneman, D. Availability: A heuristic for judging frequency and probability. Cogn. Psychol. 1973, 5, 207–232. [Google Scholar] [CrossRef]
- Kahneman, D.; Klein, G. Conditions for intuitive expertise: A failure to disagree. Am. Psychol. 2009, 64, 515–526. [Google Scholar] [CrossRef]
- Alhakamil, A.S.; Slovic, P. A Psychological Study of the Inverse Relationship Between Perceived Risk and Perceived Benefit. Risk Anal. 1994, 14, 1085–1096. [Google Scholar] [CrossRef]
- Johnson-Laird, P.N. Mental models and human reasoning. Proc. Natl. Acad. Sci. USA 2010, 107, 18243–18250. [Google Scholar] [CrossRef]
- Sjöberg, L. Factors in Risk Perception. Risk Anal. 2000, 20, 1–12. [Google Scholar] [CrossRef]
- USDI/USDA. Wildland Fire Use: Implementation Procedures Reference Guide; National Interagency Fire Center, Ed.: Boise, ID, USA, 2005. [Google Scholar]
- Noonan-Wright, E.K.; Seielstad, C.A. Patterns of wildfire risk in the United States from systematic operational risk assessments: How risk is characterised by land managers. Int. J. Wildland Fire 2021, 30, 569–584. [Google Scholar] [CrossRef]
- Rapp, C.; Rabung, E.; Wilson, R.; Toman, E. Wildfire decision support tools: An exploratory study of use in the United States. Int. J. Wildland Fire 2020, 29, 581. [Google Scholar] [CrossRef]
- Creswell, J.W.; Plano Clark, V.L. Designing and Conducting Mixed Methods Research; Sage Publications: Thousand Oaks, CA, USA, 2007. [Google Scholar]
- Ivankova, N.V.; Creswell, J.W.; Stick, S.L. Using Mixed-Methods Sequential Explanatory Design: From Theory to Practice. Field Methods 2016, 18, 3–20. [Google Scholar] [CrossRef]
- Creswell, J.W.; Clark, V.L.P.; Gutmann, M.; Hanson, W. Advanced Mixed Methods Research Designs; Sage Publications: Thousand Oaks, CA, USA, 2003; pp. 209–240. [Google Scholar]
- Short, K.C. Spatial Wildfire Occurrence Data for the United States, 1992–2015 [FPA_FOD_20170508], 4th ed.; Forest Service Research Data Archive: Fort Collins, CO, USA, 2017. [Google Scholar] [CrossRef]
- Saldana, J. The Coding Manual for Qualitative Researchers; SAGE Publications: Thousand Oaks, CA, USA, 2009. [Google Scholar]
- QSR. NVivo Qualitative Data Analysis Software, Version 11.4.1.1064; QSR International Pty Ltd.: Burlington, MA, USA, 2017. [Google Scholar]
- Evans, J.; Murphy, M. _rfUtilities_, R Package Version 2.1-3; 2018. Available online: https://cran.r-project.org/package=rfUtilities (accessed on 7 July 2022).
- Dillon, G.K.; Holden, Z.A.; Morgan, P.; Crimmins, M.A.; Heyerdahl, E.K.; Luce, C.H. Both topography and climate affected forest and woodland burn severity in two regions of the western US, 1984 to 2006. Ecosphere 2011, 2, 1–33. [Google Scholar] [CrossRef]
- R Core Team. R: A Language and Environment for Statistical Computing; R Foundation for Statistical Computing: Vienna, Austria, 2019. [Google Scholar]
- Liaw, A.; Werner, M. Classification and Regression by randomForest. R News 2002, 2, 18–22. [Google Scholar]
- Therneau, T.; Atkinson, B. Rpart: Recursive Partitioning and Regression Trees. R Package Version 4.1-15; 2019. Available online: https://cran.r-project.org/package=rpart (accessed on 7 July 2022).
- Wickham, H. ggplot2: Elegant Graphics for Data Analysis; Springer: New York, NY, USA, 2016. [Google Scholar]
- Sheppard, P.R.; Comrie, A.C.; Packin, G.D.; Angersbach, K.; Hughes, M.K. The climate of the US Southwest. Clim. Res. 2002, 21, 219–238. [Google Scholar] [CrossRef]
- O’Connor, C.; Calkin, D.; Thompson, M. An empirical machine learning method for predicting potential fire control locations for pre-fire planning and operational fire management. Int. J. Wildland Fire 2017, 26, 587–597. [Google Scholar] [CrossRef]
- O’Connor, C.D.; Calkin, D.E. Engaging the fire before it starts: A case study form the 2017 pinal fire (arizona). Wildfire 2019, 28.1, 14–18. [Google Scholar]
- Holden, Z.A.; Swanson, A.; Luce, C.H.; Jolly, W.M.; Maneta, M.; Oyler, J.W.; Warren, D.A.; Parsons, R.; Affleck, D. Decreasing fire season precipitation increased recent western US forest wildfire activity. Proc. Natl. Acad. Sci. USA 2018, 115, E8349–E8357. [Google Scholar] [CrossRef]
- Stavros, E.N.; Abatzoglou, J.T.; McKenzie, D.; Larkin, N.K. Regional projections of the likelihood of very large wildland fires under a changing climate in the contiguous Western United States. Clim. Chang. 2014, 126, 455–468. [Google Scholar] [CrossRef]
- Calkin, D.E.; Cohen, J.D.; Finney, M.A.; Thompson, M.P. How risk management can prevent future wildfire disasters in the wildland-urban interface. Proc. Natl. Acad. Sci. USA 2014, 111, 746–751. [Google Scholar] [CrossRef]
- Cohen, J.D. Preventing disaster: Home ignitability in the wildland-urban interface. J. For. 2000, 89, 15–21. [Google Scholar]
- Mockrin, M.H.; Helmers, D.; Martinuzzi, S.; Hawbaker, T.J.; Radeloff, V.C. Growth of the wildland-urban interface within and around U.S. National Forests and Grasslands, 1990–2010. Landsc. Urban Plan. 2022, 218, 104283. [Google Scholar] [CrossRef]
- Radeloff, V.C.; Helmers, D.P.; Kramer, H.A.; Mockrin, M.H.; Alexandre, P.M.; Bar-Massada, A.; Butsic, V.; Hawbaker, T.J.; Martinuzzi, S.; Syphard, A.D.; et al. Rapid growth of the US wildland-urban interface raises wildfire risk. Proc. Natl. Acad. Sci. USA 2018, 115, 3314–3319. [Google Scholar] [CrossRef]
- Haas, J.R.; Calkin, D.E.; Thompson, M.P. A national approach for integrating wildfire simulation modeling into Wildland Urban Interface risk assessments within the United States. Landsc. Urban Plan. 2013, 119, 44–53. [Google Scholar] [CrossRef]
- Downing, W.M.; Dunn, C.J.; Thompson, M.P.; Caggiano, M.D.; Short, K.C. Human ignitions on private lands drive USFS cross-boundary wildfire transmission and community impacts in the western US. Sci. Rep. 2022, 12, 2624. [Google Scholar] [CrossRef]
- Ager, A.A.; Palaiologou, P.; Evers, C.R.; Day, M.A.; Barros, A.M.G. Assessing Transboundary Wildfire Exposure in the Southwestern United States. Risk Anal. 2018, 38, 2105–2127. [Google Scholar] [CrossRef] [Green Version]
- Fischer, A.P.; Spies, T.A.; Steelman, T.A.; Moseley, C.; Johnson, B.R.; Bailey, J.D.; Ager, A.A.; Bourgeron, P.; Charnley, S.; Collins, B.M.; et al. Wildfire risk as a socioecological pathology. Front. Ecol. Environ. 2016, 14, 276–284. [Google Scholar] [CrossRef]
- Gilbertson-Day, J.; Scott, J.H.; Vogler, K.C.; Brough, A. Pacific Northwest Quantitative Wildfire Risk Assessment: Methods and Results; Pyrologix: Missoula, MT, USA, 2018. [Google Scholar]
- USDA/USDI. A National Cohesive Wildland Fire Management Strategy; U.S. Department of Agriculture, U.S. Department of Interior; Wildland Fire Leadership Council, Ed.: Washington, DC, USA, 2011. [Google Scholar]
- Pascale, S.; Carvalho, L.; Adams, D.; Castro, C.; Cavalcanti, I. Current and Future Variations of the Monsoons of the Americas in a Warming Climate. Curr. Clim. Chang. Rep. 2019, 5, 125–144. [Google Scholar] [CrossRef]
- Pascale, S.; Boos, W.R.; Bordoni, S.; Delworth, T.L.; Kapnick, S.B.; Murakami, H.; Vecchi, G.A.; Zhang, W. Weakening of the North American monsoon with global warming. Nat. Clim. Chang. 2017, 7, 806–812. [Google Scholar] [CrossRef]
- Hernandez, M.; Chen, L. Future Land Precipitation Changes Over the North American Monsoon Region Using CMIP5 and CMIP6 Simulations. J. Geophys. Res. Atmos. 2022, 127, e2021JD035911. [Google Scholar] [CrossRef]
- Williams, A.P.; Cook, B.I.; Smerdon, J.E. Rapid intensification of the emerging southwestern North American megadrought in 2020–2021. Nat. Clim. Chang. 2022, 12, 232–234. [Google Scholar] [CrossRef]
- Abatzoglou, J.T.; Williams, A.P.; Boschetti, L.; Zubkova, M.; Kolden, C.A. Global patterns of interannual climate-fire relationships. Glob. Chang. Biol. 2018, 24, 5164–5175. [Google Scholar] [CrossRef]
- Abatzoglou, J.T.; Kolden, C.A.; Williams, A.P.; Lutz, J.A.; Smith, A.M.S. Climatic influences on interannual variability in regional burn severity across western US forests. Int. J. Wildland Fire 2017, 26, 269–275. [Google Scholar] [CrossRef]
- Abatzoglou, J.T.; Williams, A.P. Impact of anthropogenic climate change on wildfire across western US forests. Proc. Natl. Acad. Sci. USA 2016, 113, 11770–11775. [Google Scholar] [CrossRef] [PubMed]
- Abatzoglou, J.T.; Rupp, D.E.; Mote, P.W. Seasonal Climate Variability and Change in the Pacific Northwest of the United States. J. Clim. 2014, 27, 2125–2142. [Google Scholar] [CrossRef]
- Young, J.D.; Evans, A.M.; Iniguez, J.M.; Thode, A.; Meyer, M.D.; Hedwall, S.J.; McCaffrey, S.; Shin, P.; Huang, C.-H. Effects of policy change on wildland fire management strategies: Evidence for a paradigm shift in the western US? Int. J. Wildland Fire 2020, 29, 857. [Google Scholar] [CrossRef]
- Rapp, C.E.; Wilson, R.S.; Toman, E.L.; Jolly, W.M. Assessing the role of short-term weather forecasts in fire manager tactical decision-making: A choice experiment. Fire Ecol. 2021, 17, 35. [Google Scholar] [CrossRef]
- Calkin, D.E.; Thompson, M.P.; Finney, M.A.; Hyde, K.D. A Real-Time Risk Assessment Tool Supporting Wildland Fire Decisionmaking. J. For. 2011, 109, 274–280. [Google Scholar]
- Wilson, R.S.; Winter, P.L.; Maguire, L.A.; Ascher, T. Managing wildfire events: Risk-based decision making among a group of federal fire managers. Risk Anal. 2011, 31, 805–818. [Google Scholar] [CrossRef]
- Black, A. The key decision log: Facilitating high reliability and organizational learning. Fire Manag. Today 2009, 69, 5–10. [Google Scholar]
- Williamson, M.A. Factors in United States Forest Service district rangers’ decision to manage a fire for resource benefit. Int. J. Wildland Fire 2007, 16, 755–762. [Google Scholar] [CrossRef]
- Hand, M.S.; Wibbenmeyer, M.J.; Calkin, D.E.; Thompson, M.P. Risk Preferences, Probability Weighting, and Strategy Tradeoffs in Wildfire Management. Risk Anal. 2015, 35, 1876–1891. [Google Scholar] [CrossRef]
- Fillmore, S.D.; McCaffrey, S.M.; Smith, A.M.S. A Mixed Methods Literature Review and Framework for Decision Factors That May Influence the Utilization of Managed Wildfire on Federal Lands, USA. Fire 2021, 4, 62. [Google Scholar] [CrossRef]
- Noble, P.; Paveglio, T.B. Exploring Adoption of the Wildland Fire Decision Support System: End User Perspectives. J. For. 2020, 118, 154–171. [Google Scholar] [CrossRef]
- Colavito, M. The Human Dimensions of Spatial, Pre-Wildfire Planning Decision Support Systems: A Review of Barriers, Facilitators, and Recommendations. Forests 2021, 12, 483. [Google Scholar] [CrossRef]
- Belval, E.J.; Stonesifer, C.S.; Calkin, D.E. Fire Suppression Resource Scarcity: Current Metrics and Future Performance Indicators. Forests 2020, 11, 217. [Google Scholar] [CrossRef]
- Stonesifer, C.S.; Calkin, D.E.; Thompson, M.P.; Belval, E.J. Is This Flight Necessary? The Aviation Use Summary (AUS): A Framework for Strategic, Risk-Informed Aviation Decision Support. Forests 2021, 12, 1078. [Google Scholar] [CrossRef]
- Wei, Y.; Thompson, M.P.; Belval, E.J.; Calkin, D.E.; Bayham, J. Understand Daily Fire Suppression Resource Ordering and Assignment Patterns by Unsupervised Learning. Mach. Learn. Knowl. Extr. 2020, 3, 14–33. [Google Scholar] [CrossRef]


| Geographic Area | Agency | |||||||
|---|---|---|---|---|---|---|---|---|
| USFS (%) | BLM (%) | BIA (%) | County (%) | NPS (%) | Other (%) | State (%) | FWS (%) | |
| Northwest | 62 | 31 | 8 | 7 | 12 | 15 | 11 | 8 |
| Southwest | 69 | 16 | 16 | 3 | 15 | 5 | 8 | 1 |
| Element | Theme | Code | Northwest | Southwest | ||||||||||||
|---|---|---|---|---|---|---|---|---|---|---|---|---|---|---|---|---|
| Frequency (%) | Chi-sq. | RF MIR, Rank | CART, Var. Imp., Rank | Frequency (%) | Chi-sq. | RF MIR, Rank | CART, Var. Imp., Rank | |||||||||
| H | M | L | T | p-Value | H | M | L | T | p-Value | |||||||
| Hazard | fire behavior | extreme | 3% | 0% | 1% | 4% | 0.406 | 4% | 1% | 1% | 5% | 0.003 | ||||
| Hazard | fire behavior | low | 2% | 5% | 5% | 11% | 0.001 | 5 | 1% | 9% | 21% | 31% | 0.000 | 1 | 1 | |
| Hazard | fire behavior | moderate | 8% | 2% | 0% | 11% | 0.146 | 5 | 4% | 3% | 3% | 11% | 0.419 | |||
| Hazard | fire behavior | passive | 7% | 4% | 2% | 13% | 0.900 | 4% | 5% | 4% | 13% | 0.705 | ||||
| Hazard | fire behavior | spotting | 8% | 3% | 0% | 11% | 0.208 | 2% | 2% | 0% | 4% | 0.116 | ||||
| Hazard | fire behavior | surface | 4% | 1% | 0% | 5% | 0.380 | 1% | 5% | 0% | 6% | 0.023 | ||||
| Hazard | fuel condition | average fuel loads | 3% | 3% | 0% | 6% | 0.175 | 1% | 4% | 0% | 5% | 0.046 | ||||
| Hazard | fuel condition | forested fuel types | 6% | 5% | 5% | 17% | 0.044 | 13 | 5% | 5% | 7% | 17% | 0.512 | |||
| Hazard | fuel condition | grass fuel types | 14% | 2% | 0% | 17% | 0.009 | 12 | 2 | 8% | 10% | 9% | 27% | 0.561 | ||
| Hazard | fuel condition | high fuel loads | 11% | 3% | 2% | 15% | 0.475 | 9% | 4% | 3% | 16% | 0.000 | 6 | |||
| Hazard | fuel condition | highly departed vegetation | 7% | 0% | 0% | 7% | 0.030 | 11 | 3% | 3% | 1% | 7% | 0.353 | |||
| Hazard | fuel condition | low fuel loads | 2% | 3% | 2% | 7% | 0.078 | 0% | 7% | 11% | 17% | 0.002 | 12 | |||
| Hazard | fuel condition | shrub fuel types | 3% | 0% | 0% | 3% | 0.223 | 7% | 9% | 8% | 24% | 0.580 | ||||
| Hazard | fuel condition | snag fuel types | 8% | 1% | 2% | 11% | 0.204 | 2% | 4% | 5% | 11% | 0.657 | ||||
| Hazard | fuel condition | vegetation within range | 4% | 2% | 5% | 11% | 0.018 | 4% | 3% | 5% | 12% | 0.310 | ||||
| Hazard | potential | high elevation | 2% | 3% | 4% | 8% | 0.007 | 15 | 0% | 1% | 1% | 2% | 0.485 | |||
| Hazard | potential | high temperature | 7% | 2% | 0% | 9% | 0.241 | 4 | 5% | 3% | 1% | 9% | 0.038 | |||
| Hazard | potential | large | 15% | 2% | 0% | 17% | 0.002 | 6 | 7% | 1% | 0% | 7% | 0.000 | 2 | ||
| Hazard | potential | low relative humidity | 7% | 2% | 0% | 9% | 0.241 | 7% | 4% | 1% | 12% | 0.000 | 13 | 8 | ||
| Hazard | potential | moderate | 6% | 2% | 0% | 8% | 0.243 | 3% | 9% | 5% | 17% | 0.183 | ||||
| Hazard | potential | precipitation present | 4% | 3% | 5% | 12% | 0.006 | 9 | 2% | 12% | 19% | 34% | 0.000 | 7 | 3 | |
| Hazard | potential | red flag conditions | 3% | 1% | 0% | 4% | 0.506 | 6% | 0% | 0% | 6% | 0.000 | 4 | |||
| Hazard | potential | small | 4% | 5% | 8% | 17% | 0.000 | 3 | 3% | 9% | 14% | 26% | 0.018 | 10 | ||
| Hazard | potential | steep topgraphy | 16% | 3% | 6% | 25% | 0.085 | 5% | 5% | 2% | 13% | 0.057 | ||||
| Hazard | potential | windy | 14% | 3% | 1% | 17% | 0.074 | 7% | 4% | 1% | 12% | 0.002 | ||||
| Probability | barriers | few | 11% | 3% | 2% | 17% | 0.555 | 7% | 5% | 1% | 12% | 0.001 | 15 | |||
| Probability | barriers | wildfire | 7% | 3% | 2% | 12% | 0.968 | 6% | 9% | 13% | 28% | 0.386 | ||||
| Probability | barriers | natural | 15% | 9% | 11% | 35% | 0.005 | 10 | 8% | 12% | 15% | 35% | 0.674 | |||
| Probability | barriers | numerous | 4% | 5% | 9% | 17% | 0.000 | 1 | 1 | 2% | 10% | 16% | 28% | 0.001 | 7 | |
| Probability | barriers | prescribed fire | 0% | 1% | 0% | 1% | 0.231 | 0% | 2% | 7% | 9% | 0.006 | ||||
| Probability | barriers | unnatural | 17% | 6% | 2% | 25% | 0.135 | 5% | 13% | 14% | 32% | 0.302 | ||||
| Probability | seasonal severity | average fire danger | 5% | 5% | 4% | 13% | 0.111 | 1% | 6% | 9% | 17% | 0.050 | ||||
| Probability | seasonal severity | drought | 11% | 4% | 1% | 15% | 0.287 | 3% | 5% | 1% | 9% | 0.162 | ||||
| Probability | seasonal severity | dry fuel moisture | 26% | 5% | 3% | 34% | 0.004 | 4 | 6% | 3% | 1% | 11% | 0.004 | 11 | ||
| Probability | seasonal severity | high (wet) fuel moisture | 2% | 0% | 3% | 5% | 0.008 | 10 | 1% | 7% | 9% | 17% | 0.020 | 4 | ||
| Probability | seasonal severity | above normal fire danger | 19% | 5% | 5% | 29% | 0.438 | 13% | 6% | 4% | 23% | 0.000 | 3 | 2 | ||
| Probability | seasonal severity | high | 5% | 4% | 1% | 9% | 0.365 | 3% | 2% | 0% | 5% | 0.016 | ||||
| Probability | seasonal severity | monsoon | 0% | 0% | 0% | 0% | N/A | 3% | 12% | 21% | 37% | 0.000 | 9 | 6 | ||
| Probability | time of season | early | 8% | 3% | 1% | 12% | 0.464 | 5% | 4% | 2% | 11% | 0.103 | ||||
| Probability | time of season | late | 2% | 2% | 3% | 6% | 0.025 | 2% | 3% | 10% | 15% | 0.012 | ||||
| Probability | time of season | middle | 15% | 5% | 1% | 20% | 0.080 | 5% | 7% | 1% | 12% | 0.011 | 14 | 12 | ||
| Values | cultural resources | general cultural res. | 5% | 2% | 0% | 7% | 0.317 | 6% | 5% | 7% | 18% | 0.280 | ||||
| Values | cultural resources | cultural sites | 8% | 3% | 1% | 11% | 0.541 | 2% | 7% | 8% | 17% | 0.255 | ||||
| Values | economic concerns | ranching | 7% | 1% | 0% | 8% | 0.094 | 7% | 5% | 9% | 21% | 0.209 | ||||
| Values | economic concerns | timber | 11% | 2% | 0% | 13% | 0.057 | 2% | 1% | 1% | 4% | 0.284 | ||||
| Values | economic concerns | tourism, recreation, trails | 16% | 6% | 8% | 29% | 0.176 | 7% | 7% | 8% | 22% | 0.334 | ||||
| Values | infrastructure | commercial | 11% | 4% | 0% | 15% | 0.079 | 3 | 5% | 5% | 6% | 17% | 0.579 | 10 | ||
| Values | infrastructure | government | 8% | 2% | 1% | 11% | 0.488 | 1% | 9% | 4% | 14% | 0.043 | 8 | |||
| Values | infrastructure | housing, structures | 26% | 3% | 1% | 29% | 0.000 | 2 | 8 | 9% | 7% | 8% | 25% | 0.078 | ||
| Values | infrastructure | private land | 8% | 1% | 2% | 10% | 0.258 | 0% | 3% | 6% | 9% | 0.035 | ||||
| Values | natural resources | sage grouse habitat | 11% | 1% | 0% | 11% | 0.012 | 0% | 0% | 0% | 0% | N/A | ||||
| Values | natural resources | special management areas | 11% | 2% | 0% | 14% | 0.040 | 7 | 1% | 3% | 1% | 4% | 0.334 | |||
| Values | natural resources | threatened and endangered species | 8% | 3% | 2% | 14% | 0.938 | 3% | 3% | 1% | 8% | 0.200 | ||||
| Values | natural resources | wilderness | 14% | 4% | 5% | 23% | 0.315 | 1% | 3% | 2% | 7% | 0.731 | ||||
| Values | natural resources | wildlife habitat | 12% | 5% | 2% | 19% | 0.737 | 9% | 5% | 8% | 22% | 0.044 | ||||
| Values | proximity | values are close to fire | 11% | 2% | 1% | 14% | 0.062 | 7% | 5% | 7% | 19% | 0.249 | ||||
| Values | proximity | values are far from fire | 5% | 3% | 2% | 10% | 0.648 | 2% | 9% | 9% | 21% | 0.106 | ||||
| Values | social concerns | general concerns | 5% | 3% | 0% | 8% | 0.262 | 9 | 1% | 2% | 1% | 4% | 0.557 | |||
| Values | social concerns | multijurisdictional | 16% | 5% | 2% | 22% | 0.151 | 8% | 5% | 3% | 15% | 0.002 | ||||
| Values | social concerns | smoke | 5% | 2% | 5% | 11% | 0.004 | 4% | 5% | 4% | 13% | 0.699 | ||||
| Northwest | |||
|---|---|---|---|
| Risk | Codes | Themes | Frequency (%) |
| High | dry fuel moisture * | seasonal severity | 26 |
| Housing * | infrastructure | 26 | |
| large potential * | potential | 15 | |
| natural barriers | barriers | 15 | |
| grass fuel type | fuel condition | 14 | |
| special management areas | natural resources | 11 | |
| sage grouse | natural resources | 11 | |
| Low | natural barriers * | barriers | 11 |
| numerous barriers * | barriers | 9 | |
| small potential * | potential | 8 | |
| forested fuels | fuel condition | 5 | |
| precipitation | potential | 5 | |
| smoke * | social concerns | 5 | |
| low fire behavior * | fire behavior | 5 | |
| veg within range | fuel condition | 5 | |
| Southwest | |||
|---|---|---|---|
| Risk | Codes | Themes | Frequency (%) |
| High | high fire danger * | seasonal severity | 13 |
| high fuel loads * | fuel condition | 9 | |
| wildlife habitat | natural resources | 9 | |
| Multijurisdictional * | social concerns | 8 | |
| low relative humidity * | potential | 7 | |
| few barriers * | barriers | 7 | |
| large potential * | potential | 7 | |
| Windy * | potential | 7 | |
| red flag conditions * | potential | 6 | |
| dry fuel moisture * | seasonal severity | 6 | |
| high temperature | potential | 5 | |
| middle time of season | time of season | 5 | |
| Low | monsoon * | seasonal severity | 21 |
| low fire behavior * | fire behavior | 21 | |
| precipitation * | potential | 19 | |
| numerous barriers * | barriers | 16 | |
| small potential | potential | 14 | |
| low fuel loads * | fuel condition | 11 | |
| late time of season | time of season | 10 | |
Publisher’s Note: MDPI stays neutral with regard to jurisdictional claims in published maps and institutional affiliations. |
© 2022 by the authors. Licensee MDPI, Basel, Switzerland. This article is an open access article distributed under the terms and conditions of the Creative Commons Attribution (CC BY) license (https://creativecommons.org/licenses/by/4.0/).
Share and Cite
Noonan-Wright, E.; Seielstad, C. Factors Influencing Risk during Wildfires: Contrasting Divergent Regions in the US. Fire 2022, 5, 131. https://doi.org/10.3390/fire5050131
Noonan-Wright E, Seielstad C. Factors Influencing Risk during Wildfires: Contrasting Divergent Regions in the US. Fire. 2022; 5(5):131. https://doi.org/10.3390/fire5050131
Chicago/Turabian StyleNoonan-Wright, Erin, and Carl Seielstad. 2022. "Factors Influencing Risk during Wildfires: Contrasting Divergent Regions in the US" Fire 5, no. 5: 131. https://doi.org/10.3390/fire5050131
APA StyleNoonan-Wright, E., & Seielstad, C. (2022). Factors Influencing Risk during Wildfires: Contrasting Divergent Regions in the US. Fire, 5(5), 131. https://doi.org/10.3390/fire5050131