1. Introduction
In a recent study, Otón et al. [
1] compared trends in global burned area (BA) mapped by the ESA Climate Change Initiative (CCI) MODIS-based FireCCI51 and AVHRR-based FireCCILT11 data sets. As noted by the authors, the two data sets were expected to be consistent, since the former was used to train the classification algorithm that generated the latter. To help establish this expected consistency, Otón et al. [
1] examined the correlation between the respective gridded annual BA time series for the common 2001–2018 period, from which they concluded that “High spatial correlations are displayed with Pearson correlation (r) > 0.75 in pixels of all regions”. However, the authors overlooked several extensive zones in Africa where the BA time series were inconsistent and poorly correlated. The presence of these low-correlation zones notwithstanding, Otón et al. [
1] reported widely predominant spatial agreement and only minor disagreement in BA trends for the 2001–2018 period.
In this study, we explore inconsistencies between the FireCCI51 and FireCCILT11 BA in Africa, over zones that collectively encompass nearly one third of the entire continent. In addition, we note that the spatial extent over which FireCCI51 and FireCCILT11 BA trends do not agree was significantly larger when a more appropriate and less selective criterion for trend consistency was used.
2. Consistency of 2001–2018 BA Time Series
As in Otón et al. [
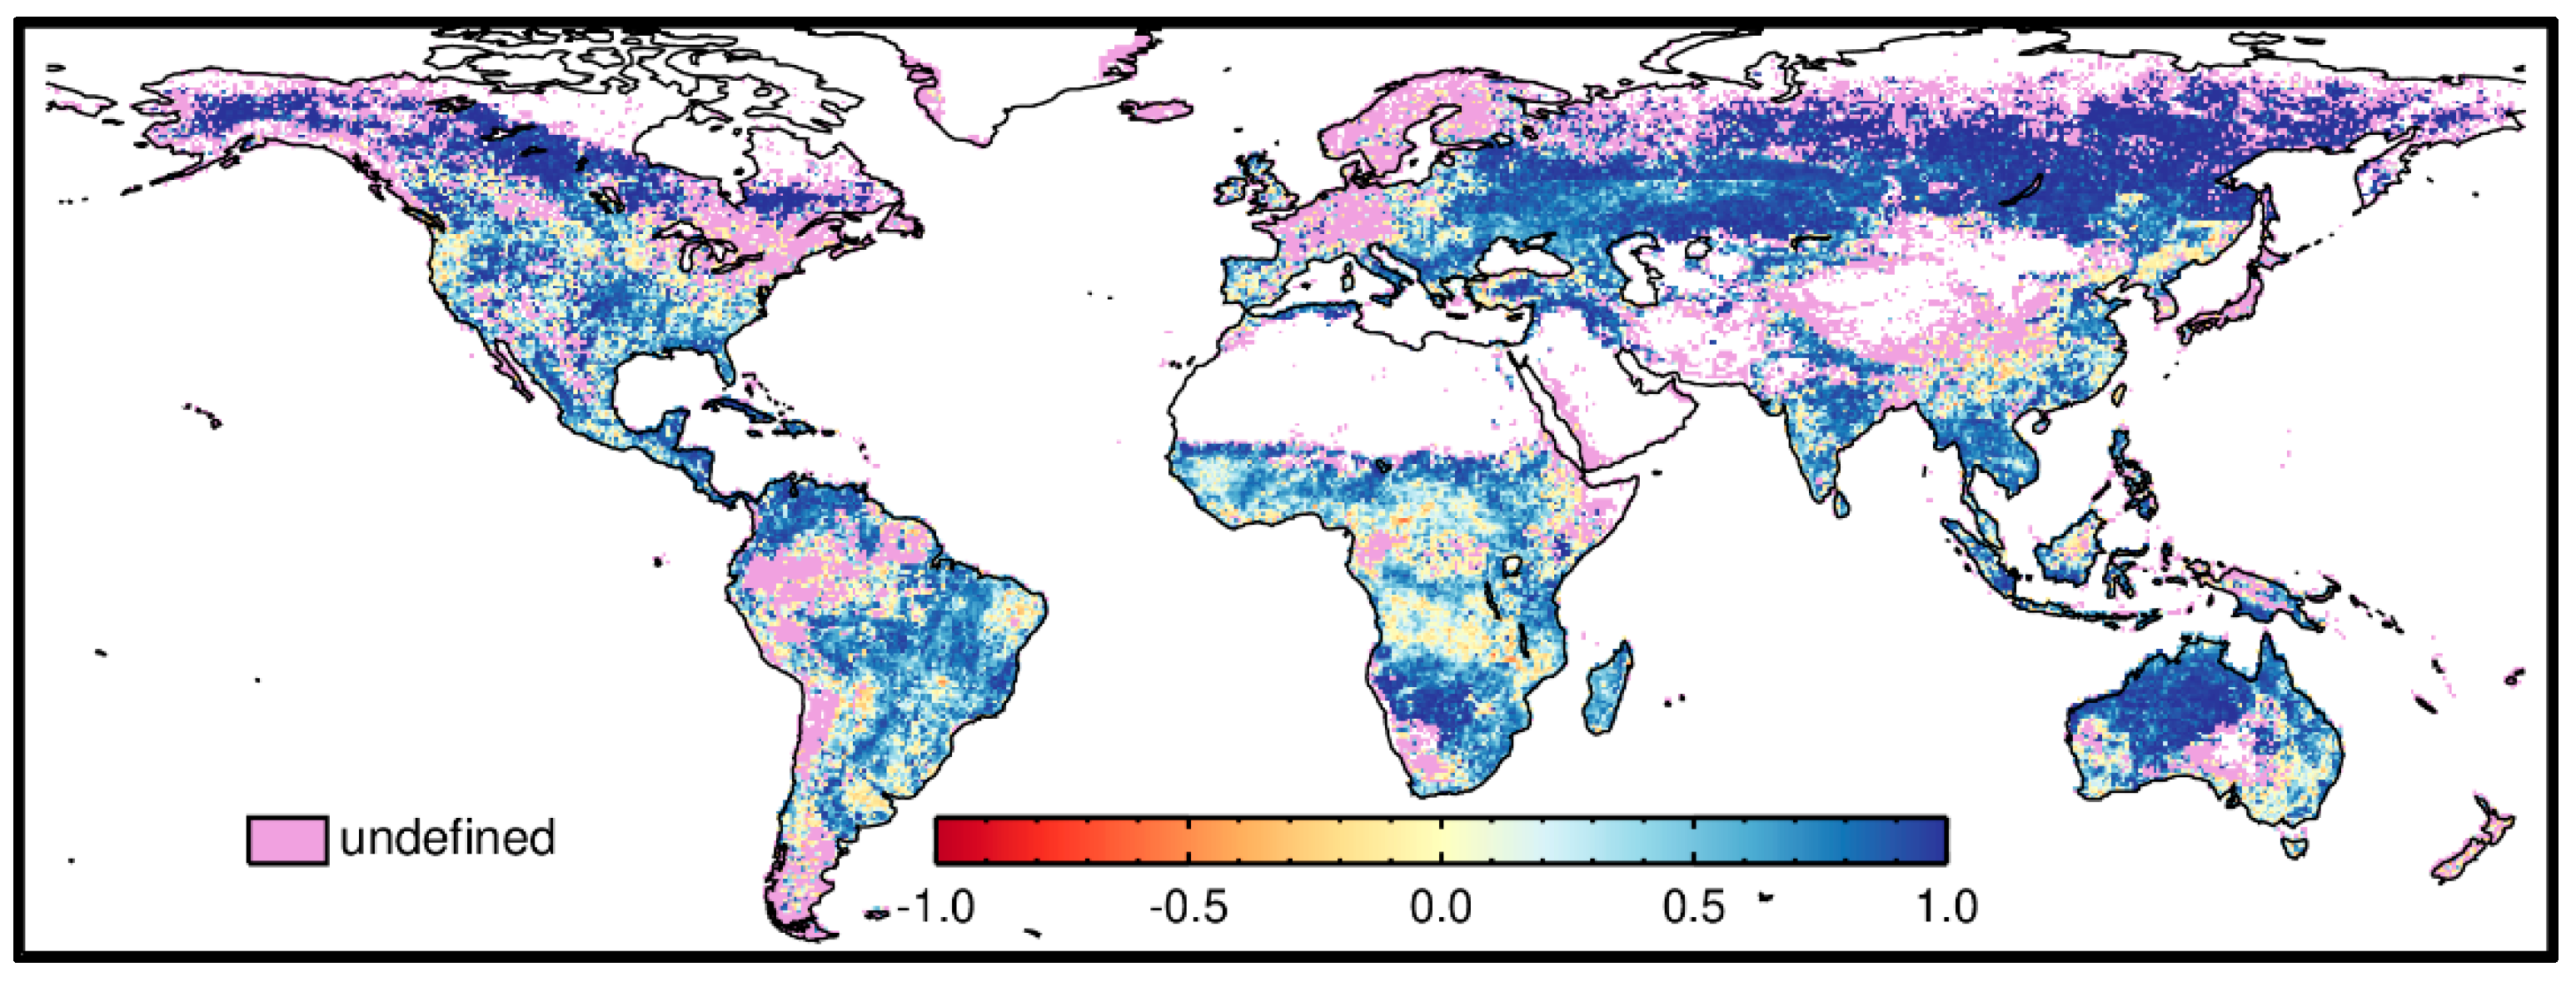
1], we computed the correlation between the FireCCI51 and FireCCILT11 gridded annual BA time series in 0.5° × 0.5° grid cells for 2001–2018. The result is shown in
Figure 1, with a continuous color scale to provide more detail than the four-level quantized correlation map shown in Otón et al. [
1] (cf. Figure 7). Grid cells where the correlation coefficient (
r) was undefined or otherwise meaningless (generally because one of the data sets never reported burned area within a grid cell) were colored pink.
Figure 1 reveals extensive zones in which the BA time series are inconsistent and poorly correlated. Notably, nearly half (48.5%) of the total global FireCCILT11 BA mapped from 2001–2018 was located within grid cells for which
r < 0.5. Curiously, some 12.1% of the total global FireCCILT11 BA mapped during this period was located within grid cells where the FireCCILT11 and FireCCI51 annual time series were inversely correlated (i.e.,
r < 0).
While zones of low correlation occur on every continent except Antarctica, where there is no burning, our focus is on Africa since it has extensive regions with low correlation (
Figure 1) and, by continent, has the most burning globally [
2].
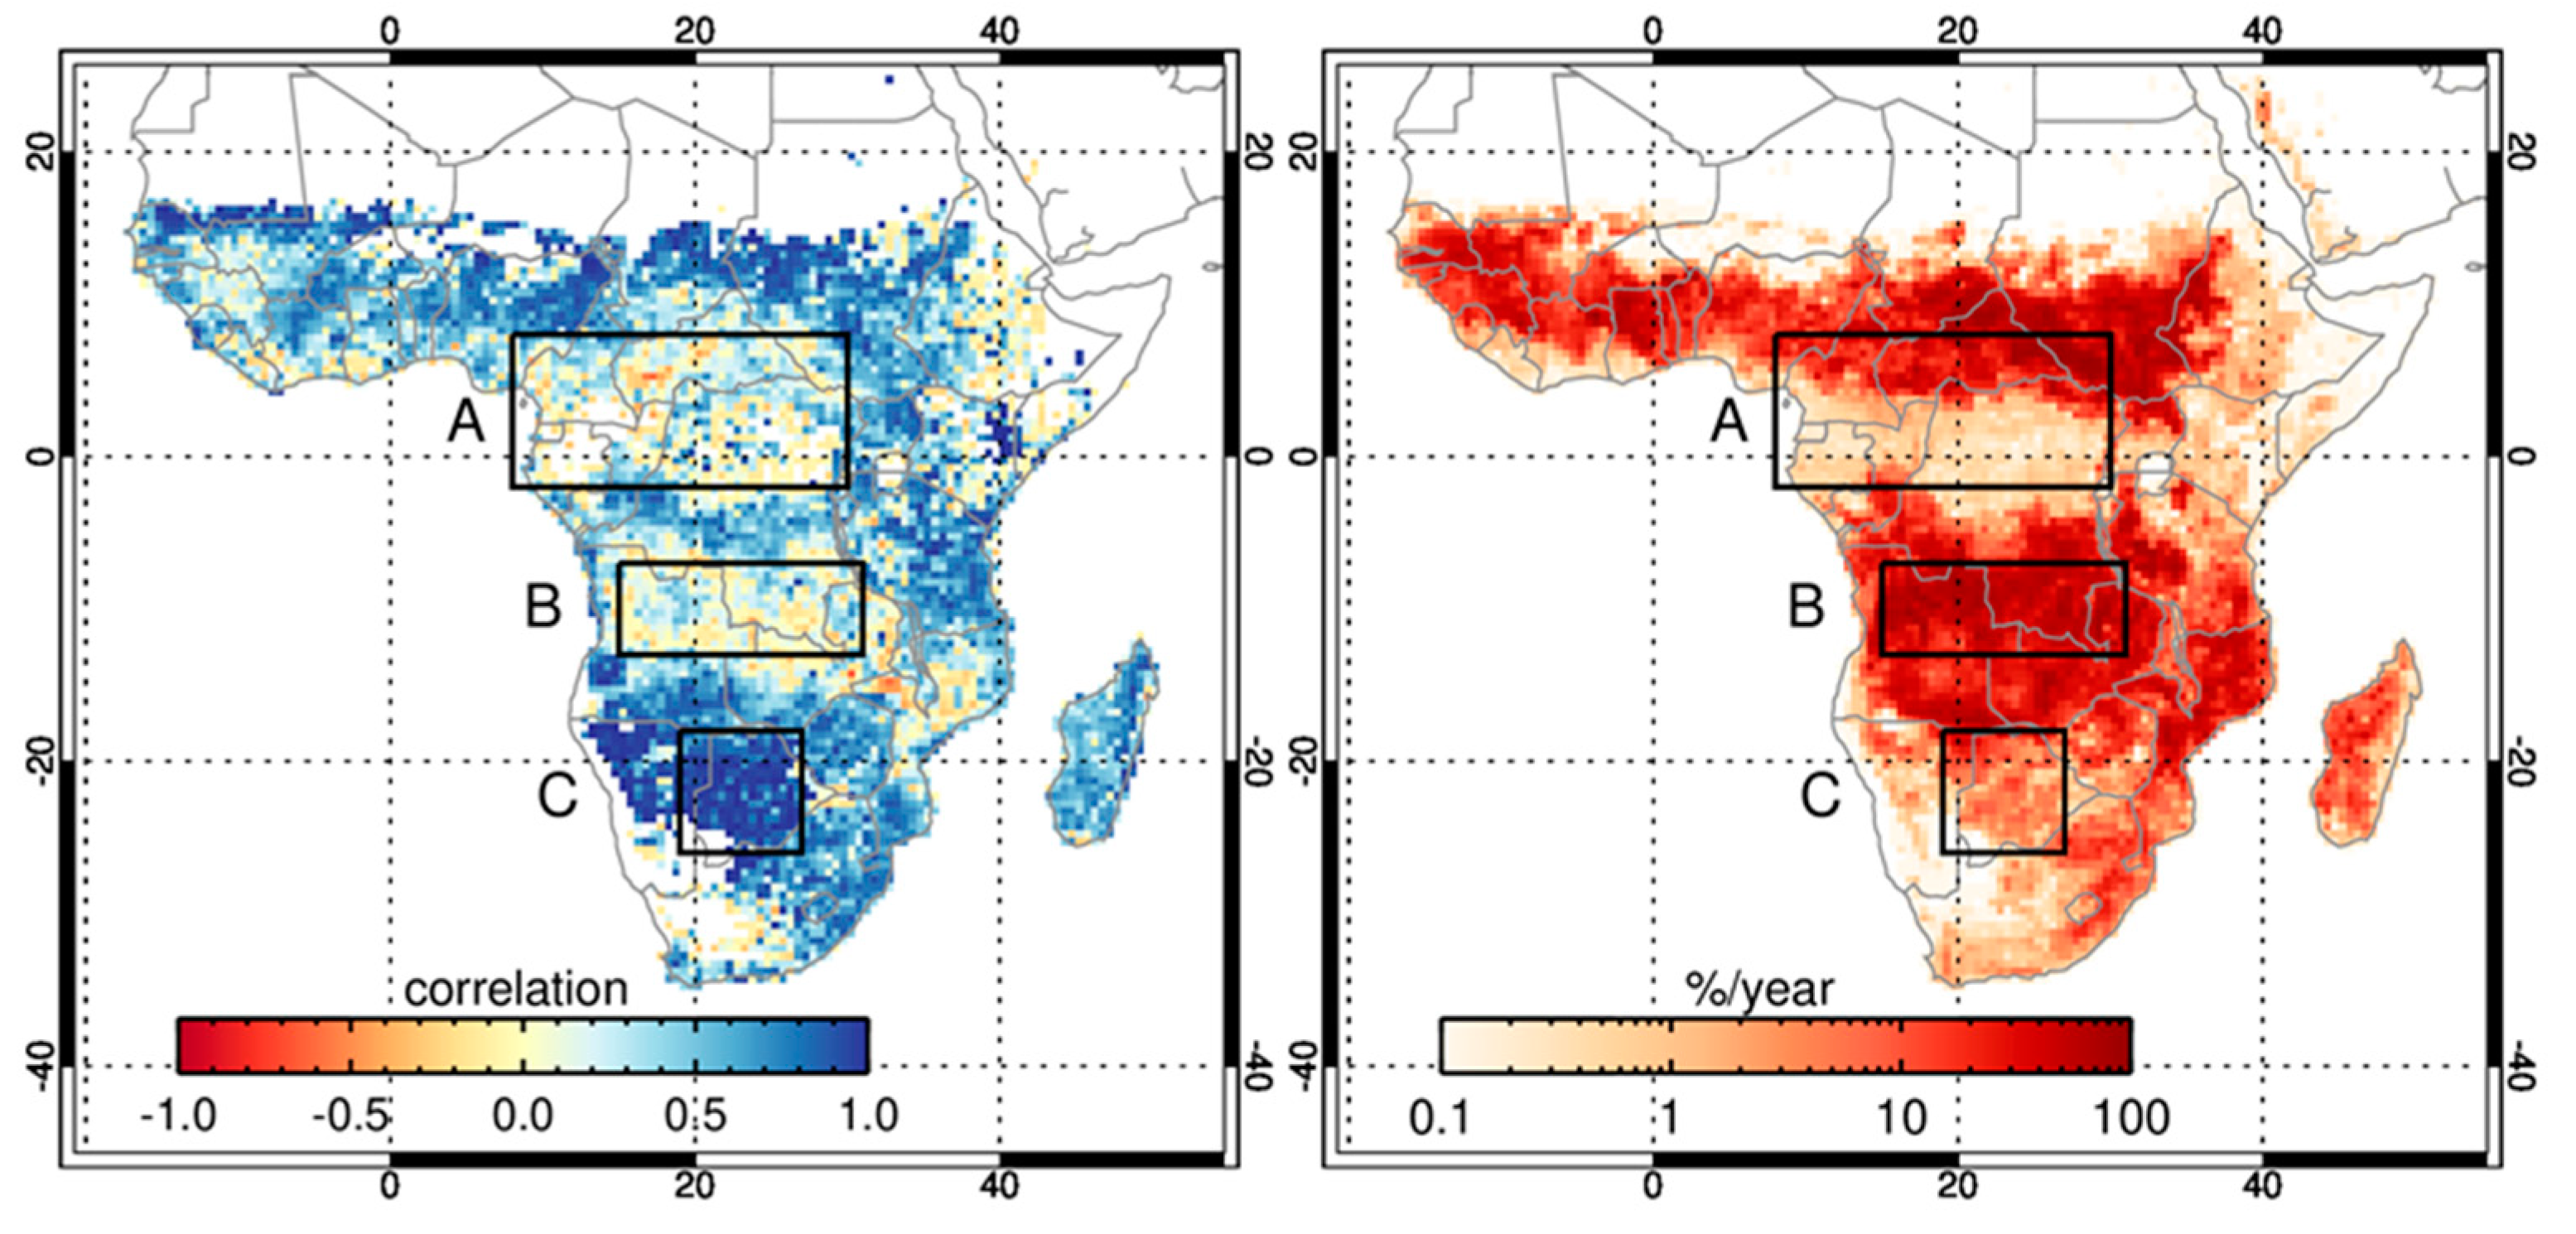
Figure 2 (left) shows the
Figure 1 results for Africa, where 31% of all grid cells have
r < 0.5.
Figure 2 (right) depicts the 2001–2018 mean annual FireCCILT11 BA. Notably, 62.9% of the FireCCILT11 BA mapped in Africa from 2001–2018 was located within grid cells with
r < 0.5.
The three boxes shown in
Figure 2 illustrates two low-correlation regions (A and B) and a high-correlation region (C) that were selected for further analysis. The low correlation regions account for 12.8% (A) and 19.0% (B) of the ≈318 Mha mean annual continental BA mapped by FireCCILT11, and the high correlation region accounts for 1.6% (C).
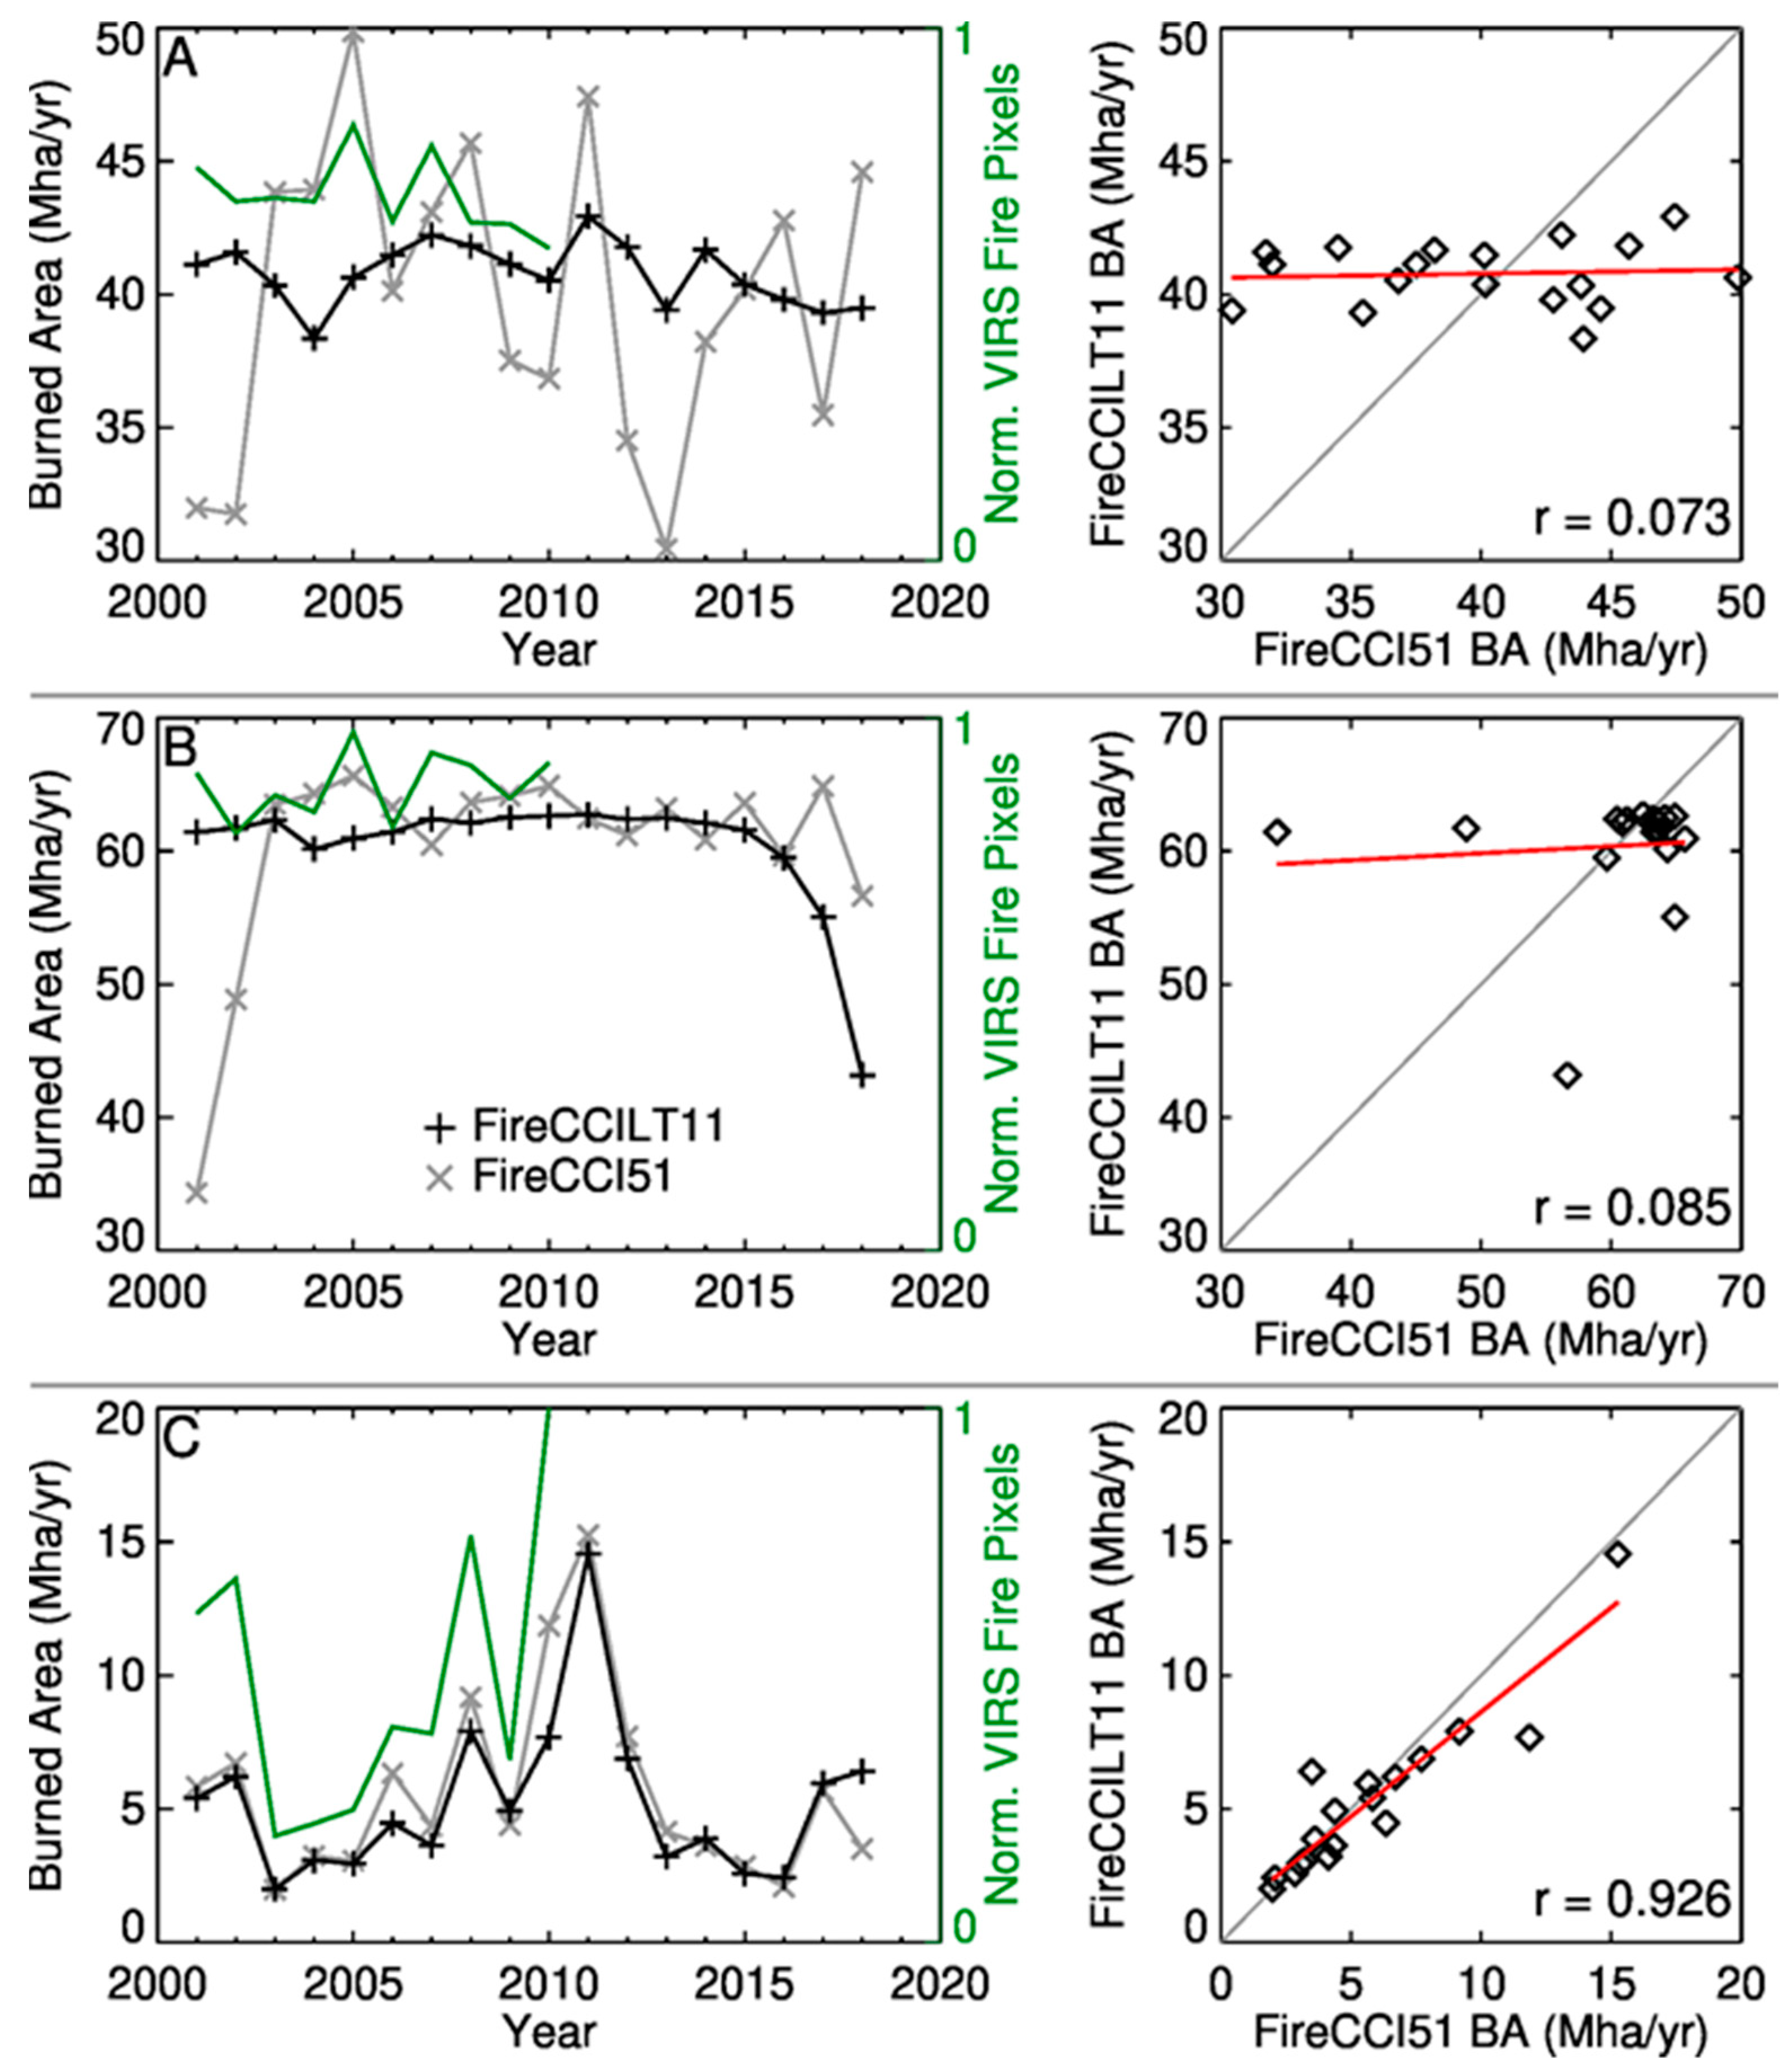
The BA within the three regions was examined in detail for 2001–2018 in
Figure 3. The left column of
Figure 3 shows the annual FireCCI51 and FireCCILT11 BA time series for each region. In addition, annual counts of Tropical Rainfall Measuring Mission (TRMM) Visible and Infrared Scanner (VIRS) active fire detections for 2001–2010 are shown (green lines). The VIRS active fire detections were available for 2001–2010 and provide a useful indicator of fire activity [
3] that is independent of the MODIS-based FireCCI51 and AVHRR-based FireCCILT11 data sets. Several features were immediately apparent for the low-correlation regions (A and B). First, the FireCCILT11 time series replicates almost none of the interannual variability present in the FireCCI51 data set. Second, the FireCCI51 and FireCCILT11 BA totals diverge substantially in 2001 and 2002, with the former significantly underreporting relative to the latter. The low FireCCI51 BA totals are likely an artifact of the June 2001 Terra MODIS data outage [
4], and because Aqua MODIS active fire data were not produced before July 2002. Active fire detections from both the MODIS Terra and Aqua instruments are nominally used to guide the seeding and growing phases of the FireCCI51 BA mapping algorithm [
5]. This attribution is consistent with the absence of similarly low totals in the VIRS active fire record for 2001 and 2002, as would be expected if the outliers were real and not merely a reflection of the FireCCI51 mapping algorithm having to operate with less input data. Third, the FireCCILT11 and FireCCI51 BA results diverged significantly in 2018, a discrepancy we have separately attributed to the rapid decay of the NOAA-19 satellite [
6]. Indeed, the product documentation for the AVHRR LTDR data set used to generate FireCCILT11 specifically recognizes NOAA-19 orbit decay as a known problem and cautions that “Data past year 2016 is not recommended for quantitative analysis” [
7]. Finally, while the VIRS time series exhibits similar annual temporal variation as the annual FireCCI51 and FireCCILT11 BA for region C, it does not for regions A and B.
The right column of
Figure 3 shows plots of annual FireCCILT11 BA versus FireCCI51 BA, and illustrates the poor consistency in regions A and B. In these regions, the FireCCI51 and FireCCILT11 annual time series are essentially uncorrelated. The results for region C illustrate that these issues are not always present. However, while the agreement in region C is high (
r = 0.926), much less BA occurs in this region each year than in regions A and B.
3. Consistency of 2001–2018 BA Trends
The main objective of Otón et al. [
1] was to analyze BA trends using the FireCCILT11 product. For this reason, their FireCCI51 consistency analysis focused on comparing BA trends derived from each data set for the common 2001–2018 period. However, their reported map of trend consistency ([
1], cf. Figure 8) is substantively influenced by their unusually selective criterion of considering only significant opposite trends as constituting disagreement. Locations where only one BA product exhibits a significant trend, even when the other exhibits an opposite trend, were not considered. The spatial extent of inconsistent trends was consequently understated, to the point of implying that the disagreement was restricted to a handful of grid cells worldwide. An additional issue is whether it was sufficient to assess trend agreement solely with respect to direction (i.e., increasing versus decreasing). Agreement in trend magnitude is an important consideration as well, and in this regard, the analysis of Otón et al. [
1] provides no insight. Other trend based statistical analyses techniques were suggested (e.g., [
8]).
4. Conclusions
Otón et al. [
1] described the FireCCI51 and FireCCILT11 BA data sets as “quite consistent during the common temporal period” spanning 2001–2018. Our analysis demonstrated that this claim was not justified for much of Africa, where the majority of global BA occurred annually. We found that a sizable majority (62.9%) of the FireCCILT11 BA mapped in Africa from 2001–2018 occurred in large zones where the time series were inconsistent and poorly correlated (
r < 0.5). This result is somewhat surprising, given that FireCCI51 provided the training data used to generate FireCCILT11. Within these zones, we additionally found that the FireCCILT11 time series replicated almost none of the interannual variability present in FireCCI51, and that the FireCCI51 and FireCCILT11 BA totals diverged substantially in 2001 and 2002 (due likely to a June 2001 Terra MODIS data gap and the lack of Aqua MODIS data), and again in 2018. Setting aside the larger issue of poor correlation, the outliers in these years can, by themselves, confound any attempt to analyze or compare trends over Africa with a combination of the two data sets. Despite these problems, Otón et al. reported widely predominant spatial agreement and only minor disagreement in the FireCCI51 and FireCCILT11 BA trends for the period of 2001–2018. However, this finding is, at least in part, a result of the unusually selective criterion they used to flag disagreement.


