Concept Paper

What Do the Australian Black Summer Fires Signify for the Global Fire Crisis?

by
Rachael H. Nolan
1,2,*,
David M. J. S. Bowman
2,3,
Hamish Clarke
1,2,4,
Katharine Haynes
2,4,
Mark K. J. Ooi
2,5,
Owen F. Price
2,4,
Grant J. Williamson
2,3,
Joshua Whittaker
2,4,6,
Michael Bedward
2,4,
Matthias M. Boer
1,2,
Vanessa I. Cavanagh
2,7,8,
Luke Collins
9,10,
Rebecca K. Gibson
11,
Anne Griebel
1,2,
Meaghan E. Jenkins
2,4,6,
David A. Keith
2,5,11,
Allen P. Mcilwee
11,
Trent D. Penman
12,
Stephanie A. Samson
2,4,
Mark G. Tozer
11 and
Ross A. Bradstock
1,2,4
add Show full author list remove Hide full author list
1
Hawkesbury Institute for the Environment, Western Sydney University, Locked Bag 1797, Penrith, NSW 2751, Australia
2
NSW Bushfire Risk Management Research Hub, Wollongong, NSW 2522, Australia
3
School of Natural Sciences, University of Tasmania, Sandy Bay, TAS 7001, Australia
4
Centre for Environmental Risk Management of Bushfires, School of Earth, Atmospheric and Life Sciences, University of Wollongong, Wollongong, NSW 2522, Australia
5
Centre for Ecosystem Science, School of Biological, Earth and Environmental Sciences, University of New South Wales, Sydney, NSW 2052, Australia
6
New South Wales Rural Fire Service, Sydney Olympic Park, Sydney, NSW 2127, Australia
7
Australian Centre for Culture, Environment, Society and Space, Faculty of the Arts, Social Sciences and Humanities, University of Wollongong, Wollongong, NSW 2522, Australia
8
Cultural Fire Management Aboriginal Working Group and Cultural Fire Management Unit, Department of Planning, Industry and Environment, Parramatta, NSW 2150, Australia
9
Pacific Forestry Centre, Canadian Forest Service, Natural Resources Canada, 506 Burnside Road West, Victoria, BC V8Z 1M5, Canada
10
Department of Ecology, Environment and Evolution, La Trobe University, Bundoora, Melbourne, VIC 3086, Australia
11
Science, Economics and Insights Division, Department of Planning, Industry and Environment, Parramatta, NSW 2150, Australia
12
School of Ecosystem and Forest Sciences, The University of Melbourne, Parkville, VIC 3010, Australia
*
Author to whom correspondence should be addressed.
Submission received: 5 November 2021 / Revised: 6 December 2021 / Accepted: 14 December 2021 / Published: 17 December 2021

Abstract

:
The 2019–20 Australian fire season was heralded as emblematic of the catastrophic harm wrought by climate change. Similarly extreme wildfire seasons have occurred across the globe in recent years. Here, we apply a pyrogeographic lens to the recent Australian fires to examine the range of causes, impacts and responses. We find that the extensive area burnt was due to extreme climatic circumstances. However, antecedent hazard reduction burns (prescribed burns with the aim of reducing fuel loads) were effective in reducing fire severity and house loss, but their effectiveness declined under extreme weather conditions. Impacts were disproportionately borne by socially disadvantaged regional communities. Urban populations were also impacted through prolonged smoke exposure. The fires produced large carbon emissions, burnt fire-sensitive ecosystems and exposed large areas to the risk of biodiversity decline by being too frequently burnt in the future. We argue that the rate of change in fire risk delivered by climate change is outstripping the capacity of our ecological and social systems to adapt. A multi-lateral approach is required to mitigate future fire risk, with an emphasis on reducing the vulnerability of people through a reinvigoration of community-level capacity for targeted actions to complement mainstream fire management capacity.

1. Introduction

Climate-change-driven intensification of wildfire activity is emerging as a global threat [1]. The Australian “Black Summer” fire season of 2019–20 burnt a globally unprecedented percentage of the continental forest biome [2], produced the largest forest fires recorded in recent history [3,4] and exposed Australian ecosystems to an unprecedented extent of high-severity fire [5]. The fires produced smoke that blanketed much of the Australian population for months, resulting in a high community burden of smoke-related illness and premature deaths [6,7]. Smoke plumes and pyrocumulonimbus clouds reached 30 km in height, injected aerosols into the stratosphere [8] and circumnavigated the globe [9]. The fires were widely viewed as emblematic of the catastrophic environmental and social harm caused by climate change [10].
The fires triggered considerable public debate about the extent to which climate change was the cause [10,11]. Alternative propositions centred around land management, principally a lack of fuel management [11], but also the role of forest management [12]. There was also debate about whether anthropogenic ignitions (specifically arson) or lightning were principally responsible for igniting the fires [10]. The fire season triggered a fresh cycle of state-level inquiries and a national Royal Commission, following a well-worn cycle that has emerged following major fire events in Australia since 1939 [13]. Inquiries into previous fire seasons have typically resulted in major changes to policy, planning and response capacity along with increased funding for their implementation, followed by a gradual complacency and failure of policy implementation until the next major bushfires [13].
Here, we apply a pyrogeographic lens to the 2019–20 Black Summer fires; that is, we synthesise the human, biophysical and ecological dimensions [14] of the fires by presenting original analyses and reviewing key papers published on the fires. This integrated approach to analysing the causes and impacts of the fires provides a foundation for examining the responses to the fires. We address the following questions. Firstly, were the fires primarily driven by climatic or land management factors? Furthermore, were the fires predominantly ignited by lightning or anthropogenic sources? Secondly, how effective was fire management in reducing impacts? Thirdly, who and what was affected by these fires? Fourthly, what key changes to policy and capacity have ensued? We provide detailed methods in the final section (Section 9). Given the nature of these fires as a harbinger of the future—not just in Australia, but globally—science, policy and management are now at a critical juncture: have we learned enough to adapt to the climate-change-driven intensification of wildfire activity, or will the cycle intensify and losses accelerate, leading to social, ecological and economic dysfunction?

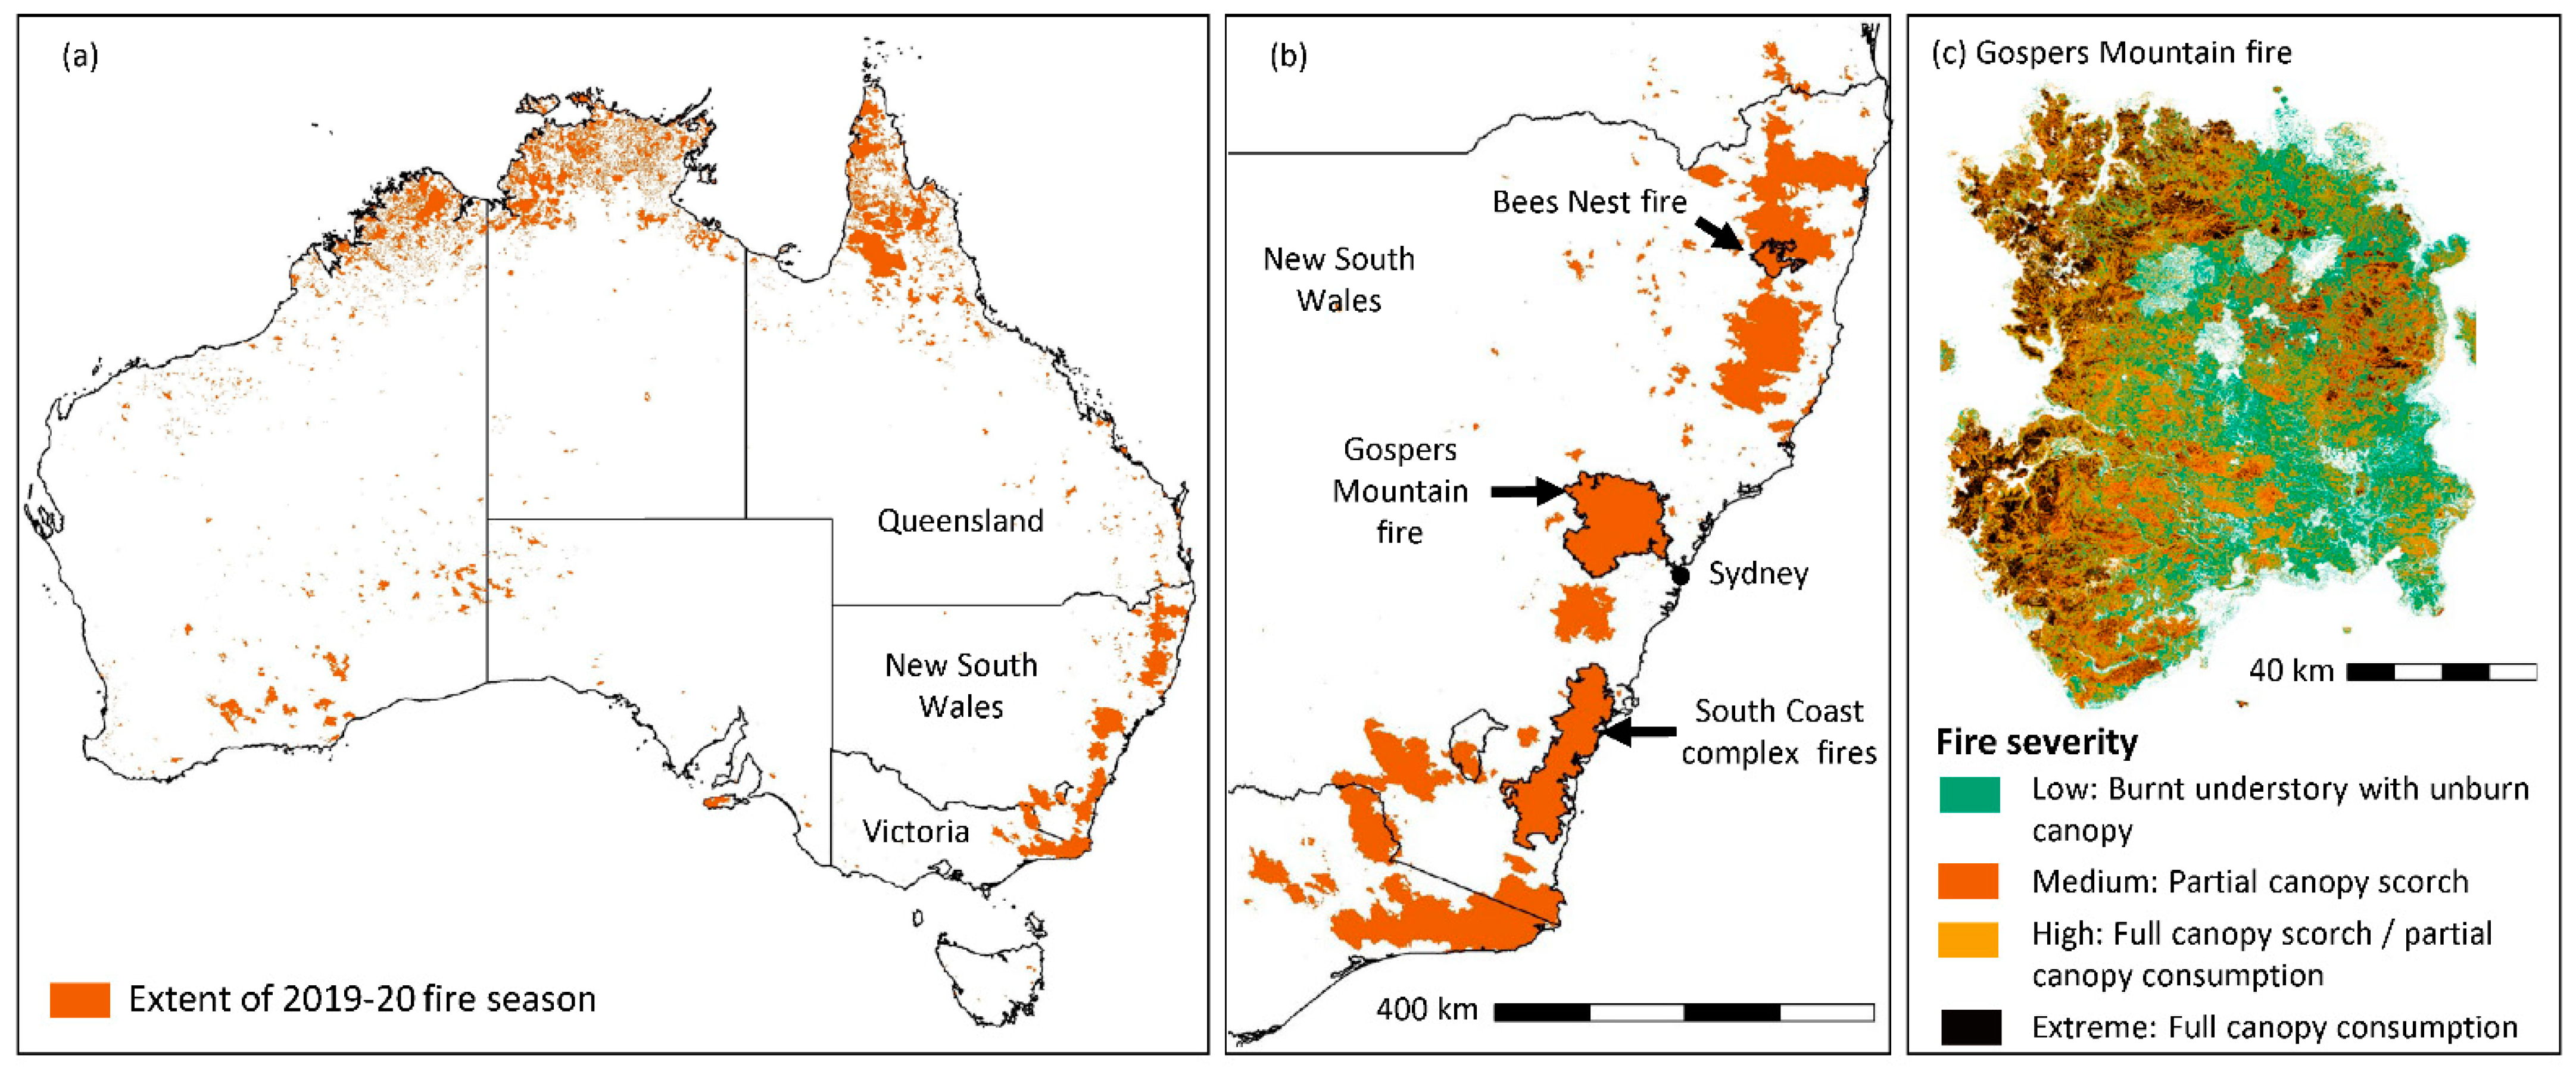
2. Extent of the Black Summer Fires

The Black Summer fires burnt over 24 Mha across Australia [15]. We limited our scope to the estimated 7.2 Mha of fires in the temperate south-east of the country, which represents an unprecedented extent of fire in the region in the modern fire management record [2,16] (Figure 1). The majority of these fires occurred between early September 2019 and February 2020, progressing southwards as the austral spring and summer progressed [4,17]. While the fires impacted a range of ecosystems, the largest fire-affected areas were eucalypt forests and woodlands [18], the majority of which are resilient to fire, i.e. fires are not typically stand replacing events [19].

3. Causes of the Black Summer Fires: Climate or Land Management? Lightning or Anthropogenic Ignition Sources?

The Black Summer fires were associated with record-breaking fuel dryness [2,4,17,21,22,23] (Figure 2g–i) and fire weather [17,24] (Figure 2l). These conditions arose out of the driest and hottest year on record for Australia [4,25], which was a function of climate variability exacerbated by climate change [17,26,27]. There is no evidence that the fires were driven by anomalously high fuel loads [28], with estimates being close to mean values for the past 30 years (Figure 2d–f). There is also no evidence that the fires were primarily the legacy of forest management [29]. Of the fires with determined ignition sources in NSW (3.7 million ha), lightning-ignited fires burnt an area six times greater than fires resulting from anthropogenic ignitions (Figure 2j), with suspected arson accounting for <1% of the area burnt (Table S1). Similarly, lightning-ignited fires were responsible for the majority of houses destroyed by the fires (Figure 2k).
The Gospers Mountain fire (Figure 1c) exemplifies the Black Summer fire season. This fire was ignited by lightning in a remote area of national park in NSW. During the 2019–20 fires, this region had the lowest fuel moisture and highest Forest Fire Danger Index (FFDI) relative to previously recorded fire seasons (Figure 2l). The FFDI represents fire weather conditions and is calculated from rainfall, temperature, windspeed and relative humidity; for details on the calculation of the FFDI see Section 9.2. The Gospers Mountain fire went on to become the largest single-ignition fire in the modern fire management record in the region, burning 512,000 ha, before being extinguished after 107 days [30]. The extensive area burnt by the Gospers Mountain fire and many other fires was evidently a function of extreme climatic circumstances, with the exceptionally dry fuels and extreme fire weather allowing lightning-ignited fires to burn across an unprecedented area. However, the question remains: to what extent was fire management effective in reducing the impacts of the Black Summer fires?

4. How Effective Was Fire Management in Reducing Impacts of the Black Summer Fires?

In Australian forests long-term fire management strategies focus on reducing fuel loads and altering fuel structure, with the aim of reducing the rate of spread and severity of wildfires and to increase opportunities for safe fire suppression. Fuel reduction is most commonly achieved through the use of hazard reduction burns—i.e., planned fire—although fuel mastication is also increasingly undertaken in areas where it can be challenging to implement burns, such as close to houses [31]. Many jurisdictions have annual targets for the area of land subject to hazard reduction burns. These targets may be area-based—e.g. a nominated percentage of public land is burnt—or risk-based, e.g. a reduction in the risk posed by wildfires to houses is achieved following hazard reduction burns [32]. Hazard reduction burns are typically of lower severity and leave more unburnt patches than wildfires [33,34]. We find that hazard reduction burns conducted in the two years prior to the 2019–20 fires were effective in reducing the probability of high severity fires under many circumstances (Figure 2a) [35]. However, the efficacy of hazard reduction burns reduced through time, with hazard reduction burns older than five years showing little ability to suppress the probability of high-severity wildfire (Figure 2b). We also find that antecedent hazard reduction burns showed lower ability to reduce the severity of the 2019–20 fire season compared to antecedent wildfires under elevated weather conditions (Figure 2c). We find that hazard reduction burns were likely to have contributed to saving houses from destruction. Specifically, there were lower rates of house loss when significant portions (60–80%) of the surrounding neighbourhood had been subject to hazard reduction burns in the five years prior to the 2019–20 fires (Figure 3). House loss was highest during extreme weather conditions and in extensively forested areas (Figure 3).
Record-breaking fire suppression efforts were undertaken during the Black Summer fires, including a record 24 million litres of aerial fire retardant used [30] and a record expenditure on fire and emergency management (Table S3). The effectiveness of these efforts is difficult to quantify, as records of the location and nature of the suppression operations and their effect on fire behaviour are incomplete [30]. However, both positive and negative impacts of fire suppression were reported during the fires. For example, the NSW Rural Fire Service (RFS) reported that strategic backburns, in combination with existing fuel breaks, were instrumental in protecting potentially thousands of homes in the Blue Mountains area, which were threatened by a spot fire from the Gospers Mountain fire [30]. In contrast, backburning operations along the southern containment line of the Gospers Mountain fire are alleged to have caused multiple spot fires that impacted local communities when weather conditions deteriorated [30]. Overall, 14,567 homes that were within or in close proximity to the fires remained undamaged, which represents almost six times as many homes that were destroyed by fire [30]. The effects of suppression efforts on the area burnt, fire severity, and biodiversity and cultural heritage, are much more difficult to ascertain, with some high-profile exceptions. For example, the “Wollemi Pine Operation” involved intensive aerial and ground-based fire suppression, including establishing an irrigation system, to protect the critically endangered Wollemi Pine [30].

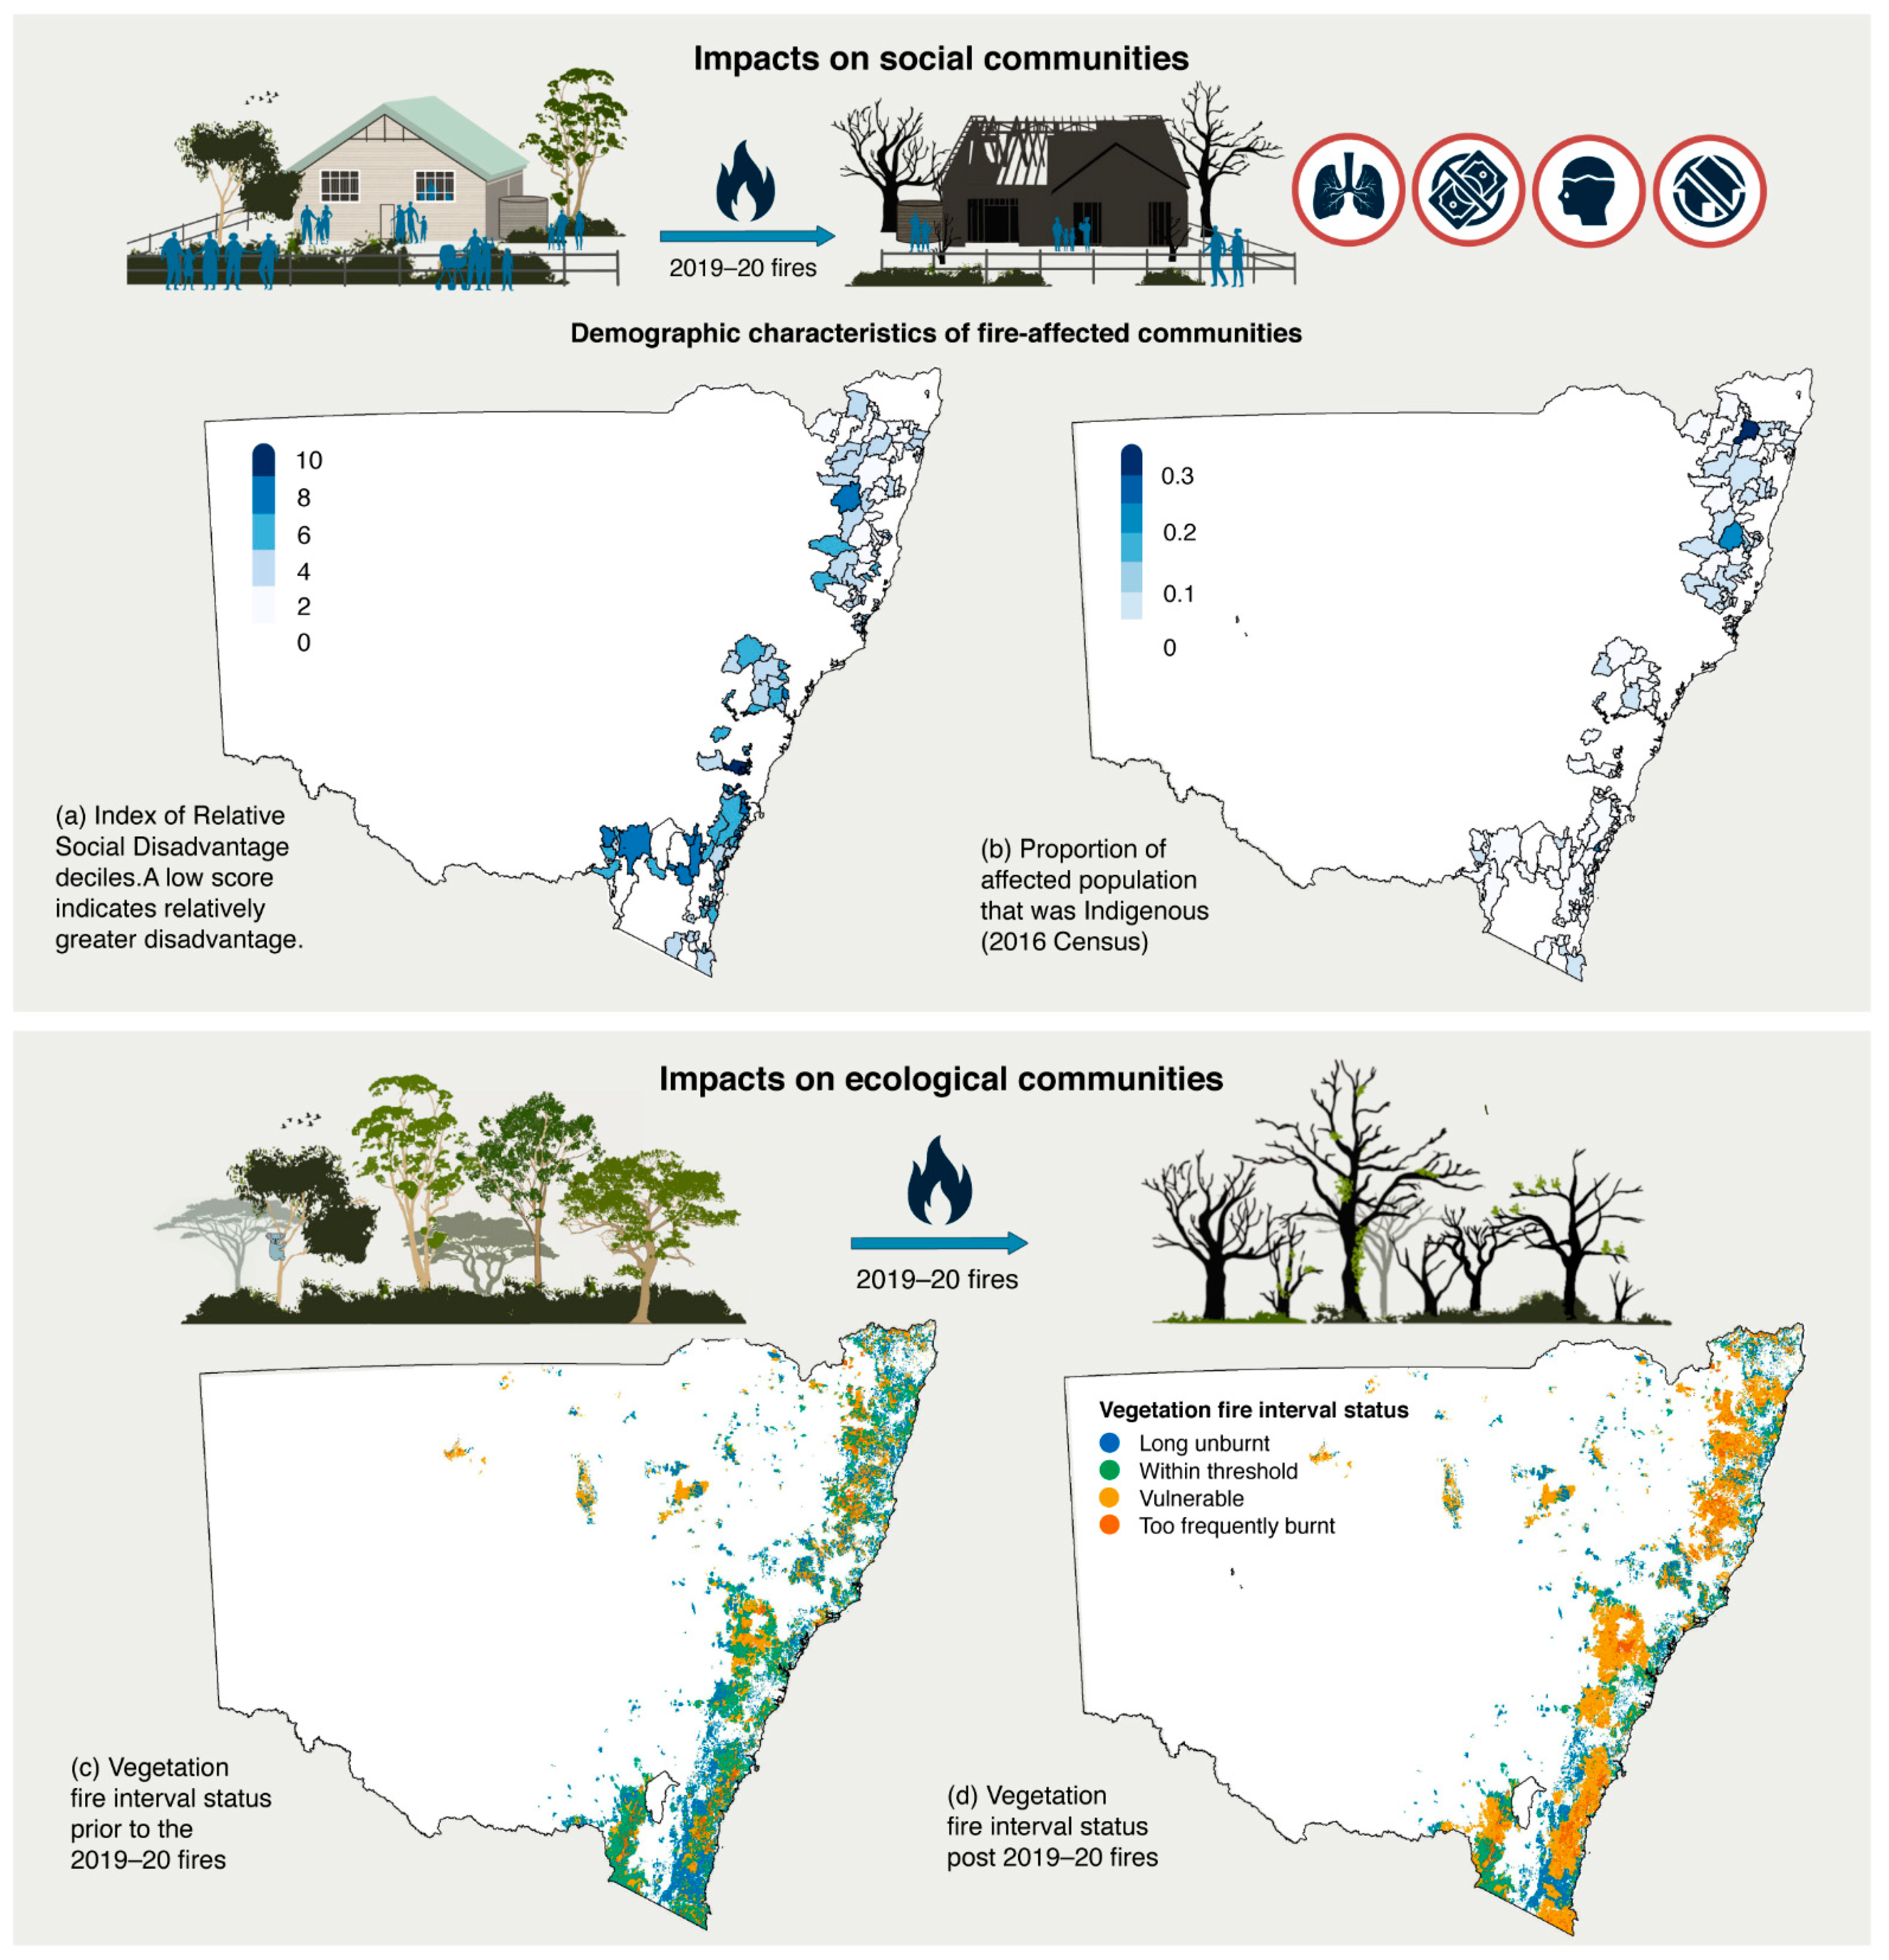
5. Who and What Was Affected by the Black Summer Fires?

The impacts of the Black Summer fires were diverse and, in some cases, unexpected. While the fires ringed the largest metropolitan area in Australia (i.e., the cities of Sydney, Newcastle and Wollongong), the losses of lives and property on the fringes of these cities was relatively small compared to regional areas. Nonetheless, impacts extended into major population centres through smoke exposure [36], which contributed to an estimated 429 deaths [6], additional to the 33 people who lost their lives directly as a result of the fires in regional areas [37]. Many more people required hospital admissions or attended emergency departments for cardiovascular and respiratory diseases linked to smoke exposure [6]. Other impacts included loss of homes (Figure 3), infrastructure [37] and income and emotional trauma [36]. These impacts were disproportionately borne by socially disadvantaged [38] and Indigenous populations; 38% of fire-affected areas were among the most disadvantaged (Figure 4a) and areas with relatively large Indigenous populations were fire-affected (Figure 4b) [39]. The bushfires particularly affected Indigenous communities in relation to Indigenous peoples’ relationality with Country and the heritage values that exist in the landscape [40]. Aboriginal peoples have a deep connection to Country, with the term ‘Country’ describing Aboriginal peoples’ cultural and spiritual connection to place, involving specific regions and the lands, waterways and seas therein [41]. Given this connection to Country and that Aboriginal cultural lives and livelihoods are tied to the land, their experience of the Black Summer fires was vastly different to those of non-Indigenous people [40].
The fires impacted extensive areas of vegetation that rarely burn, including fire-sensitive rainforests and alpine ecosystems, which usually act as a natural barrier to fire spread (Table S2). More than one third (9000) of all Australian plant species were recorded within the fire footprint prior to the fire season, including 44% of Australia’s threatened plant species [18]. An estimated 832 vertebrate fauna species were estimated to occur across the fire grounds, including 21 threatened species [42]. Post-fire erosion and subsequent declines in water quality were severe enough in some waterways to trigger fish death events, with some events reportedly killing thousands of fish [43]. However, there are early signs of recovery across many vegetation communities and observations of a wide diversity of animals surviving the fires [44]. Areas with low fire severity—i.e., where the overstorey canopy remained intact, or unburnt patches within fire footprints—are highly likely to provide important refugia for flora and fauna. These areas may account for up to 37% of the mapped burn area [5]. For example, koala survival rates were much higher in vegetation burnt at a low fire severity [45]. Of concern, however, is that much of the vegetation was placed at an immediate risk of biodiversity declines by being too frequently burnt following the fires (Figure 4c,d) [46]. As a result of the 2019–20 fires, 257 plant species experienced intervals between successive fires across their range that were likely too short to allow effective regeneration, and a further 411 species will be at similar risk if fire soon recurs [18]. The increasing fire frequency may impact the persistence of a range of ecosystems and species, depending on the nature and extent of future fire seasons (Figure 4c,d). An additional concern is the impact of drought and heat-waves during 2019, which were observed to trigger widespread forest canopy die-back [47], which likely weakened the ability of some trees to survive and recover after the fires [48].
Figure 4. Impacts of the Black Summer fires, illustrating demographic impacts, including (a) the Index of Relative Social Disadvantage (IRSD) deciles of affected areas in 2016. The areas represent “Statistical Area Level 1” (SA1), which is the smallest unit possible in the presentation of Australian census data, with an average population size of approximately 400 people [49]. A low score indicates relatively greater disadvantage and high score indicates a relative lack of disadvantage. For further details on the methods see Section 9.5. Our analysis of census data in fire-affected areas revealed the median decile in the Index of Relative Social Disadvantage (IRSD) was 4, indicating a degree of relative social disadvantage. Shown in (b) is the proportion of affected SA1 population that was Indigenous at the 2016 census. The average proportion of Indigenous people across Australia in the 2016 census was 0.03 [50]. Additionally illustrated are ecological impacts, with vegetation fire interval status (c) prior to and (d) following the 2019–20 fire season shown for NSW. Fire-interval status was determined from fire history data and established ecological thresholds for the optimal return-time of fire. These thresholds identify a minimum and maximum number of years between fires in order to maintain the ecological state of the community.
Fire 04 00097 g004

6. What Key Changes to Policy and Capacity Have Ensued from Governmental Inquiries?

In Australia, responsibility for emergency management resides with state and territory governments [15]. Thus, a national Royal Commission produced recommendations largely centred on data sharing and integration between states and the provision of disaster relief [15]. In NSW, the most fire-affected state, an inquiry into the bushfires produced 76 recommendations. Similar to previous inquiries [13], these recommendations primarily related to fire-fighting, technological advances, government systems, fire science and community education and engagement [30]. The NSW Inquiry also identified the need for a cultural shift to recognise the limits to defending assets and fire-fighting during extreme seasons [30]. The inquiry further recommended that fuel reduction increase in close proximity to developments, as supported by past [51,52] and new analyses (Figure 3). The NSW Inquiry also recommended an increased focus on fuel reduction in areas prone to the development of extreme fire behaviour such as pyrocumulonimbus storms [53]. Importantly, the overriding influence of weather conditions on governing the effectiveness of hazard reduction activities was recognised. Novel recommendations included responding to health impacts of smoke exposure, providing mental health services to firefighters and greater application of cultural burning, noting that cultural burning is part of a broader practice of Aboriginal land management and not simply another hazard reduction technique [30]. There are many benefits, but also many challenges, involved in reviving cultural burning practices (see Box 1).
It is unknown how much difference the existing management capacity made to the outcomes of the 2019–20 fires, though it is evident from our results that the current management had varied success in mitigating impacts (Figure 2 and Figure 3). Current expenses related to fire management in south-eastern Australia exceed AU$1 billion annually (e.g., NSW and Victoria), with major increases incurred (circa. 10–30%) during the 2019–20 season compared with preceding seasons (Table S3). A further increase in the magnitude required to significantly mitigate seasons of the magnitude of 2019–20 would place a formidable burden of public expenditure that is probably unfeasible. For example, the NSW Rural Fire Service, which is the leading fire protection agency in NSW, increased its annual expenditure from an average of AU$384 million in the 5 years preceding the 2019–20 fire season to AU$870 million. While this significant increase in expenditure mitigated some impacts, e.g., through the protection of assets, the 2019–20 fire season was still unprecedented in terms of ecological and social impacts. These figures demonstrate that even when fire management expenditure is doubled, it is still not enough to halt extreme fire seasons under climate change.
Box 1. Benefits of and Challenges to a Revival of Cultural Burning Practices.
The benefits of cultural burning practices are clear. In-depth qualitative inquiry with those who are involved in re-engaging with cultural burning has demonstrated significant benefits for spiritual, physical and mental health and increases in pride, confidence and resilience to life’s knocks and stresses [54]. Those involved discussed the joy at passing on their knowledge to younger generations and seeing how knowledge, cultural practice and connection to Country was growing. While the Black Summer fires led to significant interest in a revival of cultural burning, there is a need for serious commitment in terms of long-term funding and policy change. Processes of ongoing colonisation have created serious challenges for Aboriginal people to care for Country and carry out their obligations. They are left out of many important decision-making processes, face significant bureaucratic delays and often have to compromise culturally to conduct burns that comply with fire and land management agency policy. Structural and procedural change is needed to ensure that the governance around cultural burning supports Indigenous peoples’ rights to self-determination and to care for Country their way. The New South Wales government is currently working with Aboriginal communities to develop a cultural fire management strategy that will support an appropriate governance model for cultural fire management going forward [55]. This requires: greater engagement and partnership with Aboriginal communities; a recognition of the validity of cultural fire and caring for Country knowledges and practices alongside Western styles of fire and land management; the provision of secure, adequate and ongoing funding opportunities to progress community-led cultural fire management; the creation and support of sustainable livelihood opportunities for cultural burning practitioners; and ensuring opportunities for Aboriginal women to engage in cultural burning and caring for Country—which is currently a male-dominated space.

7. Is Australia Better Equipped for a Future of Extreme Fire Seasons?

While governmental inquiries produced broad-ranging recommendations, we argue that they have not resulted in a fundamental shift in the way in which fire will be managed in the future. Overwhelmingly, they reinforce the status quo of a centralised and technology focussed approach to the mitigation of risk, with greater strategic nuance and an expanded role for national level co-ordination. While technological solutions can provide important support for fire management, the implementation of technological solutions may also lead to perverse outcomes if not implemented thoughtfully. For example, community expectations of timely and accurate access to warnings and information (e.g., via targeted phone messaging, mobile phone apps and conventional and social media) are growing, but the provision of such information may lead to delays in people making decisions to leave areas at imminent risk of fire [56]. This may potentially result in catastrophic outcomes when wildfires behave unpredictably or cause disruptions to communications, as occurred during the 2019–20 fire season. Further, the development and implementation of novel technological solutions will take time, leaving Australia unprepared in the interim.
The fire–inquiry cycle, despite its strengthening of the mainstream of fire management (i.e., more suppression resources, technology and enhanced co-ordination) has not delivered the kind of transformation that would be needed to significantly alter the outcome of a fire season similar in magnitude to or exceeding 2019–20 in the near to medium term. The mainstream of fire management primarily seeks to alter the fire cycle (i.e., recurrence rate and intensity of fires) mainly through targeted prevention and suppression activities. But if the sum total of changes in capacity are unlikely to significantly counter the influence of climate change on the size, frequency and intensity of wildfires, then additional capacity and initiatives are required to complement the mainstream. The resilience of human and ecological systems will become critical to their capacity to adapt to and coexist with new fire regimes [57]. Policies that recognise, foster and build this capacity will be required to build this additional capacity. Here we outline some of the possibilities in this regard.
The rate of change needed to recover and respond to the rapidly changing outlook for fire risk may challenge the capacity of our political, policy, technological and social capacity to adapt in time. Ecological systems depend on the resilience of biota (e.g., the ability of plants to regenerate via post-fire recruitment or resprouting) to cope with the recurrence rate of fires: if such resilience is inadequate or compromised, then major changes in ecological systems’ composition and function may result [58]. In a similar vein, there are likely limits to the capacity, rate of recovery and trajectory of the resilience of human communities, which will restrict the ability of such communities to persist and adapt in fire-prone environments. While people and communities often have a high potential to adapt to biophysical and ecological changes, faced with such changes responses tend to be slow and incomplete [59,60]. A decoupling of the rate of environmental change driven by climate change from the rate of social change required to respond could lead to the withdrawal and even collapse of human communities in fire-prone environments. Faced with this reality, what are the alternatives?
A principal tension in the debate about contemporary fire management is concern about the increasing centralisation of control by large fire management agencies [61,62]. Rapid changes in technological capacity (e.g., aircraft, vehicles, fire suppression technology, geo-spatial intelligence and information, modelling, communications etc.) necessitate high levels of planning, logistics and operational control. This has subsumed a traditional ethos of self-organisation and defence in rural communities, leading to possible disempowerment and disregard for local experience and knowledge [63]. While the vulnerability of people and property in fire-prone landscapes can be reduced in many ways, such as enhancements to developmental controls and building standards imposed by governments [57], there is a potential for a significant bottom–up reinvigoration of a grass-roots, community capacity for action. This constitutes a form of adaptive resilience [64] that involves an informed local knowledge and acceptance of vulnerability and risk by residents and a shared responsibility for action, as well as mechanisms to assist and equip local communities to undertake preparation and response and to co-ordinate an active role for local communities in planning and operations [65]. In return for more resources and greater formal inclusion in the fire management hierarchy, communities and individuals in high-vulnerability and -risk areas may need to demonstrate the effective implementation of local mitigation strategies (e.g., local fuel modification, building preparations, communication networks etc.); preparation; and competencies in order to earn a social license to operate as fire managers and to live on the front line. A renewed effort to support the transition of people who may decide to withdraw from fire-prone landscapes may be required, despite the failure of prototype schemes in the recent past. For example, three years after the 2009 Black Saturday fire in Victoria, in which over 2000 houses were destroyed, only around 100 homeowners had participated in a voluntary buy-back scheme implemented by the state government [66].
Adaptive or transformative resilience of this kind will pose many challenges. Many human communities that are exposed to fire in Australia and elsewhere have been ageing on the one hand [67], but on the other, the COVID-19 crisis has resulted in a migration from cities to the regions [68], which may result in an increased exposure and vulnerability of new residents who have little experience of fire. Thus, vulnerability and the ability of communities to self-organise to meet the challenges of a more flammable future are in a state of flux, with outcomes uncertain. A renewed emphasis on the adaptive experimentation with differing approaches and interventions for both human risk mitigation and biodiversity conservation [69] may be required to test, adopt or discard new strategies.

Limits to Co-Existing with Fire in a Changing Climate

Even if we can substantially increase our capacity to mitigate localised fire impacts such as house loss (Figure 2 and Figure 3), these types of management responses are primarily targeted at protecting social communities. Many ecosystems are now at risk of biodiversity declines due to increased fire frequency (Figure 4), in combination with threats posed by climate change [48]. Protecting ecological communities will require some hard decisions about what the Australian community is prepared to conserve and, importantly, how much they are prepared to invest in these measures. The extraordinary efforts undertaken to protect the critically endangered Wollemi pine during the fires are unlikely to be feasible for many species. The collapse of social and ecological systems in the face of the increasing wildfire risk seems a remote prospect, even in many parts of the world that experience regular destructive wildfires. However, the 2019–20 Australian Black Summer fires, because of their magnitude and the scale of their impacts, have set up a template of widespread vulnerability that is unlikely to be rapidly offset by net changes in our capacity to prepare and respond. Therefore, cycles of political, social and ecological resilience will be jeopardised to an uncertain degree in the immediate future.

8. Conclusions: What Do the Australian Black Summer Fires Signify for the Global Fire Crisis?

Record heat and dryness is driving up the size and penetration of wildfires into many vulnerable human communities and ecosystems, from the tropics to the boreal regions [1]. These regions support different historical fire regimes with a range of ecosystem responses to fire and similarly, a range of strategies for human co-existence with fire. Despite these differences, there are many similar themes recurring across the globe, namely, that climate change is increasing the potential for extreme wildfire seasons [1]. Many countries are examining similar questions to that faced by Australia around how to live with wildfire under climate change. For example, in the western USA an increase in large and intense wildfires in recent decades has led to discussion about the role of historical fire suppression, Indigenous burning practices and forest thinning on forest fuels and subsequent wildfires [70]. Shifting fire regimes under climate change also poses challenges for international cooperation in managing extreme fire seasons, with many countries historically sharing firefighting resources. For example, North American and Australian firefighters historically work together, sharing resources such as firefighting personnel and aircraft, with fire seasons occurring in alternating months of the year. The Black Summer fires were no exception, with resources from North America and many other countries deployed to help fight the fires and provide logistical support [30]. However, as fire seasons have lengthened in the northern and southern hemispheres, the fire seasons are beginning to overlap. The Black Summer fires began in the winter of 2019, coinciding with the peak of the North American fire season.
We have seen from the Australian Black Summer fires that social and ecological impacts vary with the demographic characteristics of human communities and ecosystem attributes, and that recovery may be hampered by compounding factors (e.g., drought and heatwaves impacting on ecosystem resilience). The Australian Black Summer fires demonstrate that current levels of wildfire management capacity are insufficient for responding to extreme fire seasons and that our capacity to adapt may be outpaced by the rate of change in fire risk delivered by climate change. Fire management has therefore reached a cross-road. Will we continue with business as usual, or seek innovative, multi-faceted approaches to mitigating future fire risk?

9. Materials & Methods

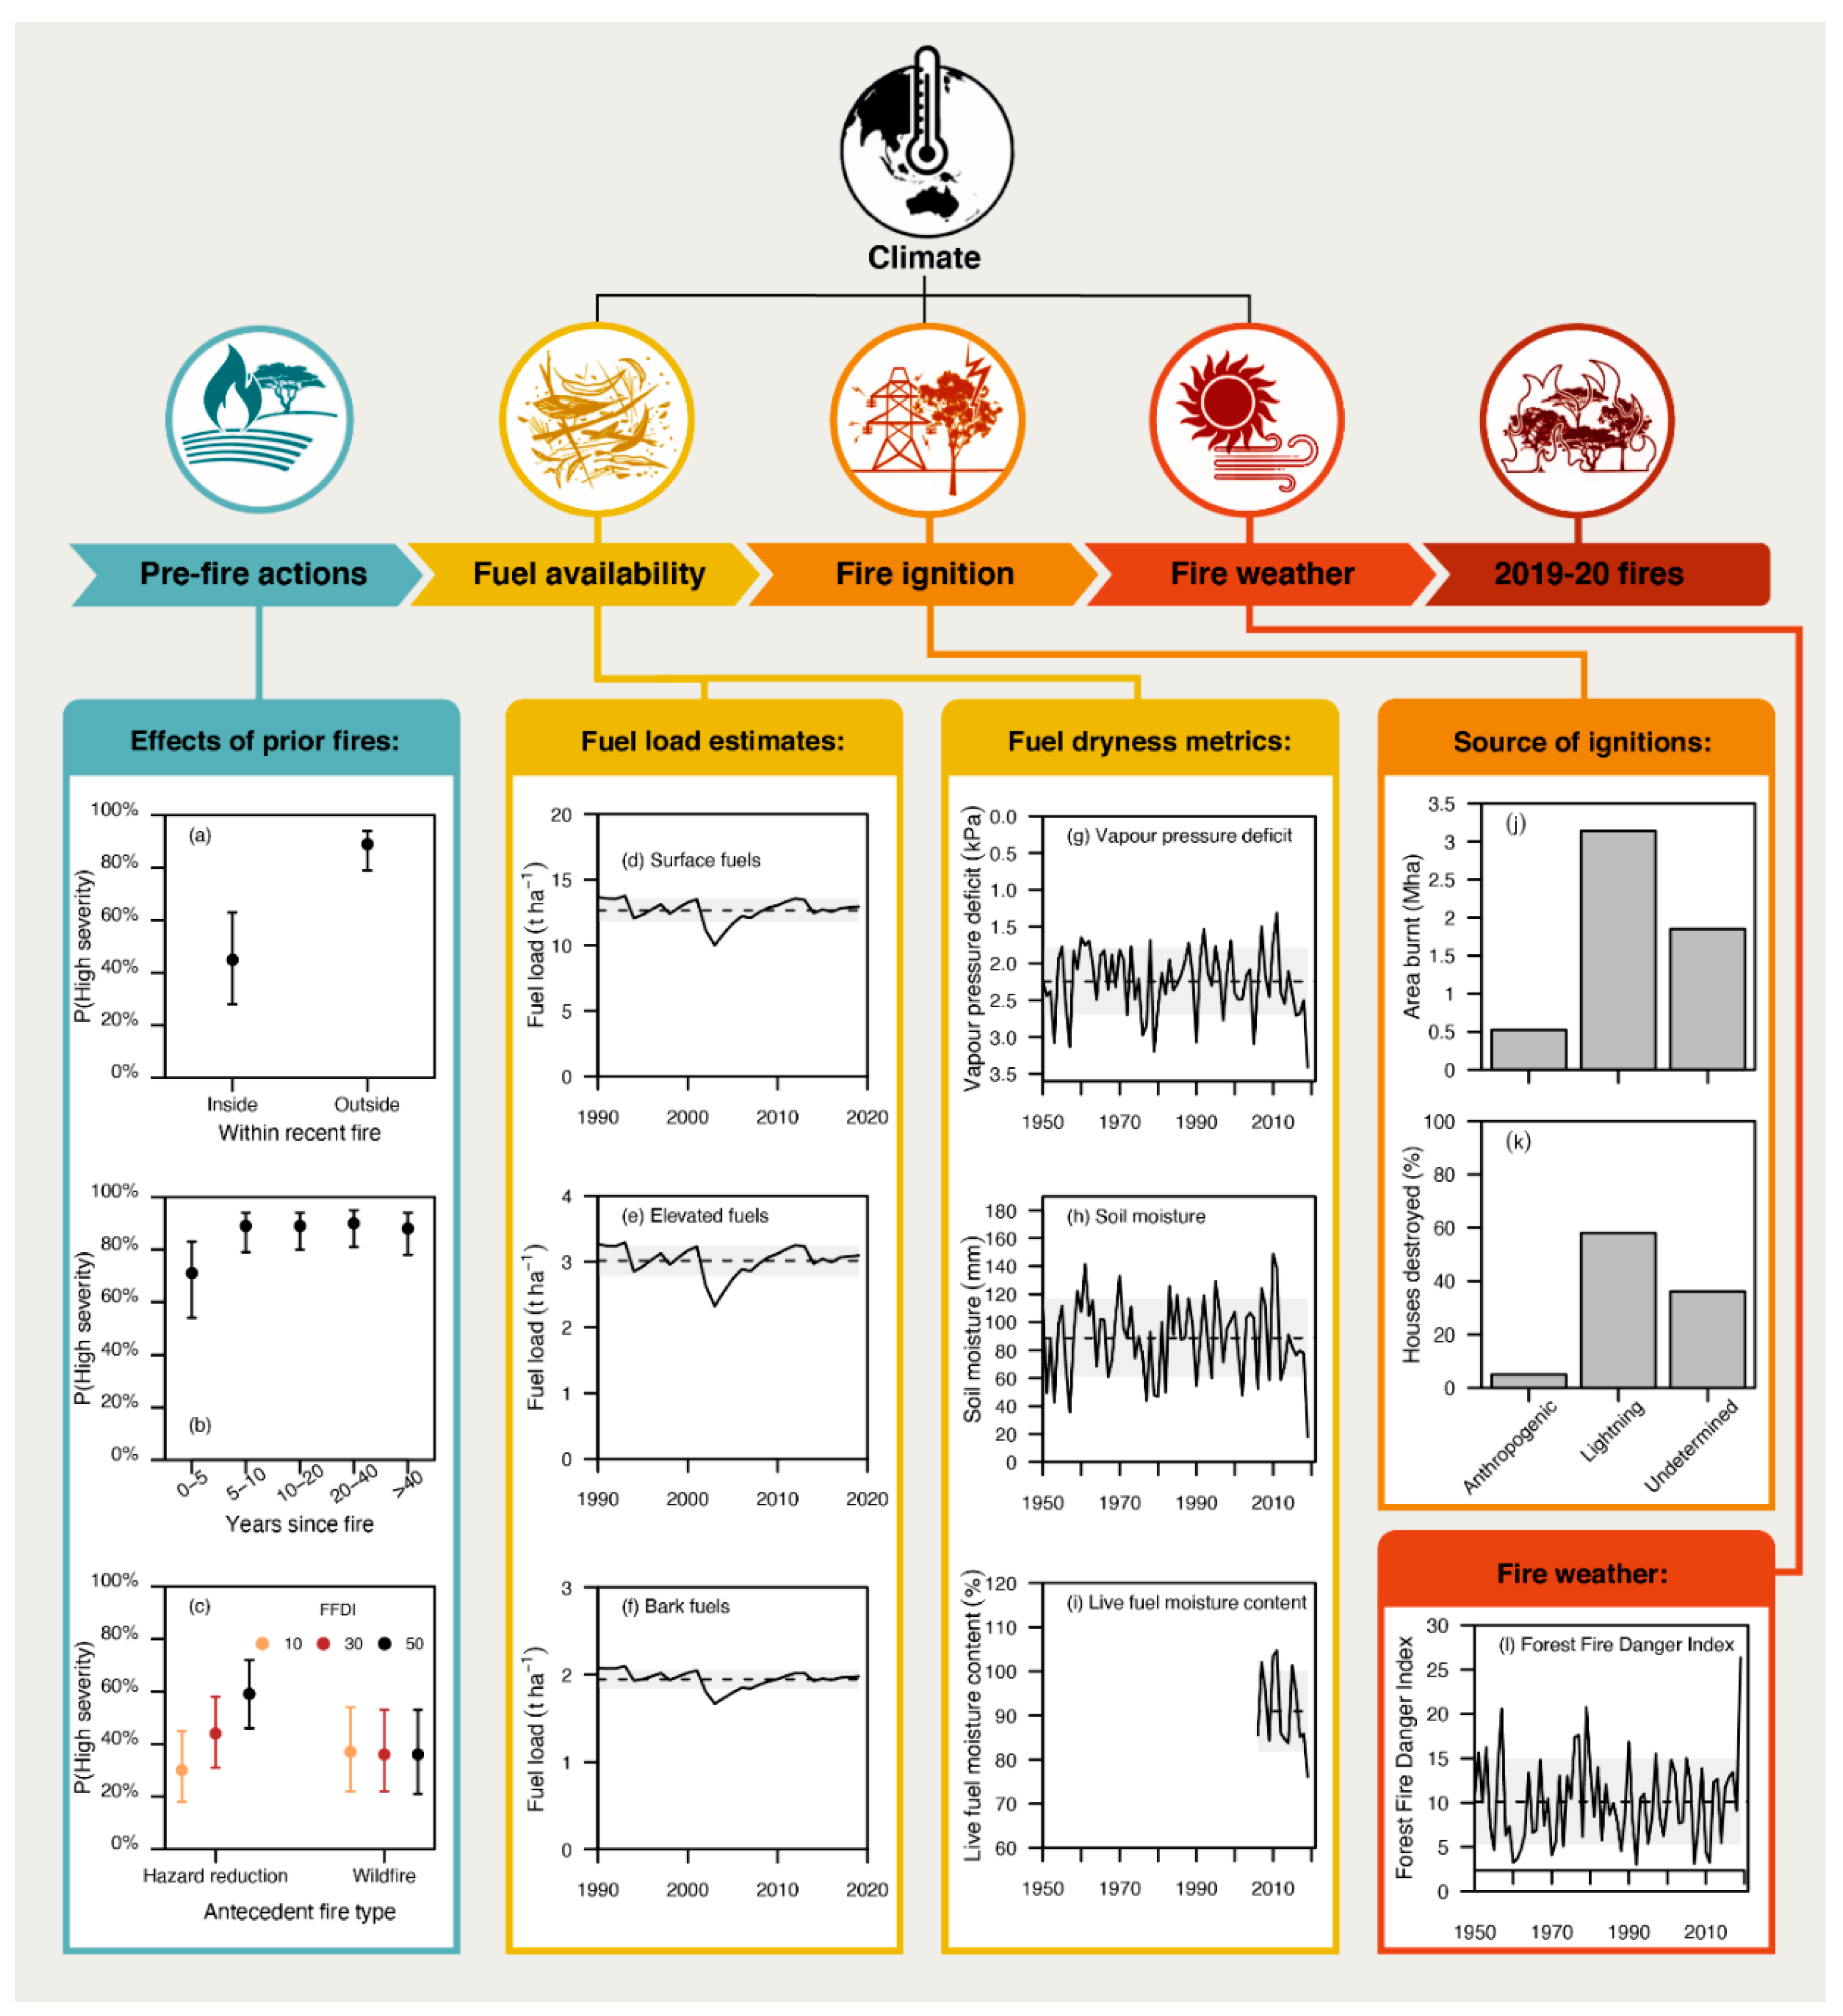
9.1. Sources of Fire Ignition for the NSW Fires

The ignition dataset was provided by the Fire Investigation Unit of the NSW Rural Fire Service (RFS; data acquired March 2020) and incorporated 958 fires, which burnt a combined area of 5.5 million ha. Ignition sources had been determined for 49 fires that burnt a combined area of 3.7 million ha (~67% of total area burnt). Building impact assessment (BIA) data was also provided by the NSW RFS and included data on 44,000 houses within fire-affected areas.

9.2. Historical Trends of Fuel Moisture, Fuel Loads and Fire Weather

We examined three different metrics related to fuel moisture: (i) soil moisture content, which influences the moisture content of both live and dead fuels [71,72]; (ii) vapour pressure deficit (D), which characterises atmospheric dryness and primarily influences dead fuel moisture content [73], but also affects live fuels [74]; and (iii) live fuel moisture content. Changes in soil moisture content and live fuel moisture can be slow, particularly during drought, i.e., at a time-scale of weeks to months, whereas D can change rapidly at a sub-daily time-step [75]. To assess soil moisture content we used the Australian Water Resources Assessment Landscape model (AWRA-L v6) [76], which is used operationally by the Australian Bureau of Meteorology. AWRA-L is a gridded (0.05° resolution) landscape water balance model which produces daily estimates of soil moisture. We used AWRA-L root zone soil moisture, which represents soil moisture from 0.1–1 m depth in mm. Maximum daily D was estimated from gridded (0.05° resolution) maximum daily air temperature and actual vapour pressure at 3 pm, following Monteith and Unsworth [77]. Input data was obtained from the Australian Water Availability Project (AWAP) hosted by the Australian Bureau of Meteorology [78]. Estimates of both soil moisture content and D were produced from 1950.
Live fuel moisture content was estimated from surface reflectance data from the MODIS Terra satellite. We used the 8 day composite dataset MOD09A1, which has a spatial resolution of 500 m. We applied an empirical model that estimates live fuel moisture content from the visible atmospherically resistant index, following [75]. This model cannot be applied to recently burnt vegetation, so we masked out areas burnt in the previous five years using the MODIS Burned Area Product, MCD64A1. Google Earth Engine was used for image acquisition and processing. Given the MODIS Burned Area Product is available from 2000, estimates of live fuel moisture content were generated from 2005 (i.e., to account for masking out recently burnt vegetation).
We generated estimates of fine fuel loads, which are those fuels which contribute most to a fire’s rate of spread and the difficulty of fire suppression [79]. Fine fuels are classified into dead fuels (dead biomass <6 mm diameter) and live fuels (live biomass <3 mm diameter) [80]. Fuels were delineated into three different strata: (i) surface fuels, which are typically comprised of dead leaves, twigs and bark; (ii) elevated fuels, which include tall shrubs and tree saplings and may contain both live and dead fuels; and (iii) bark fuels, which include the bark on tree trunks and branches [79,80]. Fuel loads were estimated by applying vegetation-specific fuel accumulation curves, which model fuel loads as a function of time since fire [81]. Time since fire was calculated on the first day of each fire season, i.e., 1 July. We selected the baseline study year as 1990, since fire history records are required for at least 25 years prior to the date fuel loads are estimated for [82] and fire history records are less reliable prior to this period. Fire history data was obtained from the NSW RFS. We applied fuel accumulation curves to the time-since-fire data to estimate fine fuel loads (in t ha1). There are 51 fuel accumulation curves for different forest and woodland fuel types within NSW, derived from a review of decomposition and litter fall studies [82]. Fuel types are based on vegetation classifications [83]. Fuel accumulation curves used were provided by the NSW RFS and are used operationally in fire management in NSW.
Fire weather conditions were represented by the McArthur Forest Fire Danger Index (FFDI) [84]. The FFDI links surface weather conditions to predicted fire behaviour and rate of spread and is widely used in Australia for fire weather warnings and to support operational decision making. FFDI is often reported as one of six named categories: Low /Moderate (0–11), High (12–24), Very High (25–49), Severe (50–74), Extreme (75–99) and Catastrophic (>=100). FFDI was calculated following Noble et al. (1980), as follows:
FFDI = 2 × exp(0.987 × ln(DF) − 0.0345 × H + 0.0338 × T + 0.0234 × V − 0.45)
where DF is the drought factor, T is temperature (°C), V is wind speed (km/h) and H is relative humidity (%). We used a national gridded FFDI dataset [85], consisting of daily values on a 0.05° grid over Australia from 1950 onwards. This dataset incorporates maximum daily temperature, relative humidity at 3:00 p.m. local time and a bias-corrected, reanalysis-derived wind speed at 0600 UTC (mid-afternoon over Australia’s longitudinal range). The drought factor is a measure of fuel dryness based on soil moisture deficit as represented by the Keetch–Byram Drought Index (KBDI) [86] and is calculated from daily accumulated rainfall at 9:00 a.m. local time.
We examined trends in annual fuel loads, mean monthly root-zone soil moisture, LFMC, D and FFDI. For soil moisture and LFMC, we examined trends in November values, which represent conditions immediately prior to the largest fires of the 2019–20 fire season; for D and FFDI, which are more temporally dynamic, we examined trends in December values, which represent conditions at the height of the largest fire runs of the 2019–20 fire season. For each metric, we examined average trends across four bioregional areas (Figure S1).

9.3. Analyses of the Effects of Prior Burns on Fire Severity

Statistical modelling was performed to examine the impact of antecedent fires on fire severity, taking into account fire type, fire severity, time since fire, vegetation type and fire weather. Three of the major fire grounds of the 2019–20 fire season were selected for analysis; the Bees Nest fire in the north of the state, the Gospers Mountain fire west of Sydney and the South Coast complex south of Sydney (see Figure 1). Analyses were limited to wet and dry sclerophyll vegetation formations.
Past fire boundaries for NSW, including both prescribed and unplanned fires, were obtained from the NSW RFS. Vegetation formation mapping was derived from the NSW State Vegetation Type Map, supplied by the NSW Department of Planning, Industry and Environment [87]. Fire severity mapping (FESM) based on Sentinel-2 imagery was carried out over all 2019–20 fires using a Random Forest classification method [88] and for past fires that occurred within the 2019–20 fire footprint from the year 2017 onwards, which is the year Sentinel-2 imagery became available. Fire severity categories were simplified to binary categories, with the low severity category retained as low severity, the two highest-severity categories (high and extreme) combined into a single category and the moderate category excluded due to the potential for class confusion, current to January 2019. Fire progression polygons for the 2019–20 fire season were obtained from the RFS, and each isochron interval was assigned distance-weighted mean FFDI values derived from Bureau of Meteorology weather stations within 100 km.
Recent past fire boundaries within these 2019–20 fire grounds, back to the year 2017, were buffered by 2 km and sample points were randomly generated inside the fire polygon and inside the external buffers, with interior sample points regarded as recently burnt prior to the 2019–20 season and external sample points regarded as not recently burnt. Sample points were placed with the constraint of an average density of two points per hectare, a density selected to best control for spatial autocorrelation through inspection of the semivariogram of 2019–20 season fire severity across the sample points. Each point was attributed with the 2019–20 fire severity (FESM), the severity of the past recent fire where available, the past fire type (prescribed or unplanned), the major vegetation formation [87], the dead fuel moisture content [89] and the topographic position, roughness, slope and northerly aspect index calculated from the NASA SRTM 30 m digital elevation model [90].
We used generalised linear mixed-effect binomial models (GLMMs) to address four hypotheses:
  • Probability of high fire severity was lower inside past fire boundaries than outside (73,914 sample points)
  • Probability of high fire severity was lower where past fire was more severe (1833 sample points)
  • Probability of high fire severity was lower where past fire was more recent, with a reduced effect of past fire under elevated fire weather conditions (73,764 sample points)
  • Probability of high fire severity was lower where the past fire was an unplanned wildfire, compared to a prescribed fire, with prescribed fire having a reduced effect under elevated fire weather conditions (1833 sample points)
Past fire ID was included as a hierarchical random effect within the 2019–20 fire ground random effect, and FFDI, vegetation type, dead fuel moisture content and topographic variables were included as covariates (Table 1). AIC-based model selection was used to identify the best variable suite for each hypothesis and all statistical modelling was carried out using R version 4.0.2 [91] using the lme4 version 1.1–25 [92] package.

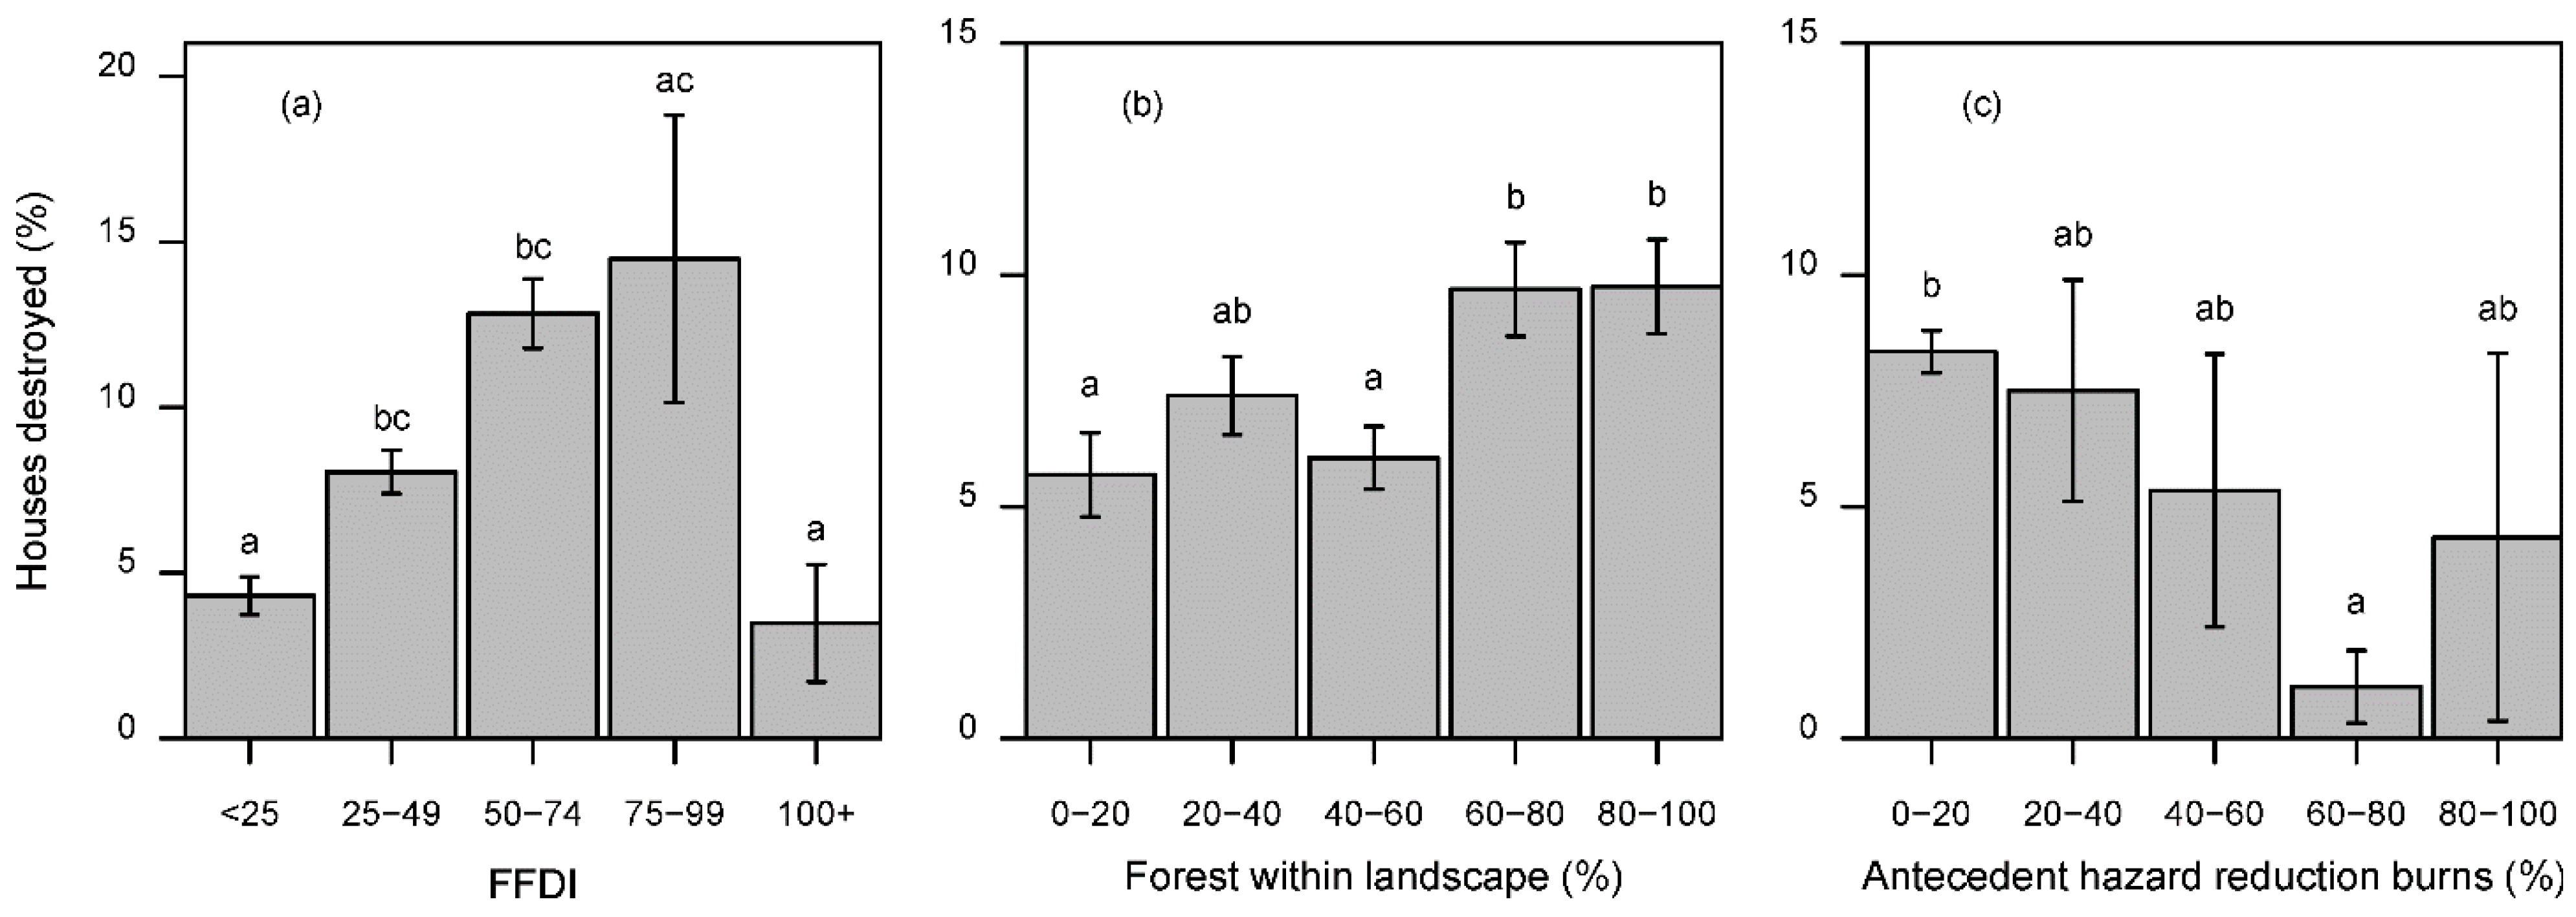
9.4. Analyses on Determinants of House Loss

House impact was analysed in arbitrarily defined 1 km2 hexagons in NSW. Specifically, we examined the 1186 hexagons that contained more than five houses and were more than half burnt. The dependent variable was the proportion of houses within each hexagon that were destroyed, with the damage information provided by the NSW RFS Bushfire Impact Assessment (BIA), which surveyed 18,000 houses. The number of houses in each hexagon was also supplied by the RFS from source data provided by Geoscience Australia. House damage was modelled against the following potential predictors: (a) the weather at the time the hexagon burnt; (b) the proportion of forest within 5 km; and (c) the proportion of antecedent hazard reduction burns (within the previous five years) within the hexagon.
Fire history mapping was supplied by the NSW RFS. Forests were defined by the NSW Vegetation map at class scale [93] supplied by the NSW Department of Planning, Industry and Environment (DPIE) [87]. Weather at the time of the burn was estimated by the authors by combining progression mapping with hourly weather observations from the Bureau of Meteorology network (which included 17 portable monitors located near the fires). Progression data supplied by the RFS was checked and edited by cross-checking with aerial line scan images captured during the fire and in some cases with hotspot data downloaded from the archives of the MODIS, VIIRS and Himawari satellites. This produced progression polygons with known start and end times with a median interval of 17 hours. The weather data was then used to calculate a distance-weighted value of the maximum Forest Fire Danger Index (FFDI) during the period.
We examined the proportion of houses destroyed within categories of (a) FFDI, (b) forest within 5 km and (c) antecedent hazard reduction burns. There was unequal variance among categories for all three predictors of house loss, so we conducted a Welch’s ANOVA with a Games–Howell post-hoc test to detect significant differences in house loss among categories. These analyses were undertaken in R [91].

9.5. Assessing Demographic Characteristics of Populations Affected by the 2019–20 Fire Season

Publicly available data from the 2016 Australian Census of Population and Housing were used to describe the socio-economic characteristics of areas affected by the fires. The Statistical Area Level 1 (SA1) geography was used for the analysis. An SA1 is the smallest unit possible for the presentation of Australian census data, with an average population size of approximately 400 people [49]. A total of 377 SA1s in NSW were directly affected by the 2019–20 fires, meaning that a bushfire burnt within its boundary. Data were sourced on the demographic variable of Indigeneity, as well as the Australian Bureau of Statistics’ Socio-Economic Indexes for Areas (SEIFA). These variables and indices were selected to provide a basic overview of the social and demographic characteristics of populations affected by the fires. Number and percentage of Indigenous people was included because a recent report identified that Indigenous people were disproportionately affected by the 2019–20 fires [39].
It is important to acknowledge the limitations of using census data to characterise populations affected by the 2019–20 fires. These data were used in the absence of other accessible forms of social data to provide a basic overview of the social and demographic characteristics of affected populations. To varying degrees, all areas affected by the 2019–20 fires will have undergone demographic change since the 2016 Census. Nevertheless, many key characteristics—such as concentrations of social disadvantage, access to economic resources and other key demographic variables such as aged populations—are unlikely to have changed markedly.

9.6. Assessing Vegetation Fire Interval Status Prior to and Following the 2019–20 Fire Season

Fire-tolerant vegetation communities in New South Wales have established ecological thresholds for the optimal return-time of fire, comprising a minimum and maximum number of years between fires in order to maintain the ecological state of the community. We used these fire intervals, or thresholds, to classify vegetation into four states representing its status relative to fire occurrence. Long Unburnt vegetation has not been burnt in a long time, past the recommended maximum burn interval and may have elevated fuel loads or be transitioning to a fire-intolerant vegetation type. Too Frequently Burnt vegetation may be transitioning to a new vegetation community due to an excess of frequent fire. Vulnerable vegetation has been frequently burnt and is in danger of transitioning to a Too Frequently Burnt state if burnt again soon, while Within Threshold vegetation has not been burnt too frequently, its fire interval is currently between the recommended minimum and maximum time since fire and an additional fire will not leave it too frequently burnt. Across the areas of the state impacted by the 2019–20 fire season, we used fire history data to classify fire interval status prior to and following the fires.

Supplementary Materials

The following are available online at https://www.mdpi.com/article/10.3390/fire4040097/s1.

Author Contributions

Conceptualization, R.H.N., D.M.J.S.B., H.C., K.H., M.K.J.O., O.F.P., G.J.W., M.B., V.I.C., D.A.K. and R.A.B.; methodology and formal analysis, R.H.N., H.C., K.H., M.K.J.O., O.F.P., G.J.W., J.W., M.M.B., L.C., R.K.G., A.G., A.P.M., T.D.P., S.A.S. and M.G.T.; writing—original draft preparation, R.H.N., H.C., K.H., M.K.J.O., O.F.P., G.J.W., V.I.C. and R.A.B.; writing—review and editing, all authors. All authors have read and agreed to the published version of the manuscript.

Funding

This research was supported by funding from the New South Wales Department of Planning, Industry and Environment via the NSW Bushfire Risk Management Research Hub.

Institutional Review Board Statement

Not applicable.

Informed Consent Statement

Not applicable.

Data Availability Statement

Fire extent and severity data is available from the State Government of NSW: https://www.seed.nsw.gov.au/ (accessed on 01 April 2021). Previous fire history data and house loss data was obtained under licence from the NSW Rural Fire Service and is not publicly available. Fire ignition data is provided in Table S1. Meteorological and soil moisture data were obtained from the Australian Water Availability Project (AWAP) hosted by the Australian Bureau of Meteorology: http://www.bom.gov.au/jsp/awap/ (accessed on 01 April 2021). Remotely sensed surface reflectance data is available from NASA: https://earthdata.nasa.gov/ (accessed on 01 April 2021). Demographic data is publicly available from the Australian Bureau of Statistics: https://www.abs.gov.au/ (accessed on 01 April 2021).

Acknowledgments

We acknowledge the traditional custodians and knowledge holders of the Country on which we conduct our research, walk and live. Figure 2 and Figure 4 were created by Jen Middleton and Peta Roebuck at Ooid Scientific.

Conflicts of Interest

The authors declare no conflict of interest.

References

  1. Duane, A.; Castellnou, M.; Brotons, L. Towards a comprehensive look at global drivers of novel extreme wildfire events. Clim. Chang. 2021, 165, 43. [Google Scholar] [CrossRef]
  2. Boer, M.M.; Resco de Dios, V.; Bradstock, R. Unprecedented burn area of Australian mega forest fires. Nat. Clim. Chang. 2020, 10, 171–172. [Google Scholar] [CrossRef]
  3. Bowman, D.; Williamson, G.; Yebra, M.; Lizundia-Loiola, J.; Pettinari, M.L.; Shah, S.; Bradstock, R.; Chuvieco, E. Wildfires: Australia needs national monitoring agency. Nature 2020, 584, 188–191. [Google Scholar] [CrossRef]
  4. Nolan, R.H.; Boer, M.M.; Collins, L.; Resco de Dios, V.; Clarke, H.; Jenkins, M.; Kenny, B.; Bradstock, R.A. Causes and consequences of eastern Australia’s 2019–20 season of mega-fires. Glob. Change Biol. 2020, 26, 1039–1041. [Google Scholar] [CrossRef] [PubMed] [Green Version]
  5. Collins, L.; Bradstock, R.A.; Clarke, H.; Clarke, M.F.; Nolan, R.H.; Penman, T.D. The 2019/2020 mega-fires exposed Australian ecosystems to an unprecedented extent of high-severity fire. Environ. Res. Lett. 2021, 16, 044029. [Google Scholar] [CrossRef]
  6. Johnston, F.H.; Borchers-Arriagada, N.; Morgan, G.G.; Jalaludin, B.; Palmer, A.J.; Williamson, G.J.; Bowman, D.M.J.S. Unprecedented health costs of smoke-related PM2.5 from the 2019–20 Australian megafires. Nat. Sustain. 2021, 4, 42–47. [Google Scholar] [CrossRef]
  7. Howard, Z.; Carlson, S.; Baldwin, Z.; Johnston, F.; Durrheim, D.; Dalton, C. High community burden of smoke-related symptoms in the Hunter and New England regions during the 2019–2020 Australian bushfires. Public Health Res. Pract. 2020, 30, e30122007. [Google Scholar] [CrossRef]
  8. Christian, K.; Yorks, J.; Das, S. Differences in the evolution of pyrocumulonimbus and volcanic stratospheric plumes as observed by CATS and CALIOP space-based lidars. Atmosphere 2020, 11, 1035. [Google Scholar] [CrossRef]
  9. Kablick, G.P., III; Allen, D.R.; Fromm, M.D.; Nedoluha, G.E. Australian pyroCb smoke generates synoptic-scale stratospheric anticyclones. Geophys. Res. Lett. 2020, 47, e2020GL088101. [Google Scholar] [CrossRef]
  10. Lundberg, K. Moved by fire: Green criminology in flux. Crime Media Culture 2020, 1–18. [Google Scholar] [CrossRef]
  11. Chester, L. The 2019–2020 Australian bushfires: A potent mix of climate change, problematisation, Indigenous disregard, a fractured federation, volunteerism, social media, and more. Rev. Evol. Political Econ. 2020, 1, 245–264. [Google Scholar] [CrossRef]
  12. Lindenmayer, D.B.; Taylor, C. New spatial analyses of Australian wildfires highlight the need for new fire, resource, and conservation policies. Proc. Natl. Acad. Sci. USA 2020, 117, 12481–12485. [Google Scholar] [CrossRef] [PubMed]
  13. Kanowski, P.J.; Whelan, R.J.; Ellis, S. Inquiries following the 2002–2003 Australian bushfires: Common themes and future directions for Australian bushfire mitigation and management. Aust. For. 2005, 68, 76–86. [Google Scholar] [CrossRef]
  14. Bowman, D.M.J.S.; O’Brien, J.A.; Goldammer, J.G. Pyrogeography and the global quest for sustainable fire management. Annu. Rev. Environ. Resour. 2013, 38, 57–80. [Google Scholar] [CrossRef]
  15. Commonwealth of Australia. Royal Commission into National Natural Disaster Arrangements—Report; Commonwealth of Australia: Canberra, Australia, 2020. [Google Scholar]
  16. Bowman, D.; Williamson, G.J.; Price, O.F.; Ndalila, M.N.; Bradstock, R.A. Australian forests, megafires and the risk of dwindling carbon stocks. Plant Cell Environ. 2021, 44, 347–355. [Google Scholar] [CrossRef] [PubMed]
  17. Abram, N.J.; Henley, B.J.; Sen Gupta, A.; Lippmann, T.J.R.; Clarke, H.; Dowdy, A.J.; Sharples, J.J.; Nolan, R.H.; Zhang, T.; Wooster, M.J.; et al. Connections of climate change and variability to large and extreme forest fires in southeast Australia. Commun. Earth Environ. 2021, 2, 8. [Google Scholar] [CrossRef]
  18. Gallagher, R.V.; Allen, S.; Mackenzie, B.D.E.; Yates, C.J.; Gosper, C.R.; Keith, D.A.; Merow, C.; White, M.D.; Wenk, E.; Maitner, B.S.; et al. High fire frequency and the impact of the 2019–2020 megafires on Australian plant diversity. Divers. Distrib. 2021, 27, 1166–1179. [Google Scholar] [CrossRef]
  19. Collins, L. Eucalypt forests dominated by epicormic resprouters are resilient to repeated canopy fires. J. Ecol. 2020, 108, 310–324. [Google Scholar] [CrossRef]
  20. State Government of NSW and Department of Planning Industry and Environment. Fire Extent and Severity Mapping (FESM). Available online: https://datasets.seed.nsw.gov.au/dataset/fire-extent-and-severity-mapping-fesm (accessed on 28 June 2021).
  21. Reddy, P.J.; Sharples, J.J.; Lewis, S.C.; Perkins-Kirkpatrick, S.E. Modulating influence of drought on the synergy between heatwaves and dead fine fuel moisture content of bushfire fuels in the Southeast Australian region. Weather Clim. Extrem. 2021, 31, 11. [Google Scholar] [CrossRef]
  22. Deb, P.; Moradkhani, H.; Abbaszadeh, P.; Kiem, A.S.; Engström, J.; Keellings, D.; Sharma, A. Causes of the Widespread 2019–2020 Australian Bushfire Season. Earth’s Future 2020, 8, e2020EF001671. [Google Scholar] [CrossRef]
  23. Ehsani, M.R.; Arevalo, J.; Risanto, C.B.; Javadian, M.; Devine, C.J.; Arabzadeh, A.; Venegas-Quinones, H.L.; Dell’Oro, A.P.; Behrangi, A. 2019–2020 Australia fire and its relationship to hydroclimatological and vegetation variabilities. Water 2020, 12, 3067. [Google Scholar] [CrossRef]
  24. Dowdy, A.J. Seamless climate change projections and seasonal predictions for bushfires in Australia. J. South Hemisph. Earth Syst. Sci. 2020, 70, 120–138. [Google Scholar] [CrossRef]
  25. Bureau of Meteorology. Special Climate Statement 73—Extreme heat and fire weather in December 2019 and January 2020; Bureau of Meteorology: Melbourne, Australia, 2020.
  26. van Oldenborgh, G.J.; Krikken, F.; Lewis, S.; Leach, N.J.; Lehner, F.; Saunders, K.R.; van Weele, M.; Haustein, K.; Li, S.; Wallom, D.; et al. Attribution of the Australian bushfire risk to anthropogenic climate change. Nat. Hazards Earth Syst. Sci. Discuss. 2021, 2020, 1–46. [Google Scholar] [CrossRef]
  27. Canadell, J.G.; Meyer, C.P.; Cook, G.D.; Dowdy, A.; Briggs, P.R.; Knauer, J.; Pepler, A.; Haverd, V. Multi-decadal increase of forest burned area in Australia is linked to climate change. Nat. Commun. 2021, 12, 6921. [Google Scholar] [CrossRef] [PubMed]
  28. Bradstock, R.A.; Nolan, R.H.; Collins, L.; Resco de Dios, V.; Clarke, H.; Jenkins, M.; Kenny, B.; Boer, M.M. A broader perspective on the causes and consequences of eastern Australia’s 2019–2020 season of mega-fires: A response to Adams et al. Glob. Chang. Biol. 2020, 26, e8–e9. [Google Scholar] [CrossRef] [PubMed]
  29. Bowman, D.M.J.S.; Williamson, G.J.; Gibson, R.K.; Bradstock, R.A.; Keenan, R.J. The severity and extent of the Australia 2019–20 Eucalyptus forest fires are not the legacy of forest management. Nat. Ecol. Evol. 2021, 5, 1003–1010. [Google Scholar] [CrossRef]
  30. NSW Government. Final Report of the NSW Bushfire Inquiry; NSW Government: Sydney, Australia, 2020.
  31. Grant, M.A.; Duff, T.J.; Penman, T.D.; Pickering, B.J.; Cawson, J.G. Mechanical mastication reduces fuel structure and modelled fire behaviour in Australian shrub encroached ecosystems. Forests 2021, 12, 812. [Google Scholar] [CrossRef]
  32. Cirulis, B.; Clarke, H.; Boer, M.; Penman, T.; Price, O.; Bradstock, R. Quantification of inter-regional differences in risk mitigation from prescribed burning across multiple management values. Int. J. Wildland Fire 2020, 29, 414–426. [Google Scholar] [CrossRef] [Green Version]
  33. Duff, T.J.; Cawson, J.G.; Penman, T.D. Determining burnability: Predicting completion rates and coverage of prescribed burns for fuel management. For. Ecol. Manag. 2019, 433, 431–440. [Google Scholar] [CrossRef]
  34. Price, O.H.; Nolan, R.H.; Samson, S.A. Fuel consumption rates in resprouting eucalypt forest during hazard reduction burns, cultural burns and wildfires. For. Ecol. Manag. 2022, 505, 119894. [Google Scholar] [CrossRef]
  35. Hislop, S.; Stone, C.; Haywood, A.; Skidmore, A. The effectiveness of fuel reduction burning for wildfire mitigation in sclerophyll forests. Aust. For. 2020, 83, 255–264. [Google Scholar] [CrossRef]
  36. Zhang, Y.; Beggs, P.J.; McGushin, A.; Bambrick, H.; Trueck, S.; Hanigan, I.C.; Morgan, G.G.; Berry, H.L.; Linnenluecke, M.K.; Johnston, F.H.; et al. The 2020 special report of the MJA-Lancet Countdown on health and climate change: Lessons learnt from Australia’s “Black Summer”. Med. J. Aust. 2020, 213, 490–492.e410. [Google Scholar] [CrossRef]
  37. Filkov, A.I.; Ngo, T.; Matthews, S.; Telfer, S.; Penman, T.D. Impact of Australia’s catastrophic 2019/20 bushfire season on communities and environment. Retrospective analysis and current trends. J. Saf. Sci. Resil. 2020, 1, 44–56. [Google Scholar] [CrossRef]
  38. Akter, S.; Grafton, R.Q. Do fires discriminate? Socio-economic disadvantage, wildfire hazard exposure and the Australian 2019–20 ‘Black Summer’ fires. Clim. Chang. 2021, 165, 53. [Google Scholar] [CrossRef]
  39. Williamson, B.; Markham, F.; Weir, J.K. Aboriginal Peoples and the Response to the 2019–2020 Bushfires; Working Paper No. 134/2020; Centre for Aboriginal Economic Policy Research, Australian National University: Canberra, Australia, 2020.
  40. Williamson, B.; Weir, J.; Cavanagh, V. Strength from Perpetual grief: How Aboriginal People Experience the Bushfire Crisis. The Conversation, 2020. Available online: https://theconversation.com/strength-from-perpetual-grief-how-aboriginal-people-experience-the-bushfire-crisis-129448 (accessed on 1 December 2021).
  41. Australian Institute of Aboriginal and Torres Strait Islander Studies. Available online: https://aiatsis.gov.au/explore/welcome-country#toc-what-is-country- (accessed on 1 December 2021).
  42. van Eeden, L.; Nimmo, D.; Mahony, M.; Herman, K.; Ehmke, G.; Driessen, J.; O’Connor, J.; Bino, G.; Taylor, M.; Dickman, C. Australia’s 2019–2020 Bushfires: The Wildlife Toll Interim Report.; WWF-Australia: Ultimo, Australia, 2020. [Google Scholar]
  43. NSW Government. Fish Kills in NSW 2019–2020. Available online: https://www.dpi.nsw.gov.au/fishing/habitat/threats/fish-kills-2019-2020 (accessed on 10 May 2021).
  44. Kirchhoff, C.; Callaghan, C.T.; Keith, D.A.; Indiarto, D.; Taseski, G.; Ooi, M.K.J.; Le Breton, T.D.; Mesaglio, T.; Kingsford, R.T.; Cornwell, W.K. Rapidly mapping fire effects on biodiversity at a large-scale using citizen science. Sci. Total Environ. 2021, 755, 142348. [Google Scholar] [CrossRef] [PubMed]
  45. Phillips, S.; Wallis, K.; Lane, A. Quantifying the impacts of bushfire on populations of wild koalas (Phascolarctos cinereus): Insights from the 2019/20 fire season. Ecol. Manag. Restor. 2021, 22, 80–88. [Google Scholar] [CrossRef]
  46. Le Breton, T.D.; Lyons, M.B.; Nolan, R.H.; Penman, T.; Williamson, G.; Ooi, M.K.J. Megafire-induced interval squeeze threatens vegetation at landscape scales. Front. Ecol. Environ. in press.
  47. Nolan, R.H.; Gauthey, A.; Losso, A.; Medlyn, B.E.; Smith, R.; Chhajed, S.S.; Fuller, K.; Song, M.; Li, X.; Beaumont, L.J.; et al. Hydraulic failure and tree size linked with canopy die-back in eucalypt forest during extreme drought. New Phytol. 2021, 230, 1354–1365. [Google Scholar] [CrossRef]
  48. Nolan, R.H.; Collins, L.; Leigh, A.; Ooi, M.K.J.; Curran, T.J.; Fairman, T.A.; Resco de Dios, V.; Bradstock, R. Limits to post-fire vegetation recovery under climate change. Plant Cell Environ. 44, 3471–3489. [CrossRef]
  49. Australian Bureau of Statistics. Australian Statistical Geography Standard (ASGS): Volume 1—Main Structure and Greater Capital City Statistical Areas. July 2016. Available online: www.abs.gov.au (accessed on 5 June 2021).
  50. Australian Bureau of Statistics. Estimates of Aboriginal and Torres Strait Islander Australians. June 2016. Available online: https://www.abs.gov.au/statistics/people/aboriginal-and-torres-strait-islander-peoples/estimates-aboriginal-and-torres-strait-islander-australians/latest-release (accessed on 5 June 2021).
  51. Gibbons, P.; van Bommel, L.; Gill, A.M.; Cary, G.J.; Driscoll, D.A.; Bradstock, R.A.; Knight, E.; Moritz, M.A.; Stephens, S.L.; Lindenmayer, D.B. Land management practices associated with house loss in wildfires. PLoS ONE 2012, 7, e29212. [Google Scholar] [CrossRef]
  52. Price, O.; Bradstock, R. Landscape scale influences of forest area and housing density on house loss in the 2009 Victorian bushfires. PLoS ONE 2013, 8, e73421. [Google Scholar] [CrossRef] [Green Version]
  53. Di Virgilio, G.; Evans, J.P.; Blake, S.A.P.; Armstrong, M.; Dowdy, A.J.; Sharples, J.; McRae, R. Climate change increases the potential for extreme wildfires. Geophys. Res. Lett. 2019, 46, 8517–8526. [Google Scholar] [CrossRef]
  54. Haynes, K. Theme 3a—People and Property Impacts: The Social Benefits of Cultural Burning; NSW Bushfire Risk Management Research Hub: Sydney, Australia, 2020. [Google Scholar]
  55. NSW Department of Planning Industry and Environment. Our Place on Country: Aboriginal Outcomes Strategy 2020–2023; NSW Department of Planning Industry and Environment: Sydney, Australia, 2020.
  56. Whittaker, J.; Haynes, K.; Wilkinson, C.; Tofa, M.; Dilworth, T.; Collins, J.; Tait, L. Black Summer—How the NSW Community Responded to the 2019–2020 Bushfire Season; Bushfire and Natural Hazards CRC: Melbourne, Austrilia, 2021. [Google Scholar]
  57. Schoennagel, T.; Balch, J.K.; Brenkert-Smith, H.; Dennison, P.E.; Harvey, B.J.; Krawchuk, M.A.; Mietkiewicz, N.; Morgan, P.; Moritz, M.A.; Rasker, R.; et al. Adapt to more wildfire in western North American forests as climate changes. Proc. Natl. Acad. Sci. USA 2017, 114, 4582–4590. [Google Scholar] [CrossRef] [Green Version]
  58. Kelly, L.T.; Giljohann, K.M.; Duane, A.; Aquilué, N.; Archibald, S.; Batllori, E.; Bennett, A.F.; Buckland, S.T.; Canelles, Q.; Clarke, M.F.; et al. Fire and biodiversity in the Anthropocene. Science 2020, 370, eabb0355. [Google Scholar] [CrossRef] [PubMed]
  59. Burke, M.; Emerick, K. Adaptation to Climate Change: Evidence from US Agriculture. Am. Econ. J.-Econ. Policy 2016, 8, 106–140. [Google Scholar] [CrossRef] [Green Version]
  60. Gawith, D.; Hodge, I.; Morgan, F.; Daigneault, A. Climate change costs more than we think because people adapt less than we assume. Ecol. Econ. 2020, 173, 106636. [Google Scholar] [CrossRef]
  61. Reid, K.; Beilin, R.; McLennan, J. Communities and responsibility: Narratives of place-identity in Australian bushfire landscapes. Geoforum 2020, 109, 35–43. [Google Scholar] [CrossRef]
  62. Fischer, A.P.; Spies, T.A.; Steelman, T.A.; Moseley, C.; Johnson, B.R.; Bailey, J.D.; Ager, A.A.; Bourgeron, P.; Charnley, S.; Collins, B.M.; et al. Wildfire risk as a socioecological pathology. Front. Ecol. Environ. 2016, 14, 276–284. [Google Scholar] [CrossRef] [Green Version]
  63. Indian, J. The concept of local knowledge in rural Australian fire management. In Community Bushfire Safety; Handmer, J., Haynes, K., Eds.; CSIRO Publishing: Clayton, Australia, 2008. [Google Scholar]
  64. McWethy, D.B.; Schoennagel, T.; Higuera, P.E.; Krawchuk, M.; Harvey, B.J.; Metcalf, E.C.; Schultz, C.; Miller, C.; Metcalf, A.L.; Buma, B.; et al. Rethinking resilience to wildfire. Nat. Sustain. 2019, 2, 797–804. [Google Scholar] [CrossRef]
  65. Norman, B.; Newman, P.; Steffen, W. Apocalypse now: Australian bushfires and the future of urban settlements. Npj Urban Sustain. 2021, 1, 2. [Google Scholar] [CrossRef]
  66. King, D.; Bird, D.; Haynes, K.; Boon, H.; Cottrell, A.; Millar, J.; Okada, T.; Box, P.; Keogh, D.; Thomas, M. Voluntary relocation as an adaptation strategy to extreme weather events. Int. J. Disaster Risk Reduct. 2014, 8, 83–90. [Google Scholar] [CrossRef]
  67. O’Halloran, M.; Davies, A. A shared risk: Volunteer shortages in Australia’s rural bushfire brigades. Aust. Geogr. 2020, 51, 421–435. [Google Scholar] [CrossRef]
  68. McConnell, K. COVID-19—Population impacts on rural and regional Australia. Interaction 2021, 49, 13–15. [Google Scholar]
  69. Keith, D.A.; Martin, T.G.; McDonald-Madden, E.; Walters, C. Uncertainty and adaptive management for biodiversity conservation. Biol. Conserv. 2011, 144, 1175–1178. [Google Scholar] [CrossRef]
  70. Prichard, S.J.; Hessburg, P.F.; Hagmann, R.K.; Povak, N.A.; Dobrowski, S.Z.; Hurteau, M.D.; Kane, V.R.; Keane, R.E.; Kobziar, L.N.; Kolden, C.A.; et al. Adapting western North American forests to climate change and wildfires: 10 common questions. Ecol. Appl. 2021, e02433. [Google Scholar] [CrossRef]
  71. Matthews, S. A process-based model of fine fuel moisture. Int. J. Wildland Fire 2006, 15, 155–168. [Google Scholar] [CrossRef]
  72. Nolan, R.H.; Hedo, J.; Arteaga, C.; Sugai, T.; Resco de Dios, V. Physiological drought responses improve predictions of live fuel moisture dynamics in a Mediterranean forest. Agric. For. Meteorol. 2018, 263, 417–427. [Google Scholar] [CrossRef] [Green Version]
  73. Resco de Dios, V.; Fellows, A.W.; Nolan, R.H.; Boer, M.M.; Bradstock, R.A.; Domingo, F.; Goulden, M.L. A semi-mechanistic model for predicting the moisture content of fine litter. Agric. For. Meteorol. 2015, 203, 64–73. [Google Scholar] [CrossRef] [Green Version]
  74. Eamus, D.; Boulain, N.; Cleverly, J.; Breshears, D.D. Global change-type drought-induced tree mortality: Vapor pressure deficit is more important than temperature per se in causing decline in tree health. Ecol. Evol. 2013, 3, 2711–2729. [Google Scholar] [CrossRef]
  75. Nolan, R.H.; Boer, M.M.; Resco de Dios, V.; Caccamo, G.; Bradstock, R.A. Large-scale, dynamic transformations in fuel moisture drive wildfire activity across southeastern Australia. Geophys. Res. Lett. 2016, 43, 4229–4238. [Google Scholar] [CrossRef] [Green Version]
  76. Frost, A.J.; Ramchurn, A.; Smith, A. The Australian Landscape Water Balance Model (AWRA-L v6); Technical Description of the Australian Water Resources Assessment Landscape Model Version 6, Bureau of Meteorology Technical Report; Bureau of Meteorology: Melbourne, Australia, 2018.
  77. Monteith, J.L.; Unsworth, M.H. Principles of Environmental Physics; Edward Arnold: London, UK, 1990. [Google Scholar]
  78. Jones, D.; Wang, Q.W.; Fawcett, R. High-quality spatial climate data-sets for Australia. Aust. Meteorol. Mag. 2009, 58, 233–248. [Google Scholar] [CrossRef]
  79. Gould, J.S.; McCaw, W.L.; Cheney, N.P. Quantifying fine fuel dynamics and structure in dry eucalypt forest (Eucalyptus marginata) in Western Australia for fire management. For. Ecol. Manag. 2011, 262, 531–546. [Google Scholar] [CrossRef]
  80. Hines, F.; Tolhurst, K.G.; Wilson, A.A.G.; McCarthy, G.J. Overall Fuel Hazard Assessment Guide, 4th ed.; Fire and Adaptive Management Report No. 82; Victorian Government Department of Sustainability and Environment: Melbourne, Australia, 2010.
  81. Olson, J.E. Energy storage and the balance of producers and decomposers in ecological systems. Ecology 1963, 44, 322–331. [Google Scholar] [CrossRef] [Green Version]
  82. Watson, P. Fuel Load Dynamics in NSW Vegetation, Part 1: Forests and Grassy Woodlands; Centre for Environmental Risk Management of Bushfires, University of Wollongong: Wollongong, Australia, 2012. [Google Scholar]
  83. Kenny, B.; Roberts, L. Building a comprehensive fuel map—From research to operational use. In Proceedings of the 5th International Fire Behaviour and Fuels Conference, Melbourne, Australia, 2016, 11–15 April 2016. [Google Scholar]
  84. Luke, R.H.; McArthur, A.G. Bushfires in Australia; Australian Government Publishing Service: Canberra, Australia, 1978. [Google Scholar]
  85. Dowdy, A.J. Climatological variability of fire weather in Australia. J. Appl. Meteorol. Climatol. 2018, 57, 221–234. [Google Scholar] [CrossRef]
  86. Keetch, J.J.; Byram, G.M. A Drought Factor Index for Forest Fire Control; US Department of Agriculture, Forest Service, Southeastern Forest Experiment Station: Asheville, NC, USA, 1968.
  87. NSW Office of Environment and Heritage. The NSW State Vegetation Type Map: Methodology for a Regional-Scale Map of NSW Plant Community Types; NSW Office of Environment and Heritage: Sydney, Australia, 2017.
  88. Gibson, R.; Danaher, T.; Hehir, W.; Collins, L. A remote sensing approach to mapping fire severity in south-eastern Australia using sentinel 2 and random forest. Remote. Sens. Environ. 2020, 240, 111702. [Google Scholar] [CrossRef]
  89. Nolan, R.H.; de Dios, V.R.; Boer, M.M.; Caccamo, G.; Goulden, M.L.; Bradstock, R.A. Predicting dead fine fuel moisture at regional scales using vapour pressure deficit from MODIS and gridded weather data. Remote. Sens. Environ. 2016, 174, 100–108. [Google Scholar] [CrossRef] [Green Version]
  90. Farr, T.G.; Rosen, P.A.; Caro, E.; Crippen, R.; Duren, R.; Hensley, S.; Kobrick, M.; Paller, M.; Rodriguez, E.; Roth, L.; et al. The shuttle radar topography mission. Rev. Geophys. 2007, 45, RG2004. [Google Scholar] [CrossRef] [Green Version]
  91. R Core Team. R: A Language and Environment for Statistical Computing; R Foundation for Statistical Computing: Vienna, Austria, 2020. [Google Scholar]
  92. Bates, D.; Maechler, M.; Bolker, B.S.W. Fitting linear mixed-effects models using lme4. J. Stat. Softw. 2015, 67, 1–48. [Google Scholar] [CrossRef]
  93. Keith, D.A. Ocean Shores to Desert Dunes: Native Vegetation of New South Wales and the ACT; NSW Department of Environment & Conservation: Hurstville, Australia, 2004.
Figure 1. (a) Extent of the 2019-20 Black Summer fire season, (b) extent of fires in south-eastern Australia, showing the extent of the Bees Nest fire, Gospers Mountain fire and South Coast complex fires, which are used as case study fires for analyses on the effects of antecedent hazard reduction burns. (c) Fire severity of the Gospers Mountain fire, the largest of the fires at 512,000 ha. Fire severity sourced from the State Government of NSW [20].
Fire 04 00097 g001
Figure 2. Overview of the causes of the extent and severity of the Black Summer fires. The effects of historical fires on the probability of high-severity fire (P(High severity)) are illustrated as a function of: (a) past fire presence (either inside or outside recent antecedent fire); (b) time since fire; and (c) past fire type (either hazard reduction burns or wildfire), in combination with fire weather (Forest Fire Danger Index; FFDI). Historical estimates of fuel loads (df), fuel dryness metrics (gi) and Forest Fire Danger Index (l) are shown for the Sydney Basin bioregion (Figure S1). These figures show mean monthly values, dashed lines represent averages and shading represents ±1 SD of average values. Other bioregions display similar trends, as shown in Figures S2–S4. Note, the y-axes for figures (di) and (l) are scaled such that the y-axis range is the same for each bioregion examined (Figures S2–S4). Live fuel moisture content was estimated from MODIS satellite data available from 2000. Sources of fire ignition for the NSW fires are illustrated as a function of area burnt (j) and houses destroyed (k).
Fire 04 00097 g002
Figure 3. We related the percentage of houses destroyed in 1 km2 blocks of fire-affected areas (n = 1100) to a range of predictors, including: (a) fire weather (Forest Fire Danger Index, FFDI); (b) the percentage of the surrounding landscape (within 5 km2) comprised of forest; and (c) the percentage of the surrounding neighbourhood (1 km2) treated with hazard reduction burns in the five years preceding the 2019–20 fires. The percentage of houses destroyed represent the mean percentage of houses destroyed (±1 SE) within 1 km2 hexagons. Different letters above bars indicate statistically significant differences between categories (p < 0.05).
Fire 04 00097 g003
Table 1. Outline of models used to test hypotheses about the impacts of antecedent fire severity and fire type on fire severity during the 2019–20 fire season.
HypothesisGeneralised Linear Mixed-Effect Binomial Models (GLMM)
H1Severity ~ Location × FFDI + TPI + TRI + Slope + Aspect + DFMC + vegetation + (1|FireGroundID/PastFireID)
H2Severity ~ PastSeverity × FFDI + TPI + TRI + Slope + Aspect + DFMC + vegetation + (1|FireGroundID/PastFireID)
H3Severity ~ TimeSinceFire × FFDI + TPI + TRI + Slope + Aspect + DFMC + vegetation + (1|FireGroundID/PastFireID)
H4Severity ~ FireType × FFDI + TPI + TRI + Slope + Aspect + DFMC + vegetation + (1|FireGroundID/PastFireID)
Publisher’s Note: MDPI stays neutral with regard to jurisdictional claims in published maps and institutional affiliations.

