An Assessment of Fire Refugia Importance Criteria Ranked by Land Managers


1
College of Natural Resources, University of Idaho, Moscow, ID 83844, USA
2
USDA Forest Service Rocky Mountain Research Station, Forestry Sciences Laboratory, Moscow, ID 83843, USA
*
Author to whom correspondence should be addressed.
Fire 2019, 2(2), 27; https://doi.org/10.3390/fire2020027
Submission received: 4 April 2019
/
Revised: 12 May 2019
/
Accepted: 20 May 2019
/
Published: 22 May 2019
Abstract
:There is evidence that forest resiliency is declining in the western US due to recent increases in both areas burned by wildfire and the number of large fires. Fire refugia may increase forest resiliency; however, for land managers to incorporate fire refugia into their management plans, methods need to be developed to identify and rank criteria for what make fire refugia important. As part of a larger effort to build a spatially explicit ranking model for unburned islands in the inland northwestern US, we investigated the perceived importance of criteria used to inform a ranking model to identify high-value fire refugia. We developed a survey targeting land managers within the inland northwestern US. Participants were asked to score a predetermined list of criteria by their importance for determining the value of fire refugia. These scores were analyzed to identify trends among respondents that could be used to develop a fire refugia ranking model. The results indicate that respondents generally organized criteria into two groups: Human infrastructure and wildlife habitat. However, there was little consensus among respondents in their scoring of fire refugia importance criteria, suggesting that a single region-wide fire refugia ranking model may not be feasible. More research with a larger sample size is needed to develop targeted ranking models.
1. Introduction
In recent decades, area burned by wildfire and the number of large wildfires have increased across the western United States despite decreased total ignitions [1] and relatively stable burn severity trends [2]. This is in large part due to fire and land management practices [3] and anthropogenic climate change [4]. Further, more large fires are projected in the future [5]. While ecosystems are well adapted to recover from disturbances under natural disturbance regimes [6], there is increasing evidence of altered disturbance regimes in some regions. In the inland northwestern US, this includes reduced tree regeneration in burned areas [7], higher than expected burn severity amidst a substantial fire deficit [8], and the contemporary loss of historical fire refugia that survived multiple previous wildfires [9].
Fire refugia are areas that are disturbed less frequently or less severely by wildfire relative to the surrounding vegetation matrix, making them important for the persistence of organisms [10]. Fire refugia are one example of biological refugia: Microhabitats providing spatial and/or temporal protection from disturbances [11], such as climate change, drought, floods, or glaciation [12]. Fire refugia formation is influenced by the factors of the fire behavior triangle: Topography, fuels, and weather [10]. Topography [13] and, to a lesser extent, vegetation [14] are relatively stable factors in the formation of fire refugia. Weather, however, is difficult to predict and leads to the formation of more stochastic fire refugia [10,15].
While the concept of biological refugia has been around for over 60 years, Camp et al. [16] were the first to analyze fire refugia across a landscape. Fire refugia serve an important ecological function by containing unique habitat conditions not present in the adjacent forest matrix [17]. During a fire, fire refugia promote survival of organisms by providing shelter from flames and radiant heat [14]. After a fire, they can allow for longer-term persistence and act as ‘lifeboats’ for recolonization [18] of vegetation by acting as seed sources [19,20,21], as wildlife habitat [17,18], and as safe havens for other organisms including soil fungi [22]. As many fire refugia are associated with topographic features that produce fire-resilient microclimates [15], some fire refugia may be at risk from climate change, land management, and fire management practices [10].
Although the maintenance of fire refugia on the landscape has been identified as an important management need for over a decade [23], a specific and comprehensive strategy for managing fire refugia to support ecological function and ecosystem services currently does not exist [10]. Meddens et al. [24,25] developed a database of unburned islands within the inland northwestern US; however, while their unburned island detection model is effective at identifying unburned patches, it does not assess the ecological (or conservation) value of these unburned islands to determine which are true ecological refugia and which have less ecological value. Within the inland northwestern US, 9.6% of the area within the average fire perimeter remains unburned [25]. Therefore, there is a critical need to develop methods that characterize the overall ‘refugia value’ or ‘refugia importance’ for these unburned islands in order to effectively maintain high-quality fire refugia [25,26].
Ranking the value of landscape patches by their ecological importance is well established throughout the ecological literature. Individual landscape patches have been ranked by their importance for general wildlife habitat [27], as well as for the habitat of individual species [28]. There have also been studies ranking habitat patches by specific features such as connectivity [29]. Such efforts have been utilized to identify potential conservation purchases and land preservation efforts, and more recently to facilitate aided species migration under climate change [30,31].
In the inland northwestern US, wildfire is the primary agent of ecological disturbance, and fire refugia play a critical role for species of concern, such as sage grouse (Centrocercus urophasianus) and spotted owl (Strix occidentalis) [16]. As part of a larger effort to build a spatially explicit ranking model for an unburned islands database in the inland northwestern US, our objective here was to use land manager input to identify and weight criteria in order to rank fire refugia importance. We developed an online survey that solicited information on the importance of several criteria. We investigated whether there was clear separability in survey responses related to respondent managed ecosystem type, occupational category, key refugial wildlife species of interest, agency, and management type. Our survey allowed managers to contribute to the development of decision models that are ultimately intended to assist land managers in carrying out their duties.
2. Materials and Methods
2.1. Sampling Methodology
We targeted participants in the inland northwestern US (i.e., Washington, Oregon, and Idaho) employed by the primary non-private sector land management entities: US Forest Service (USFS), US Bureau of Land Management (BLM), US Fish and Wildlife Service (USFWS), National Park Service (NPS), local tribal nations, Washington Department of Natural Resources (DNR), Idaho Department of Lands (IDL), Washington Department of Fish and Wildlife (DFW), Oregon Department of Fish and Wildlife (ODFW), and The Nature Conservancy (TNC). This survey was distributed using a combination of two non-probability sampling techniques: Purposive sampling [32] and snowball sampling [33]. Initial participants were identified using purposive sampling. We identified individuals who were natural resource managers and professionals who might be interested in participating in our survey based on prior engagement in workshops and collaborative projects. A snowball sampling approach was then employed by asking those initial potential participants to identify other natural resource professionals who may be interested, and then asking all subsequent potential participants to identify others; respondents were also asked to provide the name and email of potential participants at the end of the survey. A total of 70 (41 initial and 29 subsequent) individuals were identified and invited to participate in this survey as a result. While non-probability sampling techniques are likely to be biased by the social networks of the individual researchers (i.e., who the researchers know, and who do they in turn know), they are still useful techniques in exploratory studies and when soliciting information from individuals with a particular expertise [34].
We developed an online survey instrument using Qualtrics (Qualtrics, Provo, UT, USA). We emailed each potential respondent with information about the study and a unique link to participate in the survey. All potential participants who had not already responded to the survey or expressly declined to participate were contacted one additional time and asked again [35]. After a brief introduction to fire refugia, the survey asked participants to score a predetermined list of criteria (Table A1) by their importance for determining the value of fire refugia. Respondents were asked to score these using a five-point Likert scale from “not important” to “extremely important,” which were then coded from zero to four. Respondents also had the option to add their own criteria and score them in a Likert format. In addition to the criteria scoring section, there were two additional sections of the survey: (1) A participatory geographic information system (participatory GIS or PGIS) [36] portion where participants identified the locations of known fire refugia using Google Earth and (2) a questionnaire about management actions to protect or preserve fire refugia. However, these additional sections are not analyzed here. The survey concluded with several demographic questions, including the participant’s job title and employer. The survey was expected to take 15–30 min to complete, depending on the level of detail participants provided.
2.2. Survey Analysis
All data analysis was completed in the R statistical package [37]. We first removed several respondents from the analysis (listwise deletion) because they did not answer all questions, because we used multivariate statistical analysis methods that do not support missing data. Questions asking respondents to rate “Other” criteria where the respondent supplied their own criteria were excluded because these criteria were non-uniform across respondents. The only additional criterion supplied by a respondent was a refugium’s ability to “function for ecosystem services.” Surveys that were not fully completed by participants were excluded.
Exploratory factor analysis (R-type) was used to reduce the number of variables (i.e., the refugia importance criteria) by identifying correlation among the measured variables within the dataset and combining them into fewer “common” variables (after ensuring assumptions of exploratory factor analysis were addressed). Factors represent “hidden” or latent variables that were not directly measured but are influencing the data in aggregate [38]. Factors can be approximately identified and named by observing patterns in the responses of observed variables using the factor loadings. The optimal number of factors was determined considering the scree test [39]. K-means nearest neighbor analysis of the factor scores was used to group respondents with similar responses after ensuring assumptions were met. The optimal number of clusters was determined using the silhouette method [40].
After clusters were identified, we divided the responses of these clusters into two distinct groups, investigated their differences, and characterized each cluster by their main themes of survey response. In addition to the cluster analysis, we stratified our respondents into several categories to see whether patterns would arise. These categories were: Ecosystem type (forest versus non-forest/rangeland), occupation type (ecologist versus manager), refugial species of concern (sage grouse, spotted owl, other), employer (USFS, BLM, DFW, NPS, ODFW, and other), and management type (fire manager, land manager, other (agency), and other (non-agency)). We used MANOVA (multivariate analysis of variance) to test for differences in respondent scores by demographic group.
3. Results
3.1. Respondent Demographics
Of the 70 individuals identified as potential participants, 33 responded in total (response rate = 47.1%). However, nine respondents had to be excluded from the analysis due to omitted questions, so the effective response rate was 34.2%. We categorized the respondents by occupations as follows (Figure 1): 33% ecologist/biologist; 33% fire/fuels manager; 18% land manager; 6% researcher; and 9% other (including a soil scientist, science coordinator, and chief of cultural resources). The employers of the respondents were: 76% federal government; 9% state or local government; 6% nonprofit or NGO; 6% university or educational institution; and 3% other (retired federal government).
3.2. Analysis
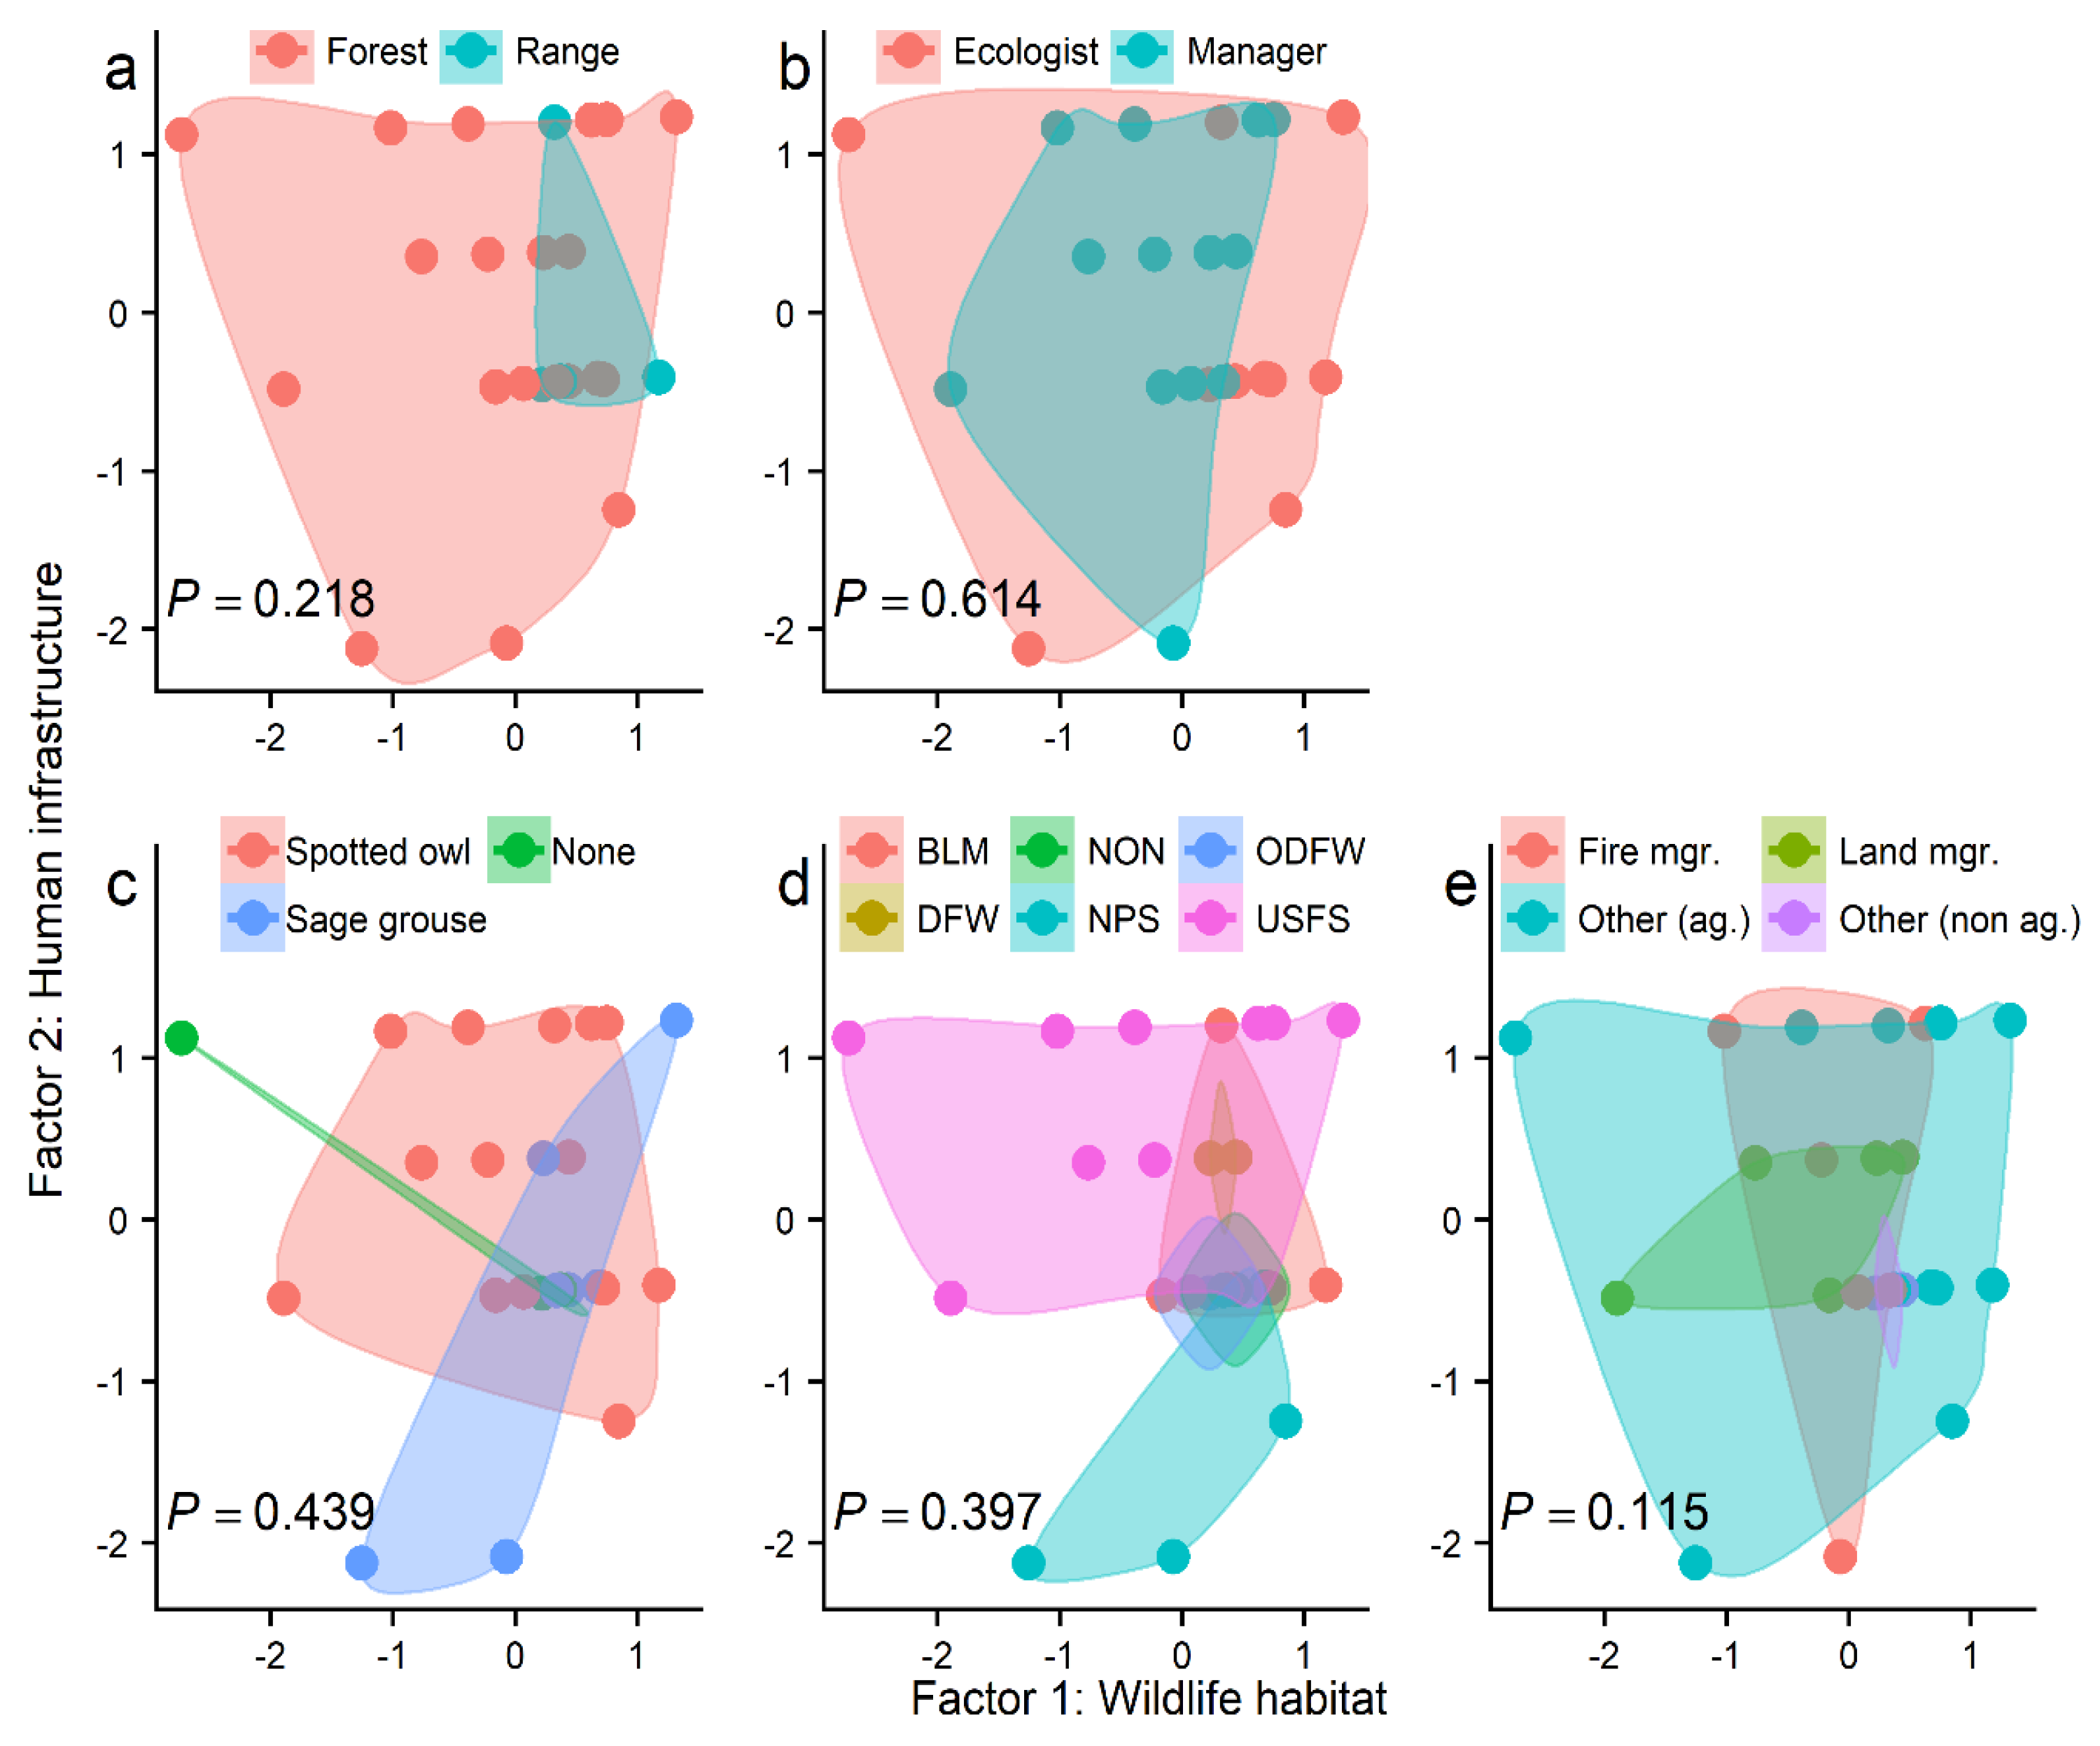
The optimal number of factors was determined to be two (Figure A1). These two factors account for 58.5% of the variance in the survey responses. The two factors broadly describe “ecological habitat” (Factor 1; 40.5% of the variance) and “human infrastructure” (Factor 2; 18.0% of the variance; Figure 2; Table A1). By plotting the respondents’ factor regression scores and grouping them by various demographic measures, several patterns in the respondents’ scores emerge (Figure 3). For example, NPS employees did not prioritize human infrastructure in refugia valuation as high as USFS employees (Figure 3d). Respondents that worked in rangeland areas were likely to prioritize both ecological habitat and infrastructure, whereas respondents working in forested areas gave more variable responses (Figure 3a). As apparent from large overlapping polygons, there was no clear separability of groups for ecosystem type (forest versus rangeland), occupation type (ecologist versus manager), refugial species of concern (sage grouse, spotted owl, other), and management type (fire manager, land manager, other (agency), and other (non-agency)). The MANOVA tests revealed no significant differences in any of these groups (Table 1; Figure 3).
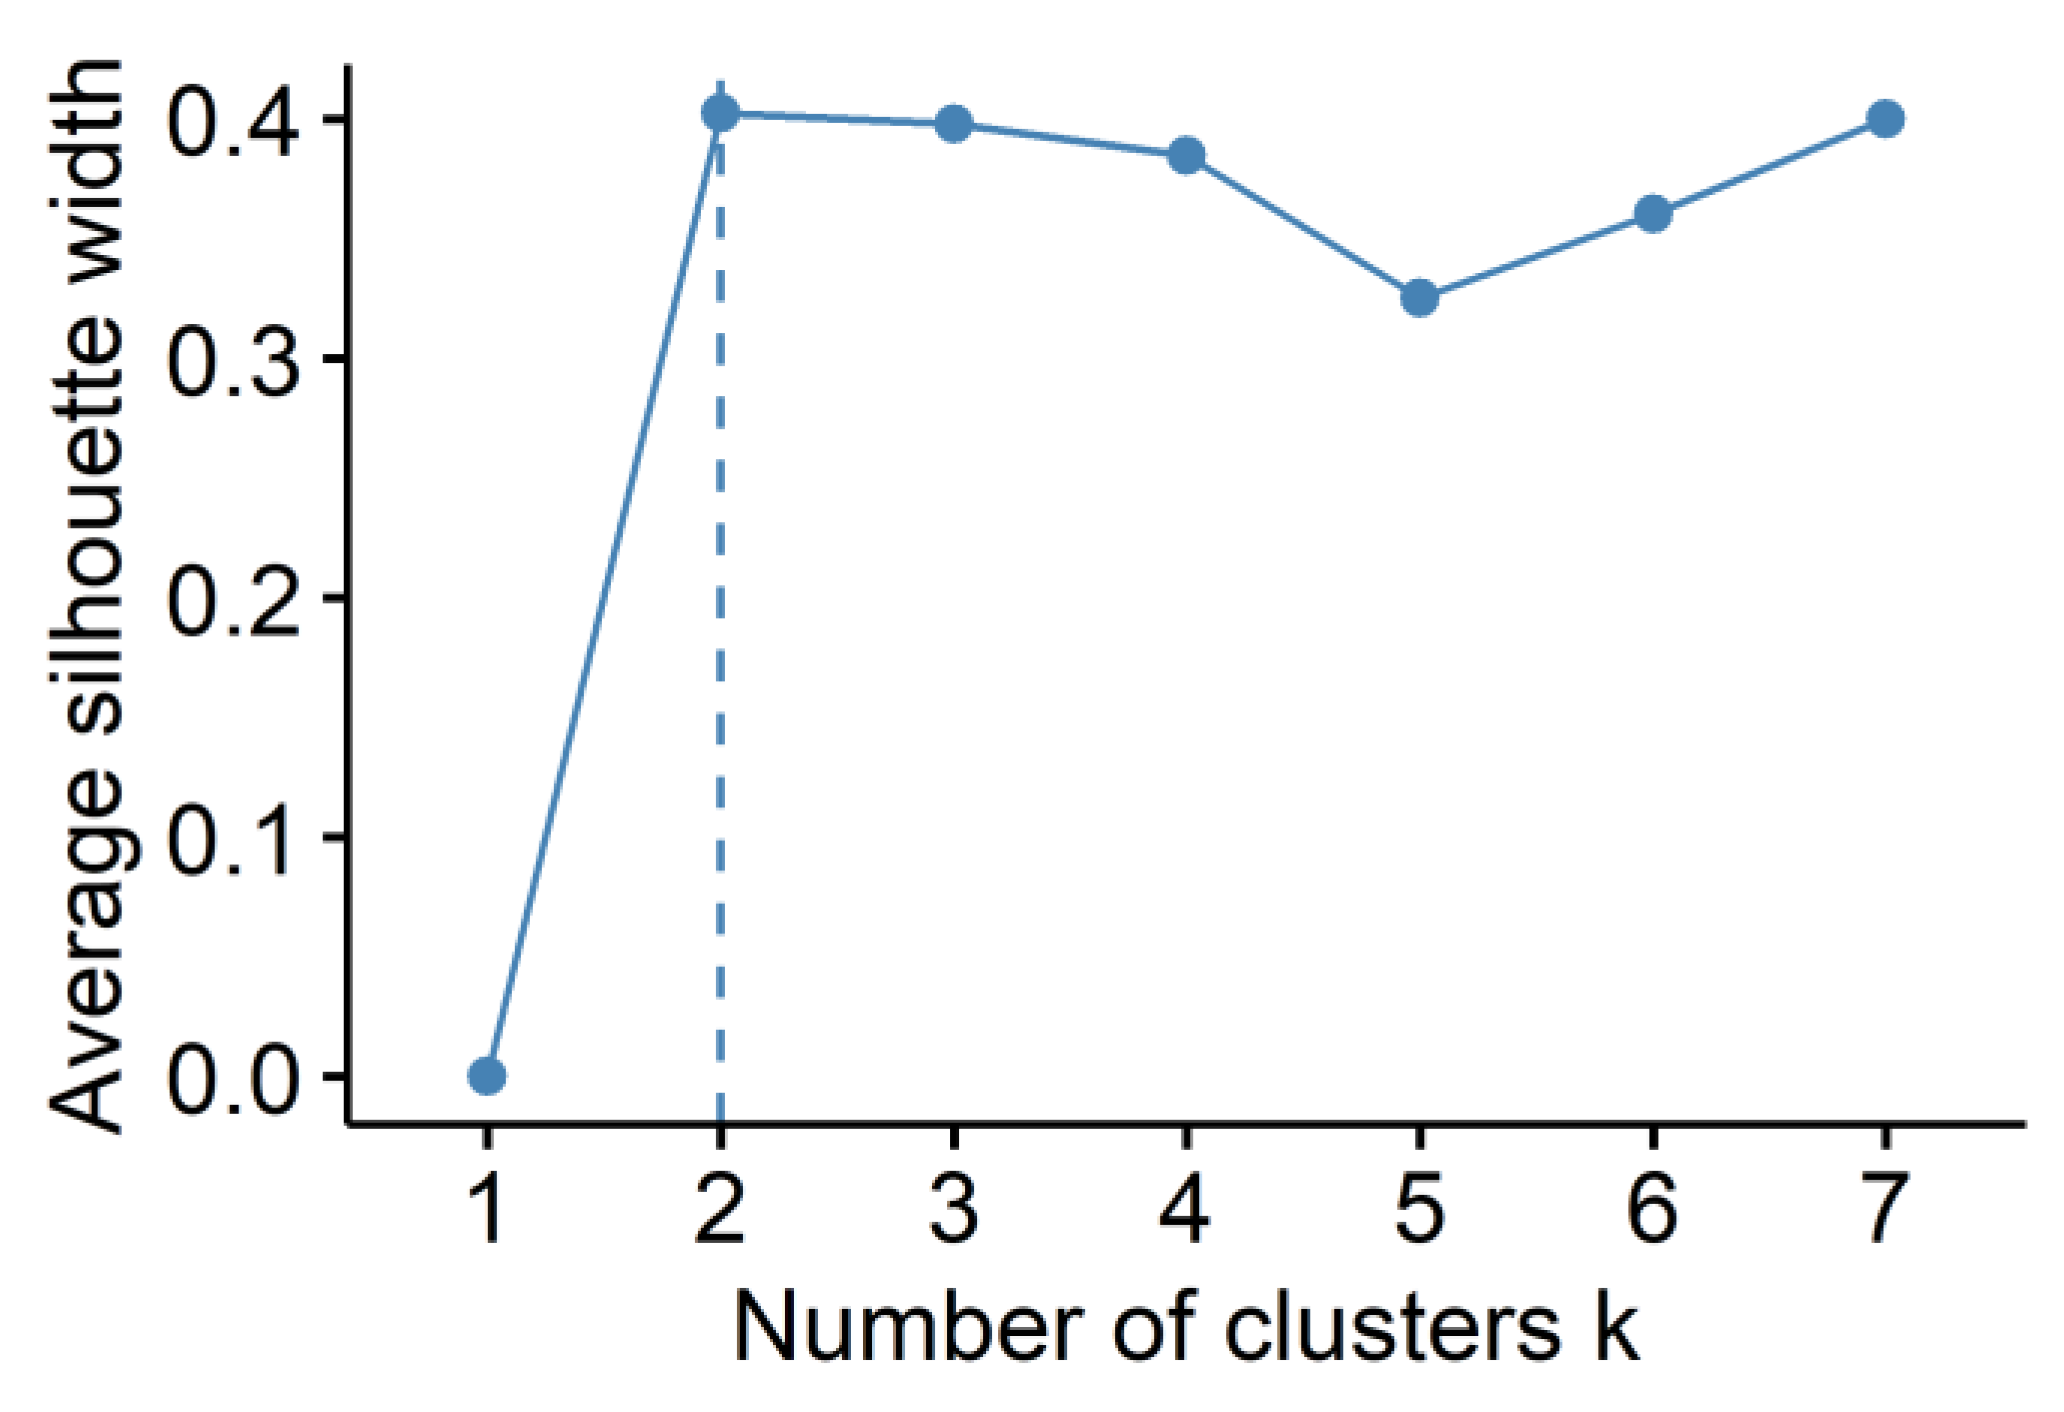
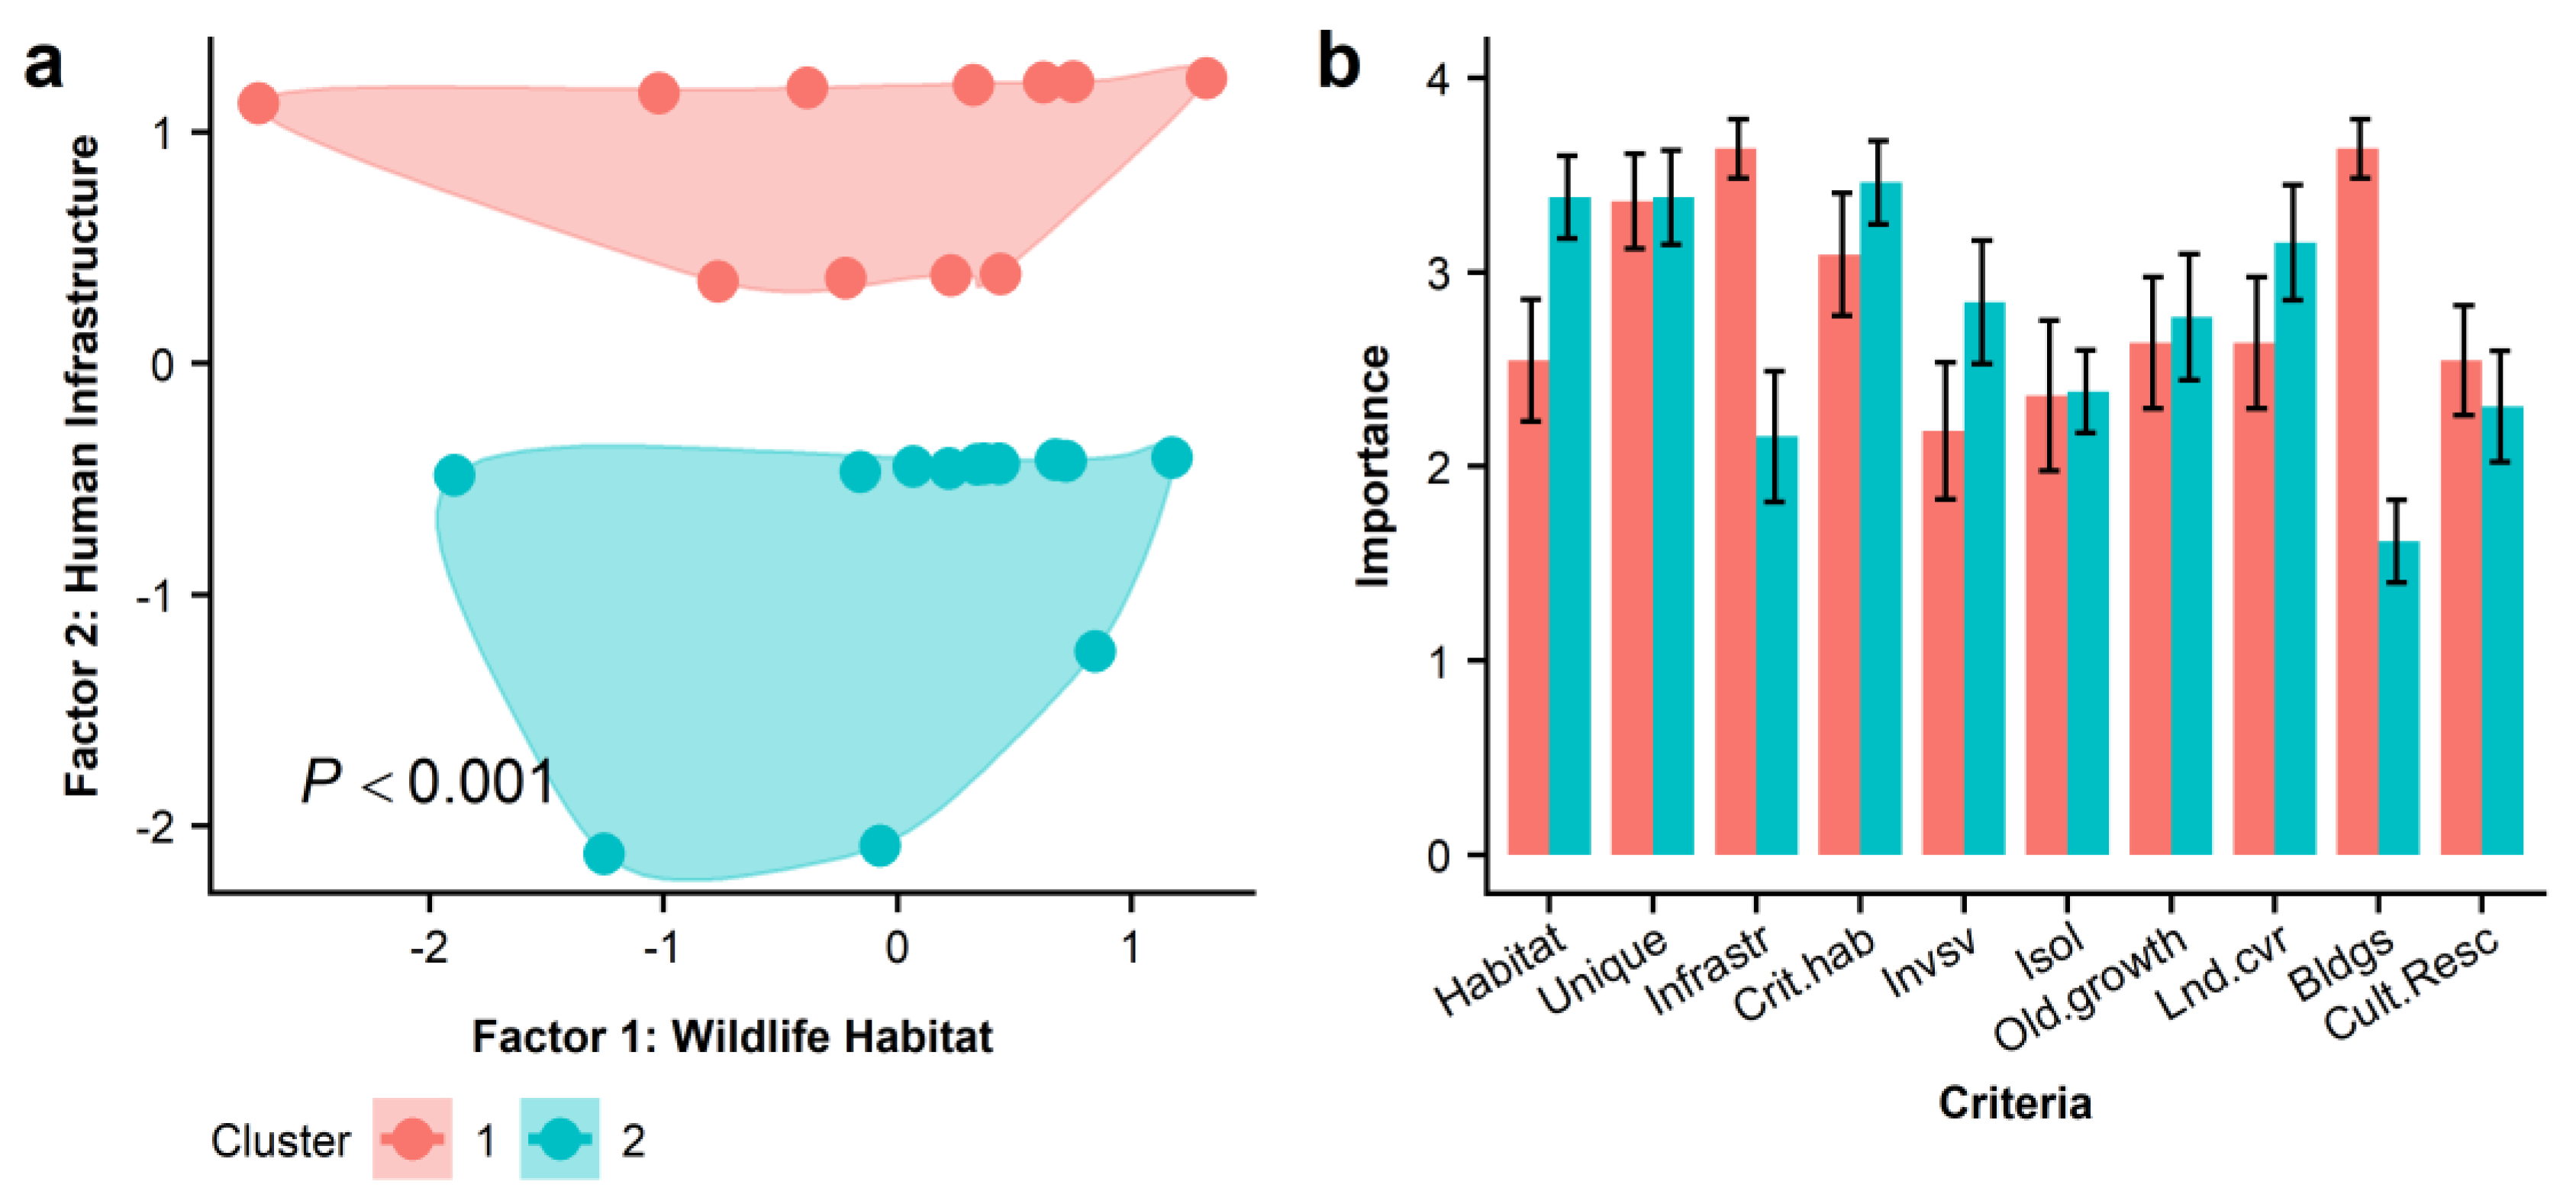
For the k-means cluster analysis, the optimal number of clusters was determined to be two (Figure A2). Respondents were clustered by their responses (Figure 4), and their average ratings for each criterion were plotted (Figure 4b). Cluster 1 included almost exclusively USFS employees (compare to Figure 3d), while Cluster 2 included individuals with no other clear demographic similarities. Respondents in Cluster 1 tended to score higher for criteria related to infrastructure and social importance (e.g., buildings, cultural resources) than respondents in Cluster 2. The MANOVA test revealed a significant difference in response scores between clusters (Table 1; Figure 4).
4. Discussion
While there were only a few discernable patterns that emerged from the participants’ raw responses, we did find two distinct clusters of respondents (Figure 4a). Respondents in Cluster 1 were predominantly USFS employees. These individuals valued human infrastructure higher than average, and there was a range of human infrastructure values. Respondents in Cluster 2 represented many different agencies. These individuals scored human infrastructure less than average and tended to value habitat higher than Cluster 1. This is particularly interesting because USFS does not have responsibility for private infrastructure on or near USFS lands, but there has been considerable scientific and gray literature over the past few decades aligning the USFS fire suppression and management mission specifically with protecting private infrastructure on adjacent lands [41]. This is perhaps best encapsulated by Calkin et al. [41], who argue that the primary means of reducing home loss in wildfire disasters is reducing fire risk on adjacent public lands. Our survey results suggest this mentality has carried over into more conservation-focused management strategies such as managing for fire refugia as well, which is particularly intriguing as USFS must manage for threatened and endangered species (e.g., spotted owl) and other non-infrastructure values as part of its multi-objective management mandate.
Our analysis revealed that, overall, there was little consensus among the respondents in their scoring of fire refugia importance criteria. This is in line with previous research that indicates that values and objectives vary greatly among forest owners [42] and even within public land management agencies [43]. This lack of consensus among land managers suggests that a single “one-size-fits-all” approach to refugia importance ranking will likely not be effective, and aligns with prior research advocating for place-based strategies that rely on local and/or traditional ecological knowledge to inform fire management strategies, in this case to promote fire refugia [44]. Instead, a more targeted approach should be used that ranks refugia at a reduced geographic scale or with a reduced scope by evaluating fewer resources.
There are a variety of management objectives that not only differ among agencies or occupation, but also among individuals and their local units. Rather, ranking models that are targeted to a single species of interest (e.g., sage grouse, northern spotted owl (Strix occidentalis caurina)) or an ecosystem function (e.g., forest recovery) may be a more suitable approach. These ranking models should reflect several of the underlying drivers of land management objectives within the region.
The inclusion of land manager input through the survey provided a mechanism for us to conclude that our initial approach was inadequate for capturing the real-world intricacies of land management decision-making. It further revealed that if a truly management-driven solution to ranking fire refugia was desired, it would require a co-produced ranking model, with land manager input at every step of the process [45]. This would require not only the ranking of the criteria used for determining the importance of fire refugia, but the identification of the precise objectives of the land managers and all the criteria they consider when making management decisions for a given management unit.
There are several limitations to the data we gathered from this survey. The most notable limitation is the small sample size. We drew from a relatively small pool of potential respondents, and several of those that did respond provided data that were unusable. Addition of participants may change the outcomes of the survey and would add more certainty to future conclusions. Additionally, there was poor representation from many agencies (particularly state agencies) and regions (particularly rangeland areas). Another limitation is the small cluster size of the two clusters. With few participants, adding additional clusters becomes less effective. Despite these limitations, our study provides evidence that there is little consensus in how land managers prioritize fire refugia importance criteria.
5. Conclusions
Fire refugia are crucial for preserving critical ecosystem functions in fire-impacted landscapes [14] and offer ecological attributes not found in the surrounding landscape [46]. We initially aimed to use a survey targeting land managers to develop a model that ranked fire refugia by their importance throughout the entire inland northwestern US. The analysis of the survey data revealed highly variable responses from land manager respondents, suggesting a wide range of land management objectives and values throughout the region. This implies that a single fire refugia ranking model useful to land managers for the entire region is not feasible. Further research is needed in developing targeted refugia ranking models, either by specific value (e.g., spotted owl or sage grouse habitat) or from a variety of values at a smaller spatial scale.
Author Contributions
Conceptualization, A.M. (Anthony Martinez) and A.M. (Arjan Meddens); methodology, A.M. (Anthony Martinez), A.M. (Arjan Meddens), and C.K.; software, A.M. (Anthony Martinez); validation, A.M. (Anthony Martinez); formal analysis, A.M. (Anthony Martinez); investigation, A.M. (Anthony Martinez); resources, A.M. (Anthony Martinez) and A.M. (Arjan Meddens); data curation, A.M. (Anthony Martinez); writing—original draft preparation, A.M. (Anthony Martinez); writing—review and editing, A.M. (Arjan Meddens), A.H., and C.K.; visualization, A.M. (Anthony Martinez); supervision, A.M. (Arjan Meddens); project administration, A.M. (Anthony Martinez); funding acquisition, A.M. (Arjan Meddens) and C.K.
Funding
This research was funded by the Joint Fire Science Program Cooperative Agreement L16AC00202, project 16-1-01-1.
Acknowledgments
Thank you to all the respondents who participated in the survey. Many thanks to Cat Edgeley who provided guidance on the survey questions and research directions. We sincerely thank the three anonymous reviewers for their valuable feedback, which greatly improved the quality of this manuscript. This study received ethical approval from the University of Idaho Institutional Review Board (reference number 003135).
Conflicts of Interest
The authors declare no conflict of interest. The funders had no role in the design of the study; in the collection, analyses, or interpretation of data; in the writing of the manuscript; or in the decision to publish the results.
Appendix A
Figure A1.
A scree plot of the survey data used to determine the optimal number of factors to use in the exploratory factor analysis. The two factors above the inflection point of the curve were retained.
Figure A1.
A scree plot of the survey data used to determine the optimal number of factors to use in the exploratory factor analysis. The two factors above the inflection point of the curve were retained.
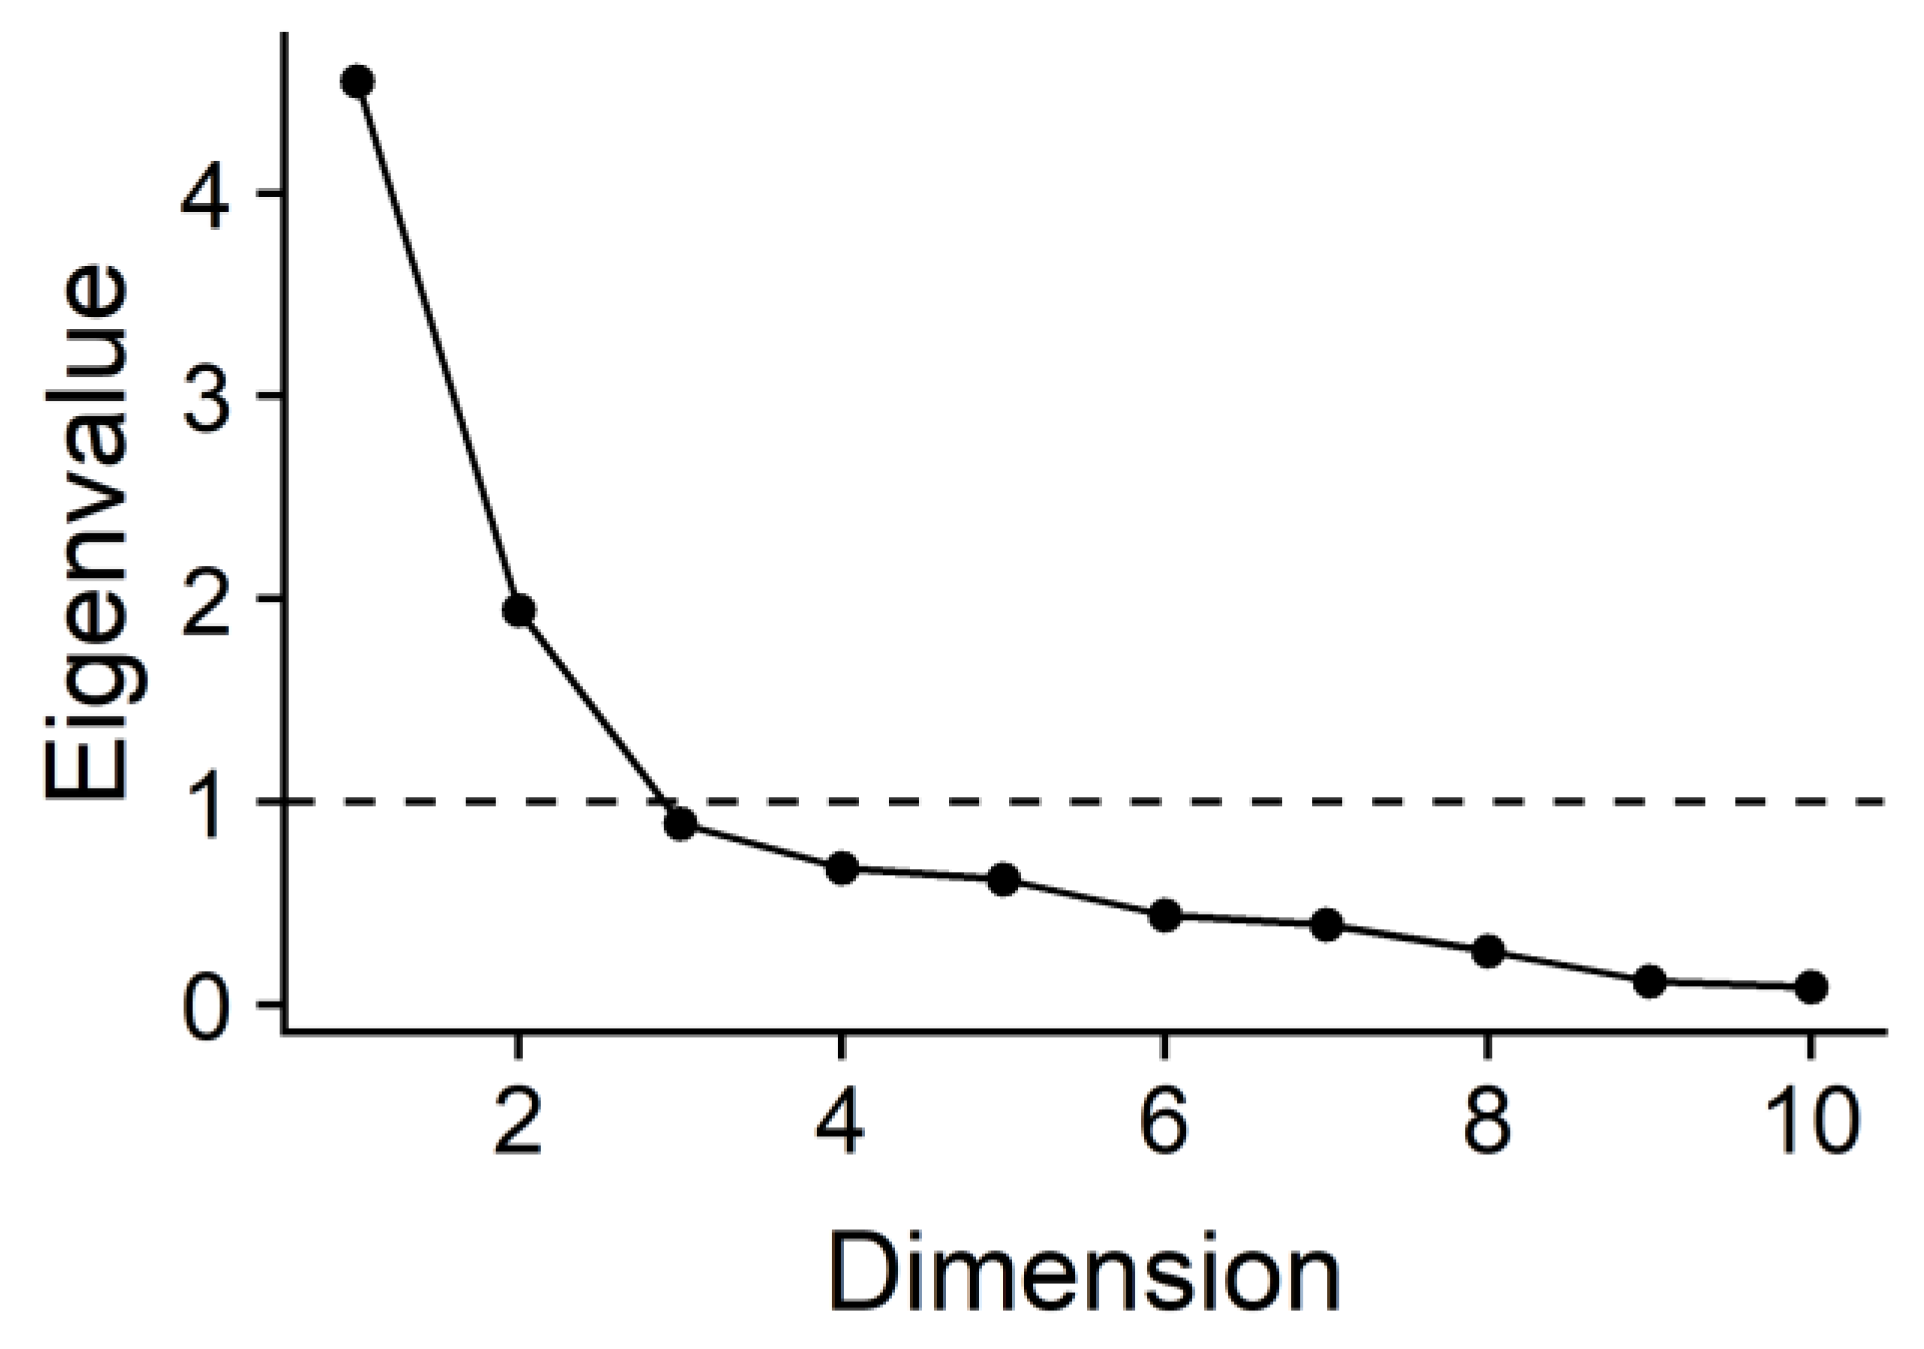
Figure A2.
Plot of average silhouette widths for each number of clusters. The optimal number is two clusters.
Figure A2.
Plot of average silhouette widths for each number of clusters. The optimal number is two clusters.

Table A1.
Factor loadings for survey response data. Items with loadings > 0.7 are in bold to highlight the most meaningful variables that make up each factor.
Table A1.
Factor loadings for survey response data. Items with loadings > 0.7 are in bold to highlight the most meaningful variables that make up each factor.
| Criteria | Abbreviation | Factor 1 | Factor 2 |
|---|---|---|---|
| Overall habitat value | Habitat | 0.794 | −0.345 |
| Overall uniqueness | Unique | 0.620 | −0.110 |
| Overall infrastructure | Infrastr | −0.060 | 0.778 |
| Critical habitat | Crit hab | 0.827 | −0.127 |
| Invasive species | Invsv | 0.585 | −0.139 |
| Isolation | Isol | 0.804 | 0.061 |
| Old growth structure | Old growth | 0.817 | 0.112 |
| Unique/rare land cover type | Lnd cvr | 0.561 | −0.081 |
| Presence of buildings | Bldgs | −0.027 | 0.997 |
| Cultural resource | Cult Resc | 0.609 | 0.113 |
References
- NIFC Total Wildland Fires and Acres (1926–2017). Available online: https://www.nifc.gov/fireInfo/fireInfo_stats_totalFires.html (accessed on 4 March 2019).
- Picotte, J.J.; Peterson, B.; Meier, G.; Howard, S.M. 1984–2010 trends in fire burn severity and area for the conterminous US. Int. J. Wildl. Fire 2016, 25, 413. [Google Scholar] [CrossRef]
- Ryan, K.C.; Knapp, E.E.; Varner, J.M. Prescribed fire in North American forests and woodlands: history, current practice, and challenges. Front. Ecol. Environ. 2013, 11, e15–e24. [Google Scholar] [CrossRef]
- Abatzoglou, J.T.; Williams, A.P. Impact of anthropogenic climate change on wildfire across western US forests. Proc. Natl. Acad. Sci. USA 2016, 113, 11770–11775. [Google Scholar] [CrossRef] [PubMed] [Green Version]
- Barbero, R.; Abatzoglou, J.T.; Larkin, N.K.; Kolden, C.A.; Stocks, B. Climate change presents increased potential for very large fires in the contiguous United States. Int. J. Wildl. Fire 2015, 24, 892. [Google Scholar] [CrossRef]
- Peterson, G.; Allen, C.R.; Holling, C.S. Ecological Resilience, Biodiversity, and Scale. Ecosystems 1998, 1, 6–18. [Google Scholar] [CrossRef]
- Stevens-Rumann, C.S.; Kemp, K.B.; Higuera, P.E.; Harvey, B.J.; Rother, M.T.; Donato, D.C.; Morgan, P.; Veblen, T.T. Evidence for declining forest resilience to wildfires under climate change. Ecol. Lett. 2018, 21, 243–252. [Google Scholar] [CrossRef]
- Haugo, R.D.; Kellogg, B.S.; Cansler, C.A.; Kolden, C.A.; Kemp, K.B.; Robertson, J.C.; Metlen, K.L.; Vaillant, N.M.; Restaino, C.M. The missing fire: quantifying human exclusion of wildfire in Pacific Northwest forests, USA. Ecosphere 2019, 10, e02702. [Google Scholar] [CrossRef]
- Kolden, C.A.; Bleeker, T.M.; Smith, A.M.S.; Poulos, H.M.; Camp, A.E. Fire effects on historical wildfire refugia in contemporary wildfires. Forests 2017, 8, 400. [Google Scholar] [CrossRef]
- Meddens, A.J.H.H.; Kolden, C.A.; Lutz, J.A.; Smith, A.M.S.S.; Cansler, C.A.; Abatzoglou, J.T.; Meigs, G.W.; Downing, W.M.; Krawchuk, M.A. Fire Refugia: What Are They, and Why Do They Matter for Global Change? Bioscience 2018, 68, 944–954. [Google Scholar] [CrossRef]
- Keppel, G.; Van Niel, K.P.; Wardell-Johnson, G.W.; Yates, C.J.; Byrne, M.; Mucina, L.; Schut, A.G.T.; Hopper, S.D.; Franklin, S.E. Refugia: Identifying and understanding safe havens for biodiversity under climate change. Glob. Ecol. Biogeogr. 2012, 21, 393–404. [Google Scholar] [CrossRef]
- Mackey, B.; Lindenmayer, D.B.; Gill, M.; McCarthy, M.; Lindesay, J. Wildlife, Fire & Future Climate; CSIRO Publishing: Collingwood, Australia, 2002; ISBN 0 643 06756 6. [Google Scholar]
- Rogeau, M.P.; Barber, Q.E.; Parisien, M.A. Effect of topography on persistent fire refugia of the Canadian Rocky mountains. Forests 2018, 9, 285. [Google Scholar] [CrossRef]
- Robinson, N.M.; Leonard, S.W.J.; Ritchie, E.G.; Bassett, M.; Chia, E.K.; Buckingham, S.; Gibb, H.; Bennett, A.F.; Clarke, M.F. REVIEW: Refuges for fauna in fire-prone landscapes: their ecological function and importance. J. Appl. Ecol. 2013, 50, 1321–1329. [Google Scholar] [CrossRef]
- Krawchuk, M.A.; Haire, S.L.; Coop, J.; Parisien, M.-A.; Whitman, E.; Chong, G.; Miller, C. Topographic and fire weather controls of fire refugia in forested ecosystems of northwestern North America. Ecosphere 2016, 7, e01632. [Google Scholar] [CrossRef]
- Camp, A.; Oliver, C.; Hessburg, P.F.; Everett, R. Predicting late-successional fire refugia pre-dating European settlement in the Wenatchee mountains. For. Ecol. Manag. 1997, 95, 63–77. [Google Scholar] [CrossRef]
- Delong, S.C.; Kessler, W.B. Ecological characteristics of mature forest remnants left by wildfire. For. Ecol. Manag. 2000, 131, 93–106. [Google Scholar] [CrossRef]
- Franklin, J.F.; Lindenmayer, D.B.; MacMahon, J.A.; Mckee, A.; Magnuson, J.; Perry, D.A.; Waide, R.; Foster, D. Threads of continuity. Conserv. Pract. 2000, 1, 8–17. [Google Scholar] [CrossRef]
- Burton, P.J.; Parisien, M.-A.; Hicke, J.A.; Hall, R.J.; Freeburn, J.T. Large fires as agents of ecological diversity in the North American boreal forest. Int. J. Wildl. Fire 2008, 17, 754–767. [Google Scholar] [CrossRef]
- Charron, I.; Greene, D.F. Post-wildfire seedbeds and tree establishment in the southern mixedwood boreal forest. Can. J. For. Res. 2002, 32, 1607–1615. [Google Scholar] [CrossRef]
- Viedma, O.; Meliá, J.; Segarra, D.; García-Haro, J. Modeling rates of ecosystem recovery after fires by using landsat TM data. Remote Sens. Environ. 1997, 61, 383–398. [Google Scholar] [CrossRef]
- Hart, S.C.; DeLuca, T.H.; Newman, G.S.; MacKenzie, M.D.; Boyle, S.I. Post-fire vegetative dynamics as drivers of microbial community structure and function in forest soils. For. Ecol. Manag. 2005, 220, 166–184. [Google Scholar] [CrossRef]
- Lindenmayer, D.B.; Franklin, J.F.; Fischer, J. General management principles and a checklist of strategies to guide forest biodiversity conservation. Biol. Conserv. 2006, 131, 433–445. [Google Scholar] [CrossRef]
- Meddens, A.J.H.; Kolden, C.A.; Lutz, J.A. Detecting unburned areas within wildfire perimeters using Landsat and ancillary data across the northwestern United States. Remote Sens. Environ. 2016, 186, 275–285. [Google Scholar] [CrossRef]
- Meddens, A.J.H.; Kolden, C.A.; Lutz, J.A.; Abatzoglou, J.T.; Hudak, A.T. Spatiotemporal patterns of unburned areas within fire perimeters in the northwestern United States from 1984 to 2014. Ecosphere 2018, 9, e02029. [Google Scholar] [CrossRef]
- Perera, A.H.; Buse, L.J. Ecology of Wildfire Residuals in Boreal Forests; John Wiley & Sons, Ltd.: Chichester, UK, 2014; ISBN 9781118870488. [Google Scholar]
- Endries, M.; Gilbert, T.; Kautz, R. Environmental planning in Florida: Mapping wildlife needs in Florida: The integrated wildlife habitat ranking system. In Proceedings of the 2003 International Conference on Ecology and Transportation, Lake Placid, NY, USA, 24–29 August 2003; Irwin, C.L., Garrett, P., McDermott, K.P., Eds.; Center for Transportation and the Environment, North Carolina State University: Raleigh, NC, USA, 2003; pp. 525–534. [Google Scholar]
- Stauffer, H.B.; Ralph, C.J.; Miller, S.L. Ranking habitat for marbled murrelets: New conservation approach for species with uncertain detection. Ecol. Appl. 2004, 14, 1374–1383. [Google Scholar] [CrossRef]
- Bodin, Ö.; Saura, S. Ranking individual habitat patches as connectivity providers: Integrating network analysis and patch removal experiments. Ecol. Modell. 2010, 221, 2393–2405. [Google Scholar] [CrossRef]
- Carroll, C.; DUunk, J.R.; Moilanen, A. Optimizing resiliency of reserve networks to climate change: multispecies conservation planning in the Pacific Northwest, USA. Glob. Chang. Biol. 2010, 16, 891–904. [Google Scholar] [CrossRef] [Green Version]
- Kiester, A.R.; Scott, J.M.; Csuti, B.; Noss, R.F.; Butterfield, B.; White, D. Conservation Prioritization Using GAP Data. Conserv. Biol. 1996, 10, 1332–1342. [Google Scholar] [CrossRef]
- Battaglia, M.P. Purposive Sample. Encycl. Surv. Res. Methods 2008, 645–647. [Google Scholar]
- Morgan, D.L. Snowball Sampling. SAGE Encycl. Qual. Res. Methods 2008, 816–817. [Google Scholar]
- Fox, N. Nonprobability Sampling. In The SAGE Encyclopedia of Qualitative Research Methods; SAGE Publications, Inc.: Thousand Oaks, CA, USA, 2008; p. 1043. ISBN 9781412941631. [Google Scholar]
- Dillman, D.A.; Smyth, J.D.; Christian, L.M. Internet, Phone, Mail, and Mixed-Mode Surveys: The Tailored Design Method, 4th ed.; John Wiley & Sons, Inc.: Hoboken, NJ, USA, 2014; ISBN 9781118456149. [Google Scholar]
- Abbot, J.; Chambers, R.; Harris, T.; de Merode, E.; Porter, G.; Townsend, J.; Weiner, D. Participatory GIS: oppurtunity or oxymoron? PLA Notes 1998, 27–34. [Google Scholar]
- R Core Team. R: A Language and Environment for Statistical Computing; R Foundation for Statistical Computing: Vienna, Austria, 2018. [Google Scholar]
- Fabrigar, L.R.; Wegener, D.T. Exploratory Factor Analysis; Oxford University Press: New York, NY, USA, 2011; ISBN 9780199734177. [Google Scholar]
- Cattell, R.B. The Scree Test For The Number Of Factors. Multivar. Behav. Res. 1966, 1, 245–276. [Google Scholar] [CrossRef]
- Rousseeuw, P.J. Silhouettes: A graphical aid to the interpretation and validation of cluster analysis. J. Comput. Appl. Math. 1987, 20, 53–65. [Google Scholar] [CrossRef] [Green Version]
- Calkin, D.E.; Cohen, J.D.; Finney, M.A.; Thompson, M.P. How risk management can prevent future wildfire disasters in the wildland-urban interface. Proc. Natl. Acad. Sci. USA 2014, 111, 746–751. [Google Scholar] [CrossRef] [PubMed]
- Ní Dhubháin, Á.; Cobanova, R.; Karppinen, H.; Mizaraite, D.; Ritter, E.; Slee, B.; Wall, S. The Values and Objectives of Private Forest Owners and Their Influence on Forestry Behaviour: The Implications for Entrepreneurship. Small-Scale For. 2007, 6, 347–357. [Google Scholar] [CrossRef]
- Martin, I.M.; Steelman, T.A. Using Multiple Methods to Understand Agency Values and Objectives: Lessons for Public Lands Management. Policy Sci. 2004, 37, 37–69. [Google Scholar] [CrossRef]
- Ray, L.A.; Kolden, C.A.; Chapin, F.S. A case for developing place-based fire management strategies from traditional ecological knowledge. Ecol. Soc. 2012, 17, 37. [Google Scholar] [CrossRef]
- Roux, D.J.; Rogers, K.H.; Biggs, H.C.; Ashton, P.J.; Sergeant, A. Bridging the science-management divide: Moving from unidirectional knowledge transfer to knowledge interfacing and sharing. Ecol. Soc. 2006, 11, 4. [Google Scholar] [CrossRef]
- Ouarmim, S.; Ali, A.A.; Asselin, H.; Hély, C.; Bergeron, Y. Evaluating the persistence of post-fire residual patches in the eastern Canadian boreal mixedwood forest. Boreas 2015, 44, 230–239. [Google Scholar] [CrossRef]
Figure 1.
Demographic makeup of survey respondents by (a) ecosystem type, (b) occupational category, (c) refugia species of concern, (d) agency, and (e) management type.
Figure 1.
Demographic makeup of survey respondents by (a) ecosystem type, (b) occupational category, (c) refugia species of concern, (d) agency, and (e) management type.
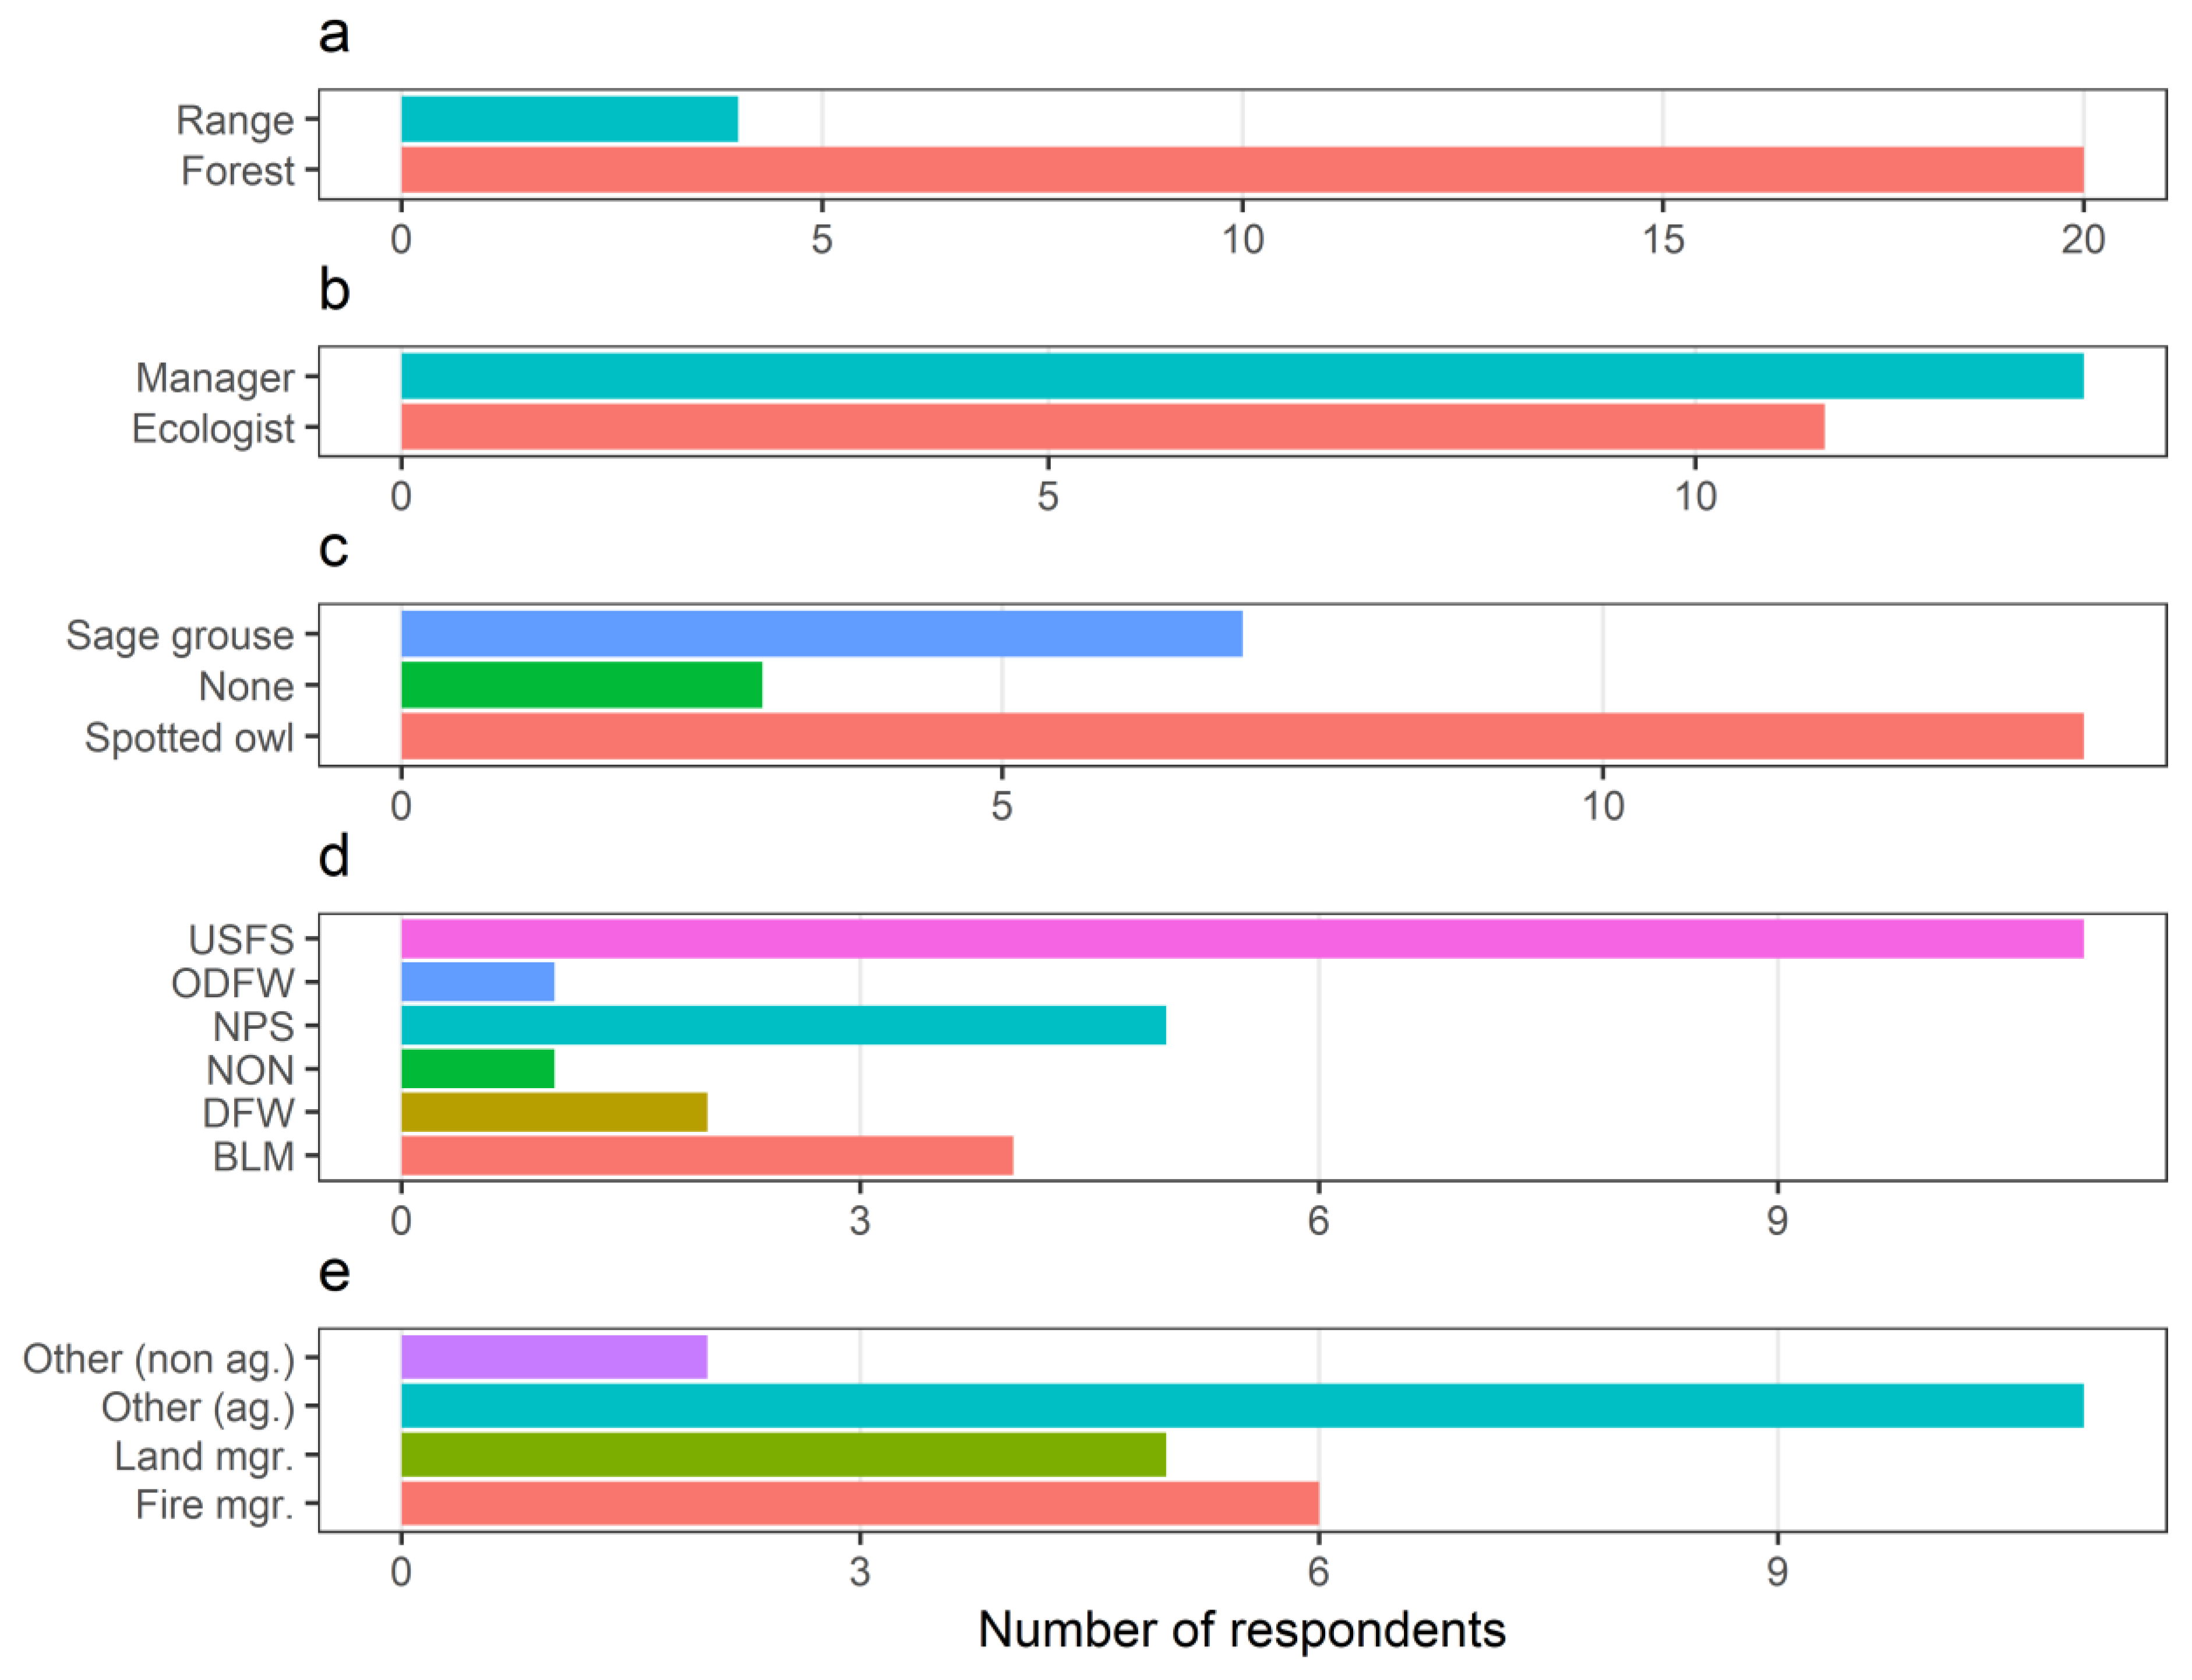
Figure 2.
Factor loadings for each variable. Latent variables can be approximated by identifying the distribution patterns of observed variables along each axis. See Table A1 for descriptions of the abbreviations of the variables.
Figure 2.
Factor loadings for each variable. Latent variables can be approximated by identifying the distribution patterns of observed variables along each axis. See Table A1 for descriptions of the abbreviations of the variables.
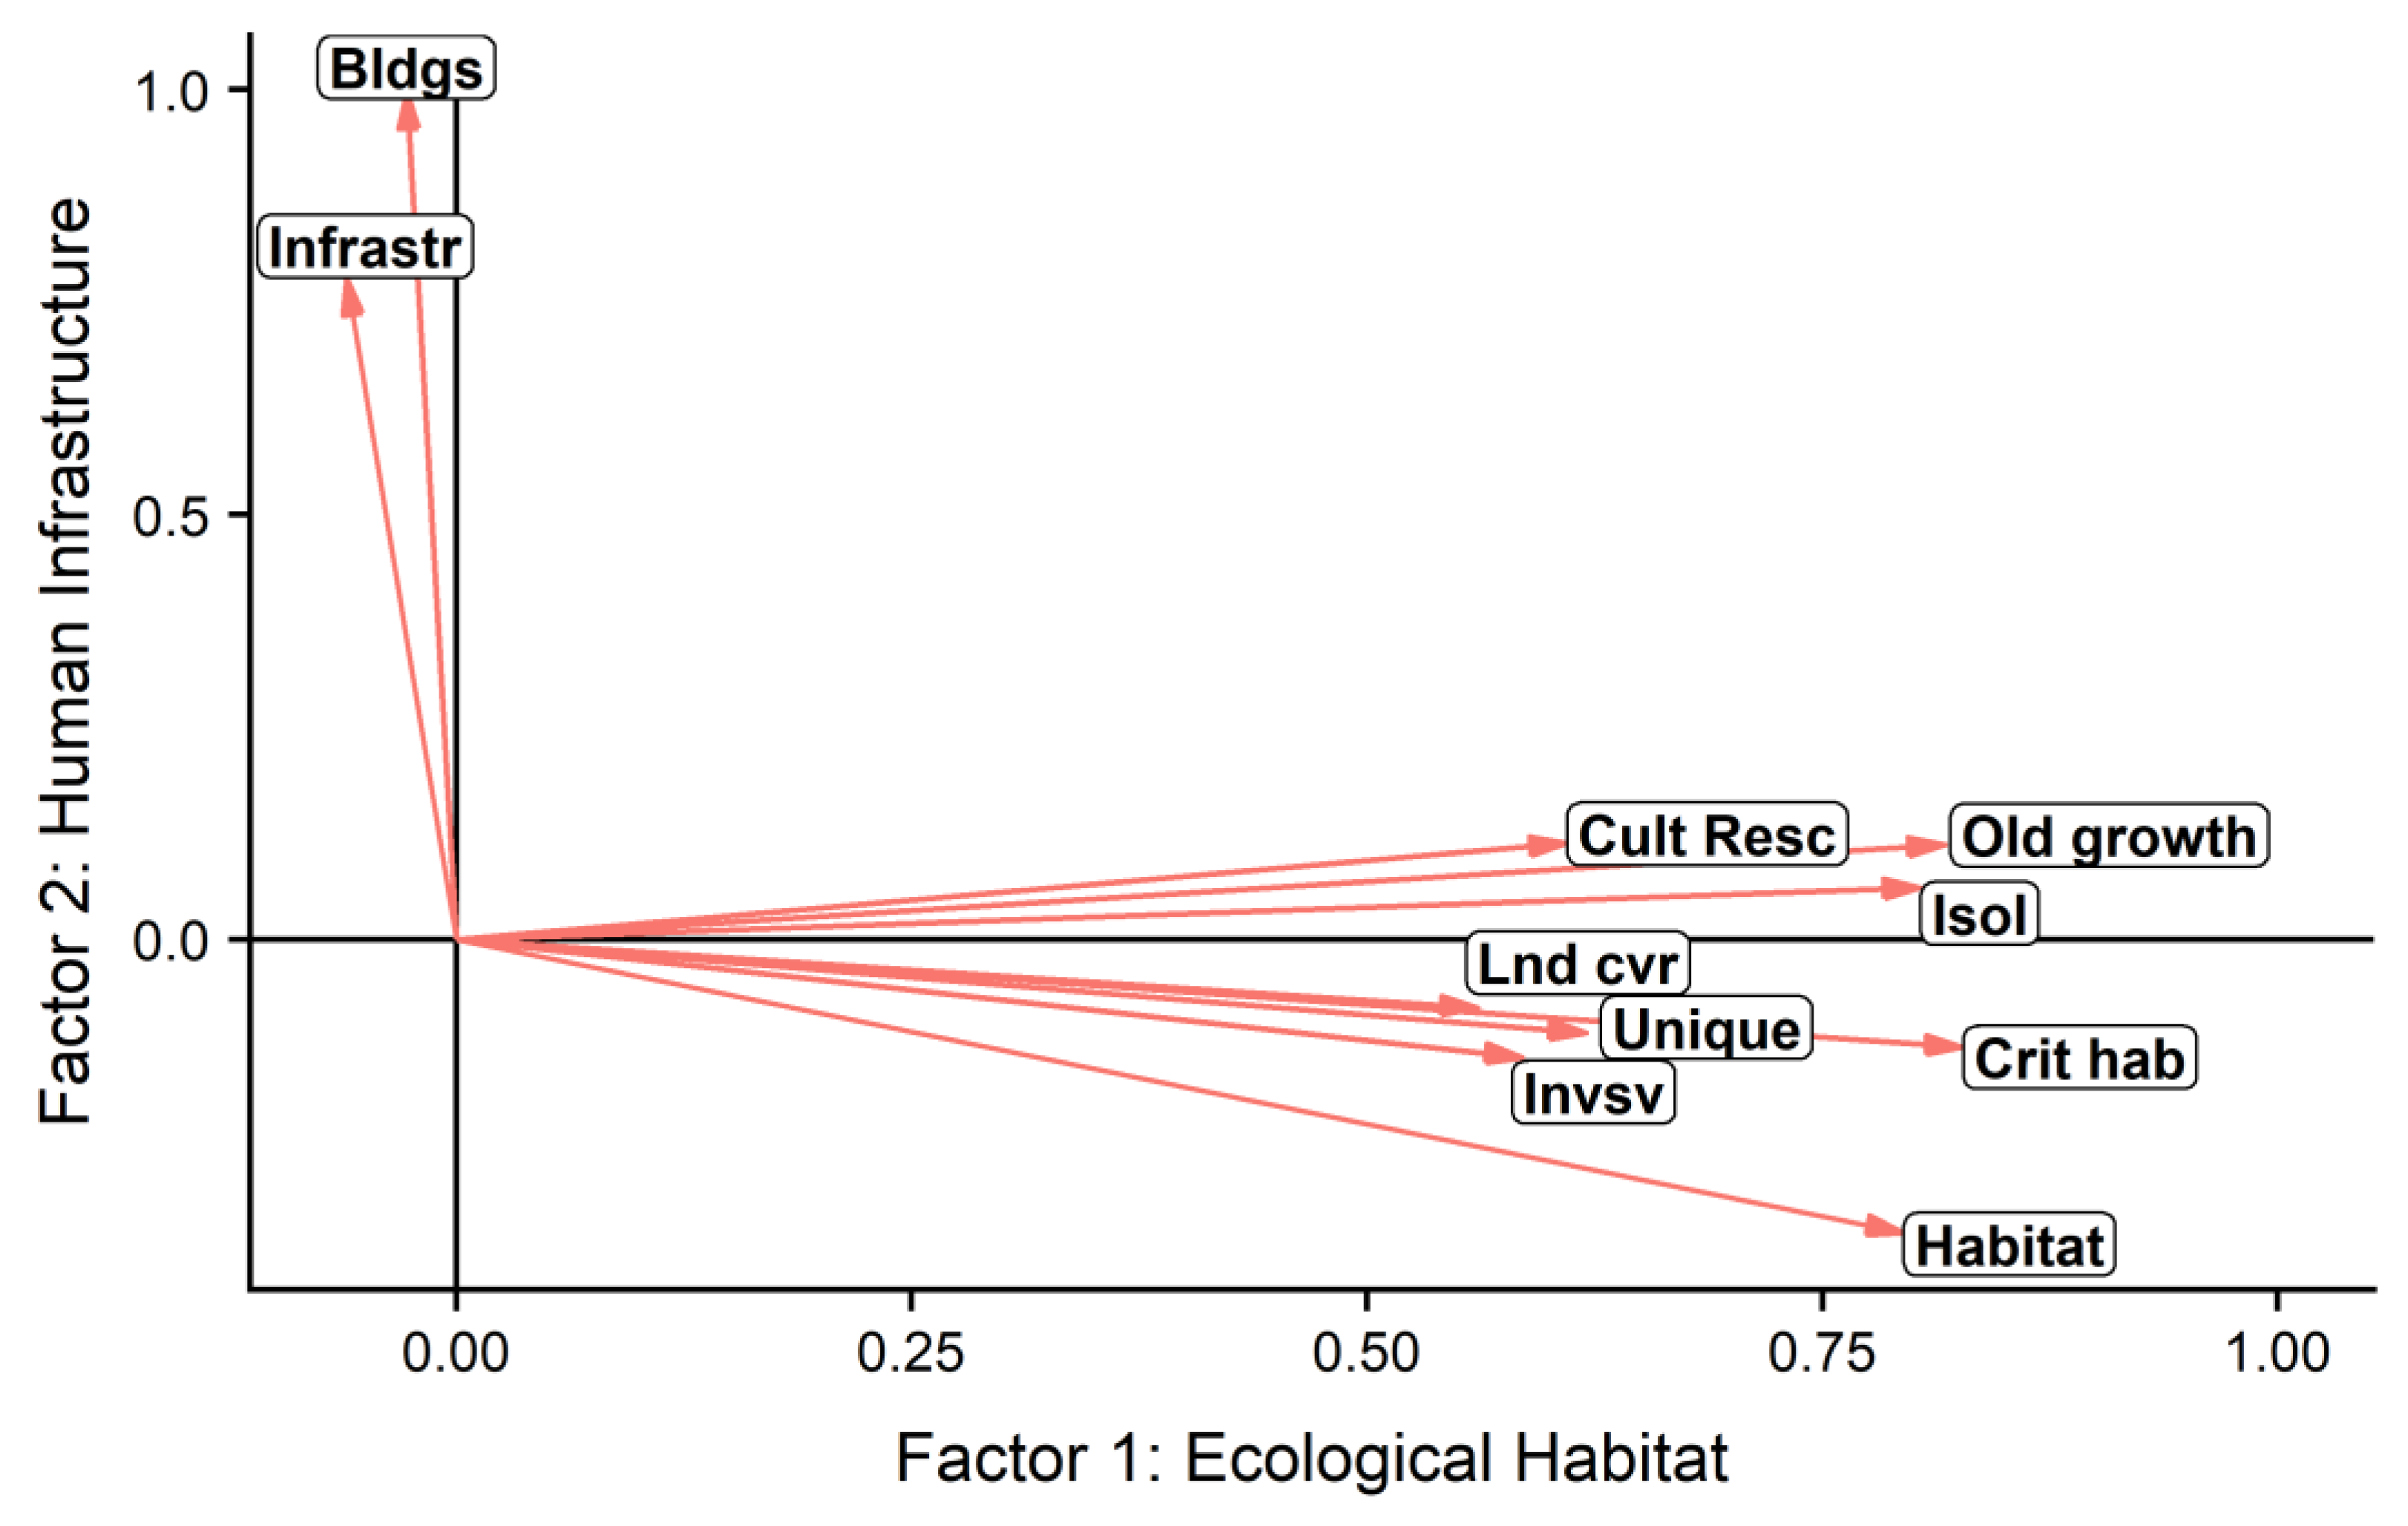
Figure 3.
Plots of the respondents’ factor scores grouped by (a) ecosystem type, (b) occupational category, (c) refugia species of concern, (d) agency, and (e) management type. Polygons were plotted to encircle all points within each group. Agencies are: US Forest Service (USFS), US Bureau of Land Management (BLM), Washington Department of Fish and Wildlife (DFW), National Park Service (NPS), Oregon Department of Fish and Wildlife (ODFW), and all others (NON). Occupations are “Fire mgr.” (fire manager), “Land mgr.” (land manager), “Other (ag.)” (other agency positions), and “Other (non ag.)” (other non-agency positions). p-values are from MANOVA tests, which test for differences between groups by respondent’s scores.

Figure 4.
Respondent scores by cluster. (a) Respondents plotted along factors, grouped by cluster. (b) Mean and standard error of respondent importance rankings, by cluster. See Table A1 for descriptions of the abbreviations of the variables. p-values are from MANOVA tests, which test for differences between clusters by respondent’s scores.

Table 1.
Multivariate analysis of variance (MANOVA) test for differences on response scores between demographic groups. df 1 and df 2 are the degrees of freedom, Pillai is the Pillai’s trace test statistic, F is the F-statistic, and p is the p-value.
Table 1.
Multivariate analysis of variance (MANOVA) test for differences on response scores between demographic groups. df 1 and df 2 are the degrees of freedom, Pillai is the Pillai’s trace test statistic, F is the F-statistic, and p is the p-value.
| Variable | df 1 | df 2 | Pillai | F | p |
|---|---|---|---|---|---|
| Ecosystem type | 1 | 22 | 0.548 | 1.577 | 0.218 |
| Occupational category | 1 | 22 | 0.388 | 0.824 | 0.614 |
| Refugia species of concern | 2 | 21 | 0.898 | 1.059 | 0.439 |
| Agency | 5 | 18 | 2.256 | 1.069 | 0.397 |
| Management type | 3 | 20 | 1.609 | 1.503 | 0.115 |
| Cluster | 1 | 22 | 0.864 | 8.28 | <0.001 |
© 2019 by the authors. Licensee MDPI, Basel, Switzerland. This article is an open access article distributed under the terms and conditions of the Creative Commons Attribution (CC BY) license (http://creativecommons.org/licenses/by/4.0/).
Share and Cite
MDPI and ACS Style
Martinez, A.; Meddens, A.; Kolden, C.; Hudak, A. An Assessment of Fire Refugia Importance Criteria Ranked by Land Managers. Fire 2019, 2, 27. https://doi.org/10.3390/fire2020027
AMA Style
Martinez A, Meddens A, Kolden C, Hudak A. An Assessment of Fire Refugia Importance Criteria Ranked by Land Managers. Fire. 2019; 2(2):27. https://doi.org/10.3390/fire2020027
Chicago/Turabian StyleMartinez, Anthony, Arjan Meddens, Crystal Kolden, and Andrew Hudak. 2019. "An Assessment of Fire Refugia Importance Criteria Ranked by Land Managers" Fire 2, no. 2: 27. https://doi.org/10.3390/fire2020027