Exploring ISO31000 Risk Management during Dynamic Fire and Emergency Operations in Western Australia


Edith Cowan University, School of Engineering, Joondalup Campus, Perth, WA 6027, Australia
Fire 2019, 2(2), 21; https://doi.org/10.3390/fire2020021
Submission received: 16 February 2019
/
Revised: 31 March 2019
/
Accepted: 16 April 2019
/
Published: 24 April 2019
Abstract
:Firefighting remains an inherently dangerous occupation with serious injuries and fatalities reported globally. The Australasian Fire Authorities Council adopt ISO31000 as the standard of risk management for all firefighting and mitigation operations. However, previous studies have reported that decisions made by incident controllers during dynamic emergencies are typically reactionary and only partially compliant with the ISO31000 process. This paper describes research using new qualitative and quantitative data that support incident controllers in managing risk during dynamic fire and emergency situations, in accordance with ISO31000. The research was completed through two studies. The first study explored risk attitudes of serving fire service officers through semistructured interviews and in-depth structured surveys. The second study identified the severity of firefighting consequences and likelihood through analysis of Western Australian fire service safety and incident reports between January 1st, 2001 and January 1st, 2015. The overall and conditional probability of specific injuries during the various tasks undertaken during emergency incidents was calculated using Bayesian statistical analysis. The findings indicate that whilst current practices are arguably effective in preventing worst case consequences being realised, improvements in operational risk management can be made in accordance with ISO31000 during emergencies and in pre-incident planning.
1. Introduction
Firefighting remains an inherently dangerous occupation which requires incident controllers (ICs) to make critical decisions within significantly restricted timeframes. This requires ICs to succinctly yet thoroughly manage risk across a large range of hazards and dynamic environments. The Australasian Fire Authorities Council adopt International Standard 31000 Risk management—principles and guidelines (ISO 31000) [1] as the standard of risk management for all firefighting and mitigation operations [2,3,4,5] for which the IC is ultimately accountable. This risk management process provides the framework to make decisions for risk to be deemed to have been considered sufficiently [4]. It must be applied in every situation, including emergency response [4]. SAI Global HB436:2013 ([6]; p. 45) provides the following example of how the process must be applied in even the most dynamic emergency situations:
“A military special forces section leader might have a split second in which to make a tactical decision on which personal wellbeing and that of subordinates as well as the success of the mission, might depend. In that time the leader must recall the objectives, appreciate the external and internal environment, assess the risks, consider the options, review those against the objectives and take the appropriate action. Despite the very short decision making window, the quality of each of these steps must be of the highest standard.”
Failing to comprehend the full nature of the risk or not applying the risk framework can have disastrous results when making dynamic decisions in the emergency environment. This is because those decisions may unintentionally worsen rather than reduce adverse consequences. Existing studies suggest risk assessment in accordance with ISO 31000 [1] may not occur during frontline emergency response in most jurisdictions even though the consequences of insufficient risk management in the firefighting context are both catastrophic and well known [2,7,8]. Controlled burns breaking containment lines and fatalities occurring as an outcome of inappropriate risk management are examples of adverse consequences faced during emergency incidents. These types of consequences can result in significant post-incident scrutiny of the ICs’ decisions.
Risk analysis or assessment is the process of understanding the nature and severity of risk [9]. This process requires that the risk manager must be able to adequately interpret risk sources in a structured manner. They also need to determine the consequences and likelihood of the risk occurring [2]. During even the most rapidly changing emergency situations, the risk management framework and structure remains the same [4]. Each risk analysis must be considered a new, separate process, even if it builds upon a previously and recently completed analysis of the same emergency situation at an earlier point in time. Awareness of this requirement is important because dynamic risk management does not involve a changing architecture or process of analysis, but rather, using the same risk management architecture and analysis process applied multiple times during a rapidly changing (dynamic) emergency situation [2].
Risk analysis may either be qualitative, quantitative or a combination of both. Qualitative analysis is used by the assessor to describe and often subjectively appraise risk. It is often useful when risk treatment strategies involve multiple risks at different levels that cannot be accurately measured on the same quantitative scale. Qualitative risk analysis may be suitable during preliminary or scoping assessments. Importantly, when qualitative analysis is applied, “there should be a clear explanation of all the terms employed and the basis for all criteria should be recorded” ([9]; p. 18). Review of fire services literature [10,11,12] identified that whilst prioritised objectives of the protection of life, property, and the environment were common across jurisdictions, explanations of terminology were largely absent from operational material. Yung [13] asserted that reliance on qualitative assessment alone must be considered fundamentally flawed because subjective judgements cannot be verified and may often differ between operators. Further, the same operator may make different decisions given the same situation at various points in time.
Quantitative assessment is used by the assessor to analyse numerical data by calculating probabilities, frequencies, and distributions. Considered the epitome of fire risk analysis, probabilistic risk analysis requires detailed and time-consuming consideration of all possible outcomes. These outcomes may be a function of incidence, Bayesian probability or life/dollar loss per unit time [13]. The availability of substantial high-quality data as well as the ability to numerically represent variability within defined confidence levels are required for such analyses. Therefore, it cannot be undertaken within the parameters and constraints of a single emergency incident [2]. This view is supported by the Australian Capital Territory Fire Service ([14]; p. 2) by the Dynamic Risk assessment overview statement that “often, rescues have to be performed, exposures protected and hose lines placed before a complete appreciation of all material facts have been obtained”. Whilst typical quantitative analysis, including fault tree or event tree diagrams, may be particularly useful for pre-incident planning and as a supporting assurance process, their complexity and time required for completion render them impractical for incident ground completion. Review of available literature identified that significant international statistical analysis of fire-related fatality and injury data were available [15,16,17]. However, there was a total absence of statistical analysis of Australian firefighting injuries and risk management during dynamic operations in both published and internal brigade documentation.
Risks encountered during emergency response are near impossible to eliminate due to the inherent nature of the situations faced. However, the likelihood and severity of adverse outcomes can be reduced through appropriate risk management. For risk analysis during dynamic incidents to align to ISO31000 [1], both qualitative and quantitative components are arguably required [2]. Reviews of historical injury data may provide quantitative probabilities pertaining to the effectiveness of certain personal protective equipment in reducing firefighter injuries. At the same time, experience may provide ICs with valuable insight into qualitatively assessing the effectiveness of specific tactics in certain situations.
Greater understanding of both qualitative and quantitative risk assessment by ICs facilitates holistic risk management by ICs during dynamic incidents [2]. It also enables ICs to effectively and simply communicate risk treatment plans using bow tie analysis, as shown in Figure 1. In this manner, both pre-exposure and post-exposure controls or barriers can be implemented holistically to reduce the likelihood and severity of adverse consequences [18]. The bow tie analysis also facilitates the illustration of relationships between various barriers. Figure 1 provides a simple example of this in the firefighting context. Where a relationship exists between barriers, the influence of the preceding barrier may be either positive or negative on the effectiveness of the following barrier. For example, inappropriate or insufficient research and data may lead to an inappropriate organisational policy. This, in turn, can result in inappropriate training, which will ultimately weaken risk management at all operational and organisational levels. The combined effect of the barriers and intrinsic relationships can ultimately affect the severity of realised consequences.
Reviews of Australasian fire and emergency services literature and databases identified a knowledge gap surrounding IC risk attitudes and lack of suitable consequence data to support informed risk analysis during dynamic emergency operations. To address these issues, this research provides new qualitative and quantitative data to support ICs in how they manage risk in accordance with ISO31000 during dynamic fire and emergency situations.
The first study explored the understanding and application of ISO31000 risk management principles amongst current ICs. It serves to establish the internal context of risk management, risk attitudes, and thresholds of the study population. Serving as a baseline for a measure of ISO31000 compliance, the findings can be used to assist fire services in identifying opportunities to align departmental and operator beliefs, expectations, and processes related to risk management.
The second study establishes the likelihood and severity of firefighting consequences, both potential and realised. In the absence of previous analysis or study, the results establish quantitative data which allow enhanced risk analysis and facilitate targeted interventions on both sides of the ‘firefighting bow-tie’. The scope of the study is not to report on interventions but, for the first time, to provide quantitative risk analysis and data in order to facilitate enhanced ISO31000 compliant risk management within Australasian fire services.
2. Study 1—Defining Risk Attitudes and Thresholds
2.1. Methodology
The research was conducted in two phases: (1) Semistructured interviews and (2) subsequent in-depth structured surveys. This enabled exploration and documentation of the beliefs, understanding, and attitudes of fire and emergency service ICs. Phase one involved ethnographic qualitative interactive observation of 20 current serving professional fire and emergency service ICs over a three-month period. All participants were experienced ICs with a minimum of seven years operational experience across all fire service hazards, including but not limited to structure fire, bushfire, hazardous materials, road crash, and other rescue response. Semistructured interviews and subsequent in-depth structured surveys designed to identify the individual’s risk attitudes and beliefs were completed by all participants. Analysis was completed using Microsoft Excel. The participation of one candidate was interrupted by an incident call out, resulting in 19 interviews and surveys being available for analysis. These represented 7% of the overall officer population from a Western Australian career fire service background. Ethics approval for the study was provided by the author’s affiliate university human ethics committee, and all participants provided a statement of informed consent to participate in the research. Department of Fire and Emergency Services (DFES) permission for the study was provided by then-Commissioner Wayne Gregson APM.
2.2. Results and Discussion
2.2.1. Phase 1: Semistructured Interviews
The semistructured interview comprised the following questions:
- How do you define risk?
- How do you manage risk in a dynamic emergency environment compared to other situations and contexts?
- How do you decide whether risks are acceptable in a dynamic emergency environment?
- Does the risk management process differ in the dynamic emergency environment compared to other situations? If yes, then how?
The first question asked of participants in the semistructured interview was “How do you define risk?” Whilst all participant responses acknowledged that risk is a consideration of consequences and likelihood, only one participant provided the answer “it is the effect of uncertainty on objectives” as defined in ISO31000. Approximately a quarter of participants (26%) provided answers that were specific to emergency response without consideration of the greater application of risk, and only one participant provided the restrictive definition “risk is the potential to injure me”. Consistent with the findings of Tissington and Flin [19] and Reinhardt-Klein [20], these answers suggest fire and emergency service ICs generally have a perception of risk as the practical consideration of consequence and likelihood as it applies to a reactive emergency environment, rather than as a considered and managed process consistent with ISO31000.
The second question asked of participants was “How do you manage risk in a dynamic emergency environment compared to other situations and contexts?” In response, nearly all participants identified that risk management in dynamic contexts was based on a similar process to risk management in other situations, but with limited information available and with restricted time frames in which to make decisions. Ten percent of participants expressed the opinion that dynamic risk management required more “forward thinking” than risk management in other situations. These responses again suggest the study group has adopted a definition of risk that is reasonably consistent throughout their population and contextualised to their perception of reality but does not consider all elements detailed in ISO31000; especially when consideration is given to the example of the special forces soldier in a hostage situation provided in SAHB436.
More than half of participants (58%) also expressed that they managed risk in dynamic emergency environments according to how they believed their organisation expected them to do so, or that they managed risk in accordance with organisational procedures and protocols. This suggests the majority of fire and emergency service ICs believed they managed risk using the same risk attitudes as their organisation. This was despite a review of the literature identifying an absence of organisational risk thresholds and attitudes specific to dynamic emergency response environments.
Responses from the study group to the third question “How do you decide whether risks are acceptable in a dynamic emergency environment?” were varied. A quarter of participants (26%) reported they relied on organisational procedures and protocols; almost half of participants (47%) reported they relied on personal prior experience to determine whether risks were acceptable; 16% of participants stated they simply relied on whether they believed the risk was acceptable to themselves personally; and 10% of participants responded that in the case of “life involvement” (being the fire services terminology for when potential consequences include the loss of occupant life), all risks are acceptable. The variation in answers provided by fire and emergency service ICs represents significant variance in the risk thresholds between ICs within the same organisation. Conflicts between risk attitudes will foreseeably lead to increased risk at an emergency incident because additional uncertainty is introduced when individuals work together to form incident management teams or when they are responsible for different sectors within the same emergency incident. When the answers provided by participants to question three are considered in conjunction with the answers provided by participants to question two, the variance in risk thresholds between participants suggests an absence of a defined organisational internal risk context that may otherwise guide participants towards similar answers. This notion is consistent with Fender [21] and reinforces the conclusion that, for risk management to be compliant with ISO31000, it must be ingrained as part of the core culture of the fire service inclusive of explicitly defined risk tolerances.
The final question posed to fire and emergency service ICs was “Does the risk management process differ in the dynamic emergency environment compared to other situations? If yes, then how?” Responses provided by participants were far less varied than the responses to question three. Forty-two percent of participants stated there was no difference in the process; however, half of these participants also stated the time frame available for completing the risk assessment was significantly reduced during dynamic emergency environments. Interestingly, one participant also stated that risk tolerance is significantly higher during dynamic emergency operations compared to other situations, which suggests fluctuating risk thresholds depending on the participant’s evolving perception of the severity of an incident. In addition, only one participant identified that the risk management process had to be repeated multiple times throughout an emergency incident, suggesting the remaining participants did not consider repeated risk application of the risk management process necessary.
More than half of participants (53%) stated that the risk management process did differ in the dynamic emergency environment compared to other situations. These participants all identified that the process changed due to a significant reduction in both the available information on which to make decisions, and the available time to gather further information. One participant clarified their response by adding they felt “pushed to do things you wouldn’t normally do due to expectations and pressure”. This indicated they operated at risk thresholds they personally felt were unacceptable. Only one participant stated the dynamic risk management process was reactive as opposed to being a thought out process.
These findings appear to contradict the previous findings of Ash and Smallman [7], Fender [21], and Naikar [22], all of whom identified decision making during dynamic emergency incidents to be reactive and based on recognition of specific cues. Whilst the finding from the study reported may be interpreted with some caution, due to the moderate sample size, the finding is supported by the answers provided by the fire and emergency service ICs to the second question posed in the interview. One participant stated they were unsure whether the risk management process differed in the dynamic emergency environment compared to other situations.
2.2.2. Phase 2: Structured Survey
The first question in the structured survey relating to risk perceptions required participants to identify the severity of potential consequence for 20 outcomes that may occur during fire and emergency incidents. From the answers provided, probability analysis was completed across the entire sample population. Conditional probability was then calculated on the basis that participants had, or had not, been previously injured at an incident. Nine participant fire and emergency service ICs had been injured at an incident and 10 had not been injured at an incident, and these results were compared to the severity assigned to the consequence in fire and emergency services risk literature. Full results are provided in Table A1 in Appendix. Analysis of the results revealed there was a conditional probability of 0.00 (zero) for all fire and emergency service ICs assigning the same severity to a consequence given the event being realised. Only in a single instance did a subgroup completely agree on the severity of a consequence. This was the non-injured group agreeing that the death of a rescuer was of catastrophic severity (represented by a conditional probability of 1.00).
Further analysis revealed there was an equal probability between the group that had never been injured, with a conditional probability of 0.2 that the survey groups’ perception of consequence severity would align with the severity adopted by fire and emergency services. Whilst some variance may be expected due to potential differences in individuals’ perception of the consequence realised, a conditional probability of 0.2 signifies agreement between participants and fire and emergency services in the perception of consequence severity of only a single occurrence each year. It is therefore concluded that the internal context of risk attitudes is not harmonious amongst fire and emergency service ICs and may lead to conflicting risk management during dynamic emergency situations or post-incident analysis. Descriptive analysis of the results identified a mean probability of 0.612 (standard deviation of 0.142) that the entire survey group would agree on the severity of any given consequence. This further supports the findings of the potential for conflicting risk attitudes between ICs and parties conducting post-incident analysis.
An individual’s beliefs and expectations can significantly affect the internal context of the risk management process [6]. To investigate how this may be a factor in risk management during dynamic emergency operations, the second question of the survey required participants to state their agreement to four statements regarding external and personal risk attitudes and expectations using a Likert scale. The statements were:
- There is an expectation that emergency services personnel will risk their own lives to save others.
- There is an expectation that emergency services personnel will risk their own lives to save property.
- There is an expectation that emergency services personnel will risk their own lives to save the environment.
- Emergency services personnel have a moral obligation to put themselves at a higher level of risk than the general public in the course of their duties.
Full results are provided in Table A2 in Appendix. Analysis of these results reveals that the overwhelming majority of the entire study group (74%), as well as the both subgroups (injured 77% and never injured 70%), believed there were external expectations that emergency services personnel would risk their own lives to save others. By comparison, only 52% of the entire study group, 78% of the injured subgroup, and 30% of the never injured subgroup believed there were external expectations that emergency services personnel would risk their own lives to save property. This difference in attitudes between the injured and never injured populations appears to suggest personnel who had a higher personal risk threshold may be more likely to be injured during emergency operations; however, further research is required to confirm this hypothesis.
Analysis of the responses to the statement “There is an expectation that emergency services personnel will risk their own lives to save the environment” was less conclusive but appeared to suggest a less strongly held belief amongst the study group of fire and emergency service ICs that this was the case (37% of the total study group stating they either disagreed or strongly disagreed with the statement).
To further define the risk attitudes and tolerance of the study group, participants were required to identify whether potential scenarios were either acceptable or unacceptable when the probability of realisation of the consequence was low, moderate, and high. Participants were required to answer the question in two contexts: First, that they were personally exposed to the risk source and, second, that they were responsible for other responders and it was these other responders who were exposed to the risk source. The scenarios presented were:
- Entering a burning building to rescue a person where the consequence is being severely injured or killed.
- Rescuing a person from a vehicle where the consequence is being exposed to dust that may cause immediate lung damage.
- Entering a toxic smoke plume to rescue a person where the consequence is developing cancer.
- Rescuing a person from a vehicle where the consequence is being exposed to dust that may cause long term lung damage.
- Entering a burning building to rescue a child where the consequence is being severely injured or killed.
- Entering a burning building to rescue a colleague where the consequence is being severely injured or killed.
- Entering a burning building to save the property where the consequence is being severely injured or killed.
Full results are provided in Table A3 in Appendix. Analysis of results revealed a probability of certainty (where probability equals 1.00) amongst the study group of only 0.143. This means there was a probability of 0.857 that participants did not collectively agree on risk tolerance attitudes or thresholds. Further analysis revealed a probability of only 0.286 that all participants shared the same risk tolerance across the presented scenarios. This probability increased to 0.381 amongst the “injured” population, whilst there was no change in the probability of agreeance amongst the “never injured” population compared to all participants. One potential explanation for the increased consensus of risk acceptance amongst the “injured” population may be that those participants who had been previously injured held a higher risk tolerance and therefore were more likely to undertake hazardous tasks that may result in injury compared to the “never injured” group.
Risk acceptance with limited certainty was also higher for the entire study population and both injured and never injured subpopulations where life involvement was present. Participants would typically put both their own safety and the safety of personnel under their command at increased risk to facilitate occupant rescue (from all risk sources). This risk acceptance with limited certainty increased marginally where rescue was of a colleague, particularly when risk was transferred from the participant to those under the participant’s control. Marginal increase in risk threshold was observed between personal and personnel exposure where rescue involved a child compared to an adult. It is hypothesised that this increase may be a consequence of perceived community expectations and/or due to an innate willingness to permit great risk to save a child. Further investigation is required to explore this hypothesis.
Risk acceptance with limited certainty declined quickly for the protection of property, whilst the level of certainty decreased as the lead time to the realisation of potential consequences increased. For example, the certainty regarding risk acceptance involving immediate impacts, such as trauma, was generally higher compared to those involving delayed impacts, such as cancer or lung disease. This suggest participants were more likely to be concerned with impacts they can witness immediately and is supported by the findings of Penney [23].
Descriptive analysis of the results identified a mean probability of 0.529 (standard deviation of 0.336) that the entire survey group would agree on the acceptability of any given situation where the risk was personal in nature. By comparison, a mean probability of 0.449 (standard deviation of 0.321) was found that the entire survey group would agree on the acceptability of any given situation where the risk was to personnel under the participant’s command. This further supports the findings that participants were more likely to accept risk when they believed the consequences were limited to themselves.
2.3. Limitations
One limitation of the study was potential reluctance of participants to provide answers, beliefs or attitudes that they felt may not be viewed favourably. Reluctance to participate within this study on the grounds was addressed through a reassurance of the anonymity of all data collected. Despite this reassurance, some potential participants elected not to participate. This may have resulted in some bias when defining the internal context of the organisation. Repetition of this study incorporating the entire population of ICs within the fire service would allow greater analysis of current risk attitudes and may serve to enhance the definition of the internal fire service context.
Only a single emergency service was examined in this study. The internal contexts between different emergency services within the same state and the same emergency service in different states will inevitably vary to some degree. The results of this study are directly applicable to risk management during dynamic emergency incidents within the fire service examined but do not necessarily represent the internal contexts of emergency services in other jurisdictions. Comparable studies in other emergency services throughout Australia will facilitate critical analysis of the validity of the findings of this study throughout the Australian context. It would also significantly enhance the priors available for analysis of conditional probability, which in turn would enhance the validity of findings.
3. Study 2—Probabilistic Injury Analysis
3.1. Methodology
A retrospective analysis of Western Australian fire service safety and incident reports between January 1st, 2001 and January 1st, 2015 was conducted. All of these reports related to incidents responded to by frontline operational fire and emergency services. All information that could identify personnel was redacted prior to collection by the lead investigator. A total of 1997 individual reports were initially analysed. Ethics approval was obtained through Edith Cowan University postgraduate research services, whilst Department of Fire and Emergency Services (DFES) permission for the study was provided by then-Commissioner Wayne Gregson APM. To ensure data reflected injuries sustained during operational events, the following inclusion criteria were applied:
- Event must relate to a specific operational incident; and
- An injury must have occurred or the potential for injury must be identified.
For the purposes of this study, “injury” was defined as any adverse outcome that was physical or psychological in nature. The term “operational incident” was defined as an incident assigned an internal incident identification number and responded to by personnel. Following application of the inclusion criteria, 666 reports were identified as suitable for analysis. Data were initially categorised according to:
- Activity (being the primary task undertaken at the time of the reported incident);
- Initiating event (being the risk source);
- Nature of the injury reported;
- Actual severity of the consequence reported; and
- Potential severity of the consequence reported.
The severity of the consequence was extrapolated from the report description and classified according to Department of Fire and Emergency Services policy [3]:
- Insignificant—no treatment required; no lost time;
- Minor—first aid treatment only; no lost time;
- Moderate—medical treatment; lost time—less than 10 days lost;
- Major—hospitalisation/significant injury; lost time—more than 10 days lost; and
- Catastrophic—severe permanent injury/disability/fatality(ies).
The potential severity of the consequence was determined by selecting the highest consequence from both the reports collected and review of comparative incident reports from the Federal Emergency Management Agency [17]. The same categories of consequence were applied as above.
Activity at the time of injury and nature of the injury sustained was extrapolated from the incident reports to facilitate probability modelling; determination of severity of the actual and potential consequence; and calculation of incident likelihood. Likelihood was determined using the formula:
Likelihood was defined in accordance with DFES policy [3]:
- Rare—may only occur in exceptional circumstances (once in 10 years);
- Unlikely—could occur at some time (once in 5 years);
- Moderate—should occur sometime (once in 2 years);
- Likely—will probably occur in most circumstances (at least once per year); and
- Almost certain—expected to occur in most circumstances (more than once per year).
For illustrative purposes utilising notional figures, if there were 18 reported ankle injuries over the 15-year period, the frequency of ankle injury would be 18/15 or 1.20 ankle injuries per year, equating to a likelihood rating of almost certain. If there were only two reported ankle injuries over the same time period, then the frequency would be 2/15 or 0.13 ankle injuries per year, equating to a likelihood rating of rare.
Data relating to the type of activity undertaken at the time of injury and the nature of the injury sustained were analysed using Bayesian statistics to determine the overall and conditional probability of specific injuries being sustained during the various tasks undertaken during an emergency incident. In this manner, the overall probability of specific outcomes was determined using the formula:
where:
- P(A∩B) is the probability that both A and B occur;
- P(A) is the probability that A will occur; and
- P(B) is the probability that B will occur.
Conditional probability was calculated by:
where:
- P(A|B) is the probability that A will occur given the fact that B has already occurred;
- P(A∩B) is the probability that both A and B occur; and
- P(B) is the probability that B will occur.
For illustrative purposes utilising notional figures, subsequently referred to as Scenario A, if there were 11 reported ankle injuries out of 666 total reported injuries across all incidents, then the probability of an ankle injury (A) is 0.017. If there were 36 injuries reported to have occurred during a rescue operation, then the probability of an injury being sustained during a rescue operation (B) is 0.054. Therefore, the probability of an ankle injury occurring during rescue operation is sustained is:
By comparison and using the same notional figures, the conditional probability (P(A|B)) of an ankle injury being sustained, given an injury is sustained during a rescue operation, is 0.306.
The analysis was repeated for each activity, risk source, and injury to determine the conditional probability of:
- A specific injury being sustained (A) given an injury is sustained during a certain task at an incident (B);
- A certain consequence severity occurring based on historical data (A) given an injury is sustained during a certain task at an incident (B); and
- A certain potential consequence was possible (A) given an injury sustained during a certain task at an incident (B).
3.2. Results and Discussion
Using Excel spreadsheets, analysis enabled the calculation of conditional probability given a reportable incident occurs, and likelihood on the basis of activity, risk source, and nature of injury reported. Whilst full results are provided as an Appendix to this report, the five most likely results are detailed in Table 1, Table 2 and Table 3. Each table is ordered from highest to lowest frequency.
By frequency, firefighting was almost three times more likely to result in a reportable event compared to any other activity with an occurrence of 21.8 times per year. Road crash rescue (RCR) response resulted in 7.3 reportable events per year, whilst bushfire fighting resulted in 6.6 reportable incidents per year. This result suggests additional attention should be provided in training personnel and developing suitable risk mitigation procedures for the activities most likely to give rise to a reportable incident, for example, firefighting, RCR, and bush firefighting.
In terms of risk source, physical strain is almost 1.8 times more likely to result in a reportable event compared to other risk sources. This is consistent with the physically demanding nature of firefighting [24] and is comparable to overexertion/strain injury rates in United States firefighters [17].
Exposure to various hazards, including asbestos, chemicals, and biohazards, collectively accounts for more reports than any other risk source (total of 225 incidents with a conditional probability of 0.338).
Just as firefighting is extremely physically demanding, it is also psychologically demanding with exposure to psychological trauma or stress identified as the second most common risk source resulting in reportable events. Carll [25] and Trappler [26] concur that care must be taken in addressing risks arising from exposures of a psychological nature in firefighting which are unique to the emergency service profession. Just as education, awareness, and resilience training is important prior to exposure to events of a psychological nature, specific psychological management programs and counselling are required post-exposure.
Analysis by injury yields results that, in limited circumstances, appear to conflict with other available data sets. Inhalation ‘injuries’ are the most probable of all classified injuries to occur. However, this may be explained by the fact that all reported incidences of “inhalation” of smoke or other chemicals were captured in this category, regardless of whether acute injury occurred. Psychological ‘injuries’ were the second most common reported injury, and this is consistent with the analysis of risk source data. Surprisingly, thermal injuries, being those resulting from heat transfer, were the least probable (0.002 conditional probability). This conflicts with data reported by FEMA [16,17] which identify a significantly higher thermal injury occurrence rate. The number of thermal injuries reported in this study may be lower than the true number of injuries because many incidents may remain unreported. The probability of “nil” injuries occurring represents “near misses” where no injury was actually sustained and is the third highest amongst reported injuries sustained. Again, this figure may be lower than the true number of near misses that occur during incidents because of a lack of report completion when near misses occur.
Table 4 reports the conditional probability of a specific injury occurring given an injury occurs during the specified activity. The five most likely injuries for each activity are identified in the table. Across all activities, the “nil” injury or “near miss” is prevalent. This is consistent with previous findings and suggests a large number of incidents occur with the potential to cause injury but do not actually cause injury in the specific case reported. Psychological injuries are also well represented throughout the reports, particularly where the potential or realisation of human trauma is present (for instance road crash rescue and suicide response). In the case of reported injuries during suicide response, it is suggested it is likely the “not reported” values should also be psychological injuries even though they have not been documented as such in the relevant reports.
Analysis reveals thermal injuries account for a relatively insignificant conditional probability of only 0.003 during firefighting activities only. No thermal burns are reported during bushfire or other responses. This is in stark contradiction to the probability of thermal injuries reported in United States statistics [16,17]. However, it is hypothesised that this may be due to underreporting of thermal injuries, or due to thermal injuries being referred to as injuries to specific body parts without reference to the burn trauma, or due to differences in firefighting tactics between Australia and the United States, which may result in different mechanisms and frequencies of injury.
For example, inhalation injuries appear overrepresented in the data, which is considered surprising given the significant respiratory protection available to responding crews [27,28]. Analysis of descriptions with the reports suggests a significant proportion of inhalation exposures may be due to partial face-fitting respiratory protection masks that do not completely prevent ingress of smoke and other products of combustion. This has been rectified since the study commenced, through the implementation of full-face respirators available for firefighting personnel. The conditional probability of heat illness occurrence also warrants attention with prevalence amongst all operations and responses that require the responder to wear structural firefighting personal protective equipment (PPE). Wearing PPE requires significant physical effort.
Review of the conditional probabilities detailed above should assist ICs having enhanced evidence-based awareness of potential consequences and likelihoods prior to their occurrence during an emergency incident. Analysis of the conditional probability of injury given an injury occurs during each of the specific operations will also facilitate the review and improvement of strategic and tactical planning; personnel relief requirements; the potential effectiveness of PPE; and even guide the potential development of targeted prophylactic physical training programs.
Table 5 provides useful data to facilitate the development of evidence-based risk mitigation strategies prior to and on the incident ground. The five most likely injuries are identified in the table. Physical strain recurrently accounts for high, if not the highest, level of risk source, giving rise to a reportable incident across almost all activities. This finding is consistent with the previous results of both this study and that of FEMA [16] and reaffirms the notion that firefighting is extremely physical in nature [24]. It is suggested that a lack of physical wellness may be the primary contributor to reportable incidents as a result of physical strain. For example, Moore-Merrell et al. [29] reported that physical strain was the second highest contributing factor to firefighter injury in the United States (the first being a lack of situational awareness).
Psychological exposure was also well represented in the data, particularly amongst incident response involving human life and trauma including road crash rescue and suicide response. This again supports previous findings of the study.
Exposure to various contaminants was also prevalent throughout the majority of fields. This may be significant as potential effects may be mitigated through appropriate strategic and tactical response; appropriate PPE; and suitable decontamination procedures [23,27,28].
Breathing apparatus operations are amongst the most hazardous of all firefighting activities. These operations involve the use of self-contained breathing apparatus in atmospheres not conducive to life due to the presence of smoke, heat, oxygen deficiency, and/or excessive temperature [27]. During breathing apparatus operations, teams of two firefighters will work in close proximity to, or inside, burning structures. Typically, they rely on a single line of firefighting hose for fire protection. The margin for error is therefore understandably narrow and the severity of potential consequences comparatively high (as reported in Table 6). Breathing apparatus operations are extremely physical in nature, and this is represented by a conditional probability of 0.55 that the responsible risk source for the reportable event will be physical strain. Analysis also revealed a conditional probability of impacts being the responsible risk source for the reportable incident of 0.15. It is suggested impacts (as compared with explosion/blasts) are more likely to occur within a burning structure. Subsequently, this figure may be reduced through the defining of organisational risk acceptance thresholds. In turn, this would facilitate a reduction in the potential for ICs committing crews to internal firefighting in the absence of life involvement because of a perceived internal or external obligation to do so.
Table 6 provides the comparisons between actual reported consequence severity and potential consequence severity for each activity. The five most likely injuries are identified in the table. Analysis reveals the conditional probability of moderate to catastrophic potential consequence severity is higher than actual reported consequence severity across all activity groups. In part, this may be explained by the lack of subsequent reports or follow-up detail for consequences that may have a long period of latency (for instance, psychological exposures, or exposures to contaminants), or for injuries that are initially reported but worsen over time. Results of this analysis also support previous findings of the prevalence of “nil” reported injuries in that there is a high conditional probability of “near misses” within the incidents reported.
Further analysis reveals that, based on actual consequence severity, there was a conditional probability of zero (0.000) for a consequence of catastrophic severity occurring across the entire activity range. This result is not consistent with numerous international studies [16,17,29] and, whilst acknowledging the differences in incidents responded to in different jurisdictions, this result potentially suggests Western Australian firefighting strategies are safer than those utilised by international counterparts. By comparison, a mean potential consequence of catastrophic severity revealed a conditional probability across all activities of 0.408 (standard deviation of 0.328). These results represent a significant potential for increased severe injury, permanent disability, and even death amongst the study group and should be considered in the establishment of the internal context for risk management during dynamic emergency operations.
3.3. Limitations
Results must be interpreted with some caution. It is suggested current recording processes do not provide sufficient data to accurately determine the realisation of injury or illness with extended latency (psychological trauma for instance). It is also suggested limited skewing of data may have occurred as a consequence of increased hazard reports being lodged by personnel following departmental safety awareness campaigns on ‘topical issues’ such as asbestos exposure or critical incident (psychological) exposures. Current recording processes also do not provide capacity to record accumulation injuries occurring as a result of repetitious exposure. Instead injuries are assigned to a single event. Despite this limitation, it is almost certain a reportable event will occur during the majority of types of incident response. This supports the notion that firefighting is an inherently dangerous occupation.
Another limitation for interpreting some results from this study is the reliance on United States statistics on which to make comparison to the injury data obtained because firefighting tactics may vary between Australian and North American services. Australian tactics, particularly in the structural fire setting, may be more closely aligned with United Kingdom fire services. However, available data for comparison in Australia were not found because records did not identify type of injury or activity at time of injury.
4. Conclusions
In the absence of any similar studies within Australasian fire services, this research provides important qualitative and quantitative data that can be used to improve risk management during dynamic emergency operations. When considered together with literature reviewed, the results of the first study explicitly reject any notion of the validity of “dynamic risk management” being a stand-alone process for managing risk during emergency situations. For best practice to be realised, the architectural structure or process of risk management as defined in ISO31000 cannot change. The context in which risk management is completed may vary in dynamic emergency situations compared to that of corporate boardrooms; however, it is this unique and dynamic context of emergency situations that only further requires the risk management process to be completed in its entirety each and every time risk is assessed and subsequently managed.
In order to achieve this, emergency services must first succinctly define their organisational risk attitudes during emergency situations (which will inevitably vary from risk attitudes during normal business) and educate their personnel appropriately so that it forms part of the subconscious and conscious incident risk management process. This research also suggests fire and emergency services need to have defined risk acceptance criteria for ICs to reference in order to reduce the potential for individual bias or conflicting operational strategies between ICs at strategic levels and officers involved in tactical frontline response.
The second study provides firefighting consequence and likelihood data that are essential to evidence-based quantitative risk analysis and which have been not previously available to Australasian fire services. The study identified recurrent heat illness and critical incident related risk trends across all activity groups. These trends are significant because they are associated with greater potential for serious consequences of hospitalisation or long-term disability compared to less severe, but more frequently occurring, physical strain related injuries. During almost all types of operational response, the potential for major or catastrophic adverse outcomes is present. The potential consequence is consistently greater than the actual consequence realised in the data analysed. This may be explained by the mitigating effects of post-event barriers (PPE, physical conditioning of personnel, etc.), or simply the personnel involved escaped more serious injury due to a combination of events that led to them being close to the impact, as opposed to being in the direct line of impact. In light of this finding, it is important that ICs and operational personnel remain vigilant to the potentially ‘normalising’ effect of recurrent exposure to potentially catastrophic, albeit low-frequency, situations. Failure to do so may expose personnel to harm as well as ICs and fire services to external criticism. To address this, it is suggested fires services not only invest in a well-defined and meaningful risk management doctrine but ensure risk management is indoctrinated into all operational personnel from the start of their career.
Exposure to various contaminants is prevalent across all activity groups. This is consistent with the nature of firefighters responding to a large range of firefighting, rescue and hazardous materials incidents. As the specific nature of contamination and/or product identification often remains undocumented, few beneficial conclusions can be drawn from the study data in this area. An opportunity for future study in this area exists once suitable data are collected. Through further analysis of these trends along with other data provided in this study, it will be possible to enhance targeted interventions at both an organisational and personal level during and post-emergency operations by IC’s and support personnel as part of the risk management process.
Funding
This research received no external funding.
Acknowledgments
This research is dedicated to my fellow firefighters. It would not have been possible without the support of Commissioner Wayne Gregson APSM (retired) of the Department of Fire and Emergency Services of Western Australia. A/Assistant Commissioner Rick Curtis’ supervision and guidance was also instrumental to the study and is gratefully acknowledged. The support and guidance by Peter Jernakoff of Corporate Governance Risk is also sincerely appreciated.
Conflicts of Interest
The author declare no conflict of interest.
Appendix A. Complete Tables

Table A1.
Consequence severity across the entire sample and the injured/never been injured subgroups.
Table A1.
Consequence severity across the entire sample and the injured/never been injured subgroups.
| Rating | Insignificant | Minor | Moderate | Major | Catastrophic | |||||||||||
|---|---|---|---|---|---|---|---|---|---|---|---|---|---|---|---|---|
| Group | A | B | C | A | B | C | A | B | C | A | B | C | A | B | C | |
| Consequence | ||||||||||||||||
| 1 | 0.42 | 0.44 | 0.40 | 0.53 | 0.44 | 0.60 | 0.05 | 0.11 | 0.00 | 0.00 | 0.00 | 0.00 | 0.00 | 0.00 | 0.00 | |
| 2 | 0.05 | 0.00 | 0.10 | 0.21 | 0.22 | 0.20 | 0.58 | 0.56 | 0.60 | 0.16 | 0.22 | 0.10 | 0.00 | 0.00 | 0.00 | |
| 3 | 0.00 | 0.00 | 0.00 | 0.00 | 0.00 | 0.00 | 0.11 | 0.00 | 0.20 | 0.42 | 0.44 | 0.40 | 0.47 | 0.56 | 0.40 | |
| 4 | 0.00 | 0.00 | 0.00 | 0.05 | 0.00 | 0.10 | 0.11 | 0.00 | 0.20 | 0.63 | 0.78 | 0.50 | 0.21 | 0.22 | 0.20 | |
| 5 | 0.00 | 0.00 | 0.00 | 0.05 | 0.00 | 0.10 | 0.26 | 0.00 | 0.50 | 0.47 | 0.78 | 0.20 | 0.21 | 0.22 | 0.20 | |
| 6 | 0.26 | 0.22 | 0.30 | 0.68 | 0.67 | 0.70 | 0.05 | 0.11 | 0.00 | 0.00 | 0.00 | 0.00 | 0.00 | 0.00 | 0.00 | |
| 7 | 0.11 | 0.00 | 0.20 | 0.83 | 0.88 | 0.80 | 0.06 | 0.13 | 0.00 | 0.00 | 0.00 | 0.00 | 0.00 | 0.00 | 0.00 | |
| 8 | 0.00 | 0.00 | 0.00 | 0.11 | 0.00 | 0.20 | 0.68 | 0.67 | 0.70 | 0.21 | 0.33 | 0.10 | 0.00 | 0.00 | 0.00 | |
| 9 | 0.00 | 0.00 | 0.00 | 0.00 | 0.00 | 0.00 | 0.00 | 0.00 | 0.00 | 0.05 | 0.11 | 0.00 | 0.95 | 0.89 | 1.00 | |
| 10 | 0.00 | 0.00 | 0.00 | 0.00 | 0.00 | 0.00 | 0.00 | 0.00 | 0.00 | 0.63 | 0.56 | 0.70 | 0.37 | 0.44 | 0.30 | |
| 11 | 0.00 | 0.00 | 0.00 | 0.00 | 0.00 | 0.00 | 0.11 | 0.00 | 0.20 | 0.42 | 0.44 | 0.40 | 0.47 | 0.56 | 0.40 | |
| 12 | 0.00 | 0.00 | 0.00 | 0.00 | 0.00 | 0.00 | 0.06 | 0.00 | 0.10 | 0.61 | 0.67 | 0.50 | 0.33 | 0.33 | 0.40 | |
| 13 | 0.00 | 0.00 | 0.00 | 0.00 | 0.00 | 0.00 | 0.26 | 0.11 | 0.40 | 0.63 | 0.78 | 0.60 | 0.11 | 0.11 | 0.00 | |
| 14 | 0.00 | 0.00 | 0.00 | 0.06 | 0.00 | 0.11 | 0.17 | 0.11 | 0.22 | 0.72 | 0.78 | 0.67 | 0.06 | 0.11 | 0.00 | |
| 15 | 0.05 | 0.00 | 0.10 | 0.79 | 0.89 | 0.70 | 0.16 | 0.11 | 0.20 | 0.00 | 0.00 | 0.00 | 0.00 | 0.00 | 0.00 | |
| 16 | 0.00 | 0.00 | 0.00 | 0.42 | 0.44 | 0.40 | 0.42 | 0.56 | 0.30 | 0.16 | 0.00 | 0.30 | 0.00 | 0.00 | 0.00 | |
| 17 | 0.05 | 0.00 | 0.10 | 0.68 | 0.44 | 0.90 | 0.26 | 0.56 | 0.00 | 0.00 | 0.00 | 0.00 | 0.00 | 0.00 | 0.00 | |
| 18 | 0.00 | 0.00 | 0.00 | 0.05 | 0.00 | 0.10 | 0.42 | 0.33 | 0.50 | 0.37 | 0.44 | 0.30 | 0.16 | 0.22 | 0.10 | |
| 19 | 0.00 | 0.00 | 0.00 | 0.00 | 0.00 | 0.00 | 0.37 | 0.22 | 0.50 | 0.58 | 0.78 | 0.40 | 0.05 | 0.00 | 0.10 | |
| 20 | 0.00 | 0.00 | 0.00 | 0.00 | 0.00 | 0.00 | 0.00 | 0.00 | 0.00 | 0.53 | 0.44 | 0.60 | 0.47 | 0.56 | 0.40 | |
Consequences:
- Near miss—cut finger
- Near miss—broken arm
- Near miss—death of rescuer
- Near miss—exposure to acutely toxic material
- Near miss—exposure to hazardous material with health effects that may take 20 years to occur
- Scratch or dent to a vehicle
- Cut finger requiring first aid treatment
- Broken arm requiring hospitalization
- Death of a rescuer
- Exposure to acutely toxic hazardous material requiring hospital admission
- Exposure to hazardous material that results in lung damage only evident 20 years post-exposure
- Inhaling asbestos particulates and dust as a result of rescue activities
- Exposure to silica particulates and dust as a result of rescue activities
- Exposure to glass particulates and dusts as a result of rescue activities
- Damage to a vehicle resulting in $1000 damage
- Damage to a vehicle resulting in $20,000 damage
- Damage to the environment that does not result in long term impact
- Damage to the environment resulting in long term impact
- Lung tissue damage without respiratory impairment
- Lung tissue damage that limits physical activity
Group:
- Total study population
- Subgroup: Study population that had been injured during emergency response whilst working under a different incident controller
- Subgroup: Study population that had never been injured during emergency response whilst working under a different incident controller
Table A2.
Incident controller perceptions and expectations across the entire sample and the injured/never been injured subgroups.
Table A2.
Incident controller perceptions and expectations across the entire sample and the injured/never been injured subgroups.
| Response | Strongly Disagree | Disagree | Neutral | Agree | Strongly Agree | |||||||||||
|---|---|---|---|---|---|---|---|---|---|---|---|---|---|---|---|---|
| Group | A | B | C | A | B | C | A | B | C | A | B | C | A | B | C | |
| Belief | ||||||||||||||||
| 1 | 0.11 | 0.11 | 0.1 | 0.11 | 0.00 | 0.2 | 0.05 | 0.11 | 0.00 | 0.53 | 0.44 | 0.60 | 0.21 | 0.33 | 0.10 | |
| 2 | 0.16 | 0.11 | 0.20 | 0.11 | 0.00 | 0.20 | 0.21 | 0.11 | 0.30 | 0.47 | 0.67 | 0.30 | 0.05 | 0.11 | 0.00 | |
| 3 | 0.21 | 0.11 | 0.30 | 0.16 | 0.11 | 0.20 | 0.37 | 0.56 | 0.20 | 0.26 | 0.22 | 0.30 | 0.00 | 0.00 | 0.00 | |
| 4 | 0.05 | 0.00 | 0.10 | 0.16 | 0.11 | 0.20 | 0.05 | 0.11 | 0.00 | 0.68 | 0.67 | 0.70 | 0.05 | 0.11 | 0.00 | |
Beliefs:
- There is an expectation that emergency services personnel will risk their own lives to save others.
- There is an expectation that emergency services personnel will risk their own lives to save property.
- There is an expectation that emergency services personnel will risk their own lives to save the environment.
- Emergency services personnel have a moral obligation to put themselves at a higher level of risk than the general public in the course of their duties.
Group:
- Total study population
- Subgroup: Study population that had been injured during emergency response whilst working under a different Incident Controller
- Subgroup: Study population that had never been injured during emergency response whilst working under a different Incident Controller
Table A3.
Risk tolerance to the participant themselves compared to those under their command.
| Risk to Participant Themselves | Risk to Personnel Under the Command of the Participant | ||||||||||||
|---|---|---|---|---|---|---|---|---|---|---|---|---|---|
| Risk Tolerance | Acceptable | Unacceptable | Acceptable | Unacceptable | |||||||||
| Group | A | B | C | A | B | C | A | B | C | A | B | C | |
| Context & Risk | |||||||||||||
| 1 | 1.00 | 1.00 | 1.00 | 0.00 | 0.00 | 0.00 | 1.00 | 1.00 | 1.00 | 0.00 | 0.00 | 0.00 | |
| 2 | 0.63 | 0.56 | 0.70 | 0.37 | 0.44 | 0.30 | 0.47 | 0.56 | 0.40 | 0.53 | 0.44 | 0.60 | |
| 3 | 0.16 | 0.00 | 0.30 | 0.84 | 1.00 | 0.70 | 0.05 | 0.00 | 0.10 | 0.95 | 1.00 | 0.90 | |
| 4 | 0.95 | 1.00 | 0.90 | 0.05 | 0.00 | 0.10 | 0.79 | 0.89 | 0.70 | 0.21 | 0.11 | 0.30 | |
| 5 | 0.47 | 0.56 | 0.40 | 0.53 | 0.44 | 0.60 | 0.32 | 0.33 | 0.30 | 0.68 | 0.67 | 0.70 | |
| 6 | 0.37 | 0.33 | 0.40 | 0.63 | 0.67 | 0.60 | 0.21 | 0.22 | 0.20 | 0.79 | 0.78 | 0.80 | |
| 7 | 0.58 | 0.56 | 0.60 | 0.42 | 0.44 | 0.40 | 0.63 | 0.78 | 0.50 | 0.37 | 0.22 | 0.50 | |
| 8 | 0.26 | 0.22 | 0.30 | 0.74 | 0.78 | 0.70 | 0.26 | 0.22 | 0.30 | 0.74 | 0.78 | 0.70 | |
| 9 | 0.16 | 0.11 | 0.20 | 0.84 | 0.89 | 0.80 | 0.26 | 0.22 | 0.20 | 0.74 | 0.78 | 0.80 | |
| 10 | 0.84 | 0.89 | 0.90 | 0.16 | 0.11 | 0.10 | 0.74 | 1.00 | 0.60 | 0.26 | 0.00 | 0.40 | |
| 11 | 0.32 | 0.22 | 0.40 | 0.68 | 0.78 | 0.60 | 0.26 | 0.22 | 0.30 | 0.74 | 0.78 | 0.70 | |
| 12 | 0.21 | 0.22 | 0.20 | 0.79 | 0.78 | 0.80 | 0.21 | 0.22 | 0.20 | 0.79 | 0.78 | 0.80 | |
| 13 | 1.00 | 1.00 | 1.00 | 0.00 | 0.00 | 0.00 | 1.00 | 1.00 | 1.00 | 0.00 | 0.00 | 0.00 | |
| 14 | 0.79 | 0.67 | 0.90 | 0.21 | 0.33 | 0.10 | 0.53 | 0.67 | 0.40 | 0.47 | 0.33 | 0.60 | |
| 15 | 0.21 | 0.11 | 0.30 | 0.79 | 0.89 | 0.70 | 0.11 | 0.11 | 0.10 | 0.89 | 0.89 | 0.90 | |
| 16 | 1.00 | 1.00 | 1.00 | 0.00 | 0.00 | 0.00 | 0.95 | 1.00 | 0.90 | 0.05 | 0.00 | 0.10 | |
| 17 | 0.79 | 0.67 | 0.90 | 0.21 | 0.33 | 0.10 | 0.63 | 0.78 | 0.50 | 0.37 | 0.22 | 0.50 | |
| 18 | 0.37 | 0.33 | 0.40 | 0.63 | 0.67 | 0.60 | 0.16 | 0.22 | 0.10 | 0.84 | 0.78 | 0.90 | |
| 19 | 0.84 | 0.78 | 0.90 | 0.16 | 0.22 | 0.10 | 0.68 | 0.67 | 0.70 | 0.32 | 0.33 | 0.30 | |
| 20 | 0.16 | 0.11 | 0.20 | 0.84 | 0.89 | 0.80 | 0.16 | 0.22 | 0.10 | 0.84 | 0.78 | 0.90 | |
| 21 | 0.00 | 0.00 | 0.00 | 1.00 | 1.00 | 1.00 | 0.00 | 0.00 | 0.00 | 1.00 | 1.00 | 1.00 | |
Context and Risk:
- Entering a burning building to rescue a person where there is a low probability of being severely injured or killed.
- Entering a burning building to rescue a person where there is a moderate probability of being severely injured or killed.
- Entering a burning building to rescue a person where there is a high probability of being severely injured or killed
- Rescuing a person from a vehicle where there is a low probability of being exposed to dust that may cause immediate lung damage.
- Rescuing a person from a vehicle where there is a moderate probability of being exposed to dust that may cause immediate lung damage.
- Rescuing a person from a vehicle where there is a high probability of being exposed to dust that may cause immediate lung damage.
- Entering a toxic smoke plume to rescue a person where there is a low probability of developing cancer.
- Entering a toxic smoke plume to rescue a person where there is a moderate probability of developing cancer.
- Entering a toxic smoke plume to rescue a person where there is a high probability of developing cancer.
- Rescuing a person from a vehicle where there is a low probability of being exposed to dust that may cause long term lung damage.
- Rescuing a person from a vehicle where there is a moderate probability of being exposed to dust that may cause long term lung damage.
- Rescuing a person from a vehicle where there is a high probability of being exposed to dust that may cause long term lung damage.
- Entering a burning building to rescue a child where there is a low probability of being severely injured or killed
- Entering a burning building to rescue a child where there is a moderate probability of being severely injured or killed.
- Entering a burning building to rescue a child where there is a high probability of being severely injured or killed.
- Entering a burning building to rescue a colleague where there is a low probability of being severely injured or killed.
- Entering a burning building to rescue a colleague where there is a moderate probability of being severely injured or killed.
- Entering a burning building to rescue a colleague where there is a high probability of being severely injured or killed.
- Entering a burning building to save the property where there is a low probability of being severely injured or killed.
- Entering a burning building to save the property where there is a moderate probability of being severely injured or killed.
- Entering a burning building to save the property where there is a high probability of being severely injured or killed.
Group:
- Total study population
- Subgroup: Study population that had been injured during emergency response whilst working under a different Incident Controller
- Subgroup: Study population that had never been injured during emergency response whilst working under a different Incident Controller
References
- International Organization for Standardization. ISO 31000:2018 Risk Management; ISO: Geneva, Switzerland, 2018. [Google Scholar]
- Penney, G. Dynamic Risk Management in Fire and Rescue Emergency Operations. Master’s Thesis, Edith Cowan University, Joondalup, Australia, 2016. Available online: http://ro.ecu.edu.au/cgi/viewcontent.cgi?article=2928&context=theses (accessed on 1 June 2016).
- DFES. Policy 14 Enterprise Risk Management; Department of Fire and Emergency Services: Perth, Australia, 2016.
- DFES. Station Officer—Incident Operations Course Manual; Department of Fire and Emergency Services: Perth, Australia, 2019.
- AFAC. A Risk Framework for Operational Risks Associated with Prescribed Burning; Report for National Burning Project—Subproject 3; Australasian Fire and Emergency Service Authorities Council Limited: Melbourne, Australia, 2016. [Google Scholar]
- SAI. Global SA/SNZ HB436:2013 Risk Management Guidelines—Companion to AS/NZS ISO 31000; Standards Australia: Sydney, Australia, 2013. [Google Scholar]
- Ash, J.; Smallman, C. A case study of decision making in emergencies. Risk Manag. 2012, 12, 185–207. [Google Scholar] [CrossRef]
- Sadler, P.; Holgate, A.; Clancy, D. Is a contained fire less risky than a going fire? Career and volunteer firefighters. J. Emerg. Manag. 2007, 22, 44–48. [Google Scholar]
- SAI. Global SA/SNZ HB89:2013 Risk Management—Guidelines on Risk Assessment Techniques; Standards Australia: Sydney, Australia, 2013. [Google Scholar]
- NZFS. Inquiry into the Explosion and Fire at Icepak Coolstores, Tamahere, on 5 April 2008, (F128045); New Zealand Fire Service: Wellington, New Zealand, 2008. [Google Scholar]
- DFES. Directive 3.4. Structural Fire; Department of Fire and Emergency Services: Perth, Australia, 2012.
- SACFS. Rural Fire Hazard State Risk Assessment Report; Government of South Australia: Adelaide, Australia, 2014.
- Yung, D. Principles of Fire Risk Assessment in Buildings; John Wiley & Sons: London, UK, 2008. [Google Scholar]
- ACT ESA. Dynamic Risk Assessment Overview; ACT ESA: Canberra, Australia, 2009.
- DCLG. Fire and Rescue Operational Statistics Bulletin for England 2011–2012; Department for Communities and Local Government/The Stationary Office: London, UK, 2012. Available online: https://www.gov.uk/government/statistics/fire-and-rescue-authorities-in-england-operational-statistics-bulletin-for-2011-to-2012 (accessed on 20 January 2015).
- FEMA. Fire-Related Firefighter Injuries Reported to NFIS. Top. Fire Rep. Ser. 2011, 11, 1–11. [Google Scholar]
- FEMA. FEMA Fire Fighgter Injury Data. 2012. Available online: http://www.usfa.fema.gov/data/statistics (accessed on 20 January 2015).
- Robinson, R.; Francis, G.; Dean, M.; Kanga, M.; Robinson, J.; Stoks, F. Risk and Reliability Engineering Due Diligence, 8th ed.; R2A Pty Ltd.: Melbourne, Australia, 2010. [Google Scholar]
- Tissington, P.; Flin, R. Assessing Risk in Dynamic Situations: Lessons from Fire Service Operations. Risk Manag. Int. J. 2004, 7, 43–51. [Google Scholar] [CrossRef]
- Reinhardt-Klein, J. Firefighters: Attitudes, Beliefs, and Behaviours That Contribute to High-Risk Behaviours. Ph.D. Thesis, University of Illinois, Urbana, IL, USA, 2010. [Google Scholar]
- Fender, D. Controlling risk taking among firefighters. Prof. Saf. 2003, 48, 14. [Google Scholar]
- Naikar, N. A Comparison of the Decision Ladder Template and the Recognition-Primed Decision Model; Defence Science and Technology Organisation: Fishermans Bend, Australia, 2010.
- Penney, G. Rethinking Hazmat. Master’s Thesis, Edith Cowan University, Joondalup, Australia, 2013. Unpublished work. [Google Scholar]
- DFES. Demands of Being a Firefighter Duties Manual; Department of Fire and Emergency Services: Perth, Australia, 2013.
- Carll, E. Trauma Psychology—Issues in Violence, Disaster, Health and Illness; Praeger: London, UK, 2007. [Google Scholar]
- Trappler, B. Psychological Trauma—A Collection of Essays Ranging from Domestic to Political Abuse; Author House: Bloomington, IN, USA, 2014. [Google Scholar]
- DFES. Breathing Apparatus TRK; Department of Fire and Emergency Services: Perth, Australia, 2015.
- DFES. HAZMAT TRK; Department of Fire and Emergency Services: Perth, Australia, 2015.
- Moore-Merrell, L.; Zhou, A.; McDonald-Valentine, S.; Goldstein, R.; Slocum, C. Contributing Factors to Firefighter Line-of-Duty Injury in Metropolitan Fire Departments in the United States; International Association of Fire Fighters: Washington, DC, USA, 2008; Available online: https://www.researchgate.net/publication/237280119_CONTRIBUTING_FACTORS_TO_FIREFIGHTER_LINE-OF-DUTY_INJURY_IN_METROPOLITAN_FIRE_DEPARTMENTS_IN_THE_UNITED_STATES (accessed on 25 February 2015).
Figure 1.
Simplified bow tie analysis contextualised to firefighting operations.
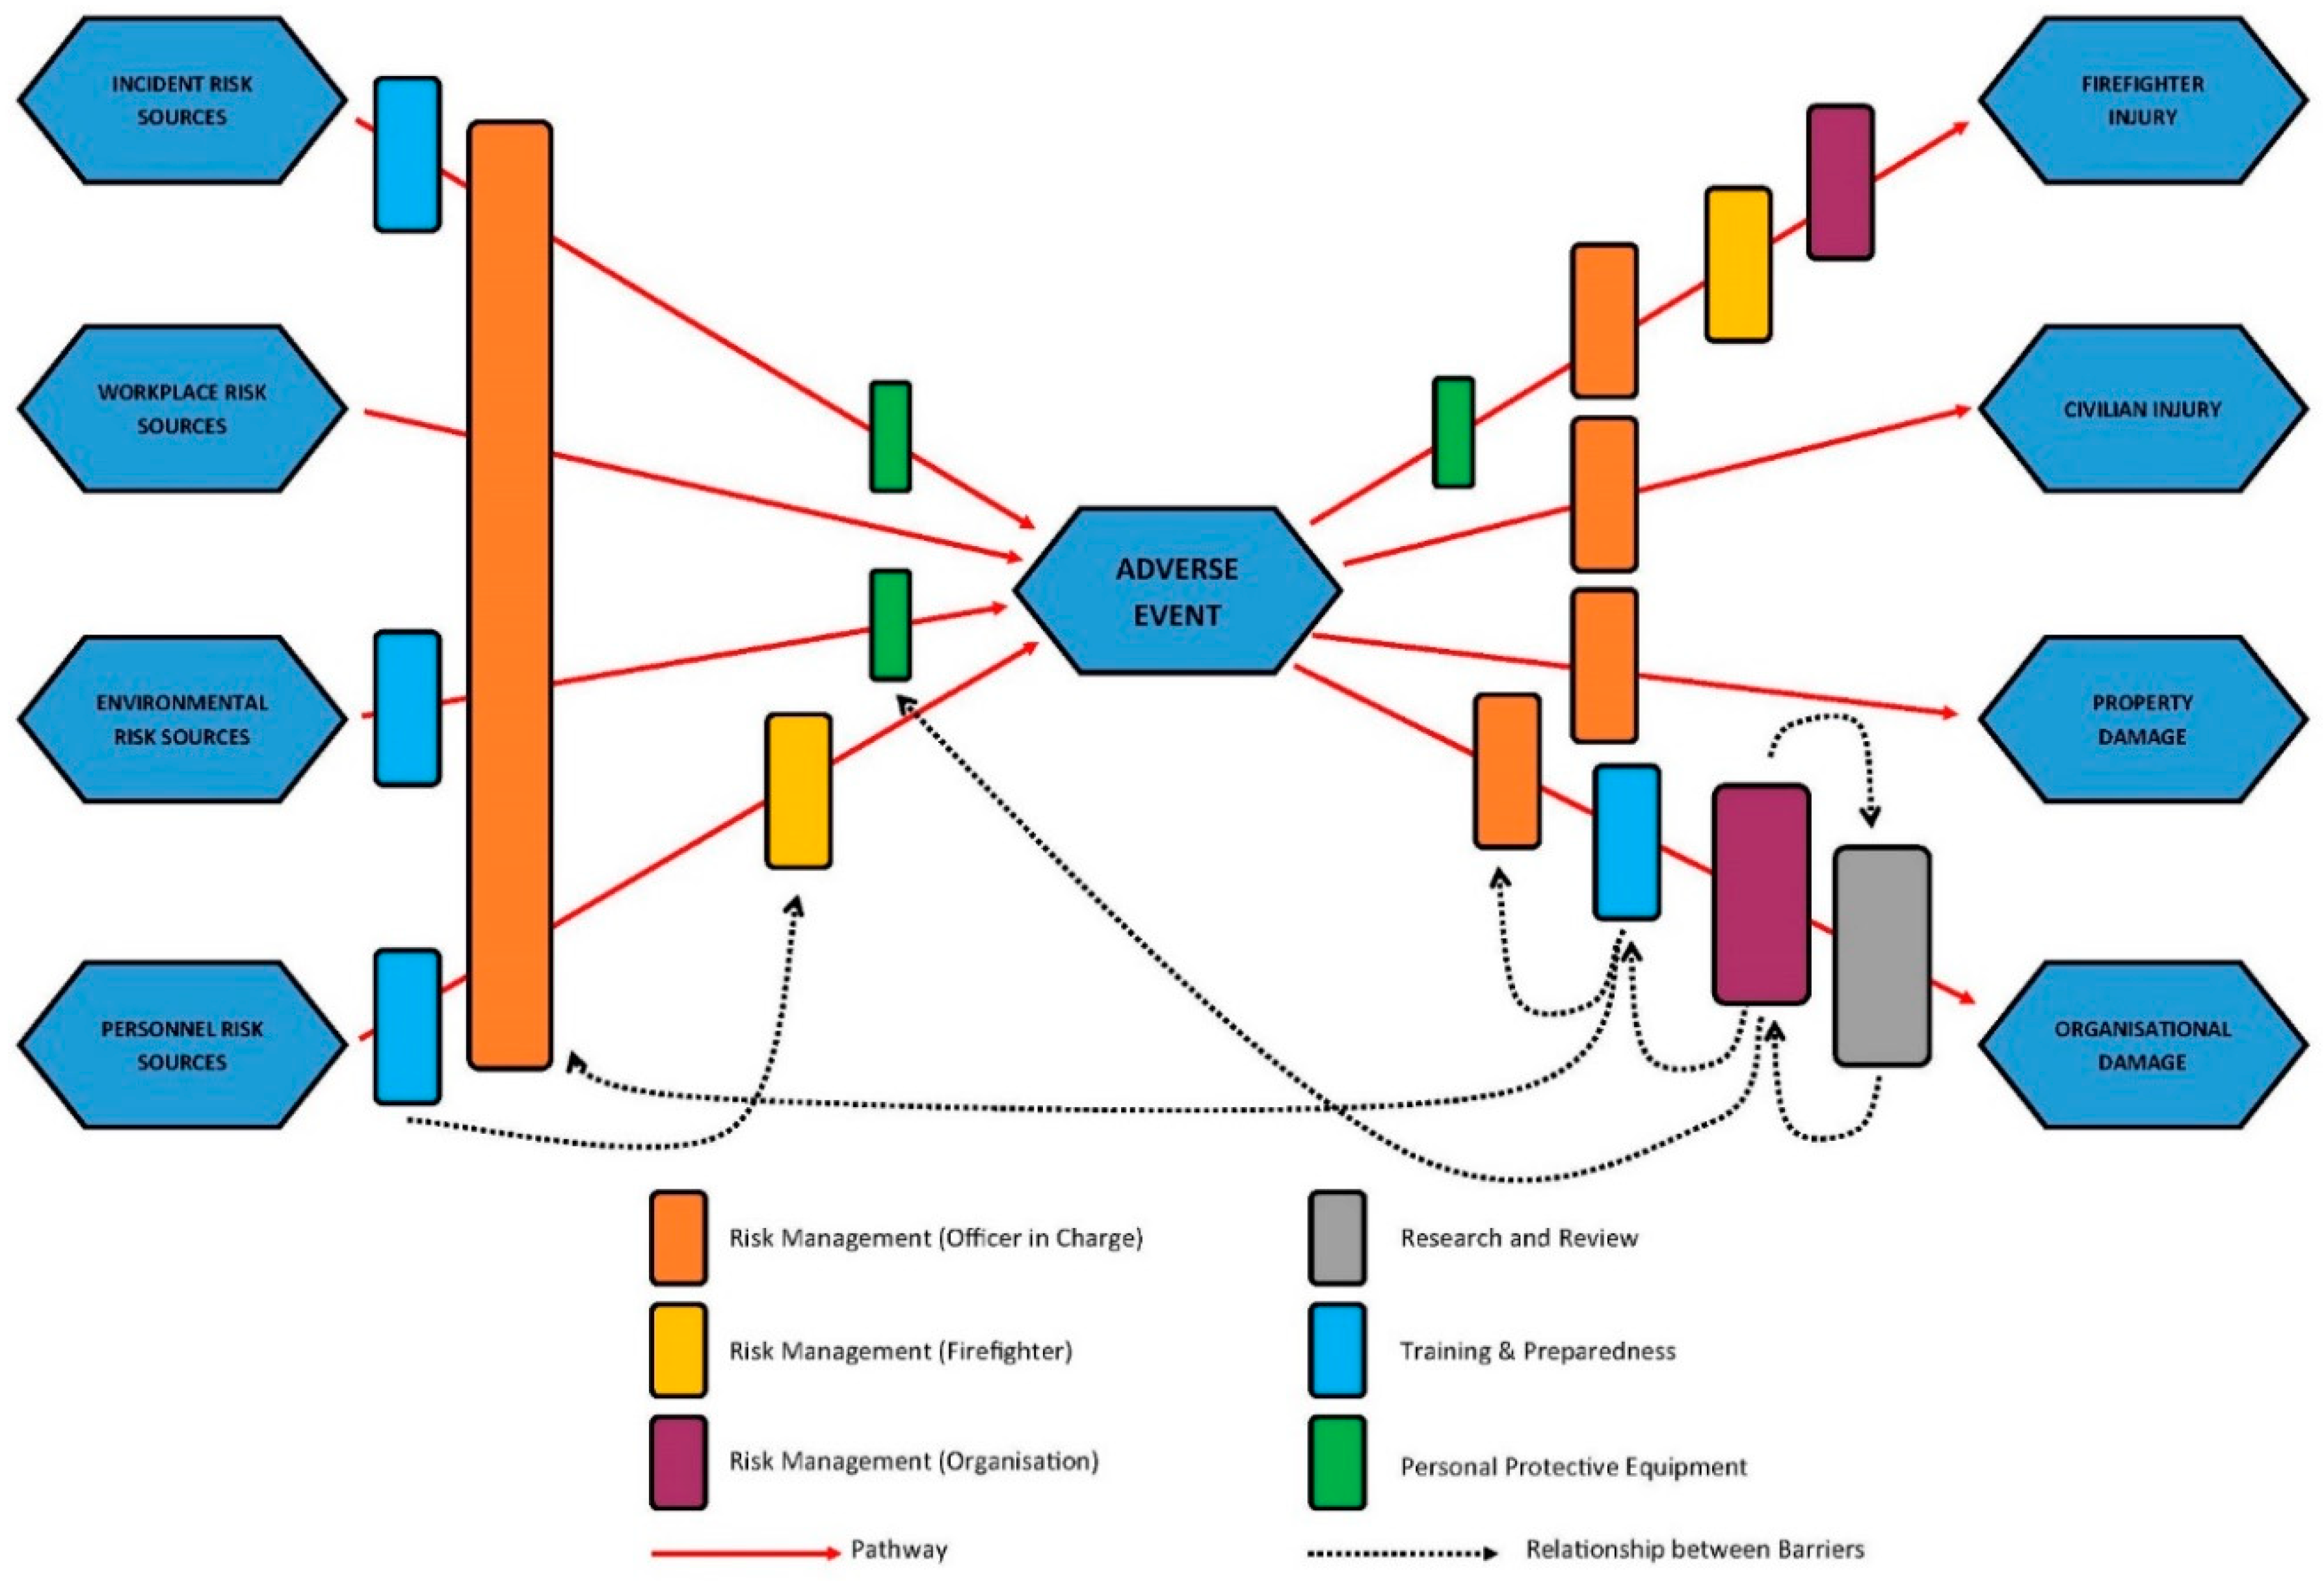
Table 1.
Analysis by activity.
| Activity (A) | Count | P(A|B) | Occurrence per year | Likelihood |
|---|---|---|---|---|
| Firefighting | 327 | 0.491 | 21.800 | Almost certain |
| RCR | 110 | 0.165 | 7.333 | Almost certain |
| Bushfire fighting | 99 | 0.149 | 6.600 | Almost certain |
| Rescue | 36 | 0.054 | 2.400 | Almost certain |
| Driving | 30 | 0.045 | 2.000 | Almost certain |
Table 2.
Analysis by risk source.
| Risk Source (A) | Count | P(A|B) | Occurrence per year | Likelihood |
|---|---|---|---|---|
| Physical Strain | 215 | 0.323 | 14.333 | Almost certain |
| Exposure—asbestos | 120 | 0.180 | 8.000 | Almost certain |
| Exposure—psychological | 95 | 0.143 | 6.333 | Almost certain |
| Impact | 49 | 0.074 | 3.267 | Almost certain |
| Exposure—smoke | 37 | 0.056 | 2.467 | Almost certain |
Table 3.
Analysis by injury.
| Nature of Injury (A) | Count | P(A|B) | Occurrence per year | Likelihood |
|---|---|---|---|---|
| Inhalation | 163 | 0.245 | 10.867 | Almost certain |
| Psychological | 96 | 0.144 | 6.400 | Almost certain |
| Nil | 70 | 0.105 | 4.667 | Almost certain |
| Back | 56 | 0.084 | 3.733 | Almost certain |
| Knee | 42 | 0.063 | 2.800 | Almost certain |
Table 4.
Conditional probability of specific injury during incident operations.
| Operation | Injury | Conditional Probability |
|---|---|---|
| Breathing apparatus operations | Nil | 0.300 |
| Back | 0.150 | |
| Knee | 0.150 | |
| Head/spinal | 0.100 | |
| Heat illness | 0.100 | |
| Bushfire fighting operations | Eye | 0.253 |
| Knee | 0.141 | |
| Nil | 0.131 | |
| Back | 0.081 | |
| Inhalation | 0.061 | |
| Direct brigade alarm response | Eye | 0.800 |
| Knee | 0.200 | |
| Driving operations | Nil | 0.800 |
| Back | 0.033 | |
| Ear | 0.033 | |
| Leg | 0.033 | |
| Psychological | 0.033 | |
| Firefighting operations | Inhalation | 0.434 |
| Back | 0.092 | |
| Heat illness | 0.067 | |
| Knee | 0.064 | |
| Nil | 0.064 | |
| Hazardous material operations | General | 0.500 |
| Inhalation | 0.417 | |
| Heat illness | 0.083 | |
| Road crash rescue operations | Psychological | 0.600 |
| Back | 0.100 | |
| General | 0.082 | |
| Face | 0.045 | |
| Absorption | 0.018 | |
| Rescue (other than RCR) operations | Psychological | 0.306 |
| Inhalation | 0.194 | |
| Back | 0.083 | |
| Nil | 0.083 | |
| Absorption | 0.056 | |
| Suicide response operations | Psychological | 0.800 |
| Not reported | 0.200 |
Table 5.
Conditional probability of specific initiating events (risk sources) during incident operations.
Table 5.
Conditional probability of specific initiating events (risk sources) during incident operations.
| Operation | Injury | Conditional Probability |
|---|---|---|
| Breathing apparatus operations | Physical Strain | 0.550 |
| Impact | 0.150 | |
| Entrapment | 0.100 | |
| Equipment failure | 0.100 | |
| Communications | 0.050 | |
| Bushfire fighting operations | Physical Strain | 0.515 |
| Exposure—smoke | 0.253 | |
| Exposure—chemical | 0.061 | |
| Impact | 0.051 | |
| Thermal | 0.051 | |
| Firefighting operations | Physical Strain | 0.358 |
| Exposure—asbestos | 0.315 | |
| Impact | 0.104 | |
| Exposure—hazmat fire | 0.073 | |
| Exposure—smoke | 0.037 | |
| Hazardous material operations | Exposure—chemical | 0.583 |
| Exposure—asbestos | 0.333 | |
| Physical Strain | 0.083 | |
| Road crash rescue operations | Exposure—psychological | 0.600 |
| Physical Strain | 0.209 | |
| Exposure—biohazard | 0.164 | |
| Exposure—asbestos | 0.018 | |
| Impact | 0.009 | |
| Rescue (other than RCR) operations | Exposure—psychological | 0.306 |
| Physical Strain | 0.278 | |
| Exposure—asbestos | 0.194 | |
| Exposure—biohazard | 0.111 | |
| Impact | 0.056 |
Table 6.
Conditional probability of actual and potential consequence severity during operations.
| Operation | Consequence Severity | Actual | Potential |
|---|---|---|---|
| Breathing apparatus operations | Insignificant | 0.300 | 0.000 |
| Minor | 0.700 | 0.150 | |
| Moderate | 0.000 | 0.400 | |
| Major | 0.000 | 0.250 | |
| Catastrophic | 0.000 | 0.200 | |
| Bushfire fighting operations | Insignificant | 0.818 | 0.000 |
| Minor | 0.131 | 0.505 | |
| Moderate | 0.040 | 0.101 | |
| Major | 0.010 | 0.212 | |
| Catastrophic | 0.000 | 0.182 | |
| Driving operations | Insignificant | 0.967 | 0.133 |
| Minor | 0.033 | 0.100 | |
| Moderate | 0.000 | 0.100 | |
| Major | 0.000 | 0.167 | |
| Catastrophic | - | - | |
| Firefighting operations | Insignificant | 0.933 | 0.031 |
| Minor | 0.034 | 0.147 | |
| Moderate | 0.021 | 0.199 | |
| Major | 0.012 | 0.098 | |
| Catastrophic | 0.000 | 0.526 | |
| Hazardous materials operations | Insignificant | 1.000 | 0.000 |
| Minor | 0.000 | 0.000 | |
| Moderate | 0.000 | 0.000 | |
| Major | 0.000 | 0.083 | |
| Catastrophic | 0.000 | 0.917 | |
| Road crash rescue operations | Insignificant | 0.973 | 0.000 |
| Minor | 0.018 | 0.073 | |
| Moderate | 0.009 | 0.218 | |
| Major | 0.000 | 0.027 | |
| Catastrophic | 0.000 | 0.682 | |
| Rescue (other than RCR) operations | Insignificant | 0.972 | 0.000 |
| Minor | 0.000 | 0.111 | |
| Moderate | 0.028 | 0.306 | |
| Major | 0.000 | 0.056 | |
| Catastrophic | 0.000 | 0.528 | |
| Suicide response operations | Insignificant | 1.000 | 0.000 |
| Minor | 0.000 | 0.133 | |
| Moderate | 0.000 | 0.000 | |
| Major | 0.000 | 0.000 | |
| Catastrophic | 0.000 | 0.867 |
© 2019 by the author. Licensee MDPI, Basel, Switzerland. This article is an open access article distributed under the terms and conditions of the Creative Commons Attribution (CC BY) license (http://creativecommons.org/licenses/by/4.0/).
Share and Cite
MDPI and ACS Style
Penney, G. Exploring ISO31000 Risk Management during Dynamic Fire and Emergency Operations in Western Australia. Fire 2019, 2, 21. https://doi.org/10.3390/fire2020021
AMA Style
Penney G. Exploring ISO31000 Risk Management during Dynamic Fire and Emergency Operations in Western Australia. Fire. 2019; 2(2):21. https://doi.org/10.3390/fire2020021
Chicago/Turabian StylePenney, Greg. 2019. "Exploring ISO31000 Risk Management during Dynamic Fire and Emergency Operations in Western Australia" Fire 2, no. 2: 21. https://doi.org/10.3390/fire2020021