Article

Mullite 3D Printed Humidity Sensors

by
Yurii Milovanov
1,2,
Arianna Bertero
1,
Bartolomeo Coppola
1,
Paola Palmero
1 and
Jean-Marc Tulliani
1,*
1
INSTM R.U PoliTO-LINCE Laboratory, Department of Applied Science and Technology, Politecnico di Torino, Corso Duca degli Abruzzi 24, 10129 Turin, Italy
2
Institute of High Technologies, Taras Shevchenko National University of Kyiv, Volodymyrska Street 64, 01601 Kyiv, Ukraine
*
Author to whom correspondence should be addressed.
Ceramics 2024, 7(2), 807-820; https://doi.org/10.3390/ceramics7020053
Submission received: 4 May 2024 / Revised: 5 June 2024 / Accepted: 7 June 2024 / Published: 10 June 2024
(This article belongs to the Special Issue Innovative Manufacturing Processes of Silicate Materials)

Abstract

:
Mullite substrates with two different porosities were 3D printed, and tested as humidity sensors. To evaluate the effects of porosity on humidity sensitivity, the samples were sintered at 1400 °C (Sensor 1) and 1450 °C (Sensor 2). The sensors were tested in a range from 0% to 85% relative humidity (RH) at room temperature. When exposed to water vapor at room temperature, the impedance value dropped down from 155 MΩ under dry air to 480 kΩ under 85 RH% for Sensor 1 and from 115 MΩ under dry air to 410 kΩ for Sensor 2. In addition, response time and recovery time were below 2 min, whatever the firing temperature, when RH changed from 0% to 74%. Finally, tests carried out involving ammonia, methane, carbon dioxide and nitrogenous oxide, as well as ethanol and acetone, showed no interference.

Graphical Abstract

1. Introduction

Over the last few decades, the use of humidity sensors to measure and control relative humidity (RH) has attracted significant interest in many industrial sectors, such as automation, food processing (e.g., microwave ovens), agriculture, health care (e.g., drug preparation, medical equipment, and air conditioners) and manufacturing (e.g., electronics and paper manufacturing) [1,2,3,4]. In addition, the need for humidity sensors able to operate in extreme conditions (high temperatures and corrosive atmospheres) is also constantly increasing. Thus, there is still an interest in studying humidity sensors today. These sensors can be classified as capacitive, resistive, and thermal conductive [5]. Their operating principle is based on the adsorption of water molecules, which changes the electrical properties, such as the capacitance or resistance, of the devices, or on the measurement of the difference between thermal conductivity in dry and in humid air [6,7,8,9,10,11,12,13,14,15]. Resistive sensors are low-cost and can be easily integrated in electronic circuits, making them ideal candidates for remote monitoring applications.
Among the resistive sensors, many sensing materials were investigated, such as metal oxides (Al2O3, Fe2O3, TiO2, SiO2, WO3, ZnO, CuO and ZrO2), perovskites (ZrTiO4, LaFeO3, BaTiO3, LiNbO3, SmCrO3, etc.) and spinels (ZnWoO4, MnWO4, NiWO4, CoWO4, MgCr2O4, ZnCr2O4, MgAl2O4, Fe3O4, etc.) [16,17], as well as carbon-based materials (e.g., carbon nanotubes, graphene oxides and biochar) [18,19,20,21,22,23,24]. Clay minerals with layered structures have also been also investigated, due to their high specific surface area and their capacity for ion exchange and the hydration process [25,26,27]. More recently, because of new applications such as the Internet of Things (IoT) and human-body monitoring, new sensors based on different materials such as paper [28], sulfides [29], sulfates [30], metal–organic frameworks (MOFs) [31] and other materials [32] have also been proposed.
Gas and humidity resistive sensors are often manufactured by screen-printing or spin-coating, or by brushing the sensing layer onto inert rigid or soft substrates, such as ceramic or polymeric ones. However, in this case, only a limited volume of material is used for the detection of the target gas.
Additive manufacturing techniques allow the production of complex geometries. In this research, Digital Light Processing (DLP) was exploited for the direct preparation of active substrates able to support metallic electrodes and to act, at the same time, as sensing layers. Thus, preliminary printing tests were performed to produce planar substrates with thickness values that could allow them to survive the successive screen-printing process, while, at the same time, not being too thick. The obtained thickness value (1.07 mm, after firing) was a good compromise on this basis. In addition, typical tape-cast films are 100–300 μm thick [33], which would have required the pressing of several stacked green layers to obtain a substrate with the same thickness. In such a case, pore size and pore size distribution could be changed during this pressing step. Finally, uniaxially pressing pellets 1 mm thick was another alternative, even if handling them without any organic temporary binder could be challenging. For these reasons, stereolithography was chosen for the sensors’ manufacturing, with the aim of producing more-complex porous geometries in the future.
Mullite (3Al2O3·2SiO2) is the only intermediate stable compound in the Al2O3-SiO2 system, and it is known for its chemical inertness in harsh environments [34]. Thus, in this work, a commercial mullite powder was first characterized by X-ray diffraction (XRD) and laser granulometry. Then, a slurry based on a photocurable commercial resin with a dispersant, a sintering additive and the mullite powder was prepared, and planar substrates were printed by DLP. These substrates were partially sintered at two different temperatures in order to investigate the effects of residual porosity on humidity-sensing properties. Their electrical responses with respect to humidity and to interfering gases such as NH3 (44 ppm in air), CH4 (100 ppm in air), CO2 (500 ppm in air) and NO2 (2.5 ppm in air), as well as ethanol (68,800 ppm) and acetone (276,900 ppm), were studied for the first time.

2. Materials and Methods

2.1. Materials

A mullite commercial powder (SA 193 CR, from Baikowski SAS, Annecy, France) was used. Chemical characterization of the as-received powder was performed by XRD analysis using a Pananalytical X′Pert Pro instrument (Pananalytical, Eindhoven, The Netherlands) with CuKα radiation (0.154056 nm) in the 2θ range, 5–70°. Furthermore, the particle size distribution of the as-received powder was checked by laser granulometry (Mastersizer 3000, Malvern Panalytical, Malvern, Worcestershire, UK) in alcohol after 5 min sonication. A photocurable commercial resin (Admatec Europe BV, Alkmaar, The Netherlands) consisting of a liquid monomer resin system with a photo-initiator, diphenyl(2,4,6,-trimethylbenzoyl)phosphine oxide and acrylates was used to prepare the slurry. A dispersant (Disperbyk-103, BYK Chemie, Wesel, Germany) was added to enhance the stability and increase the solid loading of the suspension.

2.2. Slurry Preparation

The slurry was manufactured by mechanically mixing the resin and the dispersant with the ceramic powder in order to obtain a solid loading of 69 wt%. After preliminary tests, 5.0 wt% dispersant was added (with respect to the dry powder) to the monomer, under mechanical stirring with a helix for 15 min. Then, mullite powder was gradually introduced into the mixture under continuous stirring, accurately avoiding the formation of agglomerates. Magnesium carbonate was also mixed as a sintering aid (1 wt% of equivalent MgO with respect to mullite) [35]. The total mixing process lasted 45 min. The obtained slurry was then milled in agate jars with agate spheres (d = 10 mm) for 6 h at 350 rpm in a planetary miller (Fritsch Pulverisette 5, Fritsch GmbH, Oberstein, Germany). The slurry was finally degassed for 30 min under vacuum by means of a rotative pump in order to allow the entrapped gas to leave the mixture and to obtain a homogeneous slurry. A rotational rheometer (Kinexus Pro+, Malvern Panalytical, Malvern, Worcestershire, UK) equipped with stainless steel parallel plates (20 mm diameter, 1 mm gap between plates) was used to assess the rheology of the slurry at 25 °C. Shear rates in the range of 0.1–1000 s−1 were applied.

2.3. Digital Light Processing (DLP) and Post-Processing

Planar-shaped specimens were designed using the AutoCAD 2018 software and printed using a DLP-based stereolithographic printer (ADMAFLEX 130, ADMATEC Europe BV, Alkmaar, The Netherlands) operating with a 405 nm wavelength UV light. Curing depths and curing degrees of the UV-curable suspensions were investigated through several tests. Curing parameters are of paramount importance for the integrity and quality of the printed samples. Thus, first, the best compromise between high resolution, good adhesion, and the uniformity of each layer was investigated. The most reliable parameters were the following: layer thickness, exposure time, and LED power; these were equal to 30 μm, 1 s and 13.93 mW/cm3, respectively. During the printing process, a delay of 30 s before exposure was set to allow air bubbles to be expelled from the slurry. A 125 μm doctor blade was used. Slurries were exposed to the UV light in a chessboard configuration for different exposure times to determine the curing depth. The uncured slurry was then cleaned with paper and the thickness of the single layer was determined by means of a digital micrometer.
After printing, the samples were soaked in deionized water at approx. 40 °C for 6 h to enable researchers to easily remove with a brush the uncured slurry attached to the samples, promoting the removal of the contained water-soluble fraction. Indeed, the resin used (Blank resin C, water de-binding, ADMAFLEX, Alkmaar, The Netherlands) is specifically designed to avoid thermal de-binding defects during resin decomposition by creating a porous network (via water de-binding) through which decomposition gases can be removed without stressing the green samples. Then, the substrates were dried in an oven at 70 °C for 6 h. A thermal de-binding and sintering cycle (Carbolite 1800 electric furnace, Carbolite Gero GmbH, Neuhausen, Germany) (Figure 1) was set up. Specifically, the samples were slowly heated to 1000 °C to prevent cracking during resin decomposition and then were sintered up to 1400 °C (Sensor 1) and 1450 °C (Sensor 2) for 1 h, at a heating rate of 1 °C/min. These sintering temperatures were chosen based on preliminary tests: a too-high temperature guarantees higher mechanical properties but a lower porosity and sensor response. However, a minimum mechanical strength is needed because the substrates must withstand the screen-printing process for the metallic electrodes. The sintered density was determined according to the theoretical density (TD) of mullite (3.17 g/cm3) and the microstructures of the films were observed by means of a field emission-scanning electron microscope (FE-SEM, Hitachi S3800, Tokyo, Japan).

2.4. Fabrication and Measurement of Gas Sensors

The platinum electrodes were screen-printed (Ferro 5545, King of Prussia, PA, USA; 2 successive prints) using an automatic machine with a 270-mesh steel screen. After drying overnight, the Pt ink was fired at 980 °C for 15 min to obtain a high-grade adhesion and optimize its electrical conductivity, as per the ink producer’s indications. The electrodes had widths of 400 μm and were spaced 450 μm from each other.
The sensor’s humidity response in the 0–100% relative humidity (RH) range was studied by means of a laboratory system at room temperature, under an airflow rate of 150 mL/min. The RH was increased progressively by steps, each one 15 min. In this system, the airflow (Siad, Turin, Italy, research grade) was split into two flows and controlled by means of mass flows (MF302, Teledyne Hastings, Hampton, VA, USA; mass flow controller: Teledyne 4000): the first one was kept anhydrous, whereas the second one passed through a water bubbler, generating a saturated humid flow. Then, both flows were combined. A commercial probe for humidity and temperature measurements (Delta Ohm DO9406, Caselle di Selvazzano, PD, Italy; accuracy: ±0.1% in the 0–100% RH range from 50 to 250 °C) was used as reference for temperature, and RH values were determined inside the measurement chamber. During tests under a dynamic flow, the sensors’ impedance and phase were measured by an LCR meter (Hioki 3533-01, Ueda, Nagano, Japan). The alternating voltage was 2 V at a frequency of 1 kHz. Additionally, tests were also carried out for different gases, like NH3 (44 ppm in air), CH4 (100 ppm in air), CO2 (500 ppm in air) and NO2 (2.5 ppm in air), all under the same flow rate (all gases were provided by Siad, Turin, Italy and were research grade). Then, a bubbler with pure ethanol and acetone (Sigma Aldrich, Milan, Italy, reagent grades) was added and the response of the sensor was investigated at 23 °C. The gas concentrations (in %) were calculated according to the respective vapor pressures (52.3 mmHg for ethanol and 210.4 mmHg for acetone [36]) and Equation (1) [37]:
gas concentration (%) = 100 × vapor pressure of the liquid in mmHg/760
The response of the sensor (R) was calculated according to Equation (2)
R = Z0/Zg
where Z0 and Zg are the impedance values of the sensor under dry air and under humid air, respectively.
The sensitivity (S) of the sensor is the slope of the calibration curve, and it can be determined in accordance with Equation (3):
S(Z) = ΔZ/ΔRH
The response time (the time required by a sensor to achieve 90% of the total impedance change in the presence of humid air) as well as the recovery time (the time needed for a sensor to reach 90% of the total impedance variation during gas desorption) were calculated as well.

3. Results and Discussion

3.1. Powder Characterization

The as-received powder showed a multimodal distribution with a ∅50 value close to ~29 µm (Table 1). After 5 min of sonication, the ∅50 was equal to ~1.8 µm. Thus, sonication reduced the size of the coarser fractions. It can be concluded that the as-received powder presented soft agglomeration.
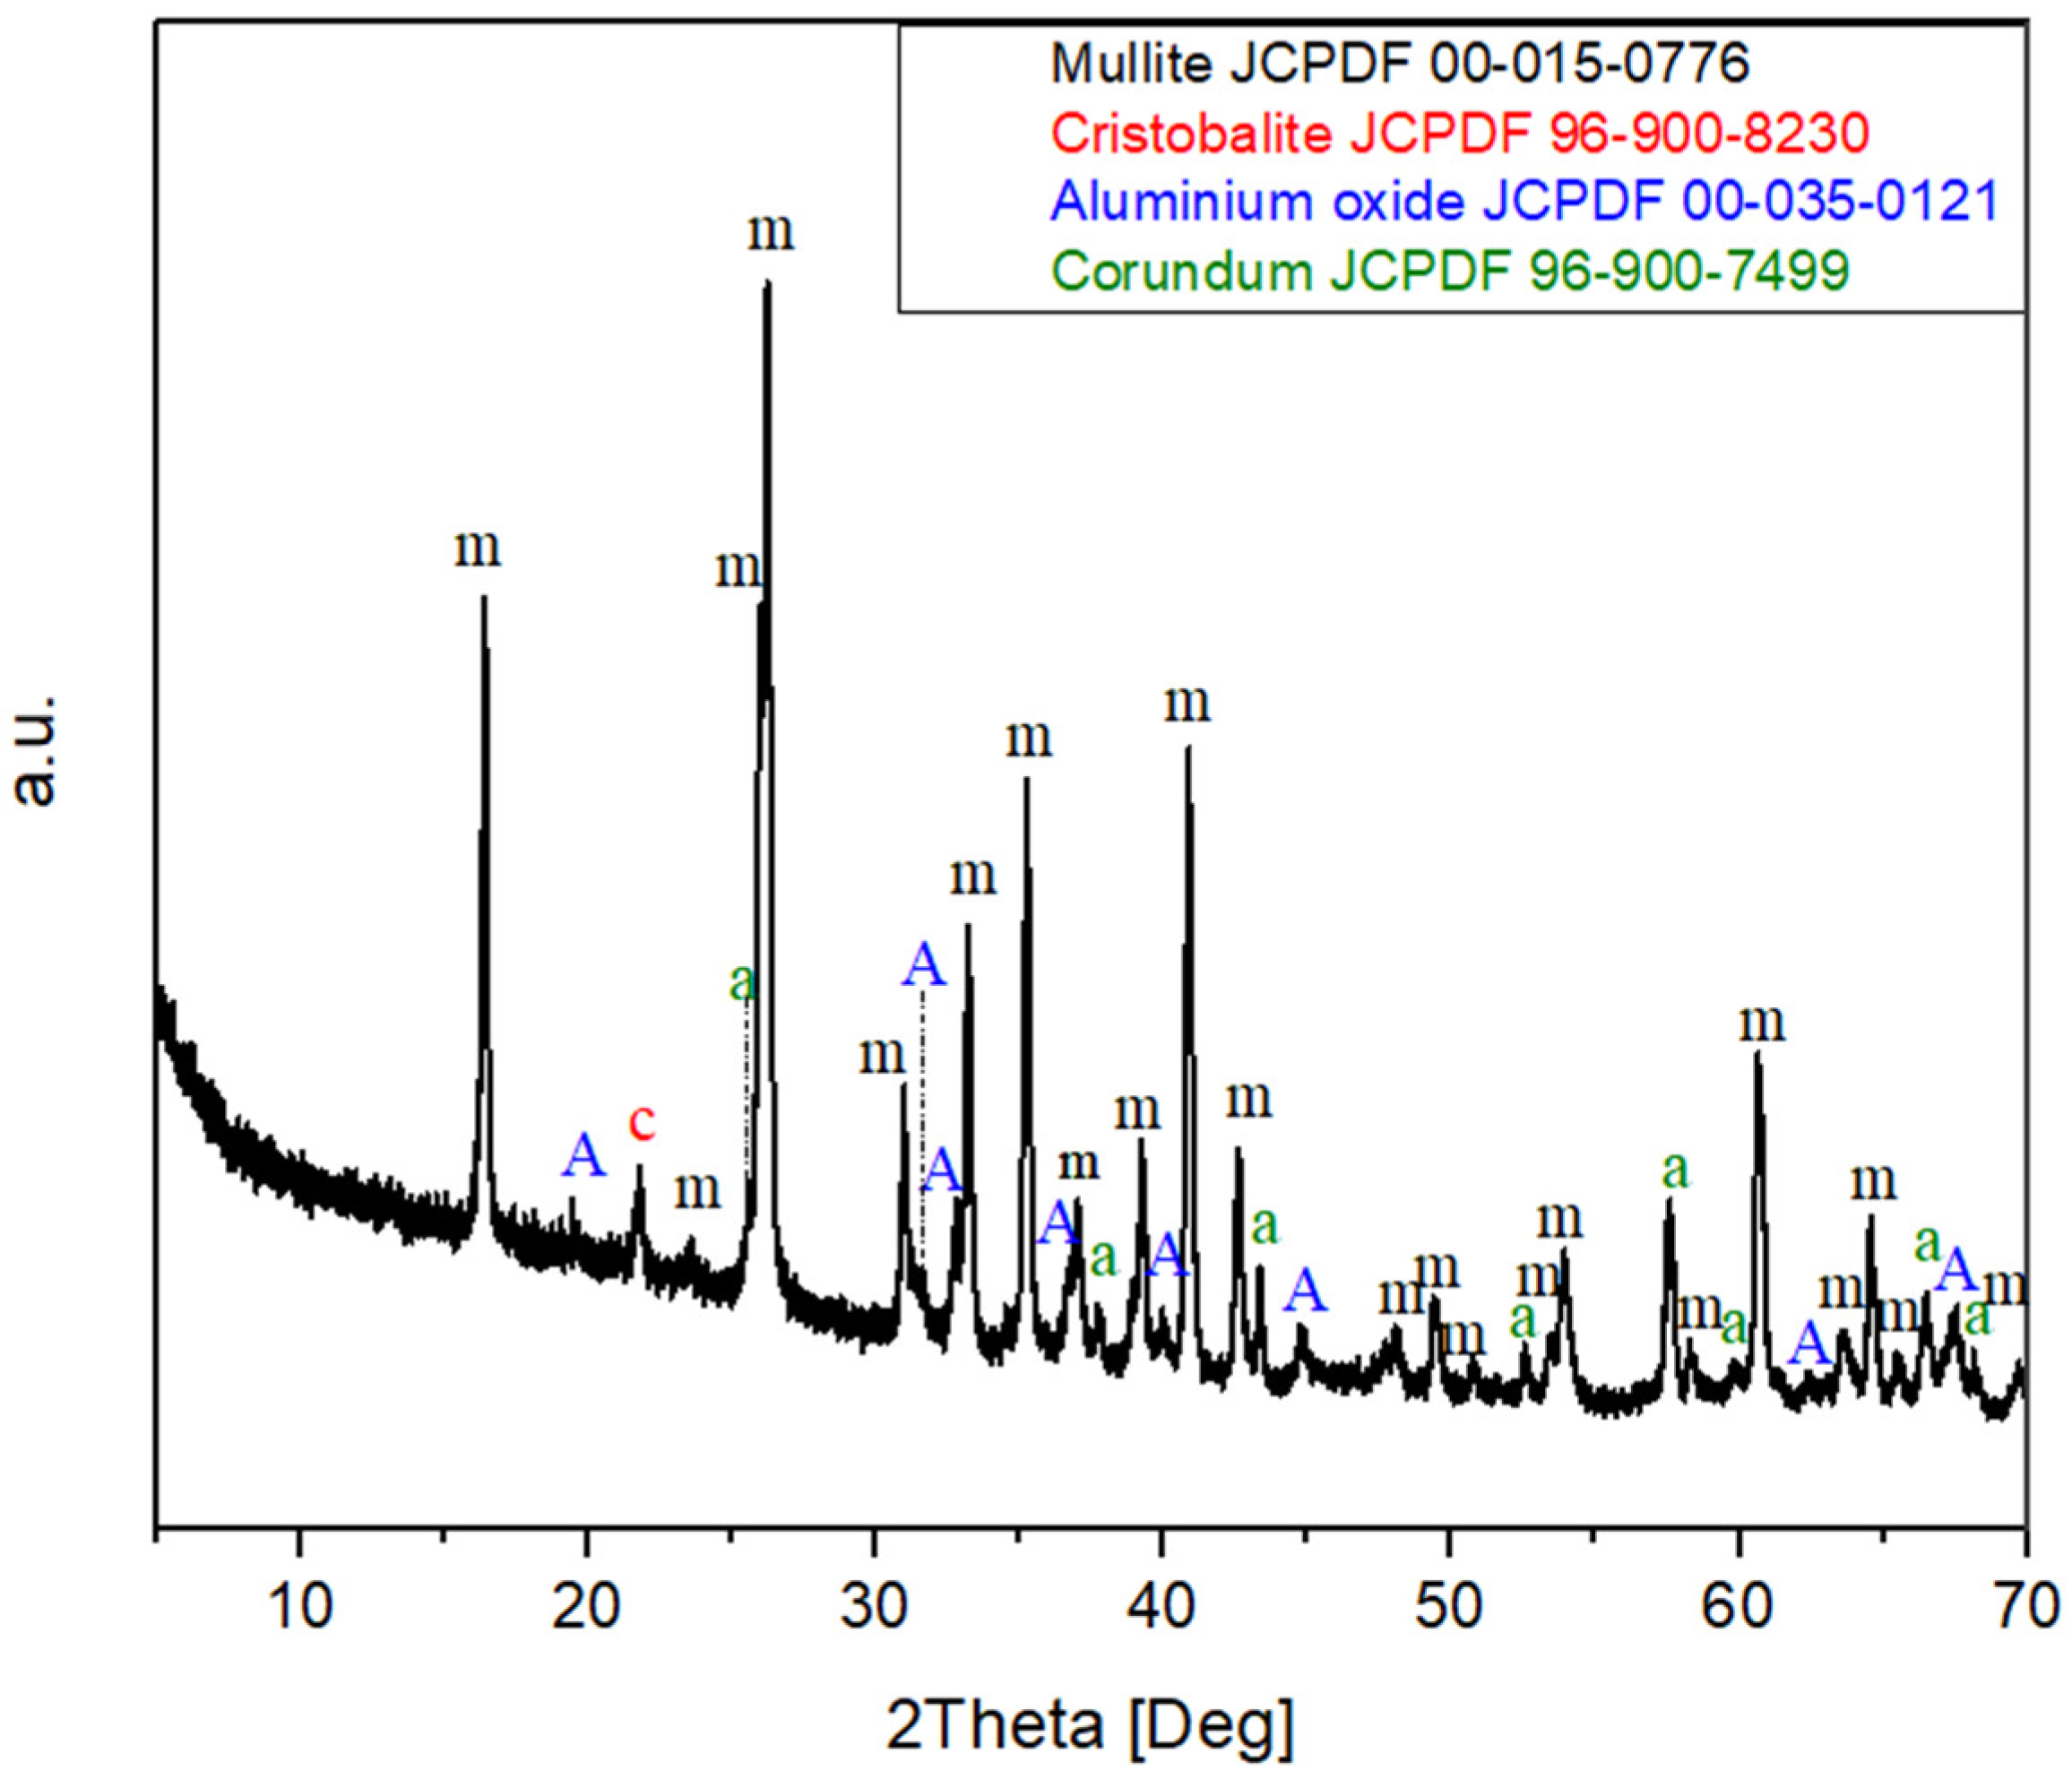
The XRD pattern of the as-received mullite is reported in Figure 2; the pattern corresponds mainly to mullite (JCPDS card n◦ 15-0776). Cristobalite (SiO2, JCPD file 96-900-8230) and aluminum oxide (Al2O3, JCPFD files 96-900-7499 and 00-035-0121, for the hexagonal and the monoclinic phase, respectively) were also detected.

3.2. Sensor-Based Microstructural Characterization

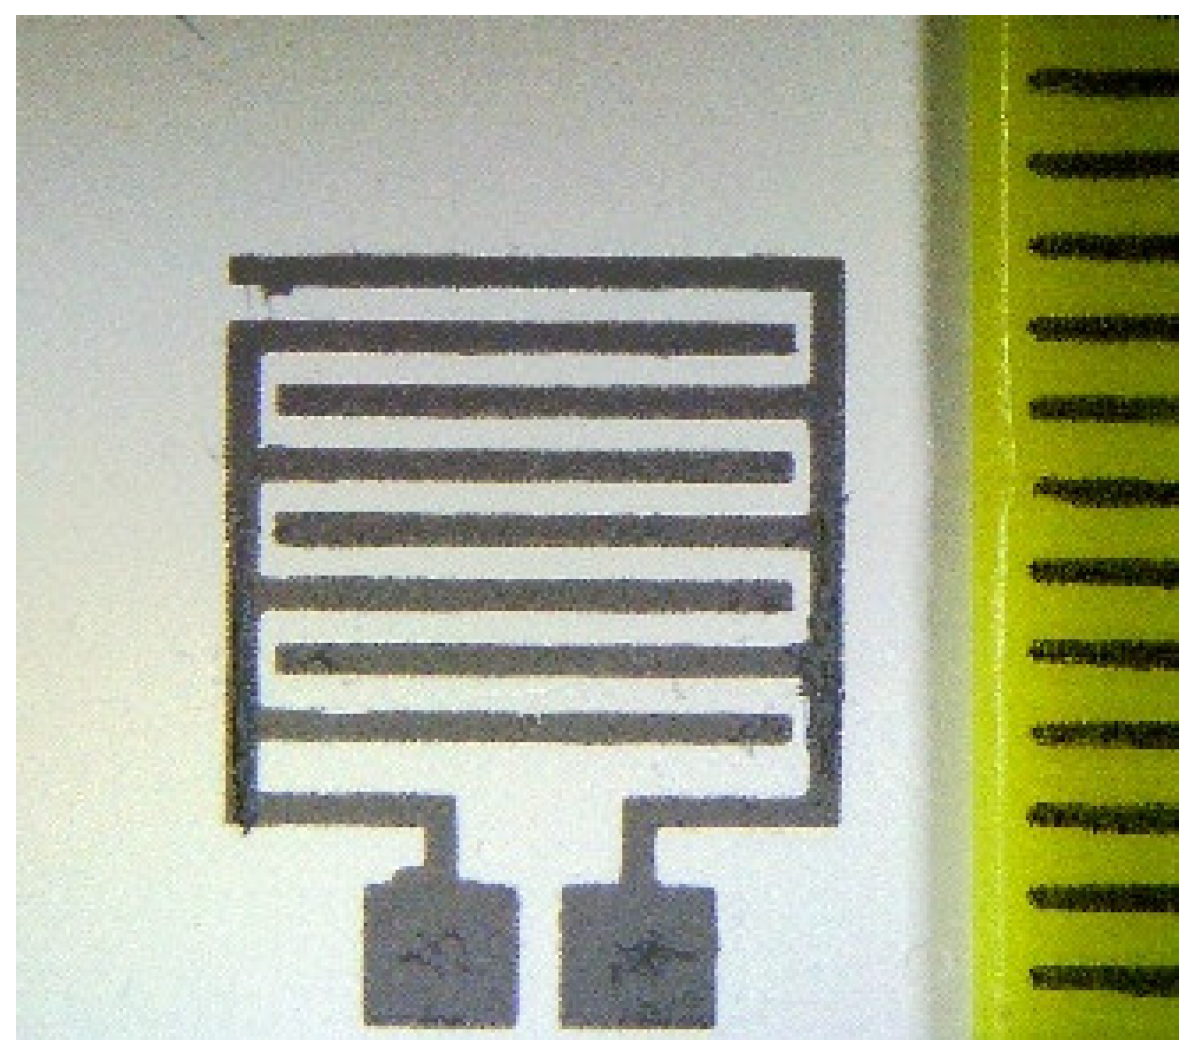
The different sintering temperatures (1400 or 1450 °C, for 1h) produced a slight difference in substrate porosity: in fact, Sensor 1 samples were characterized by a porosity of 19% (determined according to the Archimedes method), and Sensor 2, of 17%. Before sintering, the average dimensions of the substrates were: 23.12 × 15.48 × 1.19 mm3. After sintering, the average dimensions of the plates were: 21.56 × 14.4 × 1.07 mm3 for Sensor 1 and 20.15 × 13.46 × 1.07 mm3 for Sensor 2. Volume shrinkages of 20% for Sensor 1 and 32% for Sensor 2 were then calculated after sintering. The substrates were to be handled with care because of the rather low sintering temperature (with the same mullite powder and 1 wt% addition of MgO, full density can be reached after sintering at 1550 °C for 3 h [35], while the sensors were heat-treated at 1400 °C and 1450 °C for 1 h only). However, they were able to survive the screen-printing step, in which the steel mesh comes into contact with the sample and the squeegee forces the ink to pass through the former. When flat surfaces were obtained, no breaking of samples was observed. An image of the printed sensor with screen-printed electrodes is reported in Figure 3.
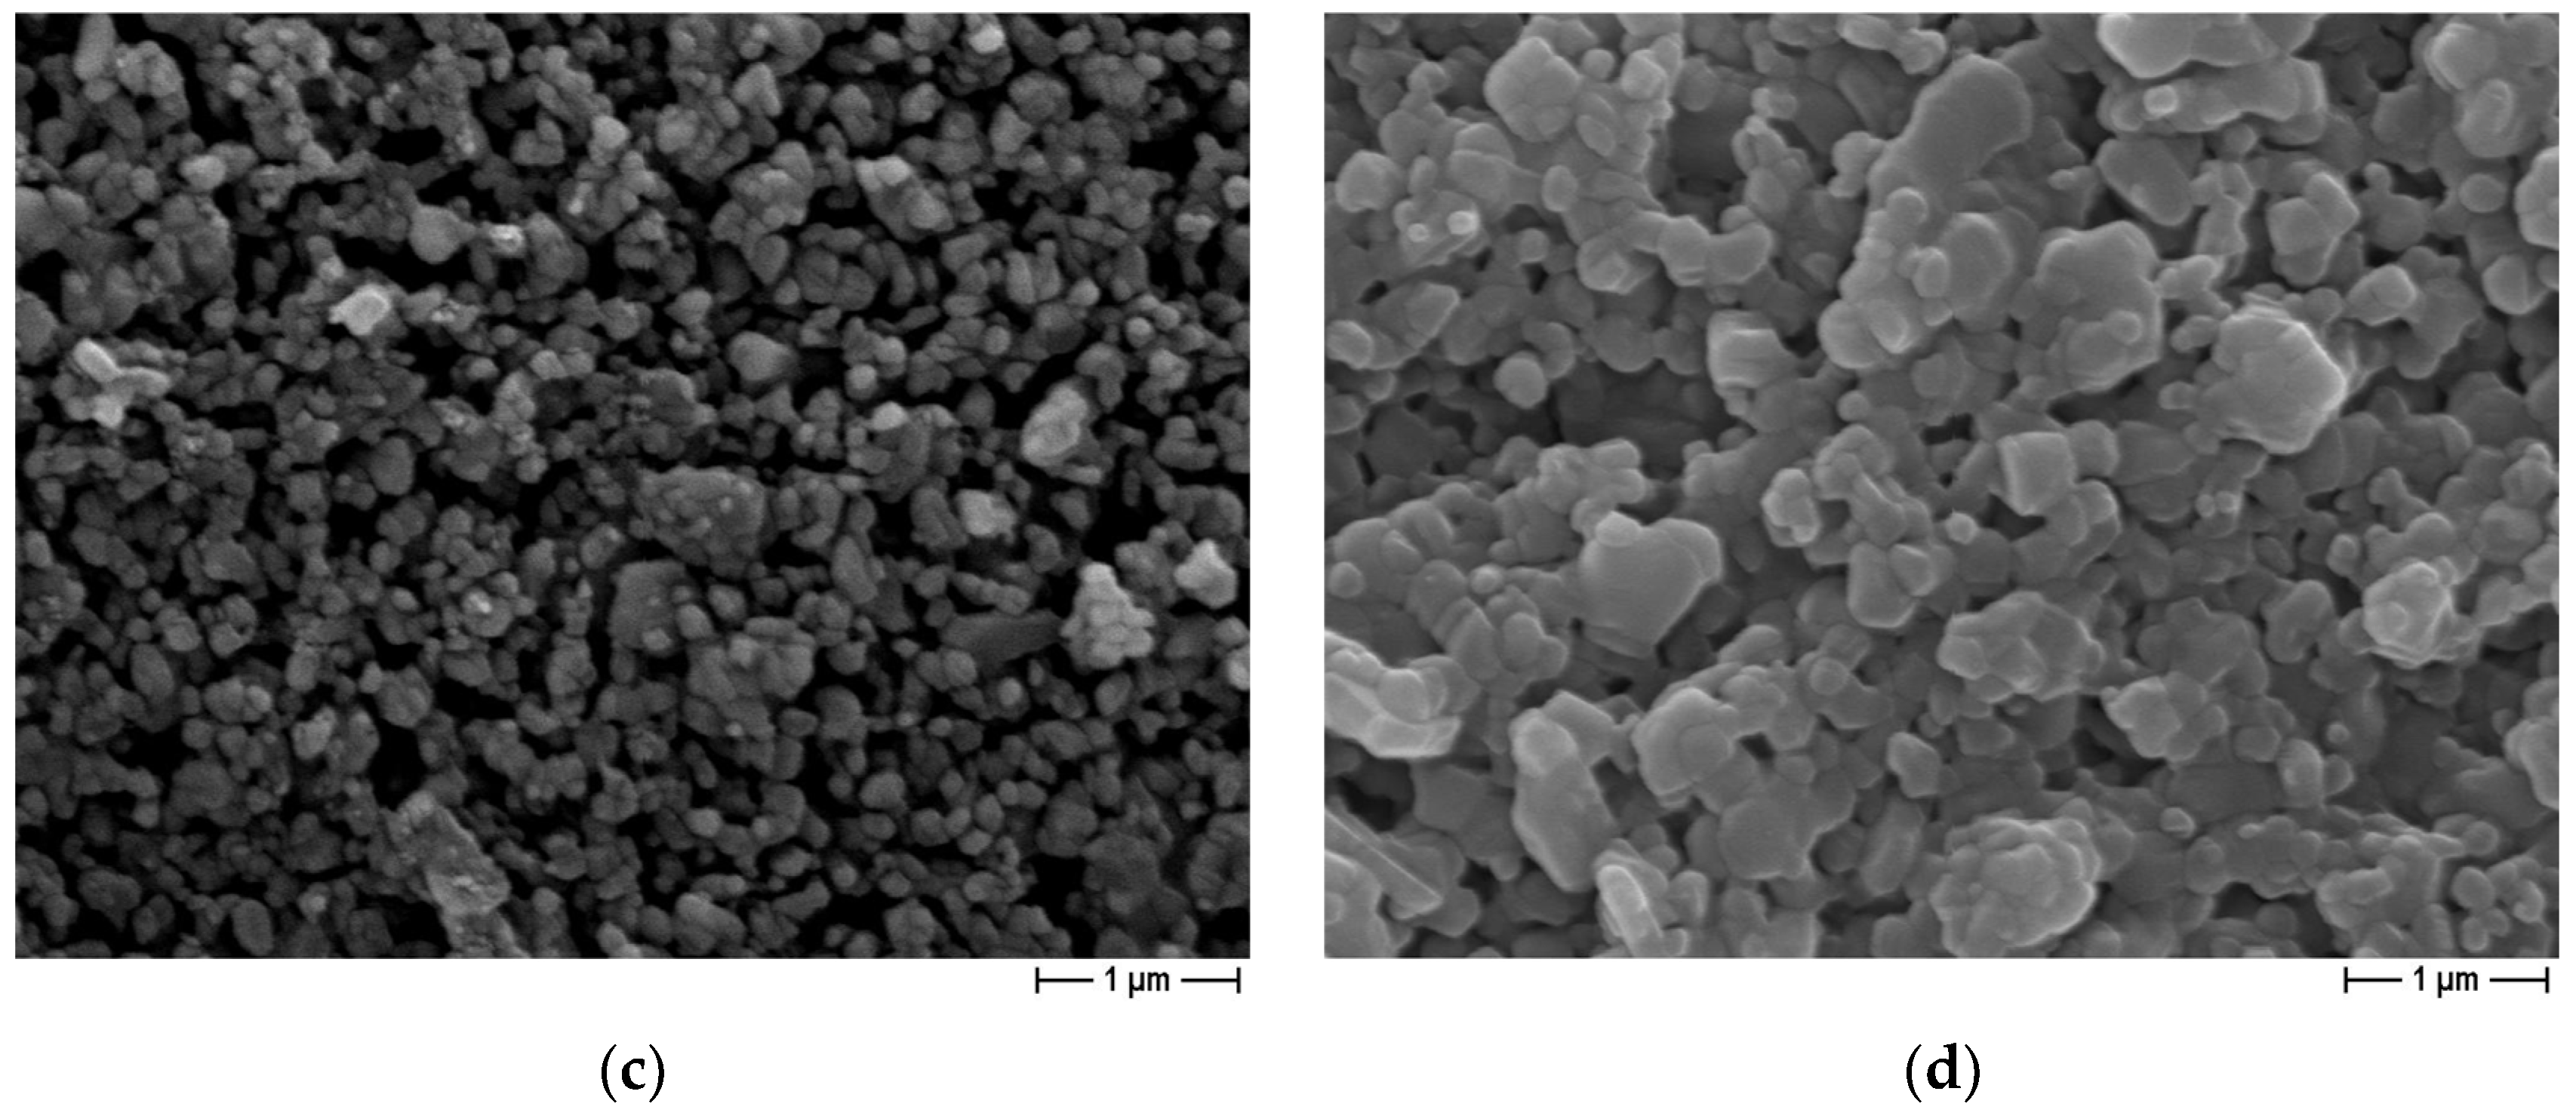
The FE-SEM micrographs of the 3D printed mullite sintered at 1400 °C and 1450 °C are presented in Figure 4. The microstructures appear porous, and the lower annealing temperature (1400 °C) led to the creation of a spongier structure (Figure 4a,c), in comparison with the one obtained at a higher temperature (1450 °C) (Figure 4b,d), which was as expected, considering the respective densities of the sensors. Sensor 1 looks like a consolidated powder at the very beginning of the sintering process (Figure 4c), while on sensor 2 a coarsening of the grain powders is already visible (Figure 4d).

3.3. Humidity-Sensing Properties

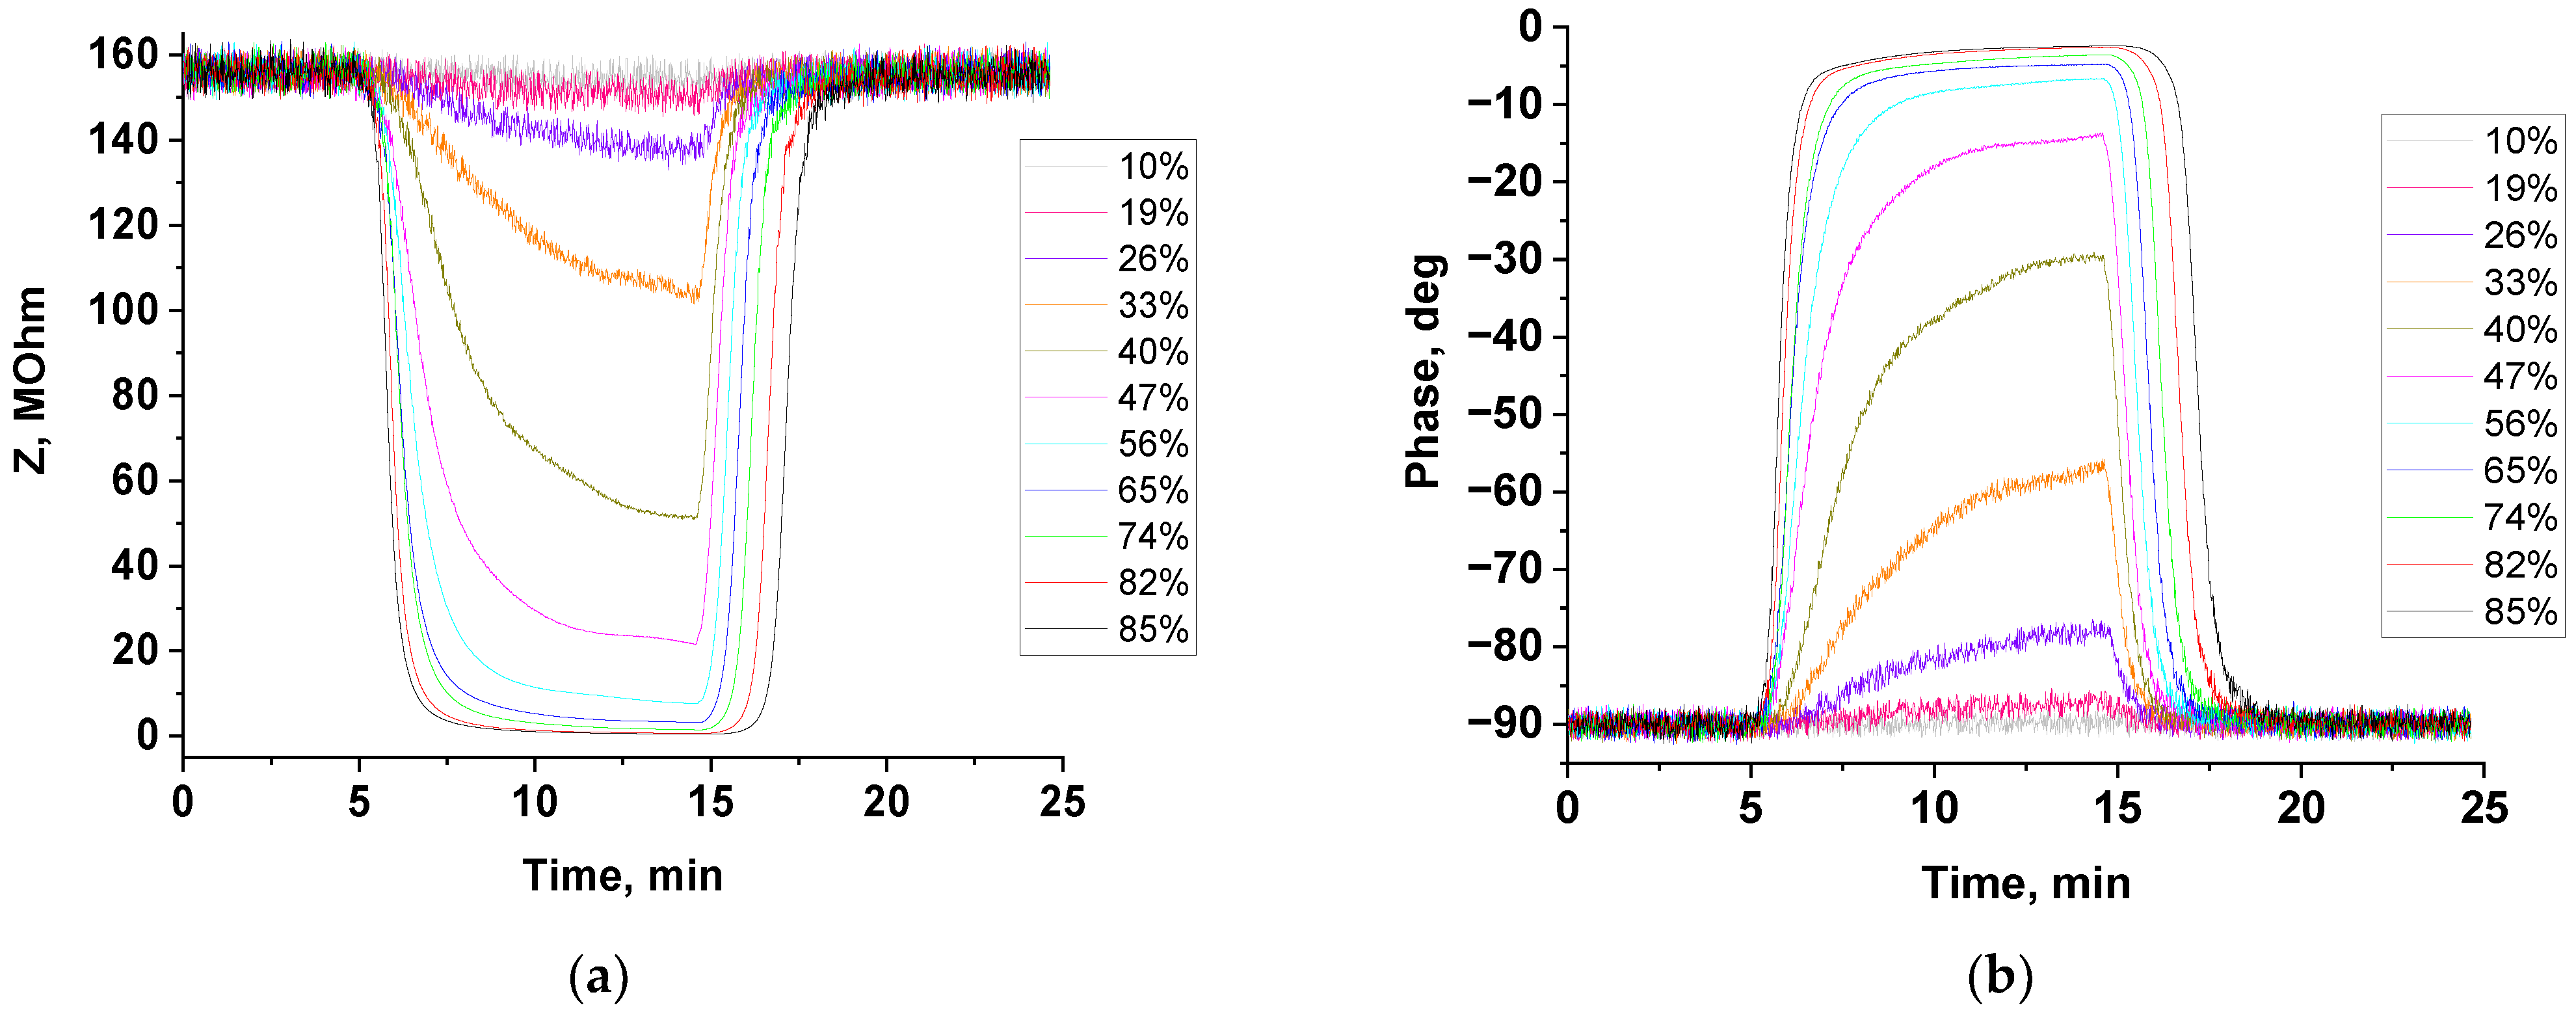
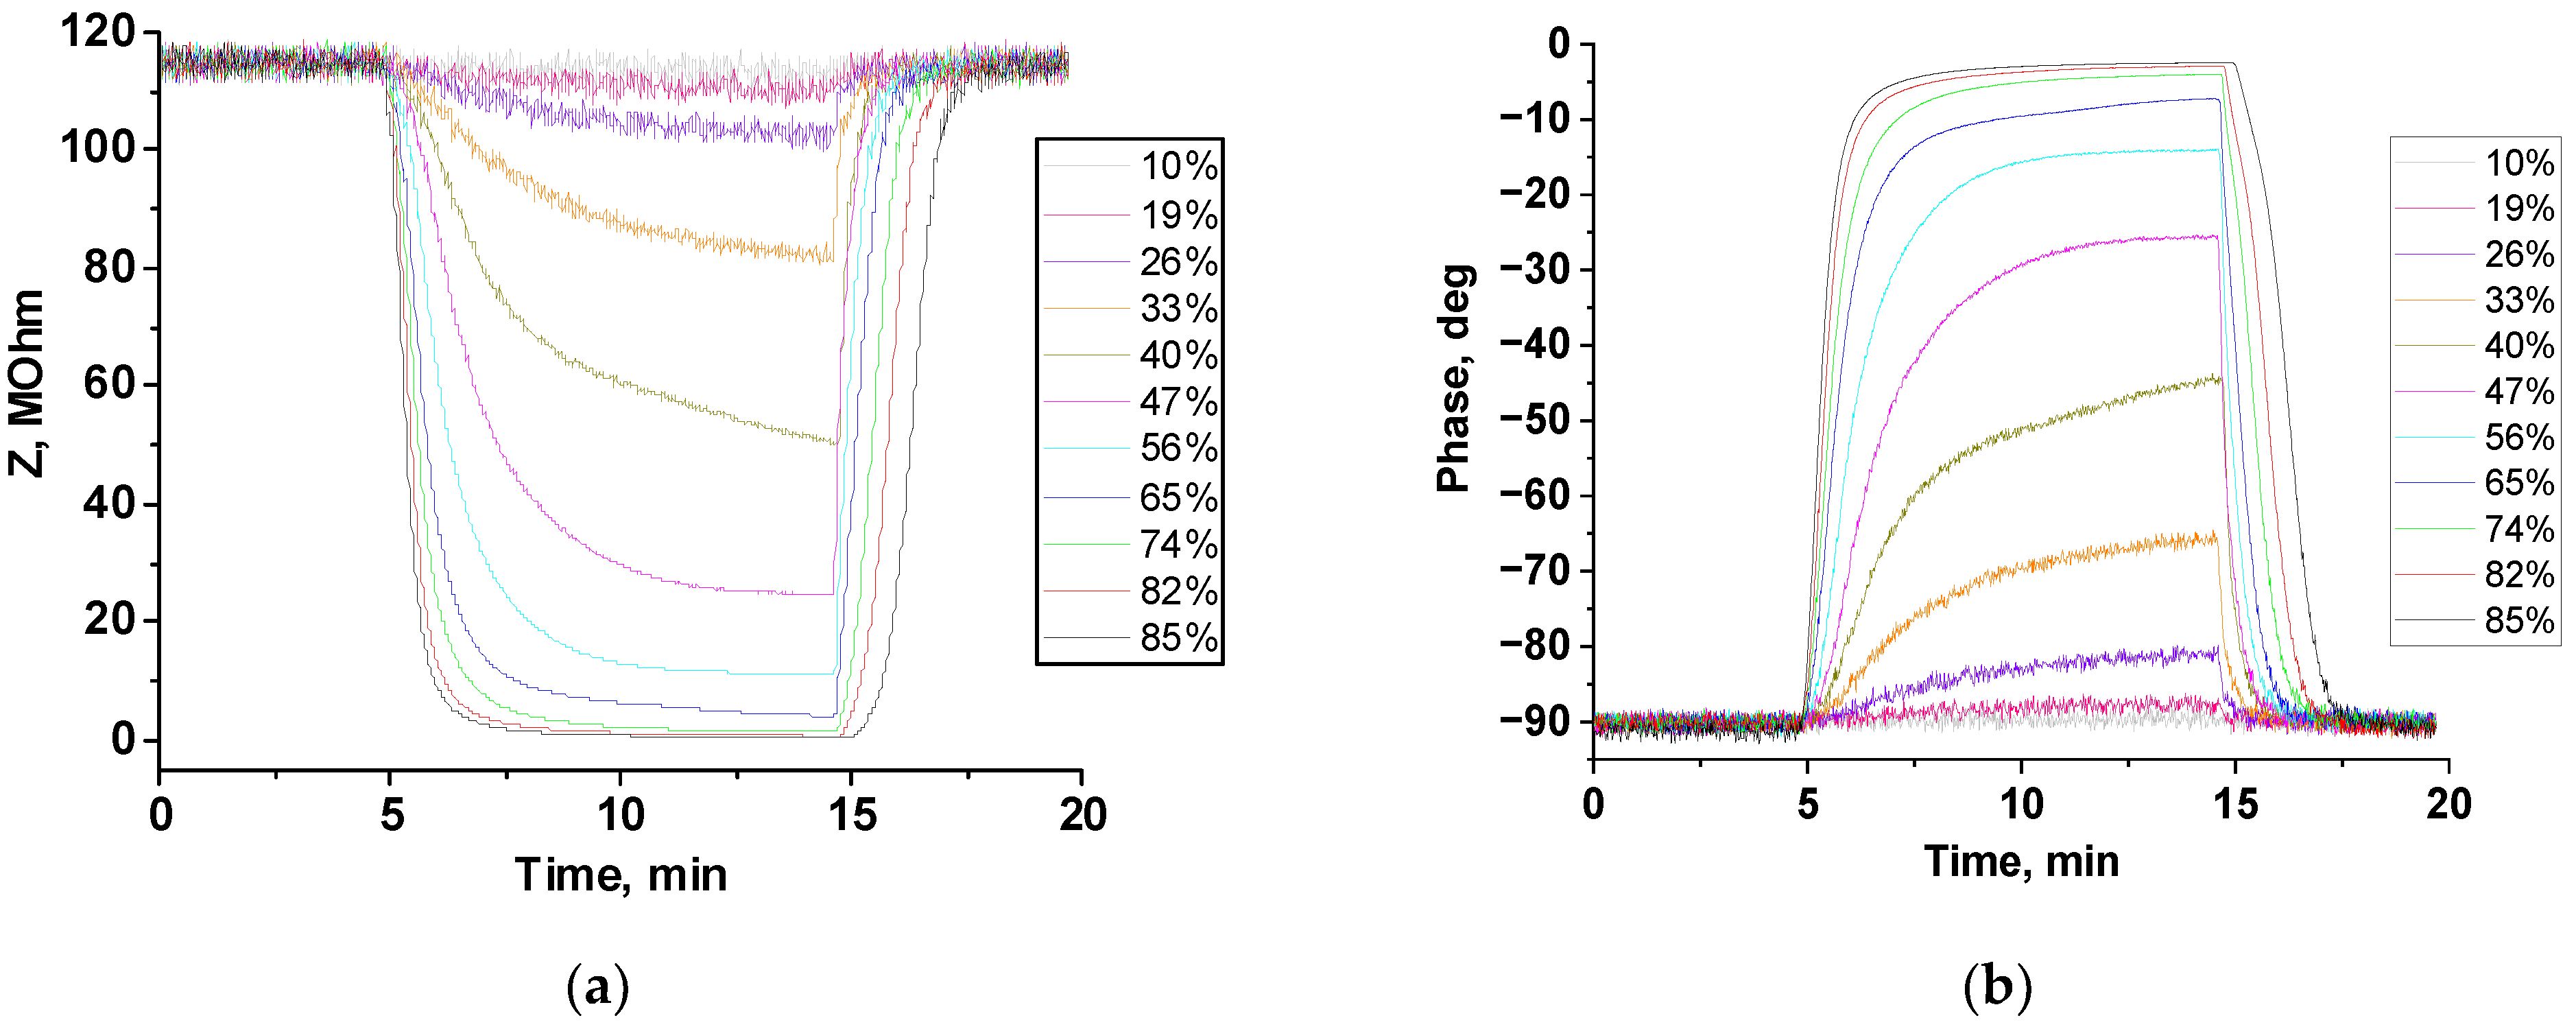
The sensor response, in terms of impedance and the phase variation of Sensors 1 and 2 are plotted in Figure 5 and Figure 6. When in contact with humidity, the impedance value dropped from 155 MΩ under dry air to 480 kΩ under 85 RH% for Sensor 1, and from 115 MΩ under dry air to 410 kΩ for Sensor 2 (Figure 5a and Figure 6a). The higher porosity of Sensor 1 can explain the higher initial (under dry air) impedance value.
Initially, at a low humidity level, the impedance value slightly changes, while above 19 RH%, the impedance of the sensor sharply drops down with the increase in humidity level (Figure 5a and Figure 6a). At the same time, the phase increased continuously, from approximately −90° under dry air to approximately −3° under 85 RH% (Figure 5b and Figure 6b), as already observed with humidity sensors based on rice husk ash [38].
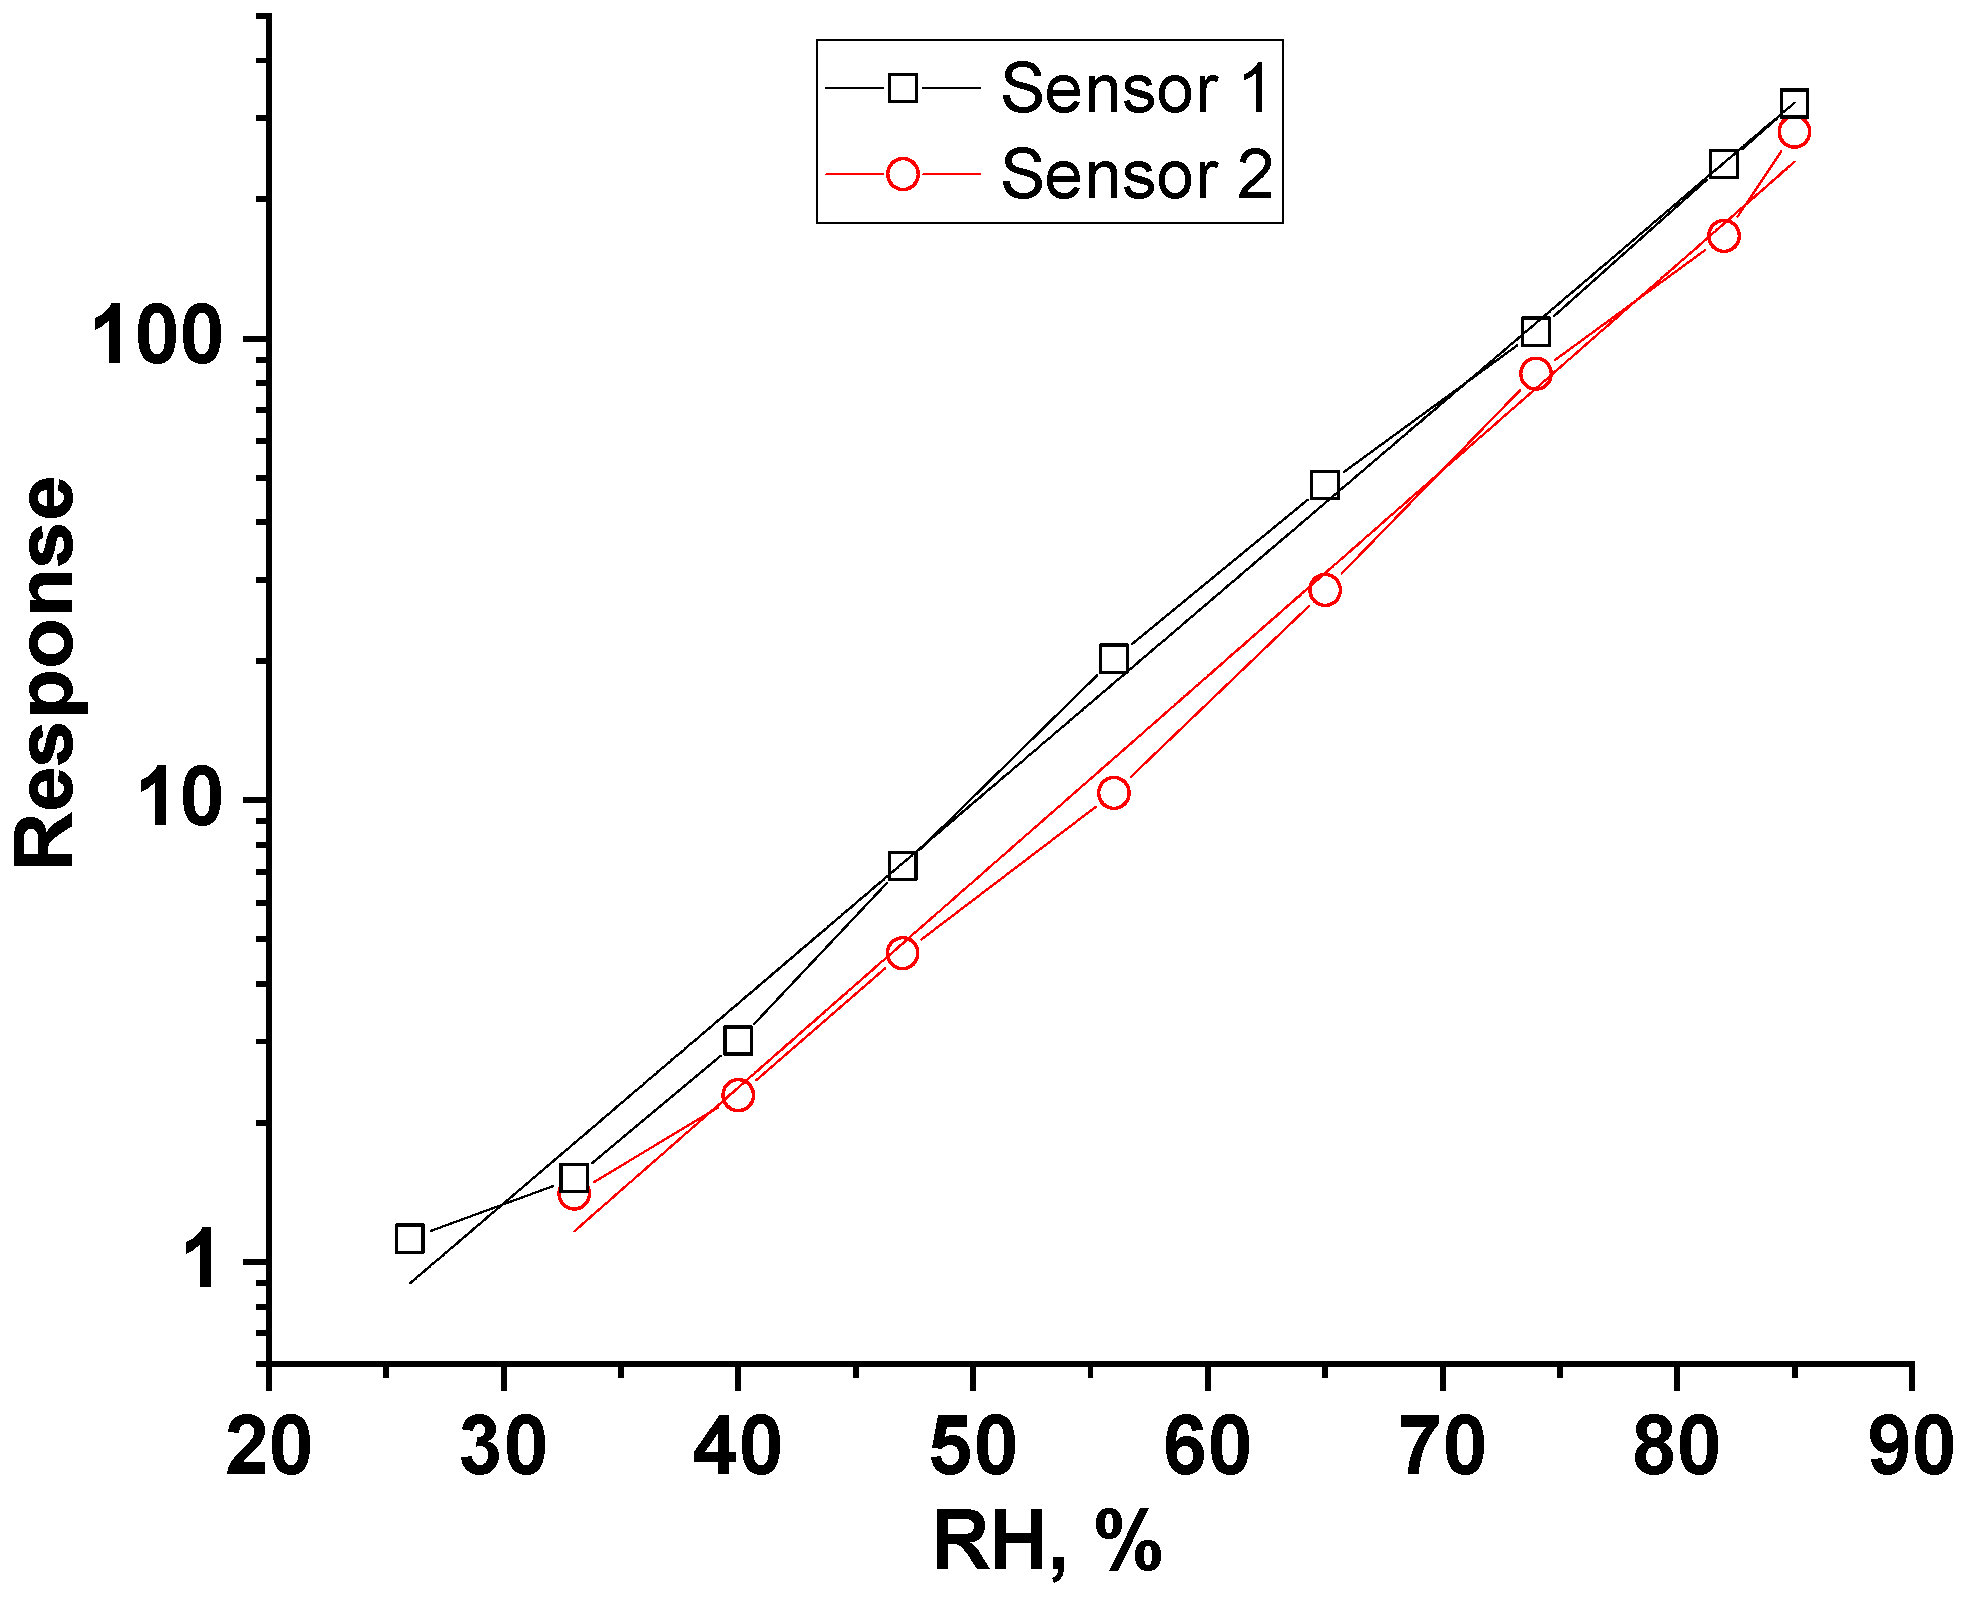
Comparing the sensors’ performances under 85% humidity (see Figure 7), Sensor 1 shows 13% higher sensor response as compared to Sensor 2 (322.9 and 280.5, respectively). The sensor also had negligible hysteresis within the measurement error.
Table 2 summarizes the sensors’ response and response/recovery times at different humidity levels associated with mullite Sensors 1 and 2. The response and recovery times of Sensor 1 (91 and 167 s, respectively) are longer than those of Sensor 2 (64 and 119 s, respectively), probably because of a higher surface area, due to the lower sintering temperature.
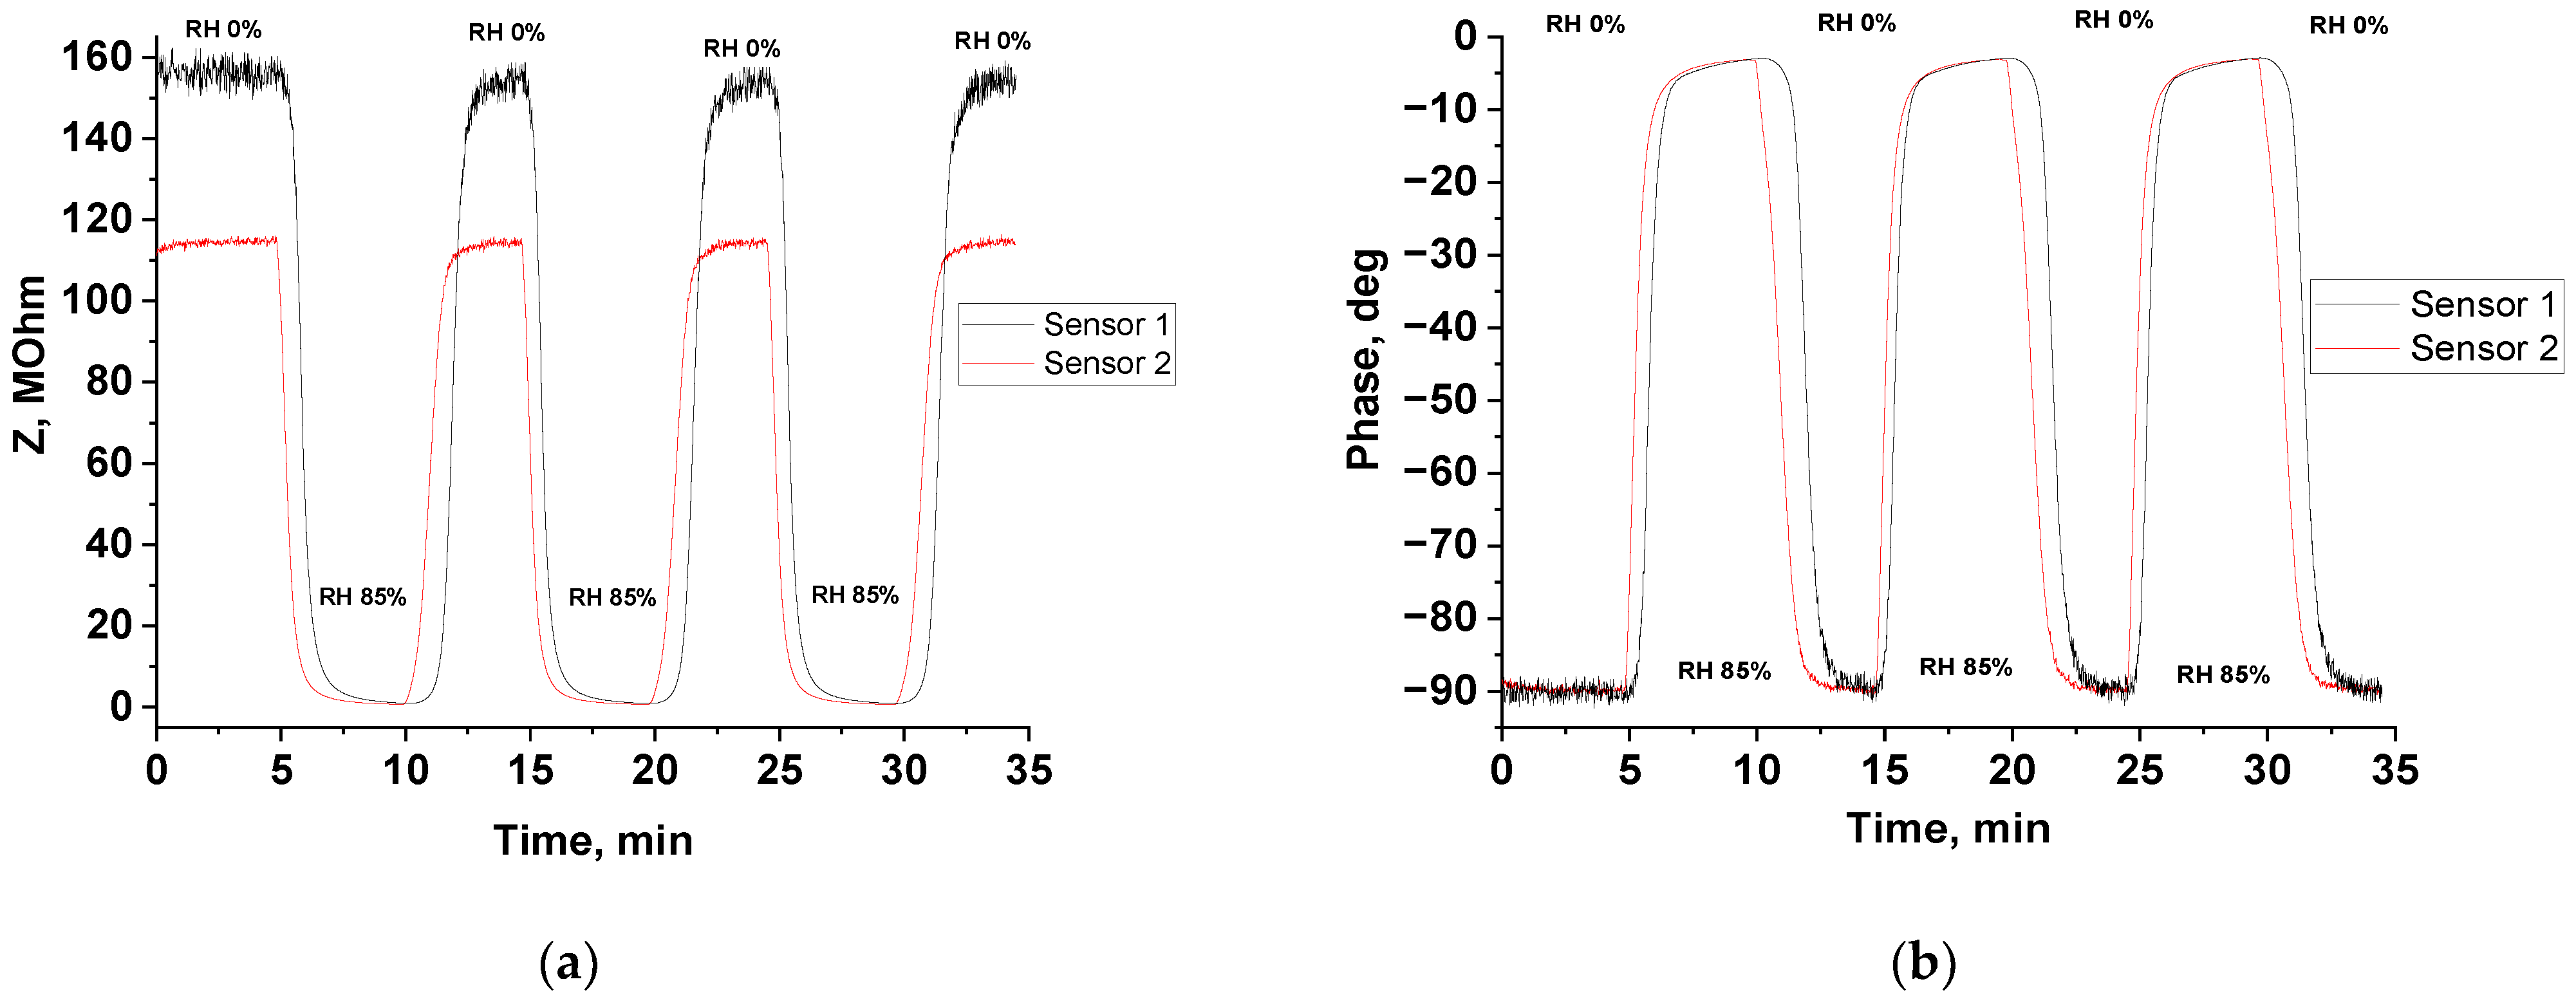
In Figure 8, three consecutive measurements on mullite Sensors 1 and 2 under 85% RH are displayed. Both sensors show an excellent repeatability.
The calibration curves of the mullite sensors are illustrated in Figure 9. The slopes (sensor sensitivity) are 0.0434 RH−1 and 0.0446 RH−1 for Sensor 1 and Sensor 2, respectively, when log(R) is plotted as a function of the relative humidity value.
The humidity-sensing mechanism of the sintered mullite sensor is based on the protonic conduction on the surface. When exposed to the humidity of the environment, the impedance changes in the mullite sensors depend on the number of adsorbed water molecules. The RH level directly dictates the number of adsorbed water molecules on the mullite’s surface. As the RH level increases, more water molecules are adsorbed, and this leads to a further decrease in the resistance value.
In Ref. [39], nanostructured ZnO, ZnO-TiO2 humidity sensors were investigated. At the first stage of adsorption process, the negatively charged oxygen species were electrostatically attached to the positively charged metallic ions of the sensing material and formed a hydroxide layer. Thereby, the grain surfaces adjacent to the pores are covered by a chemisorbed monolayer. With the increase in relative humidity, the first physisorbed layer forms when single water molecules bind to two surface hydroxyls. A hydronium group H3O+ is then formed through those molecules in the second layer that are singly bound to the underlying layer by hydrogen bonds.
A proton is thereby released to neighboring water molecules, which accept it while releasing another proton, and so on (this is the so-called Grotthuss chain-reaction mechanism) [17]. This proton is free to move along the water molecules and thus governs the sensor conductivity. At higher humidity levels, liquid water can also condense in pores, and electrolytic conduction can occur at the same time [16].
At low humidity levels, during the progressive formation of the first physisorbed layer of water molecules, the equivalent electrical circuit of oxidic humidity sensors is a parallel RC circuit [40,41]. The higher the degree of physical adsorption, the emerging ionic conduction and successive capillary water condensation, previously described, lead to a stronger decrease of the impedance of the film, as observed and supported by the phase change from almost −90° to about −3°. For these higher RH values, the equivalent circuit can be drawn by a number of (typically two) series-connected parallel RC circuits [40,41]. Then, a sweep in frequency (from 22 kHz to 100 kHz) was performed under 65% RH (Figure S7). The resistance and the capacitance of the two elements in parallel in the equivalent circuit were calculated and were equal to 60 MOhm and 4.94 × 10⁻¹⁴ F, respectively, at 53.7 kHz (at the apex of the Nyquist plot of the impedance diagram).
Tests were also performed at room temperature for ammonia (44 ppm), methane (100 ppm) and carbon dioxide (500 ppm), and nitrogenous oxide (2.5 ppm), as well as ethanol (68,800 ppm) and acetone (276,900 ppm) (Figures S1–S6, Supplementary Information). No interference towards the tested gases was observed, so the mullite sensors also exhibited a good selectivity with respect to humidity at room temperature.
Table 3 presents the results illustrated in this paper, and the recent literature data (of the last 5 years) on resistive sensors based on ceramic oxides; the obtained performances are rather promising. The response and recovery times can probably be further improved by printing more complex geometries to fully exploit the potentialities of DLP, as in Ref. [42].

4. Conclusions

In this work, 3D printed mullite substrates with two different porosities were fabricated to evaluate the effects of porosity and surface area on humidity sensitivity: one was sintered at 1400 °C, and the other one at 1450 °C. As a result of this difference, the resultant porosity of the samples affected the sensitivity of the sensors; this effect can be controlled by varying the heat treatment’s temperature.
At room temperature, the impedance value dropped downward, from 155 MΩ under dry air to 480 kΩ under 85 RH% for Sensor 1, and from 115 MΩ under dry air to 410 kΩ for Sensor 2. At low humidity levels, the impedance change is small, while above 19 RH%, the impedance of the sensor decreases sharply with the increase in humidity content. When the RH level changed from 0% to 85%, the response times were equal to 91 s for Sensor 1 and 64 s for Sensor 2, whereas the recovery times were equal to 167 s for Sensor 1 and 119 s for Sensor 2. In addition, tests carried out for ammonia (44 ppm), methane (100 ppm), carbon dioxide (500 ppm), and nitrogenous oxide (2.5 ppm), as well as ethanol (68,800 ppm) and acetone (276,900 ppm) showed no interference.
This work shows that resistive ceramic humidity sensors can be easily produced by 3D printing techniques and that their use in harsh environments (in corrosive atmospheres, for example) can be envisaged.

Supplementary Materials

The following supporting information can be downloaded at: https://www.mdpi.com/article/10.3390/ceramics7020053/s1, Figure S1: Response of the Sensor S2 to 500 ppm CO2 in air, Figure S2: Response of the Sensor S2 to 100 ppm CH4 in air, Figure S3: Response of the Sensor S2 to 2.5 ppm NO2 in air, Figure S4: Response of the Sensor S2 to 44 ppm NH3 in air, Figure S5: Response of the Sensor S2 to 276,900 ppm (27.69%) acetone in air, Figure S6: Response of the Sensor S2 to 68,800 ppm (6.88%) ethanol in air, Figure S7: Impedance diagram for the sensor S2 under 65% RH.

Author Contributions

Conceptualization, J.-M.T. and P.P.; methodology, Y.M., B.C. and A.B.; software, Y.M. and A.B.; validation, J.-M.T., P.P. and B.C.; formal analysis, J.-M.T.; investigation, Y.M. and A.B.; data curation, Y.M. and A.B.; writing—original draft preparation, Y.M.; writing—review and editing, all authors; supervision, J.-M.T. All authors have read and agreed to the published version of the manuscript.

Funding

This research received no external funding.

Institutional Review Board Statement

Not applicable.

Informed Consent Statement

Not applicable.

Data Availability Statement

The data presented in this study are available on request from the corresponding author.

Acknowledgments

The Authors greatly acknowledge the Interdepartmental laboratory SISCON (Safety of Infrastructures and Constructions) from Politecnico di Torino, for the use of the rheometer. The Authors also acknowledge Politecnico di Torino, for the grant to carry out research activity “Development of new materials and devices for the detection of gaseous pollutants”.

Conflicts of Interest

The authors declare no conflicts of interest.

References

  1. Barmpakos, D.; Kaltsas, G.A. Review on Humidity, Temperature and Strain Printed Sensors—Current Trends and Future Perspectives. Sensors 2021, 21, 739. [Google Scholar] [CrossRef] [PubMed]
  2. Esteban-Cubillo, A.; Tulliani, J.-M.; Pecharromán, C.; Moya, J.S. Iron-oxide nanoparticles supported on sepiolite as a novel humidity sensor. J. Eur. Ceram. Soc. 2007, 27, 1983–1989. [Google Scholar] [CrossRef]
  3. Céline Laville, C.P.; Deletage, J.-Y. Humidity sensors for a pulmonary function diagnostic microsystem. Sens. Actuators B Chem. 2001, 76, 304–309. [Google Scholar] [CrossRef]
  4. Tulliani, J.-M.; Baroni, C.; Zavattaro, L.; Grignani, C. Strontium-Doped Hematite as a Possible Humidity Sensing Material for Soil Water Content Determination. Sensors 2013, 13, 12070–12092. [Google Scholar] [CrossRef] [PubMed]
  5. Duraia, E.M.; Beall, G.W. Humidity sensing properties of reduced humic acid. Sens. Actuators B 2015, 220, 22–26. [Google Scholar] [CrossRef]
  6. Islam, T.; Nimal, A.T.; Mittal, U.; Sharma, M.U. A micro interdigitated thin film metal oxide capacitive sensor for measuring moisture in the range of 175–625 ppm. Sens. Actuators B 2015, 221, 357–364. [Google Scholar] [CrossRef]
  7. Nanto, H.; Minami, T.; Takata, S. Zinc-oxide thin-film ammonia gas sensors with high sensitivity and excellent selectivity. J. Appl. Phys. 1986, 60, 482–484. [Google Scholar] [CrossRef]
  8. Kim, Y.; Jung, B.; Lee, H.; Kim, H.; Lee, K.; Park, H. Capacitive humidity sensor design based on anodic aluminum oxide. Sens. Actuators B Chem. 2009, 141, 441–446. [Google Scholar] [CrossRef]
  9. Balde, M.; Vena, A.; Sorli, B. Fabrication of porous anodic aluminium oxide layers on paper for humidity sensors. Sens. Actuators B 2015, 220, 829–839. [Google Scholar] [CrossRef]
  10. Feng, X.; Chen, W.; Yan, L. Sens. and Actuators B: Chemical Free-standing dried foam films of graphene oxide for humidity sensing. Sens. Actuators B Chem. 2015, 215, 316–322. [Google Scholar] [CrossRef]
  11. Fernández-Ramos, M.D.; Ordóñez, Y.F.; Capitán-Vallvey, L.F.; De Vargas-Sansalvador, I.M.P.; Ballesta-Claver, J. Optical humidity sensor using methylene blue immobilized on a hydrophilic polymer. Sens. Actuators B Chem. 2015, 220, 528–533. [Google Scholar] [CrossRef]
  12. Jung, D.Y.; Yang, S.Y.; Park, H.; Shin, W.C.; Oh, J.G.; Cho, B.J.; Choi, S.Y. Interface engineering for high performance graphene electronic devices. Nano Converg. 2015, 2, 11. [Google Scholar] [CrossRef]
  13. Phan, D.-T.; Chung, G.-S. Effects of rapid thermal annealing on humidity sensor based on graphene oxide thin films. Sens. Actuators B Chem. 2015, 220, 1050–1055. [Google Scholar] [CrossRef]
  14. Su, P.-G.; Shiu, W.-L.; Tsai, M.-S. Flexible humidity sensor based on Au nanoparticles/graphene oxide/thiolated silica sol–gel film. Sens. Actuators B Chem. 2015, 216, 467–475. [Google Scholar] [CrossRef]
  15. Su, P.-G.; Wang, C.S. Novel flexible resistive-type humidity sensor. Sens. Actuators B Chem. 2007, 123, 1071–1076. [Google Scholar] [CrossRef]
  16. Traversa, E. Ceramic sensors for humidity detection: The state-of-the-art and future developments. Sens. Actuators B Chem. 1995, B23, 135–156. [Google Scholar] [CrossRef]
  17. Chen, Z.; Lu, C. Humidity Sensors: A Review of Materials and Mechanisms. Sens. Lett. 2005, 3, 274–295. [Google Scholar] [CrossRef]
  18. Lukaszewicz, J.P. Carbon-film-based humidity sensor containing sodium or potassium. Recovery effect. Sens. Actuators B Chem. 1999, 60, 184–190. [Google Scholar] [CrossRef]
  19. Varghese, O.K.; Kichambre, P.D.; Gong, D.; Ong, K.G.; Dickey, E.C.; Grimes, C.A. Gas sensing characteristics of multi-wall carbon nanotubes. Sens. Actuators B Chem. 2001, 81, 32–41. [Google Scholar] [CrossRef]
  20. Yao, Y.; Chen, X.; Guo, H.; Wu, Z. Graphene oxide thin film coated quartz crystal microbalance for humidity detection. Appl. Surf. Sci. 2011, 257, 7778–7782. [Google Scholar] [CrossRef]
  21. Chu, J.; Peng, X.; Feng, P.; Sheng, V.; Zhang, J. Study of humidity sensors based on nanostructured carbon films produced by physical vapor deposition. Sens. Actuators B Chem. 2013, 178, 508–513. [Google Scholar] [CrossRef]
  22. Tulliani, J.-M.; Inserra, B.; Ziegler, D. Carbon-Based Materials for Humidity Sensing: A Short Review. Micromachines 2019, 10, 232. [Google Scholar] [CrossRef] [PubMed]
  23. Afify, A.S.; Ahmad, S.; Khushnood, R.A.; Jagdale, P.; Tulliani, J.-M. Elaboration and characterization of novel humidity sensor based on micro-carbonized bamboo particles. Sens. Actuators B Chem. 2017, 239, 1251–1256. [Google Scholar] [CrossRef]
  24. Ziegler, D.; Palmero, P.; Giorcelli, M.; Tagliaferro, A.; Tulliani, J.-M.; Ziegler, D.; Palmero, P.; Giorcelli, M.; Tagliaferro, A.; Tulliani, J.-M. Biochars as Innovative Humidity Sensing Materials. Chemosensors 2017, 5, 35. [Google Scholar] [CrossRef]
  25. Konta, J. Clay and man: Clay raw materials in the service of man. Appl. Clay Sci. 1995, 4, 269–335. [Google Scholar] [CrossRef]
  26. Murray, H.H. Traditional and new applications for kaolin, smectite, and palygorskite: A general overview. Appl. Clay Sci. 2000, 17, 207–221. [Google Scholar] [CrossRef]
  27. Choy, J.-H.; Choi, S.-J.; Oh, J.-M.; Park, T. Clay minerals and layered double hydroxides for novel biological applications. Appl. Clay Sci. 2007, 36, 122–132. [Google Scholar] [CrossRef]
  28. Andersson, H.; Manuilskiy, A.; Unander, T.; Lidenmark, C.; Forsberg, S.; Nilsson, H.-E. Inkjet printed silver nanoparticle humidity sensor with memory effect on paper. IEEE Sens. J. 2012, 12, 1901–1905. [Google Scholar] [CrossRef]
  29. Burman, D.; Santra, S.; Pramank, P.; Guha, P. Pt decorated MoS2 nanoflakes for ultrasensitive resistive humidity sensor. Nanotechnology 2018, 29, 115504. [Google Scholar] [CrossRef]
  30. Nikulicheva, T.B.; Zakhvalinskii, V.S.; Pilyuk, E.A.; Nikulin, I.S.; Vyazmin, V.V.; Mishunin, M.V. New humidity sensor material (CaSO4⋅2H2O)0.975-(CuSO4⋅5H2O)0.025. Materialia 2023, 27, 101662. [Google Scholar] [CrossRef]
  31. Wu, K.; Fei, T.; Zhang, T. Humidity Sensors Based on Metal–Organic Frameworks. Nanomaterials 2022, 12, 4208. [Google Scholar] [CrossRef] [PubMed]
  32. Ku, C.-A.; Chung, C.-K. Advances in Humidity Nanosensors and Their Application: Review. Sensors 2023, 23, 2328. [Google Scholar] [CrossRef] [PubMed]
  33. Hotza, D.; Greil, P. Review: Aqueous tape casting of ceramic powders. Mater. Sci. Eng. 1995, A202, 206–217. [Google Scholar] [CrossRef]
  34. Somiya, S.; Hirata, Y. Mullite Powder Technology and Applications in Japan. Bull. Am. Ceram. Soc. 1991, 70, 1624–1632. [Google Scholar]
  35. Montanaro, L.; Tulliani, J.M.; Perrot, C.; Negro, A. Sintering of industrial mullites. J. Eur. Ceram. Soc. 1997, 17, 14, 1715–1723. [Google Scholar] [CrossRef]
  36. Dortmund Data Bank (DDB). Available online: http://ddbonline.ddbst.com/antoinecalculation/antoinecalculationcgi.exe (accessed on 29 May 2024).
  37. Firehouse. Available online: https://www.firehouse.com/rescue/article/10574732/hazmat-math-calculating-vapor-concentrations (accessed on 29 May 2024).
  38. Ziegler, D.; Boschetto, F.; Marin, E.; Palmero, P.; Pezzotti, G.; Tulliani, J.M. Rice husk ash as a new humidity sensing material and its aging behavior. Sens. Actuators B Chem. 2021, 328, 129049. [Google Scholar] [CrossRef]
  39. Srivastava, R.; Yadav, B. Nanostructured ZnO. ZnO-TiO2 and ZnO-Nb2O5 as solid state humidity sensor. Adv. Mater. Lett. 2012, 3, 197–203. [Google Scholar] [CrossRef]
  40. Zhang, Y.; Chen, Y.; Zhang, Y.; Cheng, X.; Feng, C.; Chen, L.; Zhou, J.; Ruan, S. A novel humidity sensor based on NaTaO3 nanocrystalline. Sens. Actuators B Chem. 2012, 174, 485–489. [Google Scholar] [CrossRef]
  41. Georgieva, B.; Nenova, Z.; Podolesheva, I.; Pirov, J.; Nenov, T. Investigation of humidity sensors based on Sn-O-Te films by impedance spectroscopy. Bulg. Chem. Commun. 2013, 45, 63–67. [Google Scholar]
  42. Qi, G.; Weng, Y.; Chen, J. Preparation of porous SnO2-based ceramics with lattice structure by DLP. Ceram. Int. 2022, 48, 14568–14577. [Google Scholar] [CrossRef]
  43. Burman, D.; Choudhary, D.S.; Guha, P.K. ZnO/MoS2-based enhanced humidity sensor prototype with android app interface for mobile platform. IEEE Sens. J. 2019, 19, 3993–3999. [Google Scholar] [CrossRef]
  44. Kundu, S.; Majumder, R.; Ghosh, R.; Pal Chowdhury, M. Superior positive relative humidity sensing properties of porous nanostructured Al:ZnO thin films deposited by jet-atomizer spray pyrolysis technique. J. Mater. Sci Mater. Electron. 2019, 30, 4618–4625. [Google Scholar] [CrossRef]
  45. Babu Reddy, L.P.; Megha, R.; Raj Prakash, H.G.; Ravikiran, Y.T.; Ramana, C.H.V.V.; Vijaya Kumari, S.C.; Kim, D. Copper ferrite-yttrium oxide (CFYO) nanocomposite as remarkable humidity sensor. Inorg. Chem. Commun. 2019, 99, 180–188. [Google Scholar] [CrossRef]
  46. Manut, A.; Zoolfakar, A.S.; Mamat, M.H.; Ab Ghani, N.S.; Zolkapli, M. Characterization of Titanium Dioxide (TiO2) Nanotubes for Resistive-type Humidity Sensor. In Proceedings of the IEEE International Conference on Semiconductor Electronics (ICSE), Kuala Lumpur, Malaysia, 28–29 July 2020; pp. 104–107. [Google Scholar]
  47. Pi, C.; Chen, W.; Zhou, W.; Yan, S.; Liu, Z.; Wang, C.; Guo, Q.; Qiu, J.; Yu, X.; Liu, B.; et al. Highly stable humidity sensor based on lead-free Cs3Bi2Br9 perovskite for breath monitoring. J. Mater. Chem. C 2021, 9, 11299–11305. [Google Scholar] [CrossRef]
  48. Duy, L.T.; Baek, J.Y.; Mun, Y.J.; Seo, H. Patternable production of SrTiO3 nanoparticles using 1-W laser directly on flexible humidity sensor platform based on ITO/SrTiO3/CNT. J. Mater. Sci. Technol. 2021, 71, 186–194. [Google Scholar] [CrossRef]
  49. Doroftei, C.; Leontie, L. Porous nanostructured gadolinium aluminate for high-sensitivity humidity sensors. Materials 2021, 14, 7102. [Google Scholar] [CrossRef] [PubMed]
  50. El-Denglawey, A.; Manjunatha, K.; Vijay Sekhar, E.; Chethan, B.; Zhuang, J.; Jagadeesha Angadi, V. Rapid response in recovery time, humidity sensing behavior and magnetic properties of rare earth(Dy & Ho) doped Mn–Zn ceramics. Ceram. Int. 2021, 47, 28614–28622. [Google Scholar]
  51. Shah, Z.; Shaheen, K.; Arshad, T.; Ahmad, B.; Khan, S.B. Al doped Sr and Cd metal oxide nanomaterials for resistive response of humidity sensing. Mater. Chem. Phys. 2022, 290, 126632. [Google Scholar] [CrossRef]
  52. Subki, A.S.R.A.; Mamat, M.H.; Musa, M.Z.; Abdullah, M.H.; Shameem Banu, I.B.; Vasimalai, N.; Ahmad, M.K.; Nafarizal, N.; Suriani, A.B.; Mohamad, A.; et al. Effects of varying the amount of reduced graphene oxide loading on the humidity sensing performance of zinc oxide/reduced graphene oxide nanocomposites on cellulose filter paper. J. Alloys Compd. 2022, 926, 166728. [Google Scholar] [CrossRef]
  53. Dubey, R.S.; Srilali, S.; Ravikiran, Y.T.; Babu, G.S.; Katta, K.V. Synthesis and characterization of Znx-1Al2O4(TiO2)x nanocomposite ceramics and their humidity sensing properties. J. Mater. Sci. 2022, 57, 2636–2649. [Google Scholar] [CrossRef]
  54. Yasin, E.; Javed, Y.; Imran, Z.; Anwar, H.; Shahid, M. Exploration of dielectric and humidity sensing properties of dysprosium oxide nanorods. Eur. Phys. J. Plus 2023, 138, 1050. [Google Scholar] [CrossRef]
  55. Mohamed Zahidi, M.; Mamat, M.H.; Subki, A.S.R.A.; Abdullah, M.H.; Hassan, H.; Ahmad, M.K.; Bakar, S.A.; Mohamed, A.; Ohtani, B. Formation of a nanorod-assembled TiO2 actinomorphic-flower-like microsphere film via Ta doping using a facile solution immersion method for humidity sensing. Nanomaterials 2023, 13, 256. [Google Scholar] [CrossRef] [PubMed]
  56. Zhang, Z.; Li, F.; Zheng, Y. Highly sensitive resistive humidity sensor based on strontium-doped lanthanum ferrite nanofibers. Sens. Actuators A Phys. 2023, 358, 114435. [Google Scholar] [CrossRef]
  57. Ravichandran, R.; Quine, S.D.; Arularasu, M.V. Humidity sensing performance of nitrogen doped reduced graphene oxide-WO3 composite. BioNanoSci 2023, 13, 2205–2214. [Google Scholar] [CrossRef]
  58. Dhariwal, N.; Yadav, P.; Kumari, M.; Jain, P.; Sanger, A.; Kumar, V.; Thakur, O.P. Iron oxide-based nanoparticles for fast-response humidity sensing, real-time respiration monitoring, and noncontact sensing. IEEE Sens. J. 2023, 23, 22217–22224. [Google Scholar] [CrossRef]
  59. Kumar, A.; Kumari, P.; Kumar, M.S.; Gupta, G.; Shivagan, D.D.; Bapna, K. SnO2 nanostructured thin film as humidity sensor and its application in breath monitoring. Ceram. Int. 2023, 49, 24911–24921. [Google Scholar] [CrossRef]
  60. Malik, P.; Duhan, S.; Malik, R. A high-performance humidity sensor based on 3D porous SnO2-encapsulated MCM-48 for real-time breath monitoring and contactless gesture detection. Mater. Adv. 2024, 5, 2510–2525. [Google Scholar] [CrossRef]
  61. Jiang, W.; Su, M.; Zheng, Y.; Fei, T. Efficient electron transfer through interfacial water molecules across two-dimensional MoO3 for humidity sensing. ACS Appl. Mater. Interfaces 2024, 16, 7406–7414. [Google Scholar] [CrossRef]
  62. Huang, S.; Shan, H.; Zhao, Y.; Ren, Y.; Gu, X. Preparation of humidity sensors based on CsPbBr3 quantum dots for applications in microcrack detection. Chin. J. Inorg. Chem. 2024, 40, 383–393. [Google Scholar]
Figure 1. Schematic diagram of thermal de-binding and sintering cycles.
Ceramics 07 00053 g001
Figure 2. XRD patterns of the as-received mullite (m: mullite, c: cristobalite, A: aluminum oxide, a: corundum).
Ceramics 07 00053 g002
Figure 3. Optical micrograph of the 3D printed mullite sensor with screen-printed interdigitated electrodes, sintered at 1400 °C for 60 min.
Ceramics 07 00053 g003
Figure 4. FE-SEM micrographs of the 3D printed mullite sintered at 1400 °C (a,c) and 1450 °C (b,d) for 1 h.
Ceramics 07 00053 g004aCeramics 07 00053 g004b
Figure 5. Response as a function of relative humidity value for mullite Sensor 1, sintered at 1400 °C: (a) impedance variation and (b) phase variation.
Ceramics 07 00053 g005
Figure 6. Response as a function of relative humidity values for mullite Sensor 2, sintered at 1450 °C: (a) impedance variation and (b) phase variation.
Ceramics 07 00053 g006
Figure 7. Responses of Sensors 1 and 2 at different RH values (in the range 26–85% RH).
Ceramics 07 00053 g007
Figure 8. Repeatability measurements of mullite Sensors 1 and 2 under 85% RH: (a) impedance variation and (b) phase variation.
Ceramics 07 00053 g008
Figure 9. Calibration curves of mullite Sensor 1 and mullite Sensor 2 towards different RH values at room temperature.
Ceramics 07 00053 g009
Table 1. Particle size (µm) corresponding to 10% (∅10), 50% (∅50) and 90% (∅90) of the cumulative distribution of the as-received and sonicated (5 min) mullite powders from laser granulometry.
10 (µm)50 (µm)90 (µm)
As received0.9028.70106.00
5 min sonication0.581.764.36
Table 2. The sensors’ response and response/recovery times at different humidity levels associated with mullite Sensors 1 and 2.
HumiditySensor Response (R = Zo/Zg)Response Time, sRecovery Time, s
Sensor 1Sensor 2Sensor 1Sensor 2Sensor 1Sensor 2
19%1.01.0
26%1.11.1
33%1.51.44063726735
40%3.02.33503826636
47%7.24.72552387146
56%20.210.41741748756
65%48.128.513012211371
74%103.383.91179712281
82%238.5166.99370149104
85%322.9280.59164167119
Table 3. Comparison of mullite 3D printed sensor’s performance with those in described in recent literature data on resistive sensors based on ceramic oxides.
MaterialSensor Response,
R = Zo/Zg
Response
Time, s
Recovery
Time, s
Reference
Pt decorated MoS2 nanoflakes~4000 at 85% RH92 154[29]
ZnO/MoS2~301 at 85% RH138166[43]
Porous aluminum-doped ZnO733% at 90% RH~238~202[44]
Copper ferrite-yttrium oxide nanocomposite4895 at 97% RH923[45]
Titanium dioxide nanotubes58.5 at 90% RHNANA[46]
Cs3Bi2Br9 perovskite987 at 90% RH5.566.24[47]
SrTiO3 nanoparticles1.12 at 85% RH100300[48]
GdAlO38000 at 97% RH4560[49]
Mn0.5Zn0.5DyxHoyFe2−xO4 (x = 0.005 to 0.03) nanoparticles99% at 97% RH9018[50]
Al–Sr and Al–Cd nano-materials2.87 at 95% RH
3.19 at 95% RH
60
44
29
45
[51]
Reduced graphene oxide/zinc oxide nanostructured powder172 at 90% RHNANA[52]
Znx−1Al2O4(TiO2)x265 at 97% RH19528[53]
Dy2O3 nanorods15 at 97% RH25[54]
Ta-doped TiO2/reduced graphene oxide232% at 90% RH4.23.3[55]
Sr-doped LaFeO3 nanofibers60,597 at 90% RHNANA[56]
N-doped graphene oxide-WO33427 at 98% RH2453[57]
Nanosized α-Fe2O3 nanoparticles48,569 at 95% RH94[58]
(CaSO4·2H2O)0.975-(CuSO4·5H2O)0.0256.75 at 90% RH53[30]
SnO2 thin film3.1 at 95% RH84576[59]
Porous SnO2/MCM-48105 at 98% RH912[60]
2D MoO34024 at 75% RH840[61]
Perovskite CsPbBr3-Fe quantum dots1.1 at 70% RH3838[62]
Mullite 322.9 at 85% RH91167This work
Disclaimer/Publisher’s Note: The statements, opinions and data contained in all publications are solely those of the individual author(s) and contributor(s) and not of MDPI and/or the editor(s). MDPI and/or the editor(s) disclaim responsibility for any injury to people or property resulting from any ideas, methods, instructions or products referred to in the content.