Abstract
In this work, the physical characterization of LiGdxY1−xF4 (x = 0.05, 0.3, 0.7, and 1.0) and LiGdF4:Eu3+ microparticles was performed. The distribution coefficient of LiGdxY1−xF4 (x = 0.05) was determined for the first time (0.84). Based on kinetic characterization data, the LiGdF4 sample was chosen for further Eu3+ doping (0.1 and 1.0 at.%). For the LiGdF4:Eu3+ sample, Eu3+ emission was clearly observed under the excitation of Gd3+. This fact indicates an effective energy transfer from Gd3+ to Eu3+. The temperature-dependent spectral characterization of the LiGdF4:Eu3+ (1.0%) sample revealed that in the 30–250 K temperature range, a broad emission peak is evidenced. Its intensity sharply increases with the temperature decrease. We made a suggestion that this phenomenon is related to the irradiation-induced defects. The integrated luminescence intensity ratio of this broad peak and the Eu3+ emission were taken as temperature-dependent parameters. The sensitivity values are very competitive, and the first maximum occurs at 174 K (3.18%/K). The kinetic characteristics of both Gd3+ and Eu3+ did not demonstrate a notable temperature dependence. The LiGdF4:Eu3+ sample showed the possibility of being used as an optical temperature sensor, operating in the cryogenic temperature range.
1. Introduction
Rare-earth-doped and un-doped nano- and microsized LiREF4 (RE = rare-earth ions) crystals are considered highly promising materials for quantum electronics, solar cells, optical temperature sensing, and bioimaging [1,2,3,4,5,6,7,8]. The doping—rare-earth ions—are characterized by a partially filled 4f shell that is effectively shielded by 5 s2 and 5 p6 orbitals. Therefore, the spectrum of rare-earth-doped luminescent materials consists of narrow and intense luminescence peaks. Compared with other luminescent materials (e.g., organic dye, quantum dots, etc.), rare-earth-doped luminescent materials have many advantages, such as a sharp emission and long luminescence lifetime, good photochemical and thermal stability [9], and a lack of photobleaching, etc. [10]. The luminescent properties of RE-doped fluoride materials are mainly influenced by the host matrix, as well as the doping ions. Hence, the optimal host–doping ion combinations are necessary for efficient luminescence processes. Among the RE ions, the Eu3+/Gd3+ ion pair seems to be promising and is less studied. Indeed, the Gd3+ ion shows intense luminescence due to the f–f transitions in numerous hosts, demonstrating a strong emission in the 290–312 nm range [11]. The luminescence and laser generation in this spectral range is highly demanded in the treatment of skin diseases, such as vitiligo and psoriasis [12]. In turn, Eu3+ itself has a strong temperature sensitivity in relation to its spectral–kinetic characteristics [13]. In the case of the Gd3+/Eu3+ ion pair, recent studies have demonstrated a significant enhancement of Eu3+ luminescence under UV Gd3+ excitation due to the Gd3+→Eu3+ energy transfer process. Moreover, materials doped with Gd3+ and Eu3+ have been proposed as promising materials for red lasers [2,4,14]. However, the Gd3+/Eu3+ ion pair is significantly less studied in terms of its temperature-dependent spectral–kinetic characterization, compared to such widespread ion pairs as Nd3+/Yb3+ [15], Er3+/Yb3+ [16], Eu3+/Tb3+ [17,18], and Ce3+/Yb3+ [19]. The LiYF4 matrix was chosen as the host, which decreases the non-radiative relaxation due to the low phonon energy of the host matrix. The Gd3+/Eu3+ combination was used as a donor/acceptor pair due to the presence of phonon-assisted energy transfer between them, which leads to potential temperature-dependent spectral–kinetic characteristics of the system. In turn, Eu3+ demonstrates luminescence in the visible part of the spectrum. The ability to convert UV into visible light is highly required due to the increasing need for silicon solar cell efficiency [14]. For these reasons, a thorough and detailed investigation of the spectral–kinetic characteristics of LiGdXY1−XF4: Eu3+ is very useful for the abovementioned applications. The main novelty of this work is that we characterize a set of samples (LiGdXY1−XF4 (X = 0.05, 0.3, 0.7, and 1.0)) in order to choose a suitable one for Eu3+ doping. Additionally, the distribution coefficient of LiGdxY1−xF4 (x = 0.05) is determined for the first time. The crystals with different Gd3+ concentrations were successfully prepared using the Bridgman–Stockbarger method and, then, they were mechanically milled into microparticles. The structural and photoluminescence properties were investigated. The LiGdxY1−xF4:Eu3+ particles showed efficient energy transfer and high temperature sensitivity over a wide temperature range. This observation allows them to be used as coatings for solar panels, as well as luminescent temperature sensors. The objective of this study was to estimate the possibility of using LiYXGd1−XF4 and Eu3+:LiGdF4 phosphors in optical temperature sensing. The tasks were the synthesis and the spectral–kinetic characterization of Gd3+ in LiYXGd1−XF4 in order to choose an appropriate ratio of Gd3+ and Y3+ ions, and the spectral–kinetic characterization of Eu3+ in Eu3+:LiYXGd1−XF4 in the 10–320 K temperature range.
2. Materials and Methods
In this work, we investigated LiGdxY1−xF4 (X = 0.05, 0.3, 0.5, 0.7, and 1.0) and Eu3+ (0.1 and 1.0 at.%):LiGdF4 crystals. Optically perfect, single LiGdxY1−xF4 crystals were grown using the Bridgman–Stockbarger technique, using a growth furnace with a specially designed heating unit. The comprehensive crystal growth procedure is described in our previous work [7]. To record the absorption spectra, a DFS-452 spectrograph (1200 ruling/mm lattice, 0.5–0.2 nm/mm inverse linear dispersion, 120,000 theoretical resolution of the spectrograph, spectral resolution 0.3 nm) and a broadband light source (deuterium lamp) were used. Elements analysis was carried out by means of energy-dispersive X-ray spectroscopy (EDX), using a scanning electron microscope, Dimension FastScan (Santa Barbara, CA, USA). The concentration of both Eu3+ and Gd3+ ions was calculated as a mass proportion of the EuF3 and GdF3 starting materials in the melt. The phase composition of the particles was confirmed by means of the X-ray diffraction method (XRD), using a Bruker D8 ADVANCE X-ray diffractometer (Cu Kα radiation, λ = 0.154 nm). The XRD simulation was carried out using VESTA software, version 3 (Ibaraki, Japan). The luminescence spectra were recorded by a CCD spectrometer StellarNet, (Tampa, FL, USA) (~1.0–2.0 nm spectral resolution). The optical excitation of the samples was performed using a LOTIS TII tunable laser, LT-2211A (λex (Gd3+) = 274 nm, τ = 10 ns, ν = 10 Hz). The experiments were performed in the 10–320 K temperature range via the so-called “cold finger” method. The temperature control was carried out using a thermostatic cooler “CRYO industries”, which had a LakeShore Model 325 (Westerville, OH, USA) temperature controller. The luminescence decay time curves were recorded using a Bordo 211A digital oscillograph (10 bit and 200 MHz bandwidth), an MDR-3 monochromator, and a PEM-62 photomultiplier (working spectral range ~ 600–1200 nm). All the calculations were carried out using the Origin Pro 9.0 software.
3. Results
3.1. XRD Characterization of the LiGdXY1−XF4 Samples
The phase composition of the LiGdxY1−xF4 (X = 0.05, 0.3, 0.7, and 1.0) samples was confirmed via XRD method. The XRD patterns of the LiGdxY1−xF4 samples, the simulation of LiGdF4, and JCPDS are presented in Figure 1.
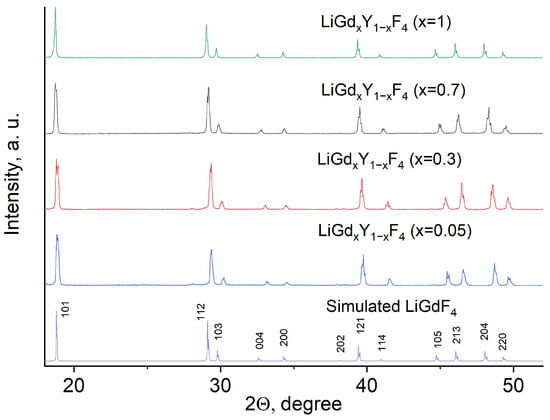
Figure 1.
The XRD patterns, simulation, and JCPDS of the LiGdxY1−xF4 (X = 0.05, 0.3, 0.7, and 1.0) samples.
The XRD patterns correspond to the trigonal structure of both LiYF4 and LiGdF4 matrices. The well-defined peaks, the absence of impurity peaks, and the absence of amorphous phases are seen. The experimental XRD patterns agree with the reference patterns from the VESTA software, version 3. They also agree with JCPDS No. 027–1236 [20]. According to the literature data, the lattice parameters of LiGdF4 are a = 0.5235 (1) nm, c = 1.1019 (2) nm [21]. In its turn, the lattice parameters of LiYF4 are a = 0.5164 (1) nm, c = 1.074 (2) nm [22]. The XRD peaks also slightly shift toward higher angles with the decrease in Gd3+ content, expressing the Bragg law. The calculated lattice parameters are in agreement with the above-mentioned values and gradually increase with the increase in Gd3+ content (Table S1, Supplementary Materials).
3.2. Spectral–Kinetic Characterization of the LiGdXY1−XF4 Samples
For this work, optically perfect crystals (65 mm in length) were grown. Since the undoped LiGdXY1−XF4 (X = 0.05, 0.3, 0.5, 0.7, and 1.0) crystals are insufficiently studied, there is no information in the literature about the distribution coefficient of Gd3+; therefore, we measured the distribution coefficient of the Gd3+ ions in the LiYF4 matrix. The information concerning the distribution coefficient of Gd3+ is very important for quantum electronics and laser technologies [23]. For this purpose, the LiYF4:Gd3+ (5 at.%) was prepared according to Figure 2a. The setup is shown in Figure 2b. The photo of the sample is represented in Figure S1 (Supplementary Materials).
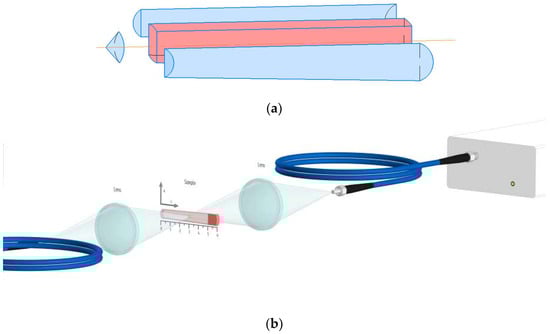
Figure 2.
(a) Preparation of the crystal for the experiment; (b) schematic representation of the experimental set-up.
For the crystal growth procedure by the Bridgman method for low crystal pulling rates (a few millimeters per hour), it can be assumed that the solution is completely mixed in the liquid. Therefore, to characterize the impurity distribution in the grown crystal, the Scheil equation can be used [24]:
where C0 is the concentration of the starting material, x—volume fraction of solid, and k—distribution coefficient. The integral absorbance A is proportional to the concentration [25] of Gd3+ ions in the crystal. Therefore, the Scheil equation can be rewritten as follows:
Thus, to determine the partition coefficient, we recorded the absorption spectra of Gd3+ ions in the 270–280 nm spectral range (Figure S2, Supplementary Materials). The absorption spectra were recorded along the crystal at points with an increment of 3 mm. Next, the integral absorbance was calculated in the 270–280 nm wavelength range and the dependence of the integral absorbance in arbitrary units on the solidified fraction was plotted. Fitting the graph according to the Scheil equation gives the distribution coefficient and integral absorbance A0 for the initial concentration C0. The initial concentration is the concentration of Gd3+ that we put into the mixture at the beginning of growth. It is equal to 5%. Taking into account the initial concentration and the corresponding integral absorption, we can recalculate the integral absorption data into concentration at the corresponding points. The data obtained in this way is presented in Figure 3. The energy-dispersive X-ray spectroscopy (EDX) confirms the obtained Gd3+ distribution. To obtain the standard deviations, we performed EDX measurements from five different parts of the crystal cap, middle part, and spout.
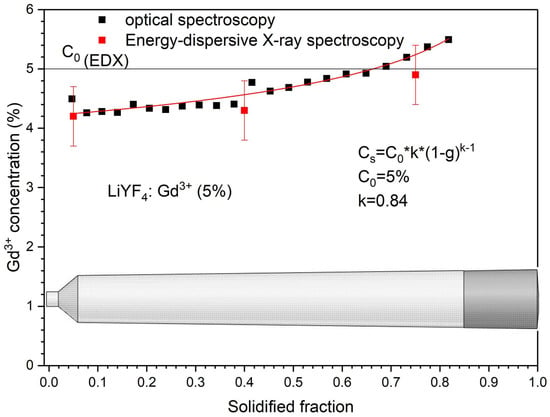
Figure 3.
The distribution of Gd3+ ions in LiGdxY1−xF4 (x = 0.05) crystal volume. Energy-dispersive X-ray spectroscopy (EDX) confirms the obtained Gd3+ distribution.
The energy level diagram and excitation scheme of the Gd3+/Eu3+ system are represented in Figure 4. The Gd3+—Eu3+ energy transfer process will be discussed below.
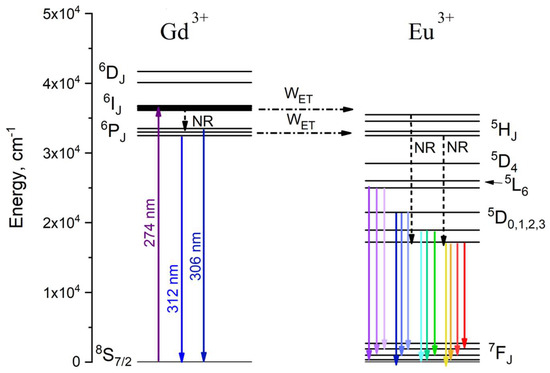
Figure 4.
Energy level diagram and excitation scheme of Gd3+/Eu3+ ion pair. λex = 274 nm corresponds to 8S7/2—6IJ absorption band of Gd3+. The dotted arrows explain the energy transfer (WET) from Gd3+ to Eu3+
The 274 nm excitation wavelength corresponds to the 8S7/2—6IJ absorption band of Gd3+. The luminescence decay times of 6P7/2—8S7/2 (at 312 nm) as functions of temperature are represented in Figure 5. The luminescence decay curves detected at different temperatures are represented in Figure S3 (Supplementary Materials).
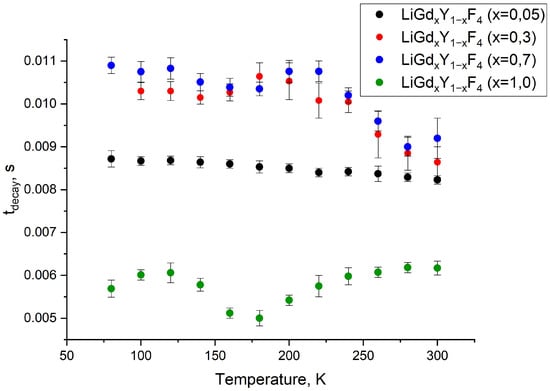
Figure 5.
The luminescence decay time (tdecay) of the LiGdxY1−xF4 samples (x = 0.05; 0.3; 0.7 and 1.0) at a wavelength of 312 nm (6P7/2—8S7/2) in the 100–300 K temperature range.
There are very few papers devoted to the concentration quenching of Gd3+ ions, especially in fluoride hosts (single Gd3+-doped systems). The difference in decay times for LiGd0.05Y0.95F4 and both LiGd0.3Y0.7F4 and LiGd0.7Y0.3F4 can be explained by the fact that there can be reabsorption of the luminescence that leads to the increase in the lifetime of the excited state. In more detail, we found in [26] that at 300 K the decay rate of 6P7/2 (Gd3+) in LiYF4-1%Gd3+ is equal to 115 (s−1); hence, the decay time can be calculated as the inverse value = 8.7 ms. In our Gd3+ (5%): LiYF4 sample, the decay time is also around 8.5 ms. It can be suggested that at lower concentrations, the decay time of 6P7/2 (Gd3+) is around 8.5 ms. With higher concentrations, the contribution of reabsorption is higher than the contribution of concentration quenching. This leads to an increase in the decay time. Thus it can be suggested that, for the LiGdF4 sample, the contribution of concentration quenching is predominant, and a decrease in the decay time is observed. It can be seen that for the LiGdxY1−xF4 samples (x = 0.05; 0.3 and 0.7), the luminescence decay time slightly shortens with the temperature increase. This expected tendency can be explained by the multiphonon relaxation on defects. Indeed, its efficiency decreases with the temperature increase. In its turn, for the LiGdF4 sample, the opposite trend is observed: an increase in the luminescence decay time with the increase in the temperature, starting from 180 K. For this sample, the reabsorption of the luminescence plays a more significant role. The reabsorption efficiency can rise with the temperature increase due to the broadening of the absorption bands. This is the same phenomenon we earlier observed for Yb3+ ions [27]. However, the observed phenomena require additional investigation. After the kinetic characterization of the LiGdxY1−xF4 samples, the LiGdF4 one was selected for further doping with Eu3+ because there are at least two temperature-dependent processes: multiphonon relaxation on defects and reabsorption of the luminescence. It is known that to obtain a higher temperature sensitivity of phosphors, as many temperature-dependent processes as possible are needed, which can eventually strengthen each other, resulting in higher temperature sensitivity. To avoid concentration quenching, the 0.1 and 1.0 at.% concentrations of Eu3+ were chosen. Room-temperature luminescence spectra of the LiGdF4:Eu3+ (0.1 (a) and 1.0 at.% (b)) sample under Gd3+ excitation (8S7/2—6PJ absorption band, λex = 274 nm) are represented in Figure 6a,b, respectively.
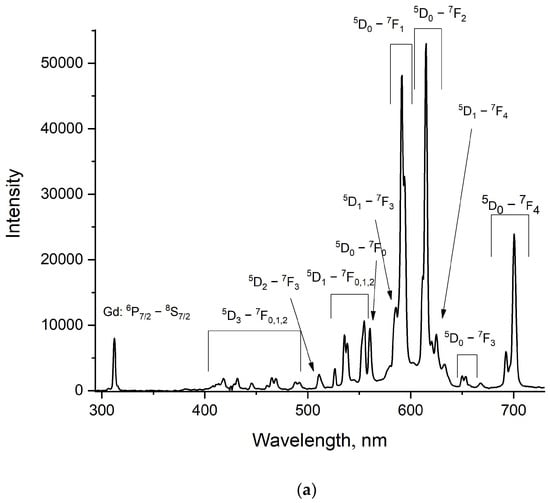
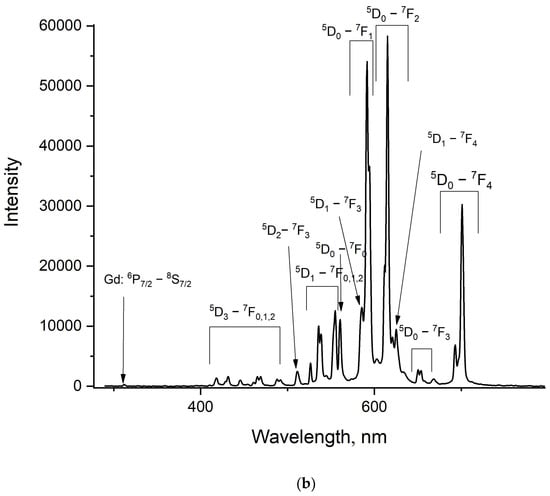
Figure 6.
Room-temperature luminescence spectrum of the LiGdF4:Eu3+ (0.1 (a) and 1.0% (b)) sample under the Gd3+ excitation (λex = 274 nm, 8S7/2—6PJ absorption band).
It can be seen that for the LiGdF4:Eu3+ (0.1%) sample, the luminescence peaks of both Gd3+ and Eu3+ doping ions are observed. To exclude the possibility of the direct excitation of Eu3+ under 274 nm, we carried out the same experiment for LiYF4:Eu3+, where the LiYF4 host does not absorb this wavelength (274 nm). The pictures of both LiGdF4:Eu3+ (0.1%) and LiYF4:Eu3+ (0.1%) powders under 274 nm excitation are represented in Figure S4. For LiGdF4:Eu3+ (0.1%), the characteristic red luminescence of Eu3+ is clearly observed. LiYF4: Eu3+ (0.1%) does not show emission. According to the literature data, the energy transfer from Gd3+ to Eu3+ occurs via quantum cutting [28] and energy transfer between suitable energy levels of Gd3+ and Eu3+ [29,30]. Quantum cutting can be described at the Gd3+ excitation (λex = 202 nm (8S7/2—6GJ absorption band of Gd3+)) as “cuts” into the excitation of the 5D0 level of Eu3+ and 6PJ level of Gd3+. This process is possible only for the above-mentioned excitation scheme (λex = 202 nm). In the present work, such quantum cutting is impossible. The energy transfer from Gd3+ to Eu3+ occurs via 6IJ (Gd3+)—5FJ, 5IJ (Eu3+) and 6PJ—(Gd3+)—5FJ, 5IJ (Eu3+). Gd3+ ions can be optically excited at 274 nm (8S7/2–6IJ). Then, the 6IJ states can decay non-radiatively, populating 6PJ excited states. The excitation energy can be transferred to the 5HJ states of Eu3+, following the non-radiative transition to the lower 5DJ. The lowest 6PJ (J = 7/2) of Gd3+ has an energy of around 32,000 cm−1 in LiGdF4 [31]. In its turn, the highest 5DJ (J = 4) state of Eu3+ has an energy of around 29,000 cm−1 [32]. The highest phonon energy for LiGdF4 is around 570 cm−1 [33,34]. It required around five phonons to “bridge” the 6P7/2–5D4 energy gap. In the case of 6IJ (Gd3+)—5FJ, 5IJ (Eu3+) energy transfer, there is also an energy gap of the same order. It can be suggested that this energy transfer is phonon-assisted at our excitation conditions. This energy transfer leads to the intense Eu3+ emission under Gd3+ excitation. In its turn, the LiGdF4:Eu3+ (1.0%) sample demonstrates negligible Gd3+ luminescence. It can be suggested that higher Eu3+ concentrations quench Gd3+ more efficiently. Due to the efficient energy transfer from Gd3+ (donor) to Eu3+ (acceptor), this material can be used as coatings for silicon-based solar cells [35]. Indeed, for these solar panels, it is very important to convert UV radiation into visible light and IR, since there are intense absorption bands of silicon in the visible and IR ranges.
3.3. Spectral Characterization of the LiGdF4:Eu3+ (1 at.%)
The LiGdF4:Eu3+ (1 at.%) luminescence spectra were recorded in the 30–320 K temperature range (Figure 7). We immediately noticed broadband emission peaks in the visible spectral region (~350–650 nm) and a simultaneous decrease in the intensity of Eu3+ emission at low temperatures: the same phenomenon we earlier observed in our previous work for Nd3+, Yb3+: YF3 crystalline particles [36].
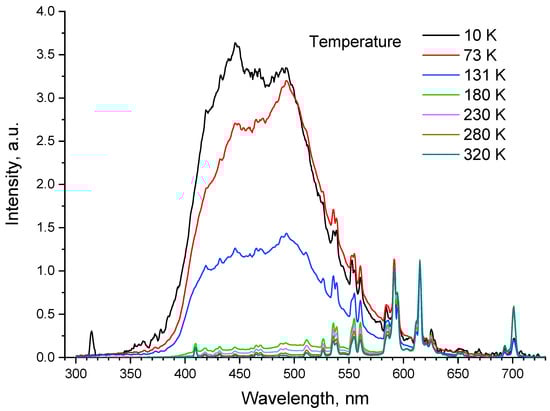
Figure 7.
Luminescence spectrum of LiGdF4:Eu3+ (1.0%) in the 10–290 K temperature range.
Particularly, the presence of this broad emission can be explained by several mechanisms. In the work of [37], the broad excitonic emission is observed for LiYF4 (the same crystal structure as LiGdF4) under X-ray excitation at 4.2 K. These excitons are of the type . However, this emission in the 200–400 K spectral range centered at 300 nm, unlike the obtained results (Figure 7). Moreover, the excitonic emission is thermally quenched at T > 100 K. Here, we observe a broad emission at higher temperatures [38]. The second mechanism is related to the presence of oxygen impurities which are considered the most common impurity for fluorides. There are also fluorine vacancies (VF): in this case, fluoride matrices where the fluorine ion is substituted by oxygen. The absorption band of these impurities is in the 250–300 nm range. Our excitation wavelength (274 nm) is almost at the center of the absorption band [39]. We found at least two consequences of the presence of the oxygen impurities (OF). The first is the OF–RE3+ complex [39] and the second is the OF—VF—RE3+ one [40]. Under UV excitation, both doping ions and the above-mentioned complexes are excited following the emission or non-radiative transitions. It can be suggested that the OF—RE3+ and OF—VF—RE3+ complexes have an intricate energy level structure that provides broad-band emission. At low temperatures, the energy transfer from the complex to RE is hindered and we observe the broad emission of the complexes. The energy transfer probability increases with the rise in the temperature, which leads to the decrease in the complex emission intensity and the increase in RE emission. This hypothesis requires additional investigation.
Having used the baseline function in OriginPro 9.0 software, we separated the luminescence spectrum of Eu3+ and the defects. The luminescence intensity ratio (LIR) between the luminescence of the defects and Eu3+ was taken as a temperature-dependent parameter. The LIR curves as functions of temperature are represented in Figure 8.
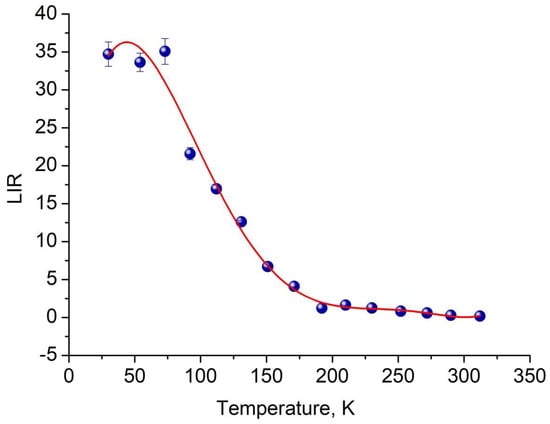
Figure 8.
LIR as a function of temperature. The approximation function is determined as LIR = 9.8 + 1.412·T − 2.4·10−2·T2 + 1.5·10−4·T3 − 4.0·10−7·T4 + 4.0·10−10·T5.
It can be seen that all luminescence intensity ratio (LIR) curves exhibit interesting behavior. Also, an important characteristic of temperature sensors is the absolute Sa and relative Sr temperature sensitivities (Figure 9a,b, respectively). We see that for the sample, we have obtained a competitive temperature sensitivity Sa in the 50–180 K temperature range. Note that the presence of the crank points is related to the use of absolute values of the Sa and Sr functions [41].
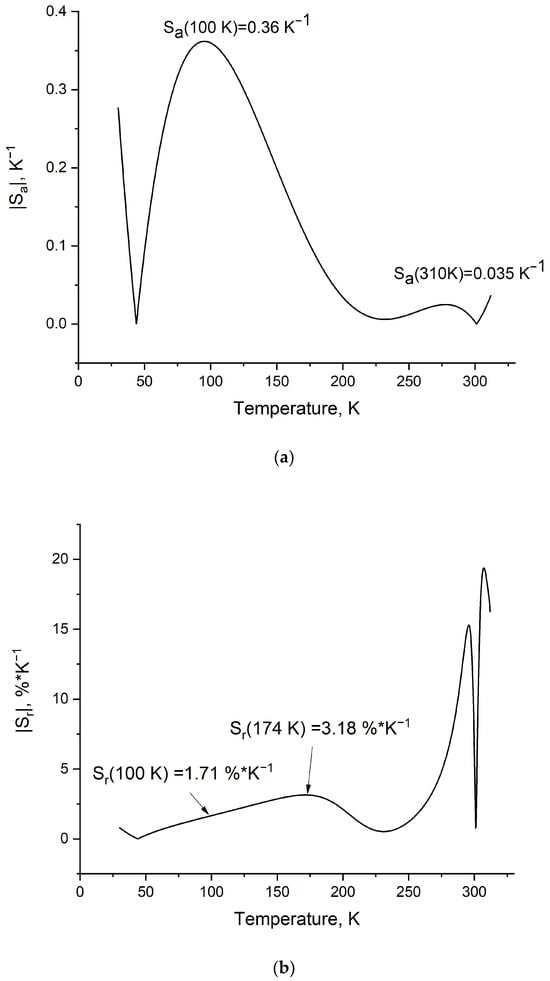
Figure 9.
Absolute Sa (a) and relative Sr (b) temperature sensitivities of the LiGdF4:Eu3+ (1 at.%) sample.
It can be seen from Figure 9b that the Sr reaches very competitive values. In particular, Sr has the first maximum at 174 K (3.18%/K). In its turn, at 100 K, Sr is equal to 1.71%/K. This value is quite competitive compared to such analogs as the Er3+, Yb3+: LaF3 (~0.9%/K at 100 K) and Pr3+, Yb3+: LaF3 (gradually decreases from ~1.0 at 30 K to ~0.2 at 100 K) cryogenic temperature sensors [16]. The same principle was used in [42], where, in YVO4:Eu3+, the LIR was based on the ratio of the YVO4 host and Eu3+ emission. In this system, the maximum Sr is ~4.0%/K at 123 K; however, in the 170–320 K range, the Sr values are in the 2.0–1.0%/K range, unlike the studied system.
3.4. Kinetic Characterization of the LiGdXY1−XF4 Samples at Room Temperature
The luminescence decay and rise curves of Eu3+ are very important kinetic characteristics of the phosphors. Indeed, there is a huge class of luminescence temperature sensors based on the analysis of the temperature-dependent kinetic characteristics of the luminescence signal [27,41,43,44,45,46]. For the studied LiGdF4:Eu3+ (0.1 and 1.0 at.%) samples, there is a series of intense peaks in the red spectral part corresponding to the radiative transitions from 5D1 and 5D0 levels of Eu3+ to their lower ones. The decay and rise times of the suitable transitions at different temperatures are represented in Figure 10a and b, respectively. The decay and rise curves are represented in Figure S5 (Supplementary Materials). Such a significant difference in the kinetics of the rise and decay curves occurs due to the cross-relaxation between Eu3+ ions. Such a notable difference in the kinetics of the rise and decay of luminescence occurs due to the processes of cross-relaxation between Eu3+ ions.
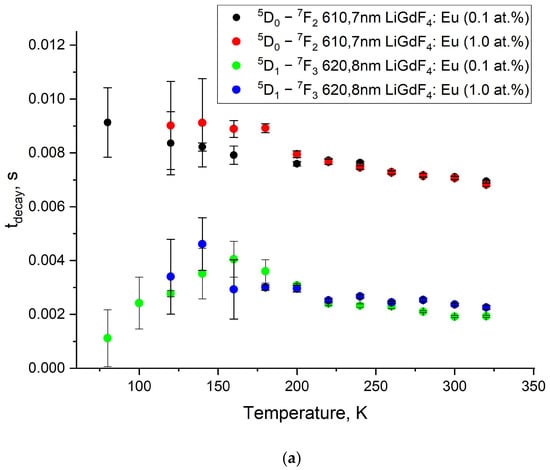
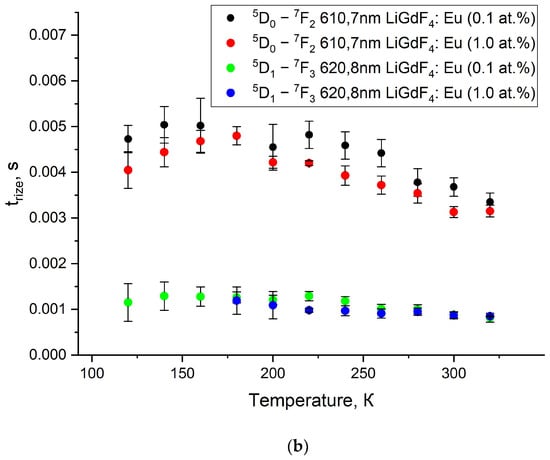
Figure 10.
Luminescence decay (a) and rise (b) times of LiGdF4:Eu3+ (0.1 and 1.0 at.%) at 610.7 (5D0 emission) and 620.8 nm (5D1 emission) in the 80–320 K temperature range.
It can be seen from Figure 10b that the decay times for the 5D1 and 5D0 states are around 7 and 3 ms at 300 K, respectively. The obtained results are in good agreement with the literature data on LiGdF4 [47,48]. The decay times demonstrate a weak tendency to decrease with an increase in temperature. This tendency can be attributed to the increase in the probability of non-radiative relaxation with the rise in temperature. The presence of the rise-time curve is explained by non-radiative relaxation from the higher-energy 5DJ levels to 5D1,0 ones (the excitation of 5D1,0 state is non-resonant). When the temperature is lowered, relaxation rates slow down, which is indicated by an increase in the rise-time [47]. Based on Figure 8 and Figure 9 in the LiGdF4:Eu3+ samples, it was found that the cross-relaxation process weakly depends on the temperature and concentration of Eu3+ ions and is not suitable for sensing purposes. The same tendency is observed in such important fluoride phosphors as Ka5Li2La1−xEuXF10 in the 80–300 K range. Specifically, the 5D1 lifetime decreases gradually from ~4 (80 K) to ~2 ms (300 K) [49]. The rise times for the 5D1 and 5D0 states are around 1 and 3 ms at 300 K, respectively. The same values were obtained for Eu3+: LiGdF4 in Ref. [47]. The rise times also demonstrate a decreasing tendency with the temperature increase.
4. Conclusions
In this work, the physical characterization of LiGdxY1−xF4 (x = 0.05; 0.3; 0.7 and 1.0) and LiGdF4:Eu3+ microparticles was carried out. The XRD method confirmed that all the samples have a tetragonal structure that corresponds to LiYF4 and LiGdF4 matrices. For the LiGdxY1−xF4 (x = 0.05) bulk crystal, the distribution coefficient was determined for the first time. It was equal to 0.84. Based on kinetic characterization data, the LiGdF4 sample was chosen for further Eu3+ doping (0.1 and 1.0 at.% concentrations). It was shown that for the LiGdF4:Eu3+ (0.1%) sample, both Gd3+ and Eu3+ emissions were clearly observed under the excitation of Gd3+. This fact indicates an efficient energy transfer from Gd3+ to Eu3+. However, for the LiGdF4:Eu3+ (1.0%) sample, the Gd3+ emission was negligible. In its turn, the intense Eu3+ emission was observed in the red part of the spectrum. These findings make the LiGdF4:Eu3+ material relevant for creating coatings of solar silicon cells in order to convert UV light into visible light. The temperature-dependent spectral characterization of the LiGdF4:Eu3+ (1.0%) sample revealed that in the 30–250 K temperature range, a broad emission peak is evident. Its intensity sharply increases with the temperature decrease in the range of 30–150 K. We associated this phenomenon with the emission of defects, which is often found in fluorides and is associated with the formation of complexes of oxygen, fluorine vacancy, and RE. The integrated luminescence intensity ratio of this broad peak and Eu3+ emission was taken as a temperature-dependent parameter. The Sr reached very competitive values. In particular, Sr has the first maximum at 174 K (3.18%/K). In its turn, at 100 K, Sr is equal to 1.71%/K. The kinetic characteristics of both Gd3+ and Eu3+ did not demonstrate notable temperature dependence. Finally, it can be concluded that the LiGdF4:Eu3+ showed a possibility of being used as an optical temperature sensor operating in the cryogenic temperature range. The next step forward concerning the present work is to develop the precise procedure of the separation of the luminescence signals of the broad emission and the doping ions. To control and estimate the amount of the defects, the development of the LiGdF4 synthesis procedure is also an important task. Finally, the interesting dependence of Gd3+ decay times on temperature will also be investigated.
Supplementary Materials
The following supporting information can be downloaded at: https://www.mdpi.com/article/10.3390/ceramics7010018/s1, Figure S1. The photo of the Gd3+ (5 at.%):LiYF4 sample for the determination of the distribution coefficient; Table S1. Lattice parameters of LiGdxY1−xF4; Figure S2. Absorption spectra of the LiGdxY1−xF4 sample (x = 0.05) at different distances from the crystal cap; Figure S3. Kinetics of luminescence of: (а) LiGdxY1−xF4 (х = 0.05), (b) LiGdxY1−xF4 (х = 0.3), (c) LiGdxY1−xF4 (х = 0.7) and (d) LiGdxY1−xF4 (х = 1.0) at the 312 nm; wavelength (6P7/2-8S7/2) at a temperature 100 К (black), 200 К (red), 300 К (blue); Figure S4. The pictures of both LiGdF4: Eu3+ (0.1%) (a) and LiYF4: Eu3+ (0.1%) (b)under 274 nm excitation; Figure S5. Kinetics of luminescence of LiGdF4: Eu3+ (1 at.%) in the different wavelength: (а) kinetics of luminescence decay in the 610.7 nm, (b) kinetics of luminescence rise in the 610.7 nm, (c) kinetics of luminescence decay in the 620.8 nm and (d) kinetics of luminescence rise in the 620.8 nm at a temperature 160 К (black), 240 К (red), 320 К (green).
Author Contributions
E.I.O.: methodology, data curation, investigation, writing—original draft preparation; O.A.M.: methodology, data curation, investigation, writing—original draft preparation; S.L.K.: methodology, investigation; M.S.P.: conceptualization, methodology, data curation, investigation, writing—original draft preparation, project administration, funding acquisition. All authors have read and agreed to the published version of the manuscript.
Funding
Physical characterization and optical spectroscopy experiments were funded by the subsidy allocated to Kazan Federal University for the state assignment in the sphere of scientific activities (project number FZSM-2022-0021). Crystal growth procedures were funded by the Russian Science Foundation Grant No. 22-12-00259.
Institutional Review Board Statement
Not applicable.
Informed Consent Statement
Not applicable.
Data Availability Statement
The data presented in this study are available in this article and supplementary material.
Conflicts of Interest
The authors declare no conflicts of interest.
References
- Morozov, O.A.; Korableva, S.L.; Pudovkin, M.S.; Shakirov, A.A.; Shavelev, A.A.; Cherosov, M.A.; Klimovitskii, A.E. Pr3+:LiGdF4 microparticles for optical temperature sensing. Solid State Commun. 2022, 351, 114792. [Google Scholar] [CrossRef]
- Lepoutre, S.; Boyer, D.; Mahiou, R. Quantum cutting abilities of sol–gel derived LiGdF4:Eu3+ powders. J. Lumin. 2008, 128, 635–641. [Google Scholar] [CrossRef]
- Velázquez, J.J.; Mosa, J.; Gorni, G.; Balda, R.; Fernández, J.; Pascual, L.; Castro, Y. Transparent SiO2-GdF3 sol–gel nano-glass ceramics for optical applications. J. Sol-Gel Sci. Technol. 2019, 89, 322–332. [Google Scholar] [CrossRef]
- Wegh, R.T.; Donker, H.; Oskam, K.D.; Meijerink, A. Visible quantum cutting in LiGdF4:Eu3+ through downconversion. Science 1999, 283, 663–666. [Google Scholar] [CrossRef]
- Choi, J.E.; Kim, H.K.; Kim, Y.; Kim, G.; Lee, T.S.; Kim, S.; Jang, H.S. 800 nm near-infrared light-excitable intense green-emitting Li(Gd,Y)F4:Yb, Er-based core/shell/shell upconversion nanophosphors for efficient liver cancer cell imaging. Mater. Des. 2020, 195, 108941. [Google Scholar] [CrossRef]
- Shin, J.; Kyhm, J.H.; Hong, A.R.; Song, J.D.; Lee, K.; Ko, H.; Jang, H.S. Multicolor tunable upconversion luminescence from sensitized seed-mediated grown LiGdF4: Yb, Tm-based core/triple-shell nanophosphors for transparent displays. Chem. Mater. 2018, 30, 8457–8464. [Google Scholar] [CrossRef]
- Morozov, O.A.; Korableva, S.L.; Nurtdinova, L.A.; Kyashkin, V.M.; Popov, P.A.; Klimovitskii, A.E.; Semashko, V.V. Growth and characterization of optical and thermal properties of LiGdF4 single crystal. Opt. Mater. 2023, 137, 113490. [Google Scholar] [CrossRef]
- Lepoutre, S.; Boyer, D.; Mahiou, R. Structural and optical characterizations of sol–gel based fluorides materials: LiGdF4:Eu3+ and LiYF4:Er3+. Opt. Mater. 2006, 28, 592–596. [Google Scholar] [CrossRef]
- Yu, F.; Ma, B.; Xie, Z.; Wang, P.; Wu, X.; Lin, C.; Zhang, Q. Developing” smart windows” for optical storage and temperature sensing based on KNN transparent ceramics. J. Eur. Ceram. Soc. 2023, 43, 4408–4418. [Google Scholar] [CrossRef]
- Aseev, V.; Babkina, A.; Evstropiev, S.; Kuzmenko, N.; Sevastianova, I.; Prokuratov, D.; Khodasevich, M. Structural and Luminescence Properties of (Gd1−xYx)2O3 Powders Doped with Nd3+ Ions for Temperature Measurements. Ceramics 2022, 5, 1185–1197. [Google Scholar] [CrossRef]
- Mikhaylov, D.A.; Potanina, E.A.; Nokhrin, A.V.; Orlova, A.I.; Yunin, P.A.; Sakharov, N.V.; Tabachkova, N.Y. Investigation of the Microstructure of Fine-Grained YPO4: Gd Ceramics with Xenotime Structure after Xe Irradiation. Ceramics 2022, 5, 237–252. [Google Scholar] [CrossRef]
- Shinde, V.V.; Kunghatkar, R.G.; Dhoble, S.J. UVB-emitting Gd3+-activated M2O2S (where M = La, Y) for phototherapy lamp phosphors. Luminescence 2015, 30, 1257–1262. [Google Scholar] [CrossRef] [PubMed]
- Shi, X.; Xue, Y.; Mao, Q.; Pei, L.; Li, X.; Liu, M.; Zhong, J. Eu3+ single-doped phosphor with antithermal quenching behavior and multicolor-tunable properties for luminescence thermometry. Inorg. Chem. 2023, 62, 893–903. [Google Scholar] [CrossRef] [PubMed]
- Na, H.; Jeong, J.S.; Chang, H.J.; Kim, H.Y.; Woo, K.; Lim, K.; Jang, H.S. Facile synthesis of intense green light emitting LiGdF4:Yb, Er-based upconversion bipyramidal nanocrystals and their polymer composites. Nanoscale 2014, 6, 7461–7468. [Google Scholar] [CrossRef]
- Faria, W.J.; Gonçalves TD, S.; de Camargo, A.S. Near infrared optical thermometry in fluorophosphate glasses doped with Nd3+ and Nd3+/Yb3+. J. Alloys Compd. 2021, 883, 160849. [Google Scholar] [CrossRef]
- Kaczmarek, A.M.; Kaczmarek, M.K.; Van Deun, R. Er3+-to-Yb3+ and Pr3+-to-Yb3+ energy transfer for highly efficient near-infrared cryogenic optical temperature sensing. Nanoscale 2019, 11, 833–837. [Google Scholar] [CrossRef]
- Xia, W.; Li, L.; Yang, P.; Ling, F.; Wang, Y.; Cao, Z.; Hua, Y. Synthesis of color-tunable Sr8MgLa(PO4)7: Eu3+/Tb3+ phosphors for designing dual-model thermometers. J. Lumin. 2021, 239, 118383. [Google Scholar] [CrossRef]
- Trannoy, V.; Carneiro Neto, A.N.; Brites, C.D.; Carlos, L.D.; Serier-Brault, H. Engineering of mixed Eu3+/Tb3+ metal-organic frameworks luminescent thermometers with tunable sensitivity. Adv. Opt. Mater. 2021, 9, 2001938. [Google Scholar] [CrossRef]
- Nizamutdinov, A.S.; Kuznetsov, S.V.; Madirov, E.I.; Voronov, V.V.; Khadiev, A.R.; Yapryntsev, A.D.; Ivanov, V.K.; Semashko, V.V.; Fedorov, P.P. Down-conversion luminescence of Yb3+ in novel Ba4Y3F17:Yb:Ce solid solution by excitation of Ce3+ in UV spectral range. Opt. Mater. 2020, 108, 110185. [Google Scholar] [CrossRef]
- Zhai, X.; Lei, P.; Zhang, P.; Wang, Z.; Song, S.; Xu, X.; Zhang, H. Growth of lanthanide-doped LiGdF4 nanoparticles induced by LiLuF4 core as tri-modal imaging bioprobes. Biomaterials 2015, 65, 115–123. [Google Scholar] [CrossRef] [PubMed]
- Grzechnik, A.; Crichton, W.A.; Bouvier, P.; Dmitriev, V.; Weber, H.P.; Gesland, J.Y. Decomposition of LiGdF4 scheelite at high pressures. J. Phys. Condens. Matter 2004, 16, 7779. [Google Scholar] [CrossRef]
- Yin, J.; Zhang, Q.; Liu, T.; Song, M.; Wang, X.; Zhang, H. Ab initio lattice relaxation and electronic structures of LiYF4 crystals containing VF color center. Phys. B Condens. Matter 2009, 404, 1053–1057. [Google Scholar] [CrossRef]
- Xiong, J.; Peng, H.; Hu, P.; Hang, Y.; Zhang, L. Optical characterization of Tm3+ in LiYF4 and LiLuF4 crystals. J. Phys. D Appl. Phys. 2010, 43, 185402. [Google Scholar] [CrossRef]
- Gulliver, G.H. The Quantitative Effect of Rapid Cooling Upon the Constitution of Binary Alloys. J. Inst. Met. 1913, 9, 120–157. [Google Scholar]
- Mayerhöfer, T.G.; Pipa, A.V.; Popp, J. Beer’s law-why integrated absorbance depends linearly on concentration. ChemPhysChem 2019, 20, 2748–2753. [Google Scholar] [CrossRef] [PubMed]
- De Vries, A.J.; Hazenkamp, M.F.; Blasse, G. On the Gd3+ luminescence and energy migration in Li(Y,Gd)F4−Tb3+. J. Lumin. 1988, 42, 275–282. [Google Scholar] [CrossRef][Green Version]
- Pudovkin, M.S.; Ginkel, A.K.; Morozov, O.A.; Kiiamov, A.G.; Kuznetsov, M.D. Highly-sensitive lifetime optical thermometers based on Nd3+, Yb3+:YF3 phosphors. J. Lumin. 2022, 249, 119037. [Google Scholar] [CrossRef]
- Feldmann, C.; Jüstel, T.; Ronda, C.R.; Wiechert, D.U. Quantum efficiency of down-conversion phosphor LiGdF4: Eu. J. Lumin. 2001, 92, 245–254. [Google Scholar] [CrossRef]
- Sun, Y.; Zou, H.; Zhang, B.; Zhou, X.; Song, Y.; Zheng, K.; Sheng, Y. Luminescent properties and energy transfer of Gd3+/Eu3+ co-doped cubic CaCO3. J. Lumin. 2016, 178, 307–313. [Google Scholar] [CrossRef]
- Reid, M.F.; Van Pieterson, L.; Wegh, R.T.; Meijerink, A. Spectroscopy and calculations for 4fN→ 4fN−15d transitions of lanthanide ions in LiYF4. Phys. Rev. B 2000, 62, 14744. [Google Scholar] [CrossRef]
- Lo, D.; Makhov, V.N.; Khaidukov, N.M.; Krupa, J.C. Two-photon excitation to 4f65d configuration of Gd3+ in LiGdF4 crystal by KrF excimer laser. J. Lumin. 2006, 119, 28–32. [Google Scholar] [CrossRef]
- Niranjana, V.; Janani, K.; Darba, V.R.; Ramasubramanian, S. Investigations on the synthesis dependent luminescence property of LiGdF4:Eu3+ microcrystals. Optik 2019, 198, 163233. [Google Scholar]
- Donega, C.D.M.; Meijerink, A.; Blasse, G. Non-radiative relaxation processes of the Pr3+ ion in solids. J. Phys. Chem. Solids 1995, 56, 673–685. [Google Scholar] [CrossRef]
- Zhang, Y.X.; Wang, S.X.; Di Alberto, L.; Yu, G.L.; Yu, H.H.; Zhang, H.J.; Wang, J.Y. Temperature-dependent fluorescence properties and diode-pumped deep red laser performance of Pr: LiGdF4 crystal. Chin. Phys. Lett. 2015, 32, 054210. [Google Scholar] [CrossRef]
- Sheoran, S.; Singh, V.; Singh, S.; Kadyan, S.; Singh, J.; Singh, D. Down-conversion characteristics of Eu3+ doped M2Y2Si2O9 (M = Ba, Ca, Mg and Sr) nanomaterials for innovative solar panels. Prog. Nat. Sci. Mater. Int. 2019, 29, 457–465. [Google Scholar] [CrossRef]
- Pudovkin, M.S.; Ginkel, A.K.; Lukinova, E.V. Temperature sensitivity of Nd3+, Yb3+:YF3 ratiometric luminescent thermometers at different Yb3+ concentration. Opt. Mater. 2021, 119, 111328. [Google Scholar] [CrossRef]
- Hayes, W.; Yamaga, M.; Robbins, D.J.; Cockayne, B. Optical detection of excitation EPR in LiYF4. J. Phys. C Solid State Phys. 1980, 13, L1011. [Google Scholar] [CrossRef]
- Belsky, A.N.; Chevallier, P.; Gesland, J.Y.; Kirikova, N.Y.; Krupa, J.C.; Makhov, V.N.; Queffelec, M. Emission properties of Nd3+ in several fluoride crystals. J. Lumin. 1997, 72, 146–148. [Google Scholar] [CrossRef]
- Meijer, J.M.; Aarts, L.; van der Ende, B.M.; Vlugt, T.J.; Meijerink, A. Downconversion for solar cells in YF3:Nd3+, Yb3+. Phys. Rev. B 2010, 81, 035107. [Google Scholar] [CrossRef]
- Santos, H.D.A.; Novais, S.M.V.; Jacinto, C. Optimizing the Nd:YF3 phosphor by impurities control in the synthesis procedure. J. Lumin. 2018, 201, 156–162. [Google Scholar] [CrossRef]
- Dramićanin, M.D. Trends in luminescence thermometry. J. Appl. Phys. 2020, 128, 040902. [Google Scholar] [CrossRef]
- Kolesnikov, I.E.; Mamonova, D.V.; Kurochkin, M.A.; Kolesnikov, E.Y.; Lahderanta, E. Optical thermometry by monitoring dual emissions from YVO4 and Eu3+ in YVO4:Eu3+ nanoparticles. ACS Appl. Nano Mater. 2021, 4, 1959–1966. [Google Scholar] [CrossRef]
- Dramićanin, M.D.; Antić, Ž.; Ćulubrk, S.; Ahrenkiel, S.P.; Nedeljković, J.M. Self-referenced luminescence thermometry with Sm3+ doped TiO2 nanoparticles. Nanotechnology 2014, 25, 485501. [Google Scholar] [CrossRef]
- Fu, Y.; Zhao, L.; Guo, Y.; Yu, H. Up-conversion luminescence lifetime thermometry based on the 1G4 state of Tm3+ modulated by cross relaxation processes. Dalton Trans. 2019, 48, 16034–16040. [Google Scholar] [CrossRef] [PubMed]
- Maciejewska, K.; Bednarkiewicz, A.; Marciniak, L. NIR luminescence lifetime nanothermometry based on phonon assisted Yb3+–Nd3+ energy transfer. Nanoscale Adv. 2021, 3, 4918–4925. [Google Scholar] [CrossRef] [PubMed]
- Siaï, A.; Haro-González, P.; Naifer, K.H.; Férid, M. Optical temperature sensing of Er3+/Yb3+ doped LaGdO3 based on fluorescence intensity ratio and lifetime thermometry. Opt. Mater. 2018, 76, 34–41. [Google Scholar] [CrossRef]
- Vergeer, P.; van Den Pol, E.; Meijerink, A. Time and temperature dependence of the emissions from the quantum-cutting phosphor LiGdF4:Eu3+. J. Lumin. 2006, 121, 456–464. [Google Scholar] [CrossRef]
- Takeuchi, N.; Ishida, S.; Matsumura, A.; Ishikawa, Y.I. Time-Resolved Study of Luminescence in LiGd1−xF4: Eu3+x. J. Phys. Chem. B 2004, 108, 12397–12403. [Google Scholar] [CrossRef]
- Solarz, P.; Ryba-Romanowski, W. Effect of temperature and activator concentration on relaxation of excited states of Eu3+ in K5Li2La1−xEuxF10 crystals. J. Phys. Chem. Solids 2003, 64, 1289–1296. [Google Scholar] [CrossRef]
Disclaimer/Publisher’s Note: The statements, opinions and data contained in all publications are solely those of the individual author(s) and contributor(s) and not of MDPI and/or the editor(s). MDPI and/or the editor(s) disclaim responsibility for any injury to people or property resulting from any ideas, methods, instructions or products referred to in the content. |
© 2024 by the authors. Licensee MDPI, Basel, Switzerland. This article is an open access article distributed under the terms and conditions of the Creative Commons Attribution (CC BY) license (https://creativecommons.org/licenses/by/4.0/).