Article

Air Temperature Change at the End of the Late Holocene and in the Anthropocene in the Middle Volga Region, European Russia

by
Yuri P. Perevedentsev
1,
Konstantin M. Shantalinsky
1,
Artyom V. Gusarov
2,*,
Nadezhda A. Mirsaeva
1,
Timur R. Aukhadeev
1 and
Alexander A. Nikolaev
1
1
Institute of Environmental Sciences, Kazan Federal University, 420008 Kazan, Russia
2
Institute of Geology and Petroleum Technologies, Kazan Federal University, 420008 Kazan, Russia
*
Author to whom correspondence should be addressed.
Quaternary 2023, 6(3), 48; https://doi.org/10.3390/quat6030048
Submission received: 9 February 2023 / Revised: 27 July 2023 / Accepted: 16 August 2023 / Published: 1 September 2023

Abstract

:
The temporal variability of air temperature in the Middle Volga region from 1828 to 2021 is considered according to instrumental observations at the oldest meteorological station in the east of the East European Plain (Kazan University) and throughout the Asian part of Russia against the background of long-term climate fluctuations in the Northern Hemisphere of Earth. A general trend toward an increase in air temperature was revealed. It was found that climate change in Kazan was consistent with the climatic processes that occurred in the Middle Volga region as a whole. The greatest warming for the entire observation period was observed in the winter and spring seasons of the year. In December, warming occurred at a maximum rate of 0.28 °C/10 years. At the same time, the most intense warming process was observed from 1991 to 2021. The analysis of low-frequency fluctuations in the series of monthly average air temperatures made it possible to identify different periods of change, both in type (direction) and intensity. It is shown that in the Middle Volga region, positive anomalies of air temperature have occurred more often than negative ones in recent decades. Statistical data processing was also carried out for 30-year periods, starting from the first period, i.e., 1841–1870. This made it possible to reveal long-term changes in air temperature. Comparisons of climatic parameters in two periods, i.e., 1828–1945 and 1946–2021, allowed us to reliably detect the climatic beginning of the increasingly identifiable Anthropocene epoch (since 1946), characterized by a sharp increase in air temperature, increased interannual variability of the air temperature regime, and a significant increase (by about three times) in the rate of warming in the Middle Volga region. A correlation was made between atmospheric circulation indices and air temperature fluctuations in Kazan over different periods. The closest relationship was found for the 1990–2020 period. It is shown that the contribution of global factors to air temperature variability in the Middle Volga region during the Anthropocene reached 37% in winter and 32% in summer; in annual terms, this contribution amounted to 54%.

1. Introduction

In modern scientific literature, much attention is paid to the problem of climate change in the industrial era (since 1700). The main method for detecting climate change is statistical analysis of all observations accumulated over a historical period [1]. It should be noted that the period of instrumental observations in Russia is relatively short (about three centuries). The first instrumental meteorological observations date back to 1725 (St. Petersburg) [2]. In Kazan, regular meteorological observations began later, in 1812, when a meteorological observatory was founded at Kazan University. These observations were the first not only in the Volga region, but, in general, in the east of Russia. The first scientific publication on climate was Bronner’s paper [3]. Kazan University was entrusted with the organization and methodological guidance of meteorological observations in the Urals, Siberia, and the Caucasus. In addition, soil temperature measurements in Russia were first started in the 1830s at this meteorological observatory on the initiative of N.I. Lobachevsky, Russian mathematician and geometer, who was then the rector of Kazan University. These observations were made using mercury thermometers built into the walls of a special well at different depths (1.0–3.2 m); since 1841, an external bimetallic thermometer has been used [4]. The series of monthly average air temperatures have been preserved only since 1828, which makes it possible to trace changes in the regional climate, starting from the end of the Little Ice Age and ending with the current period of global warming. According to the Sixth Assessment Report of the IPCC [5], the main cause of modern global warming is the anthropogenic increase in the concentration of greenhouse gasses. Global near-surface air temperature data since 1850, held at the University of East Anglia’s Department of Climate Research and the Hadley Center, are widely used to assess macroscale climate change [6].
Let us consider the main features of the ongoing climate change in the Holocene based on published articles. Based on numerical calculations using the global climate model of the Institute of Atmospheric Physics of the Russian Academy of Sciences, it was shown that the current annual average near-surface air temperature in recent decades exceeded the corresponding values for the previous ten thousand years [7]. Moreover, if natural impacts on the climate system played a key role in climate change in the past, now, anthropogenic impacts have been added to them.
It is noted that for the mid-latitude zone (30–60° N), the contribution of greenhouse gases to air temperature trends is 0.5 (i.e., 50%) for relatively short time intervals (0.41 for a 20-year period, 0.44 for a 30-year period), but for a 50-year interval, it is estimated to be 0.68, i.e., almost 2/3 of the trends [6]. In the same work, the contribution of the growth in the concentration of greenhouse gases in the atmosphere to air temperature trends in various latitudinal zones for different time intervals was also estimated. According to Brohan et al. [6], the global near-surface air temperature trend is mainly associated with the radiative forcing of greenhouse gases in the atmosphere. A significant contribution to this trend is made by Atlantic Multidecadal Oscillation (AMO) (0.42 in the middle latitudes for 20-year periods, 0.31 for 30-year periods). The contribution of Pacific Decade Oscillation (PDO) to the trend is statistically insignificant.
It is noted that the current impact of anthropogenic greenhouse gases is estimated at about 2 W/m2 [8]. An approximately 60-year fluctuation of a series of mean global air temperatures was revealed [9]. In 1876, 1944, and 1998, there were maximums of the average global air temperature, while in 1907 and 1963, there were minimums. The relationship of circulation indices with the global average air temperature is detected. The strongest El Niño events (1873, 1941, 1997), as well as sharp drops in the North Atlantic Oscillation Index (1875, 1942, 1996), occurred before the global air temperature maximum.
It may be concluded that the warming in the 20th century was largely due to short-term, primarily anthropogenic, factors and was carried out against the backdrop of a distinct millennial trend of the natural climate toward cooling [10]. The decrease in air temperature due to the influence of millennium cycles has amounted to more than 1 °C over the last millennium, which is twice as high as the air temperature increase observed in the 20th century.
It was noted that during the Holocene, there were several periods, the climates of which were warmer than the present one [11]. According to Klimenko [12], the climate is subject to quasi-periodic fluctuations, the duration of which varies from several to hundreds of millions of years. There is evidence that in the 9th–13th centuries AD, the climate in various parts of the globe was warmer than today.
Among the works studying climate change in recent centuries based on instrumental data from urban stations, one can single out the papers of Datsenko [9], Monin and Shishkov [13], Golitsyn et al. [14], and Gazina and Klimenko [15]. These studies have shown that the increase in the annual average air temperature in recent decades was mainly due to significant warming in winter and spring. In addition, it was assumed that long-term changes in air temperature were associated with rearrangements of the thermohaline circulation of the ocean or with the recurrence of strong, moderate, and weak El Niño events [13]. Gazina and Klimenko [15] also pointed out the need to take into account the circulation factor in air temperature changes in Eastern Europe over the past 250 years.
Using data from a reanalysis of meteorological observations over the past 160 years, similar peaks were found in the energy spectra of both the El Niño-Southern Oscillation (ENSO) indices and in the spectra of global air temperature and pressure fields [16]. This fact indicates the presence of a common process affecting the changes in these variables.
It was shown [17] that the rate of warming in Russia over 100 years (1901–2000) was 0.9 °C/10 years. This warming was more noticeable in winter and spring: the trends were 4.7 °C/100 years and 2.9 °C/100 years, respectively. A 54-year cycle of the winter season was revealed in European Russia, manifested in the extremely cold winters of 1996, 1942, 1888, 1834, 1780, and 1726 [18].
In IPCC studies [19,20], using three-dimensional models of the general circulation of the atmosphere and ocean, estimates of climate sensitivity were obtained for various scenarios of changes in the concentration of greenhouse gases in the atmosphere. In particular, in the case of a doubling of CO2, estimates of the most probable rise in global air temperature fall within the range of 1.5–4.5 °C. These estimates do not contradict the results obtained by direct statistical analysis of time series of the global air temperature [21]. The IPCC report notes that the warming observed since the second half of the 20th century cannot be modeled without introducing anthropogenic factors. At the same time, when considering anthropogenic greenhouse gases and aerosols, climate models accurately describe the dynamics of global air temperature.
In response to the anthropogenic forcing of greenhouse gases, there should be a continuous increase in the global near-surface air temperature. In fact, there is a more complex structure of the temporal dynamics of global air temperature, which includes constant short-term fluctuations in air temperature. The root cause of most of them is known; this is the ENSO phenomenon [22].
At present, the Earth is in an interglacial period, i.e., at the air temperature peak of the ice cycle in the so-called Holocene (the last about 11.7 thousand years). After reaching the maximum air temperature regime, i.e., the Holocene optimum, which occurred about six thousand years ago, the global air temperature decreased (before the onset of the industrial era). Model estimates indicate the formation of a new geological epoch, the Anthropocene (approximately from the middle of the last century). Variations with a time scale of about six decades, which are characteristic of AMOs, are significantly manifested in intrasecular air temperature variability. Against the background of an increase in global near-surface air temperatures, the strongest interannual variations associated with the El Niño phenomenon are manifested.
An estimate of the contribution of greenhouse gases and the AMO to changes in air temperature is given in a paper by Mokhov [23]. A climate projection was made for the extratropical zone of the Northern Hemisphere, according to which the warm climate will generally persist for 500 years, but in the 22nd century, it will begin to acquire a noticeable trend toward gradual cooling due to the occurrence of 1000-, 500-, 350-, and 200-year periodicities of climatic fluctuations [24]. Earlier works described regional climate change against the background of barico-circulation processes in the atmosphere of the Northern Hemisphere [25,26,27]. The oscillatory nature of changes in air temperature and precipitation and the contribution of macroscale circulation to regional processes have been revealed.
A paper by Perevedentsev et al. [28] analyzed the features of long-term fluctuations in air temperature according to observations made at the meteorological observatory of Kazan University for the 1828–1992 period. It is shown that the annual average air temperature has increased by 2 °C over the past 165 years. At the same time, the correlation between the annual average air temperature in Kazan and the average air temperature of the 30–60° N latitudinal zone was the largest (r = 0.64) for the 1958–1989 period.
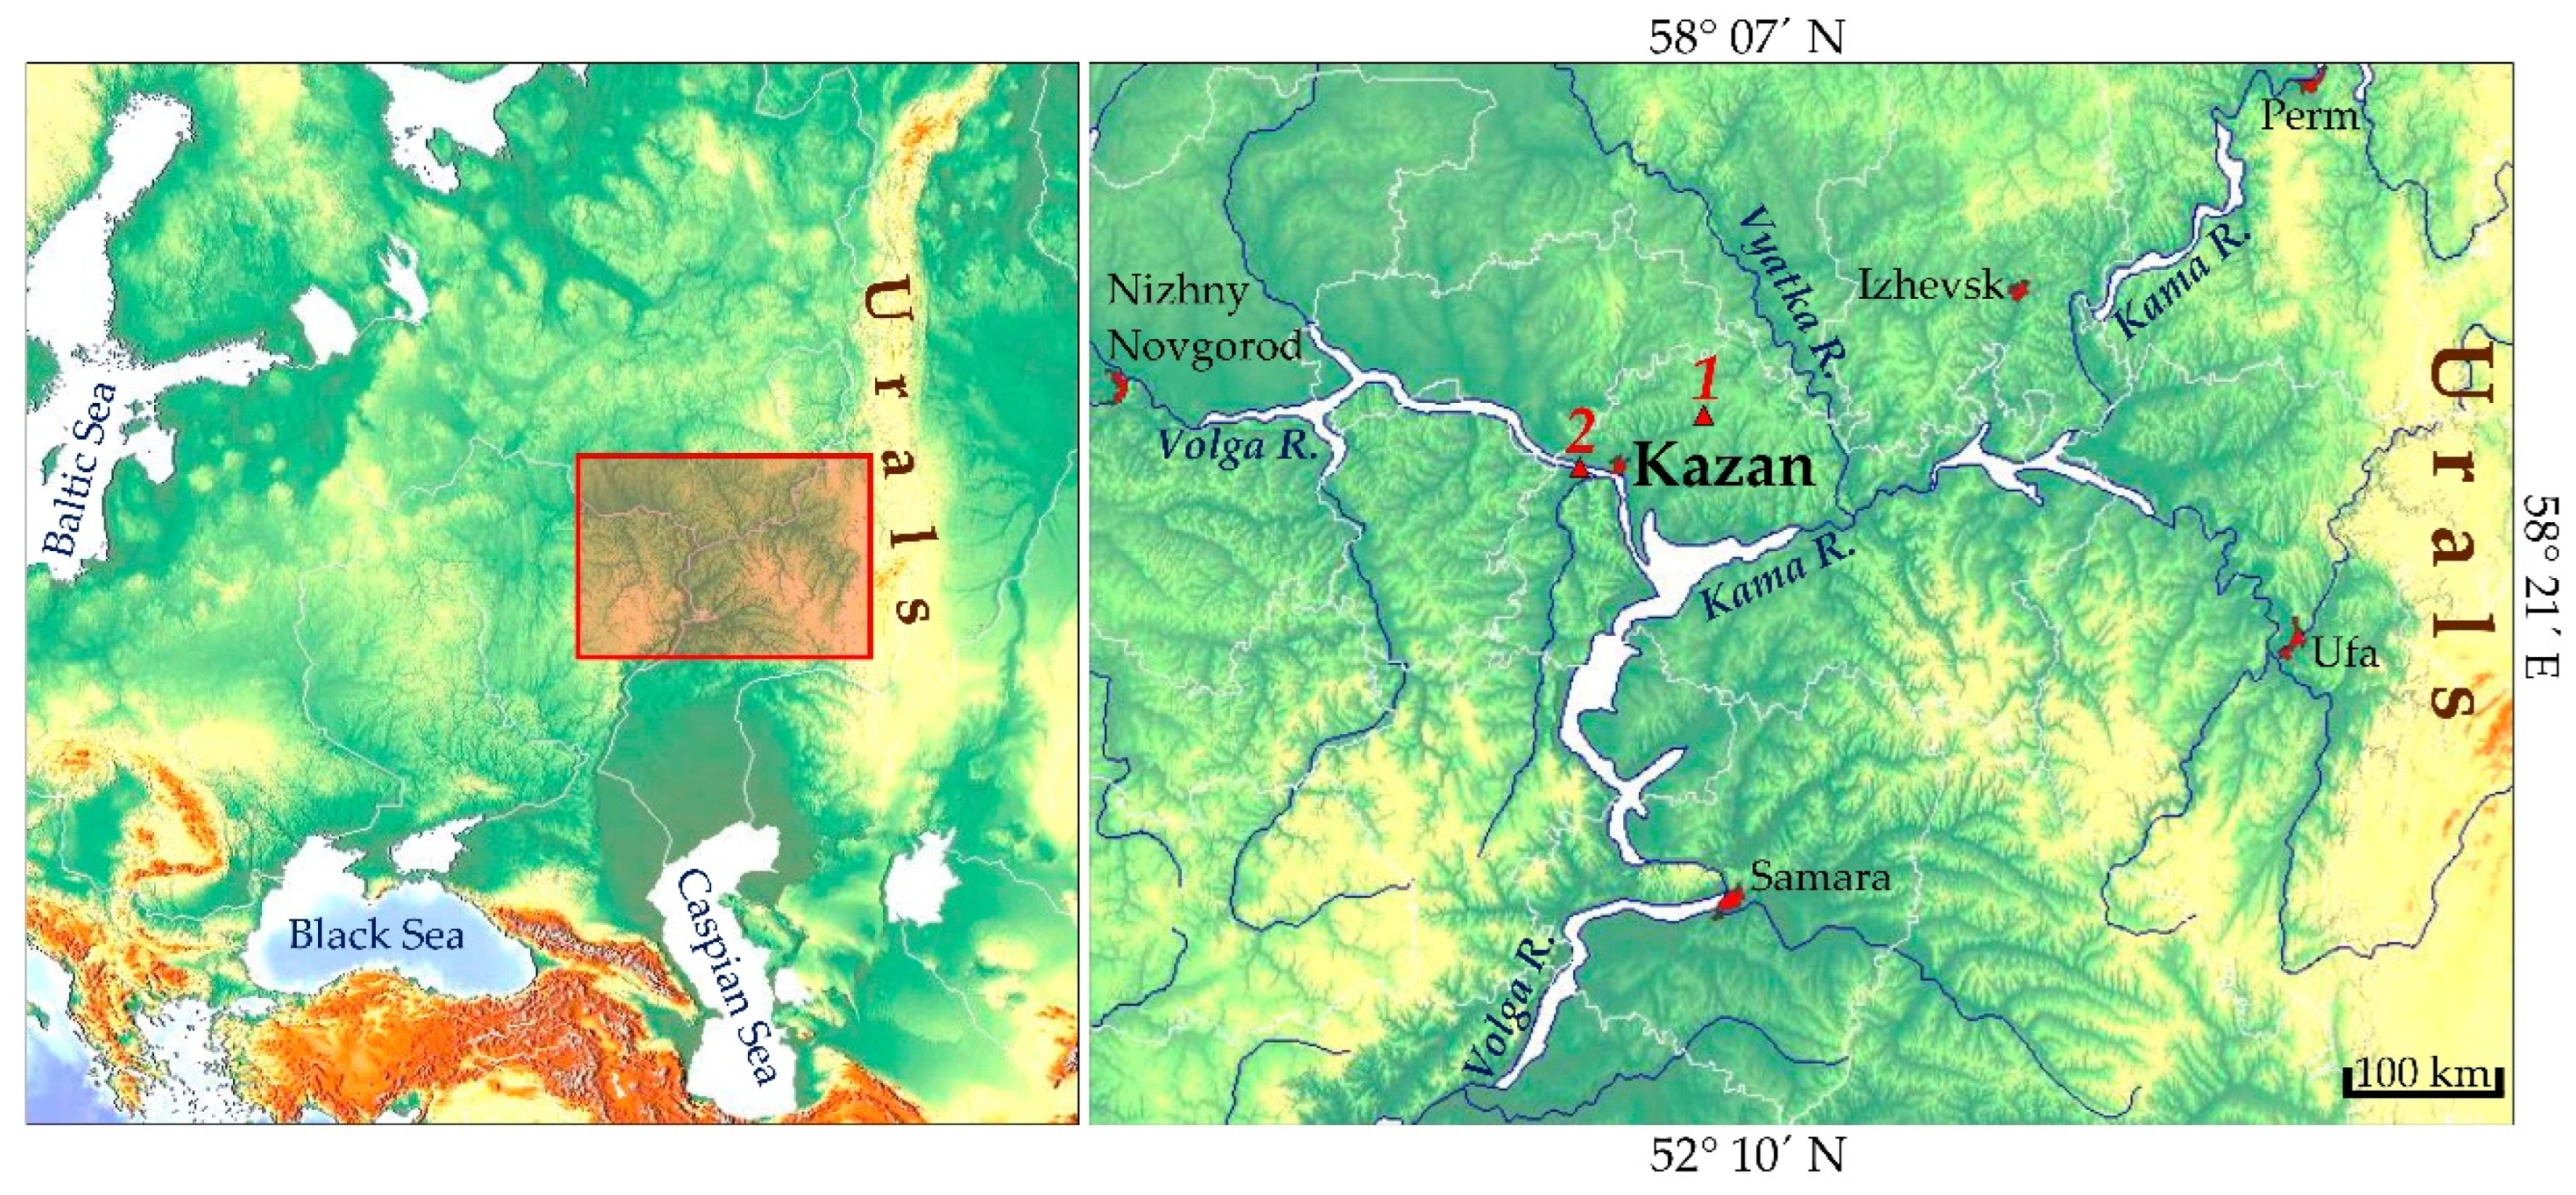
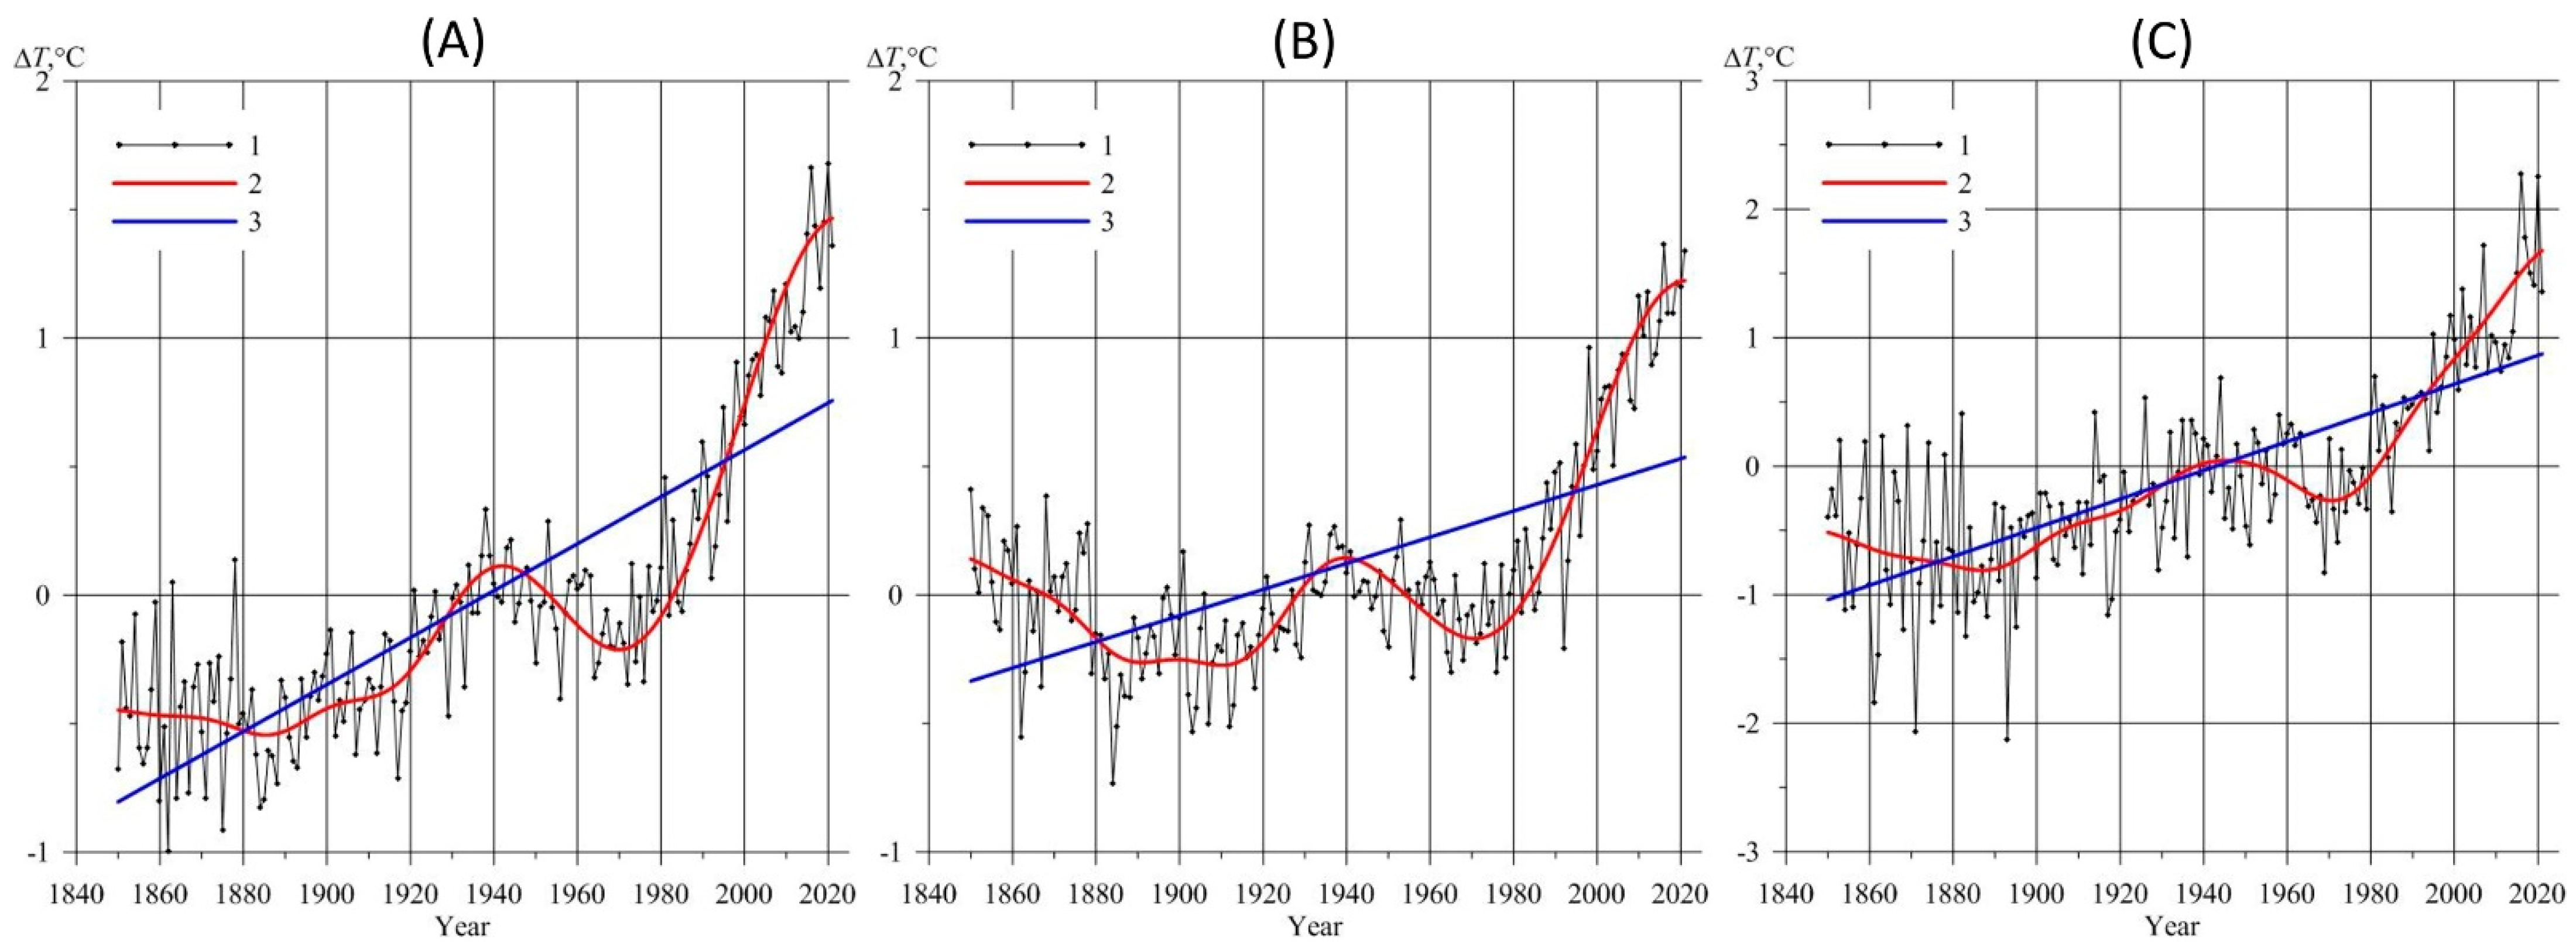
This paper analyzes climate change in the Middle Volga region using long-term data from the meteorological station of Kazan University for the 1828–2021 period. This period was chosen in order to compare regional climatic fluctuations with near-surface air temperature fluctuations averaged over the entire Northern Hemisphere since 1850. This made it possible to assess the contribution of global processes to regional ones.
Climate change in Kazan largely resembles climate change in the Middle Volga region, which is explained by the relatively homogeneous flat territory of the region, the influence of the same factors of macroscale circulation (North Atlantic Oscillation, Scandinavian Oscillation, Arctic Oscillation, and East Atlantic–Western Russia Oscillation) on air temperature and humidity regimes, etc. Our calculations of the correlation coefficients between fluctuations in air temperature in Kazan and at 11 meteorological stations (for the 1888–2020 period), evenly covering the territory of the study region, showed that this correlation is very close in all seasons of the year. Correlation coefficients decrease from 1.0 (Kazan) to 0.82 in the northeast of the Middle Volga region, located at a distance of 663 km from Kazan.
The objectives of this paper are: (1) to consider changes in air temperature in Kazan and the Middle Volga region as a whole for the 1828–2021 period in the context of its change in the Northern Hemisphere of Earth under the influence of natural (atmospheric circulation) and anthropogenic factors; and (2) to detect the climatically determined time boundary between the Holocene and the Anthropocene epoch in the study area.

2. Materials and Methods

As initial data, we used data on near-surface air temperatures around the globe (1850–2021) from the University of East Anglia (https://www.uea.ac.uk/groups-and-centres/climatic-research-unit/data, accessed on 28 December 2022), meteorological observations from 183 meteorological stations in the Volga Federal District (1,036,975 km2), European Russia, from the All-Russia Research Institute of Hydrometeorological Information–World Data Centre (RIHMI–WDC) fund for 1955–2021, as well as long-term observation data from the meteorological observatory of Kazan University for the 1828–2021 period (Figure 1).
As for the meteorological station of Kazan University, in our calculations, we used data on the monthly average and annual average air temperatures for the 1828–1965 period, published in the climatological reference book on the climate of the former USSR [29]. There were no data on the maximum and minimum air temperatures in the reference book for this period; therefore, these indicators of climate change are not considered in this paper. In the 1966–2021 period, data from our own meteorological observations were used (using a TM-1 thermometer, observations were made eight times daily, i.e., every three hours, starting at 00:00 local time). There were no data gaps in the studied series of observations. Throughout the entire period (since 1828), this meteorological station was located in only one place, i.e., in the courtyard of the main building of Kazan University.
Until 1966, observations of air temperature at the network of meteorological stations in the former USSR were carried out not according to an eight-measurements-per-day program, but according to a three- and four-measurements-per-day (for 24 h) program. In the methodological section of the above-noted reference book [29], it is noted that the daily average air temperature obtained from the data of a three- and four-measurements-per-day observation program was equated to the average for 24 h by introducing a correction, i.e., the difference between the average temperature for 24 h, obtained from hourly data thermographs, and the average air temperature for three- and four-measurements-per-day observations. Since 1966, we have not introduced such corrections to the temperature values ca lculated according to the program of our eight-measurements-per-day observations.
The air temperature time series in Kazan was tested for homogeneity. For this, the Abbe test (the method of successive differences) was used. Ratio δ was calculated using the following formulas (Equations (1)–(3)):
δ = g 2 σ 2 ,
g = 1 2 ( n 1 ) i = 1 n 1 ( x i + 1 x i ) 2 ,
σ 2 = 1 n 1 i = 1 n ( x i x ¯ )  is the variance
where xi and xi+1 are parameter values from the data series, x ¯   is the average, and n is the length of the time series.
In the case of stochastic independence of the elements within the series among themselves, δ = 1. In our case, δ = 0.044 (a small value), which indicates the heterogeneity of the series. The Neumann test also applied to verify to the heterogeneity (p = 0.05) of the series used.
We used a long time series for the Kazan University meteorological station in order to assess climate change in the region. By definition, such a series cannot be homogeneous, since its static indicators, i.e., average values, dispersion, etc., changed over time due to changes in climatic conditions (physical and circulation epoch changes) over two centuries, as shown below. A comparison of the low-frequency components of the time series in Kazan and two neighboring stations, Arsk and N. Vyazovye (Figure 1), over the past 70 years showed that there were no statistically significant differences between them, which indicates the quality of observations and the homogeneity of the process. In the 19th century, there were no other stations in the study region besides the university station. We do not know the whole history of observations at the university meteorological station in Kazan in the 19th century; we only use data published before 1966, which are also available in the RIHMI–WDC (Obninsk, Russia) archive (except for climate reference books). In our opinion, this paper obtained reliable objective results indicating long-term changes in the regional climate against the background of the processes occurring in the Northern Hemisphere, including circulation processes.
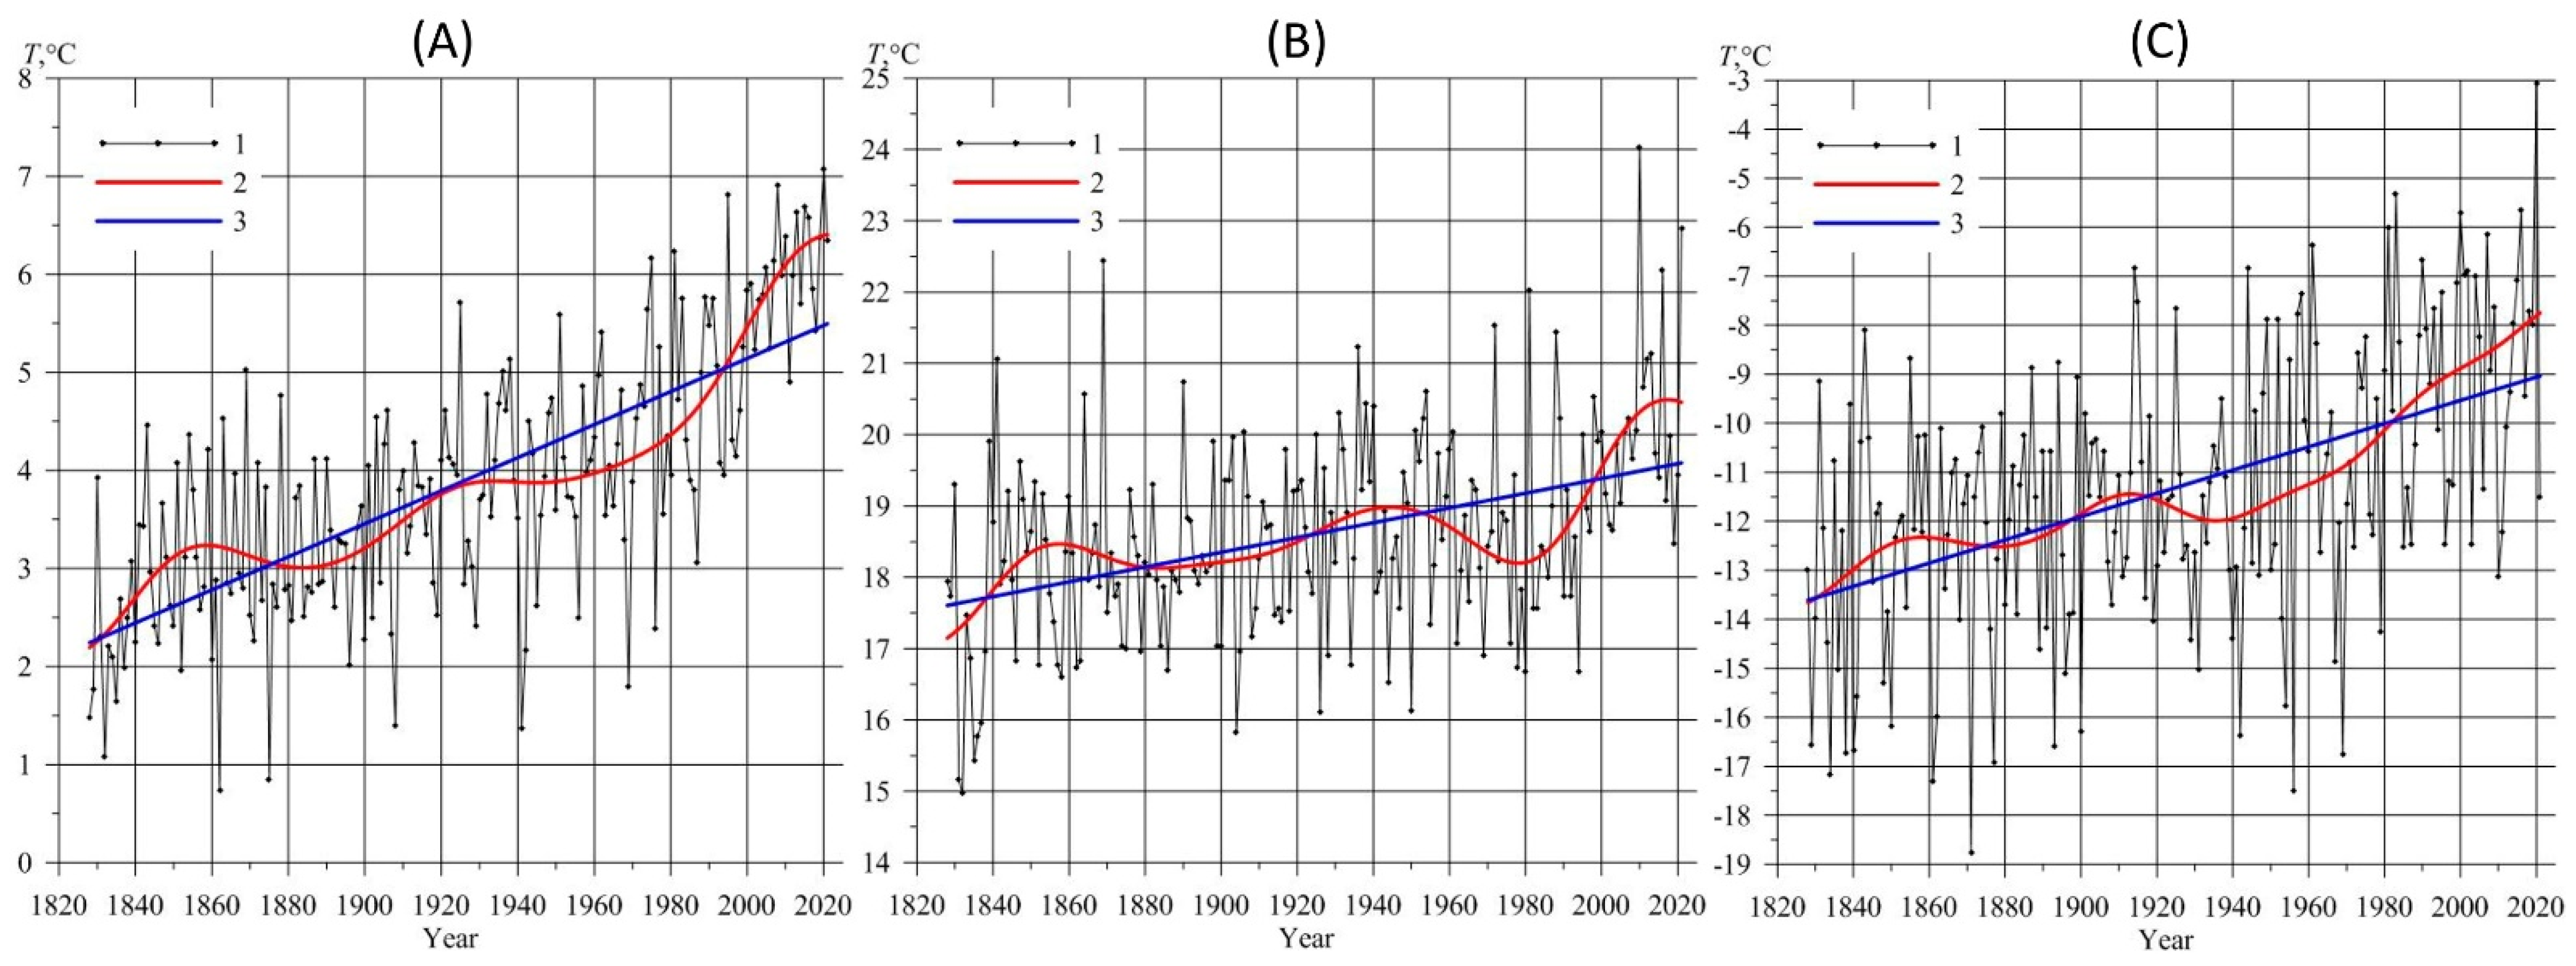
Long-term series of observations were subjected to statistical processing, including the calculation of average values, standard deviations, and the contribution of the linear trend to the air temperature dispersion. Correlation analysis was used to reveal the relationship between air temperature and circulation indicators. Six 30-year periods were identified: 1841–1870, 1871–1900, 1901–1930, 1931–1960, 1961–1990, and 1991–2020. As is known, the 30-year interval is recommended by the World Meteorological Organization (WMO) as a reference period (currently, it is the period 1991–2020) for assessing climatic averages. To assess climate change trends, a linear trend slope coefficient (LTSC) was calculated, the statistical significance of which was estimated at a 95% level of probability [30]. To identify a statistically significant trend in the air temperature time series observations, the nonparametric Mann-Kendall statistical test was used according to the method described in the paper of Alemu and Dioha [31]. For this test, the null hypothesis H0 is that the data (x1, …, xn) are a sample of independent and identically distributed random variables. The alternative hypothesis (H1) of the two-tailed test is that distributions xi, xj are not identical for all k, jn for kj. The value of statistical criterion S is calculated according to Equations (4) and (5):
S = i = 1 n 1 j = k + 1 n s g n ( x i x k )
s g n x i x k =       1   a t   x i x k > 0       0   a t   x i x k = 0 1   a t   x i x k < 0
where xi and xk are parameter values from the data series and n is the length of the time series. The variance of the S value is determined using Equation (6):
V a r S = n n 1 2 n + 5 i t t 1 2 t + 5 / 18
where t is the value of any given relationship and ∑ is the sum over all relationships. If n > 10, the standard normal variable Z is calculated using Equation (7):
Z = S 1 V a r ( S )   a t   S > 0 0   a t   S = 0 S + 1 V a r ( S )   a t   S < 0
According to the two-tailed trend test, the H0 hypothesis should be rejected if |Z| ≥ Z(1 − α/2), where α is the significance level. A positive Z value indicates an uptrend, while a negative Z value indicates a downtrend.
The Buishand’s test at a 5% significance level was used to determine the turning point (change-point detection) of air temperature change. This made it possible to identify two periods in the analyzed long-term observation series, which differed significantly from each other in terms of the intensity of changes in air temperature. This gave grounds to put forward an assumption about a new climatic epoch in the study region.
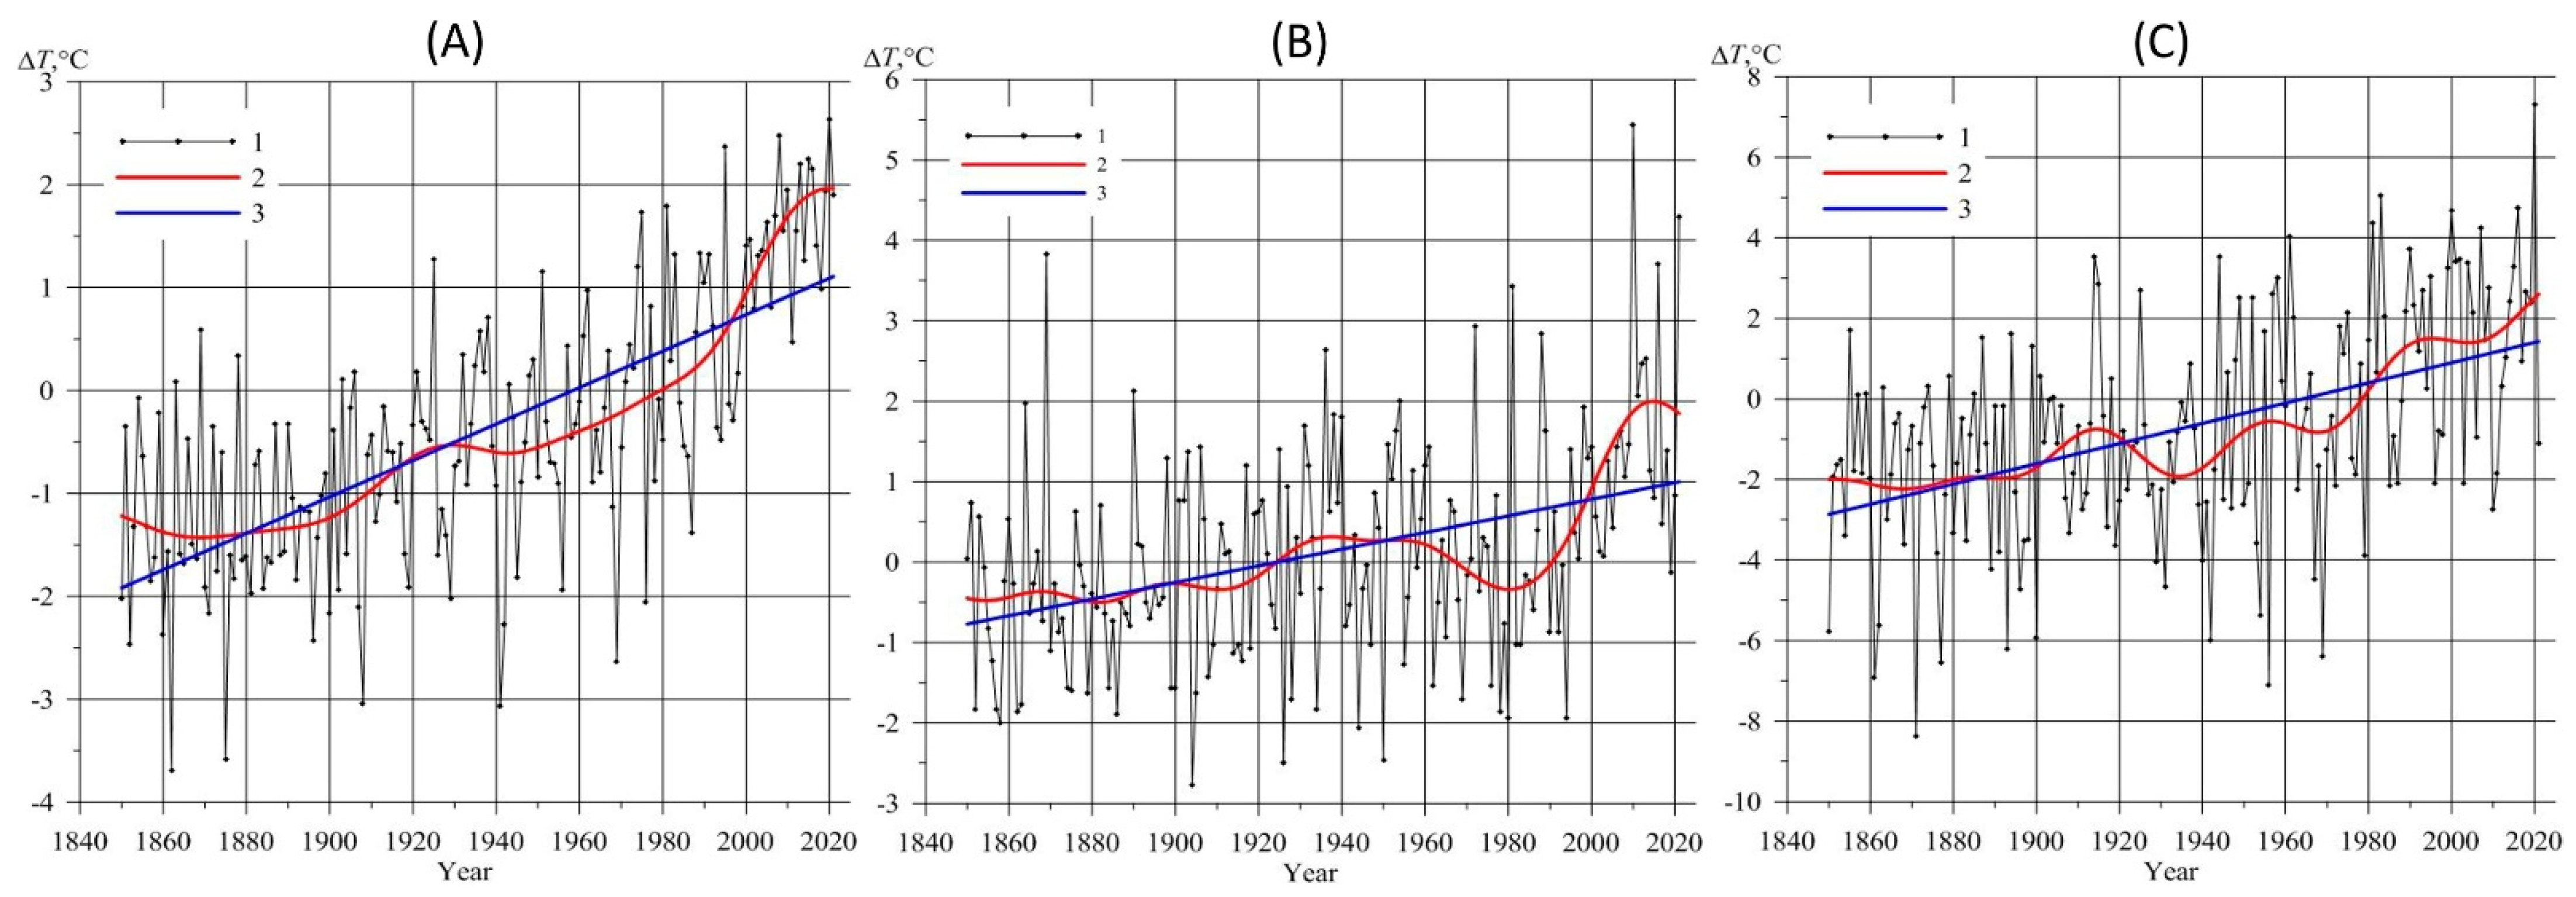
The selection of the low-frequency component (LFC) in the analysis of long-term fluctuations in the multiannual series of air temperature was carried out using the low-frequency Potter factor with a cut-off point of 35 years or more. The statistical significance of the results was assessed using the Fisher test.
Correlations between the air temperature and atmospheric circulation indices of the North Atlantic Oscillation (NAO), Arctic Oscillation (AO), East Atlantic–West Russia Oscillation (EAWR), Scandinavian Oscillation (SCAND), and El Niño–Southern Oscillation (ENSO) were also calculated and then analyzed. The NAO is the leading cause of atmospheric circulation variability over the North Atlantic and Europe; it is characterized by differences in atmospheric pressure between the Azores and Iceland. The strongest winds fall on the positive phase of the NAO. The pressure drop between the subtropical and polar zones characterizes the AO. EAWR (or EATL/WRUS) fluctuations are associated with the main centers of atmospheric action in the eastern part of the Atlantic and the European part of Russia. In its positive phase, the pressure increases over Western Europe and decreases over the center of the North Atlantic and over the European part of Russia. The SCAND index characterizes an increase in atmospheric pressure over Scandinavia and a decrease over Western Europe (the positive phase of SCAND). For more information on these indexes, see https://www.cpc.ncep.noaa.gov/data/teledoc/telecontents.shtml (accessed on 22 December 2022).

3. Results

3.1. Changes in the Air Temperature in the Middle Volga Region over the 1828–2021 Period

Table 1 presents the average characteristics of the air temperature regime in Kazan over a 194-year observation period. During this period, the annual course of air temperature was expressed well: the lowest air temperature was in January (−12.6 °C), the highest air temperature was in July (20.1 °C); thus, the annual amplitude was 32.7 °C, which is typical for a temperate continental climate. The annual average air temperature of this period was 3.9 °C. The interannual variability, expressed in terms of standard deviation (SD), reached its maximum value in the winter months (in December and January, SD = 3.9 °C); in the calendar summer, SD took on minimum values (in July, SD = 1.9 °C). It should be noted that climate warming occurred in all months of the year of the observation period. The greatest increase in air temperature was observed in the winter months (in December and January), as well as in early spring (in March). During the summer months, LTSC values were minimum. The annual LTSC was 0.17 °C/10 years. The used Mann-Kendall test showed that all trends in changes in annual average, summer average, and winter average air temperatures over the 1878–2021 period were statistically significant. At the same time, the contribution of LTSC to the air temperature dispersion was 22% in winter, 15% in summer, and 51% for the whole year. A large contribution to the dispersion of air temperature was also made by the low-frequency component: 27% in winter, 25% in summer, and 58% for the whole year. It should be noted that the 1871–1900 period (especially its winter season) turned out to be the coldest, not only in Kazan, but also in Moscow [12] and in Russia as a whole [17].
It is also of interest to consider changes in air temperature over 30-year periods, as recommended by WMO, as this makes it possible to trace the dynamics of climate change. The results of calculations of climatic averages for six consecutive 30-year periods are presented in Table 2. It is noteworthy that, starting from 1871–1900, the annual average air temperatures, averaged over a 30-year period, increased from 3.1 to 5.7 °C, in summer–from 18.1 to 19.7 °C, and in winter–from −12.6 to −8.7 °C. Moreover, if the annual average air temperature, starting from the 1871–1900 period, increased unidirectionally, then the summer air temperature decreased by 0.34 °C in 1961–1990, and the winter air temperature decreased by 0.05 °C in 1931–1960.
Figure 2 presents data on changes in annual, summer, and winter average air temperatures in Kazan for the 1828–2021 period. As can be seen from Figure 2A, the linear trend (LTSC = 0.168 °C/10 years) indicates an increase in the annual average air temperature throughout the entire period. However, the low-frequency component also highlights subperiods as it decreases. Thus, from 1859 to 1884, the annual average air temperature decreased by 0.23 °C; from 1934 to 1945, it decreased by 0.02 °C, and from 1946 to 2021, it increased by 2.53 °C. This fact indicates a significant warming trend in the modern climate. It should also be noted that the periods of cooling, according to the time series, were much less intense and shorter than the periods of warming.
In summer (Figure 2B), the linearity of the rate of increase in air temperature (LTSC = 0.104 °C/10 years) was significant from 1828 to 1857 (1.32 °C) and even more so in the 1978–2017 period, when the summer air temperature increased by 2.29 °C. Over the 2017–2021 period, there was only a slight decrease in the summer air temperature (by 0.04 °C). In winter (Figure 2C), the LFC curve shows two periods of intense warming: 1828–1858 (ΔT = 1.34 °C) and 1936–2021 (ΔT = 4.24 °C). Thus, winter warming (the passive phase?) in Kazan and in the Middle Volga region as a whole began about 85 years ago, i.e., much earlier than in the entire Northern Hemisphere.
To assess the temporal variability of the air temperature series, the amplitude of the annual variation was calculated as the difference between the maximum and minimum values of the monthly average air temperature in a particular series. Figure 3 shows the long-term course of fluctuations in the annual amplitude of air temperature for 1828–2021. The value of the air temperature amplitude decreased along a linear trend at a rate of 0.12 °C/10 years. Its average value for this period was 34.7 °C, and the amplitude decreased from 36.0 to 33.6 °C over 194 years of observations. This fact testifies to the weakening of the continentality of the regional climate. According to Zveryaev [32], in the 1901–2000 period in European Russia, anomalously warm years were characterized by smaller amplitudes of the annual variation in air temperature.
An analysis of the maximum monthly average air temperature in July (Tmax) and the minimum monthly average air temperature in January (Tmin) showed that Tmax grew at a rate of 0.108 °C/10 years and, based on the LFC curve, its course was oscillatory. Tmin grew noticeably faster (0.230 °C/10 years) than Tmax.

3.2. The Beginning of the Anthropocene in the Middle Volga Region

According to IPCC (2013), the current anthropogenic climate warming on Earth entered an active phase in the mid-1970s. An analysis of the data from Figure 2 shows that, according to the low-frequency curve, warming in Kazan began somewhat earlier, i.e., in 1946. As noted above, to determine the turning point of air temperature change, the Buishand’s test was used, according to which a significant change in the annual average air temperature since 1946 was revealed. Therefore, that year can be considered the beginning of a new climatic epoch, i.e., the Anthropocene, in the Middle Volga region. To substantiate this position, calculations of average air temperatures, standard deviations of air temperatures, and linear trends were made, the results of which are presented in Table 3. As can be seen from Table 3, during the Anthropocene epoch (from 1946 to the present), the annual average air temperature in Kazan increased sharply (by 1.66 °C); in summer by 0.91 °C, and in winter by 2.45 °C. It is known that anthropogenic warming is most effective in winter, which is confirmed by the data from Table 3. The increase in the magnitude of interannual fluctuations in air temperature in the summer and winter seasons and for the year as a whole should also be noted. All this testifies to a more intense process of changing the air temperature regime in the final more than 75-year period. The increase in air temperature growth rates was especially noticeable in the 1946–2021 period (statistically significant increase). Thus, in winter, the coefficient of slope of the linear trend of the annual average air temperature reached 0.46 °C/10 years, which exceeded this value for 1828–1945 by 3.4 times. In addition, the process of warming in Kazan and throughout the Middle Volga region proceeded more intensely throughout the year and in summer (0.25 °C/10 years), exceeding the previous indicator by 2.8 times.
Modern climate warming is most noticeably manifested in winter, and not in summer, when solar radiation and the underlying surface have a strong influence on the air temperature regime [15,17,18]. This fact further confirms the anthropogenic nature of the warming observed in Kazan since the late 1940s. The evaluation results are reliable at a probability of more than 95%.
In addition, the nonparametric Mann–Kendall test was used to estimate air temperature trends over the 1828–1945 and 1946–2021 periods. An analysis of the results showed that the trend was statistically insignificant for winter and summer in 1828–2021 and significant in 1946–2021. This fact indicates a qualitative change in the air temperature regime.
We carried out a special study in which we compared changes in air temperature in Kazan and in the village of N. Vyazovye and the town of Arsk (see Figure 1), located in rural areas. Almost identical results were found for long-term changes in air temperature over the 1950–2021 period. The presence of an urban environment in Kazan has caused only a slight increase in the annual average air temperature, i.e., by 0.24 °C, compared to the surrounding area over the past decades.

3.3. Statistics of Large Air Temperature Anomalies in the Middle Volga Region

In the 1955–2021 period, according to data from 183 meteorological stations, large, normalized anomalies of near-surface air temperature (TT) averaged over the Volga Federal District were estimated. Table 4 presents the results of calculations for the entire observed period and for its two sub-periods: 1955–1998 and 1999–2021. The number of large positive anomalies in the 1955–2021 period was more common in the spring months (March to May) and in June, when their number ranged from 11 to 15, or from 17.2 to 23.4% of the total time, i.e., almost every fourth or fifth year was abnormally warm. The average intensity of such anomalies varied from 1.24 (December) to 1.74 (August). The number of negative anomalies was approximately the same as positive ones, but they often exceeded positive anomalies in intensity. A sub-period from 1999 to 2021 was identified, in which the number of positive anomalies significantly exceeded the number of negative ones. At the same time, the share of the lifetime of positive anomalies (often up to 30%) increased significantly in percentage terms. This fact indicates a noticeable warming of the climate in the Volga Federal District at the beginning of the 21st century. The intensity of positive normalized anomalies varied from 1.26 (June) to 1.81 (August), while the intensity of negative normalized anomalies varied from −1.20 (October) to −2.51 (December). At the same time, there were no cases of large negative anomalies in April and September over the past twenty years.

3.4. Long-Term Changes in Air Temperature in the Middle Volga Region against the Background of the Northern Hemisphere

A comparison of near-surface air temperature anomalies calculated over the background (reference) period (1961–1990) for the city of Kazan and the Northern Hemisphere (Figure 4 and Figure 5) indicated that, in both cases, climate warming showed a linear trend throughout the year and season. However, the LFC curve showed that the annual warming began in Kazan in 1946, while in the Northern Hemisphere, the active phase of the annual average air temperature increase began in 1970. Summer warming in Kazan has been ongoing since 1980 (in the 2015–2021 period, it slowed, and the air temperature decreased by 0.15 °C over 6 years); in the Northern Hemisphere, the air temperature has been rising since 1971. Winter warming (the active phase) in Kazan began in 1968 and continues now, except for a short period, i.e., 1995–2004; in the Northern Hemisphere, the winter average air temperature rose steadily from 1970 to 2021. Thus, the current intense climate warming (with the possible exception of the winter season) in Kazan and the Middle Volga region as a whole did not coincide with similar indicators in the Northern Hemisphere.
In general, for the 1850–2021 period, the LTSC values of the Northern Hemisphere were 0.07 °C/10 years (annual), 0.05 °C/10 years (summer), and 0.08 °C/10 years (winter). In Kazan, the LTSC values were equal to 0.18 °C/10 years (annual), 0.10 °C/10 years (summer), and 0.25 °C/10 years (winter). Hence, the warming in the Middle Volga region was more intense than in the Northern Hemisphere as a whole. The air temperature LFC curve makes it possible to identify periods with monotonous air temperature changes of the same type (direction). It should be noted that during the period from 1970 to 2021, the air temperature in the Northern Hemisphere increased by 1.32 °C per annum, by 1.20 °C in summer, and by 1.39 °C in winter. In Kazan, the annual average air temperature for 1946–2021 increased by 2.57 °C; the summer average air temperature increased by 2.34 °C from 1980 to 2015; and the winter average air temperature increased by 3.43 °C from 1968 to 2021.
The most detailed information about the nature of long-term air temperature changes in different months of the year in Kazan and the Northern Hemisphere can be obtained from Figure 6. It shows the fields of change in the first difference in the low-frequency component of air temperature with a period of more than 25 years in from 19th to the 21st centuries. Naturally, the picture is smoother for the Northern Hemisphere; the periodicity of warming and cooling is clearly noticeable, starting from 1910. At the same time, this process was almost homogeneous throughout the year (Figure 6 (right)). In Kazan, the process was more complicated: the most dramatic changes in air temperature occurred during the cold season. Against the general background of warming, periods of less intense cooling were distinguished. The greatest changes in air temperature were observed in the city in November. In recent decades, summer average air temperatures have increased more intensively in August, but in recent years, there has been some decrease.

3.5. The impact of Atmospheric Circulation on the Thermal Regime of the Middle Volga Region

To assess the impact of atmospheric circulation on air temperature changes in Kazan, correlation coefficients (r) between monthly average air temperatures in Kazan and the ENSO and EAWR indices were calculated. It was revealed that the highest values of r were for July (r (ENSO) = 0.63) and August (r (ENSO) = 0.48) over the 30-year period from 1990 to 2019. Almost every 30 years, from 1950–1979 to 1990–2019, there was a close dependence of air temperature fluctuations in Kazan on EAWR oscillations. The correlation coefficients took a negative value, which indicates the cooling effect of these fluctuations. The absolute value of r in April–October in some cases reached 0.86 (Table 5). It should also be noted that there was a fairly close relationship between the ENSO and EAWR indices in July and August in the 1990–2019 period (r = −0.61), which indicates the influence of the ENSO phenomenon on the circulation regime of the Northern Hemisphere.
For a more detailed assessment of the impact of the El Niño phenomenon on the Middle Volga region climate, its various indices, characterized by ocean surface temperatures, including Niño1+2 (80–90° W), Niño3 (90–150° W), Niño3,4 (170–120° W), and Niño4 (160° E–150° W) in the near-equatorial latitudes of the Pacific Ocean, were used. Correlation coefficients between monthly average air temperatures in Kazan in various 30-year periods and the indicated El Niño indices were also calculated. For the 1930–1959 period, significant correlation coefficients were detected in August (where r ranged from 0.36 to 0.45) and October (where r ranged from −0.36 to −0.41). The highest correlations were found for July (where r ranged from −0.36 to −0.70) and August (where r ranged from −0.31 to −0.47) for the 1990−2019 period. In general, for the calendar summer season, the closest relationships were with Niño3,4 (r = −0.54) and Niño4 (r = −0.66).
During the 1990–2019 period, the most intense El Niño events (warm phase) were observed in 1998 and 2015; the more intense ENSO (the warmer equatorial zone of the Pacific Ocean), the stronger its influence on the climate of the Middle Volga region. Apparently, an indirect mechanism is at work: during the warm phase of El Niño, the EAWR oscillation increases, which has a cooling effect on the air of the Middle Volga region in summer. Indeed, in June and July in the 1990–2019 period, fairly close relationships between the ENSO and EAWR indices (r = −0.61) were found. Table 5 presents the values of r between the air temperature in Kazan and the EAWR index for 30-year subperiods during the 1950–2019 period, where each new period begins with a time shift (lag) of 10 years. Regardless of the chosen 30-year period, during the warm season (April to September), air temperature changes in Kazan were under the steady influence of EAWR oscillations. At the same time, if, in winter, the air masses entering the Middle Volga region from the Atlantic resulted in warming, then, in summer, they resulted in a decrease in air temperature.
To assess the impact of climate change occurring in the Northern Hemisphere, we calculated the correlation coefficients between near-surface air temperatures in Kazan and the Northern Hemisphere for the 1850–2021 period. As can be seen from Table 6, these coefficients are statistically significant for all months of the year. The closest correlation was found for the winter period (in January, r = 0.68). The value of the coefficient of determination R2 shows the contribution of the processes of the Northern Hemisphere to air temperature changes in the Middle Volga region. Thus, the annual contribution has reached 63%, i.e., 27% in summer and 43% in winter.
For the shorter period of 1950 to 2021, the correlation coefficients between air temperature fluctuations in Kazan and the entire Northern Hemisphere were also calculated. As can be seen from Table 7, there was a slight decrease in these coefficients, but the observed pattern remained, although there was a slight increase in the interaction between the processes in the summer.
Table 8 shows the calculated correlation coefficients between air temperature changes in Kazan and some atmospheric circulation indices for the 1950–2021 period. In winter, the closest positive correlations were noted with the NAO and AO indices; it was negative on the SCAND index. In summer, EAWR oscillations had a strong cooling effect on the regional climate.

4. Discussion

As a result of this study, a certain dependence of air temperature fluctuations in Kazan and the Middle Volga region as a whole on climatic processes in the Northern Hemisphere was revealed. This was evidenced by the high coefficients of correlation between the air temperature of the study region and the land in the Northern Hemisphere: according to annual data, r = 0.79; according to summer data, r = 0.52; and according to winter data, r = 0.66. This is equivalent to the contribution of the global factor to the regional processes by 63% in the year, by 27% in summer, and by 43% in winter, according to the values of the coefficient of determination R2. These data refer to the entire 1850–2021 period. For a later period, for example, 1970–2021, this contribution was most likely higher. Paleoclimatic reconstructions testify to the periodicity of climate change in the Holocene caused by natural factors. According to Gruza and Rankova [17], 1000-, 500-, 350-, and 200-year periodicities have been detected. At the same time, some studies of the Late Holocene have shown 60-year fluctuations [1,9]; according to Mokhov and Smirnov [
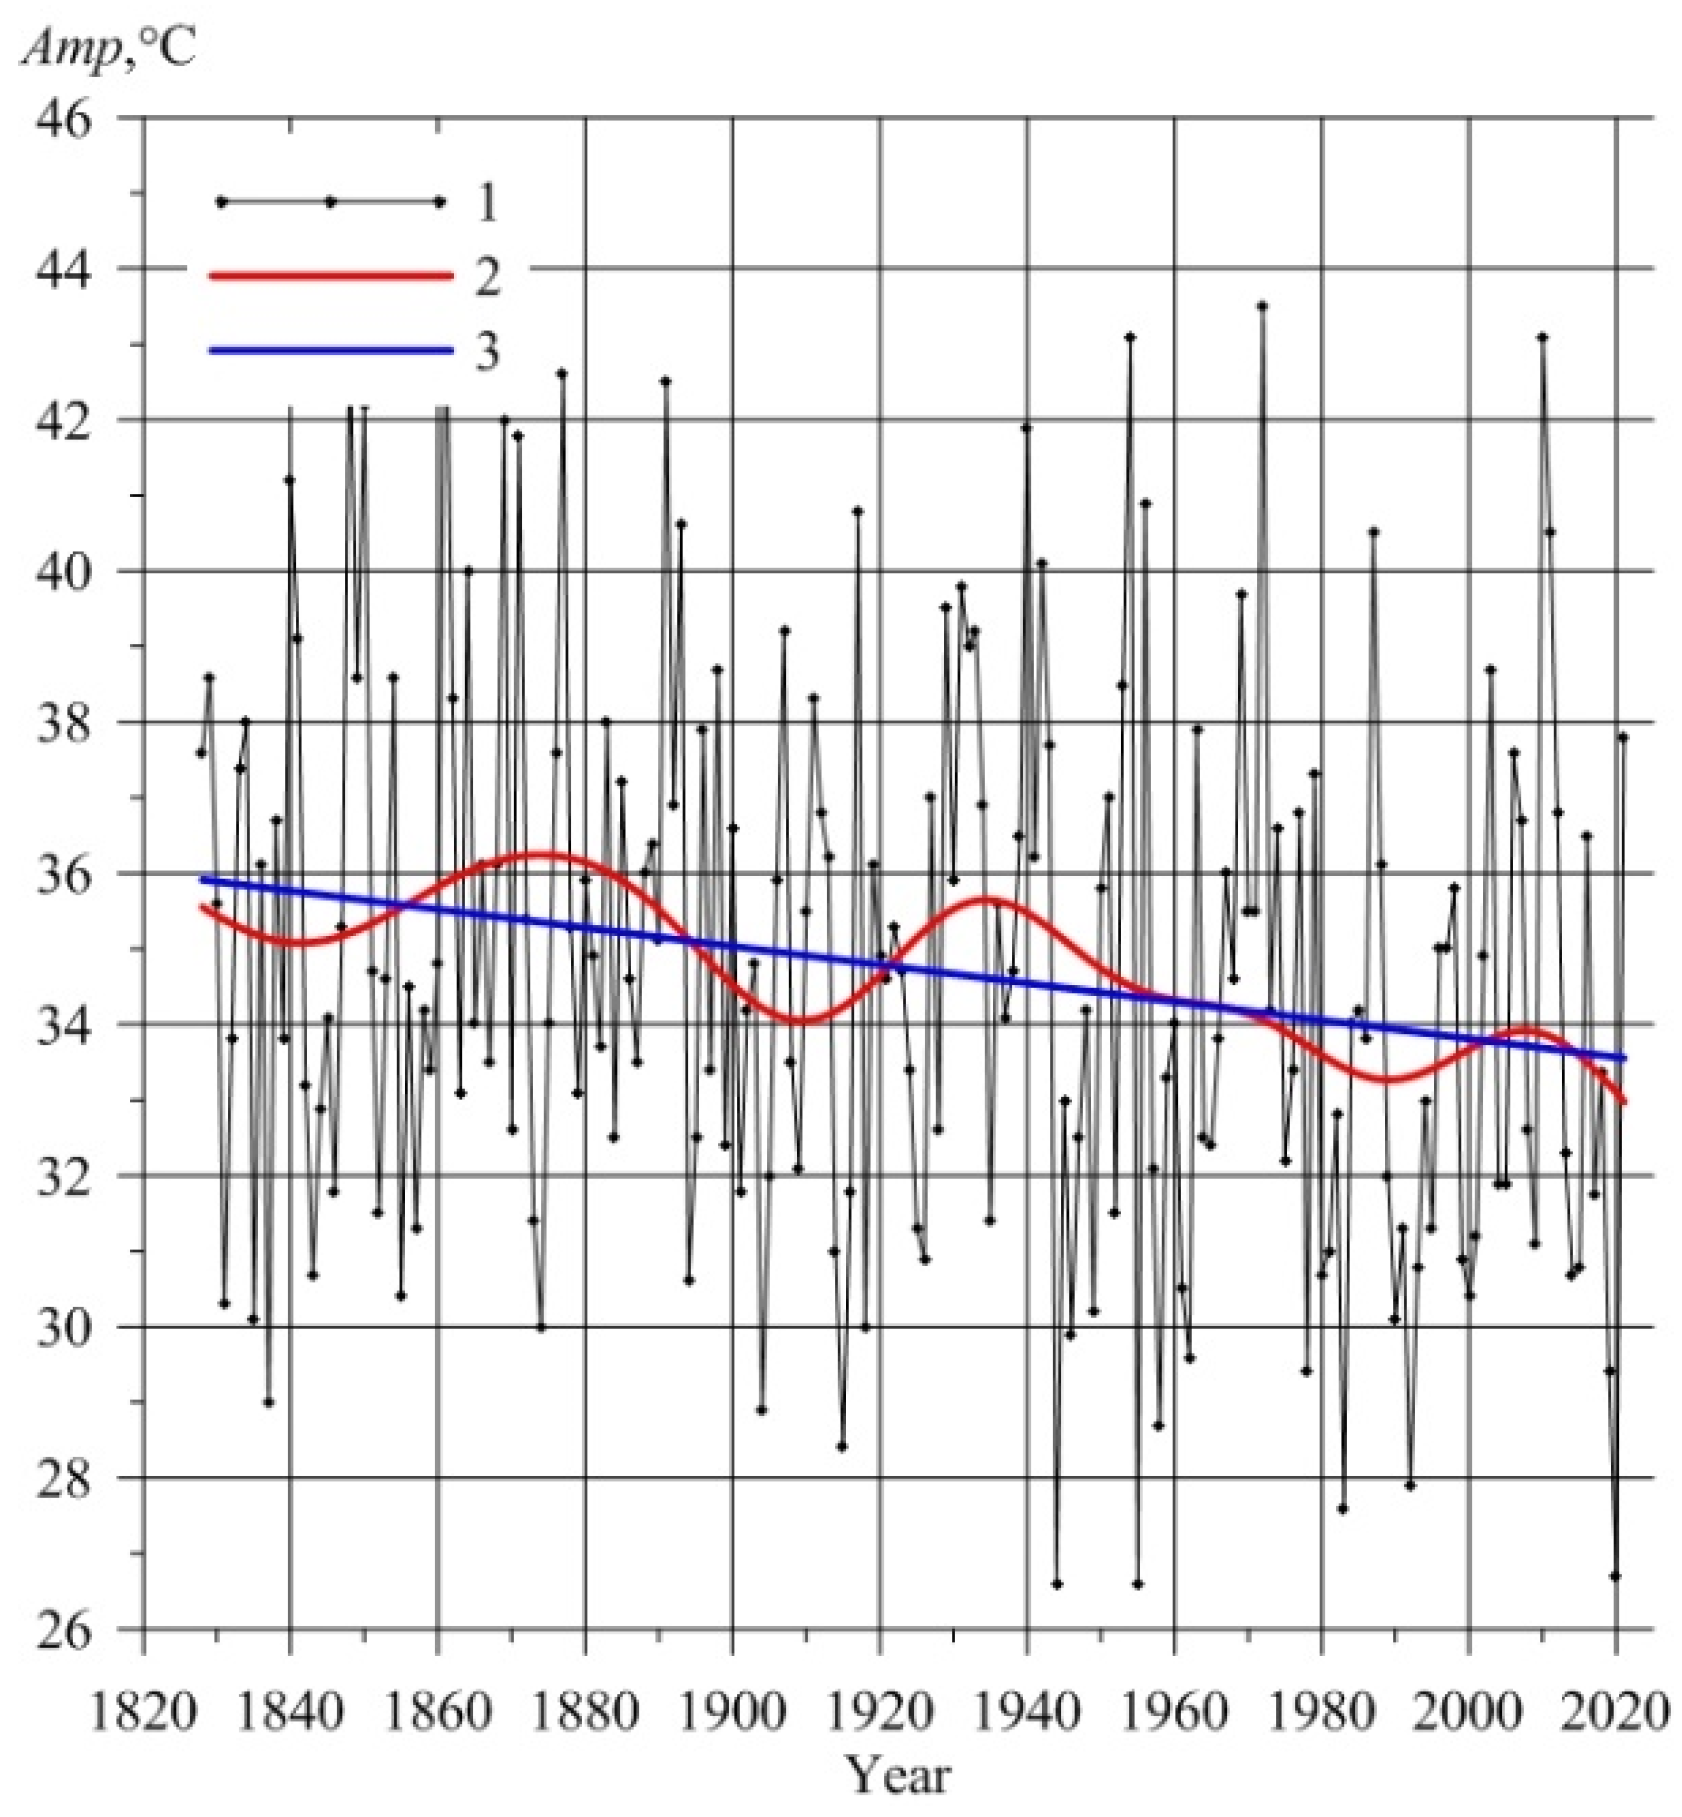
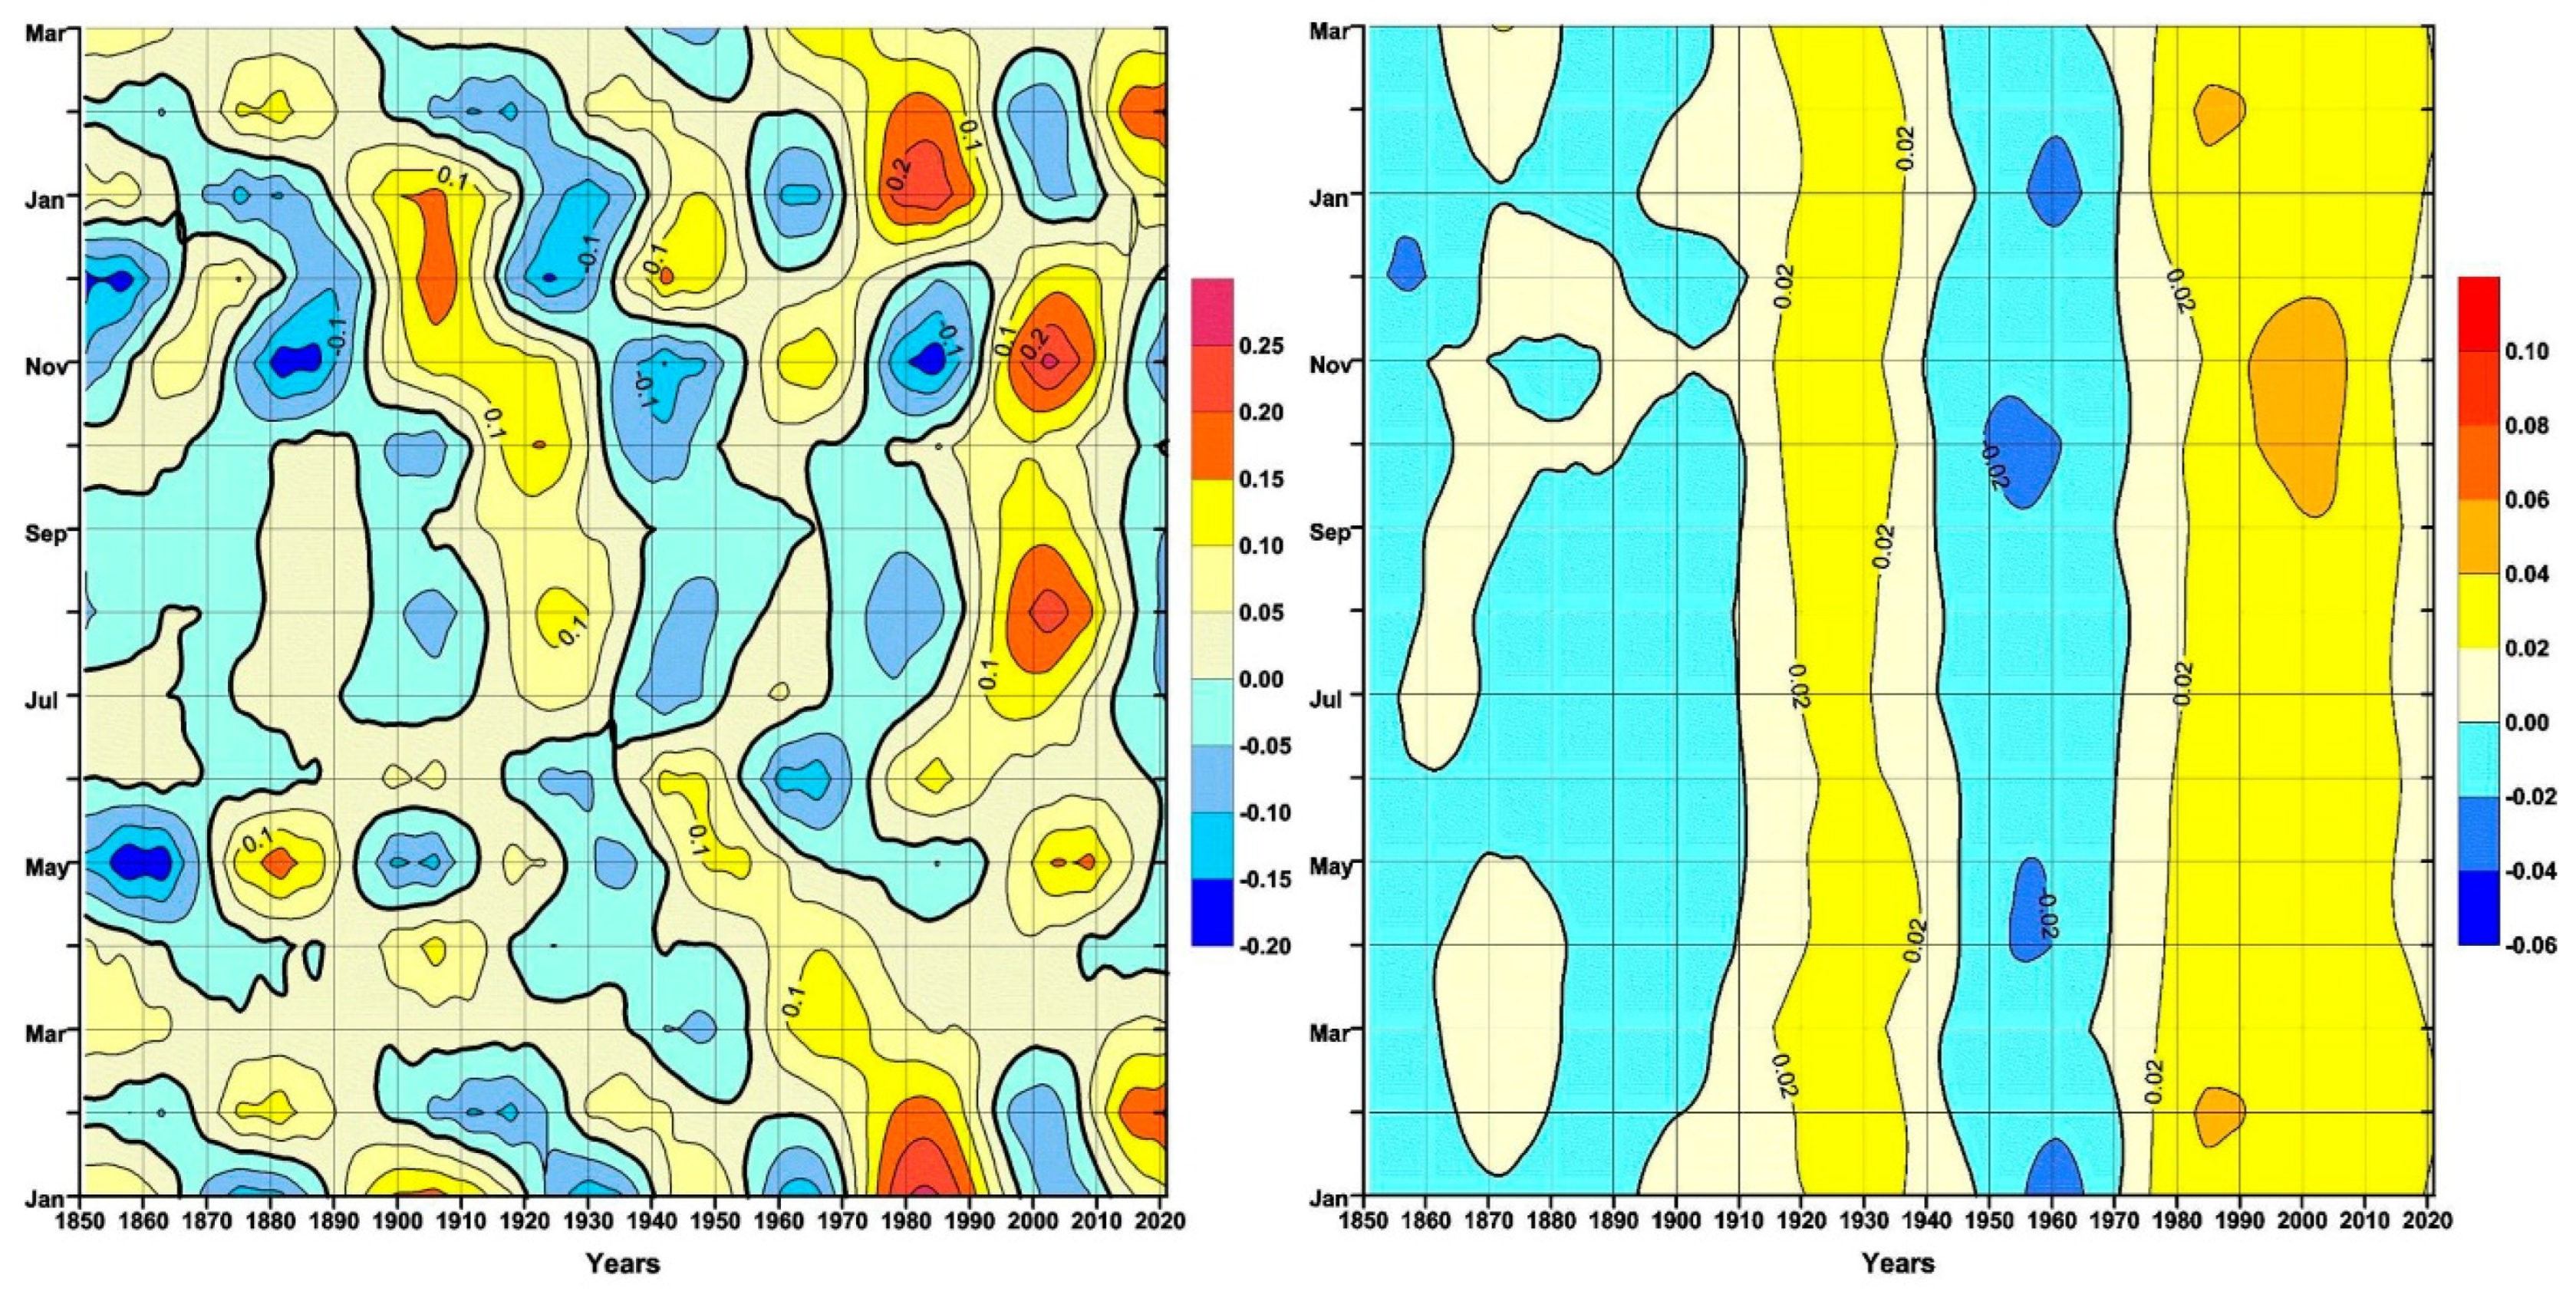
10], climate warming in the 20th century was associated with short-term fluctuations of anthropogenic origin. This can be confirmed by short-term fluctuations in the air temperature of the Northern Hemisphere in all months of the year in the 20th and 21st centuries (1920–1937, 1948–1970, and 1976–2020). As a result of ongoing climate change in the region, there was a significant increase in the number of positive air temperature anomalies in the 1991–2021 period compared to the earlier 1955–1998 period. At the same time, in April and September, there was no case of a large negative air temperature anomaly over the past 20 years. In addition, in the 1828–2021 period, there was a noticeable decrease in the annual air temperature amplitude (by 2.4 °C), which indicates a weakening of the continentality of the climate in the region. However, one cannot ignore the role of atmospheric circulation regimes, which have a noticeable effect on climate fluctuations of a shorter nature, as well as 60-year fluctuations that manifest themselves in many geophysical and geographical processes. The role of the ENSO is indirectly affected, since this phenomenon affects the oscillations of the EAWR, which has a noticeable cooling effect on the summer air temperature regime in the Middle Volga region.
In this paper, as a result of our analysis of air temperature indicators in the 1828–1945 and 1946–2021 periods, it has been convincingly shown that the climate-induced beginning of the Anthropocene epoch in the Middle Volga region dates back to the end of the 1940s, which resulted in a sharp increase in air temperature and its growth rate (by about three times). All this points to an important role of anthropogenic factors, especially in winter.

5. Conclusions

  • In the 1828–2021 period, in Kazan and the Middle Volga region as a whole, a trend toward an increase in air temperature was revealed in all calendar months. The rate of warming reached the highest values in the winter and spring seasons (in December, LTSC = 0.28 °C/10 years; in March, LTSC = 0.25 °C/10 years).
  • An analysis of 30-year averages of air temperature for the 1841–2020 period showed that in the last 30 years (1991–2020), the air temperature in all months of the year was higher than in all previous 30-year periods. The greatest air temperature trends were observed in the region in the 1970–2021 period. At the same time, in the winter and spring months, warming occurred at a higher rate than in the rest of the year.
  • Using a low-frequency analysis of time series of air temperature in Kazan and throughout the Northern Hemisphere over the 1850–2021 period, periods of increase (decrease) in air temperature of various intensity were identified. It has been shown that periods of warming were longer and more intense than periods of cooling. In the low-frequency component, quasi-60-year fluctuations in the annual air temperature amplitude were distinguished, which can be explained by fairly close cycles of a number of geophysical factors.
  • Our analysis of the air temperature parameters during the 1828–1945 and 1946–2021 periods made it possible to identify the climatically determined beginning of the Anthropocene epoch (i.e., 1946) in the Middle Volga region, at which point a significant increase in air temperature (warming) and its growth rate (by about three times) occurred. These facts point to the anthropogenic phase of climate warming in the study region.
  • A correlation dependence of air temperature fluctuations in Kazan and the Middle Volga region as a whole on the climatic processes of the Northern Hemisphere was also revealed for the entire observation period. According to annual indicators, the correlation coefficient (r) reached 0.79; in summer, r = 0.52; in winter, r = 0.66. This made it possible to assess the contribution of the global processes to regional ones: in winter, ~43% of air temperature changes were explained by global factors; in summer, this value was ~27%. In an annual context, this contribution amounted to 63%. As for the Anthropocene, this contribution was 37%, 32%, and 54%, respectively.
  • The dependence of the air temperature regime of the city of Kazan and the Middle Volga region as a whole on oscillations in atmospheric circulation is shown: a close relationship with the NAO, AO, and SCAND indices was found, and in summer with EAWR.
  • The closest relationship between air temperature fluctuations in Kazan and the Middle Volga region as a whole and the EAWR oscillation index was revealed for the 1990–2019 period. This fact indicates a significant role of natural factors in the formation of the air temperature regime during the warm period of the year, contributing to an increase in air temperature.

Author Contributions

Conceptualization, Y.P.P., K.M.S. and N.A.M.; methodology, Y.P.P., K.M.S., A.V.G., N.A.M., T.R.A. and A.A.N.; software, K.M.S., T.R.A. and A.A.N.; validation, Y.P.P., A.V.G., N.A.M., T.R.A. and A.A.N.; formal analysis, Y.P.P.; investigation, Y.P.P.; resources, Y.P.P., A.V.G., N.A.M., K.M.S., T.R.A. and A.A.N.; data curation, Y.P.P. and A.V.G.; writing—original draft preparation, Y.P.P. and N.A.M.; writing—review and editing, Y.P.P., A.V.G., N.A.M., K.M.S. and T.R.A.; visualization, Y.P.P.; supervision, Y.P.P.; project administration, Y.P.P.; funding acquisition, Y.P.P. All authors have read and agreed to the published version of the manuscript.

Funding

The analysis of the long-term dynamics of the thermal regime in Kazan and the Middle Volga region against the background of the processes of the Northern Hemisphere was carried out with financial support of the Russian Science Foundation and the Cabinet of Ministers of the Republic of Tatarstan within the framework of the scientific project No. 22-27-20080.

Data Availability Statement

Not applicable.

Conflicts of Interest

The authors declare no conflict of interest.

References

  1. Gruza, G.V.; Rankova, E.Y. (Eds.) Observed and Expected Climate Changes in Russia: Air Temperatures; RIHMI-WCD: Obninsk, Russia, 2012. (In Russian) [Google Scholar]
  2. Meleshko, V.P. (Ed.) Climate of St. Petersburg and Its Changes; Voeikov Main Geophysical Observatory: St. Petersburg, Russia, 2010. (In Russian) [Google Scholar]
  3. Bronner, F.K. Consequences from meteorological observations in Kazan in 1814. Kazan News 1815, 35, 200–202. (In Russian) [Google Scholar]
  4. Shulgin, A.M. Soil Temperature Regime; Gidrometeoizdat: Leningrad, Russia, 1957. (In Russian) [Google Scholar]
  5. IPCC. Climate Change 2022: Impacts, Adaptation and Vulnerability. Contribution of Working Group II to the Sixth Assessment Report of the Intergovernmental Panel on Climate Change; Pörtner, H.-O., Roberts, D.C., Tignor, M., Poloczanska, E.S., Mintenbeck, K., Alegría, A., Craig, M., Langsdorf, S., Löschke, S., Möller, V., et al., Eds.; Cambridge University Press: Cambridge, UK; New York, NY, USA, 2022. [Google Scholar]
  6. Brohan, P.; Kennedy, J.J.; Harris, I.; Tett, S.F.B.; Jones, P.D. Uncertainty estimates in regional and global observed temperature changes: A new data set from 1850. J. Geophys. Res. 2006, 111, D12106. [Google Scholar] [CrossRef]
  7. Mokhov, I.I.; Eliseev, A.V.; Guryanov, V.V. Model estimates of global and regional climate changes in the Holocene. Dokl. Earth Sci. 2020, 490, 23–27. [Google Scholar] [CrossRef]
  8. Bartsev, S.I.; Belolipetsky, P.V.; Degermendzhi, A.G.; Ivanova, Y.D.; Pochekutov, A.A.; Saltykov, M.Y. Refocusing on the dynamics of the Earth’s climate. Her. Russ. Acad. Sci. 2016, 86, 135–142. [Google Scholar] [CrossRef]
  9. Datsenko, N.M.; Ivashchenko, N.N.; Sonechkin, D.M.; Monin, A.S.; Berestov, A.A. Clobal climate oscillations over the last 150 years. Dokl. Earth Sci. 2004, 399, 1180–1183. (In Russian) [Google Scholar]
  10. Mokhov, I.I.; Smirnov, D.A. Empirical estimates of the contribution of greenhouse gases and natural climatic variability to surface air temperature trends for various latitudes. Dokl. Earth Sci. 2022, 503, 53–59. [Google Scholar] [CrossRef]
  11. Klimenko, V.V.; Klimanov, V.A. Climate of the Northern Hemisphere in the medieval optimum. Dokl. Earth Sci. 2000, 371, 554–558. [Google Scholar]
  12. Klimenko, V.V. On the main climatic rhythms of the Holocene. Rep. Russ. Acad. Sci. 1997, 357, 399–402. (In Russian) [Google Scholar]
  13. Monin, A.S.; Shishkov, Y.A. On statistical characteristics of the Small Ice Age. Rep. Russ. Acad. Sci. 1998, 358, 252–255. (In Russian) [Google Scholar]
  14. Golitsyn, G.S.; Efimova, L.K.; Mokhov, I.I.; Tikhonov, V.A.; Khon, V.I. Long-period changes in the temperature and precipitation regime in St. Petersburg according to empirical data and model estimates of regional changes in the past and future. Russ. Meteorol. Hydrol. 2004, 8, 5–17. (In Russian) [Google Scholar]
  15. Gazina, E.A.; Klimenko, V.V. Climate changes in Eastern Europe over the past 250 years according to instrumental data. Vestn. Moscow. Univ. Geogr. 2008, 5, 60–65. (In Russian) [Google Scholar]
  16. Serykh, I.V.; Sonechkin, D.M. Comparison of time energy spectra of El Nino-Southern oscillation indices and global temperature and atmospheric pressure fields in the near–surface layer. Fundam. Appl. Climatol. 2017, 2, 144–155. (In Russian) [Google Scholar] [CrossRef]
  17. Gruza, G.V.; Rankova, E.Y. Fluctuations and climate changes on the territory of Russia. Phys. Atmos. Ocean 2003, 39, 166–185. (In Russian) [Google Scholar]
  18. Sidorenkov, N.S.; Sidorenkov, P.N. 580-year cycle of lunar and solar eclipses as an indicator of climate fluctuations of the same period. Geophys. Process. Biosph. 2021, 20, 5–15. (In Russian) [Google Scholar]
  19. IPCC. Climate Change 2007: Synthesis Report. Contribution of Working Groups I, II and III to the Fourth Assessment Report of the Intergovernmental Panel on Climate Change; Core Writing Team, Pachauri, R.K., Reisinger, A., Eds.; IPCC: Geneva, Switzerland, 2007. [Google Scholar]
  20. IPCC. Climate Change 2013: The Physical Science Basis. Contribution of Working Group I to the Fifth Assessment Report of the Intergovernmental Panel on Climate Change; Stocker, T.F., Qin, D., Plattner, G.-K., Tignor, M., Allen, S.K., Boschung, J., Nauels, A., Xia, Y., Bex, V., Midgley, P.M., Eds.; Cambridge University Press: Cambridge, UK; New York, NY, USA, 2013. [Google Scholar]
  21. Loehle, C. A minimal model for estimating climate sensitivity. Ecol. Model. 2014, 276, 80–84. [Google Scholar] [CrossRef]
  22. Lean, K.L.; Rind, O.H. How natural and anthropogenic influences after global and regional surface temperatures: 1889 to 2006. Geophys. Res. Lett. 2008, 35, 18701. [Google Scholar] [CrossRef]
  23. Mokhov, I.I. Climate change: Causes, risks, consequences, and problems of adaptation and regulation. Her. Russ. Acad. Sci. 2022, 92, 1–11. [Google Scholar] [CrossRef]
  24. Babich, V.V.; Dar’in, A.V.; Kalugin, I.A.; Smolyaninova, L.G. Climate prediction for the extratropical Northern Hemisphere for the next 500 years based on periodic natural processes. Russ. Meteorol. Hydrol. 2016, 41, 593–600. (In Russian) [Google Scholar] [CrossRef]
  25. Perevedentsev, Y.P.; Vereshchagin, M.A.; Naumov, E.P.; Shantalinsky, K.M. Long-term variations in main characteristics of the hydrometeorological regime of the Volga River basin. Russ. Meteorol. Hydrol. 2001, 10, 9–15. (In Russian) [Google Scholar]
  26. Perevedentsev, Y.P.; Vereshchagin, M.A.; Naumov, E.P.; Shantalinskiy, K.M.; Nikolaev, A.A. Regional display of the modern climate warming in tropo- and stratospheres of the Northern Hemisphere. Izv. Akad. Nauk. Ser. Geogr. 2005, 6, 6–16. (In Russian) [Google Scholar]
  27. Perevedentsev, Y.P.; Shantalinsky, K.M.; Aukhadeev, T.R.; Ismagilov, N.V.; Zandi, R. Effect of microcirculation systems on the thermobaric conditions of the Volga Federal District. Uchenye Zap. Kazan. Univ. Seriya Estestv. Nauk. 2014, 156, 156–169. (In Russian) [Google Scholar]
  28. Perevedentsev, Y.P.; Vereshchagin, M.A.; Shantalinsky, K.M. On long-term fluctuations in air temperature according to the meteorological Observatory of Kazan University. Russ. Meteorol. Hydrol. 1994, 7, 59–67. (In Russian) [Google Scholar]
  29. Gidrometeoizdat. Climatological Reference Book on the Climate of the USSR; Long-Term Data; Gidrometeoizdat: Leningrad, Russia, 1988; Series 3; Volume 12, 648p. (In Russian) [Google Scholar]
  30. Bendat, J.S.; Piersol, A.G. (Eds.) Measurement and Analysis of Random Data; Wiley: New York, NY, USA, 1966. [Google Scholar]
  31. Alemu, Z.A.; Dioha, M.O. Climate change and trend analysis of temperatures: The case of Addis Ababa, Ethiopia. Environ. Syst. Res. 2020, 9, 1–15. [Google Scholar] [CrossRef]
  32. Zveryaev, I.I. Climatology and long-period variability of the annual course of air temperature over Europe. Russ. Meteorol. Hydrol. 2007, 7, 18–24. (In Russian) [Google Scholar]
Figure 1. Location of the Kazan University meteorological station in European Russia. 1—the town of Arsk; 2—the village of N. Vyazovye.
Quaternary 06 00048 g001
Figure 2. Characteristics of changes in near-surface air temperature (T) in Kazan per annum (A), in summer (B), and winter (C); 1—initial series, 2—LFC with a period of more than 35 years, 3—linear trend.
Quaternary 06 00048 g002
Figure 3. Long-term change in the intra-annual amplitude (Amp) of the monthly average air temperature in Kazan in the 1828–2021 period (see Figure 2).
Quaternary 06 00048 g003
Figure 4. Anomalies (relative to the reference period (1961–1990)) of near-surface air temperature in Kazan (University) per annum (A), in summer (B), and winter (C); 1—initial series, 2—LFC with a period of more than 35 years, 3—linear trend.
Quaternary 06 00048 g004
Figure 5. Anomalies (relative to the reference period (1961–1990)) of the near-surface air temperature of the Northern Hemisphere per annum (A), in summer (B), and winter (C); 1—initial series, 2—LFC with a period of more than 35 years, 3—linear trend.
Quaternary 06 00048 g005
Figure 6. The LFC first differences with a period of more than 25 years of near-surface air temperatures in the city of Kazan (left) and in the Northern Hemisphere (right) (in °C/10 years).
Quaternary 06 00048 g006
Table 1. Characteristics of changes in near-surface air temperature in Kazan for the 1828–2021 period.
MonthTav, °CSD, °CLTSC, °C/10 YearsR2L, %R2F, %
I−12.63.90.2661421
II−11.63.60.178714
III−5.52.90.2462227
IV4.32.70.2151922
V13.12.50.1621221
VI17.92.10.1221017
VII20.11.90.088615
VIII17.82.00.100719
IX11.62.00.1241117
X4.22.20.121815
XI−3.22.90.116415
XII−9.93.90.2831620
Year3.91.30.1695158
Winter (XII–II)−11.32.80.2372227
Summer (VI–VIII)18.61.40.1041525
Tav—near-surface average air temperature; SD—standard deviation; LTSC—linear trend slope coefficient; R2L—the contribution of the linear trend to the dispersion of air temperature; R2F—the contribution of the low-frequency component to the dispersion of air temperature.
Table 2. 30-year air temperature averages (°C) at the Kazan University meteorological station during the 1841–2020 period.
MonthPeriod
1841–18701871–19001901–19301931–19601961–19901991–2020
I−13.7−14.3−12.3−12.4−12.3−9.5
II−12.0−12.5−12.0−12.2−10.6−9.2
III−7.1−6.6−5.9−5.8−4.2−2.7
IV2.92.94.34.55.46.4
V12.112.912.712.813.814.6
VI17.517.018.018.517.918.9
VII20.219.819.720.220.221.2
VIII17.617.417.518.217.818.9
IX11.310.811.312.211.812.9
X3.83.93.54.24.55.8
XI−3.6−4.2−3.4−3.0−2.7−1.9
XII−11.4−10.7−10.3−9.6−8.3−7.5
Year3.13.13.64.04.45.7
Winter (XII–II)−12.3−12.6−11.5−11.5−10.4−8.7
Summer (VI–VIII)18.418.118.418.918.619.7
Table 3. Characteristics of changes in near-surface air temperatures at the Kazan University meteorological station in the 1828–1945 and 1946–2021 periods.
VariablePeriodYearWinterSummer
Tav, °C1828–19453.2−12.318.3
1946–20214.9−9.819.2
SD, °C1828–19451.02.41.3
1946–20211.22.81.5
LTSC, °C/10 years1828–19450.110.130.09
1946–20210.340.460.25
R2L, %1828–19451635
1946–2021421213
Tav—average near-surface air temperature; SD—standard deviation; LTSC—linear trend slope coefficient; R2L—the contribution of the linear trend to the dispersion of air temperature.
Table 4. Characteristics of large normalized near-surface air temperature anomalies averaged over the Volga Federal District (European Russia) for the 1955–2021 period.
PeriodIndexMonth
IIIIIIIVVVIVIIVIIIIXXXIXII
1955–1998n+545799346535
n+ (%)11.49.111.415.920.520.56.89.113.611.46.811.4
Sum+6.25.86.411.211.513.54.86.68.58.14.05.7
Av+1.21.51.31.61.31.51.61.61.41.61.31.2
n–87129671057787
n− (%)18.215.927.320.513.615.922.711.415.915.918.215.9
Sum−−13.6−11.3−17.2−13.4−9.0−10.2−15.3−6.6−13.3−11.8−13.5−12.0
Av−−1.7−1.6−1.4−1.5−1.5−1.5−1.5−1.3−1.9−1.7−1.7−1.7
1999–2018n+466556663565
n+ (%)203030252530303015253025
Sum+5.99.68.17.27.17.68.810.94.66.59.36.7
Av+1.51.61.41.41.41.31.51.81.51.31.51.3
n−222041310111
n− (%)10101002051550555
Sum−−2.9−2.7−2.60.0−6.6−2.0−3.6−1.50.0−1.2−1.8−2.5
Av−−1.5−1.4−1.30.0−1.7−2.0−1.2−1.50.0−1.2−1.8−2.5
n+ is the number of large positive anomalies; n+(%) is the number of years (%), in which ∆t > σ; Sum+ is the sum of large positive anomalies; Av+ is the average large positive anomaly. The minus sign (−) denotes the characteristics of large negative anomalies.
Table 5. Linear correlation coefficients between the EAWR index and air temperatures in Kazan (Middle Volga region, European Russia), calculated for 30-year periods with a 10-year shift.
MonthPeriod
1950–19791960–19891970–19991980–20091990–2019
I−0.49−0.24−0.16−0.10−0.07
II−0.10−0.04−0.25−0.20−0.30
III−0.28−0.180.110.02−0.21
IV−0.62−0.63−0.62−0.62−0.50
V−0.51−0.51−0.77−0.69−0.74
VI−0.42−0.62−0.56−0.65−0.57
VII−0.60−0.61−0.63−0.72−0.80
VIII−0.57−0.52−0.55−0.60−0.53
IX−0.84−0.73−0.86−0.69−0.71
X−0.54−0.43−0.48−0.42−0.54
XI−0.26−0.32−0.31−0.38−0.46
XII−0.22−0.34−0.39−0.48−0.19
Year−0.12−0.24−0.08−0.31−0.36
NB: The months with the highest absolute values for the coefficient of correlation are shown in bold.
Table 6. Coefficients of correlation (r) and determination (R2) between changes in near-surface air temperatures in Kazan and the Northern Hemisphere for the 1850–2021 period.
CoefficientMonth and Season
IIIIIIIVVVIVIIVIIIIXXXIXIIYearWinterSummer
r0.680.580.680.520.480.400.400.470.480.530.500.580.790.660.52
R20.460.340.460.270.230.160.160.220.230.290.250.330.630.430.27
Table 7. Coefficients of correlation (r) and determination (R2) between changes in air temperature in Kazan and near-surface air temperature in the Northern Hemisphere for the 1950–2021 period.
CoefficientMonth and Season
IIIIIIIVVVIVIIVIIIIXXXIXIIYearWinterSummer
r0.610.540.630.310.370.380.500.490.330.450.420.420.740.610.57
R20.370.290.390.090.130.140.250.240.110.200.170.180.540.370.32
Table 8. Correlation coefficients (r) between air temperatures in the city of Kazan and atmospheric circulation indices for the 1950–2021 period.
IndexMonth and Season
IIIIIIIVVVIVIIVIIIIXXXIXIIYearWinterSummer
NAO0.360.400.51−0.13−0.26−0.20−0.10−0.140.10−0.08−0.100.500.110.60−0.22
AO0.440.380.46−0.05−0.04−0.040.230.010.060.110.230.460.350.560.03
EAWR−0.24−0.15−0.26−0.58−0.70−0.57−0.68−0.63−0.78−0.51−0.26−0.24−0.49−0.02−0.71
SCAND−0.51−0.57−0.25−0.25−0.220.020.10−0.11−0.10−0.31−0.12−0.26−0.44−0.49−0.09
NB: The months with the highest absolute value the coefficient of correlation are shown in bold. Coefficients with r ≥ |0.24| are significant with a probability of 95%.
Disclaimer/Publisher’s Note: The statements, opinions and data contained in all publications are solely those of the individual author(s) and contributor(s) and not of MDPI and/or the editor(s). MDPI and/or the editor(s) disclaim responsibility for any injury to people or property resulting from any ideas, methods, instructions or products referred to in the content.

