
A 1900 Year Sediment Record Suggests Recent Establishment of Black Mangrove (Avicennia Germinans) Stands within a Salt Marsh in St. Augustine, Florida, USA

Abstract
:1. Introduction
2. Materials and Methods
3. Results
4. Discussion
5. Conclusions
Supplementary Materials
Author Contributions
Funding
Acknowledgments
Conflicts of Interest
References
- IPCC. Climate Change 2021: The Physical Science Basis. Contribution of Working Group I to the Sixth Assessment Report of the Intergovernmental Panel on Climate Change; Masson-Delmotte, V., Zhai, P., Pirani, A., Connors, S.L., Péan, C., Berger, S., Caud, N., Chen, Y., Goldfarb, L., Gomis, M.I., et al., Eds.; Cambridge University Press: Cambridge, UK, 2021; Available online: https://www.ipcc.ch/report/ar6/wg1/downloads/report/IPCC_AR6_WGI_SPM.pdf (accessed on 20 September 2021).
- Mitsch, W.J.; Bernal, B.; Hernandez, M.E. Ecosystem Services of Wetlands. Int. J. Biodivers. Sci. Ecosyst. Serv. Manag. 2015, 11, 1–4. [Google Scholar] [CrossRef] [Green Version]
- Stuart, S.A.; Choat, B.; Martin, K.C.; Holbrook, N.M.; Ball, M.C. The Role of Freezing in Setting the Latitudinal Limits of Mangrove Forests. New Phytol. 2007, 173, 576–583. [Google Scholar] [CrossRef] [Green Version]
- Pickens, C.N.; Hester, M.W. Temperature Tolerance of Early Life History Stages of Black Mangrove Avicennia germinans: Implications for Range Expansion. Estuaries Coasts 2011, 34, 824–830. [Google Scholar] [CrossRef]
- Doyle, T.W.; Smith, T.J.; Robblee, M.B. Wind Damage Effects of Hurricane Andrew on Mangrove Communities along the Southwest Coast of Florida, USA. J. Coast. Res. 1995, 21, 159–168. Available online: https://pubs.er.usgs.gov/publication/1008428 (accessed on 20 September 2021).
- Kennedy, J.P.; Dangremond, E.M.; Hayes, M.A.; Preziosi, R.F.; Rowntree, J.K.; Feller, I.C. Hurricanes Overcome Migration Lag and Shape Intraspecific Genetic Variation Beyond a Poleward Mangrove Range Limit. Mol. Ecol. 2020, 29, 2583–2597. [Google Scholar] [CrossRef] [PubMed]
- Langston, A.; Kaplan, D.; Angelini, C. Predation Restricts Black Mangrove (Avicennia germinans) Colonization at its Northern Range Limit along Florida’s Gulf Coast. Hydrobiologia 2017, 803, 317–331. [Google Scholar] [CrossRef]
- Leong, R.C.; Friess, D.A.; Crase, B.; Lee, W.K.; Webb, E.L. High-Resolution Pattern of Mangrove Species Distribution is Controlled by Surface Elevation. Estuar. Coast. Shelf Sci. 2018, 202, 185–192. [Google Scholar] [CrossRef]
- Riascos, J.M.; Cantera, J.R.; Blanco-Liberos, J.F. Growth and Mortality of Mangrove Seedlings in the Wettest Neotropical Mangrove Forests during ENSO: Implications for Vulnerability to Climate Change. Aquat. Bot. 2018, 147, 34–42. [Google Scholar] [CrossRef]
- Cavanaugh, K.C.; Kellner, J.R.; Forde, A.J.; Gruner, D.S.; Parker, J.D.; Rodriguez, W.; Feller, I.C. Poleward Expansion of Mangroves is a Threshold Response to Decreased Frequency of Extreme Cold Events. Proc. Natl. Acad. Sci. USA 2018, 111, 723–727. [Google Scholar] [CrossRef] [Green Version]
- Osland, M.J.; Day, R.H.; Hall, C.T.; Feher, L.C.; Armitage, A.R.; Cebrian, J.; Dutton, K.H.; Hughes, A.R.; Kaplan, D.A.; Langston, A.K. Temperature Thresholds for Black Mangrove (Avicennia germinans) Freeze Damage, Mortality and Recovery in North America: Refining Tipping Points for Range Expansion in a Warming Climate. J. Ecol. 2020, 108, 654–665. [Google Scholar] [CrossRef]
- Giri, C.; Long, J. Is the Geographic Range of Mangrove Forests in the Conterminous United States Really Expanding? Sensors 2016, 16, 2010. [Google Scholar] [CrossRef] [PubMed] [Green Version]
- Saintilan, N.; Wilson, N.; Rogers, K.; Rajkaran, A.; Krauss, K.W. Mangrove Expansion and Salt Marsh Decline at Mangrove Poleward Limits. Glob. Chang. Biol. 2014, 20, 147–157. [Google Scholar] [CrossRef] [PubMed] [Green Version]
- Stevens, P.; Fox, S.; Montague, C. The Interplay between Mangroves and Saltmarshes at the Transition between Temperate and Subtropical Climate in Florida. Wetl. Ecol. Manag. 2006, 14, 435–444. [Google Scholar] [CrossRef]
- Rodriguez, W.; Feller, I.C.; Cavanaugh, K.C. Spatio-Temporal Changes of a Mangrove-Saltmarsh Ecotone in the Northeastern Coast of Florida, USA. Glob. Ecol. Conserv. 2016, 7, 245–261. [Google Scholar] [CrossRef]
- Cavanaugh, K.C.; Dangremond, E.M.; Doughty, C.L.; Williams, A.P.; Parker, J.D.; Hayes, M.A.; Rodriguez, W.; Feller, I.C. Climate-Driven Regime Shifts in a Mangrove-Salt Marsh Ecotone Over the Past 250 Years. Proc. Natl. Acad. Sci. USA 2019, 116, 21602–21608. [Google Scholar] [CrossRef] [PubMed] [Green Version]
- Rodriquez, E.; Cohen, M.C.L.; Liu, K.; Pessenda, L.C.R.; Yao, Q.; Ryu, J.; Rossetti, D.; de Souza, A.; Dietz, M. The Effect of Global Warming on the Establishment of Mangroves in Coastal Louisiana during the Holocene. Geomorphology 2021, 381, 107648. [Google Scholar] [CrossRef]
- Yao, Q.; Liu, K. Dynamics of Marsh-Mangrove Ecotone Since the mid-Holocene: A Palynological Study of Mangrove Enroachment and Sea Level Rise in the Shark River Estuary, Florida. PLoS ONE 2017, 12, e0173670. [Google Scholar] [CrossRef]
- United States Fish and Wildlife Service. South Florida Multi-Species Recovery Plan; U.S. Fish and Wildlife Service: Atlanta, GA, USA, 1999. Available online: https://www.nrc.gov/docs/ML1219/ML12193A340.pdf (accessed on 20 September 2021).
- Smee, D.L.; Sanchez, J.A.; Diskin, M.A.; Trettin, C. Mangrove Expansion into Salt Marshes Alters Associated Faunal Communities. Estuar. Coast. Shelf Sci. 2017, 187, 306–313. [Google Scholar] [CrossRef]
- Kelleway, J.J.; Cavanaugh, K.; Rogers, K.; Feller, I.C.; Ens, E.; Doughty, C.; Saintilan, N. Review of the Ecosystem Service Implications of Mangrove Encroachment into Salt Marshes. Glob. Chang. Biol. 2017, 23, 3967–3983. [Google Scholar] [CrossRef]
- Vaughn, D.R.; Bianchi, T.S.; Shields, M.R.; Kenney, W.F.; Osborne, T.Z. Increased Organic Carbon Burial in Northern Florida Mangrove-Salt Marsh Transitional Zones. Glob. Biogeochem. Cycles 2020, 34, e2019GB006334. [Google Scholar] [CrossRef]
- Cahoon, D.R.; McKee, K.L.; Morris, J.T. How Plants Influence Resilience of Salt Marsh and Mangrove Wetlands to Sea-Level Rise. Estuaries Coast 2021, 44, 883–898. [Google Scholar] [CrossRef]
- Chmura, G.L.; Aharon, P. Stable Carbon Isotope Signatures of Sedimentary Carbon in Coastal Wetlands as Indicators of Salinity Regime. J. Coast. Res. 1995, 11, 124–135. [Google Scholar]
- Wilson, K.R.; Kelley, J.T.; Tanner, B.R.; Belknap, D.F. Examining North-Temperate Salt-Marsh Geologic Records: Determining Origin of and Defining a Unique Stratigraphic Signature for Salt Pools of Six Maine Salt Marshes, U.S.A. J. Coast. Res. 2010, 26, 1007–1026. [Google Scholar] [CrossRef]
- Khan, N.S.; Vane, C.H.; Horton, B.P. Stable Carbon Isotope and C/N Geochemistry of Coastal Wetland Sediments as a Sea-level Indicator. In Handbook of Sea-Level Research, 1st ed.; Shennan, I., Long, A.J., Horton, B.P., Eds.; John Wiley & Sons: New York City, NY, USA, 2015; pp. 295–311. [Google Scholar]
- Tanner, B.R.; Douglas, M.L.; Greenberg, C.H.; Chamberlin, J.N.; Styers, D.M. A Macroscopic Charcoal and Multiproxy Record From Peat Recovered from Depression Marshes in Longleaf Pine Sandhills, Florida, USA. Quaternary 2018, 1, 25. [Google Scholar] [CrossRef] [Green Version]
- Waller, S.S.; Lewis, J.K. Occurrence of C3 and C4 Photosynthetic Pathways in North American Grasses. J. Range Manag. 1979, 32, 12–28. [Google Scholar] [CrossRef] [Green Version]
- Cerling, T.E.; Quade, J.; Wang, Y.; Bowman, J.R. Carbon Isotopes in Soil and Paleosols as Ecologic and Paleoecologic Indicators. Nature 1989, 341, 138–139. [Google Scholar] [CrossRef]
- FNAI—Florida Natural Areas Inventory. Guide to the Natural Communities of Florida: 2010 Edition; Florida Natural Areas Inventory: Tallahassee, FL, USA, 2010; 276p, Available online: https://www.fnai.org/species-communities/natcom-guide (accessed on 20 September 2021).
- Brady, N.; Weil, R. Elements of the Nature and Properties of Soils, 2nd ed.; Prentice Hall: Upper Saddle River, NJ, USA, 2003; 624p. [Google Scholar]
- Reimer, P.J. IntCal13 and Marine13 Radiocarbon Age Calibration Curves, 0–50,000 Years Cal BP. Radiocarbon 2013, 55, 1869–1887. [Google Scholar] [CrossRef] [Green Version]
- França, M.C.; Pessenda, L.C.R.; Cohen, M.C.L.; de Azevedo, A.Q.; Fontes, N.A.; Silva, F.B.; de Melo, J.C.F., Jr.; Piccolo, M.C.; Bendassolli, J.A.; Macario, K. Late-Holocene Subtropical Mangrove Dynamics in Response to Climate Change During the Last Millennium. Holocene 2019, 29, 445–456. [Google Scholar] [CrossRef]
- Harrison, A.F.; Bocock, K.L. Estimation of Soil Bulk Density from Loss-On-Ignition Values. J. Appl. Ecol. 1981, 8, 919–927. [Google Scholar] [CrossRef]
- Hatté, C.; Jull, A.J. Radiocarbon Dating: Plant Macrofossils. Encycl. Quat. Sci. 2007, 2958–2965. [Google Scholar] [CrossRef]
- Sefton, J.; Woodroffe, S.; Ascough, P. Radiocarbon Dating of Mangrove Sediments. In Dynamic Sedimentary Environments of Mangrove Coasts; Sidik, F., Friess, D.A., Eds.; Elsevier: Amsterdam, The Netherlands, 2021; pp. 199–215. [Google Scholar]
- Alongi, D.M. Carbon Cycling and Storage in Mangrove Forests. Annu. Rev. Mar. Sci. 2014, 6, 195–215. [Google Scholar] [CrossRef]
- Goñi, M.A.; Thomas, K.A. Sources and Transformations of Organic Matter in Surface Soils and Sediments from a Tidal Estuary (North Inlet, South Carolina, USA). Estuaries 2000, 23, 548–564. [Google Scholar] [CrossRef]
- Drexler, J.Z.; Davis, M.J.; Woo, I.; De La Cruz, S. Carbon Sources in the Sediments of a Restoring vs. Historically Unaltered Salt Marsh. Estuaries Coasts 2020, 43, 1345–1360. [Google Scholar] [CrossRef]
- Schuerch, M.; Dolch, T.; Bisgwa, J.; Vafeidis, A.T. Changing Sediment Dynamics of a Mature Backbarrier Salt Marsh in Response to Sea-Level Rise and Storm Events. Front. Mar. Sci. 2018, 5, 155. [Google Scholar] [CrossRef] [Green Version]
- Mcleod, E.; Chmura, G.L.; Bouillon, S.; Salm, R.; Björk, M.; Duarte, C.M.; Lovelock, C.; Schlesinger, W.H.; Silliman, B.R. A blueprint for blue carbon: Toward an improved understanding of the role of vegetated coastal habitats in sequestering CO2. Front. Ecol. Environ. 2011, 9, 552–560. [Google Scholar] [CrossRef] [Green Version]


| Mangrove Samples | Salt Marsh Samples | |||||||||||
|---|---|---|---|---|---|---|---|---|---|---|---|---|
| Water | LOI | Density | C | C/N | δ13C | Water | LOI | Density | C | C/N | δ13C | |
| (%) | (%) | (g/cm3) | (%) | (‰) | (%) | (%) | (g/cm3) | (%) | (‰) | |||
| 32.3 | 4.8 | 1.06 | 1.2 | 9.63 | −20.06 | 78.5 | 36.4 | 0.22 | 14.3 | 13.48 | −18.17 | |
| 32.3 | 6.4 | 1.06 | 1.1 | 9.53 | −21.02 | 75.9 | 35.9 | 0.26 | 19.1 | 13.37 | −16.29 | |
| 33.1 | 5.9 | 1.04 | 7.7 | 11.72 | −20.72 | 76.7 | 34.4 | 0.27 | 16.8 | 13.47 | −17.20 | |
| 51.1 | 16.5 | 0.67 | 10.1 | 12.31 | −21.13 | 76.7 | 40.0 | 0.26 | 22.5 | 13.73 | −19.37 | |
| 32.7 | 6.2 | 1.08 | 7.0 | 13.36 | −21.14 | 79.0 | 35.8 | 0.22 | 20.5 | 13.19 | −19.02 | |
| 51.7 | 27.9 | 0.79 | 4.3 | 11.16 | −20.20 | 78.4 | 36.9 | 0.23 | 25.6 | 15.85 | −14.62 | |
| 45.4 | 10.4 | 0.79 | 21.3 | 14.60 | −20.63 | 78.6 | 37.1 | 0.23 | 19.8 | 12.69 | −16.52 | |
| 51.8 | 11.3 | 0.76 | 4.3 | 13.16 | −22.06 | 77.5 | 40.3 | 0.25 | 16.3 | 13.77 | −17.72 | |
| 79.8 | 45.4 | 0.24 | 4.3 | 13.29 | −21.15 | 77.8 | 45.3 | 0.23 | 14.5 | 11.64 | −18.75 | |
| 29.5 | 3.7 | 1.07 | 4.5 | 12.94 | −21.89 | 79.2 | 39.5 | 0.26 | 17.5 | 13.77 | −18.80 | |
| 52.8 | 16.7 | 0.59 | 1.9 | 11.58 | −20.37 | 79.7 | 38.3 | 0.22 | 16.2 | 12.81 | −18.56 | |
| 55.0 | 21.6 | 0.55 | 6.3 | 14.05 | −21.19 | 79.4 | 34.1 | 0.22 | 16.7 | 12.48 | −18.41 | |
| 59.3 | 23.6 | 0.50 | 9.2 | 11.36 | −19.40 | 81.1 | 40.9 | 0.20 | 15.5 | 11.76 | −18.49 | |
| 52.5 | 15.2 | 0.63 | 4.9 | 11.29 | −20.60 | 79.3 | 41.7 | 0.22 | 17.8 | 12.77 | −17.55 | |
| 72.5 | 37.5 | 0.31 | 28.5 | 14.07 | −21.26 | 79.1 | 39.6 | 0.22 | 25.2 | 17.79 | −14.02 | |
| 55.6 | 14.9 | 0.57 | 1.9 | 12.75 | −25.95 | 67.6 | 23.4 | 0.38 | 7.3 | 11.96 | −22.16 | |
| 61.3 | 18.3 | 0.47 | 4.7 | 15.33 | −26.67 | 68.7 | 28.3 | 0.36 | 10.3 | 11.16 | −21.85 | |
| 41.5 | 6.8 | 0.83 | 1.7 | 13.68 | −26.70 | 70.3 | 27.8 | 0.32 | 2.9 | 3.40 | −21.47 | |
| 61.7 | 15.2 | 0.45 | 6.1 | 16.77 | −26.61 | 70.3 | 26.4 | 0.34 | 21.5 | 12.09 | −23.89 | |
| 73.0 | 33.3 | 0.32 | 11.3 | 15.06 | −27.04 | 76.7 | 40.7 | 0.29 | 16.2 | 12.48 | −22.42 | |
| 63.3 | 21.6 | 0.45 | 4.9 | 14.49 | −26.63 | 79.6 | 44.5 | 0.22 | 18.2 | 12.83 | −23.40 | |
| 74.2 | 37.2 | 0.28 | 16.1 | 15.14 | −27.12 | 83.2 | 51.1 | 0.17 | 20.7 | 13.58 | −24.89 | |
| 72.9 | 33.3 | 0.30 | 15.9 | 16.01 | −27.31 | 83.0 | 56.3 | 0.19 | 23.6 | 13.65 | −23.80 | |
| 72.1 | 42.9 | 0.29 | 17.6 | 15.83 | −26.93 | 84.9 | 55.2 | 0.17 | 27.9 | 13.76 | −21.19 | |
| 73.2 | 39.7 | 0.29 | 18.1 | 16.23 | −27.03 | 84.7 | 55.9 | 0.17 | 30.9 | 14.26 | −20.75 | |
| 74.8 | 37.8 | 0.27 | 18.5 | 15.28 | −27.53 | 84.6 | 59.5 | 0.17 | 31.1 | 14.68 | −19.36 | |
| 76.2 | 43.8 | 0.25 | 20.2 | 15.64 | −27.23 | 85.9 | 50.9 | 0.16 | 29.3 | 13.85 | −19.49 | |
| 76.0 | 51.4 | 0.25 | 23.1 | 17.86 | −27.13 | 84.8 | 57.5 | 0.16 | 29.8 | 14.38 | −21.92 | |
| 75.4 | 46.6 | 0.25 | 18.7 | 16.99 | −27.20 | 84.2 | 58.8 | 0.17 | 31.7 | 13.71 | −21.54 | |
| 76.3 | 41.2 | 0.24 | 20.8 | 16.34 | −27.32 | 94.3 | 53.9 | 0.16 | 26.1 | 13.74 | −20.32 | |
| 58.6 | 24.6 | 0.55 | 10.5 | 13.92 | −23.91 | Mean | 79.3 | 42.2 | 0.23 | 20.2 | 13.07 | −19.73 |
| 16.0 | 15.0 | 0.3 | 7.9 | 2.2 | 3.2 | Std. Dev. | 5.6 | 10.2 | 0.1 | 7.1 | 2.2 | 2.7 |
| <0.01 | <0.01 | <0.01 | <0.01 | 0.14 | <0.01 | p= | <0.01 | <0.01 | <0.01 | <0.01 | 0.14 | <0.01 |
| Water Content | LOI | Bulk Density | Percent Carbon | C/N | δ13C | |
|---|---|---|---|---|---|---|
| Water Content | NA | 0.85 | 0.97 | 0.55 | 0.10 | 0.01 |
| LOI | 0.85 | NA | 0.79 | 0.67 | 0.11 | 0.00 |
| Bulk Density | 0.97 | 0.79 | NA | 0.49 | 0.11 | 0.00 |
| Percent Carbon | 0.55 | 0.67 | 0.49 | NA | 0.21 | 0.03 |
| C/N | 0.10 | 0.11 | 0.11 | 0.21 | NA | 0.11 |
| δ13C | 0.01 | 0.00 | 0.00 | 0.03 | 0.11 | NA |
| Conventional Radiocarbon | Calibrated 2σ Range | Calibrated 2σ Range | |||
|---|---|---|---|---|---|
| Core/Depth | Age (yrs BP) | (cal yr BP) | Median (cal yr BP) | Dated Material | Laboratory # |
| Nease Park Core 1 | |||||
| 42.5cm | Modern | NA | NA | Bulk Sediment | ICA-18OS/0449 |
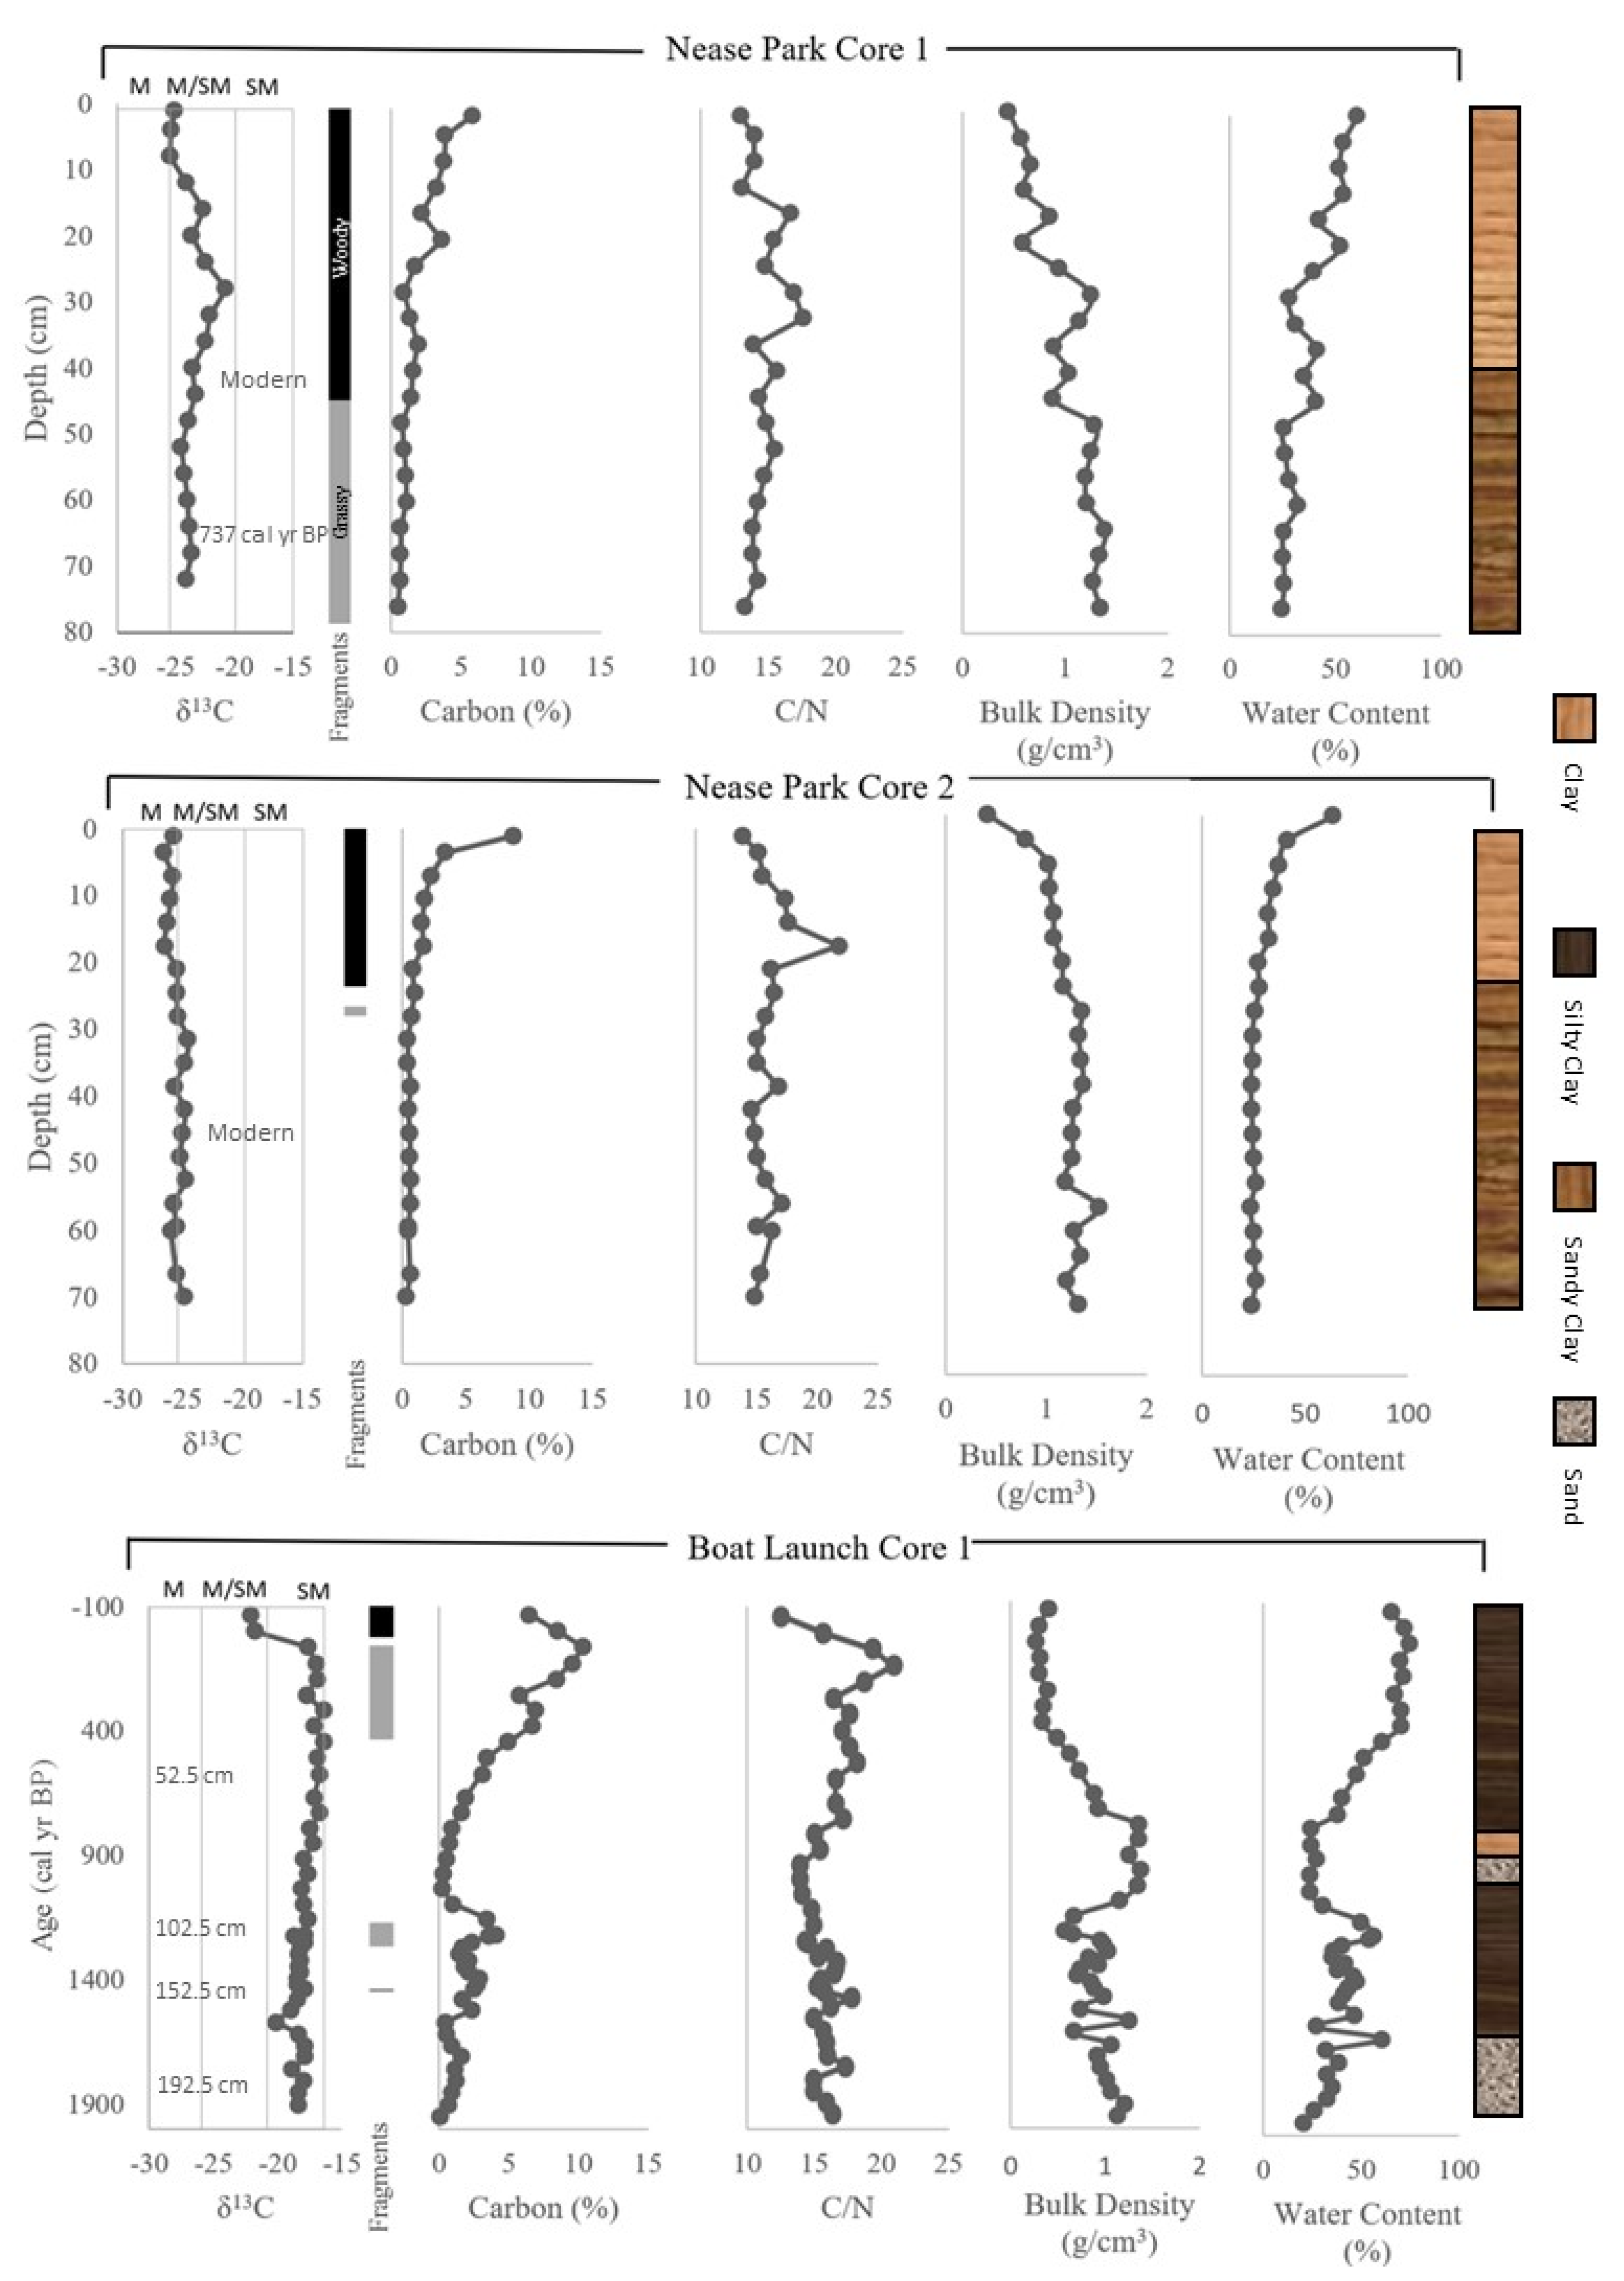
| 66.5cm | 830 ± 30 | 688 to 789 | 737 | Bulk Sediment | ICA-18OS/0451 |
| Nease Park Core 2 | |||||
| 46.5cm | Modern | NA | NA | Bulk Sediment | ICA-18OS/0448 |
| Boat Launch Core | |||||
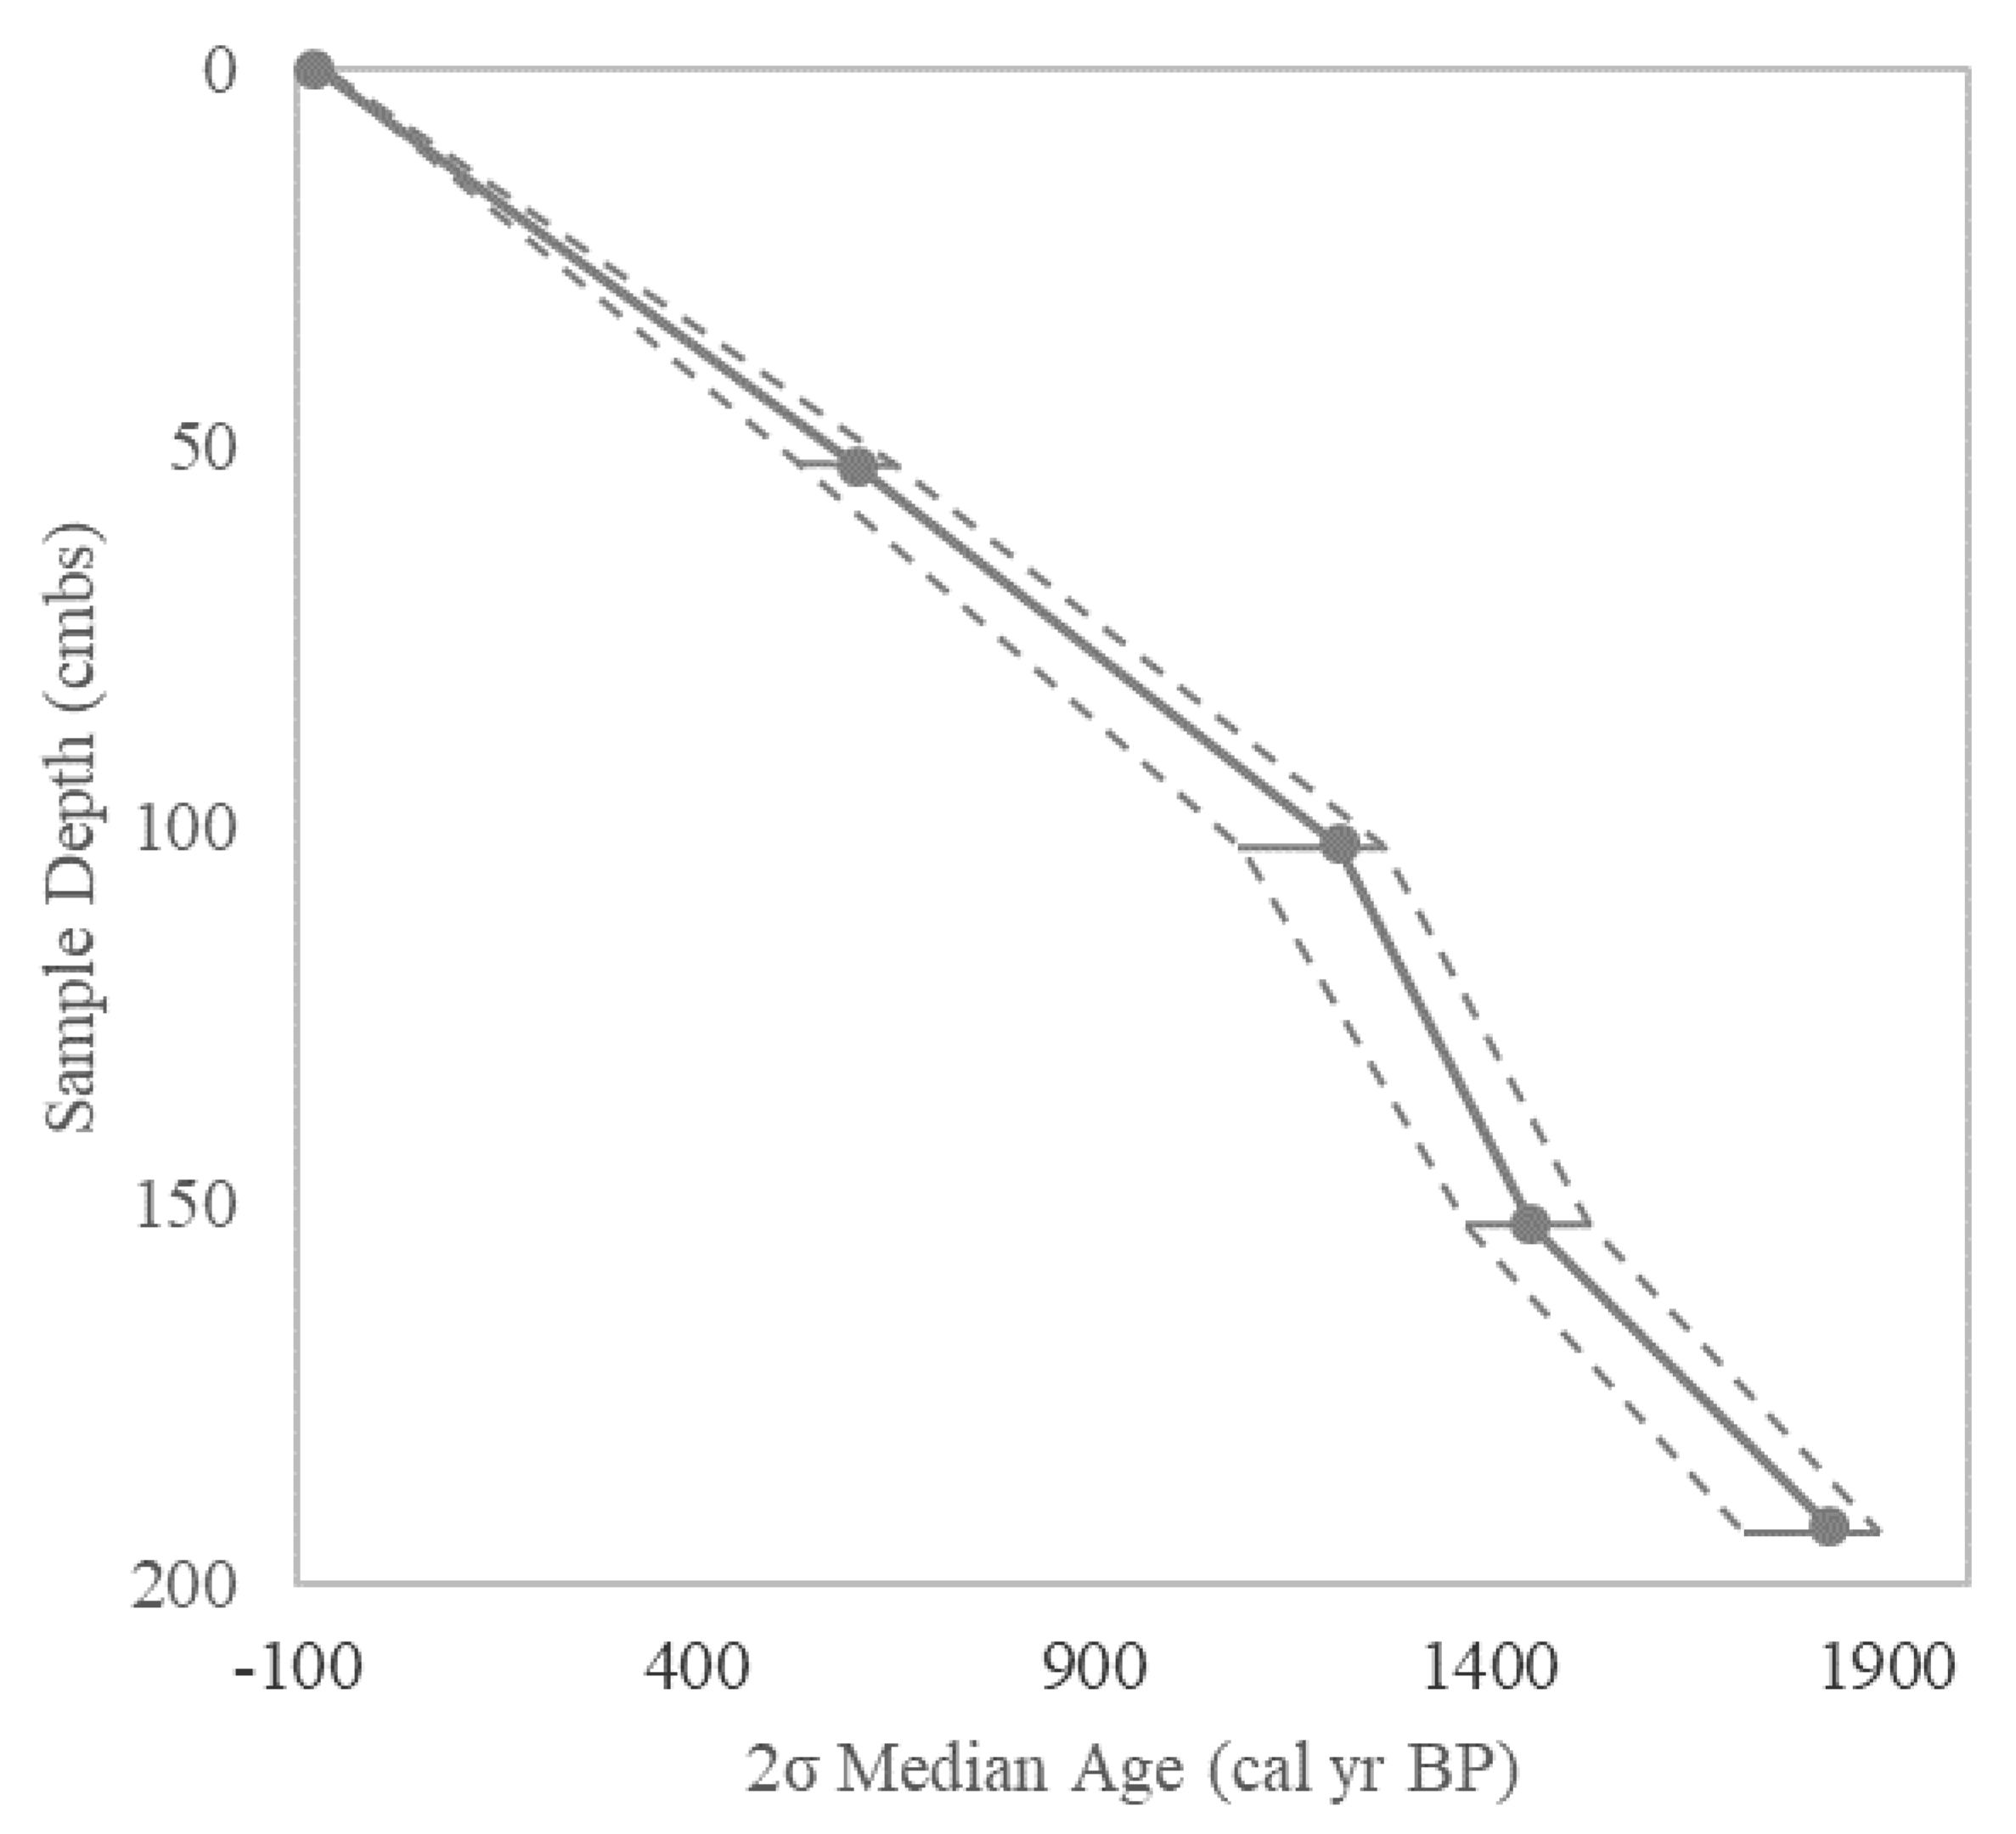
| 52.5cm | 580 ± 30 | 533 to 569 | 604 | Bulk Sediment | ICA-18OS/0447 |
| 582 to 649 | |||||
| 102.5cm | 1240 ± 20 | 1082 to 1160 | 1211 | Bulk Sediment | ICA-18OS/0446 |
| 1172 to 1194 | |||||
| 1196 to 1263 | |||||
| 152.5 cm | 1540 ± 30 | 1365 to 1524 | 1451 | Bulk Sediment | ICA-18OS/0450 |
| 192.5 cm | 1880 ± 30 | 1729 to 1884 | 1828 | Bulk Sediment | ICA-18OS/0452 |
| Depth Interval (cm) | Environmental Interpretation | Carbon Sequestration Rate (g C m−2 yr−1) | Carbon (%) | Sedimentation Rate (mm/yr) | Bulk Density (g/cm3) |
|---|---|---|---|---|---|
| 0 to 10 | Mangrove | 20.01 | 7.49 | 0.77 | 0.35 |
| 10 to 52.5 | Salt Marsh | 20.99 | 6.54 | 0.77 | 0.42 |
| 52.5 to 102.5 | Salt Marsh | 12.92 | 1.45 | 0.82 | 1.09 |
| 102.5 to 152.5 | Salt Marsh | 38.78 | 2.26 | 1.99 | 0.86 |
| 152 to 192.5 | Salt Marsh | 13.43 | 1.22 | 1.06 | 1.04 |
Publisher’s Note: MDPI stays neutral with regard to jurisdictional claims in published maps and institutional affiliations. |
© 2022 by the authors. Licensee MDPI, Basel, Switzerland. This article is an open access article distributed under the terms and conditions of the Creative Commons Attribution (CC BY) license (https://creativecommons.org/licenses/by/4.0/).
Share and Cite
Chamberlin, J.; Soehnlein, C.; Evans, J.; Tanner, B. A 1900 Year Sediment Record Suggests Recent Establishment of Black Mangrove (Avicennia Germinans) Stands within a Salt Marsh in St. Augustine, Florida, USA. Quaternary 2022, 5, 2. https://doi.org/10.3390/quat5010002
Chamberlin J, Soehnlein C, Evans J, Tanner B. A 1900 Year Sediment Record Suggests Recent Establishment of Black Mangrove (Avicennia Germinans) Stands within a Salt Marsh in St. Augustine, Florida, USA. Quaternary. 2022; 5(1):2. https://doi.org/10.3390/quat5010002
Chicago/Turabian StyleChamberlin, Jessica, Camryn Soehnlein, Jason Evans, and Benjamin Tanner. 2022. "A 1900 Year Sediment Record Suggests Recent Establishment of Black Mangrove (Avicennia Germinans) Stands within a Salt Marsh in St. Augustine, Florida, USA" Quaternary 5, no. 1: 2. https://doi.org/10.3390/quat5010002
APA StyleChamberlin, J., Soehnlein, C., Evans, J., & Tanner, B. (2022). A 1900 Year Sediment Record Suggests Recent Establishment of Black Mangrove (Avicennia Germinans) Stands within a Salt Marsh in St. Augustine, Florida, USA. Quaternary, 5(1), 2. https://doi.org/10.3390/quat5010002