1. Introduction
The Federal Institute of Geosciences and Natural Resources of Germany (BGR) and the Sahara and Sahel Observatory (OSS) are implementing a regional project for improved groundwater management in the Maghreb region within the framework of international technical cooperation. One of the key challenges in the Maghreb is the groundwater abstraction used for irrigation in agriculture. Since this groundwater abstraction is usually uncontrolled, the quantification of the volume as well as its spatial distribution are crucial for decision makers.
The volume of the abstracted groundwater is hard to measure directly over large areas. Therefore, an indirect approach is applied in two steps. Firstly, the agricultural areas are classified using optical and multi-spectral satellite data. Secondly, the groundwater abstraction for irrigation is quantified by referring to local farmers’ irrigation practices.
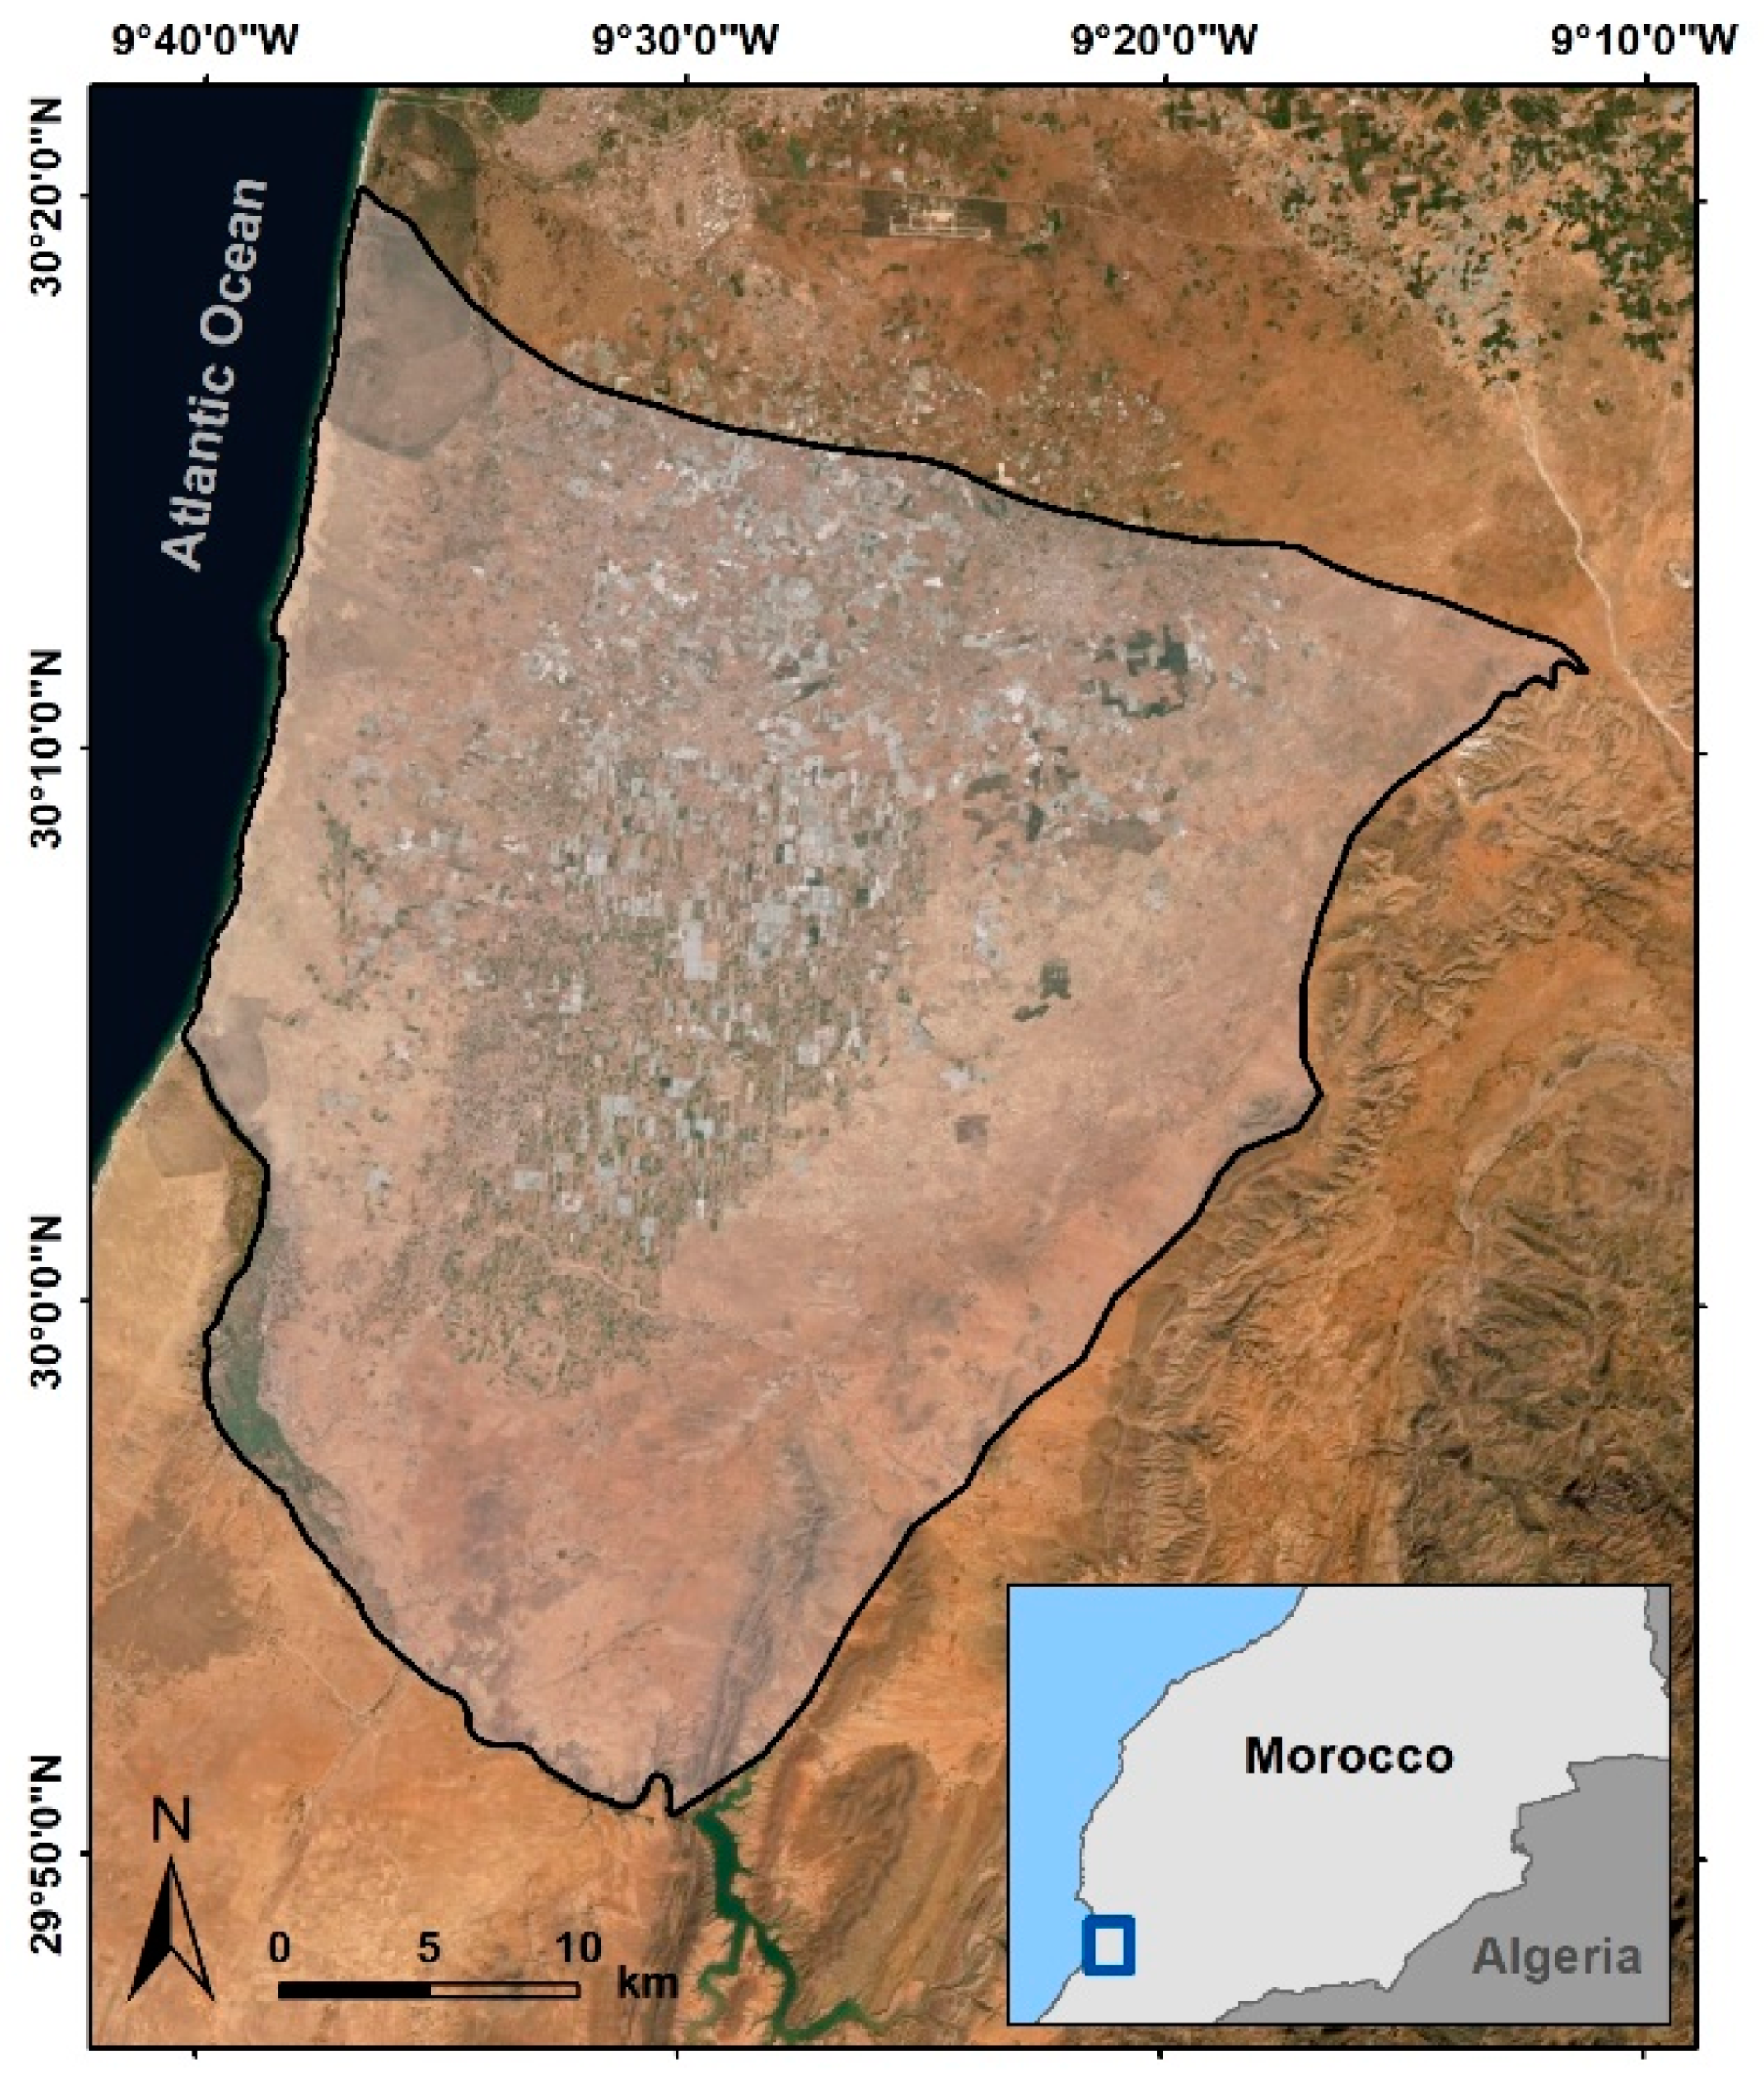
The Chtouka aquifer is located in the Souss-Massa watershed south of the city of Agadir in the south of Morocco. It covers an area of 1373 km
2. The aquifer is delimited by the Wadi Souss in the north, by the Wadi Massa in the south and is located next to the Atlantic Ocean to the west. The foothills of the Anti-Atlas represent the natural boundary to the east (
Figure 1).
The area is characterised by intensive agricultural use, especially by the cultivation of crops in greenhouses. The high irrigation demand is mainly covered by groundwater as well as by surface water from a dam in the south whose water is distributed by an open channel system. Due to its immediate location to the Atlantic Ocean, the groundwater body is at risk from saltwater intrusion, which is worsened by groundwater abstraction.
2. Materials and Methods
Following the presence of crops and their growth cycles, there are two major agricultural periods, winter/spring and summer [
1]. Thus, the agricultural areas have to be identified twice a year in order to differentiate these periods and to estimate the groundwater abstraction. In this study, the case for the summer period 2019 is presented due to the available data.
The agricultural areas were identified using a supervised classification approach of a specific date based on Sentinel 2 data. A suitable date for the summer period is around mid-July so that all relevant crops are well represented. In this case, 26 July 2019 was defined for the summer period 2019. All bands of the Sentinel 2 level 2A data tile 29RMP at 10 m spatial resolution were used for layer stacking. The merged layer stack was then clipped to the study area.
The crops in the study area were structured into tree crops and annual crops. The water needs of these two crops are different over the year. Therefore, the two crops have to be considered differently. Tree crops (mostly olive trees) are evergreen, grow all year round and need to be irrigated all year round. However, the growing period of annual crops is either in winter/spring or in summer. In summer, mainly tomato, melon, cereals and pepper are cultivated. These crop types are merged and are considered as a class. In addition, a large number of greenhouses cover the study area. According to this classification, three main crop classes are defined for the estimation of groundwater abstraction: tree crops (olive trees), annual crops and greenhouses.
The Royal Centre for Remote Sensing in Morocco (CRTS) developed a digital land use map for the summer period of 2019 by visual photo interpretation that covers the Chtouka aquifer. It was created at a scale of 1:10,000 using Spot 6/7 satellite data from July 2019 and includes several classes such as urban areas, forest areas, greenhouses, annual crops and olive trees [
2].
Before the classification was processed, the map by CRTS was used in order to mask all permanent non-agricultural areas, because they were not relevant to the water demand. Olive trees were also masked and later used for the estimation of the groundwater abstraction. The result was a satellite image that was used as input for the classification. This included potential agricultural areas of greenhouses and annual crops but also bare soil that represented non-cultivated areas. Accordingly, three classes were defined for the classification: greenhouses, annual crops and bare soil.
Since no ground truth data were available, the training pixels were determined manually. The corresponding Sentinel 2 satellite image, the historical satellite images by the Google Earth software and the Normalised Difference Vegetation Index (NDVI) were used in order to define the training areas visually. The Maximum Likelihood algorithm was applied for the supervised classification. The result was a land use map for the masked study area with the three classes: greenhouse, annual crops and bare soil. The classification result was validated with the CRTS reference map for 2019 by comparing the total areas as well as the variances of the two relevant classes, greenhouse and annual crops, and by using random points.
The processing steps were performed with QGIS. QGIS is an open source geographic information system (GIS) that contains the necessary functions.
3. Results
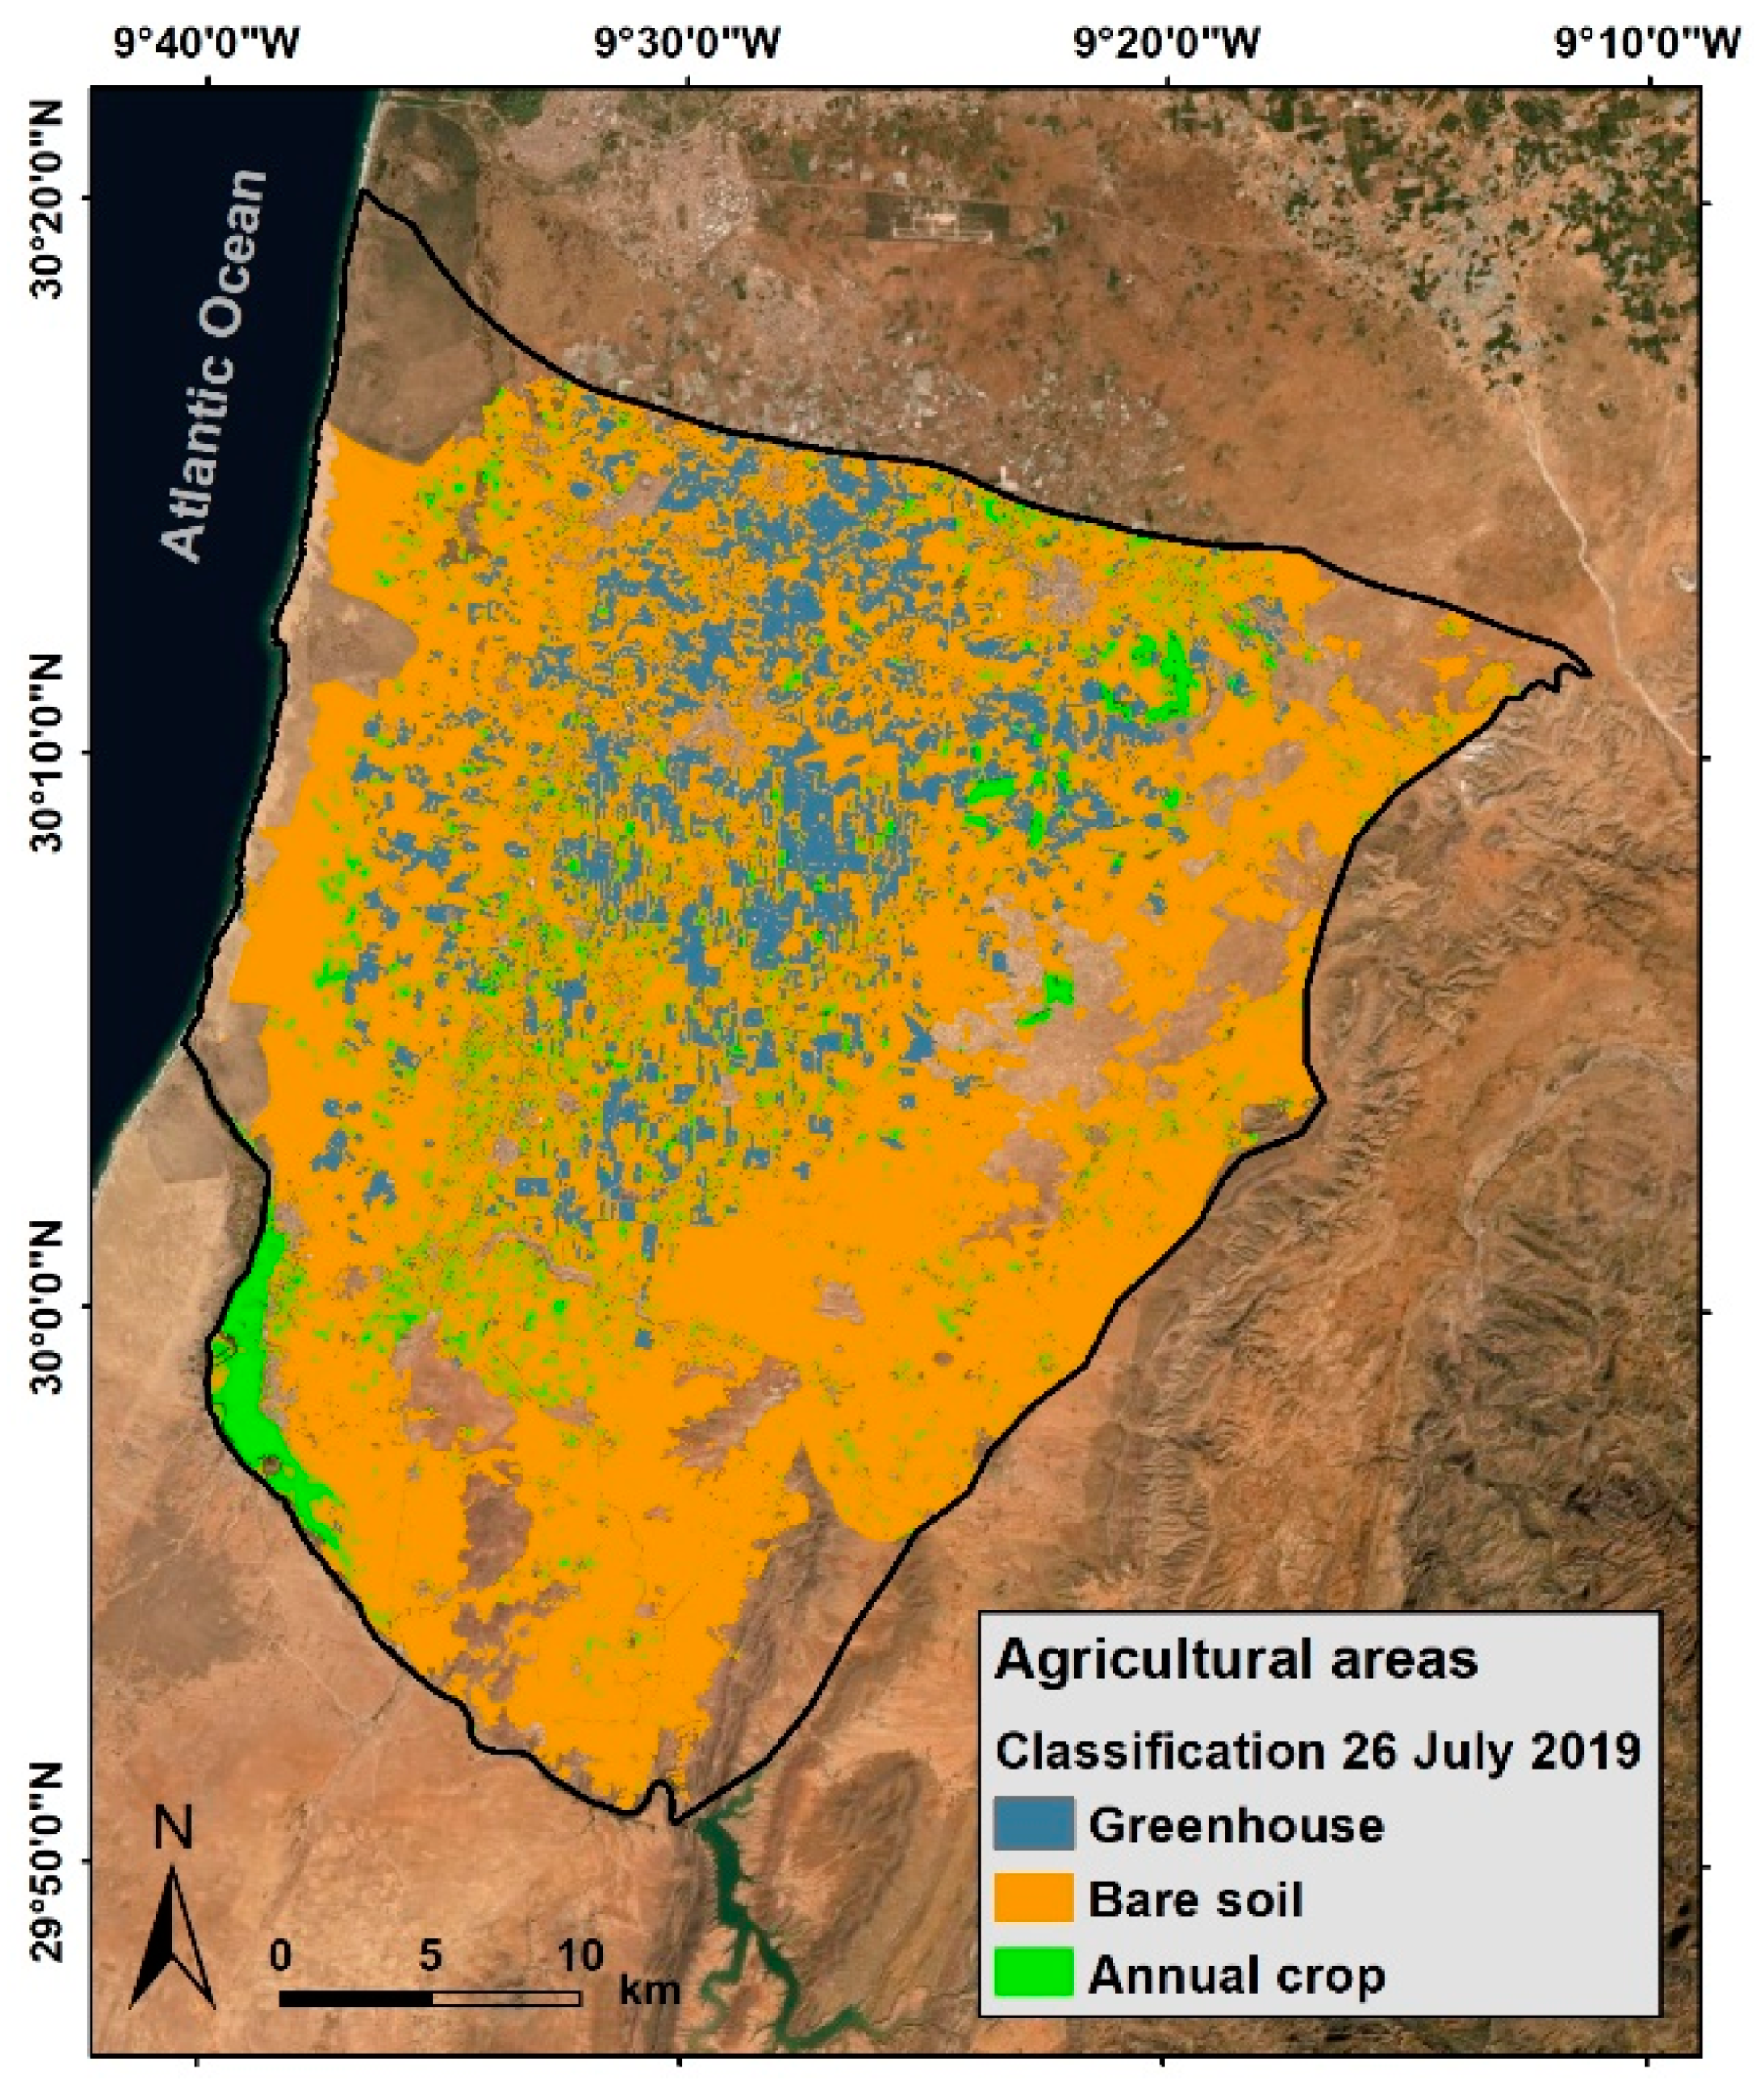
Figure 2 gives a spatial overview of the results of the classification for the summer period 2019 based on the Sentinel 2 data from 26 July 2019. The total area of greenhouses was 15,870 ha and of annual crops was 7433 ha.
In order to validate the results, the areas of the classification were compared with the total areas of the land use map 2019 by CRTS (
Table 1).
With a difference of 1.6% for the greenhouses and 2.2% for the bare soil, the areas were almost identical, whereas the total area of the annual crops differed more strongly by 17.5%.
In addition, the results were validated using random points where the land use map by CRTS was used as reference. In total, 765 random points with a minimum distance of 100 m were generated in the study area. A total of 122 were assigned to greenhouses, 63 to annual crops and 580 to bare soil. The distribution of the points roughly corresponded to the percentage of the total areas.
Table 2 shows the confusion matrix. The overall accuracy (OA) is 88.4%, but within the classes, differences can be observed. In total, 94.7% of the pixels of the bare soil and 78.7% of the greenhouses, whereas 49.2% of the pixels of the annual crops, are correctly classified.
In order to estimate the groundwater abstraction of the different crop classes, a field study from 2015 was used [
3]. This includes, amongst others, the pump rates, the pumping time, the crop types, and the irrigated area of the farmers’ land plots in the study area for the summer period. Based on this information the average amount of irrigation for each crop type was calculated.
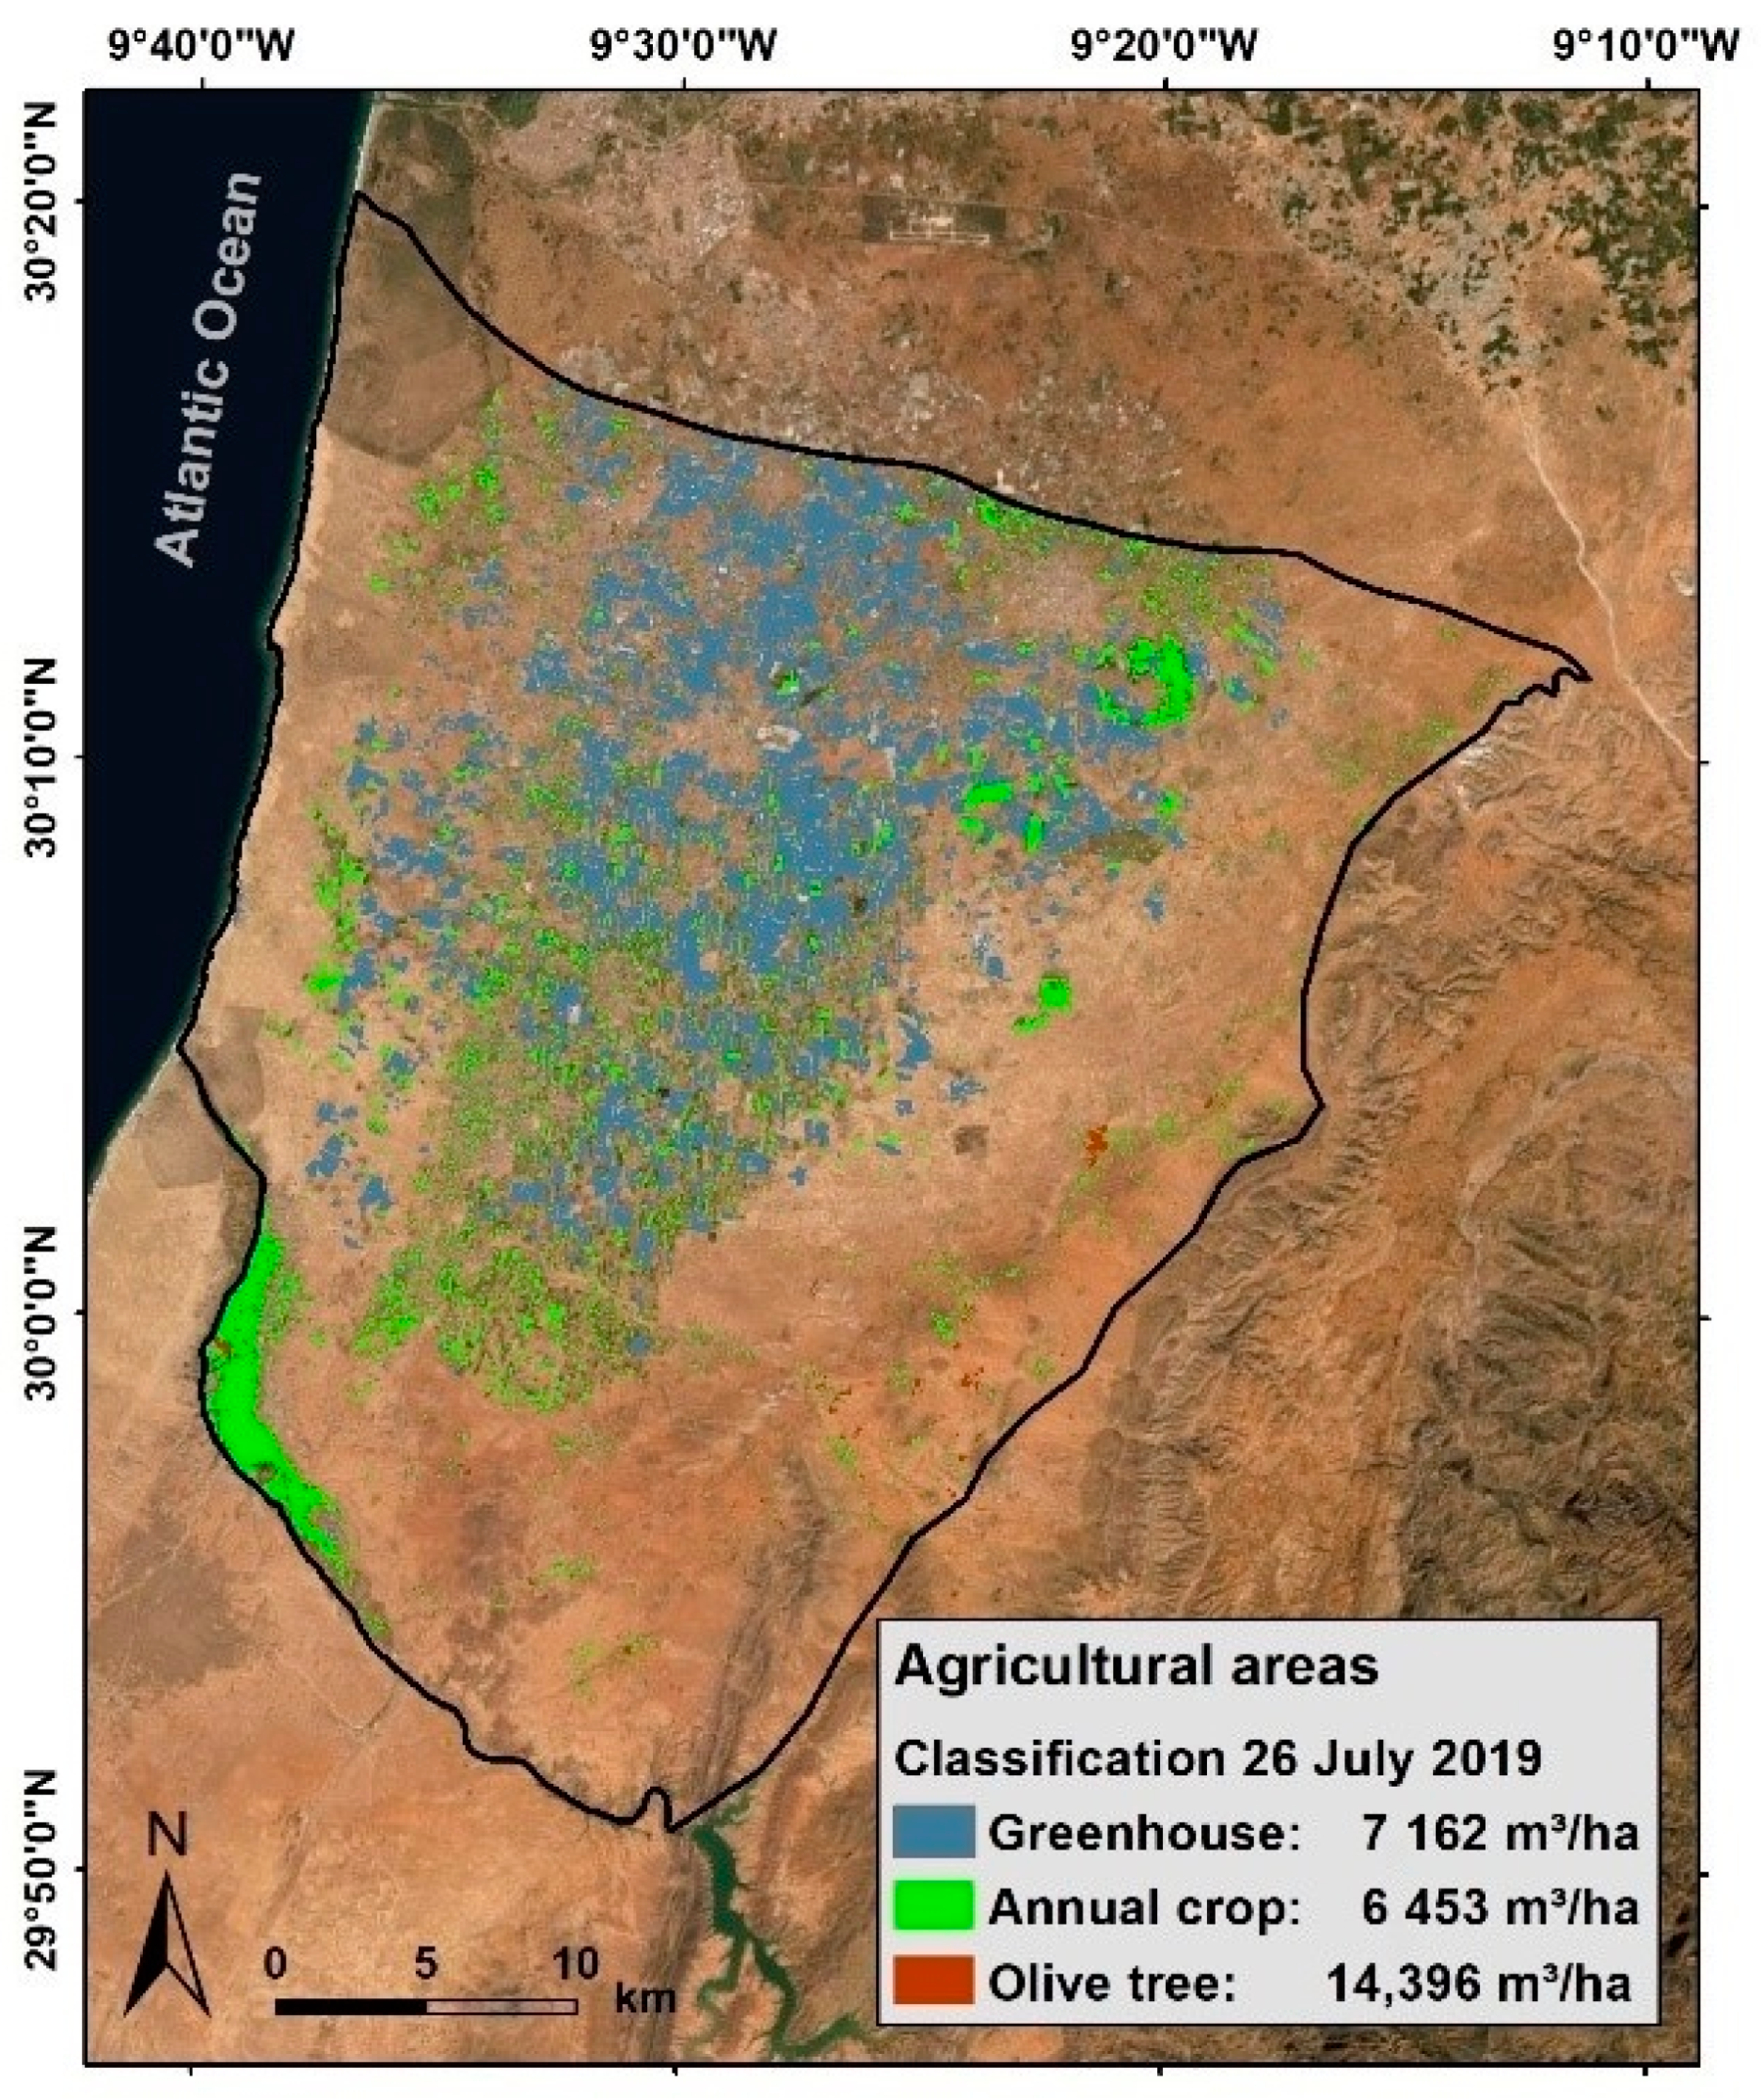
In order to define one representative value for greenhouses and annual crops, the averaged irrigation volume per crop type of these classes and the percentage of the total area for each crop type was used. The resulting weighted average value for greenhouses was 7162 m
3 per ha and for annual crops was 6453 m
3 per ha. As olive trees were masked before, but are relevant for the water balance, the amount of irrigation water of olive trees was also defined by calculating the average amount of irrigation. The value for olive trees was 14,396 m
3 per ha.
Figure 3 gives a spatial overview of the amount of irrigation. The groundwater abstraction was, thus, estimated by multiplying the amounts of irrigation with the corresponding agricultural areas. Following this approach, the estimated groundwater abstraction for the summer period 2019 was approximately 157 million m
3.
4. Discussion
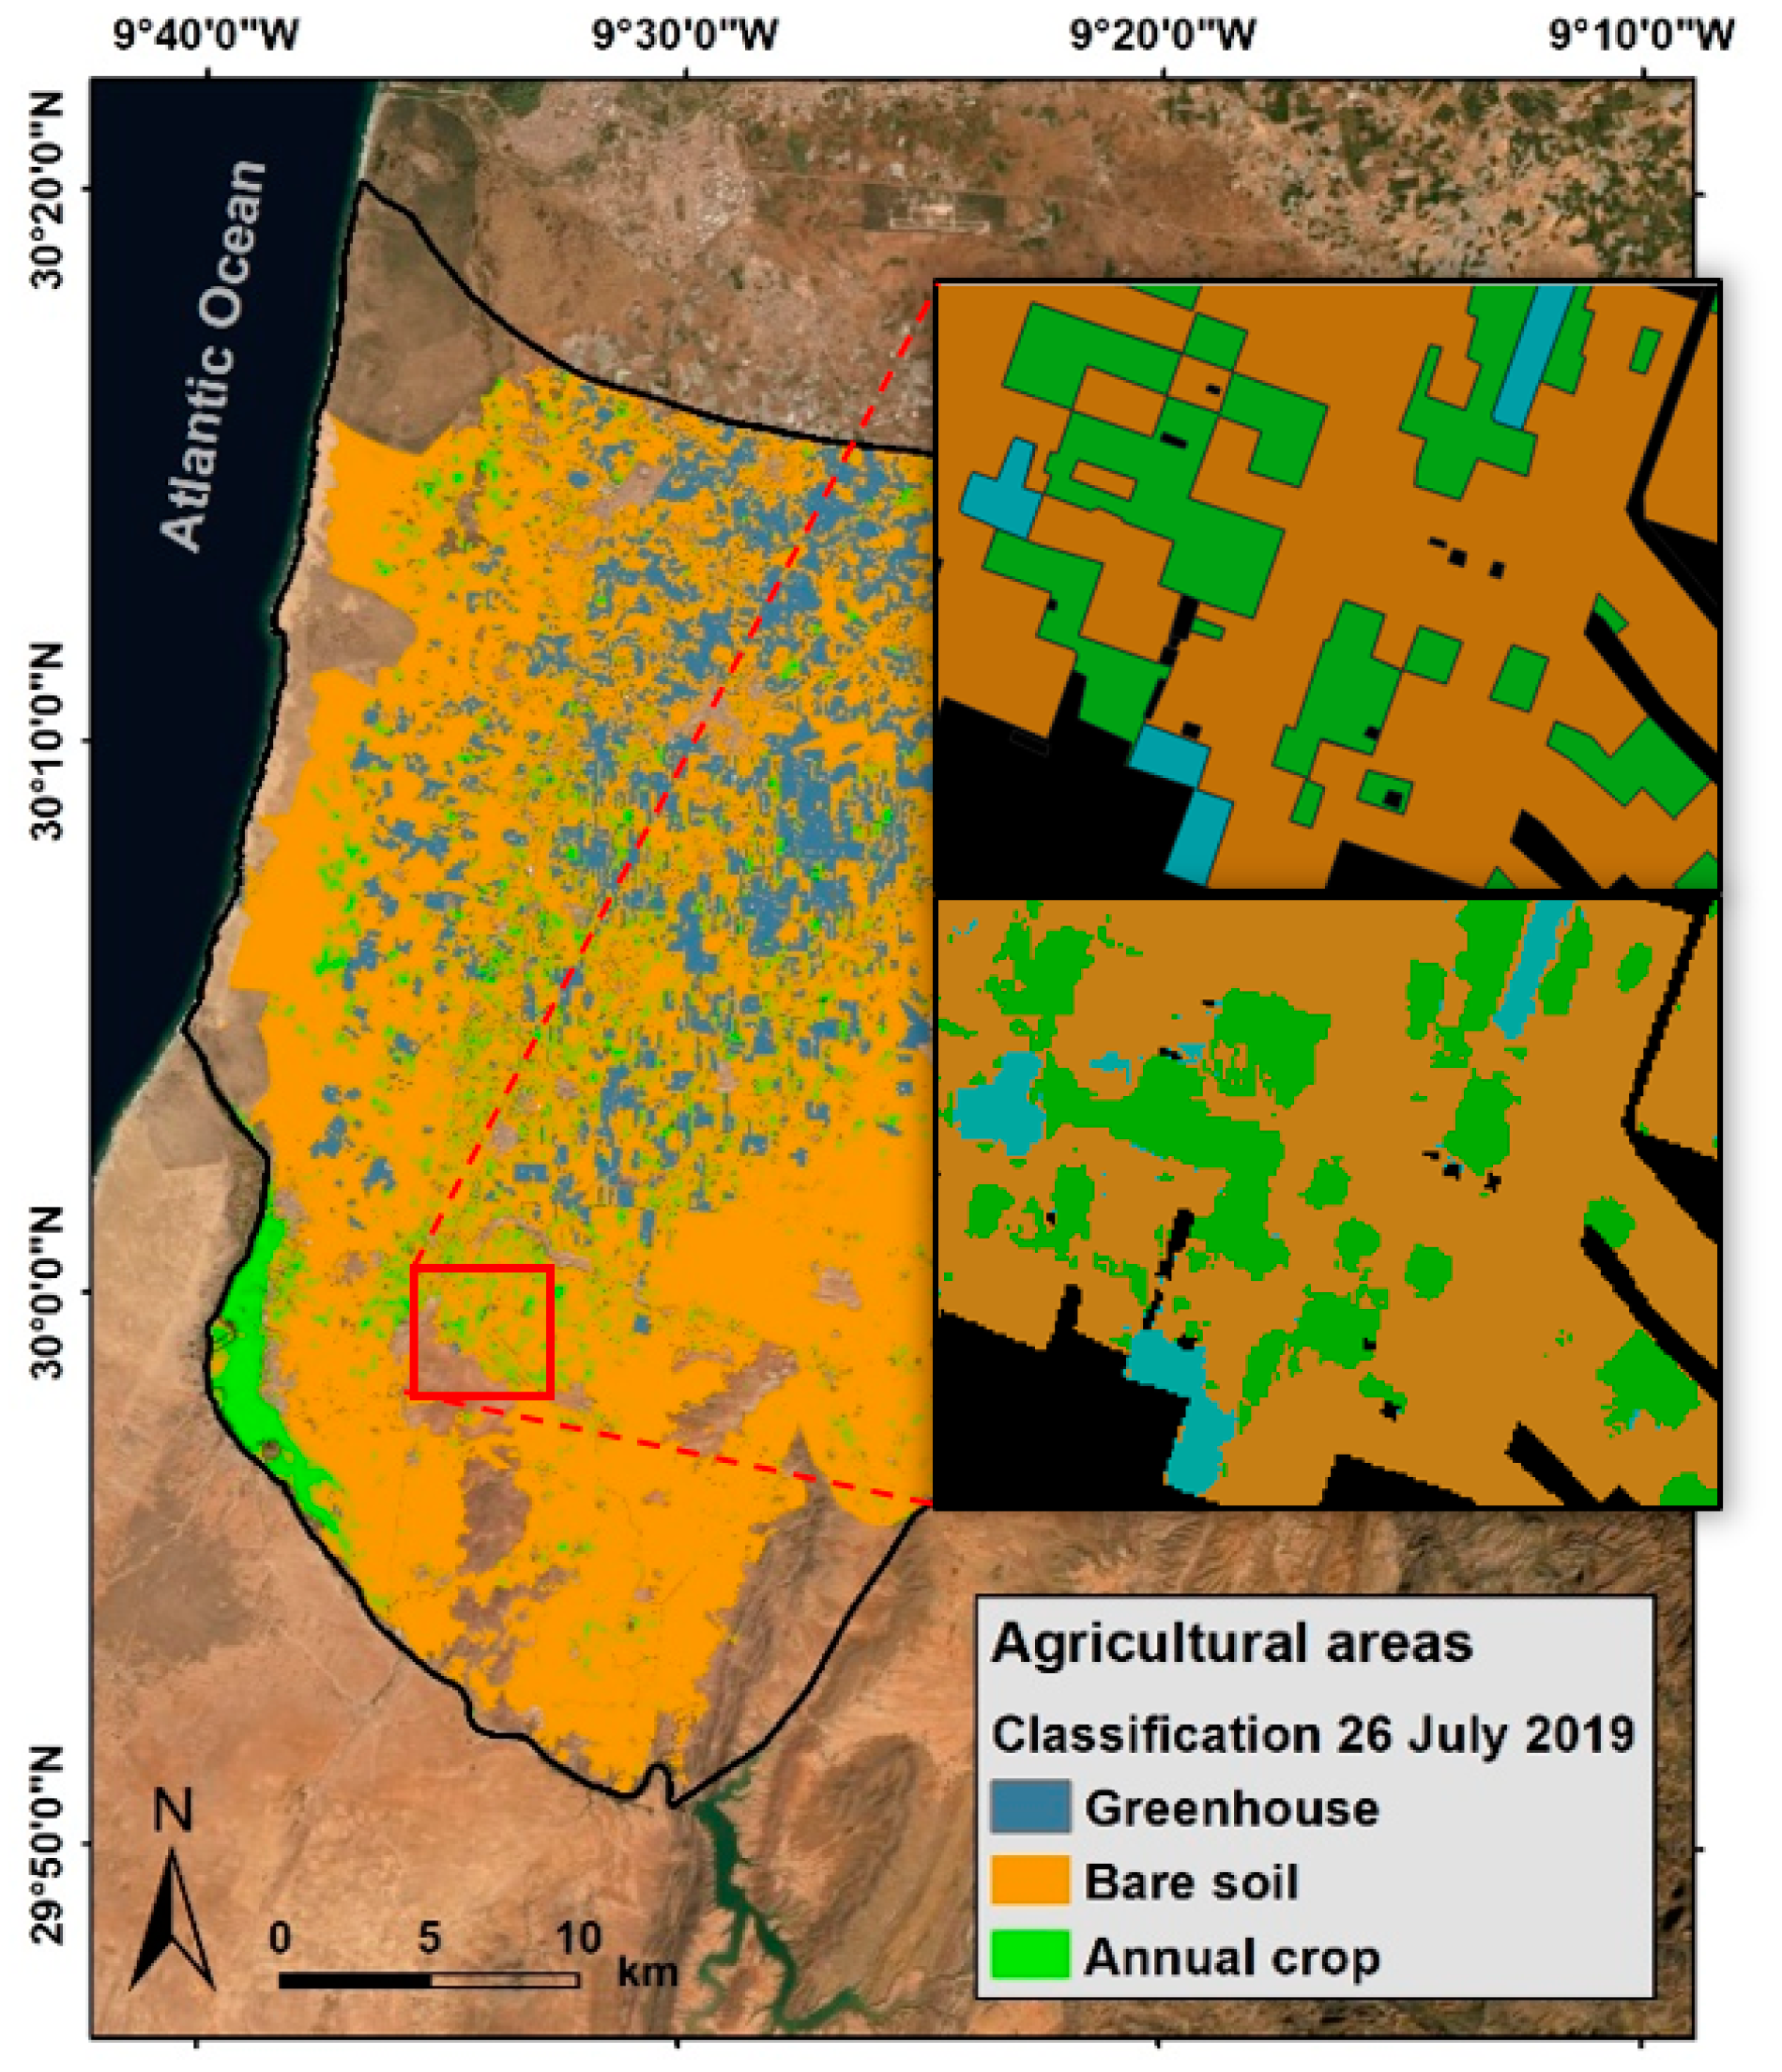
Comparatively low overall accuracies of the greenhouses and especially annual crops (
Table 2) can be partly explained by the fact of comparing raster and vector data. The result of the classification is a pixel-based map with patchy areas. In contrast, the land use map by CRTS is a vector dataset of polygons with homogenous areas and clear contours, as illustrated in
Figure 4.
It is also possible that the land use map by CRTS shows a complete agricultural parcel, although only half of it is cultivated. The actual land use from the classification may differ from the schematic land use map by CRTS, as it shows the entire agricultural plot extent.
The amounts of irrigation from 2015 are supposed to be valid in 2019 since there was no precipitation in the summer period in both years that could have affected the water availability for the crops. It is also assumed that all agricultural areas are irrigated, otherwise it would not be possible for the crops to grow in the summer.
However, the areas identified by the satellite data represent all agricultural areas, regardless of the source of irrigation water. Therefore, it also includes areas that are irrigated with surface water from the nearby dam or other reservoirs. A total of 96.6% of the greenhouses, 93.8% of the annual crops and 87.9% of the olive trees are irrigated with groundwater [
3]. These proportions are taken into account when calculating groundwater abstraction.
5. Conclusions
The approach is developed on the basis of local conditions as well as taking into account the specifications of the partner authorities. Another important aspect is the simple and cost-effective implementation of the method.
The results of the classification are promising, However, validation steps with recorded ground truth data would be helpful. In addition, the approach should be tested with further processing for another year as well as for the period winter/spring.
The volume of groundwater abstraction is estimated referring to local farmers’ irrigation practices in 2015. In general, compared to other empirical values, this information can be considered realistic. However, some differences in the individual irrigation data can be observed. In order to improve the estimation of groundwater abstraction, updated data of the farmers’ irrigation practices would be beneficial.
Author Contributions
Conceptualization, F.S. and M.M.; methodology, F.S.; software, F.S.; validation, F.S. and M.M.; formal analysis, F.S. and M.M.; investigation, F.S.; resources, F.S.; data curation, F.S. and M.M.; writing—original draft preparation, F.S.; writing—review and editing, F.S. and M.M.; visualization, F.S.; supervision, F.S.; project administration, F.S. and M.M. All authors have read and agreed to the published version of the manuscript.
Funding
This research received no external funding.
Institutional Review Board Statement
Not applicable.
Informed Consent Statement
Not applicable.
Data Availability Statement
All references including the data used for this study are available at the water authority in Agadir (ABH-SM).
http://www.abhsm.ma/ (accessed on 1 October 2021).
Acknowledgments
The authors would like to thank the Moroccan water authority in Agadir for their assistance in providing the land use maps and the irrigation data for the crop types.
Conflicts of Interest
The authors declare no conflict of interest.
References
- Capion Consulting. Résidence Jardins du Souss. Agadir, Morocco. Expertise pour une collecte et une analyse descriptive des données spatiales au niveau de la Nappe de Chtouka—Maroc. In External Study Within the Framework of the Project Regional Cooperation in the Water Sector implemented by BGR; CREM Project: Tunis, Tunisia, 2018; Available online: https://drive.google.com/drive/folders/1RyOA3kGI8WSERtb5nnlAt4lJzAqdmmb_ (accessed on 1 October 2021).
- Centre Royale de la Télédétection Spatiale du Maroc (CRTS). 21 Angle Avenue Sanawbar et Avenue Allal El Fassi, Rabat, Morocco. Carte de l’occupation du sol de l’année 2019. In External Study Within the Framework of the Project Programme D’appui à la Gestion Intégrée des Ressources en Eau Implemented by GIZ; AGIRE Project: Rabat, Morocco, 2020. [Google Scholar]
- ANZAR Conseil. 54 Av. Kamal Zebdi, Rabat, Morocco. Etude et élaboration de Contrat de Nappe de Chtouka (Province Chtouka Ait Baha), Base de Données Prélèvements Nappe Chtouka; ABH SM: Agadir, Morocco, 2015; Unpublished work. [Google Scholar]
| Publisher’s Note: MDPI stays neutral with regard to jurisdictional claims in published maps and institutional affiliations. |
© 2021 by the authors. Licensee MDPI, Basel, Switzerland. This article is an open access article distributed under the terms and conditions of the Creative Commons Attribution (CC BY) license (https://creativecommons.org/licenses/by/4.0/).


