Expression Profiling of Candidate Genes in Sugar Beet Leaves Treated with Leonardite-Based Biostimulant

 ,
, 

 ,
,  ,
,  ,
,  and
and 
Abstract
:1. Introduction
2. Materials and Methods
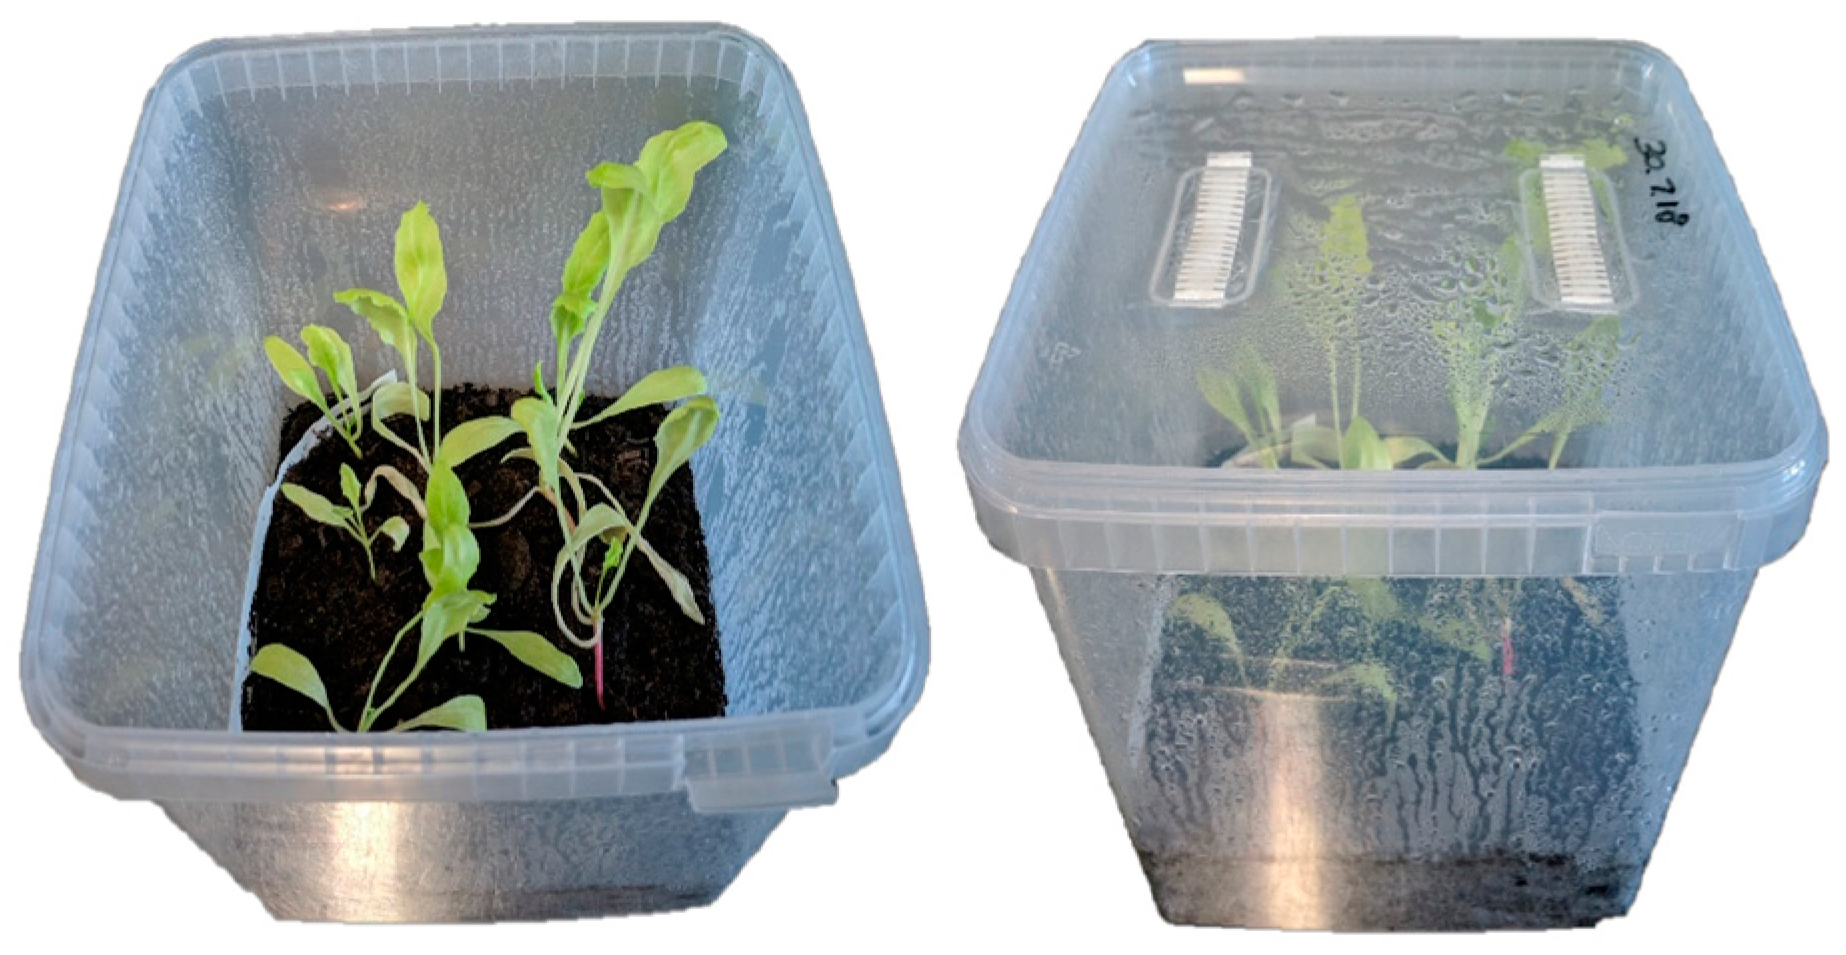
2.1. Plant Materials and Growing Conditions
2.2. Leaf RNA Isolation and cDNA Synthesis
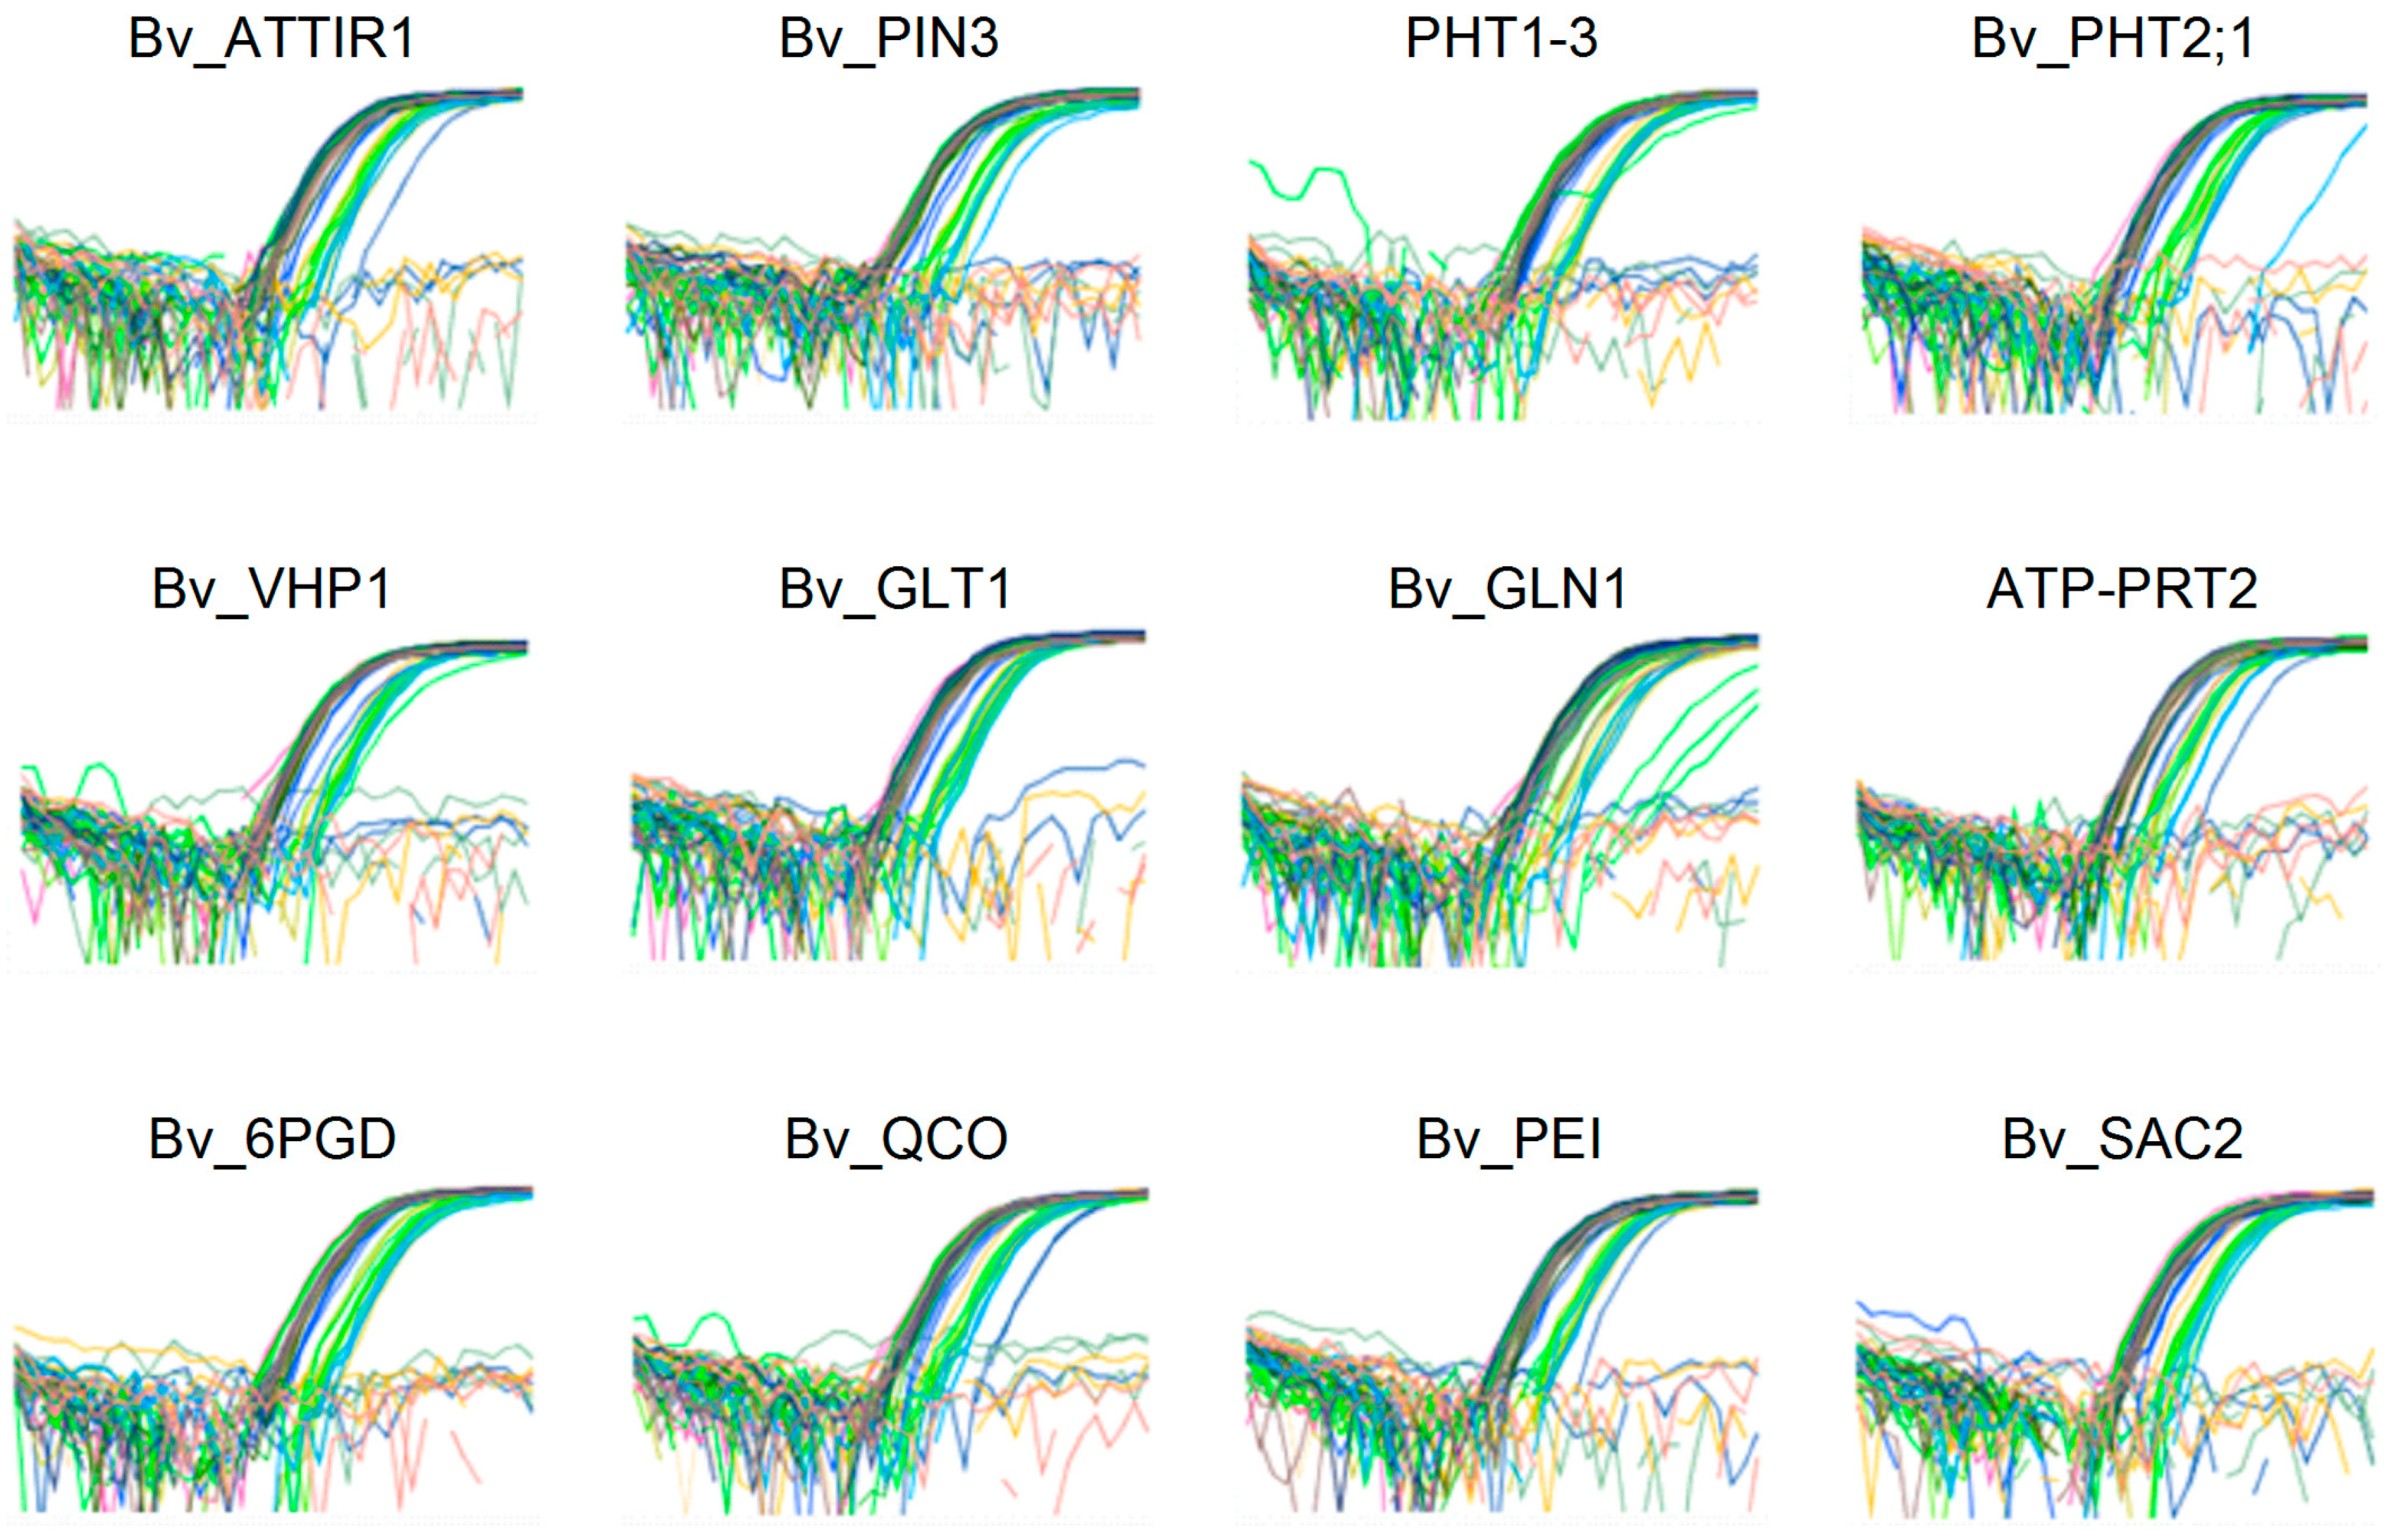
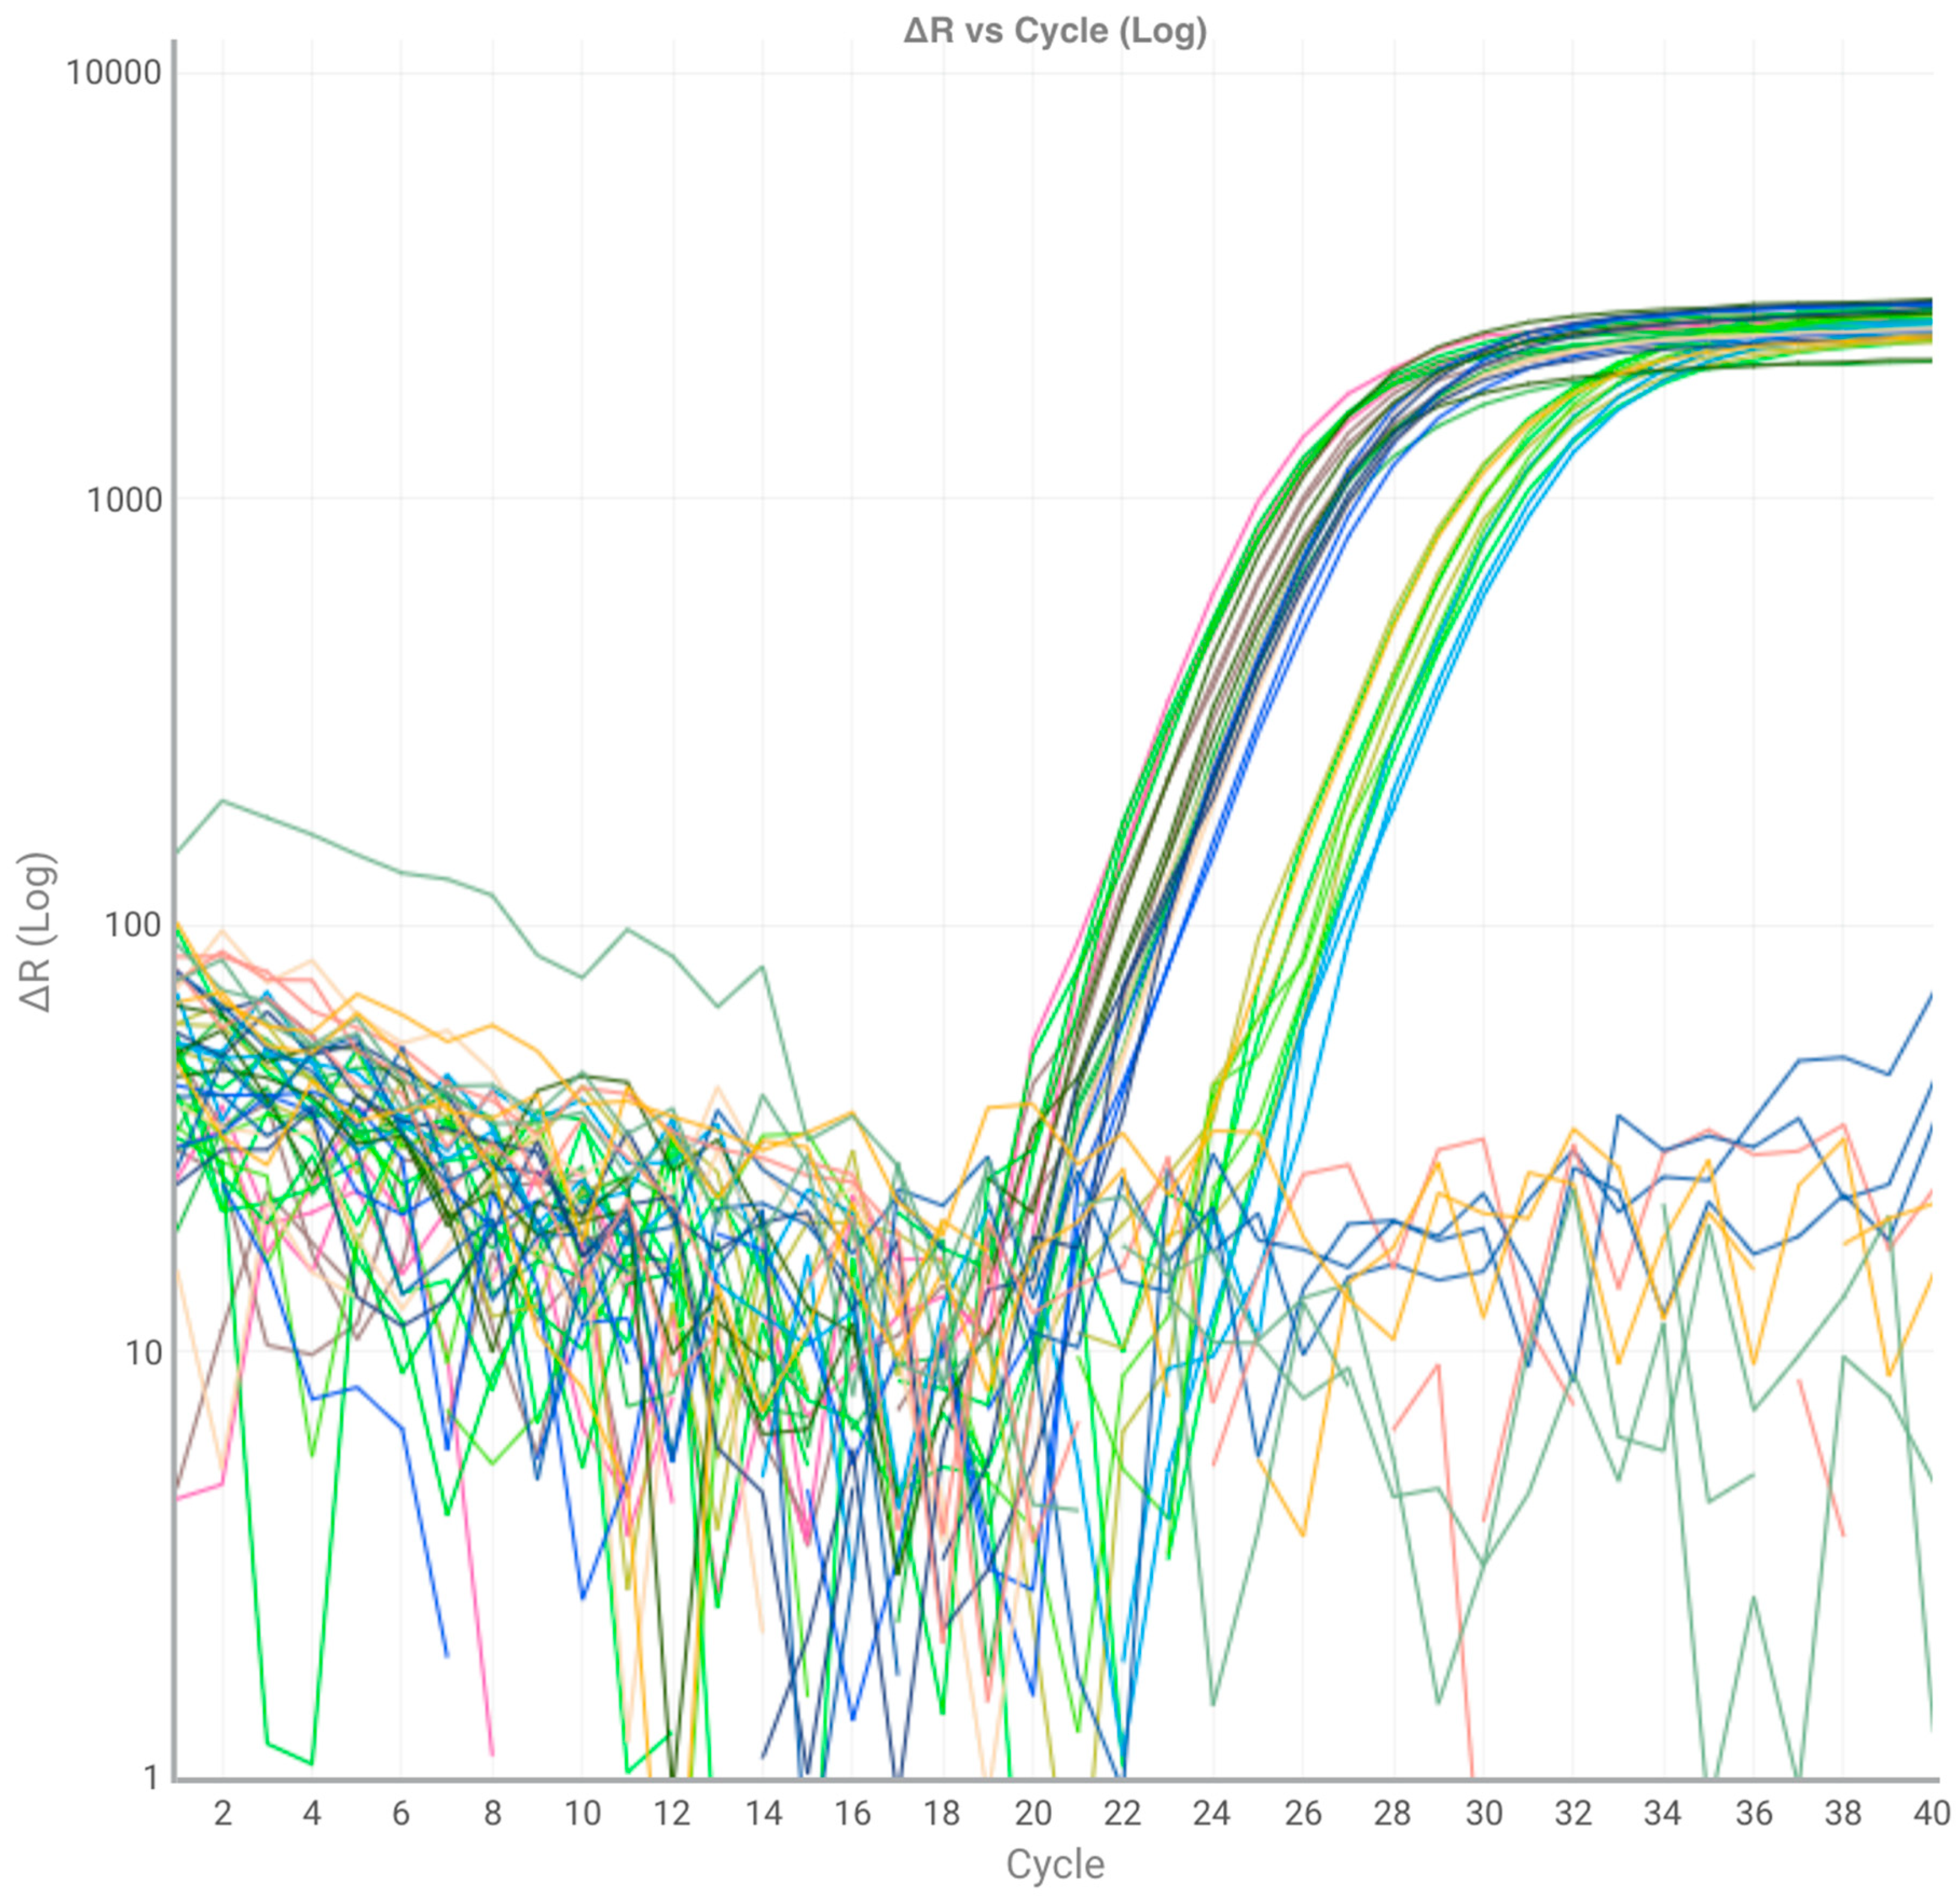
2.3. Real Time PCR analysis
2.4. Statistical Analysis
3. Results
4. Discussion
5. Conclusions
Supplementary Materials
Author Contributions
Funding
Acknowledgments
Conflicts of Interest
References
- Calvo, P.; Nelson, L.; Kloepper, J.W. Agricultural uses of plant biostimulants. Plant Soil 2014, 383, 3–41. [Google Scholar] [CrossRef] [Green Version]
- Clapp, C.E.; Chen, Y.; Hayes, M.H.B.; Cheng, H.H. Plant growth promoting activity of humic substances. In Understanding and Managing Organic Matter in Soils, Sediments and Waters; Swift, R.S., Sparks, K.M., Eds.; Int Humic Sci Society: Madison, WI, USA, 2001. [Google Scholar]
- Nardi, S.; Carletti, P.; Pizzeghello, D.; Muscolo, A. Biological activities of humic substances. In Biophysico-Chemical Processes Involving Natural Nonliving Organic Matter in Environmental Systems; Senesi, N., Xing, B., Huang, P.M., Eds.; Wiley: Hoboken, NJ, USA, 2009; pp. 305–339. [Google Scholar]
- EBIC. 2013. Available online: http://www.biostimulants.eu/ (accessed on 18 April 2013).
- Du Jardin, P. Plant biostimulants: Definition, concept, main categories and regulation. Sci. Hort. 2015, 196, 3–14. [Google Scholar] [CrossRef] [Green Version]
- Kelleher, B.P.; Simpson, A.J. Humic substances in soils: Are they really chemically distinct? Environ. Sci. Technol. 2006, 40, 4605–4611. [Google Scholar] [CrossRef]
- Canellas, L.P.; Dantas, D.J.; Aguiar, N.O. Probing the hormonal activity of fractionated molecular humic components in tomato auxin mutants. Ann. Appl. Biol. 2011, 159, 202–211. [Google Scholar] [CrossRef] [Green Version]
- Tahir, M.M.; Khurshid, M.; Khan, M.Z.; Abbasi, M.K.; Hazmi, M.H. Lignite-derived humic acid effect on growth of wheat plants in different soils. Pedosphere 2011, 2, 124–131. [Google Scholar] [CrossRef]
- Jindo, K.; Martim, S.A.; Navarro, E.C. Root growth promotion by humic acids from composted and noncomposted urban organic wastes. Plant Soil 2012, 353, 209–220. [Google Scholar] [CrossRef]
- Aydin, A.; Kant, C.; Turan, M. Humic acid application alleviate salinity stress of bean (Phaseolus vulgaris L.) plants decreasing membrane leakage. Afr. J. Agric. Res. 2012, 7, 1073–1086. [Google Scholar] [CrossRef]
- Khaleda, L.; Park, H.J.; Yun, D.J.; Jeon, J.R.; Kim, M.G.; Kim, W.Y. Humic acid confers high-affinity K+ transporter 1-mediated salinity stress tolerance in Arabidopsis. Mol. Cells 2017, 40, 966–975. [Google Scholar] [CrossRef]
- Cimrin, K.M.; Önder, T.; Turan, M.; Burcu, T. Phosphorus and humic acid application alleviate salinity stress of pepper seedling. Afr. J. Biotechnol. 2010, 9, 5845–5851. [Google Scholar]
- García, A.C.; Santos, L.A.; Izquierdo, F.G.; Rumjanek, V.M.; Castro, R.N.; dos Santos, F.S.; de Souza, L.G.A.; Berbara, R.L.L. Potentialities of vermicompost humic acids to alleviate water stress in rice plants (Oryza sativa L.). J. Geochem. Explor. 2013, 136, 48–54. [Google Scholar] [CrossRef]
- Fathy, E.S.L.E.S.; Khedr, Z.M.A.; Moghazy, A.M. Improves metabolical and agronomical performances of eggplant under high temperature stressful condition (late summer) by using some antioxidants and mineral nutrients. Conference of untraditional tools in production and improvement of agriculture crops. Agri. Res. Centre Hortic. Inst. Cairo 2003, 1–3. [Google Scholar]
- Salwa, A.; Eisa, A.I. Effect of amendments, humic and amino acids on increases soils fertility, yields and seeds quality of peanut and sesame on sandy soils. Res. J. Agric. Biol. Sci. 2011, 7, 115–125. [Google Scholar] [CrossRef]
- Van Oosten, M.J.; Pepe, P.; De Pascale, S.; Silletti, S.; Maggio, A. The role of biostimulants and bioeffectors as alleviators of abiotic stress in crop plants. Chem. Biol. Technol. Agric. 2017, 4, 5. [Google Scholar] [CrossRef] [Green Version]
- El-Bassiony, A.M.; Fawzy, Z.F.; AbdEi-Baky, M.M.H.; Mahmood, A.R. Response of snap bean plants to mineral fertilizers and humic acid application. J. Plant Biol. Soil Health 2010, 4, 1–7. [Google Scholar]
- Kaya, M.; Atak, M.; Khawar, K.M.; Cemalettin, Y.C.; Özcan, S. Effect of pre-sowing seed treatment with zinc and foliar spray of humic acids on yield of common bean (Phaseolus vulgaris L.). Int. J. Agric. Biol. 2005, 7, 875–878. [Google Scholar]
- Dina, S.S.; Ibrahim, A.H.; Nour El-Deen, A.E.K.; Fatma, A.M.M. Induction of systemic resistance in sugar-beet infected with meloidogyne incognita by humic acid, hydrogen peroxide, thiamine and two amino acids. Egypt J. Agronematol. 2011, 12, 22–41. [Google Scholar]
- Contartese, V.; Garabello, G.; Ochipinti, A.; Barbero, F.; Bertea, C.M. Effects of a new biostimulant on gene expression and metabolic responses of tomato plants. Acta Hortic. 2016, 1148, 35–42. [Google Scholar] [CrossRef]
- Yakhin, O.I.; Lubyanov, A.A.; Yakhin, I.A.; Brown, P.H. Biostimulants in plant science: A global perspective. Front. Plant Sci. 2017, 7, 2048. [Google Scholar] [CrossRef]
- Stevanato, P.; Broccanello, C.; Biscarini, F.; Del Corvo, M.; Sablok, G.; Panella, L.; Stella, A.; Concheri, G. High-throughput RAD-SNP genotyping for characterization of sugar beet genotypes. Plant Mol. Biol. Rep. 2014, 32, 691–696. [Google Scholar] [CrossRef]
- Barone, V.; Bertoldo, G.; Magro, F.; Broccanello, C.; Puglisi, I.; Baglieri, A.; Cagnin, M.; Concheri, G.; Squartini, A.; Pizzeghello, D.; et al. Molecular and morphological changes induced by leonardite-based biostimulant in Beta vulgaris L. Plants 2019, 8, 181. [Google Scholar] [CrossRef]
- Heid, C.A.; Stevens, J.; Livak, K.J.; Williams, P.M. Real time quantitative PCR. Genome Res. 1996, 6, 986–994. [Google Scholar] [CrossRef] [PubMed]
- Livak, K.J.; Schmittgen, T.D. Analysis of relative gene expression data using real-time quantitative PCR and the 2(-Delta Delta C(T)) method. Methods 2001, 25, 402–408. [Google Scholar] [CrossRef] [PubMed]
- Schmittgen, T.D.; Livak, K.J. Analyzing real-time PCR data by the comparative C(T) method. Nat. Protoc. 2008, 3, 1101–1108. [Google Scholar] [CrossRef] [PubMed]
- KEGG. 2019. Available online: http://www.kegg.jp (accessed on 1 September 2019).
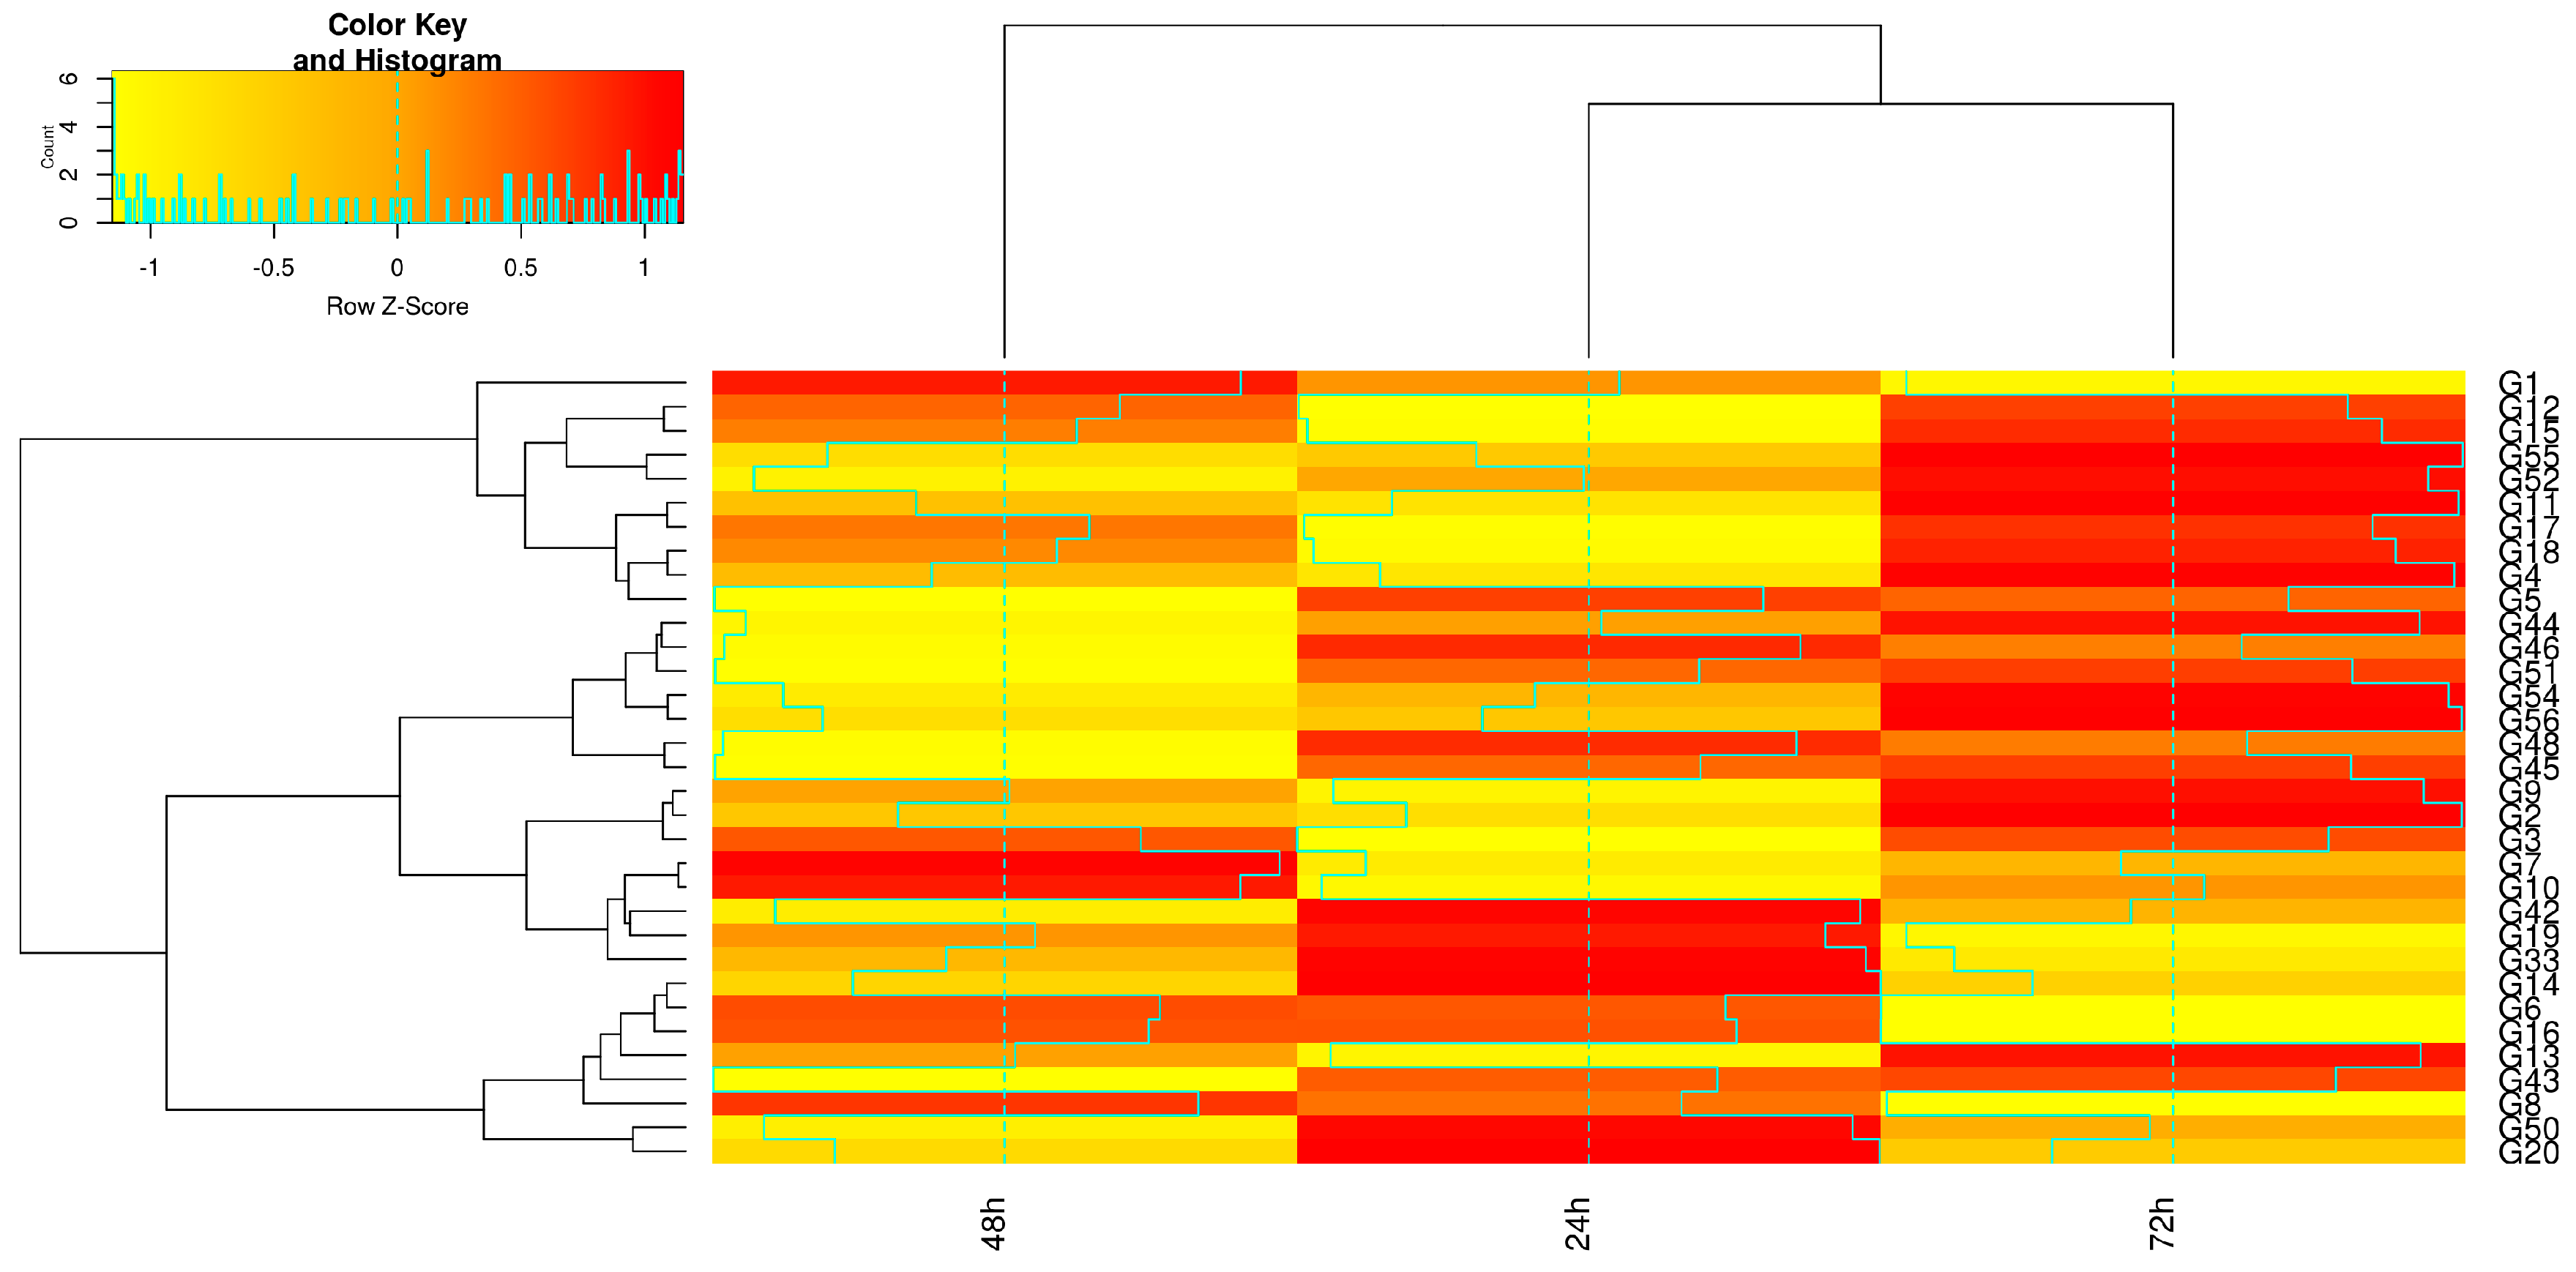
- Babicki, S.; Arndt, D.; Marcu, A.; Liang, Y.; Grant, J.R.; Maciejewski, A.; Wishart, D.S. Heatmapper: Web-enabled heat mapping for all. Nucleic Acids Res. 2016, 14, 148–153. [Google Scholar] [CrossRef] [PubMed]
- Beevers, H. Metabolic production of sucrose from fat. Nature 1961, 191, 433–436. [Google Scholar] [CrossRef] [PubMed]
- Cornah, J.E.; Germain, V.; Ward, J.L.; Beale, M.H.; Smith, S.M. Lipid utilization, gluconeogenesis, and seedling growth in arabidopsis mutants lacking the glyoxylate cycle enzyme malate synthase. J. Biol. Chem. 2004, 279, 42916–42923. [Google Scholar] [CrossRef] [PubMed]
- Kovács, G.; Sorvari, S.; Scott, P.; Toldi, O. Pyrophosphate: Fructose 6-phosphate 1-phosphotransferase operates in net gluconeogenic direction in taproots of cold and drought stressed carrot plants. Acta Biol. Szeged. 2006, 50, 25–30. [Google Scholar] [CrossRef]
- Shaar-Moshe, L.; Hübner, S.; Peleg, Z. Identification of conserved drought-adaptive genes using a cross-species meta-analysis approach. BMC Plant Biol. 2015, 15, 111. [Google Scholar] [CrossRef]
- Amthor, J.S. Respiration and Crop Productivity; Springer: New York, NY, USA, 1989. [Google Scholar]
- Seabra, A.R.; Silva, L.S.; Carvalho, H.G. Novel aspects of glutamine synthetase (GS) regulation revealed by a detailed expression analysis of the entire GS gene family of Medicago truncatula under different physiological conditions. BMC Plant Biol. 2013, 13, 137. [Google Scholar] [CrossRef]
- Černý, I.; Pačuta, V.; Ernst, D.; Gažo, J. Formation of sugar beet yield and sugar content depending on year and foliar application of biologically active substances and fertilizers. LCaR 2018, 134, 141–145. [Google Scholar]
- Bao, A.; Zhao, Z.; Ding, G.; Shi, L.; Xu, F.; Cai, H. The Stable Level of Glutamine synthetase 2 plays an important role in rice growth and in carbon-nitrogen metabolic balance. Int. J. Mol. Sci. 2015, 16, 12713–12736. [Google Scholar] [CrossRef] [PubMed]
- Xiong, L.; Lee, B.; Ishitani, M.; Lee, H.; Zhang, C.; Zhu, J.K. FIERY1 encoding an inositol polyphosphate 1-phosphatase is a negative regulator of abscisic acid and stress signaling in Arabidopsis. Genes Dev. 2001, 15, 1971–1984. [Google Scholar] [CrossRef] [PubMed]
- Sharp, R.E.; Lenoble, M.E. ABA, ethylene and the control of shoot and root growth under water stress. J. Exp. Bot. 2002, 53, 33–37. [Google Scholar] [CrossRef] [PubMed]
- Woodward, A.W.; Bartel, B. Auxin: Regulation, Action, and Interaction. Annal. Bot. 2005, 95, 707–735. [Google Scholar] [CrossRef] [PubMed] [Green Version]
- Vanneste, S.; Frim, J. Auxin: A trigger for change in plant development. Cell 2009, 136, 1005–1016. [Google Scholar] [CrossRef] [PubMed]
- Overvoorde, P.; Fukaki, H.; Beeckman, T. Auxin control of root development. Cold Spring Harb Perspect. Biol. 2010, 2, a001537. [Google Scholar] [CrossRef] [PubMed]
- Wang, A.; Garcia, D.; Zhang, H.; Feng, K.; Chaudhury, A.; Berger, F.; Peacock, W.J.; Dennis, E.S.; Luo, M. The VQ motif protein IKU1 regulates endosperm growth and seed size in Arabidopsis. Plant Journal 2010, 63, 670–679. [Google Scholar] [CrossRef]
- Xue, H.W.; Xu, C.; Mei, Y. Function and regulation of phospholipid signalling in plants. Biochem. J. 2009, 421, 145–156. [Google Scholar] [CrossRef]
- Lin, W.H.; Ye, R.; Ma, H.; Xu, Z.H.; Xue, H.W. DNA chip-based expression profile analysis indicates involvement of the phosphatidyl inositol signaling pathway in multiple plant responses to hormone and abiotic treatments. Cell Res. 2004, 14, 34–45. [Google Scholar] [CrossRef]
- Helimann, I. Phosphoinositide signaling in plant development. Development 2016, 143, 2044–2055. [Google Scholar] [CrossRef] [Green Version]
- König, S.; Mosblech, A.; Heilmann, I. Stress-inducible and constitutive phosphoinositide pools have distinctive fatty acid patterns in Arabidopsis thaliana. FASEB J. 2007, 21, 1958–1967. [Google Scholar] [CrossRef] [PubMed]
- König, S.; Ischebeck, T.; Lerche, J.; Stenzel, I.; Heilmann, I. Salt stress-induced association of phosphatidylinositol 4,5-bisphosphate with clathrin-coated vesicles in plants. Biochem. J. 2008, 415, 387–399. [Google Scholar] [CrossRef] [PubMed]
- Dieck, C.B.; Boss, W.F.; Imara, Y.; Perera, I.Y. A role for phosphoinositides in regulating plant nuclear functions. Front Plant Sci. 2012, 3, 1–12. [Google Scholar] [CrossRef] [PubMed]
- Hung, C.Y.; Aspesi, P.; Hunter, M.R.; Lomax, A.W.; Perera, I.Y. Phosphoinositide-signaling is one component of a robust plant defense response. Front Plant Sci. 2014, 5, 1–15. [Google Scholar] [CrossRef] [PubMed]
- Pan, L.; Zhang, X.; Wang, J.; Ma, X.; Zhou, M.; Huang, L.; Nie, G.l.; Wang, P.; Yang, Z.; Li, J. Transcriptional profiles of drought-related genes in modulating metabolic processes and antioxidant defenses in Loliumm ultiflorum. Front. Plant Sci. 2016, 7, 519. [Google Scholar] [CrossRef] [PubMed]
- Zhang, C.; Meng, S.; Li, M.; Zhao, Z. Genomic identification and expression analysis of the phosphate T\transporter gene family in Poplar. Front. Plant Sci. 2016, 7, 1398. [Google Scholar] [CrossRef] [PubMed]

| Gene Code | Gene ID | Gene Function Category | EC Number | |
|---|---|---|---|---|
| G2 | Bv_6PGD | Mitocondrial respiratory pathway | OPP oxidative PP.6-phosphogluconate dehydrogenase | 1.1.1.44 |
| G3 | Bv_R5PI | OPPnon-reductive PP.ribose 5-phosphate isomerase | 5.3.1.6 | |
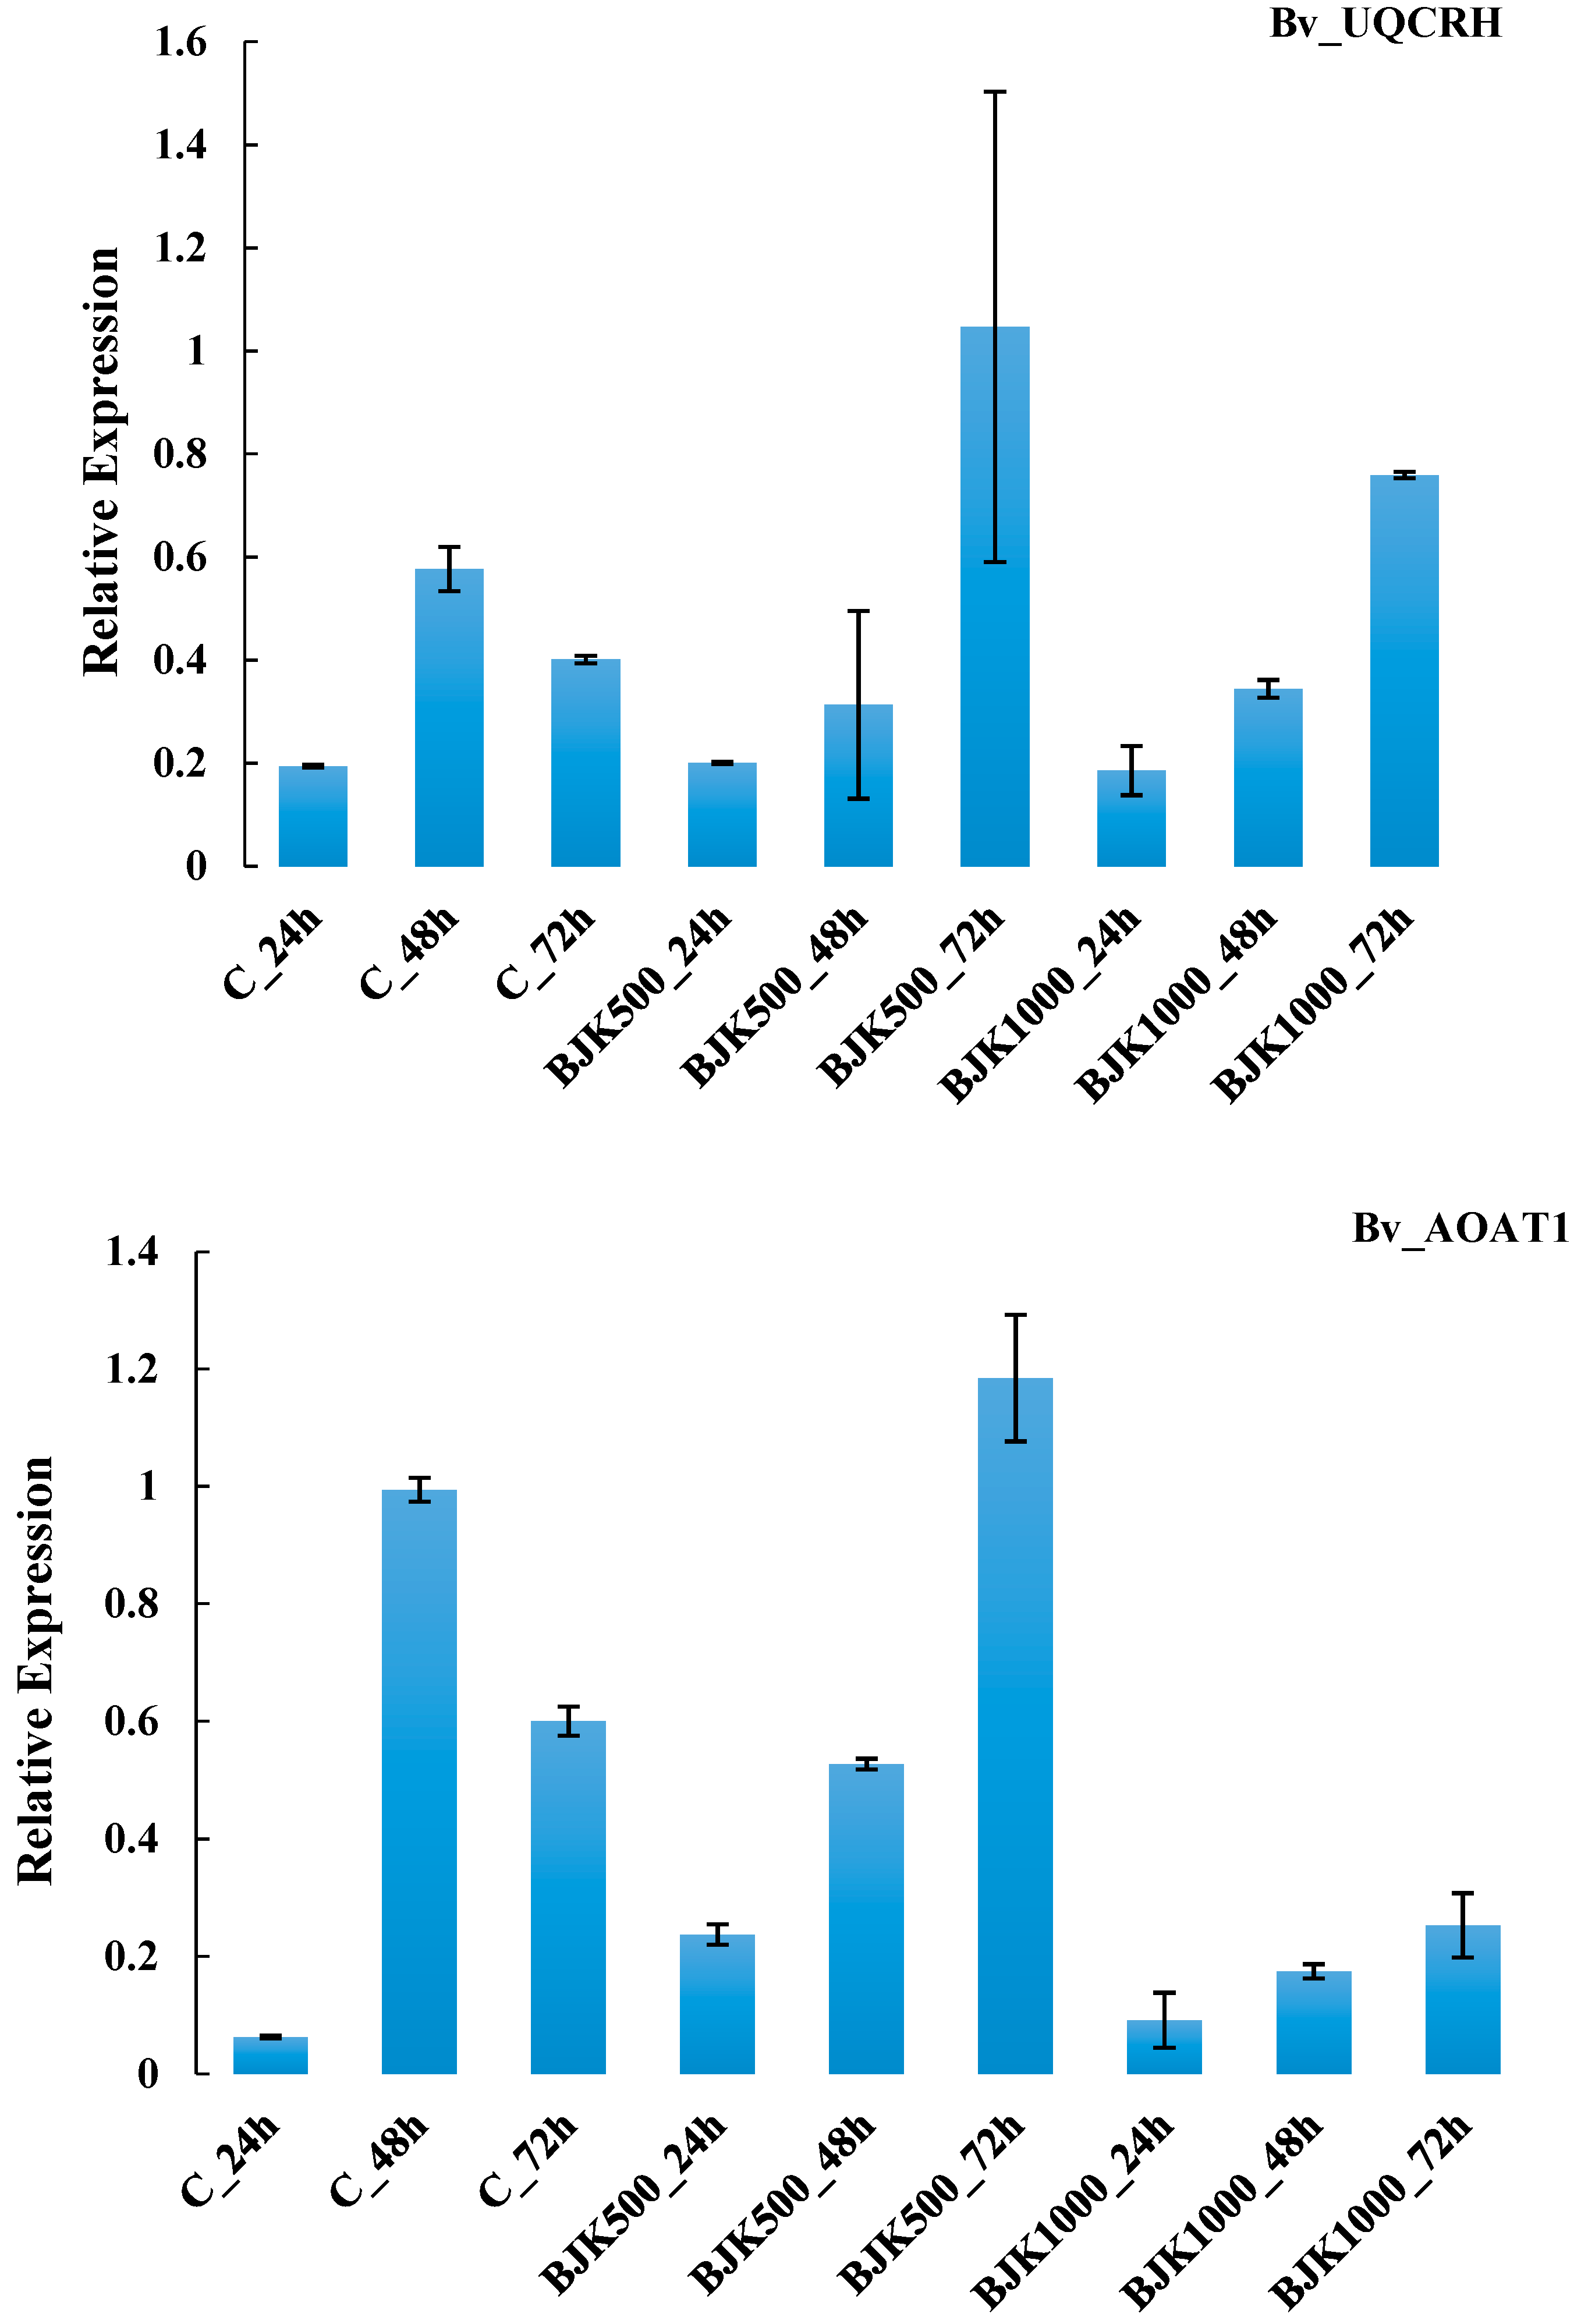
| G4 | Bv_UQCRH | mitochondrial electron transport/ATP synthesis, cytochrome c reductase | 1.10.2.2 | |
| G5 | Bv_UQCR7 | mitochondrial electron transport/ATP synthesis, cytochrome c reductase | 1.10.2.2 | |
| G6 | Bv_QCO | mitochondrial electron transport/ATP synthesis, cytochrome c | 1.10.2.2 | |
| G7 | Bv_PEI | Lipid metabolism | lipid metabolism, lipid degradation, lipases | 3.1.1.3 |
| G8 | Bv_SAC2 | lipid metabolism, lipid degradation, lysophospholipases | 3.1.1.5 | |
| G9 | Bv_AOAT1 | N-metabolism | amino acid metabolism, central amino acid metabolism, alanine, alanine aminotransferase | 2.6.1.2 |
| G10 | ATP-PRT2 | amino acid metabolism, synthesis histidine, ATP phosphoribosyl transferase | 2.4.2.17 | |
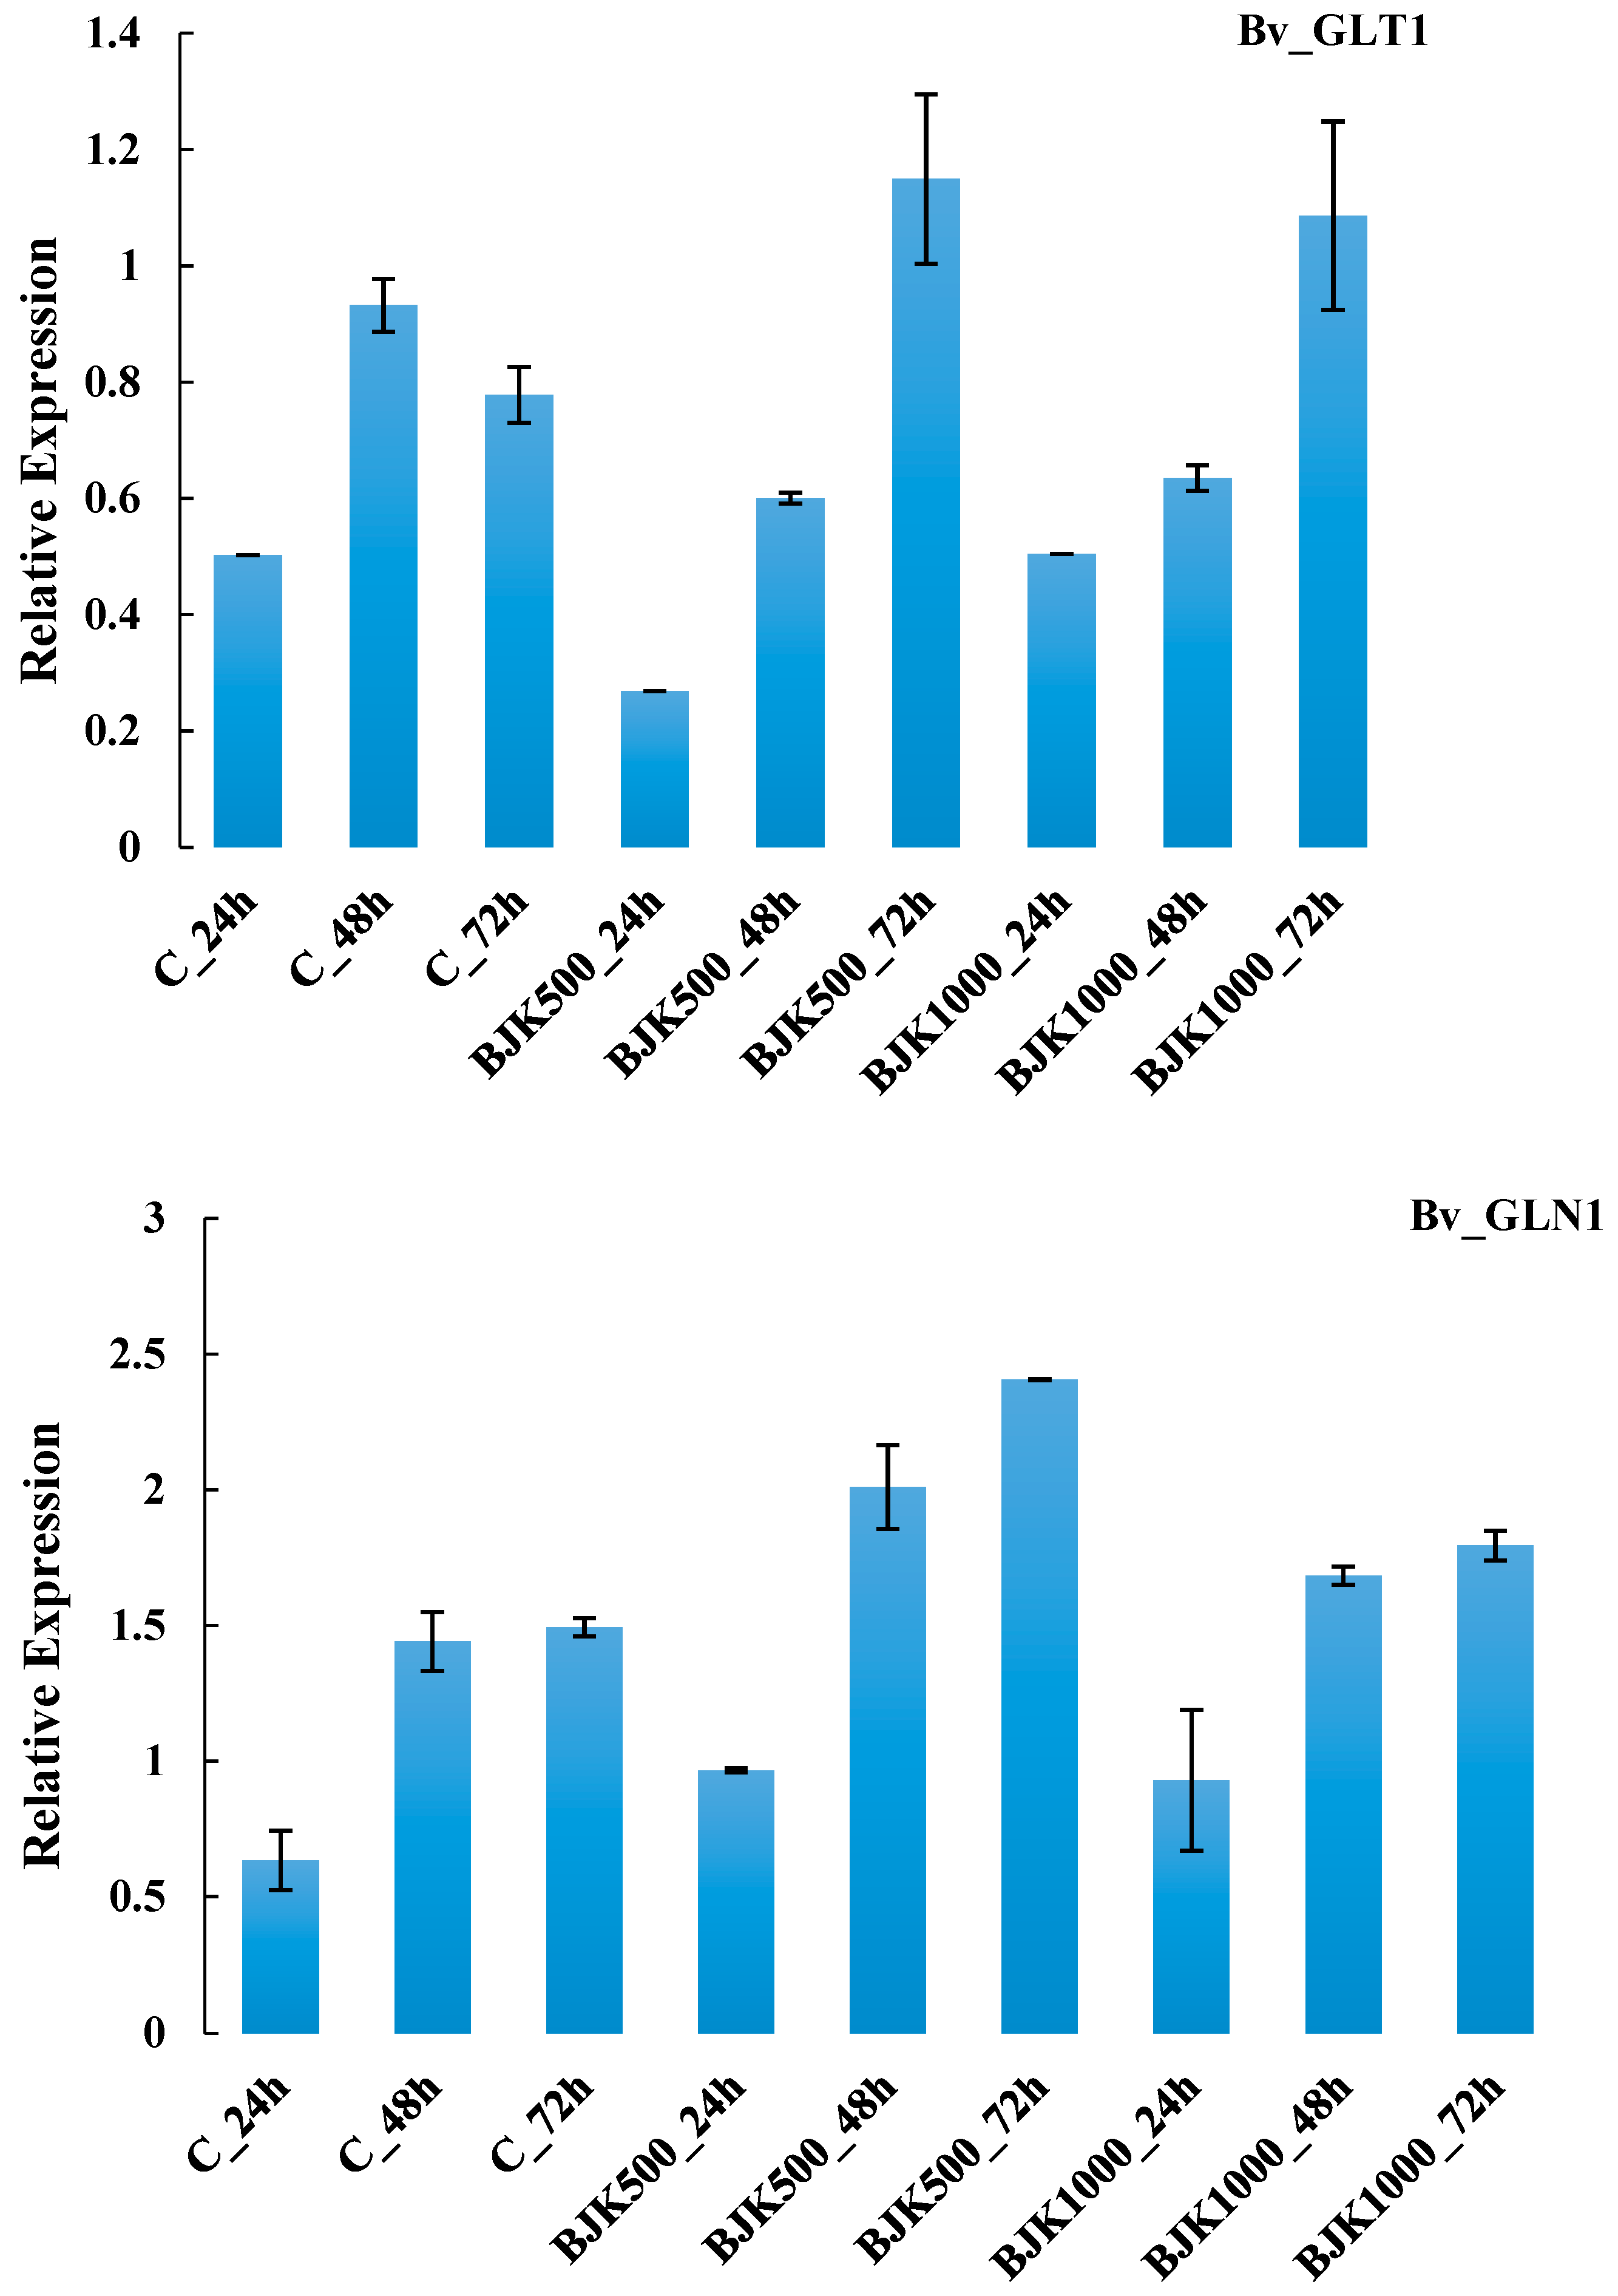
| G11 | Bv_GLT1 | N-metabolism, ammonia metabolism, glutamate synthase NADH dependent | 1.4.1.14 | |
| G12 | Bv_GLN1 | N-metabolism, ammonia metabolism, glutamine synthetase | 6.3.1.2 | |
| G13 | Bv_AREB1 | Hormone metabolism | hormone metabolism, abscisic acid, induced-regulated-responsive-activated | 244.319.5 |
| G14 | Bv_HAB1 | hormone metabolism, abscisic acid signal transduction | ||
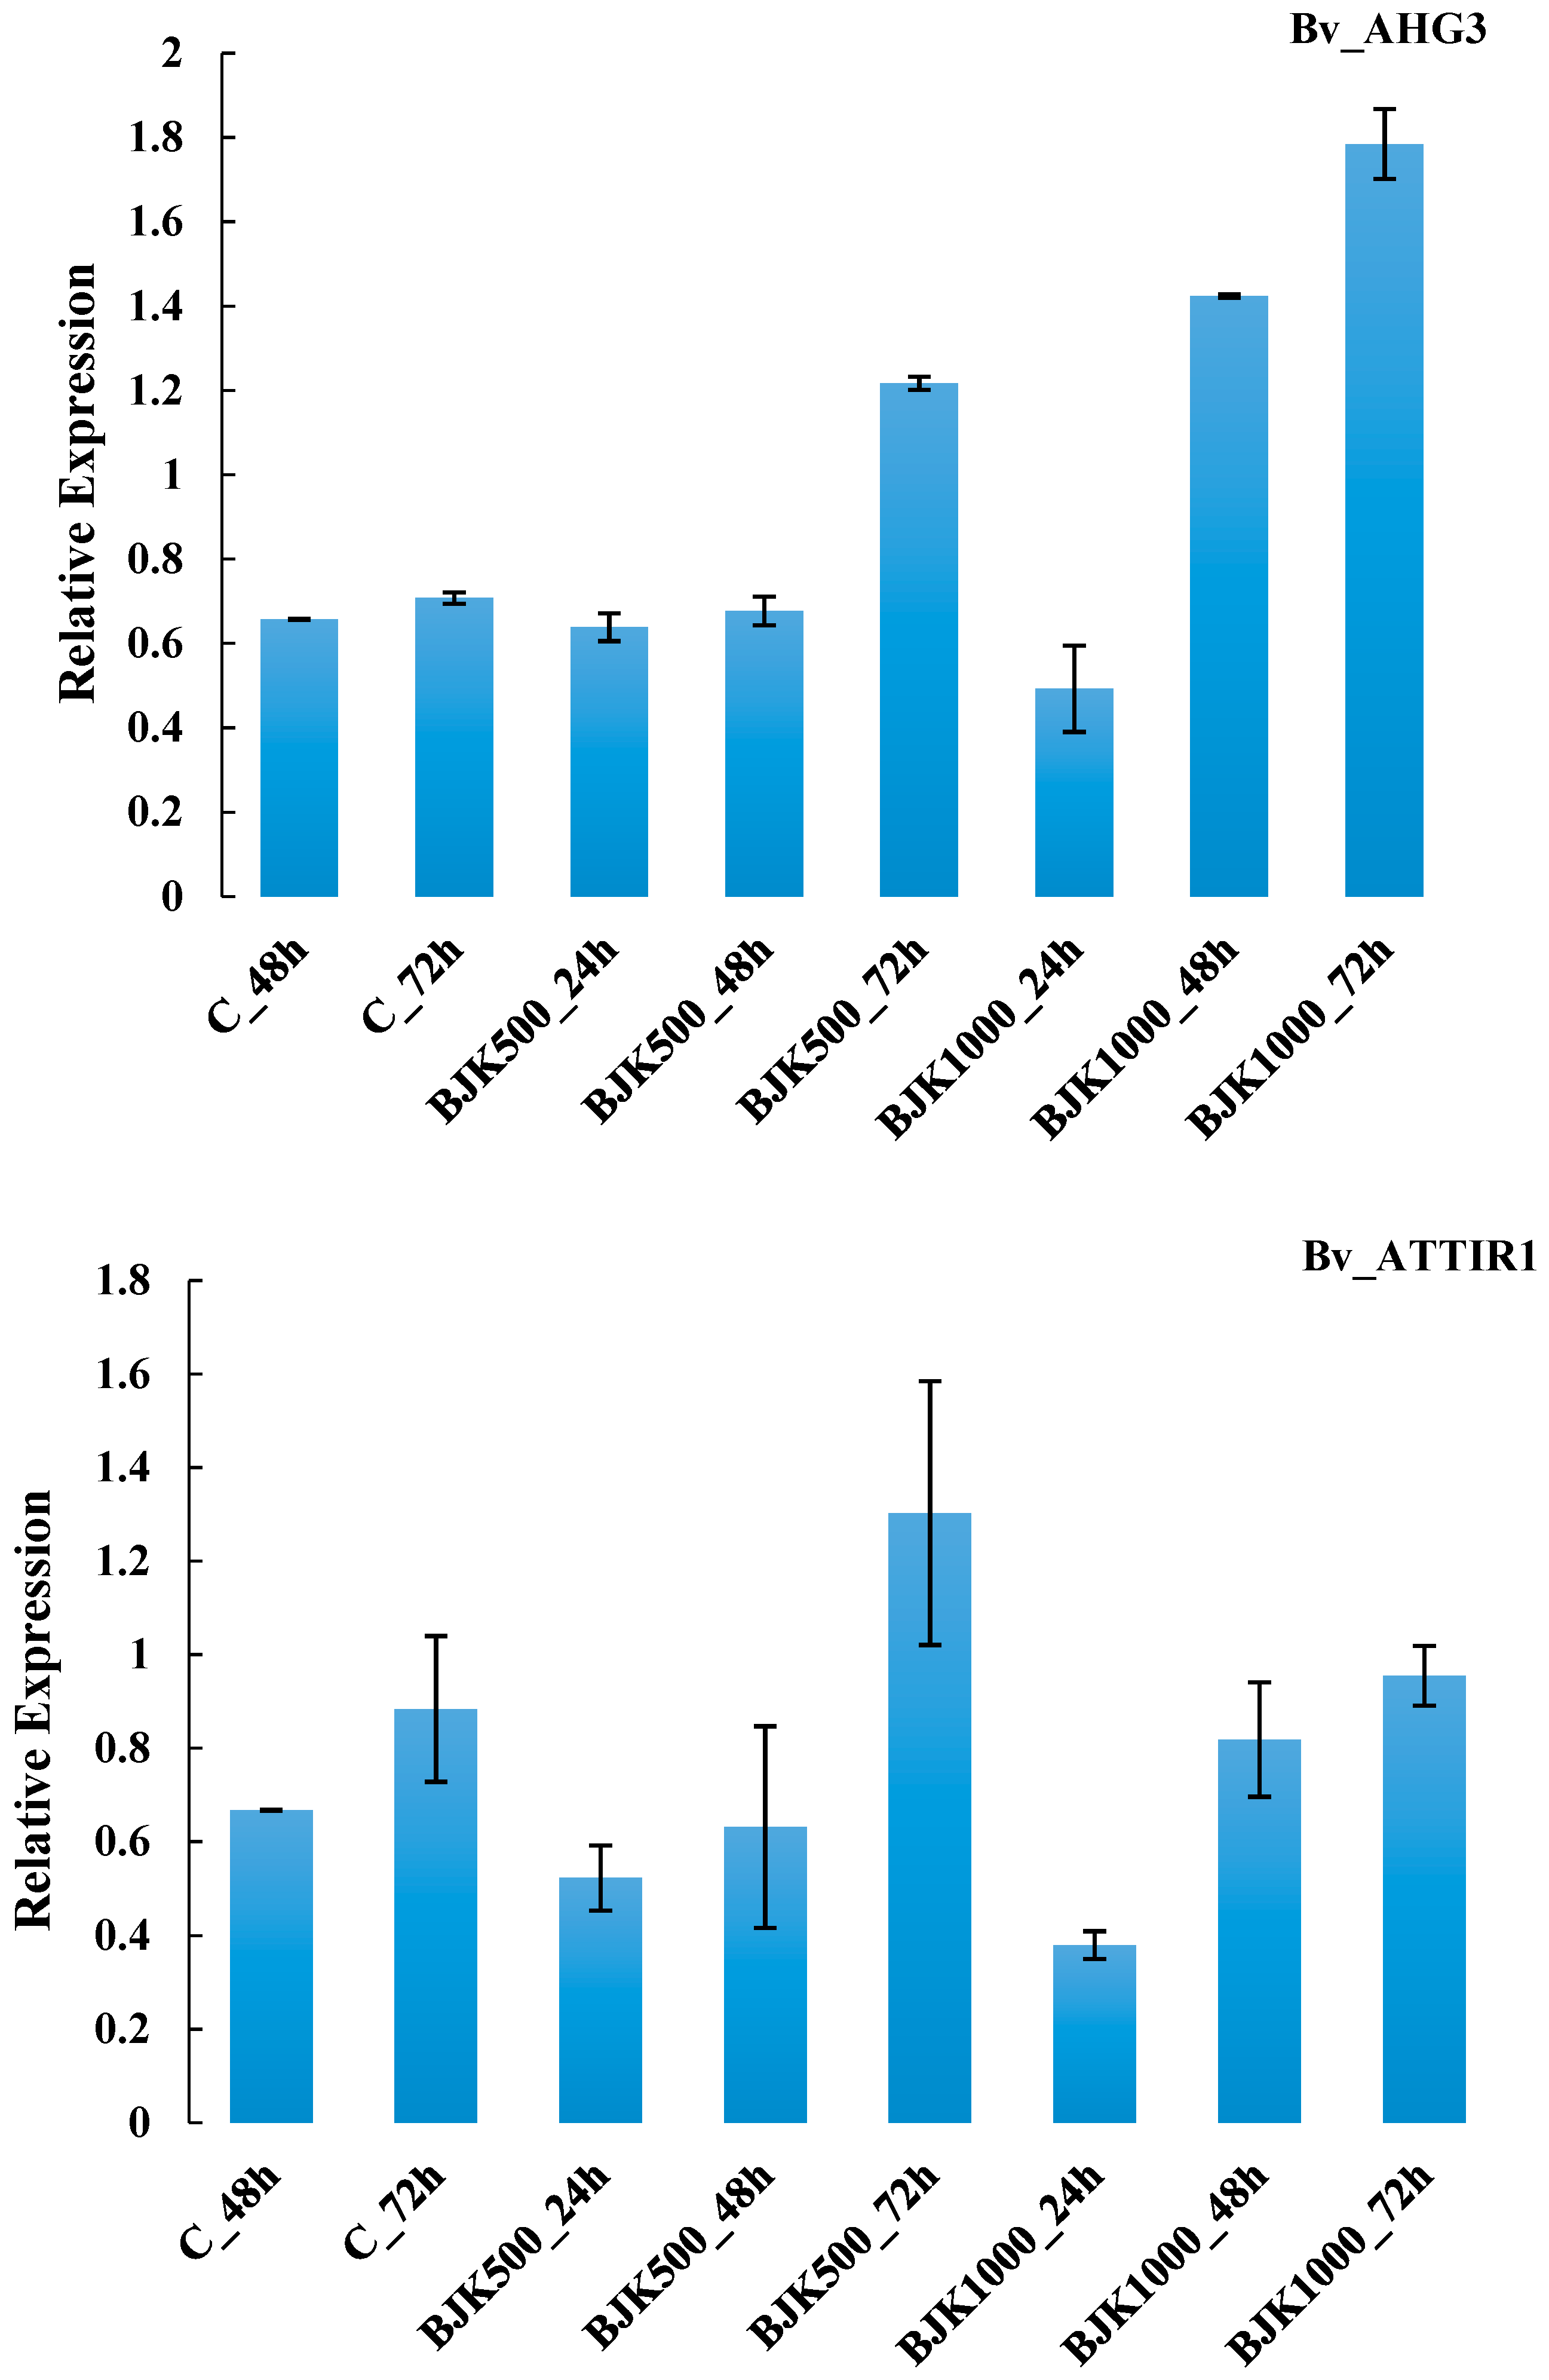
| G15 | Bv_AHG3 | hormone metabolism, abscisic acid signal transduction | ||
| G16 | Bv_LAX1 | hormone metabolism, auxin signal transduction | ||
| G17 | Bv_ATTIR1 | hormone metabolism, auxin signal transduction | ||
| G18 | Bv_PIN1 | hormone metabolism, auxin signal transduction | ||
| G19 | Bv_LAX2 | hormone metabolism, auxin signal transduction | ||
| G20 | Bv_PIN3 | hormone metabolism, auxin signal transduction | ||
| G21 | Bv_SAUR | hormone metabolism, auxin induced-regulated-responsive-activated | ||
| G22 | Bv_CKX3 | hormone metabolism, cytokinin synthesis-degradation | 1.5.99.12 | |
| G23 | Bv_AHK2 | hormone metabolism, cytokinin signal transduction | ||
| G24 | Bv_CKDHase | hormone metabolism, cytokinin synthesis-degradation | 1.5.99.12 | |
| G25 | Bv_2OGD | hormone metabolism, gibberelin synthesis-degradation | ||
| G26 | Bv_GID1C | hormone metabolism, gibberelin signal transduction | ||
| G27 | Bv_GRP | hormone metabolism, gibberelin induced-regulated-responsive-activated | ||
| G28 | Bv_GAST1 | hormone metabolism, gibberelin induced-regulated-responsive-activated | ||
| G29 | Bv_GASA14 | hormone metabolism, gibberelin induced-regulated-responsive-activated | ||
| G30 | Bv_SAMT1 | hormone metabolism, salicylic acid synthesis-degradation | ||
| G31 | Bv_SAMT2 | hormone metabolism.salicylicacid.synthesis-degradation.synthesis.methyl-SA methyl esterase | ||
| G32 | Bv_HSP | Abiotic stress | heat stress | |
| G33 | Bv_sah | heat stress | ||
| G34 | Bv_HPO3 | cold stress | ||
| G35 | Bv_PMT21 | drought/salt stresses | ||
| G36 | Bv_PMTI4 | drought/salt stresses | ||
| G37 | Bv_TXN | Oxidative stress | redox thioredoxin | |
| G38 | Bv_APX | redox ascorbate and glutathione ascorbate | ______________ | |
| G39 | Bv_GR | redox ascorbate and glutathione glutathione | ______________ | |
| G40 | Bv_FSD | redox dismutases and catalases | 1.15.1.1/1.11.1.6 | |
| G41 | Bv_CAT | redox dismutases and catalases | 1.15.1.1/1.11.1.6 | |
| G42 | Bv_CZSOD | redox dismutases and catalases | 1.15.1.1/1.11.1.6 | |
| G43 | Bv_CBR | redox misc | ||
| G44 | Bv_TIM | DNA synthesis/repair | protein targeting mitochondria | |
| G45 | Bv_MY10 | DNA synthesis/chromatin structure | ||
| G46 | Bv_DRT111 | DNA repair | ||
| G47 | CRK27 | Signal transduction pathway | signalling receptor kinases., leucine rich repeat I | |
| G48 | IKU2 | signalling receptorkinases, leucine rich repeat XI | ||
| G51 | SFH3 | signallingin sugar and nutrient physiology | ||
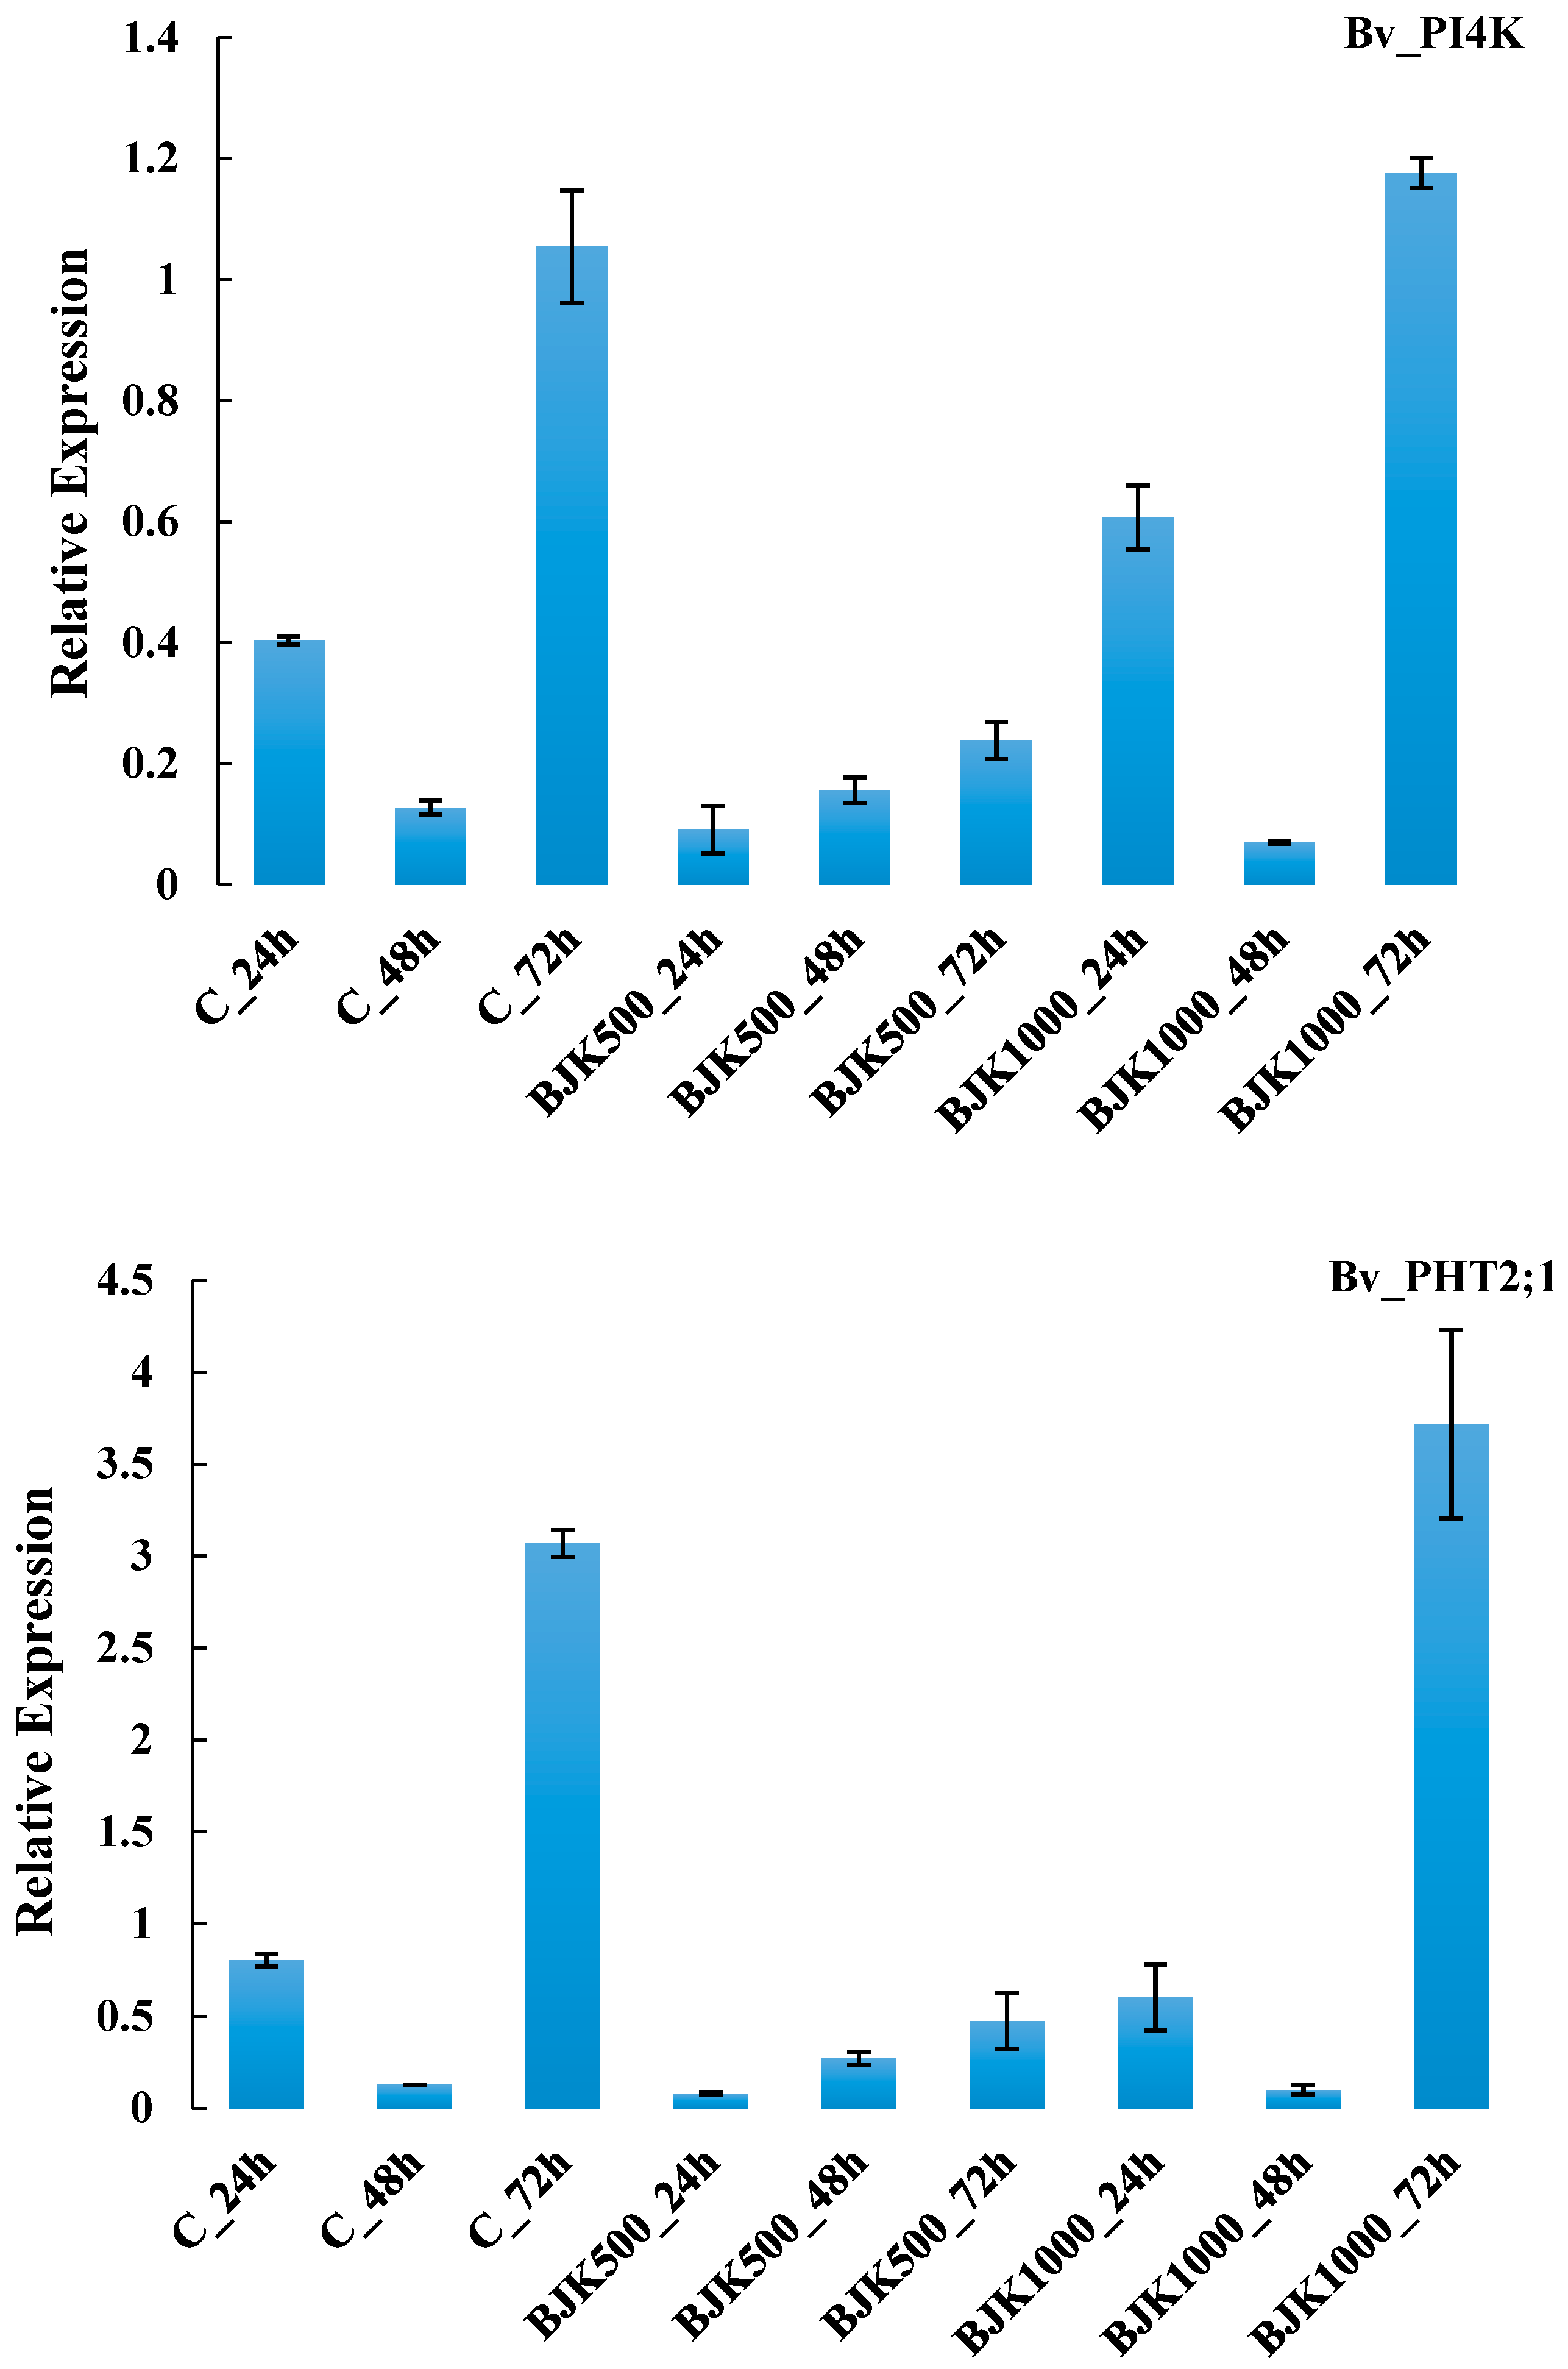
| G52 | Bv_PI4K | signalling phosphinositides | ||
| G49 | ABCI6 | Protein assembly | protein targeting secretory pathway | |
| G50 | EXO | protein assembly and cofactor ligation | ||
| G53 | GABAt1 | Nutrient uptake | transport amino acids | |
| G54 | PHT1-3 | transport phosphatase | ||
| G55 | Bv_PHT2;1 | transport phosphatase | ||
| G56 | Bv_VHP1 | transport H+ transporting pyrophosphatase | 3.6.1.1 | |
| BLACKJAK | Statistic | Trait | |||
|---|---|---|---|---|---|
| Sugar Content (%) | Sugar Yield (t ha−1) | Sodium (mmol 100g−1) | Potassium (mmol 100g−1) | ||
| Untreated | Mean | 12.74 | 12.63 | 2.26 | 3.25 |
| STDEV | 0.4 | 0.92 | 0.12 | 0.49 | |
| Treated | Mean | 12.88 | 13.55 | 2.07 | 3.14 |
| STDEV | 0.49 | 1.12 | 0.1 | 0.46 | |
| Code | Gene ID | Mean Squares | ||||
|---|---|---|---|---|---|---|
| Treatment (T) | Exposure (E) | T × E | Error | Relative Expression (RE) | ||
| G2 | Bv_6PGD | 0.0043 | 0.0223 * | 0.002 | 0.0035 | 0.1416 |
| G3 | Bv_R5PI | 0.0052 | 0.0215 | 0.0045 | 0.007 | 0.1562 |
| G4 | Bv_UQCRH | 0.0265 | 0.4461 ** | 0.112 | 0.0546 | 0.447 |
| G5 | Bv_UQCR7 | 0.081 | 0.0377 | 0.1093 | 0.0325 | 0.4909 |
| G6 | Bv_QCO | 0.0008 ** | 0.0003 ** | 0.0002 ** | 0.00001 | 0.0316 |
| G7 | Bv_PEI | 0.0005 | 0.0056 | 0.0006 | 0.0013 | 0.0873 |
| G8 | Bv_SAC2 | 0.0006 ** | 0.0003 ** | 0.0005 ** | 0.00001 | 0.0281 |
| G9 | Bv_AOAT1 | 0.3806 ** | 0.5031 ** | 0.2094 ** | 0.004 | 0.458 |
| G10 | ATP-PRT2 | 0.0036 ** | 0.0066 ** | 0.0032 ** | 0.00008 | 0.0995 |
| G11 | Bv_GLT1 | 0.0067 | 0.3501 ** | 0.8100 * | 0.0174 | 0.7757 |
| G12 | Bv_GLN1 | 0.5487 ** | 1.9005 ** | 0.0561 | 0.0267 | 1.4838 |
| G13 | Bv_AREB1 | 0.00004 | 0.0002 * | 0.00001 | 0.00003 | 0.0158 |
| G14 | Bv_HAB1 | 0.000001 | 0.00004 * | 0.00001 | 0.000007 | 0.02499 |
| G15 | Bv_AHG3 | 0.0585 | 0.0427 | 0.3608 ** | 0.0339 | 0.9499 |
| G16 | Bv_LAX1 | 0.00005 | 0.00017 | 0.00006 | 0.00016 | 0.03032 |
| G17 | Bv_ATTIR1 | 0.0047 | 0.1016 | 0.0006 | 0.0397 | 0.7697 |
| G18 | Bv_PIN1 | 0.0023 | 0.0005 | 0.0258 | 0.0025 | 0.4049 |
| G19 | Bv_LAX2 | 0.000003 | 0.000005 | 0.000006 | 0.00007 | 0.0451 |
| G20 | Bv_PIN3 | 0.00000008 | 0.0000003 | 0.0000001 | 0.000001 | 0.0037 |
| G33 | Bv_sah | 0.00000008 | 0.00000003 | 0.00000001 | 0.000001 | 0.0037 |
| G42 | Bv_CZSOD | 0.0009 ** | 0.0057 ** | 0.0108 ** | 0.00003 | 0.0819 |
| G43 | Bv_CBR | 0.0004 * | 0.0016 ** | 0.0004 ** | 0.00006 | 0.0205 |
| G44 | Bv_TIM | 0.0300 ** | 0.0655 ** | 0.0139 ** | 0.0007 | 0.139 |
| G45 | Bv_MY10 | 0.0031 ** | 0.0088 ** | 0.0042 ** | 0.00009 | 0.0691 |
| G46 | Bv_DRT111 | 0.0335 ** | 0.0241 ** | 0.0103 ** | 0.0012 | 0.1162 |
| G48 | IKU2 | 0.0091 ** | 0.0150 ** | 0.0058 ** | 0.0002 | 0.0854 |
| G51 | SFH3 | 0.0464 ** | 0.767 ** | 0.0233 ** | 0.0006 | 0.1764 |
| G52 | Bv_PI4K | 0.3502 ** | 0.7668 ** | 0.1543 ** | 0.0033 | 0.436 |
| G50 | EXO | 0.00001 ** | 0.00002 ** | 0.00004 ** | 0.000001 | 0.00619 |
| G54 | PHT1-3 | 0.0857 * | 0.1624 ** | 0.0461 | 0.0166 | 0.1811 |
| G55 | Bv_PHT2;1 | 2.5789 ** | 8.8989 ** | 1.8073 ** | 0.0722 | 1.0261 |
| G56 | Bv_VHP1 | 0.0658 * | 0.1954 ** | 0.0538 * | 0.0098 | 0.1529 |
© 2019 by the authors. Licensee MDPI, Basel, Switzerland. This article is an open access article distributed under the terms and conditions of the Creative Commons Attribution (CC BY) license (http://creativecommons.org/licenses/by/4.0/).
Share and Cite
Hajizadeh, H.S.; Heidari, B.; Bertoldo, G.; Della Lucia, M.C.; Magro, F.; Broccanello, C.; Baglieri, A.; Puglisi, I.; Squartini, A.; Campagna, G.; et al. Expression Profiling of Candidate Genes in Sugar Beet Leaves Treated with Leonardite-Based Biostimulant. High-Throughput 2019, 8, 18. https://doi.org/10.3390/ht8040018
Hajizadeh HS, Heidari B, Bertoldo G, Della Lucia MC, Magro F, Broccanello C, Baglieri A, Puglisi I, Squartini A, Campagna G, et al. Expression Profiling of Candidate Genes in Sugar Beet Leaves Treated with Leonardite-Based Biostimulant. High-Throughput. 2019; 8(4):18. https://doi.org/10.3390/ht8040018
Chicago/Turabian StyleHajizadeh, Hanifeh Seyed, Bahram Heidari, Giovanni Bertoldo, Maria Cristina Della Lucia, Francesco Magro, Chiara Broccanello, Andrea Baglieri, Ivana Puglisi, Andrea Squartini, Giovanni Campagna, and et al. 2019. "Expression Profiling of Candidate Genes in Sugar Beet Leaves Treated with Leonardite-Based Biostimulant" High-Throughput 8, no. 4: 18. https://doi.org/10.3390/ht8040018
APA StyleHajizadeh, H. S., Heidari, B., Bertoldo, G., Della Lucia, M. C., Magro, F., Broccanello, C., Baglieri, A., Puglisi, I., Squartini, A., Campagna, G., Concheri, G., Nardi, S., & Stevanato, P. (2019). Expression Profiling of Candidate Genes in Sugar Beet Leaves Treated with Leonardite-Based Biostimulant. High-Throughput, 8(4), 18. https://doi.org/10.3390/ht8040018