1. Introduction
Pain is an unpleasant sensation as described in the definition by the International Association for the Study of Pain. It is defined as “an unpleasant sensory and emotional experience associated with, or resembling that associated with, actual or potential tissue damage” [
1]. Pain has a negative impact on patients’ mood, personality and social relationships, which affects quality of life and, consequently, creates economic losses due to impacts on the labor force [
2,
3,
4,
5]. Many people who experience pain and associated unpleasantness take medication to relieve pain [
6].
To assess the intensity of pain, currently, the following subjective methods are used in clinical practice: the visual analogue scale (VAS), numerical rating scale (NRS), face rating scale (FRS), and verbal rating scale (VRS). Among these methods, VAS is the most accurate and reproducible scale [
7] and is frequently used in pain research as well as in clinical practice [
8]. However, the following problems are associated with the VAS: (1) Patients must have a certain level of ability and understanding of the VAS to evaluate their pain [
9,
10]. (2) Patients’ standards of pain intensity differ; the term “maximum imaginable pain” is obscure and it is difficult to determine its intensity, regardless of a patient’s understanding of the VAS [
11]. (3) Sometimes physicians cannot properly evaluate the intensity of a patient’s pain with such subjective pain assessments, and they may underestimate the patient’s pain [
12].
Thus, researchers have recently attempted to develop objective pain assessment methods [
13]. In a review article reporting on the objective assessment of pain, it was stated that a patient’s facial expression, as assessed by the Facial Action Cording System (FACS), may be a good objective indicator of pain because clinicians generally read pain intensity in patients from their facial expression [
13].
The corrugator, orbicularis oculus, upper lip elevator, zygomaticus major and laugh muscles are verified as muscles used to express pain [
14,
15]. Among these facial muscles, the corrugator muscle is considered the most pain-related muscle because corrugator muscle activity showed the strongest association with intensity of pain stimulation compared with other facial muscles [
16,
17,
18]. Increases in surface electromyography (sEMG) of corrugator muscle activity during pain elicited by laser [
16], thermal [
17,
18] or electrical [
18] stimulation have been reported. However, there are no reports of corrugator muscle activity due to pain elicited with the pressure stimulation that is used in palpation in the clinical field.
Pressure stimulation with the fingers is often used to induce tenderness and determine the area and intensity of pain, such as skeletal muscle pain, in patients [
19]. Conventionally, such pain induced by manual pressure stimulation is assessed exclusively by subjective methods (e.g., VAS). If corrugator muscle activity with pressure pain stimulation can be captured by sEMG, subjectively assessed pain could be co-evaluated with an objective pain assessment.
Therefore, it is important to reveal the relationship between subjective and objective methods in pain assessment. However, the relationship between corrugator muscle activity and the pain intensity assessed by subjective methods such as the VAS has not yet been reported. If the intensity of pain elicited by pressure pain stimulation can be assessed both objectively and subjectively, patients/clinicians can receive/provide more appropriate medical care to relieve pain. Further, objective pain evaluation becomes possible using sEMG in palpation.
The purpose of this study was to investigate activity of the corrugator muscle associated with pain elicited by pressure stimulation and the relationship between its activity and pain and unpleasantness intensity assessed by the VAS in healthy participants to establish an objective pain assessment method using sEMG.
2. Methods
This study was approved by the Ethics Committee of Tokyo Ariake University of Medical and Health Sciences (Tokyo Ariake University of Medical and Health Sciences, approval no. 366, date of approval: 17 December 2021).
2.1. Participants
A total of 14 healthy adults (12 males and 2 females; age of 20.0 ± 2.1 years; height of 166.9 ± 6.1 cm; weight of 64.4 ± 12.7 kg (mean ± SD)) with no pain participated in this study. Prior to the study trial, we informed the participants about the study protocol orally and by written explanation, which included possible disadvantages and allowed withdrawal from the study by the participant at his/her own free will. Then, we obtained their consent to participate in the study.
2.2. Pressure Stimulation
2.2.1. Point of Pressure Pain Stimulation
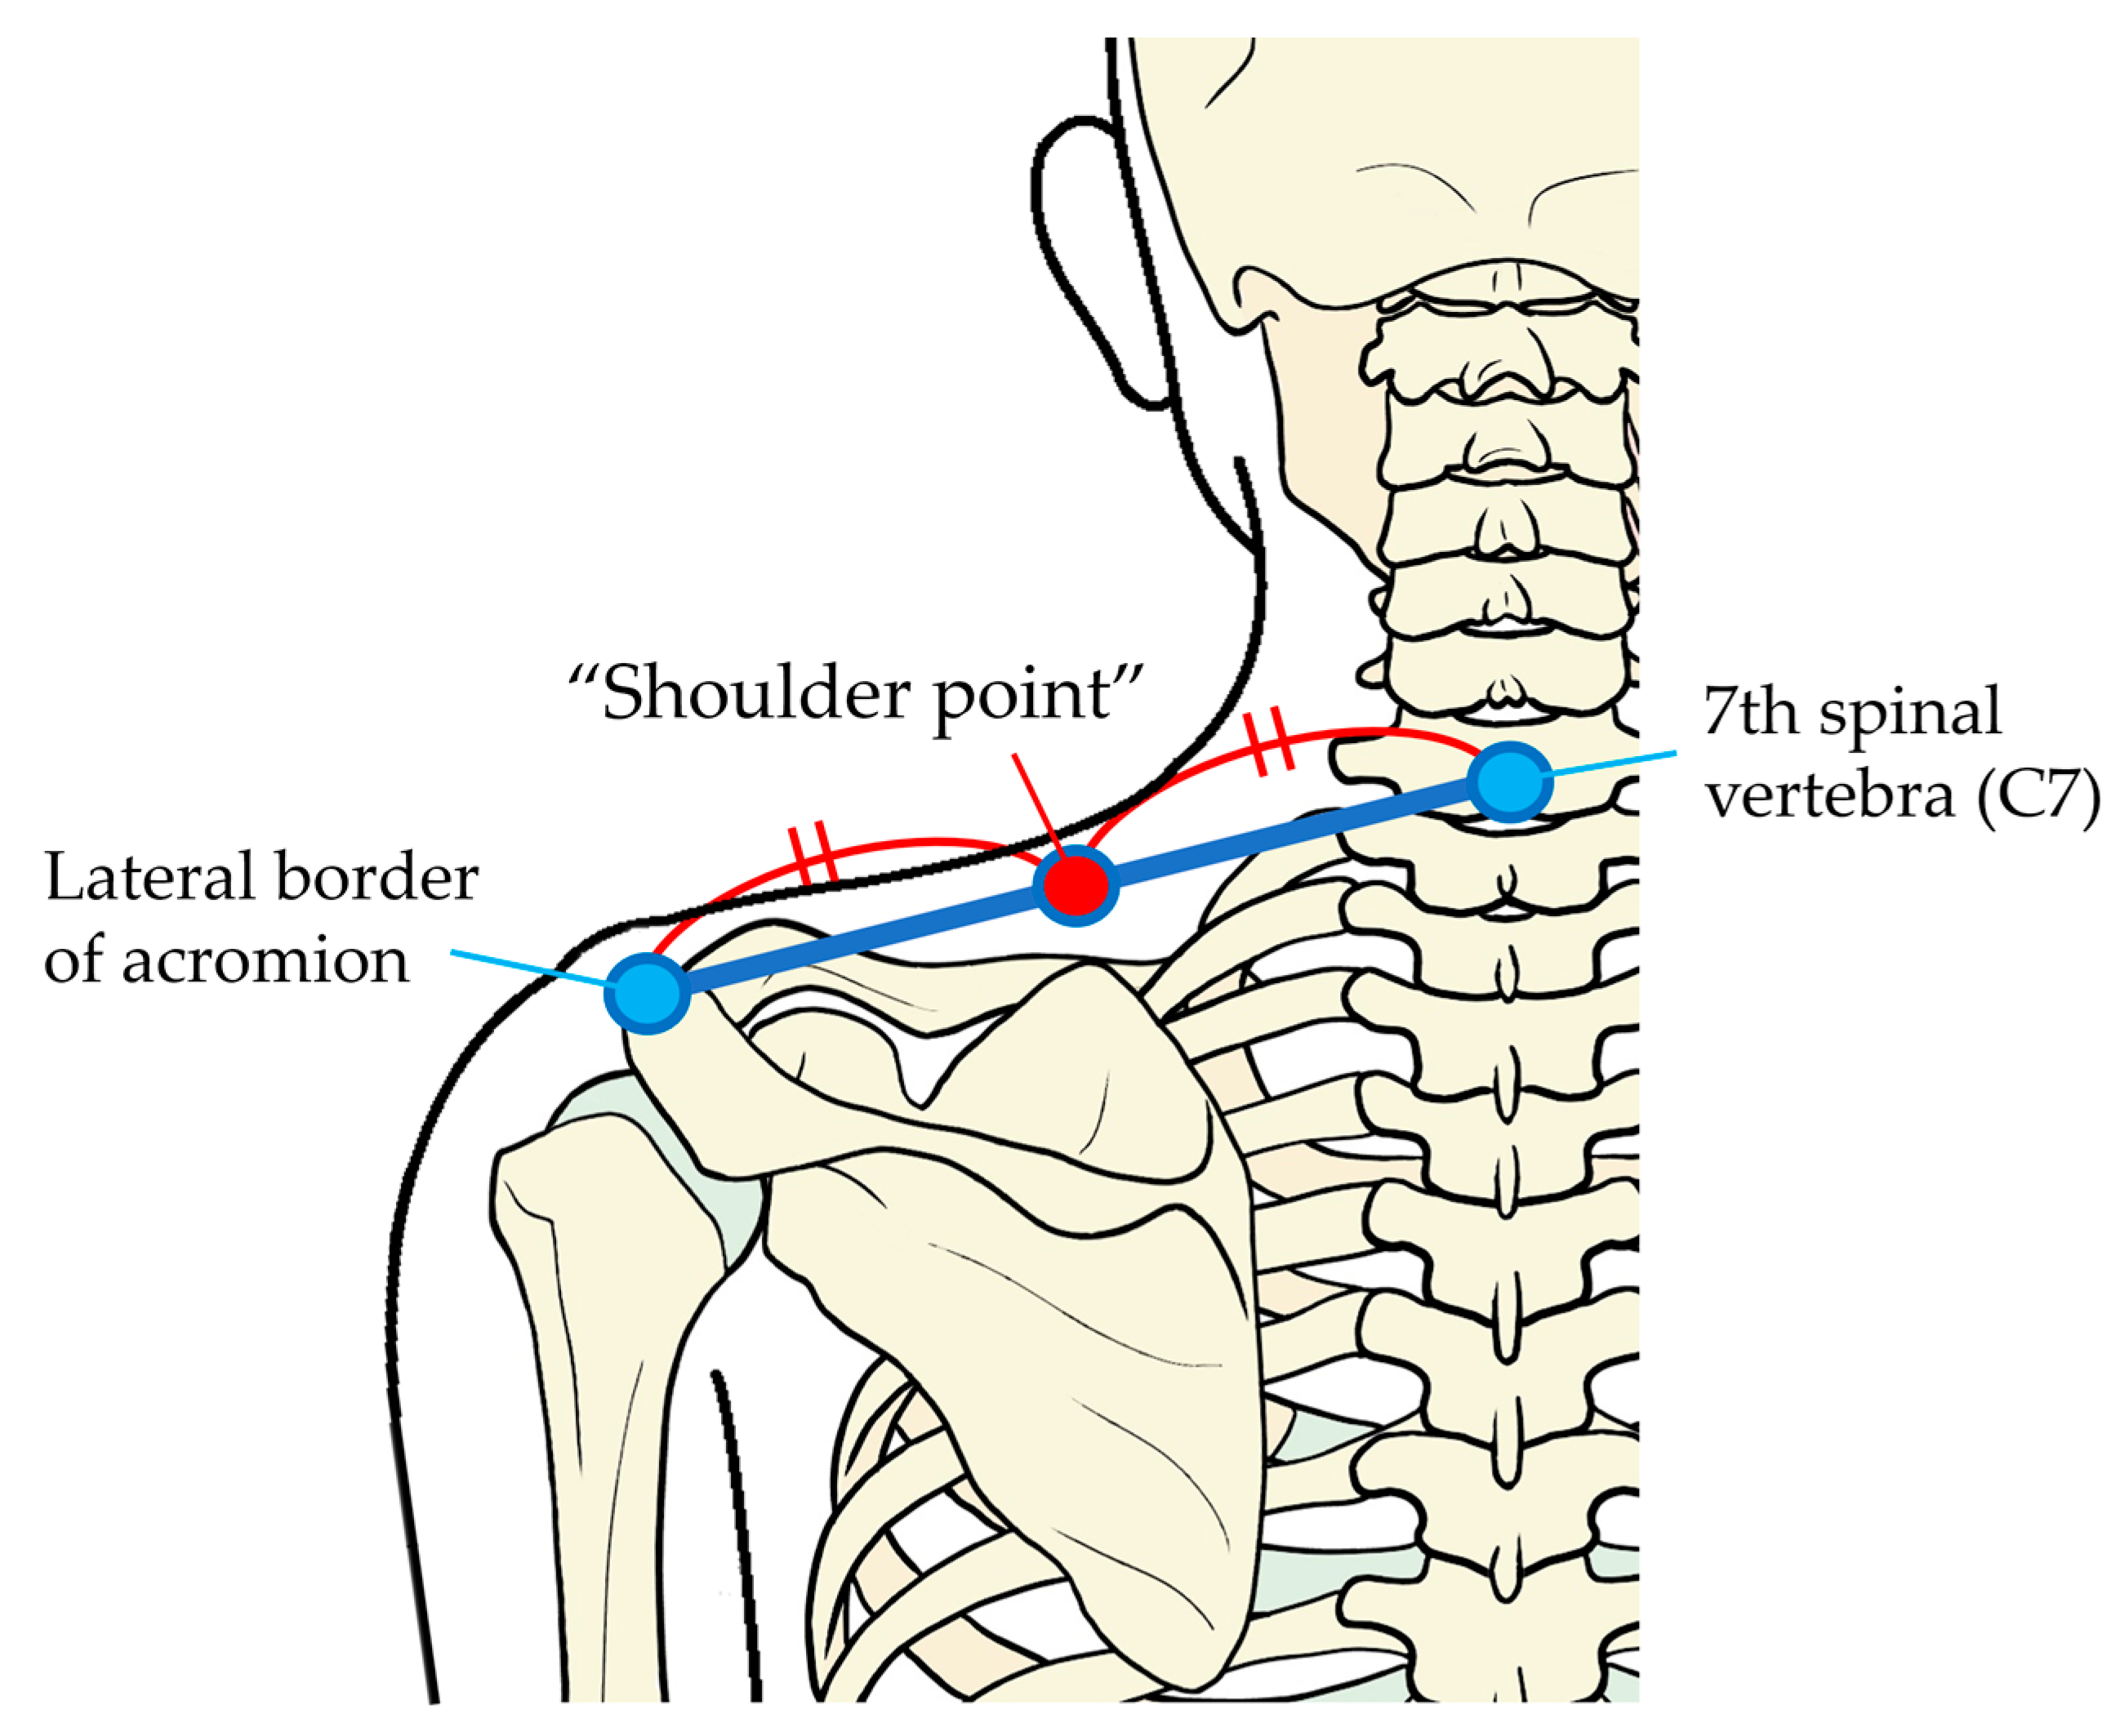
The pressure stimulation point was the midpoint between the seventh spinal vertebra and the center of the lateral border of acromion in the left, which we call the “shoulder point” in the following text (
Figure 1).
2.2.2. Pressure Pain Threshold
We used an algometer (Algometer Type II, SBMEDIC Electronics, Stockholm, Sweden) capable of providing quantitative pressure stimulation to measure pressure pain thresholds. Using this algometer, which digitally displays pressure intensity, pressure can be applied to the body at a constant rate of increasing pressure per second.
The pressure was applied to the shoulder point with a 0.5 cm2 circular probe at a rate of increase of 50 kPa per second starting from a nonpainful pressure level of 10 kPa. The pressure intensity at pain threshold was determined as the intensity at which participants felt pain and simultaneously pushed a button connected to the algometer to stop the measurement. We measured the pressure pain threshold three times for each participant, and the mean value was used for analysis.
2.2.3. Pressure Pain Stimulation
Twice the intensity of the pressure pain threshold in each participant was calculated as the intensity of pressure pain stimulation. Pressure pain stimulation was applied by a researcher to the shoulder point for 5 s using the algometer. The same pressure pain stimulation was applied three times with an interval of 30 s to each participant.
2.3. Measurement of Surface Electromyography (sEMG)
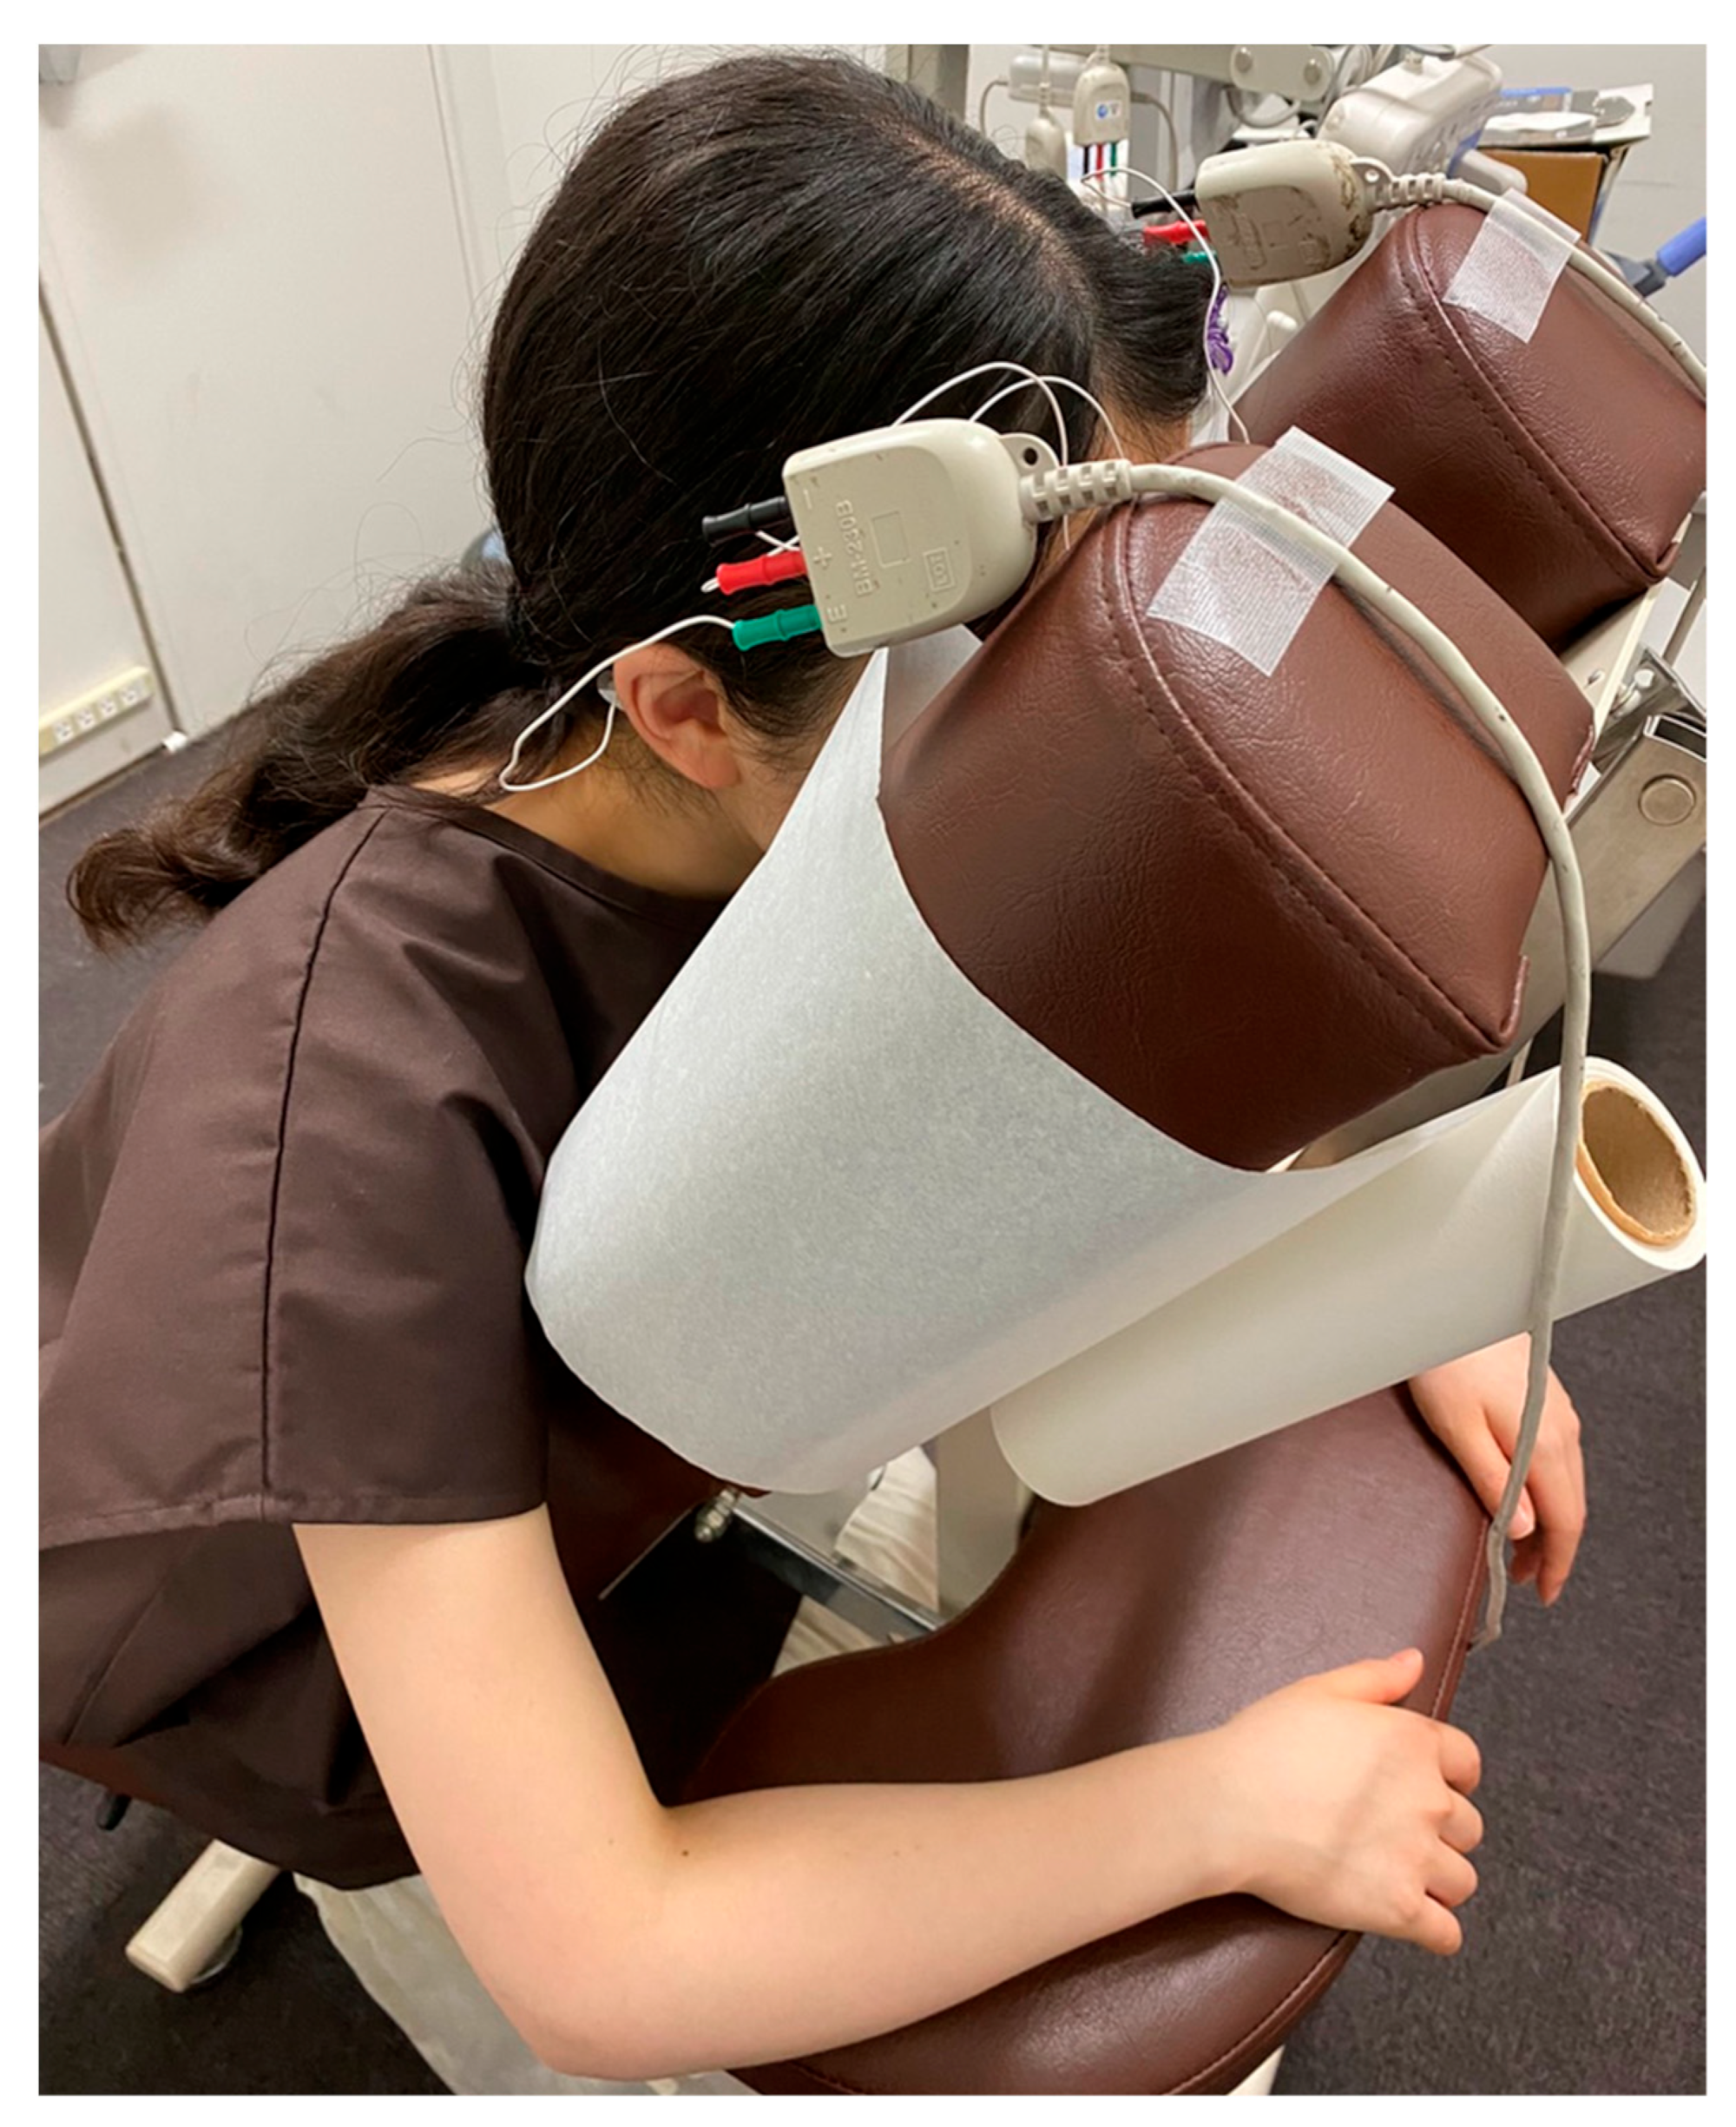
Each participant sat face down on bilateral head-support pads on a massage chair (Takada Bed Massage Chair, Quick Massage Round Chair N Type/TB-519, Osaka, Japan) without touching the center of the face (around the corrugator muscle) (
Figure 2).
To record corrugator muscle activity, surface electrodes (NSC electrode, NM-317Y3, NIHON KOHDEN CORPORATION, Tokyo, Japan) were attached to the intersection of a vertical line extending upward from the medial corner of the eyelid and a horizontal line extending from the upper edge of the eyebrow and to another point 10 mm lateral from the above-mentioned crossing point on both sides of the face. The grounded electrodes were attached to the left and right mastoid processes.
The sEMG of corrugator muscle activity was recorded by an electromyogram (Neuropack X1: MEB-2306, NIHON KOHDEN CORPORATION, Tokyo, Japan) with a sampling frequency at 1000 Hz and a bandpass filter of 20–500 Hz as used in previous studies [
18,
20]. Corrugator muscle activity at rest was recorded as the baseline sEMG for 5 s when it became stable. Then, sEMG recordings of corrugator muscle activity in participants immediately before, during and immediately after pressure pain stimulation for 5 s were performed by the bipolar derivation method, as in previous studies [
21]. At each measuring point, sEMG recordings were conducted three times in the same manner with an interval of 30 s.
To process the sEMG recordings, analysis software (Labchart, ADInstruments, Nagoya, Japan) was used. The sEMG recordings of corrugator muscle activity were A/D-converted every msec and integrated after full-wave rectification. The left and right integrated sEMG recordings of corrugator muscle activity were averaged to represent the muscle activity at each measurement for analysis. Then, the means before, during and after pressure pain stimulation were divided by the mean of baseline-integrated sEMG recordings. These values are expressed as a percentage (denoted as “% corrugator activity”).
2.4. Subjective Pain and Unpleasantness
Immediately after application of each of the three bouts of pressure pain stimulation to the shoulder point, the participant assessed the subjective intensity of the pain on a 100 mm visual analogue scale (VAS, 0: no pain; 100: maximum imaginable pain). At the same time, the intensity of unpleasantness associated with the pain was assessed on a 100 mm VAS (0: no unpleasantness; 100: maximum imaginable unpleasantness). If a participant felt pleasantness associated with pressure pain, he/she assessed the intensity of pleasantness on a 100 mm VAS (0: no pleasantness; 100: maximum imaginable pleasantness) [
22].
2.5. Experimental Procedures
The participants dressed in patients’ clothes and sat on a massage chair in a relaxed position (
Figure 2). The skin of the foreheads of participants was sterilized with 70% alcohol-soaked cotton and surface electrodes were attached to the above-mentioned points.
The researcher located and marked the shoulder point and measured pressure pain thresholds using the algometer. First, the sEMG of the baseline corrugator muscle activity was recorded for 5 s. Then, pressure pain stimulation was applied with the algometer to the shoulder point. sEMG recordings were made immediately before, during and immediately after pressure pain stimulation. After that, the participant assessed the intensity of pain and its unpleasantness on the VAS. In the same way, sEMG recordings and subjective pain and unpleasantness assessments were conducted three times at intervals of 30 s (
Figure 3).
2.6. Data Analysis
We performed statistical analysis using SPSS Statistics Version 29 (IBM Japan, Ltd., Tokyo, Japan). The Bonferroni test was used for between-group comparisons after a significant difference was revealed among % corrugator activity before, during and after pressure pain stimulation by the Friedman test. For the first, second and third measured % corrugator activity before, during and after pressure pain stimulation, pressure stimulation intensity (kPa), pressure pain VAS score and unpleasantness VAS score, the Bonferroni test was used for between-group comparisons when a significant difference was revealed by the Friedman test for among-group comparisons. Spearman’s correlation coefficient was used to analyze the relationship of % corrugator activity and pain and unpleasantness VAS scores for all measurements during pressure pain stimulation.
3. Results
3.1. Pressure Pain Threshold and Pressure Pain Stimulation
The pain thresholds measured in the 14 participants and the intensity of pressure pain stimulations were as follows. The mean ± SD (median) of the pressure pain threshold was 531.3 ± 192.5 (493.0) kPa. There was no significant difference in the mean ± SD (median) of the intensity of pressure pain stimulation: 1067.9 ± 355.3 (1127.5) kPa in the first measurement, 1038.1 ± 385.8 (962.0) kPa in the second measurement and 1059.5 ± 353.2 (1020.0) kPa in the third measurement.
3.2. Corrugator Muscle Activity before, during and after Pressure Pain Stimulation
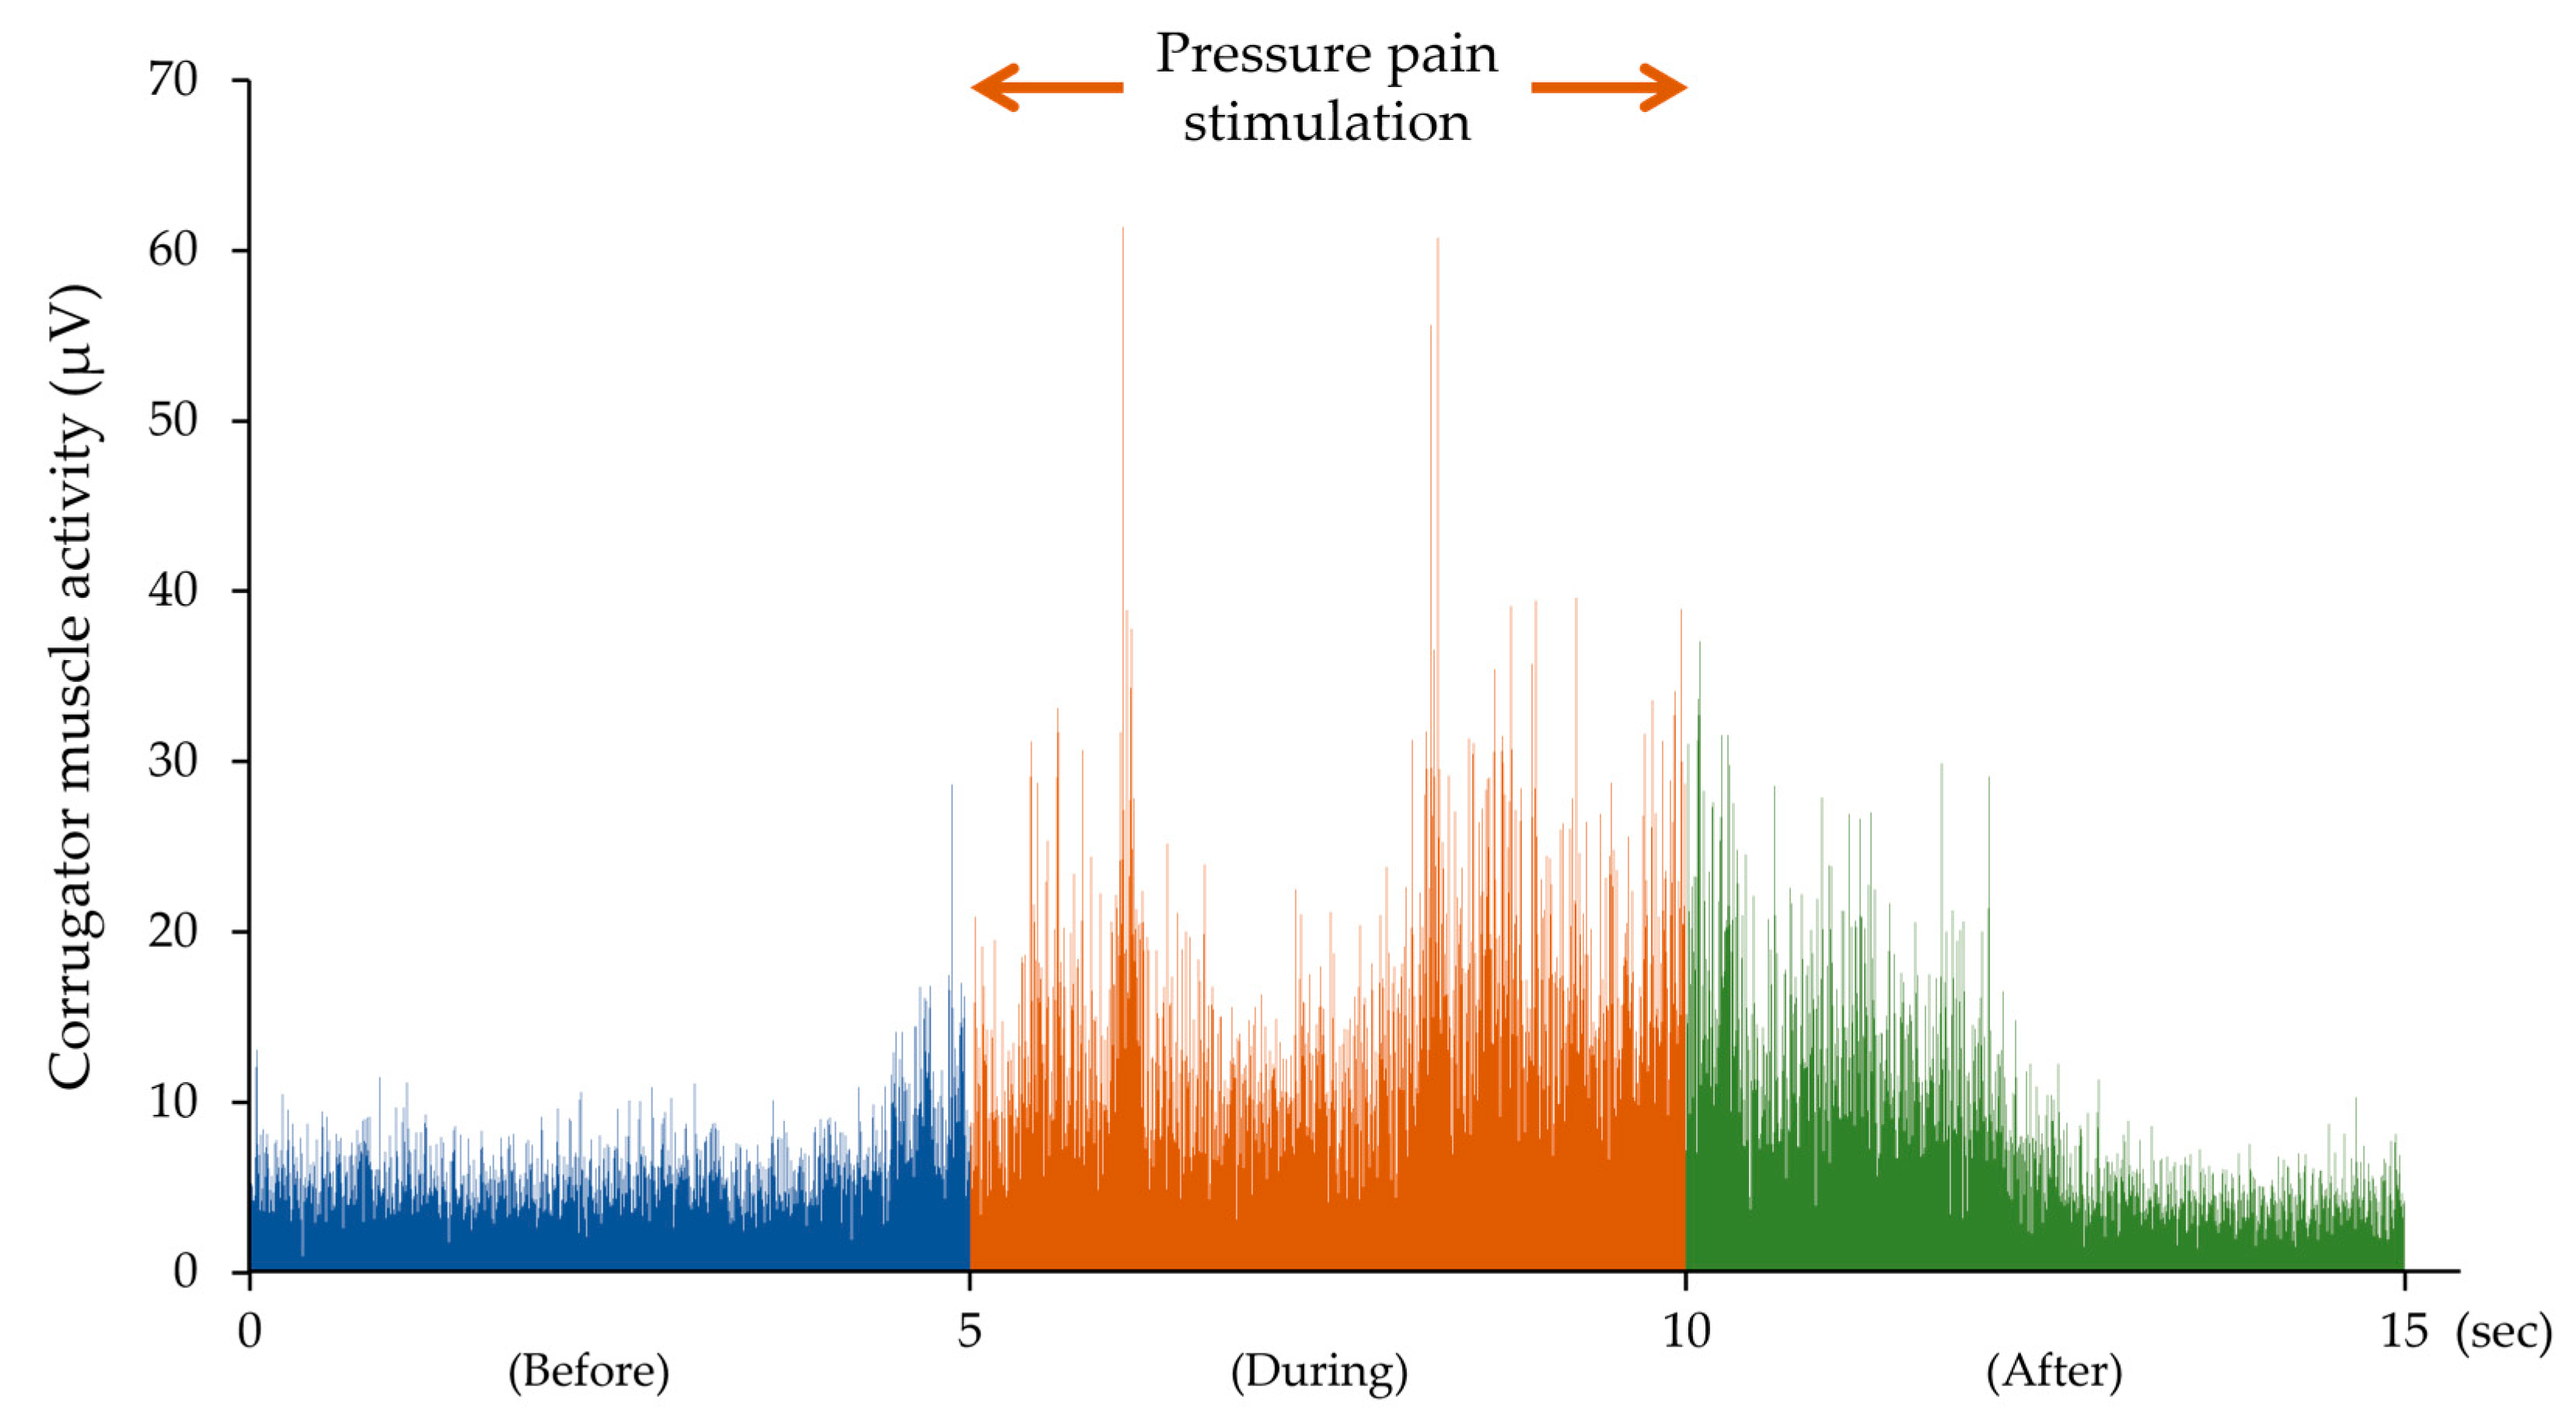
Corrugator muscle activity increased with pressure pain stimulation at the shoulder point.
Figure 4 shows an integrated sEMG of corrugator muscle activity before, during and after pressure pain stimulation after full-wave rectification in one participant.
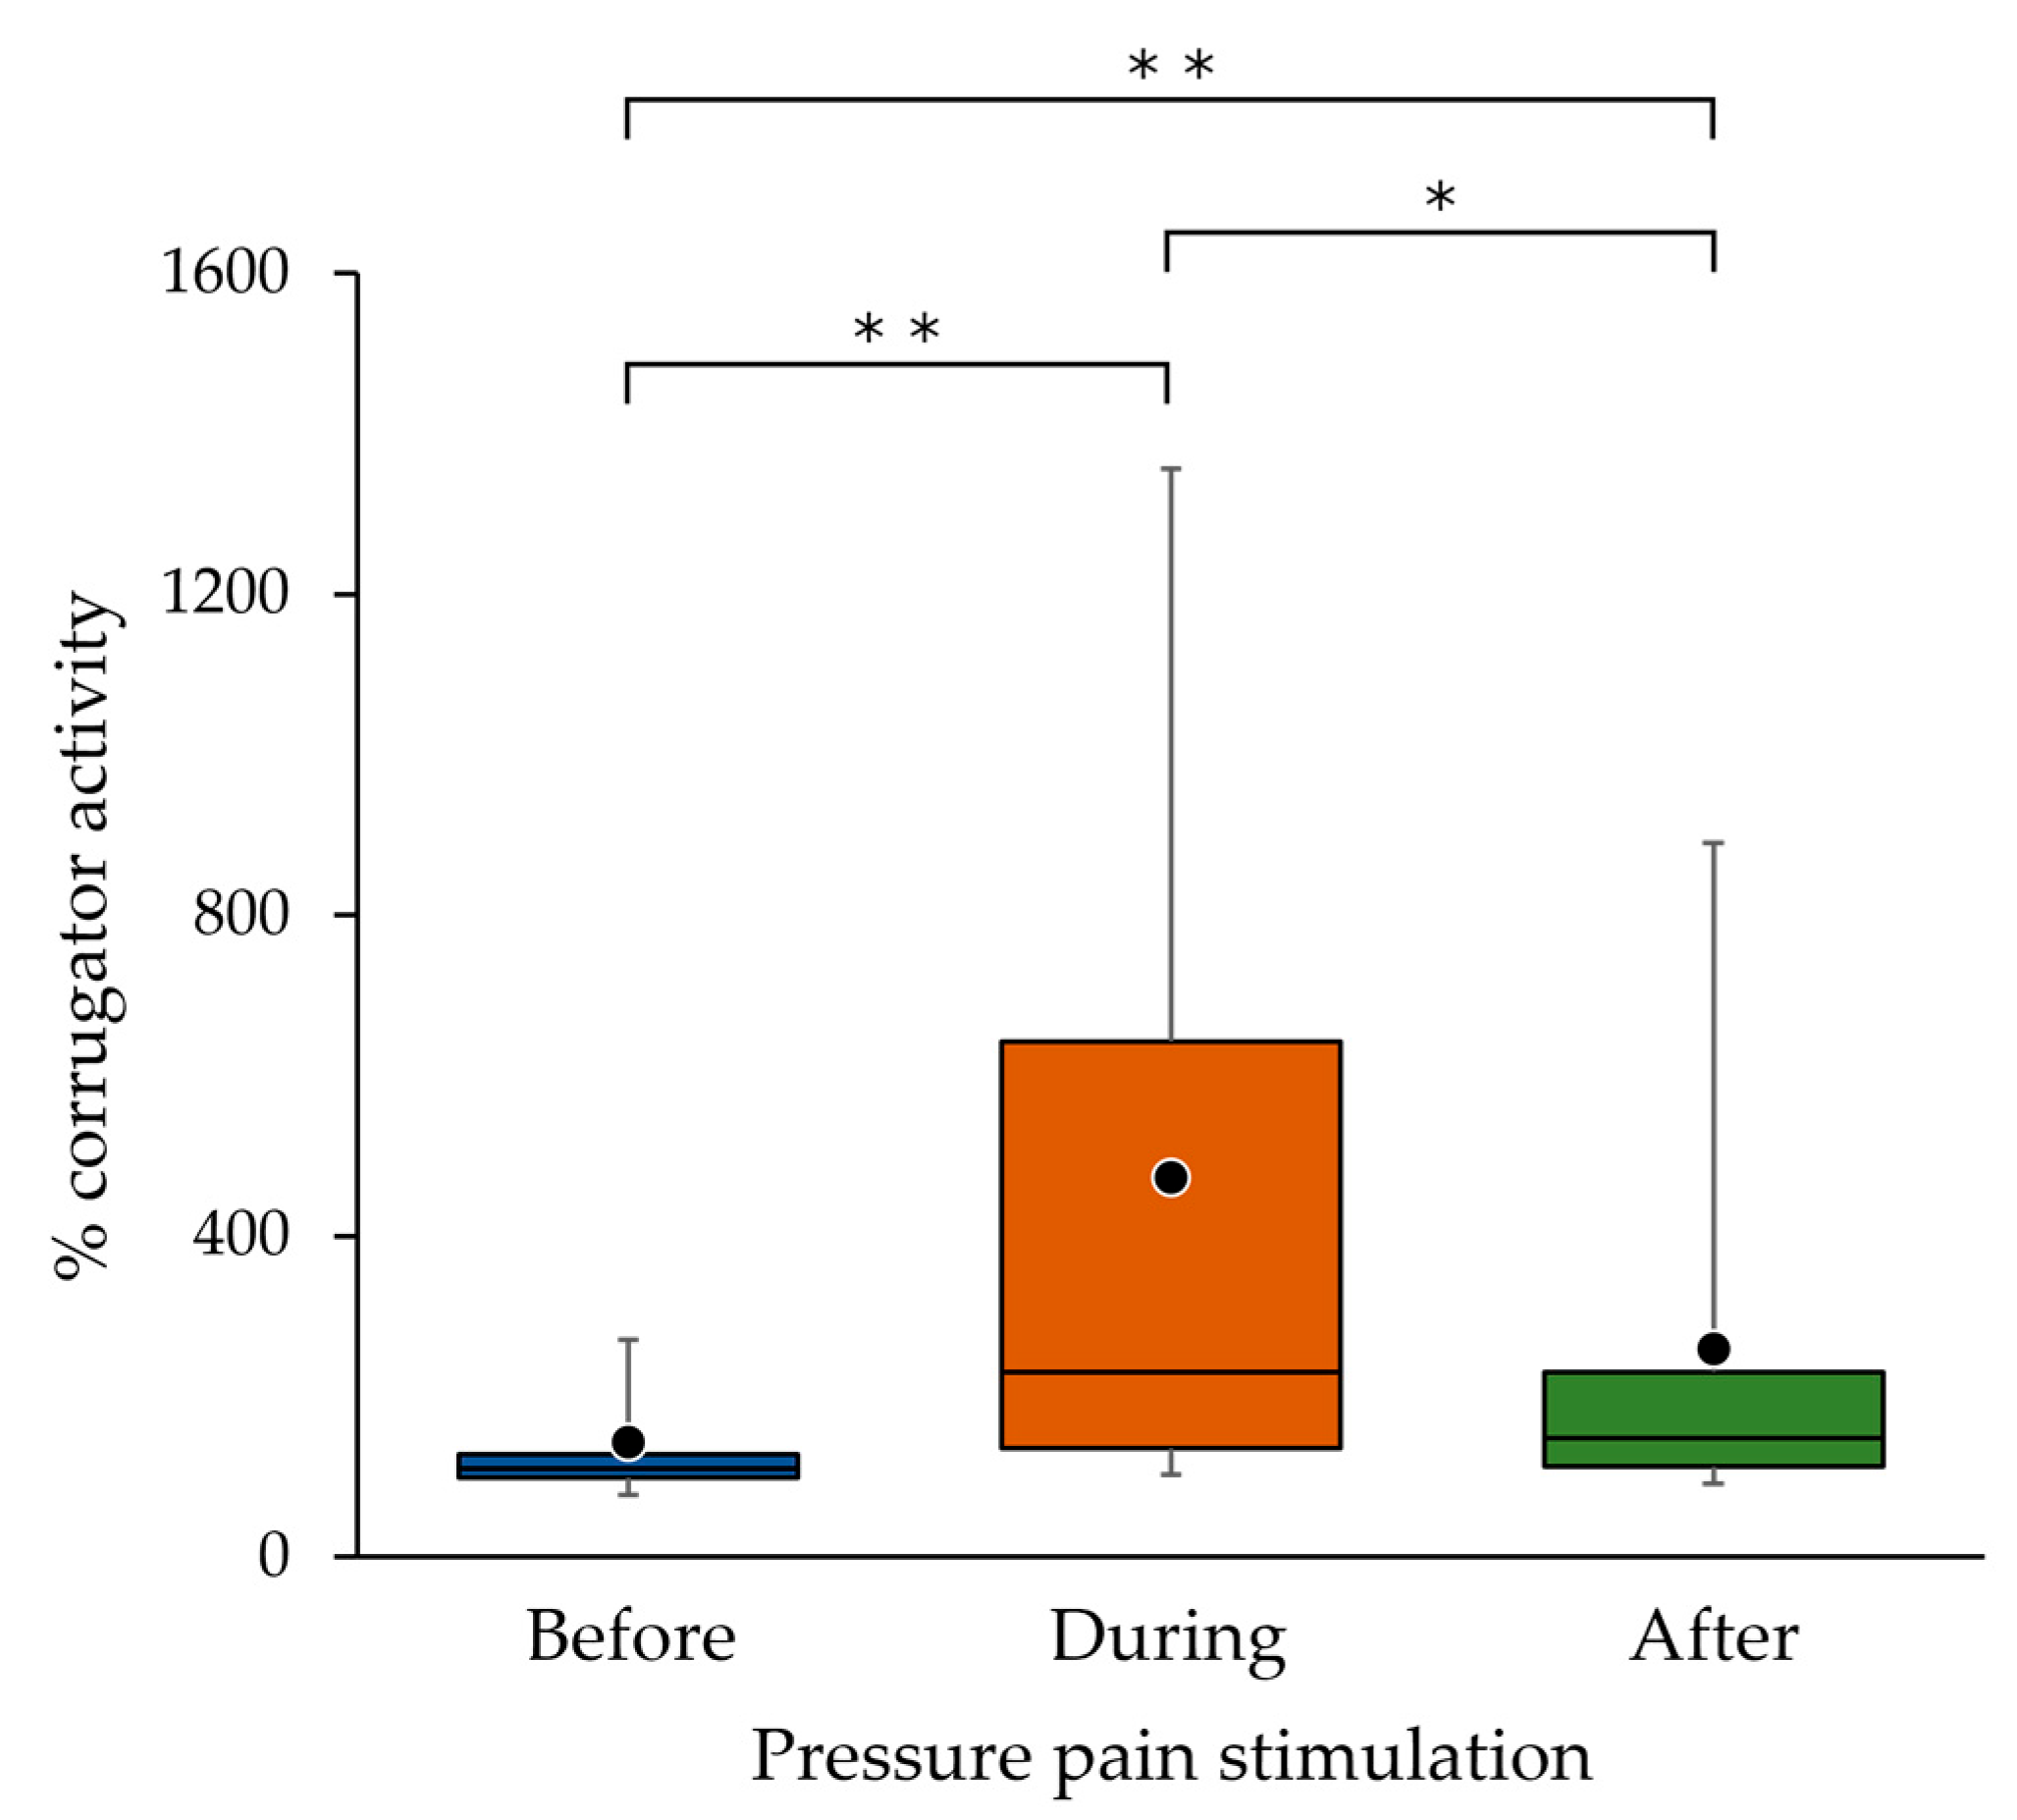
In the sEMG recordings of all participants, % corrugator activity during pressure pain stimulation was significantly higher than that before (
p < 0.001) and after (
p = 0.019) pressure pain stimulation, and % corrugator activity after pressure pain stimulation was significantly higher than that before pressure pain stimulation (
p = 0.007) (
Figure 5).
In two participants, the mean ratio of the three measurements for % corrugator activity during pressure pain stimulation to those before stimulation was less than 1.1 (0.99 and 1.06).
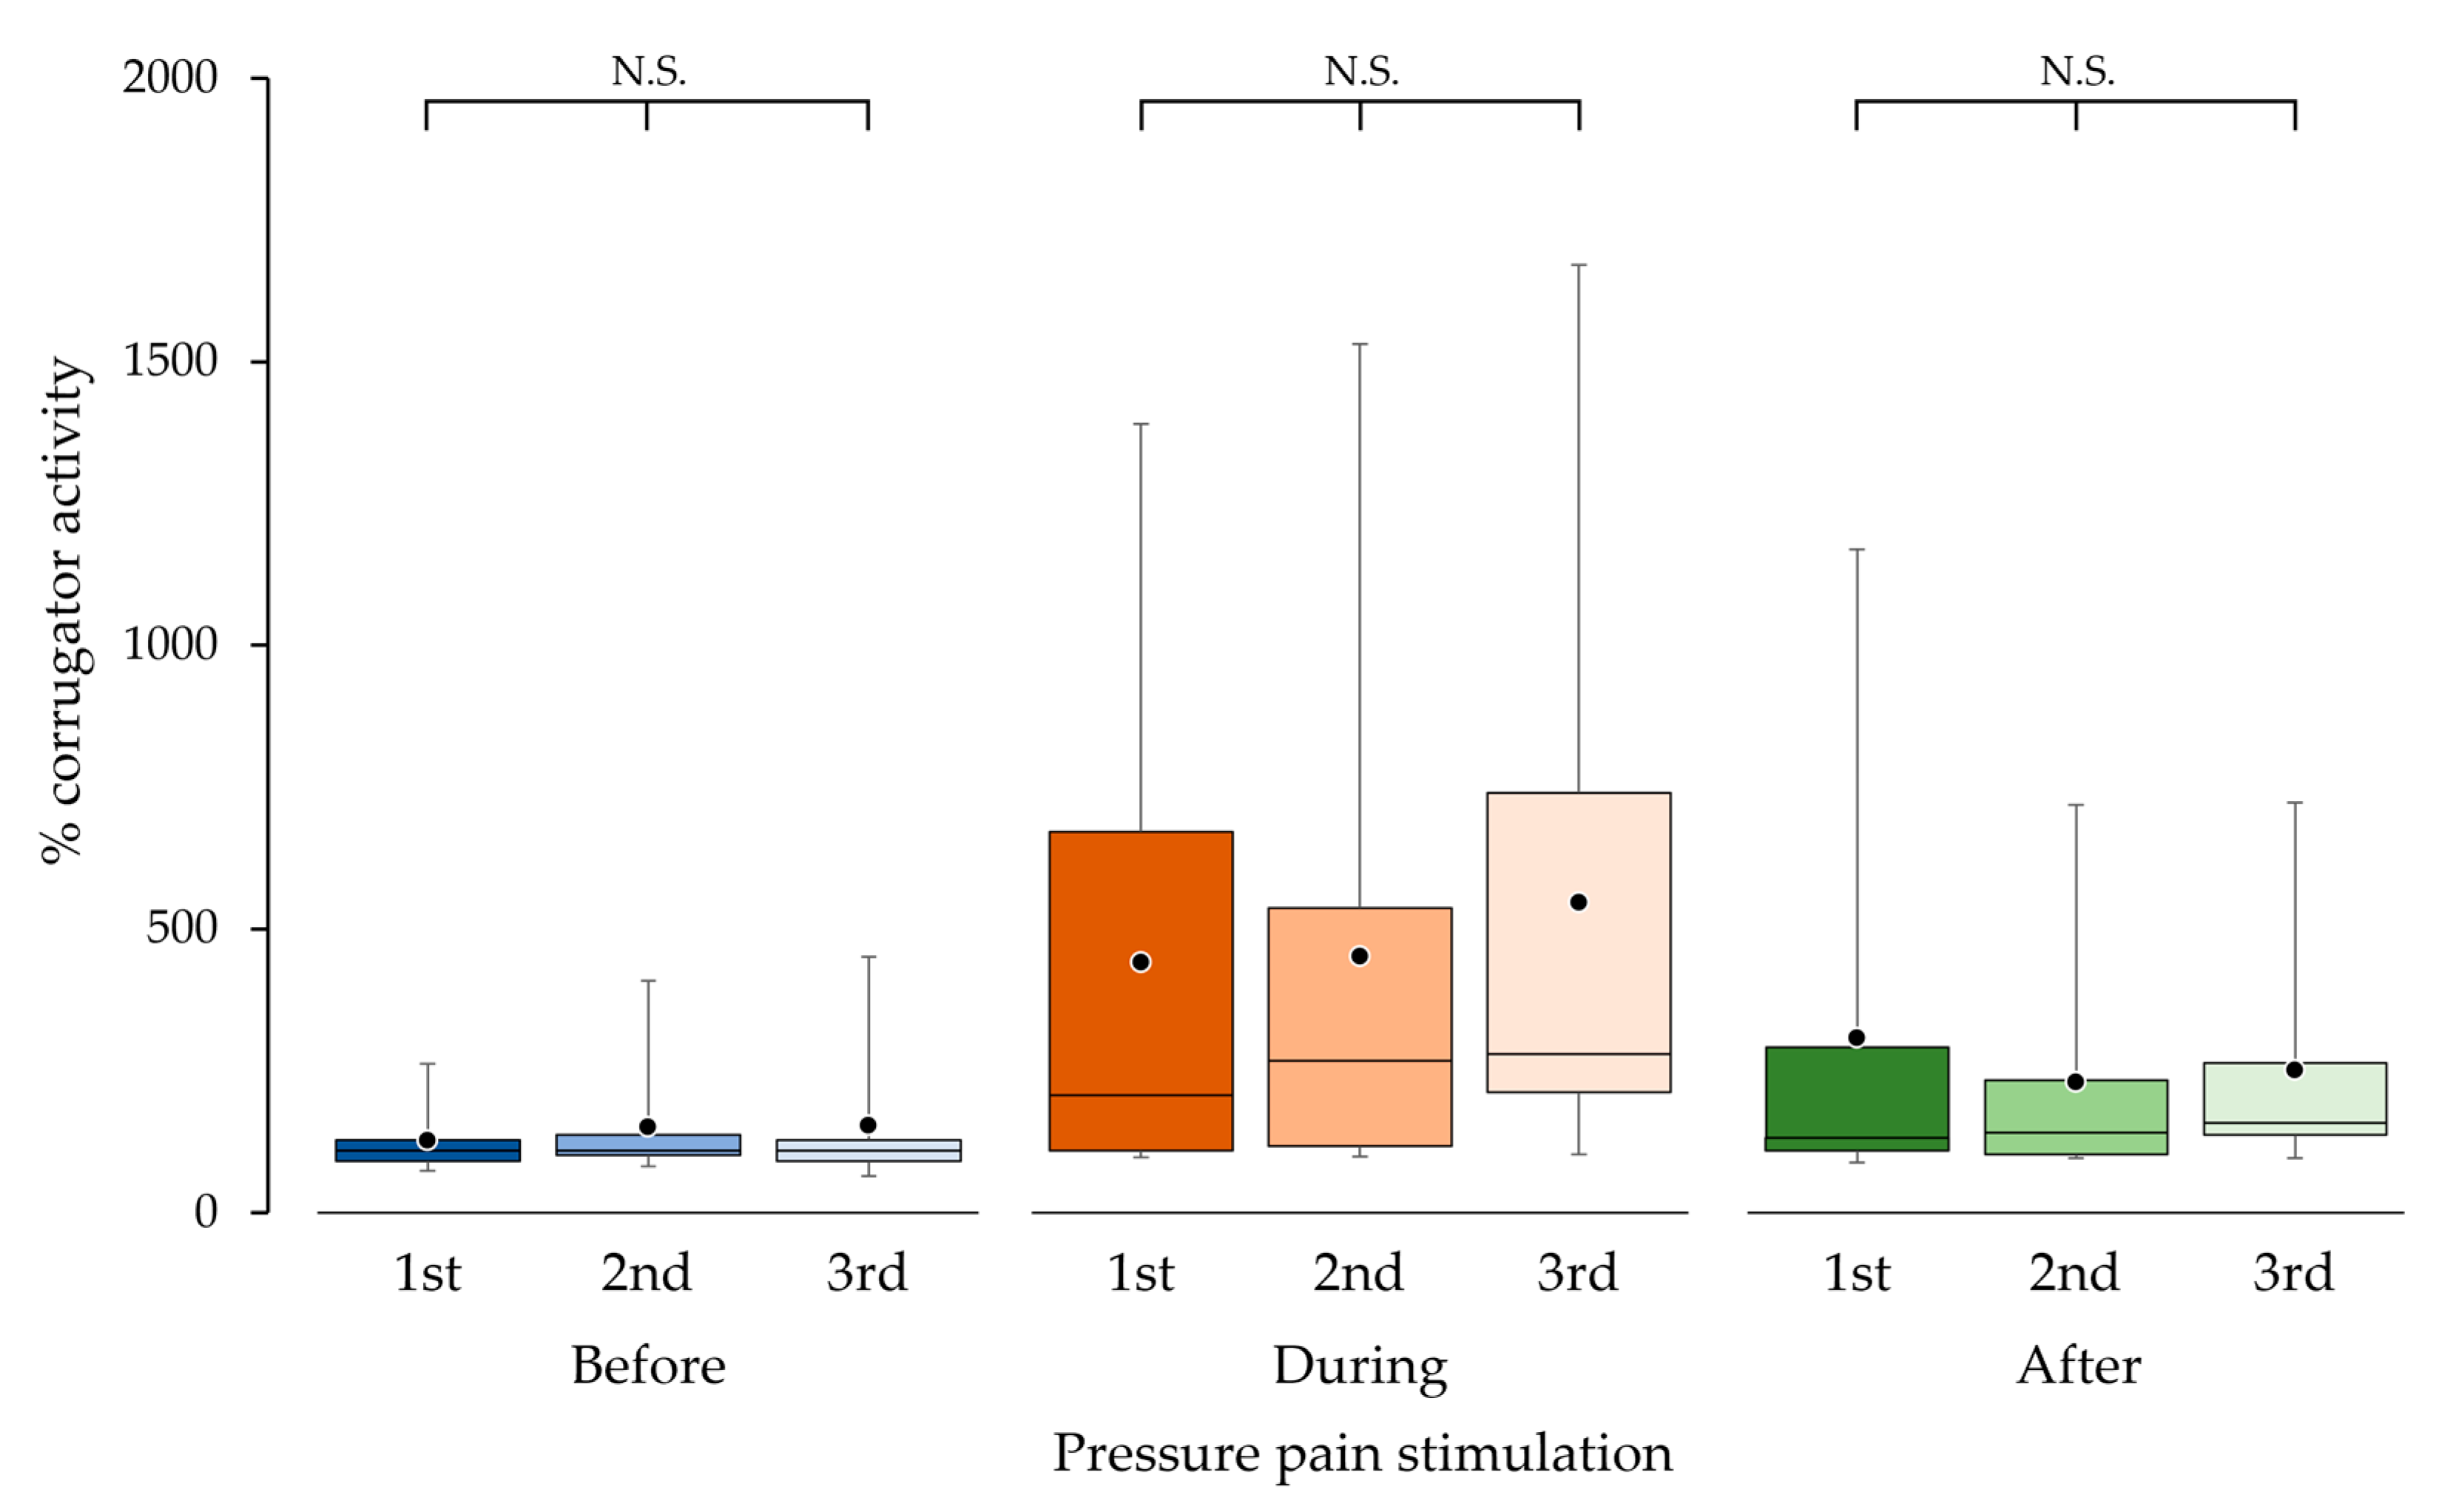
3.3. Reproducibility of Corrugator Muscle Activity
Reproducibility of corrugator muscle activity was confirmed from three repetitive measurements. There were no significant differences in % corrugator activities among the first, second and third measurements before (
p = 0.526), during (
p = 0.145) and after (
p = 0.109) pressure pain stimulation, respectively (
Figure 6).
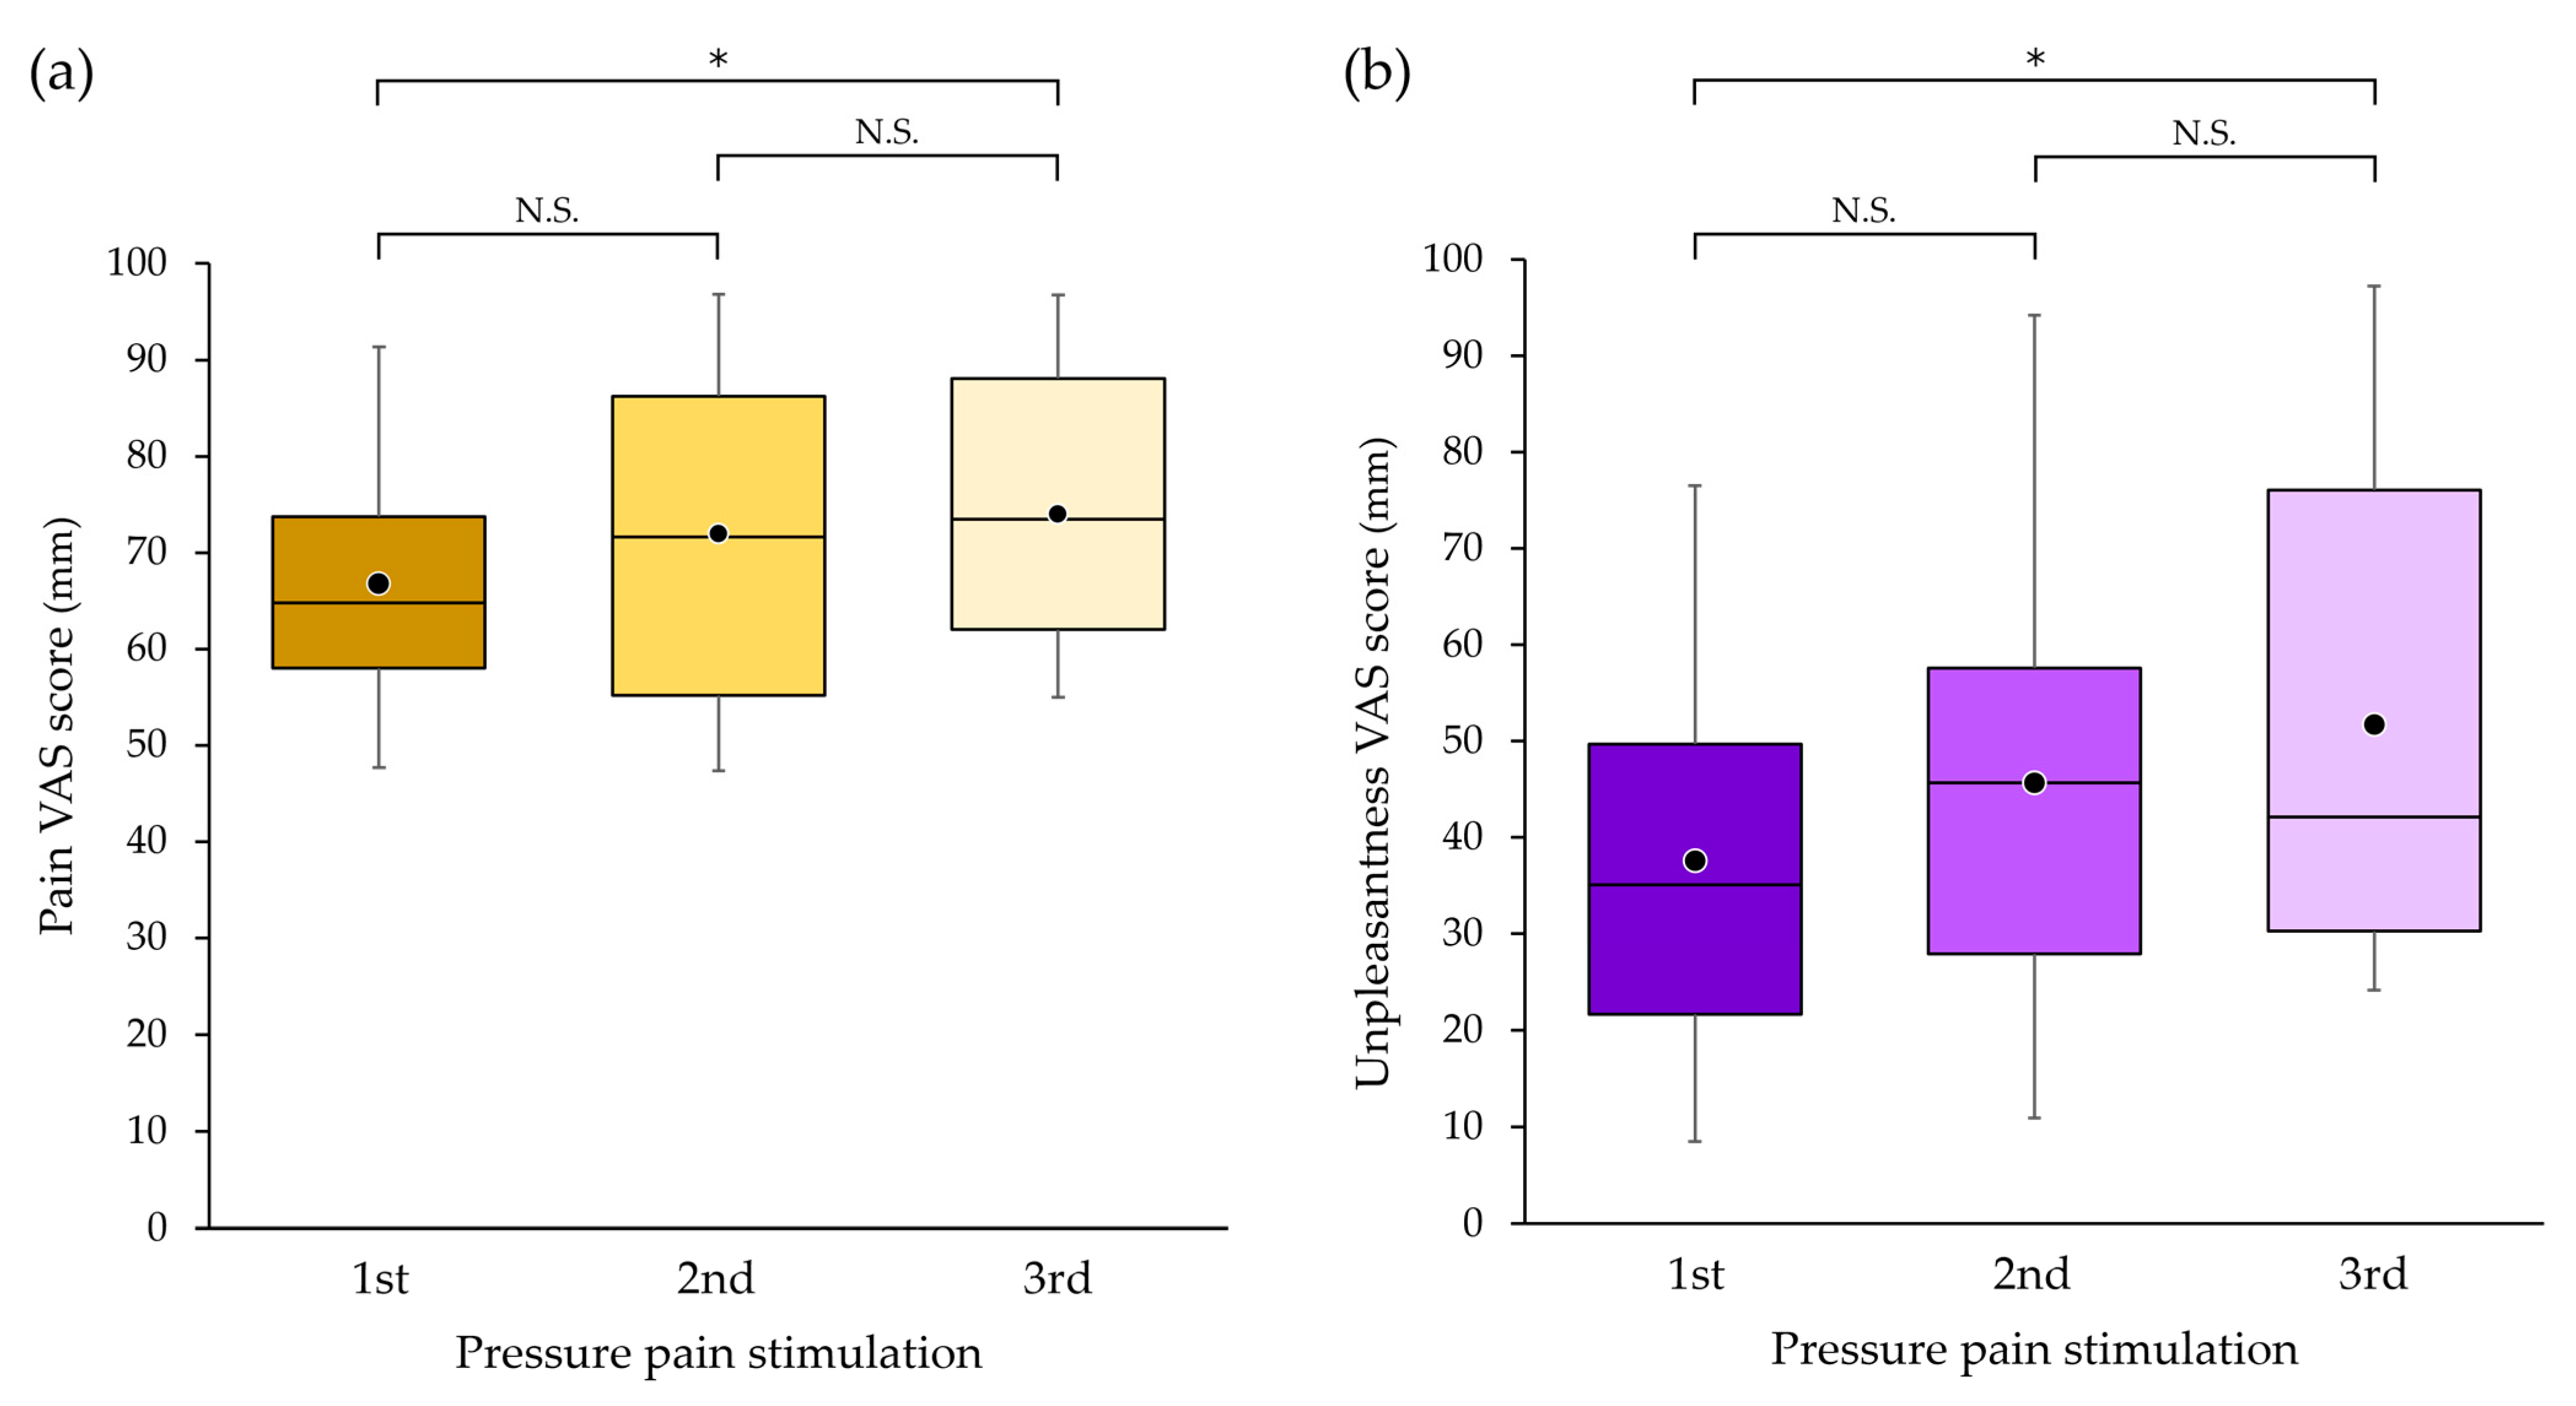
3.4. Subjective Pain and Unpleasantness with Pressure Pain Stimulation
All participants felt pain and its unpleasantness, although the VAS scores of both were not stable between measurements. The mean ± SD (median) of pain and unpleasantness VAS scores across all measurements (n = 42) were 70.9 ± 15.3 (71.2) and 45.0 ± 25.7 (39.1), respectively. No participants experienced any pleasantness associated with pain.
There was a significant difference in pain VAS score between the first and third measurements (
p = 0.042) but not between the first and second measurements (
p = 0.392) or between the second and third measurements (
p = 1.000) (
Figure 7a).
There was a significant difference in unpleasantness VAS score between the first and third measurements (
p = 0.018) but not between the first and second measurements (
p = 1.000) or between the second and third measurements (
p = 0.218) (
Figure 7b).
For the above-mentioned two participants whose corrugator muscle activity during pressure pain stimulation did not increase, the mean intensities of the three measurements on the VAS were 57.2 and 58.1 mm in pain and 7.1 and 33.0 mm in unpleasantness, respectively.
3.5. Relationship between Corrugator Muscle Activity and Subjective Pain or Unpleasantness with Pressure Pain Stimulation
There were positive correlations between corrugator muscle activity, and pain and unpleasantness VAS scores. Significant positive correlations were found between % corrugator activity during pressure pain stimulation and pain (ρ = 0.465,
p = 0.002) (
Figure 8a) and unpleasantness (ρ = 0.558,
p < 0.001) (
Figure 8b).
There was a significant positive correlation between pressure pain and unpleasantness with pressure pain stimulation (ρ = 0.643, p < 0.001).
3.6. Adverse Events
No adverse events except for pain were observed in any of the participants in any of the experiments.
4. Discussion
In pain research or clinical fields, mainly subjective pain assessment methods have been used. Due to a lack of established objective pain assessment methods, researchers have been challenged to develop the objective methods. In this context, corrugator muscle activity has been reported as promising measure for pain assessment. In this study, we observed corrugator muscle activity and intensity of pain and unpleasantness with pressure pain stimulation applied to the shoulder point and the relationship between them to explore the utility of corrugator muscle activity as an indicator of pain or its unpleasantness. The results showed that corrugator muscle activity increased with pressure pain stimulation and positively correlated to the sensory and affective VAS scores, which suggests the usefulness of corrugator muscle activity as an indicator for pain or associated unpleasantness assessments.
In a recent study on corrugator muscle activity elicited by pain, it was reported that electrical stimulation to the fingertip and thermal stimulation to the medial forearm increased corrugator muscle activity [
18]. In this previous study, the corrugator muscle clearly showed the most pronounced activity resulting from pain compared with the orbicularis oculi, levator labii, superioris zygomaticus major and risorius. This finding suggests that the corrugator muscle is the most useful muscle for pain assessment. In other words, recordings of the activity of corrugator muscle alone may be sufficient to assess pain, which represents practicality and simplicity for an objective method of pain assessment in clinical practice. Considering these results [
18] together with a previous finding that the skeletal muscle activity was increased by unpleasant stimulation [
23], it is rational to conclude that pain and unpleasantness represent a reason for the increased corrugator muscle activity found in this study.
However, it should be noted that increased corrugator muscle activity was not induced by pressure pain stimulation in two participants, despite that fact they felt certain amounts of pain, which suggests that the intensity of pressure pain stimulation might not have reached the pain threshold at which the corrugator muscle is activated [
24] or that corrugator muscle activity may be not induced by pain in a certain proportion of people.
The positive correlations between corrugator muscle activity and pain or unpleasantness VAS scores with pressure pain stimulation indicate that corrugator muscle activity expresses subjective sensory or affective pain objectively and can be used as an objective pain assessment. In this study, in addition, we examined the reproducibility and stability of corrugator muscle activity and the VAS scores, and found significant differences among three measurements in VAS scores but not in corrugator muscle activity. The significant difference in VAS scores is consistent with the 20% variation in scores of repeated VAS measurements in a previous report [
25]. The results suggest that a certain amount of corrugator muscle activity may be observed in response to a certain intensity of pain; in other words, sEMG recordings of corrugator muscle activity may be reliable for evaluating pain in skeletal muscles rather than VAS scores. Regarding VAS scores from the current results, several measurements of VAS scores may produce more stable results.
However, it cannot be determined whether corrugator muscle activity or VAS score more accurately expresses the pain or unpleasantness intensity one feels. One must note the following difference between these assessment methods: for the VAS scores, the subject marks his/her pain/unpleasantness felt on a 100 mm long line scale from 0 (no pain/unpleasantness) to 100 (maximum imaginable pain/unpleasantness), but first he/she imagines the maximum possible pain/unpleasantness and then evaluates the pain/unpleasantness felt based on their imagined maximum intensity on the VAS [
7,
8]. It has been stated that there are difficulties in imagining the maximum possible pain and determining where one’s pain intensity lies on the 100 mm line of the VAS based on an ambiguous maximum possible pain [
9,
10]. In other words, the VAS score is a result obtained through such a thought process. On the other hand, corrugator muscle activity elicited by pain does not rely on such a thought process, but might be elicited directly via neural circuits between pain and the motor neurons to the corrugator muscle [
26] like in the withdraw reflex. Although corrugator muscle activity seems to express pain more directly than VAS, as to which of the two pain assessments is superior requires further research. Including corrugator muscle activity in pain assessment in addition to VAS scores will be helpful in assessing pain more accurately.
As for the practicality of pain assessment using corrugator muscle activity, it is relatively easy to introduce pain assessment to the bedside. If clinicians are capable of applying a constant pressure to the body, such as physicians skilled in palpation, a simple pain assessment using the application of pain pressure with the fingers could become possible. Moreover, using sEMG as one of the methods to objectively capture subjective pain might make it much easier to assess pain before and after treatment. Clinicians can use an algometer or other devices to provide quantitative pressure, when pain quantification is required [
27]. Further, for patients who are unable to express their subjective sensations and feelings in words or written notation, corrugator muscle activity can be a useful indicator of their pain [
17,
18,
28].
The results of the present study suggest that corrugator muscle activity can be used as an objective indicator of assessment for pain per se originating from patients, especially chronic pain patients. Also, corrugator muscle activity elicited with pressure stimulation can be used to assess patient’s sensitivity to pain for pain patients both with and without corrugator muscle activity.
The key research questions, findings and implications of this study are as follows. (1) We aimed to investigate whether corrugator muscle activity increases by pressure pain stimulation in the shoulder and correlations between corrugator muscle activity and sensory and affective VAS scores exist. (2) Corrugator muscle activity increased with pain with pressure stimulation and was positively correlated with sensory and affective VAS scores. (3) The results obtained here suggest that corrugator muscle activity can be a measure for objective pain assessment and that pressure stimulation is a useful method to elicit corrugator muscle activity.
The limitations of this study were as follows: The pain targeted in this study was not pain in pain patients, but artificial pain elicited with pressure stimulation. The reproducibility of corrugator muscle activity in response to pain was examined only over a short period of time, and different strengths of pressure pain stimulation were used across the participants. Further limitations of this study were that the participants were exclusively young healthy people in their 20 s and the small sample size. Therefore, gender and age differences could not be analyzed. Further studies with healthy people or pain patients with large sample sizes are warranted to solidify the current conclusion.


