Article

Prediction of Tissue Damage Using a User-Independent Machine Learning Algorithm vs. Tmax Threshold Maps

1
Institute of Diagnostic and Interventional Neuroradiology, Inselspital Bern University Hospital, University of Bern, 3010 Bern, Switzerland
2
Department of Neurology, Inselspital Bern University Hospital, University of Bern, 3010 Bern, Switzerland
*
Author to whom correspondence should be addressed.
Clin. Transl. Neurosci. 2021, 5(3), 21; https://doi.org/10.3390/ctn5030021
Submission received: 7 August 2021 / Revised: 28 October 2021 / Accepted: 9 November 2021 / Published: 12 November 2021
(This article belongs to the Section Neuroimaging)

Abstract

:
(1) Background: To test the accuracy of a fully automated stroke tissue estimation algorithm (FASTER) to predict final lesion volumes in an independent dataset in patients with acute stroke; (2) Methods: Tissue-at-risk prediction was performed in 31 stroke patients presenting with a proximal middle cerebral artery occlusion. FDA-cleared perfusion software using the AHA recommendation for the Tmax threshold delay was tested against a prediction algorithm trained on an independent perfusion software using artificial intelligence (FASTER). Following our endovascular strategy to consequently achieve TICI 3 outcome, we compared patients with complete reperfusion (TICI 3) vs. no reperfusion (TICI 0) after mechanical thrombectomy. Final infarct volume was determined on a routine follow-up MRI or CT at 90 days after the stroke; (3) Results: Compared to the reference standard (infarct volume after 90 days), the decision forest algorithm overestimated the final infarct volume in patients without reperfusion. Underestimation was observed if patients were completely reperfused. In cases where the FDA-cleared segmentation was not interpretable due to improper definitions of the arterial input function, the decision forest provided reliable results; (4) Conclusions: The prediction accuracy of automated tissue estimation depends on (i) success of reperfusion, (ii) infarct size, and (iii) software-related factors introduced by the training sample. A principal advantage of machine learning algorithms is their improved robustness to artifacts in comparison to solely threshold-based model-dependent software. Validation on independent datasets remains a crucial condition for clinical implementations of decision support systems in stroke imaging.

1. Introduction

Defining infarction core and penumbra is relevant to determine the management plan of patients with acute ischemic stroke. Multiple factors influence the evolution and final extent of ischemic lesions, such as the location of the thrombus [1,2], preexisting vascular pathology [3], and the state of collateral circulation [4,5], as well as other patient-related factors [6,7], which necessitate moving from a universal time window towards an individualized approach in management. This is reflected in the current guidelines for stroke management by the American Stroke Association, as selected patients may be eligible for invasive stroke therapy in an extended time window (6–24 h from last seen normal). The guidelines also incorporate collateral flow status in clinical decision-making [8].
Perfusion imaging identifies hypoperfused brain tissue that is potentially salvageable if revascularization can be achieved within 24 h [9]. An ADC threshold of ≤620 × 10−6 mm2/s is currently recommended as a marker for the infarct core [10,11,12], and a Tmax of >6 s is used as a predictor of severely hypoperfused tissues [13,14]. However, defining the infarct core based on DWI remains a matter of controversy [15], as multiple studies have shown the presence of reversible diffusion restriction [12,16,17,18,19,20]. The dependency of the deconvolution method on the arterial input function (AIF) renders Tmax susceptible to even minor changes in the shape of AIF, making it one of the limitations of this perfusion parameter [21].
Quantitative analysis using a fixed threshold of a single parameter is widely used clinically. However, due to the complexity of the stroke pathophysiology, with multiple factors affecting the outcome, and increasing availability of advanced stroke therapy, a multiparametric approach could be more useful. Currently, a reliable method able to precisely determine the core and penumbra is lacking. In the last years, many attempts were made to find a mathematical solution that could predict the fate of ischemic tissue and gain better results using the perfusion data in the acute stage of patients with vascular occlusion. Deep learning algorithms have been introduced to predict the salvageable tissue in patients who receive mechanical thrombectomy and i.v. thrombolysis [22]. Supervised decision forests (a subform of random forest classifiers) [23] have been suggested to predict tissue fate based on multiparametric MRI sequences including perfusion data [24]. Fully automated stroke tissue estimation using random forest classifiers (FASTER) [24,25] is a fully automated algorithm that predicts tissue fate, from images in the acute stage, based on supervised learning. When applied to 19 test cases with thrombolysis in cerebral infarction (TICI) grading of 1–2 a, the predicted tissue-at-risk volume was positively correlated with the final lesion volume. Prediction of tissue damage in cases with persistent occlusion or full recanalization has not yet been analyzed. From a clinical point of view, this dichotomization is of relevance, since growing evidence suggests that complete perfusion (TICI 3) rather than incomplete revascularization (TICI 0) may provide remarkable benefit in outcomes [26,27], while from the view of medical image analysis, major challenges arise for predicting the outcome from multiple factors that influence tissue survival and guide eligibility for reperfusion regimens. In this study, we report the precision of FASTER against a threshold-based perfusion analysis in patients without vs. immediate full recanalization.

2. Materials and Methods

2.1. Ethical Statement

This is a retrospective study of patients from the Bernese Stroke Registry, a prospectively collected database approved by the review board of the University Hospital of Bern and the local ethical committee (Kantonale Ethikkommision Bern, Switzerland).

2.2. Patients and Inclusion Criteria

Patients who underwent treatment for acute ischemic stroke were retrospectively identified from the stroke unit registry at the Inselspital, University of Bern. Inclusion criteria were (i) patients over 18 years with acute ischemic stroke who underwent a brain MRI exam in the acute phase, (ii) ischemic lesion (s) on DWI and PWI, (iii) proximal occlusion of the middle cerebral artery (M1 or M2 segments), (iv) endovascular therapy with a resulting TICI score of 0 or 3, and (v) follow-up imaging after 3 months. Patients were included if imaging data were complete, including the raw perfusion data saved in the Picture archiving and communication system (PACS), and were not used to train the FASTER algorithm.
Patients were stratified according to TICI score [28]: (1) TICI score 3 (complete reperfusion) vs. (2) TICI score 0 (no reperfusion).

2.3. Imaging Protocol

The institutional clinical acute MRI stroke protocol was performed either on a 1.5T system (Siemens Magentom Avanto and Siemens Magnetom Aera, Siemens medical solution) or a 3T system (Siemens Magnetom Verio, Siemens, healthcare, Erlangen, Germany). The protocol includes the following sequences: a whole-brain DWI (slice thickness 5 mm), an axial FLAIR sequence (slice thickness 5 mm), TOF-MRA (slice thickness 0.5 mm), and an SWI (slice thickness 1.6 mm). After the application of i.v. Gadobutrol (Gadovist; Bayer Healthcare, Berlin, Germany ) in an antecubital vein with 5 mL/s injection rate a standard dynamic susceptibility contrast (DSC), MRI perfusion (slice thickness 5 mm) was acquired as well as a contrast-enhanced T1-weighted sequence (slice thickness 5 mm). Finally, a contrast-enhanced MR angiography of the head and neck vessels was acquired after injection of a second bolus of Gadobutrol with a 3 mL/s injection rate.
A similar MRI protocol was performed after 3 months. In 6 patients, a CT exam was performed on follow-up instead of the MRI, which was performed on a 128 multidetector CT, slice thickness 3 mm (Siemens Definition Edge). For this work, the prediction was based on the diffusion weighted images, the apparent diffusion coefficient images, and the dynamic susceptibility perfusion imaging, whereas the lesion volume was determined in the follow-up examination of the FLAIR or non-enhanced CT.

2.4. Data Processing

Perfusion postprocessing was performed using Olea Sphere v2.3, which is an FDA-cleared automated multivendor processing software for medical imaging, developed by Olea Medical. The following postprocessing steps were performed automatically: (1) motion correction, (2) segmentation of non-cerebral tissue, (3) automatic identification of arterial input function (AIF) and venous reference, and finally, the different perfusion parameters were generated. For each case, oscillation index Singular Value Decomposition (oSVD) was performed to generate TTP, MTT, rBV, rBF, Tmax, corrected rBV, and K2 maps.

2.5. Manual Segmentation of Hypoperfusion

After processing perfusion parameters, manual segmentation of the lesions with delayed perfusion was performed in the analysis module of Olea, which allows drawing constraints of the volume of interest. The segmentation was performed on a slice-by-slice basis in regions with a Tmax delay of >6 s to calculate the penumbra volume. These constraints were defined as ground truth for penumbra. This step was performed by a medical master’s student under the supervision of a board-certified neuroradiologist with more than 10 years of experience.

2.6. Manual Segmentation of Final Infarct Volume

The final infarct volume was defined based on follow-up MRI (FLAIR), or follow-up CT. The 3D slicer® v4.5.1–1, which is an open-source software for 3D visualization and imaging postprocessing, was used for this task. Final infarct volumes were delineated manually by a board-certified neuroradiologist on a slice-by-slice basis in the editor module using draw and paint tools, and the calculated volume was defined as the ground truth for the infarct core (Figure 1). The obtained delineated volumes were reviewed by a second experienced observer in stroke imaging.

2.7. Postprocessing with FASTER

The perfusion maps, calculated using oSVD deconvolution and generated by Olea in the acute phase, were analyzed using FASTER, which provided an estimation of the final infarct volume in the case of either complete (TICI 3) or no reperfusion (TICI 0), as well as estimation of the penumbra in the acute situation.

2.8. Data Comparison

The results generated by FASTER were compared to the manually segmented areas on the follow-up images:
  • Infarct core volume: The predicted infarct volume at baseline using FASTER was compared to the final infarct volume on follow-up imaging (MRI or CT) calculated with the slicer.
  • Penumbral volume: The estimated penumbral volume by FASTER was compared to the manually delineated volume by Olea using the linear threshold of Tmax (>6 s).
We have actively waived metrics that are relevant for image analysis, such as Dice score coefficient and Hausdorff distance, and focused on the clinically relevant metrics only, i.e., the volume of tissue damage and the mismatch between core and penumbra, since they constitute outcomes of clinical trials.

2.9. Statistics

For statistical analysis, R statistical software v3.32 was used to obtain the following results: (1) statistical distribution of volumes, split according to TICI scores; (2) statistical volume difference between manually delineated volumes and automatically estimated volumes by FASTER using a Bland Altman plot; and (3) linear correlation between the two datasets using the Pearson correlation coefficient.

3. Results

Thirty-one patients (13 female) with an acute ischemic stroke that underwent mechanical thrombectomy with available baseline multimodal MRI imaging and follow-up MRI or CT at 3 months were anonymized and included in the study. The age range was between 32–86 years (Median 70, IQR 60–75).
Complete reperfusion (TICI 3) was achieved in 26 (83.8%) patients, while no perfusion (TICI 0) was reported in five patients (16.1%). A three months follow-up was available in all patients, 6 (19.3%) with a CT, and 25 (80.6%) with brain MRI. Table 1 summarizes the patient demographics.

3.1. Infarct Core

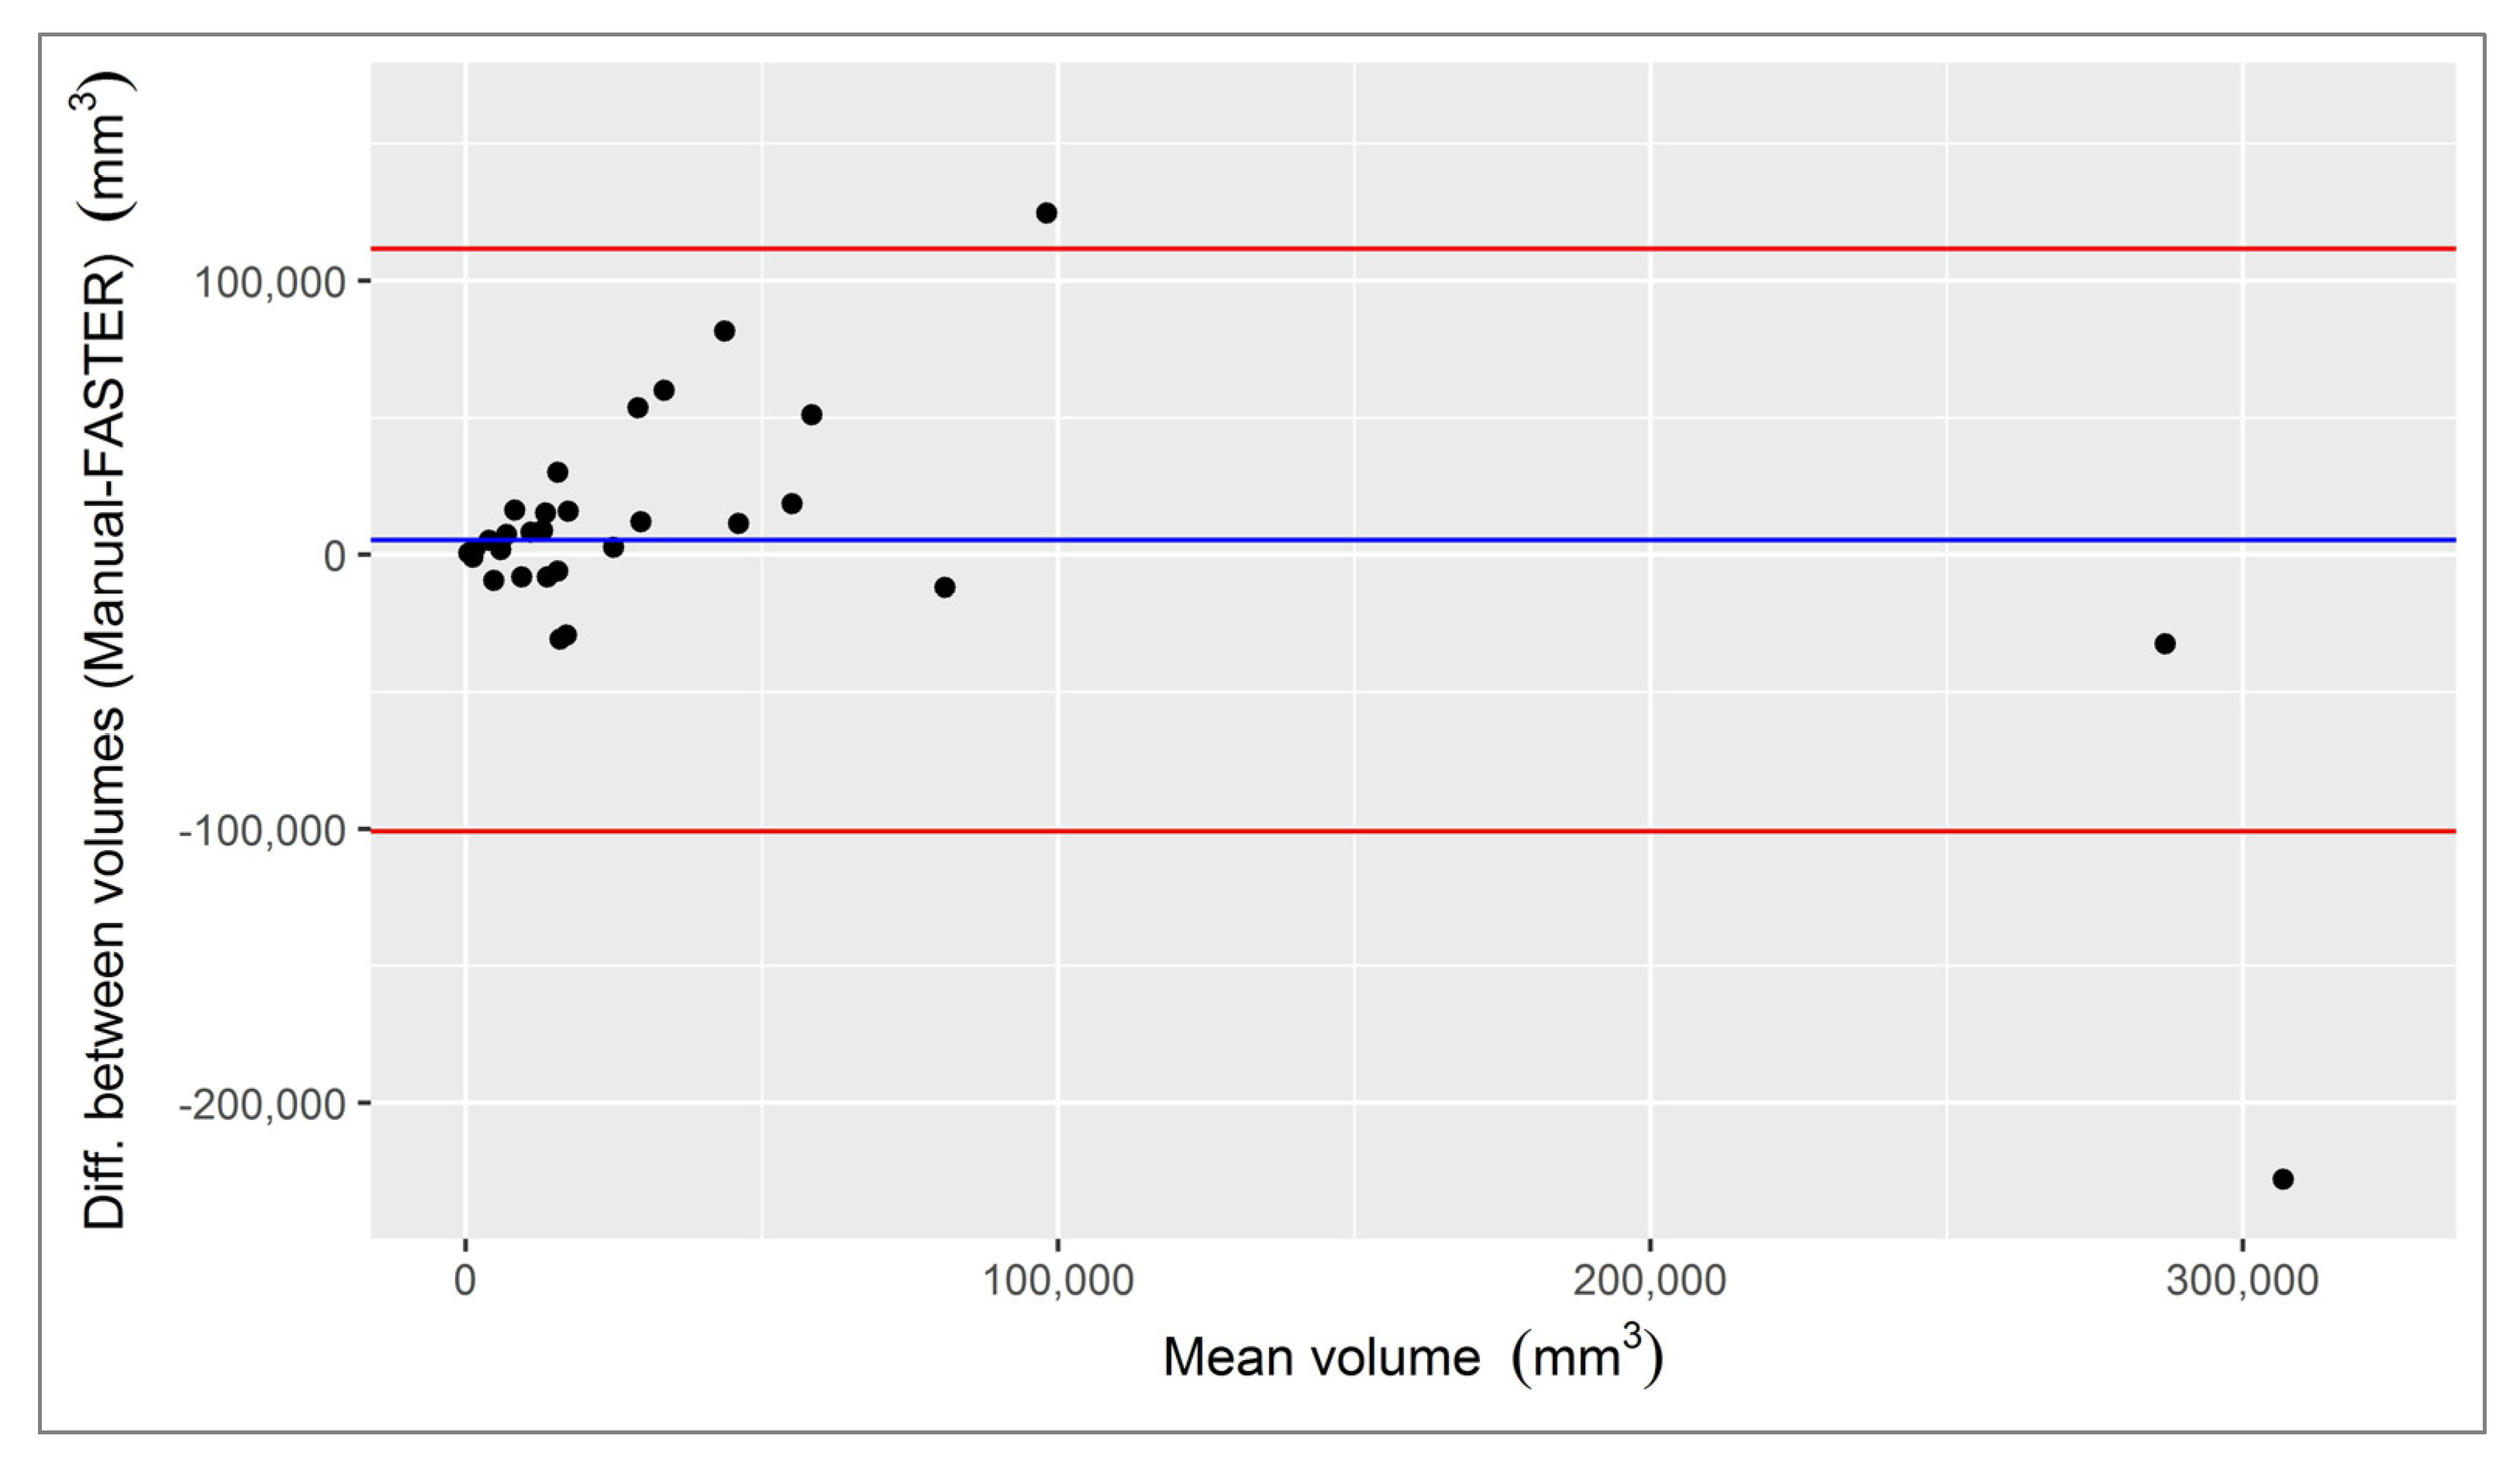
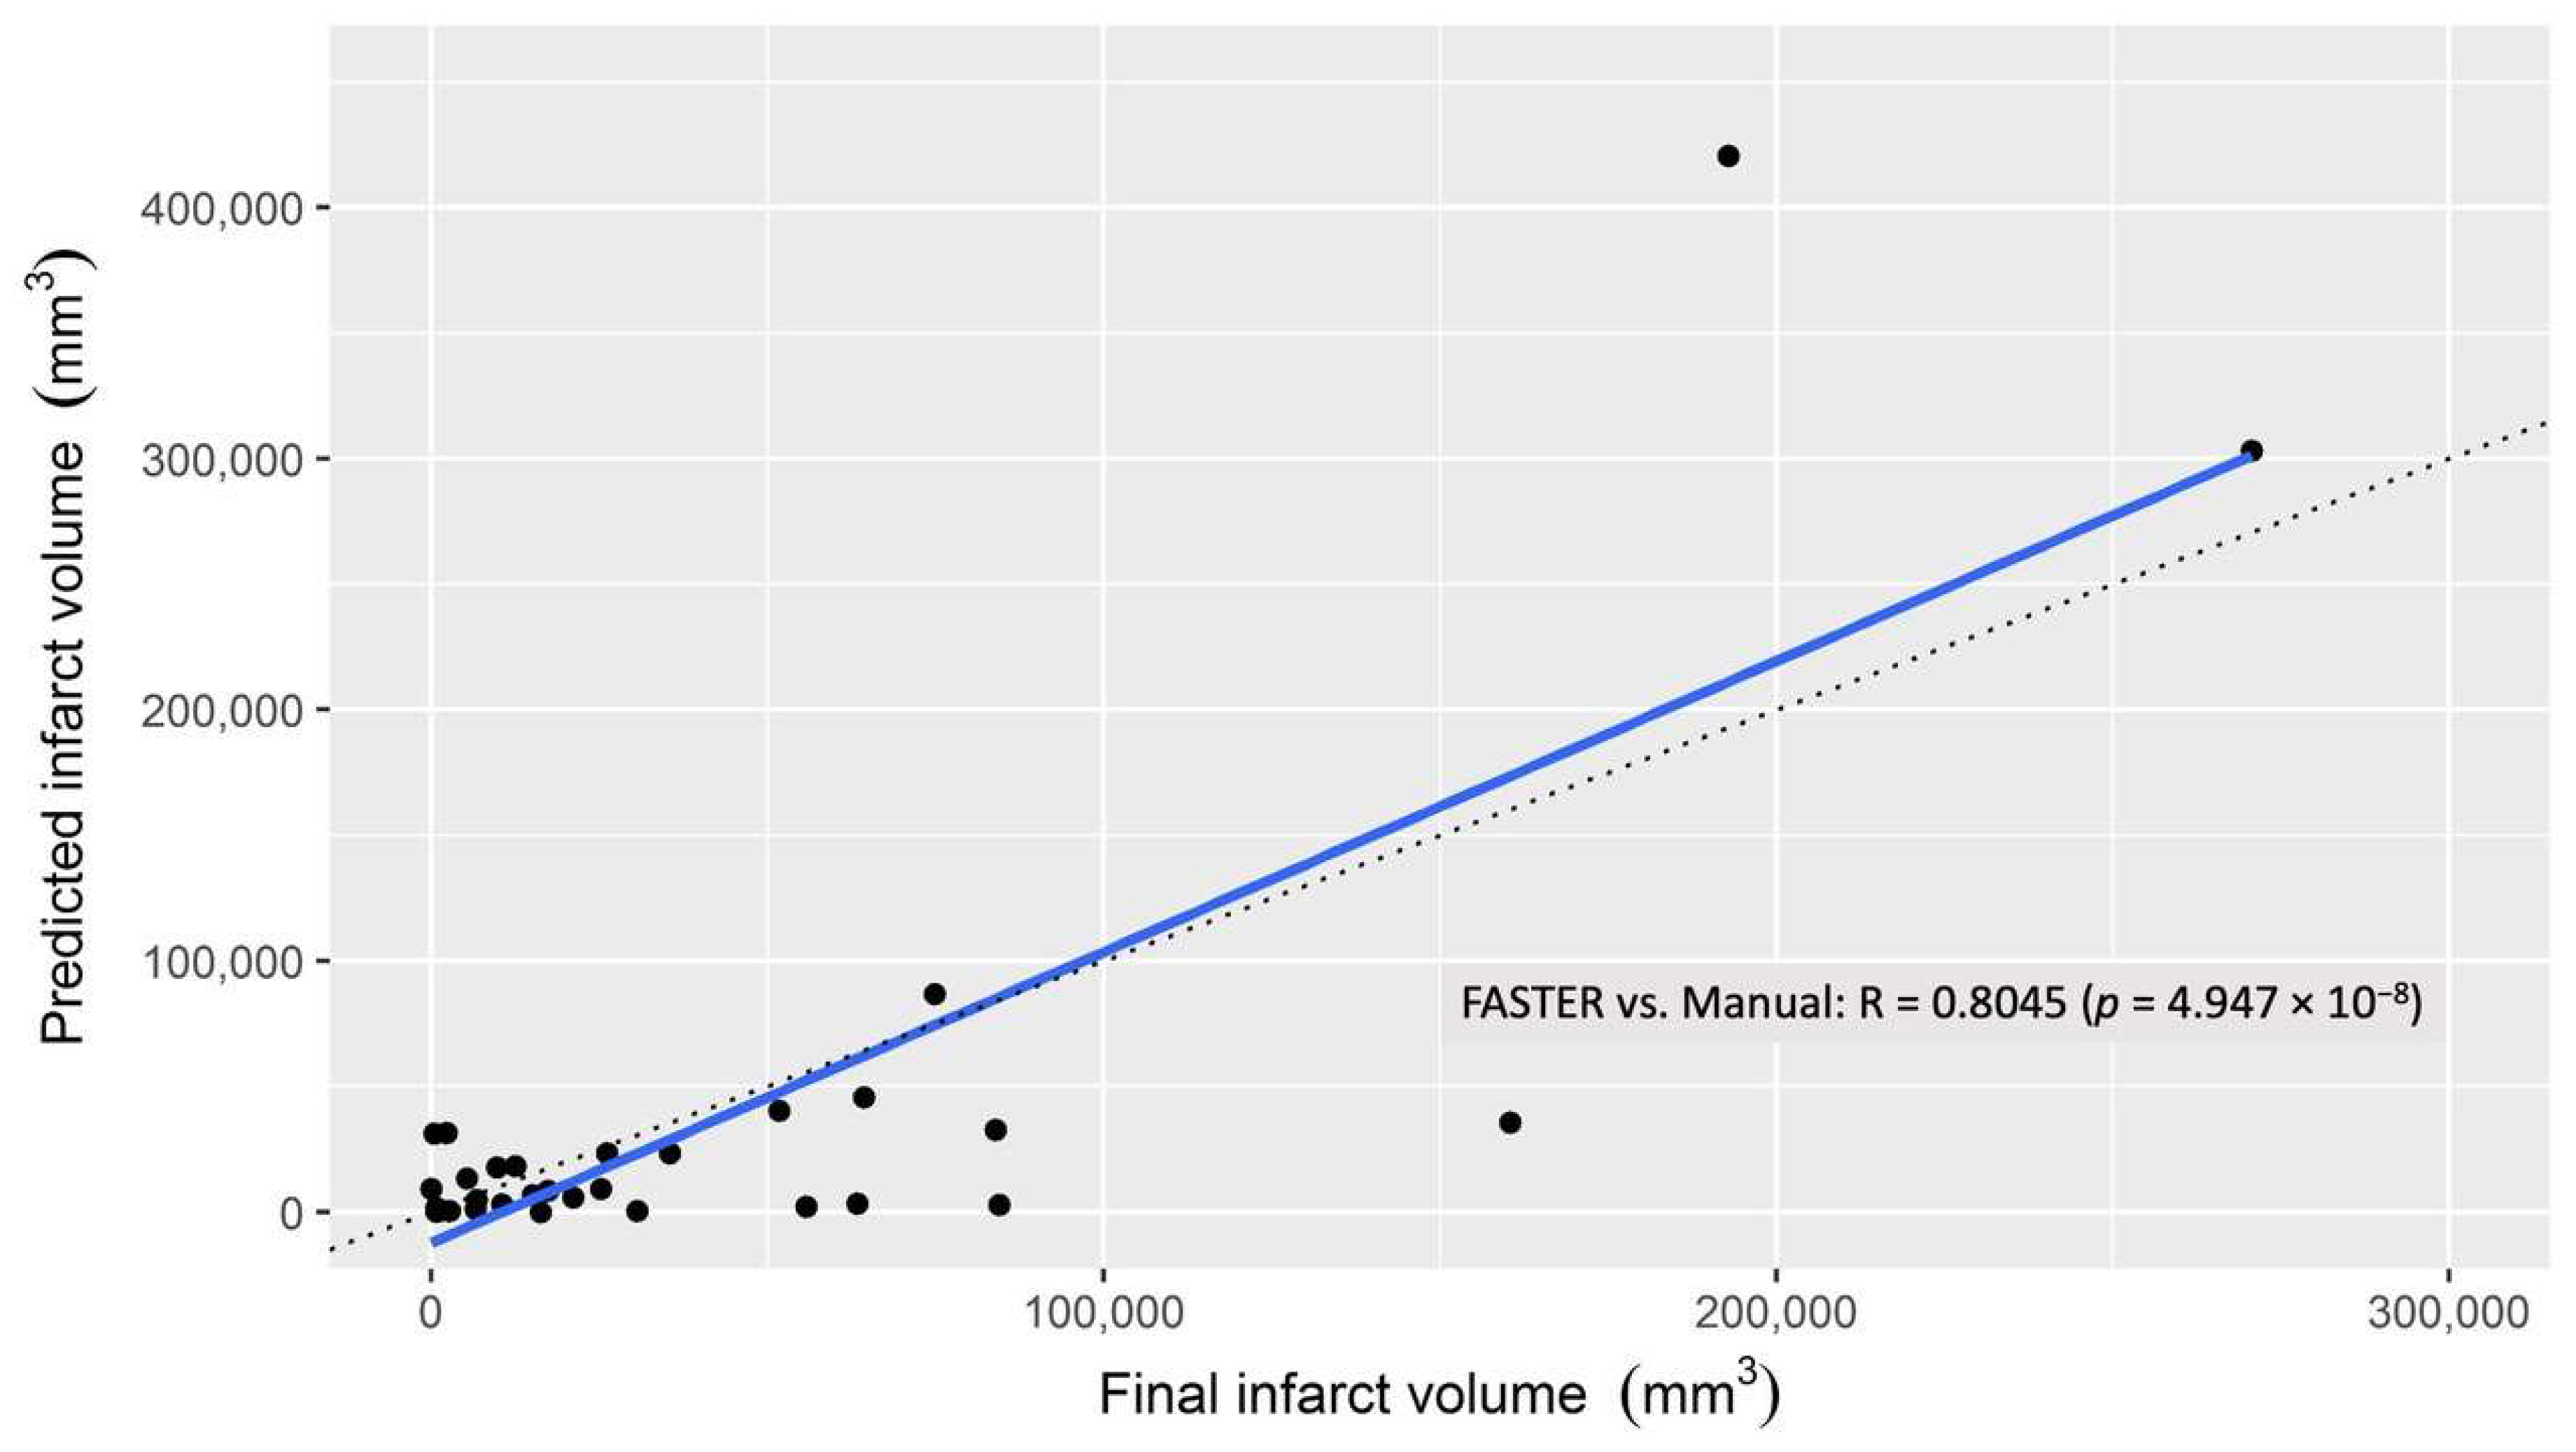
The final infarct volume (ground truth) calculated on the follow-up imaging ranged from 0–270,659 mm3 (Median 17,394 mm3, IQR 5950–59,600). The volume difference between FASTER and the manual segmentation varied between −30,749 mm3 (larger volumes detected by FASTER) and +81,764 mm3 (smaller volumes detected by FASTER), with a mean difference of +5398 mm3. Except for two outliers (patient 18 with a difference of +124,819 mm3 and patient 2 with a difference of −227,682 mm3) (Figure 2), the differences tended to increase with increasing the mean infarct volume (true volume); the Pearson correlation coefficient was R = 0.8045 with a p-value < 0.001. The linear correlation approves to be statistically significant (Figure 3).
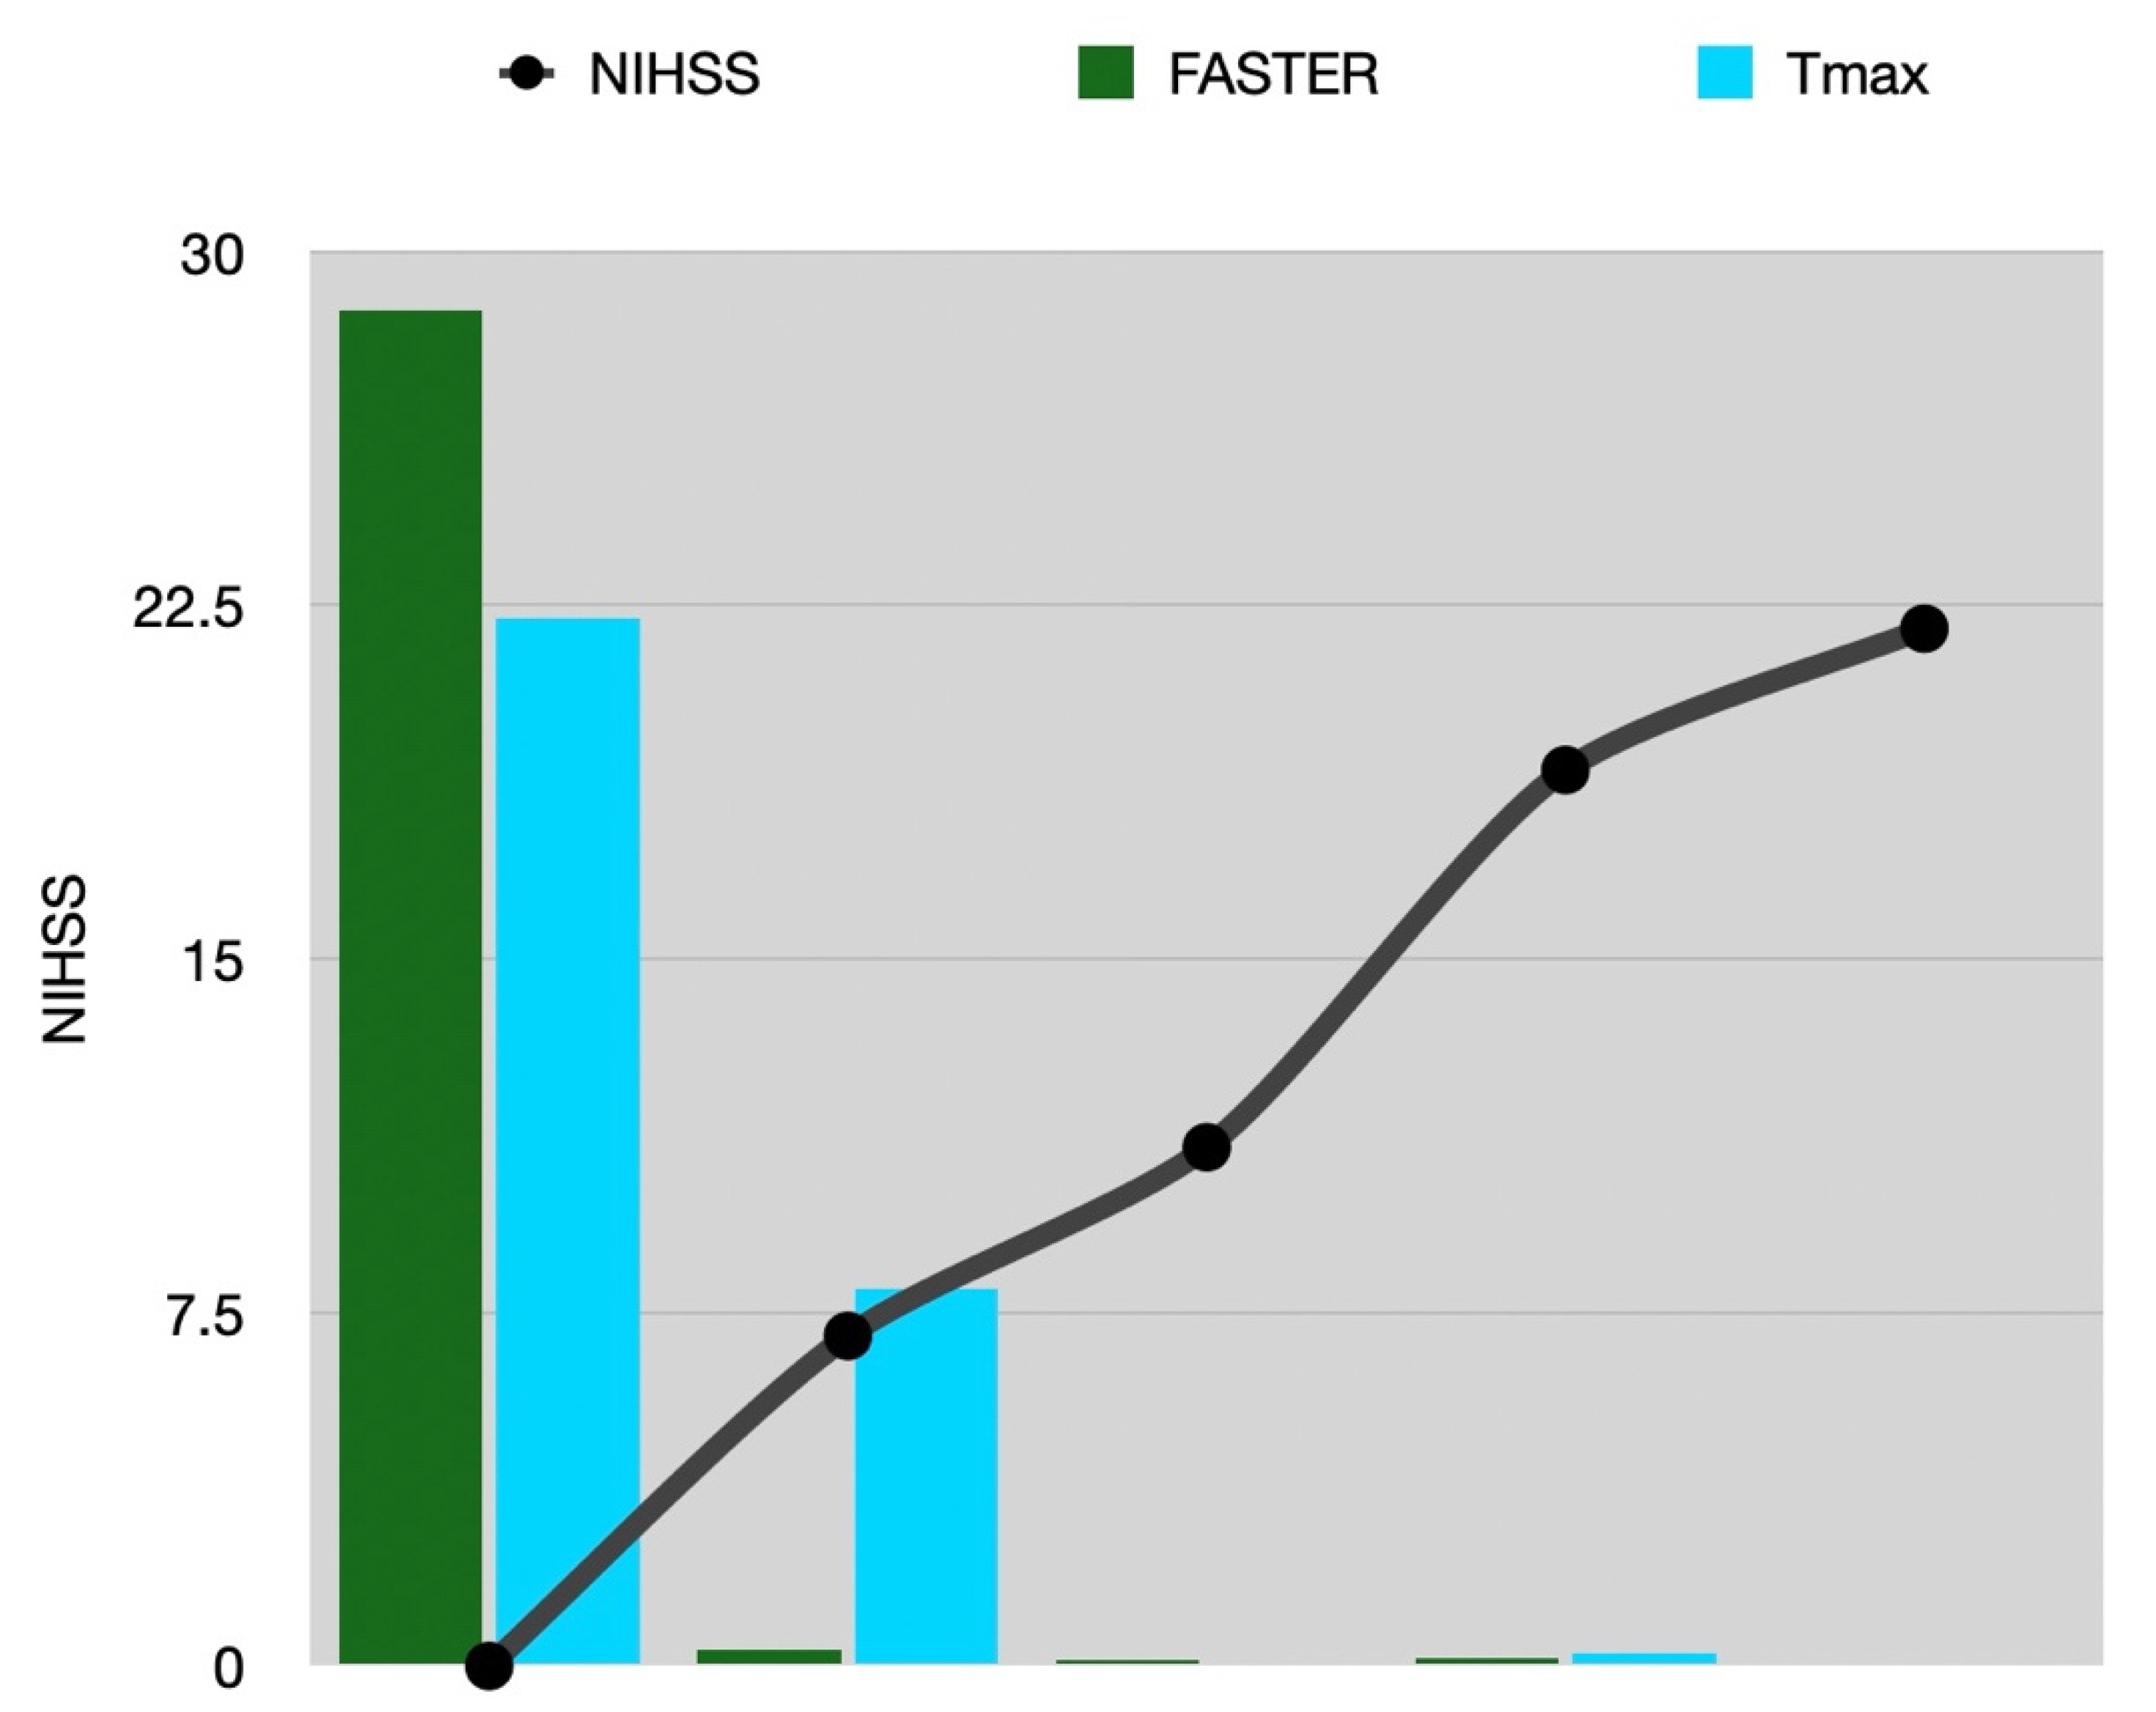
Subgroup analysis shows that in cases with TICI 0, FASTER, as well as Tmax, estimates larger final infarction volumes compared to the ground truth; however, the mean overestimation of the final infarction volume by Tmax was greater than FASTER (average difference for Tmax = 39,227 mm3 and for FASTER = 31,284 mm3). The volume difference tends to be higher in cases with high NIHSS for both FASTER and Tmax (assuming that the penumbra equals the infarction core in cases of no perfusion). The case with the highest volume difference in both Tmax and FASTER was a patient with NIHSS of 19. However, in relation to the final infarction volume, the volume difference (between ground truth and estimation) appears to be higher in cases with lower NIHSS for both the FASTER and Olea estimation (Figure 4). There was no relation found between volume difference and time to recanalization.
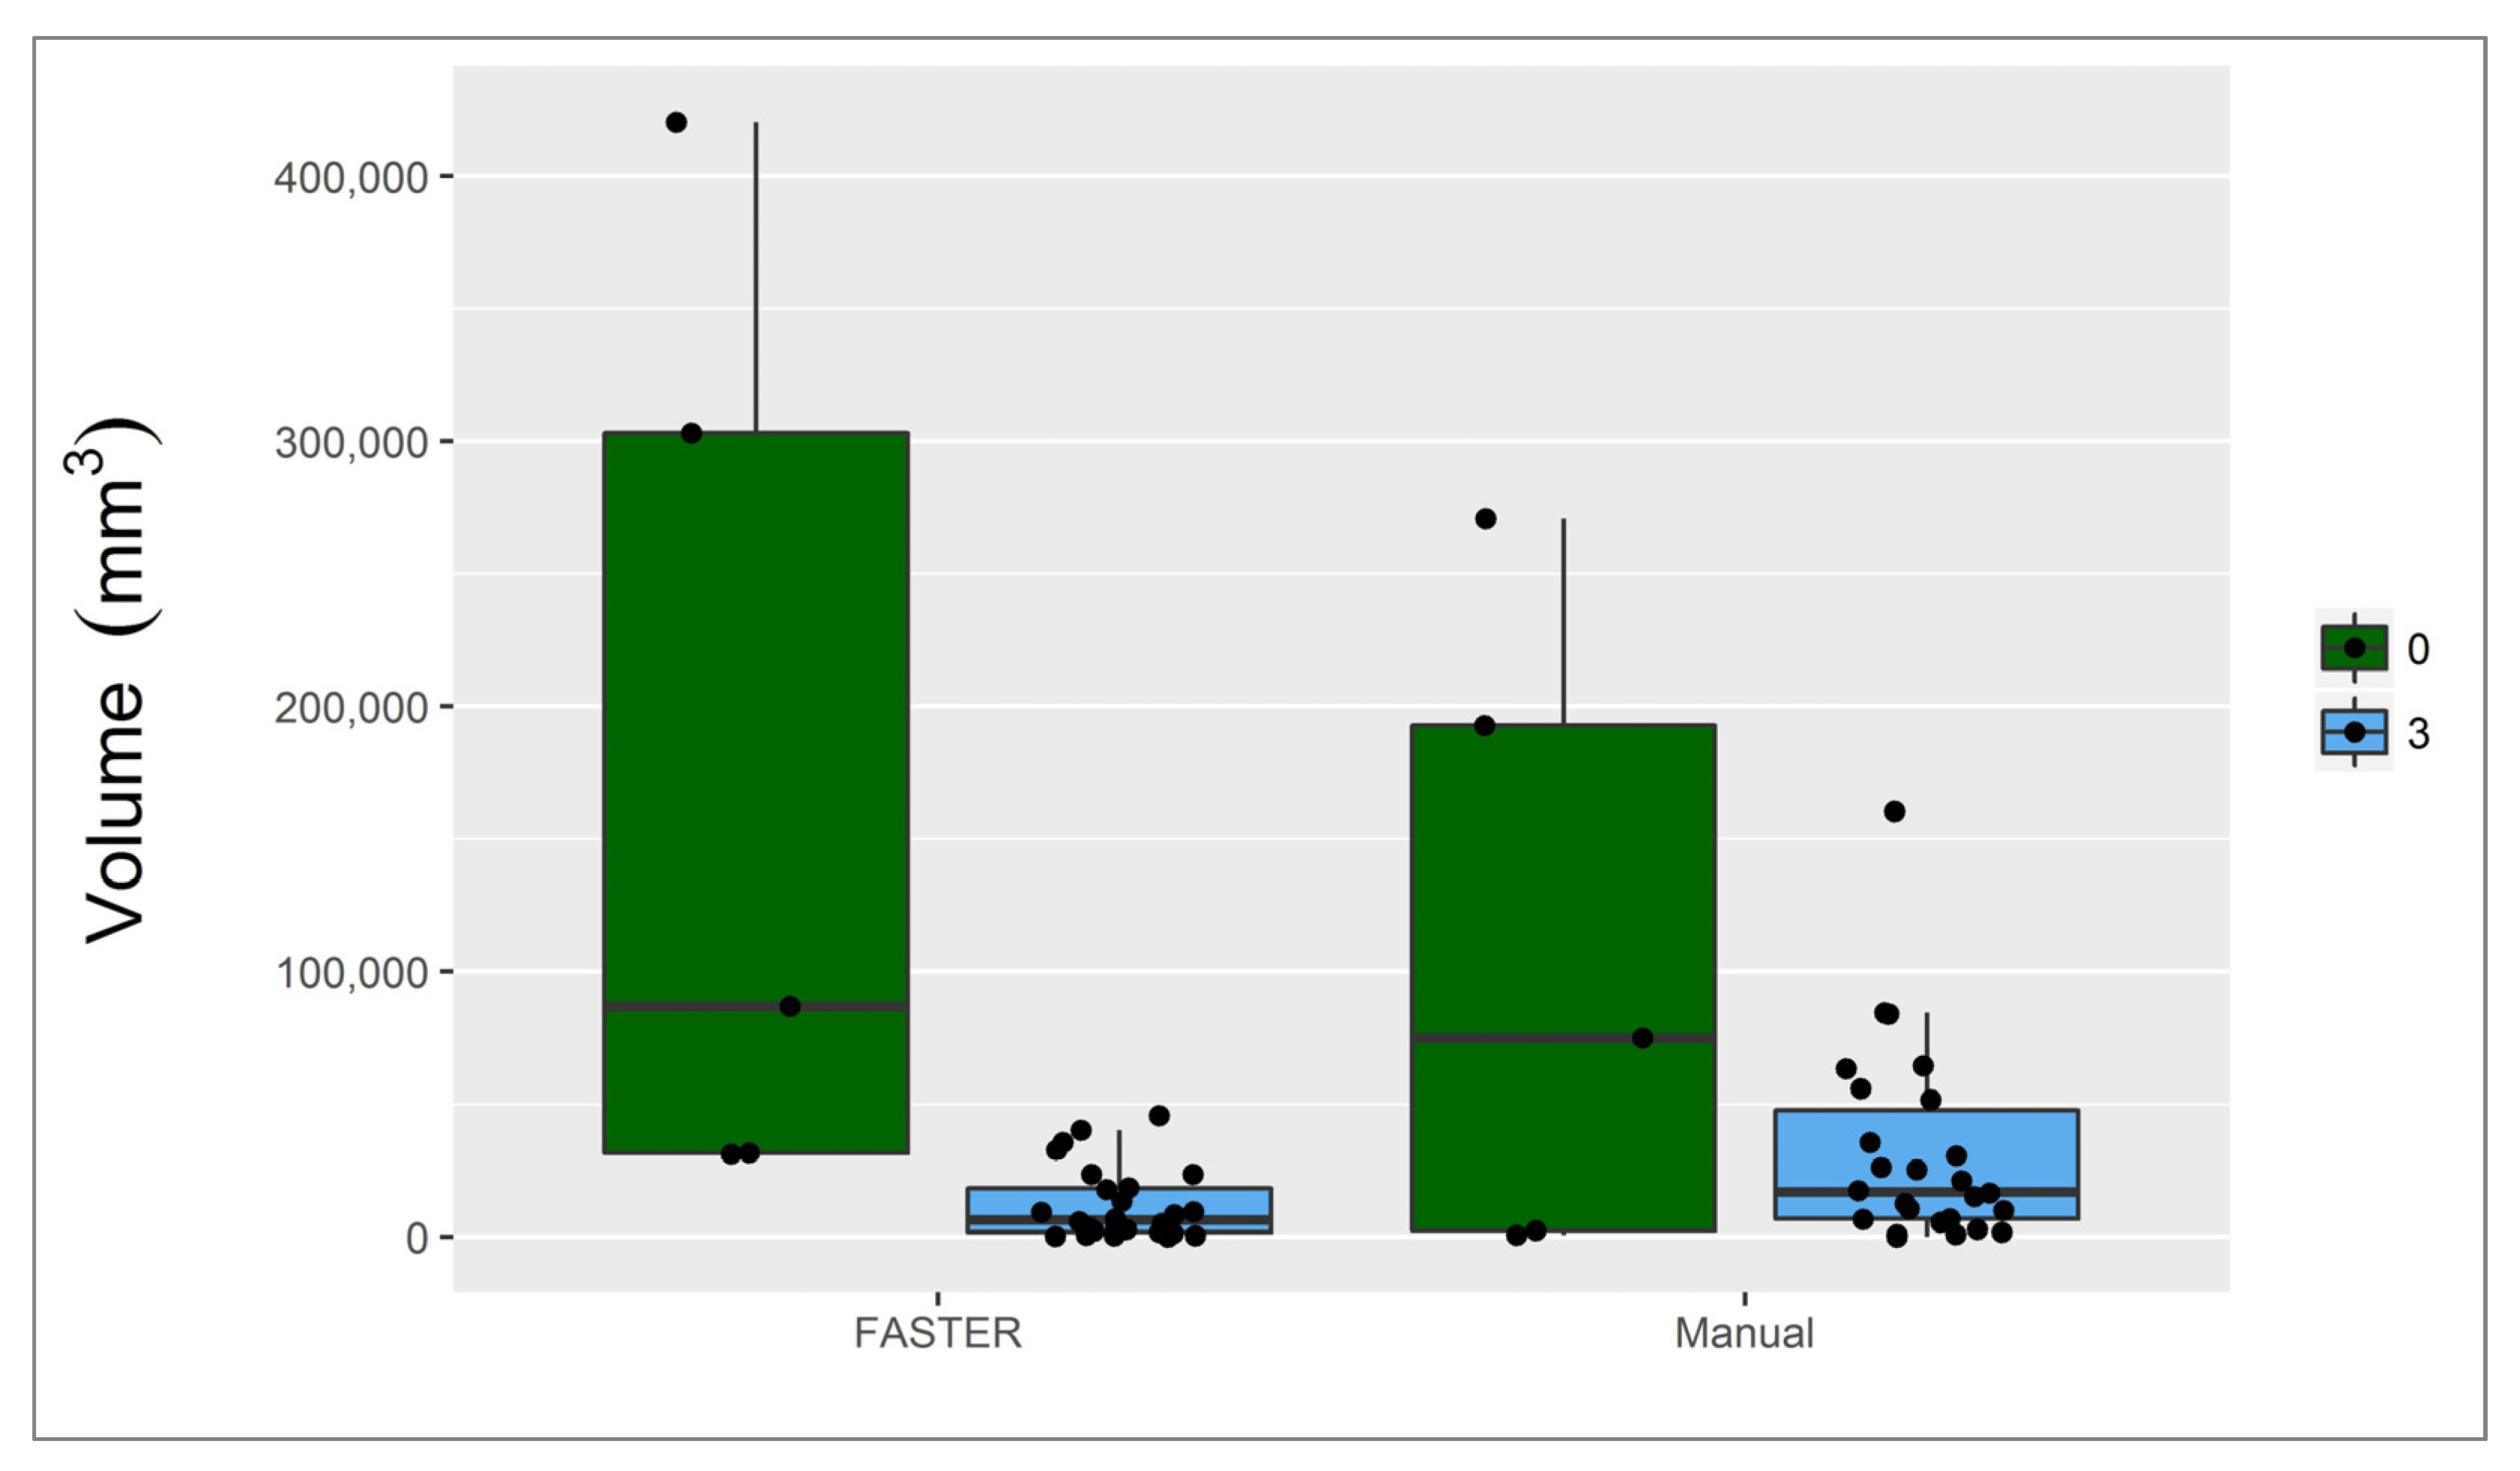
In cases with TICI 3, FASTER provides smaller infarct volumes (Figure 5).

3.2. Penumbra

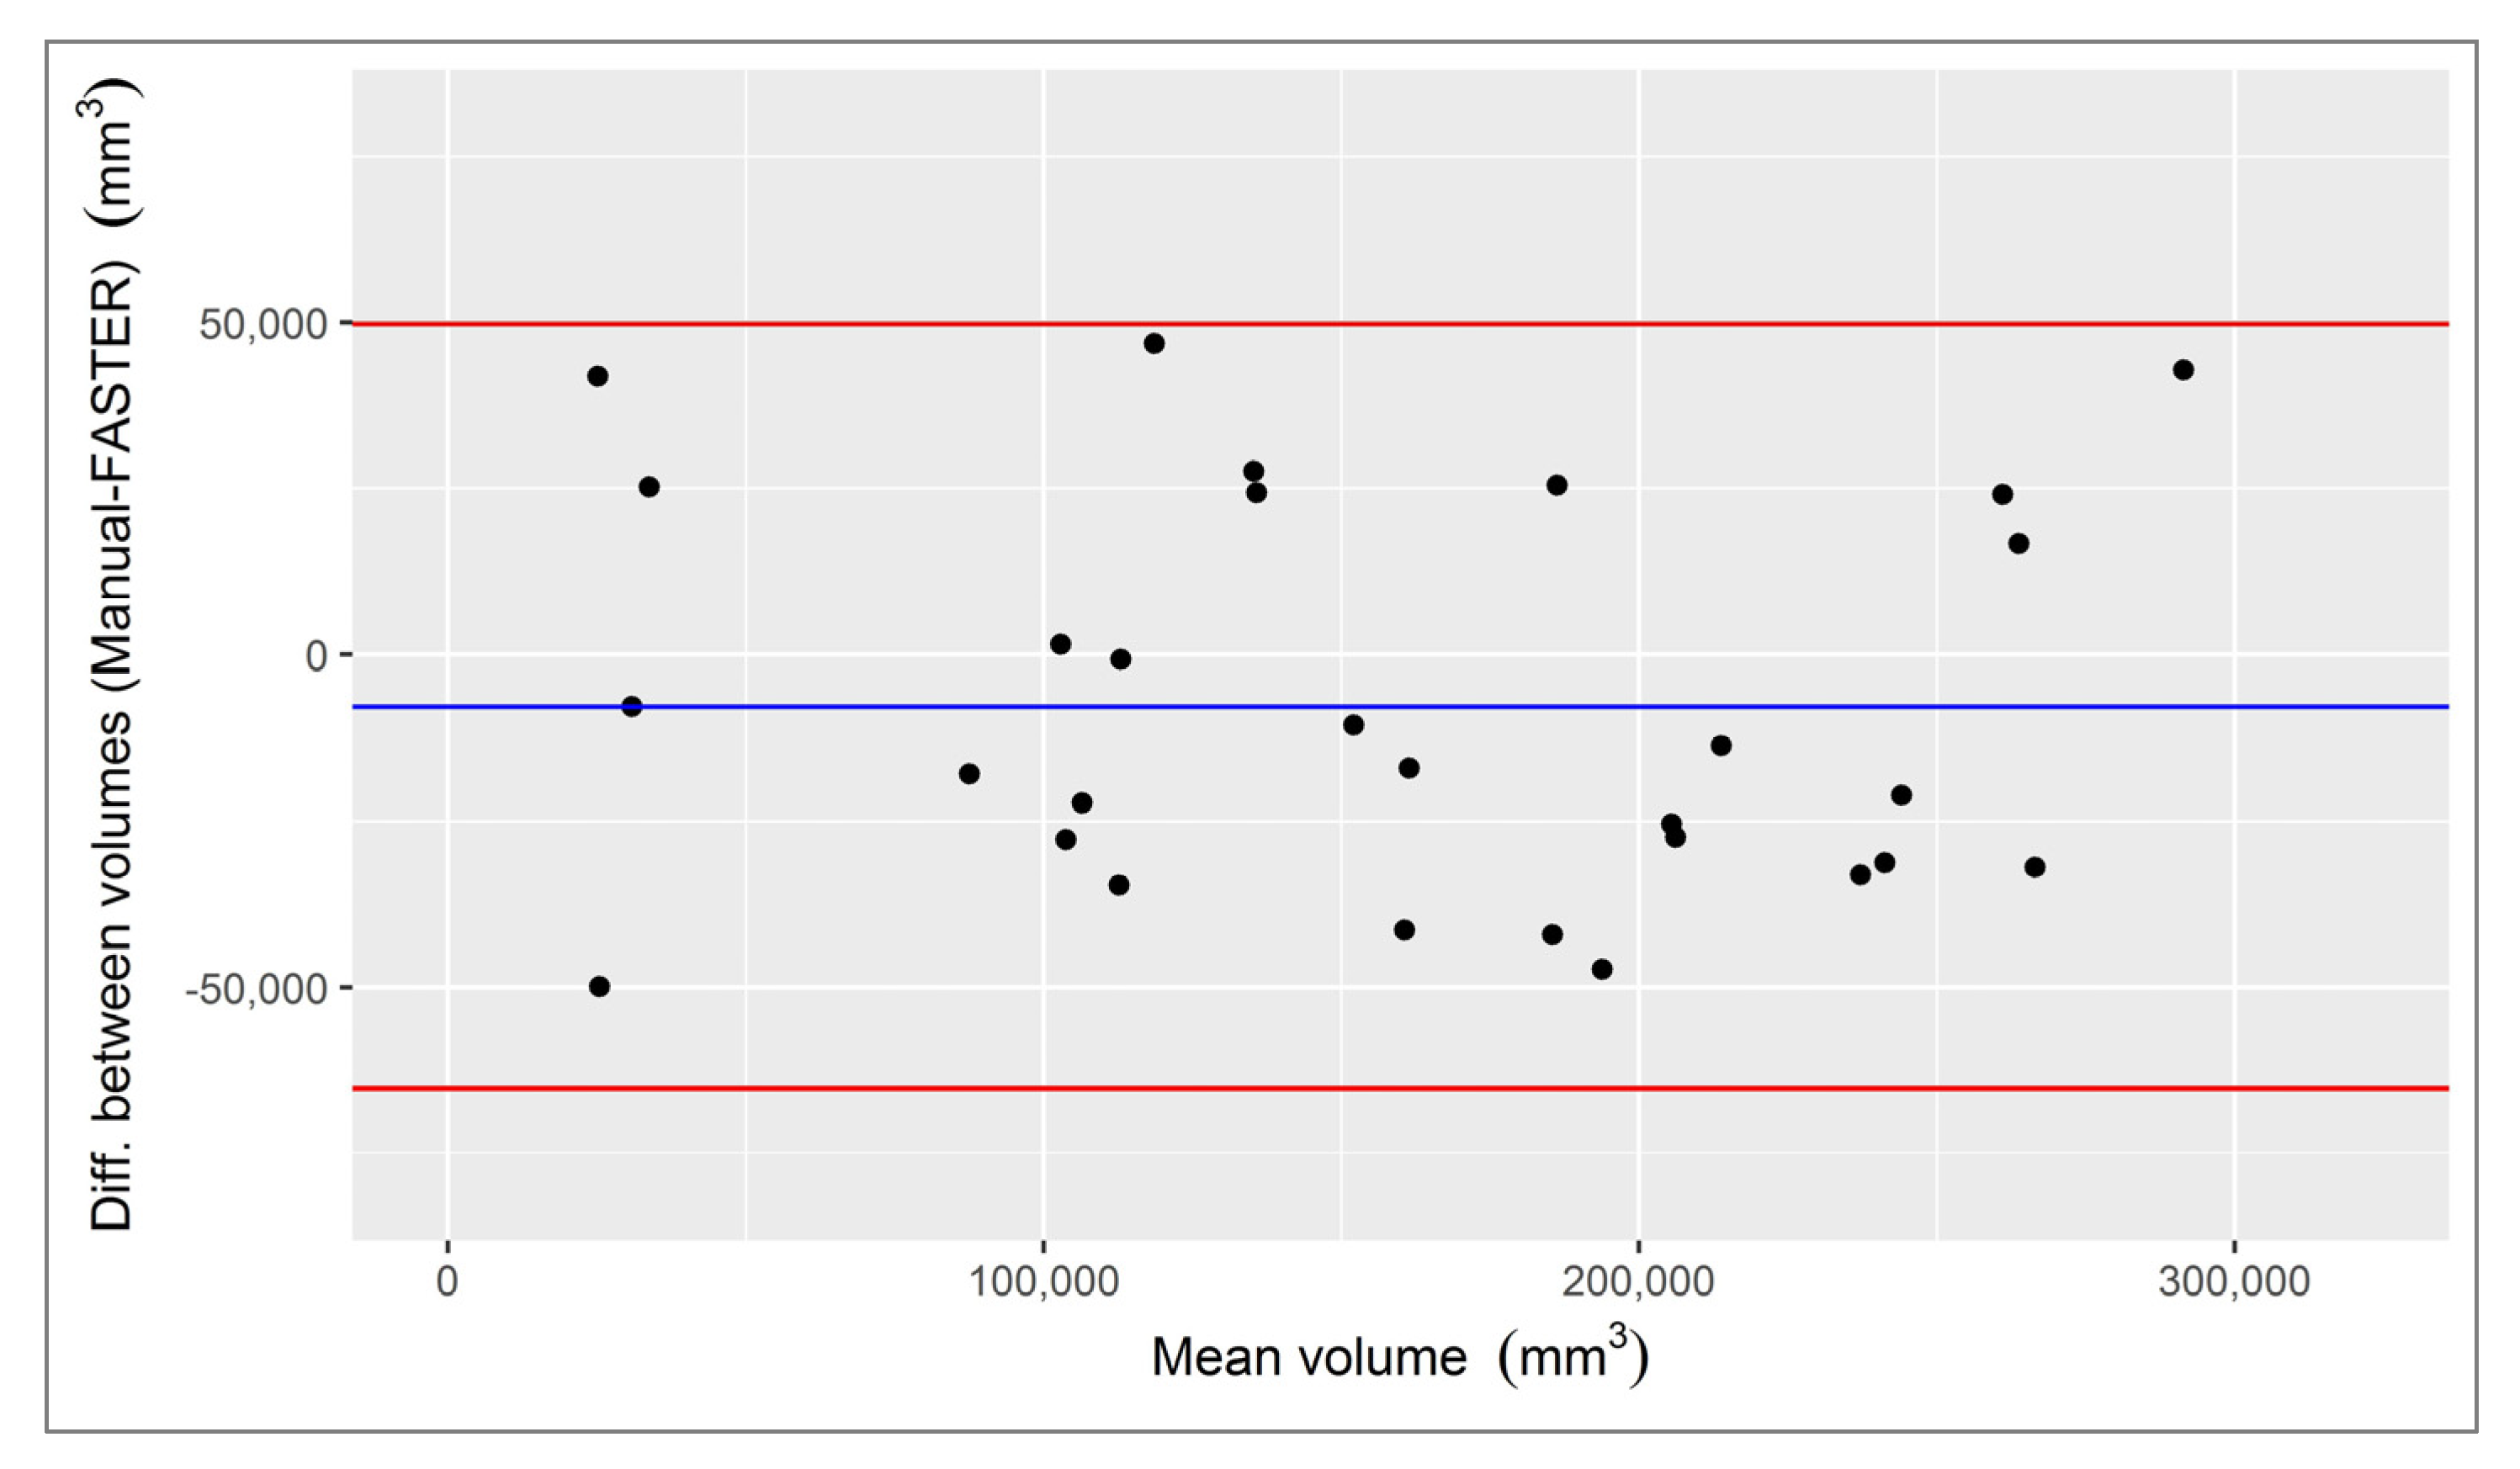
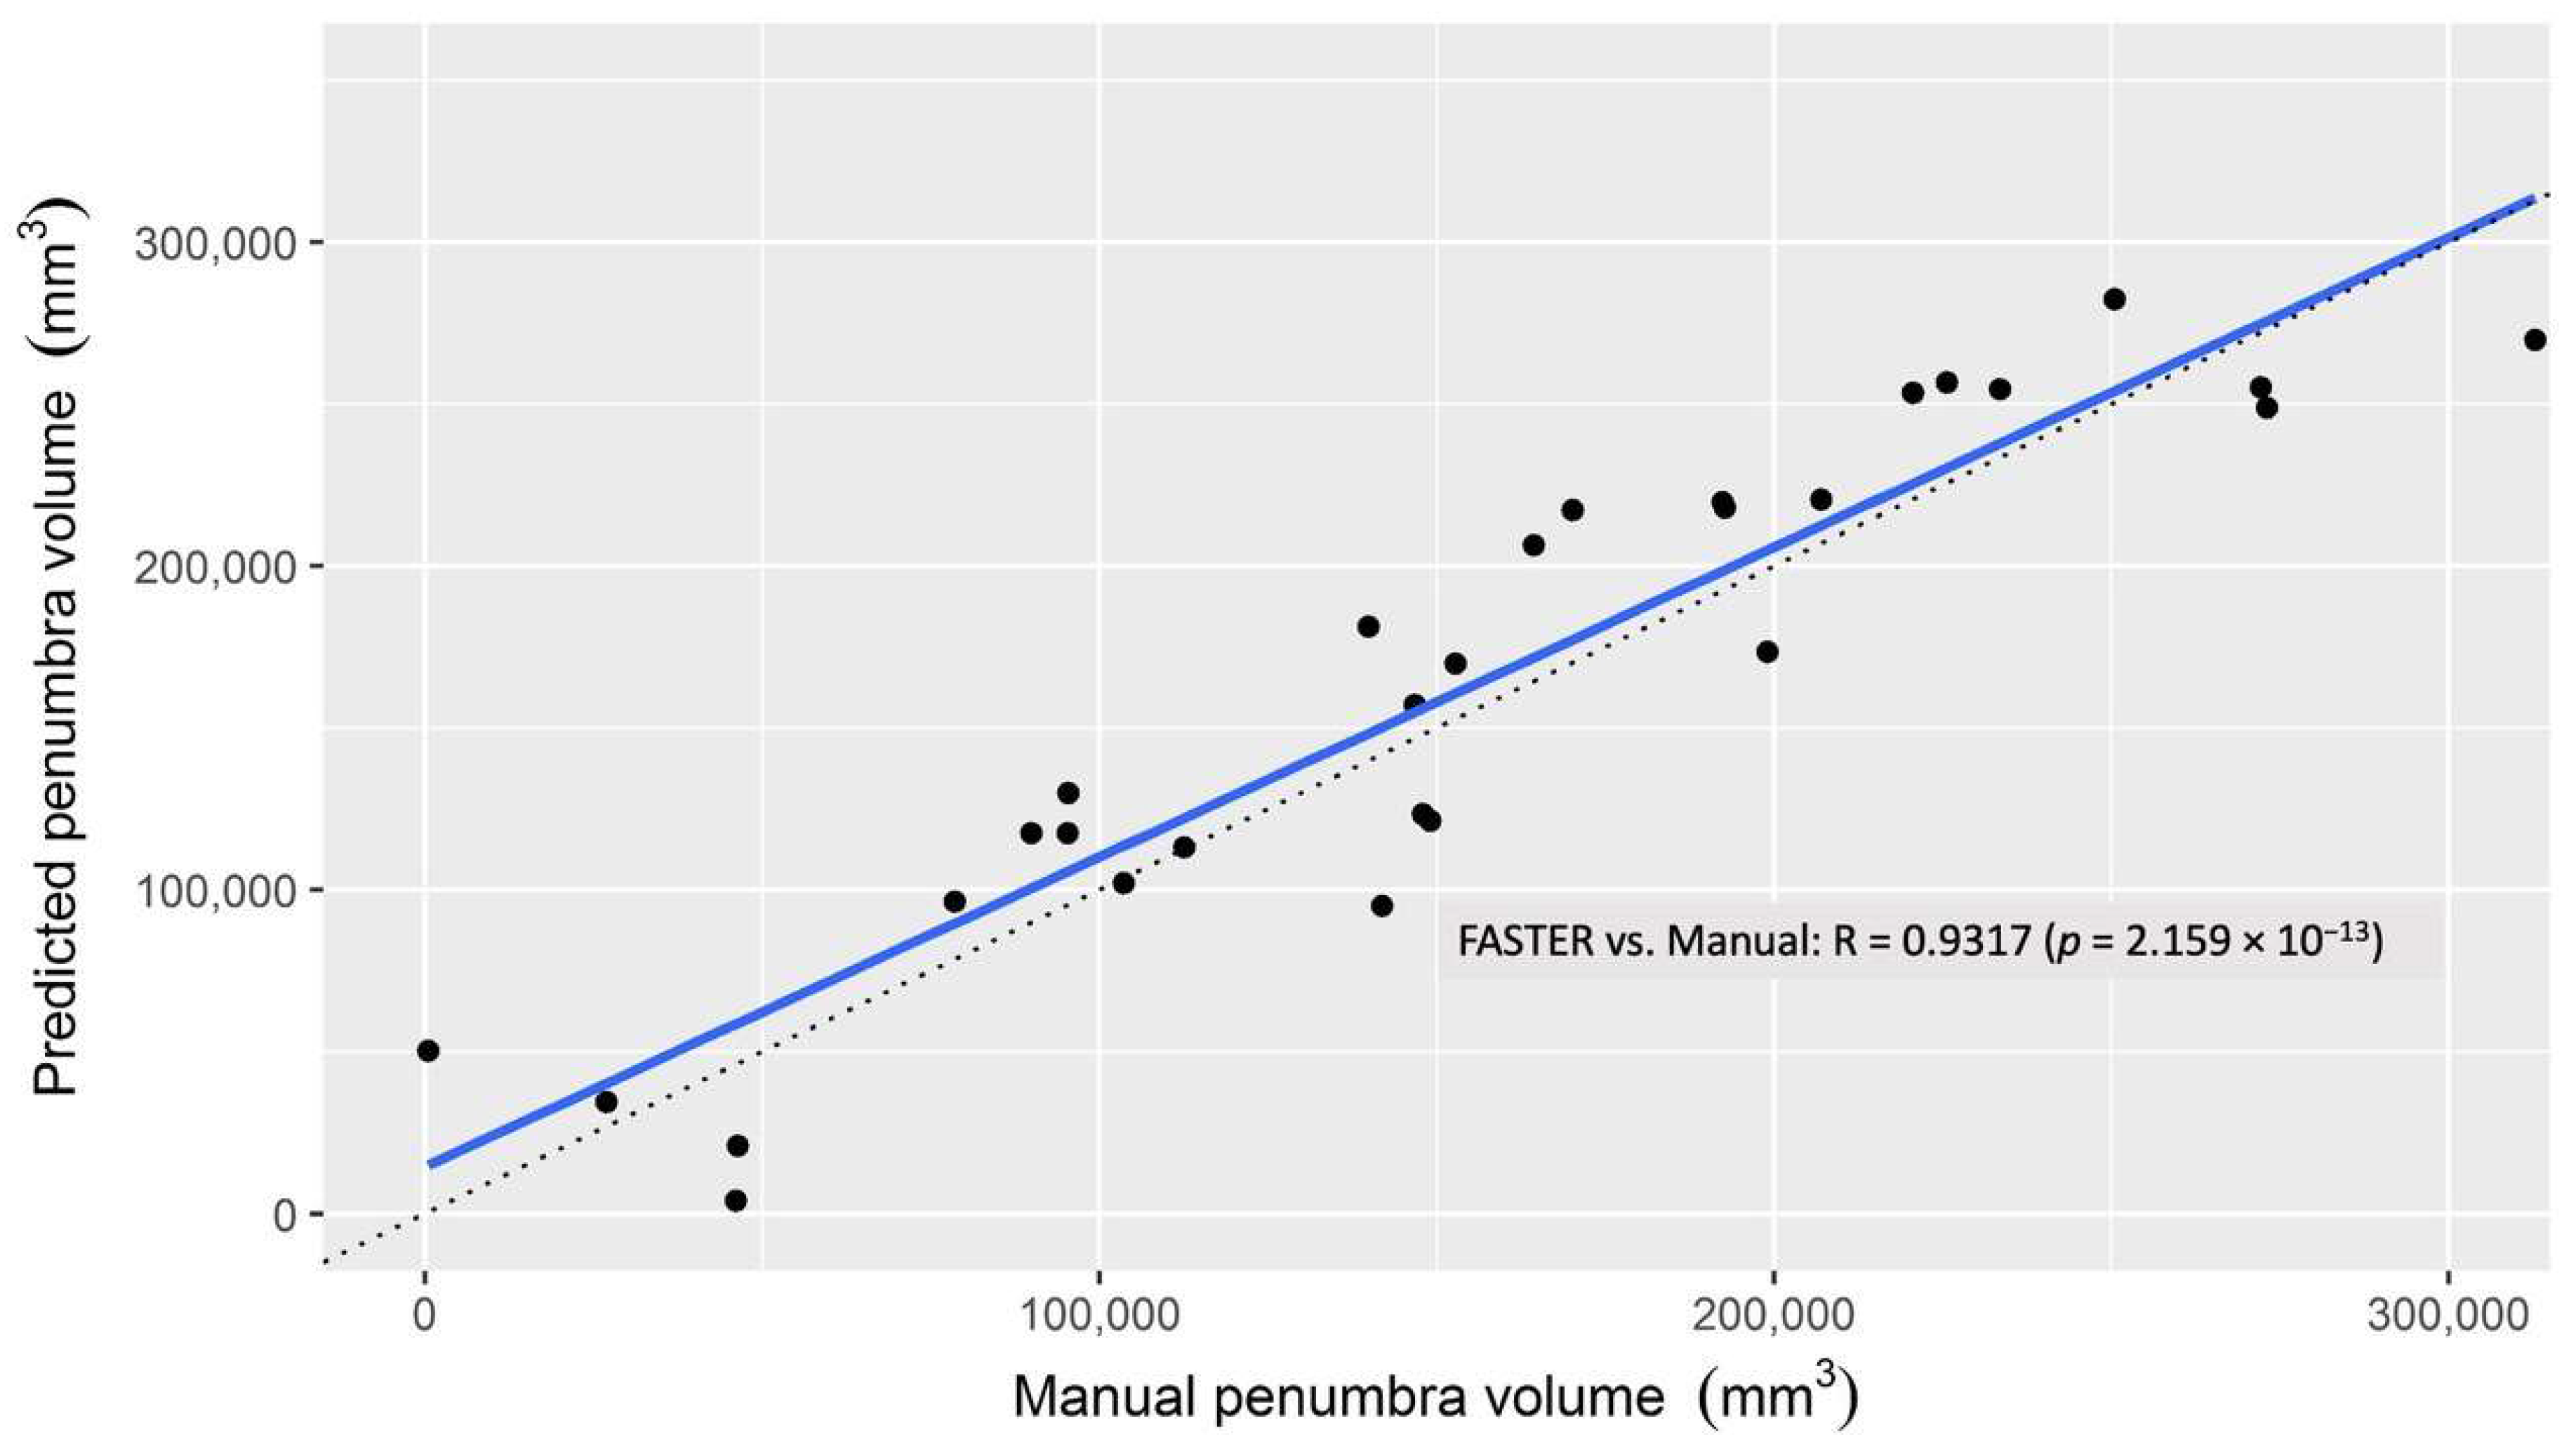
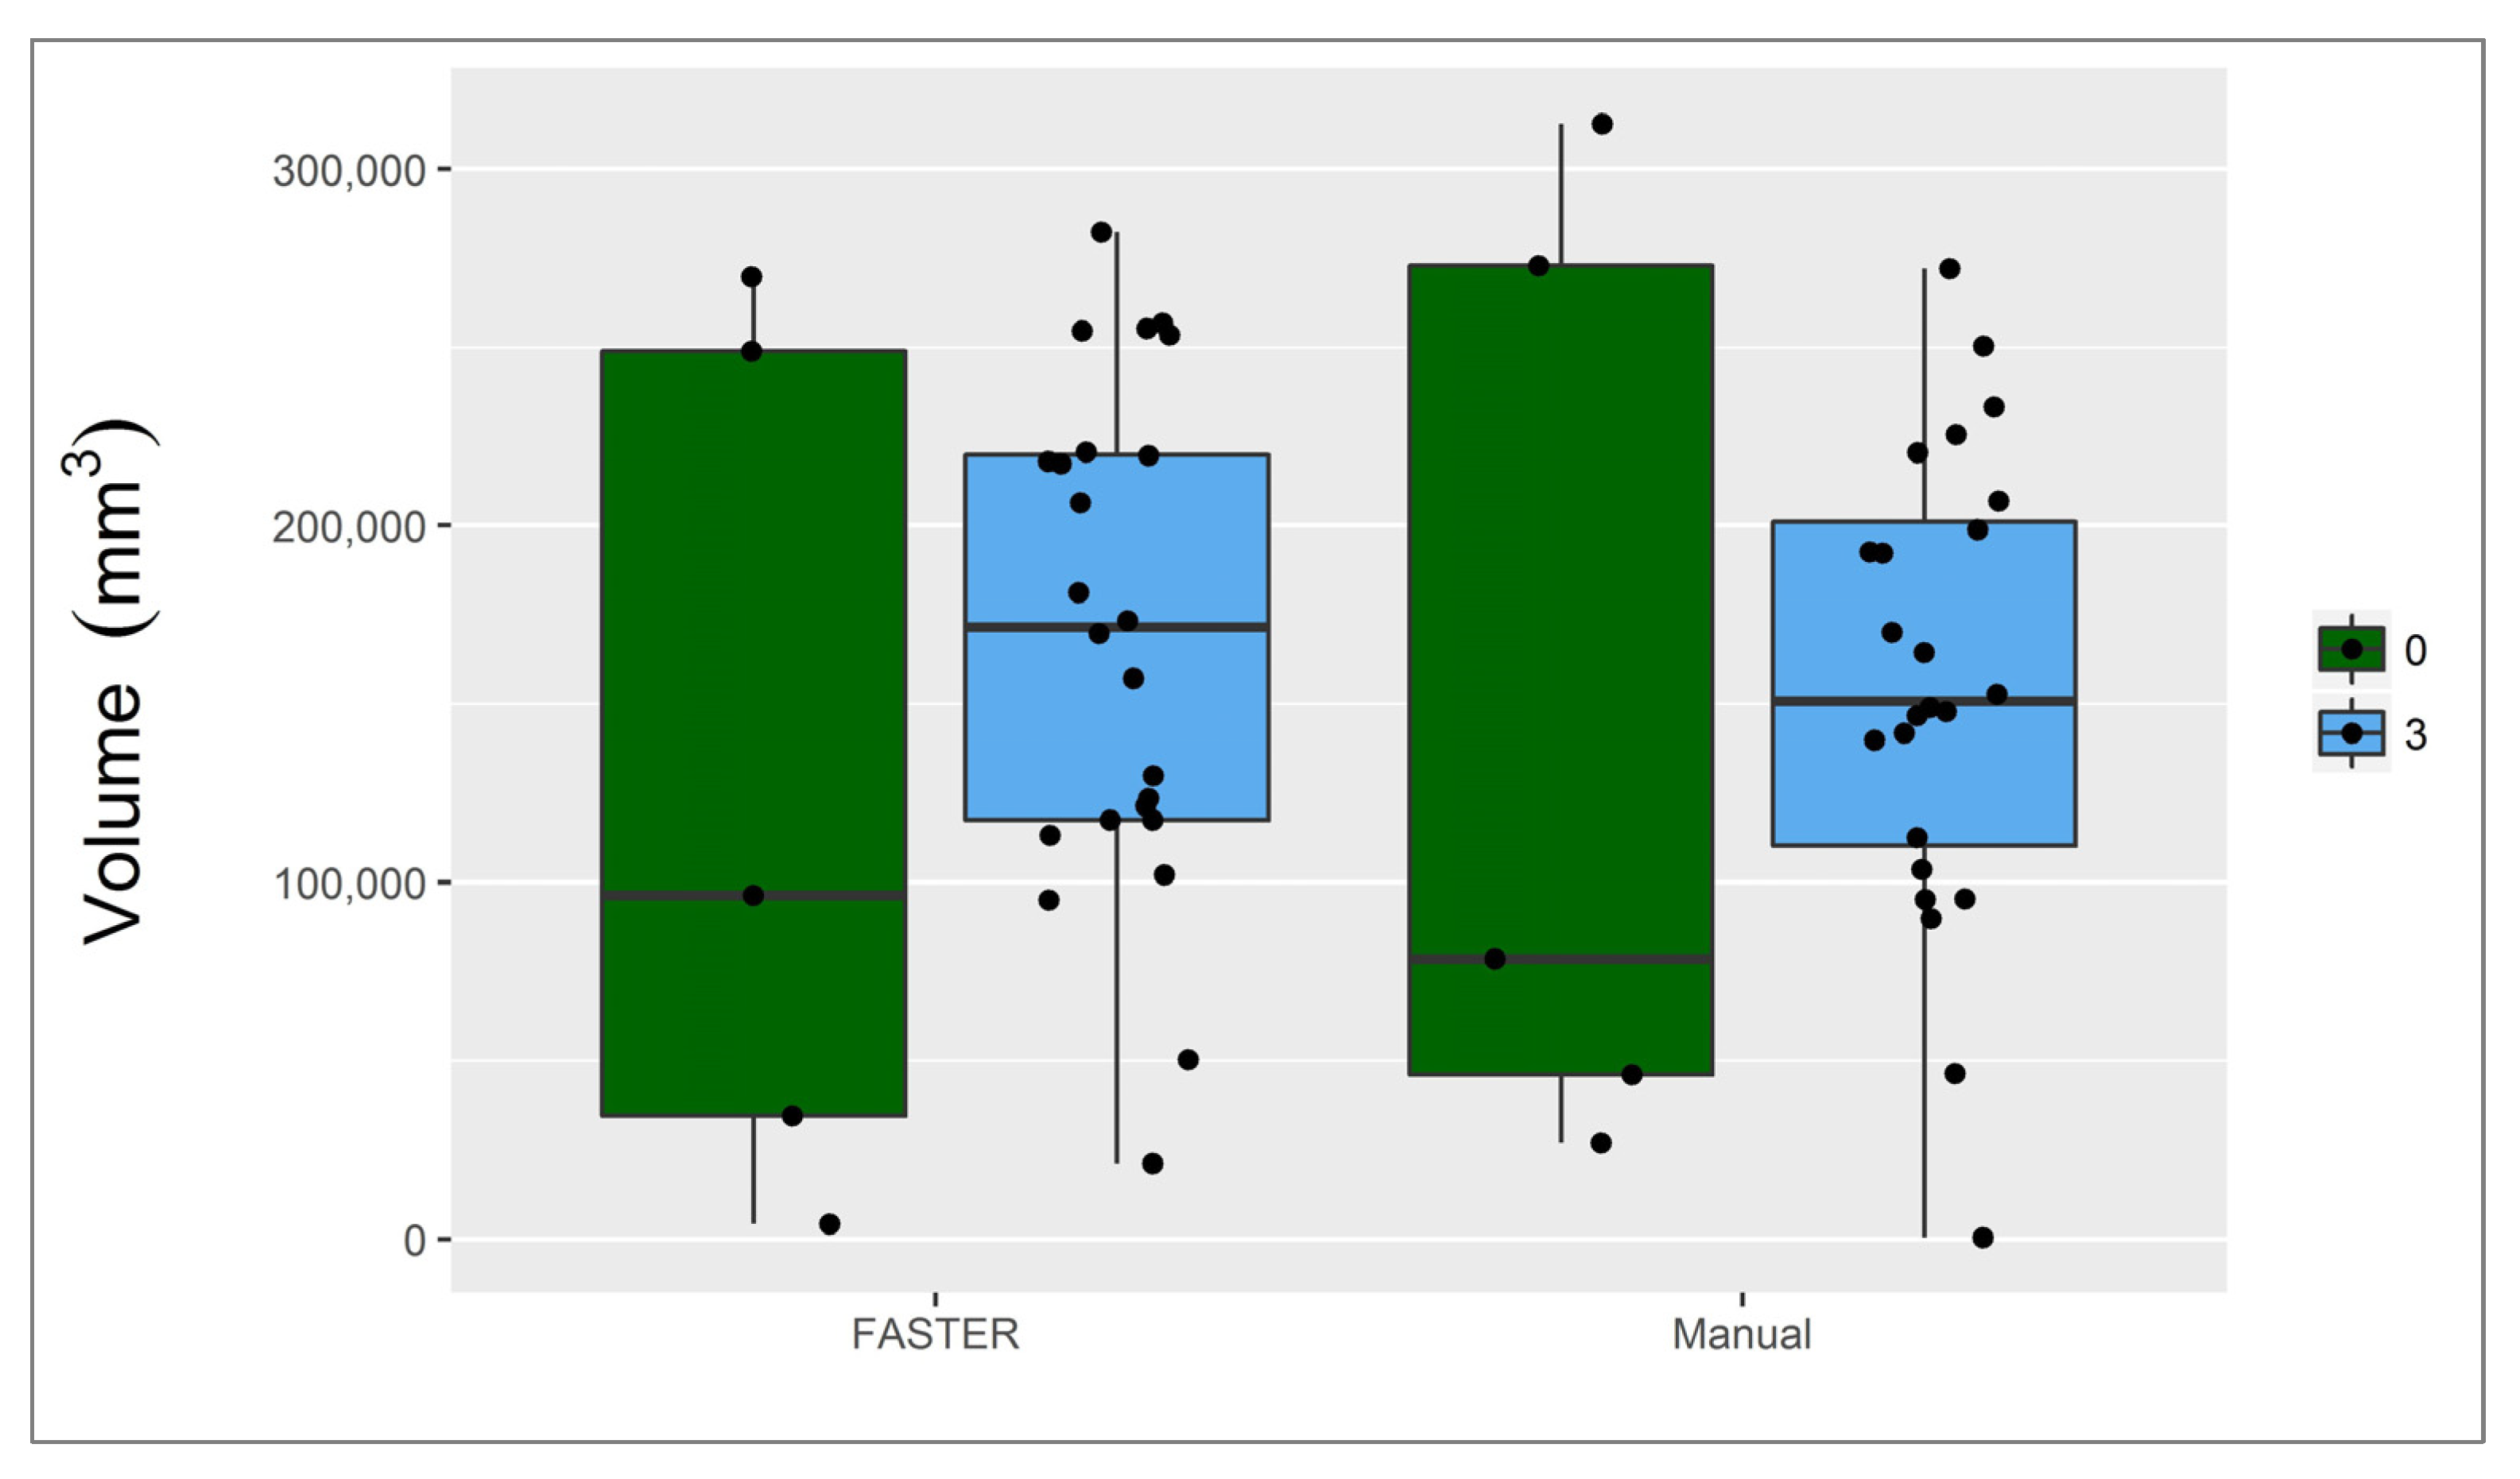
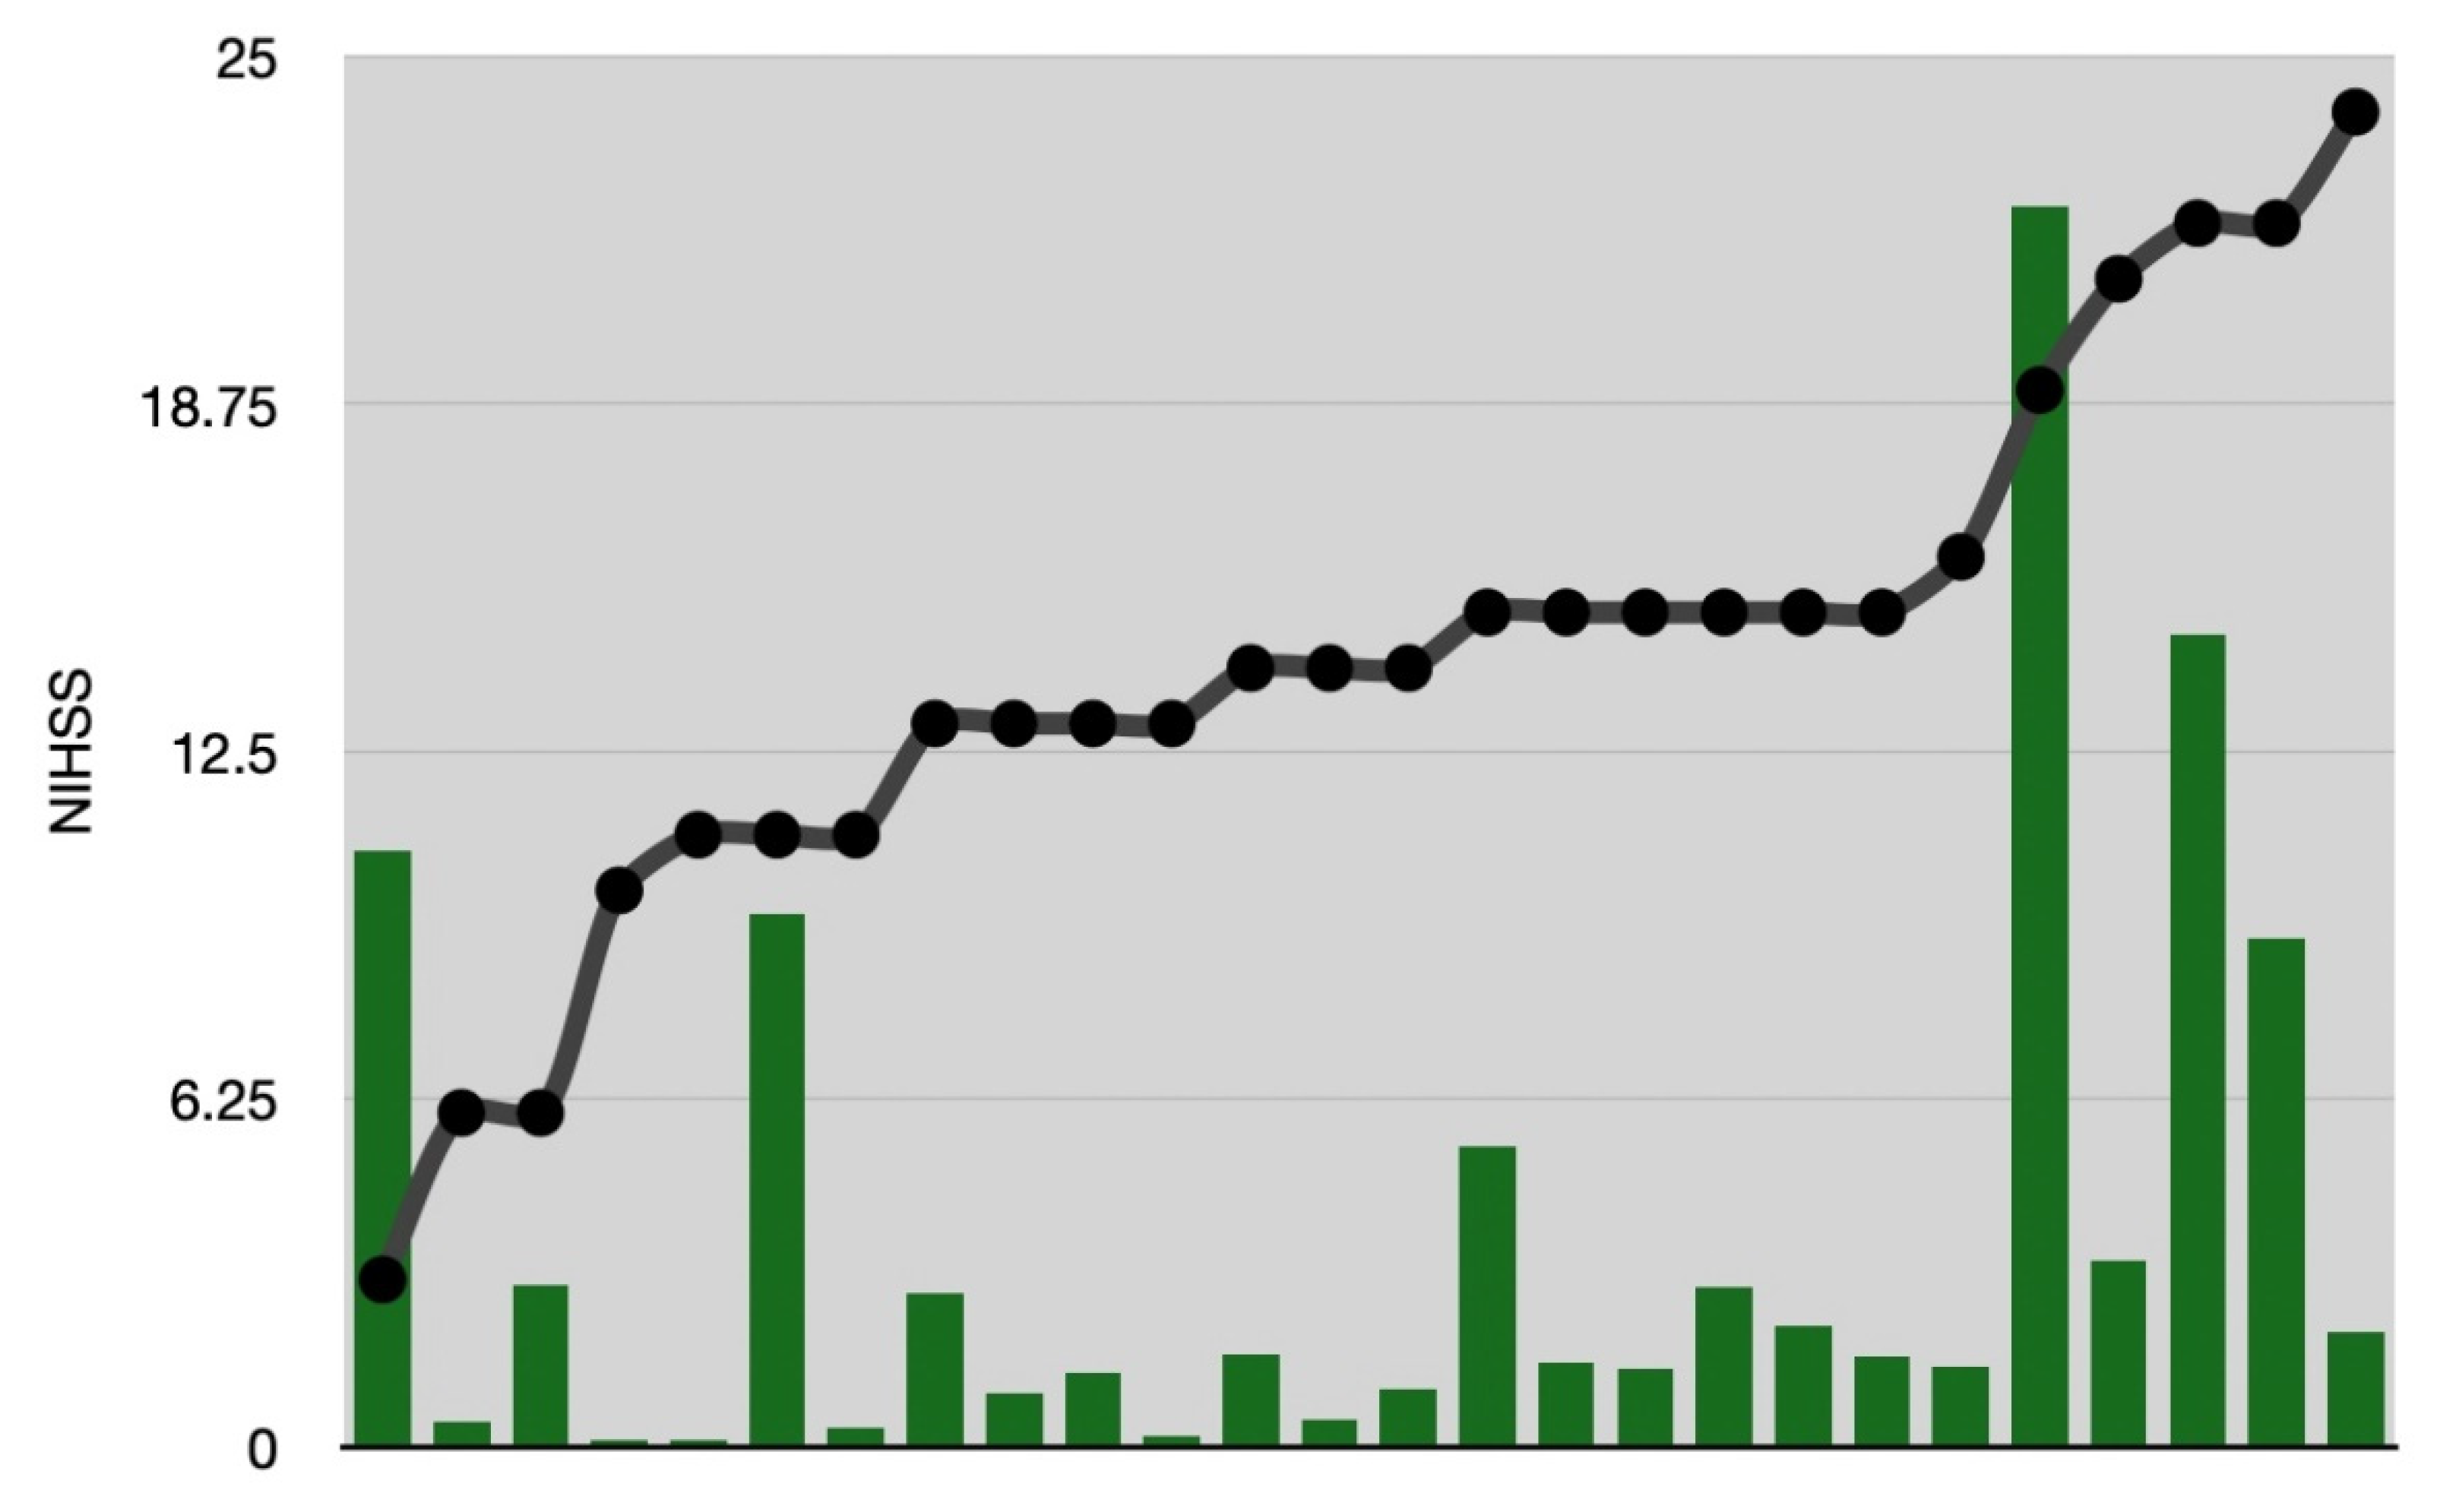
The calculated tissue at risk volume based on Tmax > 6 s (critical hypoperfusion) ranged from 480–312,800 mm3. (Median 149,040 mm3, IQR 95,340–206,970). Two patients (P 6 and P 9) were excluded due to artifacts in the Tmax perfusion map, leading to the inability to delineate the lesion. In these two patients, FASTER calculated the volume of at-risk-tissue to be 48,327 mm3 and 4695 mm3, respectively. The volume difference between the volume estimated by FASTER and the threshold method vary between −49,820 mm3 (overestimation of FASTER) and 46,832 mm3 (underestimation of FASTER). All results lie inside the limits of agreement (Figure 6). There is no clear trend between the size of the mean volume and the volume differences. The volume differences are distributed uniformly between cases. The correlation between the two volumes (i.e., estimated by FASTER and calculated by threshold method) is statistically significant with an overall correlation value R = 0.9317 and p = < 0.001 (Figure 7). For both groups (TICI 0 and TICI 3), FASTER overestimated the true penumbra volume compared to the conventional threshold method (Figure 8). The volume difference tended to be higher in cases with high NIHSS. The NIHSS of the patients with the highest volume difference was 19 and 22 (Figure 9). Notably, the differences were higher in the patients with an NIH below 11 and beyond 15.
No relation was found between volume difference and time to recanalization.

4. Discussion

The prediction accuracy of a decision forest was previously reported, in which the final lesion volume predicted by FASTER in the case of a poor response to therapy was significantly correlated with the final lesion volume. Since testing was restricted to cases having TICI scores 1–2 a, we have now extended the analysis to cases with TICI scores of 0 and 3. The results of our study indicate a trend towards overestimation of the final infarct volume in TICI 0 versus a trend towards underestimation in cases with complete reperfusion after therapy using FASTER.
Both the final infarction and tissue-at-risk may differ according to response to revascularization therapy [24], and the state of collaterals [29,30], which influenced the prediction accuracy of FASTER. In cases with no reperfusion after mechanical thrombectomy (TICI 0), FASTER, as expected, tended to overestimate the final infarction volume. In this study, we followed a strategy that defined a “final” infarction as a time point where periprocedural effects, inflammation, and tissue repair can be neglected as confounders, rather than to compare the lesion size earlier during lesion evolution, since apparent lesion size in the early acute phase is known to overestimate final lesion volume even in cases with complete revascularization. In cases with complete reperfusion after mechanical thrombectomy (TICI 3), FASTER tended to underestimate the true infarction volume, which tended to be larger with higher lesion volumes. Since the perfusion maps were processed with oSVD—a delay-sensitive approach—any delay in contrast bolus arrival (e.g., due to carotid stenosis or impaired cardiac function) may lead to overestimation of the results. The mean penumbra volume difference was found to be 7.8 mL; this volume appeared to be not related to the size of the effective penumbra. In summary, the results achieved a good accuracy, whereas precision was low. Improving the precision of detecting the infarction core and penumbra is mandatory for improved decision support in the selection of patients for reperfusion therapy beyond the defined treatment window. A principal advantage of the automated method is its robustness to artifacts. Due to the susceptibility of the singular value decomposition to noise and artifacts, the results of the perfusion parameters may not be accurate or maps can be distorted so that no decision can be made even by the experienced readers. In our series, FASTER allowed for predicting the tissue at risk in two additional cases where the FDA-cleared software failed [31]. The superiority of automated analysis could be subsequently demonstrated in further studies with arterial input function detection failures [32].
Technical factors such as image resolution, supervised implementation of feature extraction, and the initial training dataset may to some extent account for the differences between the FASTER algorithm and manual segmentation. FASTER perfusion maps were resampled to 2 mm isotropic resolution with linear interpolation; however, for the newer version, the original scanner resolution was used without any modifications. FASTER was trained on maps processed with block circulant decomposition using the Perfusion Mismatch Analyzer (PMA) from the Acute Stroke Imaging Standardization Group (ASIST) v3.4.0.6, but the testing cases in this study were processed by Olea v2.3. An additional factor for the difference was the inclusion criteria of patients, which included only patients with TICI 0 and TICI 3 only, and not all different responses to reperfusion therapy (TICI 0 to TICI 3). Clinical severity of stroke appears to be one of the factors that may influence the results, as high core and penumbra volume difference was often found in high NIHSS, and also a high percentage of volume difference for both FASTER and OLEA was found in cases with lower NIHSS.
Methods based on thresholds of different perfusion parameters still form the basis for decision support in different commercially available software [33] and are already integrated into clinical practice. However, there are inaccuracies and limitations of such methods, and there are already known significant differences between the commercially available software and sequences, even if identical source data were used, with insufficient correlations of true values and a lack of standardization [34,35,36,37,38]. Therefore, different attempts were made to move beyond the classical threshold-based methods to use semiautomated or fully automated methods [39]; lately, different works have focused on using deep learning methods to better differentiate the tissue at risk from the infarcted tissue, and challenges were organized to motivate researchers to develop advanced algorithms for evaluation of perfusion images in stroke patients [40,41], of which FASTER was one of the top-performing algorithms [40]. Other various machine learning models have been used for the prediction of tissue fate of processed perfusion parameters, but lately, different works reported the value of using the raw perfusion data instead of the already post-processed parameters, with good results [31,32,42,43,44,45,46]. Pinto et al. designed a fully automated deep learning method using both supervised and unsupervised learning to predict final stroke lesions after 90 days from multiparametric MRI imaging [47]. Combining clinical information with multimodal MRI images also reaches an improved performance [48]. Results from the ISLES 2018 challenge have recently demonstrated that machine learning methods may predict infarcted tissue from perfusion-CT with improved accuracy compared to threshold-based methods used in clinical routine [46]. More recently, quantitative evaluation of deep learning derived MR perfusion maps yielded a strong agreement across different threshold-based segmentation of Tmax perfusion maps for patient selections for thrombectomy, rendering automated image analysis methods suitable for point of care triage and decision support if a medical expert performs the second look [32].

Limitations

This is a retrospective study, with a limited number of patients from a single center and single perfusion processing software. Another limitation is that we did not calculate the interrater reliability, as the segmentation of the final infarction volume was performed primarily by a single rater and reviewed by a second rater to check for correctness, which showed a high interobserver agreement. The study focused on the evaluation of volumetric estimation of tissue at risk and final infarction, which does not take into account the topography of the lesion; therefore, the metrics as a dice similarity coefficient were not calculated. We decided to focus the analysis on the volumetric estimates since those estimates are most relevant for software solutions in decision support in strokes.

5. Conclusions

The volume estimation of FASTER for the infarction core and penumbra in predicting tissue fate varies according to the response to reperfusion therapy, generally with good accuracy, but with low precision. Both Tmax and FASTER overestimated the final infarction. FASTER performed better in the determination of tissue fate in cases with artifacts in which such determination is not possible using conventional methods. Using different processing techniques may impact the results of prediction.

Author Contributions

Conceptualization, R.W.; methodology, R.M. (Richard McKinley); software, R.M. (Richard McKinley); validation, R.M. (Raphael Meier); formal analysis, R.M. (Raphael Meier). resources, S.J.; data curation, B.M., T.D. and S.B.; writing—original draft preparation, A.H., B.M.; writing—review and editing, R.W.; visualization, R.M. (Raphael Meier); supervision, R.W. All authors have read and agreed to the published version of the manuscript.

Funding

This research received no external funding.

Institutional Review Board Statement

The study was conducted according to the guidelines of the Declaration of Helsinki, and approved by the Ethics Committee (Kantonale Ethikkommision Bern, Switzerland).

Informed Consent Statement

Informed consent was obtained from all subjects or from legally authorized representatives.

Data Availability Statement

Data is contained within the article.

Conflicts of Interest

The authors declare no conflict of interest.

References

  1. Cheng, B.; Golsari, A.; Fiehler, J.; Rosenkranz, M.; Gerloff, C.; Thomalla, G. Dynamics of regional distribution of ischemic lesions in middle cerebral artery trunk occlusion relates to collateral circulation. Br. J. Pharmacol. 2010, 31, 36–40. [Google Scholar] [CrossRef] [Green Version]
  2. Menezes, N.M.; Ay, H.; Zhu, M.W.; Lopez, C.J.; Singhal, A.B.; Karonen, J.O.; Aronen, H.J.; Liu, Y.; Nuutinen, J.; Koroshetz, W.J.; et al. The real estate factor. Stroke 2007, 38, 194–197. [Google Scholar] [CrossRef] [Green Version]
  3. Chen, Y.; Liu, Y.; Luo, C.; Lu, W.; Su, B. Analysis of multiple factors involved in acute progressive cerebral infarction and extra- and intracranial arterial lesions. Exp. Ther. Med. 2014, 7, 1495–1505. [Google Scholar] [CrossRef] [Green Version]
  4. Campbell, B.C.V.; Christensen, S.; Tress, B.M.; Churilov, L.; Desmond, P.M.; Parsons, M.W.; Barber, P.A.; Levi, C.; Bladin, C.; Donnan, G.; et al. Failure of collateral blood flow is associated with infarct growth in ischemic stroke. Br. J. Pharmacol. 2013, 33, 1168–1172. [Google Scholar] [CrossRef] [Green Version]
  5. Boulouis, G.; Lauer, A.; Siddiqui, A.K.; Charidimou, A.; Regenhardt, R.; Viswanathan, A.; Rost, N.; Leslie-Mazwi, T.M.; Schwamm, L.H. Clinical imaging factors associated with infarct progression in patients with ischemic stroke during transfer for mechanical thrombectomy. JAMA Neurol. 2017, 74, 1361–1367. [Google Scholar] [CrossRef]
  6. Goda, T.; Oyama, N.; Kitano, T.; Iwamoto, T.; Yamashita, S.; Takai, H.; Matsubara, S.; Uno, M.; Yagita, Y. Factors associated with unsuccessful recanalization in mechanical thrombectomy for acute ischemic stroke. Cerebrovasc. Dis. Extra 2019, 9, 107–113. [Google Scholar] [CrossRef] [PubMed]
  7. Campbell, B.C.V.; De Silva, D.A.; MacLeod, M.R.; Coutts, S.B.; Schwamm, L.H.; Davis, S.M.; Donnan, G.A. Ischaemic stroke. Nat. Rev. Dis. Prim. 2019, 5, 70. [Google Scholar] [CrossRef] [PubMed]
  8. Powers, W.J.; Rabinstein, A.A.; Ackerson, T.; Adeoye, O.M.; Bambakidis, N.C.; Becker, K.; Biller, J.; Brown, M.; Demaerschalk, B.M.; Hoh, B.; et al. Guidelines for the early management of patients with acute ischemic stroke: 2019 update to the 2018 guidelines for the early management of acute ischemic stroke: A guideline for healthcare professionals from the American Heart Association/American Stroke Association. Stroke 2019, 50, e344–e418. [Google Scholar] [CrossRef] [PubMed]
  9. Neumann-Haefelin, T.; Wenserski, F.; Siebler, M. The DWI/PWI mismatch region in acute stroke. Stroke 1999, 30, 1591–1597. [Google Scholar] [CrossRef] [Green Version]
  10. Purushotham, A.; Campbell, B.; Straka, M.; Mlynash, M.; Olivot, J.-M.; Bammer, R.; Kemp, S.M.; Albers, G.W.; Lansberg, M. Apparent diffusion coefficient threshold for delineation of ischemic core. Int. J. Stroke 2013, 10, 348–353. [Google Scholar] [CrossRef] [PubMed]
  11. Straka, M.; Albers, G.W.; Bammer, R. Real-time diffusion-perfusion mismatch analysis in acute stroke. J. Magn. Reson. Imaging 2010, 32, 1024–1037. [Google Scholar] [CrossRef] [PubMed] [Green Version]
  12. Campbell, B.C.V.; Purushotham, A.; Christensen, S.; Desmond, P.M.; Nagakane, Y.; Parsons, M.W.; Lansberg, M.; Mlynash, M.; Straka, M.; De Silva, D.A.; et al. The infarct core is well represented by the acute diffusion lesion: Sustained reversal is infrequent. Br. J. Pharmacol. 2011, 32, 50–56. [Google Scholar] [CrossRef] [PubMed]
  13. Olivot, J.-M.; Mlynash, M.; Thijs, V.N.; Kemp, S.; Lansberg, M.; Wechsler, L.; Bammer, R.; Marks, M.P.; Albers, G.W. Optimal tmax threshold for predicting penumbral tissue in acute stroke. Stroke 2009, 40, 469–475. [Google Scholar] [CrossRef]
  14. Olivot, J.-M.; Mlynash, M.; Thijs, V.N.; Purushotham, A.; Kemp, S.; Lansberg, M.G.; Wechsler, L.; Gold, G.E.; Bammer, R.; Marks, M.P.; et al. Geography, structure, and evolution of diffusion and perfusion lesions in diffusion and perfusion imaging evaluation for understanding stroke evolution (DEFUSE). Stroke 2009, 40, 3245–3251. [Google Scholar] [CrossRef] [PubMed] [Green Version]
  15. Soize, S.; Tisserand, M.; Charron, S.; Turc, G.; Ben Hassen, W.; Labeyrie, M.-A.; Legrand, L.; Mas, J.-L.; Pierot, L.; Meder, J.-F.; et al. How sustained is 24-Hour diffusion-weighted imaging lesion reversal? Stroke 2015, 46, 704–710. [Google Scholar] [CrossRef] [Green Version]
  16. Kidwell, C.S.; Saver, J.L.; Mattiello, J.; Starkman, S.; Vinuela, F.; Duckwiler, G.; Gobin, Y.P.; Jahan, R.; Vespa, P.; Kalafut, M.; et al. Thrombolytic reversal of acute human cerebral ischemic injury shown by diffusion/perfusion magnetic resonance imaging. Ann. Neurol. 2000, 47, 462–469. [Google Scholar] [CrossRef]
  17. Fiehler, J.; Foth, M.; Kucinski, T.; Knab, R.; von Bezold, M.; Weiller, C.; Zeumer, H.; Röther, J. Severe ADC decreases do not predict irreversible tissue damage in Humans. Stroke 2002, 33, 79–86. [Google Scholar] [CrossRef] [Green Version]
  18. Labeyrie, M.-A.; Turc, G.; Hess, A.; Hervo, P.; Mas, J.-L.; Meder, J.-F.; Baron, J.-C.; Touzé, E.; Oppenheim, C. Diffusion lesion reversal after thrombolysis. Stroke 2012, 43, 2986–2991. [Google Scholar] [CrossRef] [Green Version]
  19. Olivot, J.-M.; Mlynash, M.; Thijs, V.N.; Purushotham, A.; Kemp, S.; Lansberg, M.G.; Wechsler, L.; Bammer, R.; Marks, M.P.; Albers, G.W. Relationships between cerebral perfusion and reversibility of acute diffusion lesions in DEFUSE. Stroke 2009, 40, 1692–1697. [Google Scholar] [CrossRef]
  20. Meier, R.; Lux, P.; McKinley, R.; Jung, S.; Fischer, U.; Gralla, J.; Wiest, R.; Kaesmacher, J. Threshold-based identification of persistent infarction after successful endovascular treatment: Re-evaluating the “core”. medRxiv 2020. [Google Scholar] [CrossRef] [Green Version]
  21. Wouters, A.; Christensen, S.; Straka, M.; Mlynash, M.; Liggins, J.; Bammer, R.; Thijs, V.; Lemmens, R.; Albers, G.W.; Lansberg, M. A Comparison of relative time to peak and tmax for mismatch-based patient selection. Front. Neurol. 2017, 8, 539. [Google Scholar] [CrossRef] [PubMed] [Green Version]
  22. Nielsen, A.; Hansen, M.B.; Tietze, A.; Mouridsen, K. Prediction of tissue outcome and assessment of treatment effect in acute ischemic stroke using deep learning. Stroke 2018, 49, 1394–1401. [Google Scholar] [CrossRef] [PubMed]
  23. Breiman, L. Random forests. Mach. Learn. 2001, 45, 5–32. [Google Scholar] [CrossRef] [Green Version]
  24. McKinley, R.; Häni, L.; Gralla, J.; El-Koussy, M.; Bauer, S.; Arnold, M.; Fischer, U.; Jung, S.; Mattmann, K.; Reyes, M.; et al. Fully automated stroke tissue estimation using random forest classifiers (FASTER). Br. J. Pharmacol. 2016, 37, 2728–2741. [Google Scholar] [CrossRef] [Green Version]
  25. Brosch, T.; Yoo, Y.; Tang, L.Y.; Li, D.K.; Traboulsee, A.; Tam, R. Deep Convolutional Encoder Networks for Multiple Sclerosis Lesion Segmentation; Lecture Notes in Computer Science, Including Subseries Lecture Notes in Artificial Intelligence and Lecture Notes in Bioinformatics; Crimi, A., Menze, B., Maier, O., Reyes, M., Handels, H., Eds.; Springer International Publishing: Cham, Switzerland, 2016. [Google Scholar] [CrossRef]
  26. Jovin, T.G.; Chamorro, A.; Cobo, E.; De Miquel, M.A.; Molina, C.A.; Rovira, A.; Román, L.S.; Serena, J.; Abilleira, S.; Ribo, M.; et al. Thrombectomy within 8 hours after symptom onset in ischemic stroke. N. Engl. J. Med. 2015, 372, 2296–2306. [Google Scholar] [CrossRef] [PubMed] [Green Version]
  27. Deeks, J.; Dinnes, J.; D′Amico, R.; Sowden, A.J.; Sakarovitch, C.; Song, F.; Petticrew, M.; Altman, D.G. Evaluating non-randomised intervention studies. Health Technol. Assess. 2003, 7, 1–179. [Google Scholar] [CrossRef] [Green Version]
  28. Higashida, R.T.; Furlan, A.J.; Roberts, H.; Tomsick, T.; Connors, B.; Barr, J.; Dillon, W.; Warach, S.; Broderick, J.; Tilley, B.; et al. Erratum: Trial design and reporting standards for intra-arterial cerebral thrombolysis for acute ischemic stroke. Stroke 2003, 34, 2774. [Google Scholar] [CrossRef] [Green Version]
  29. Jung, S.; Gilgen, M.; Slotboom, J.; El-Koussy, M.; Zubler, C.; Kiefer, C.; Luedi, R.; Mono, M.-L.; Heldner, M.R.; Weck, A.; et al. Factors that determine penumbral tissue loss in acute ischaemic stroke. Brain 2013, 136, 3554–3560. [Google Scholar] [CrossRef]
  30. Jung, S.; Wiest, R.; Gralla, J.; McKinley, R.; Mattle, H.; Liebeskind, D. Relevance of the cerebral collateral circulation in ischaemic stroke: Time is brain, but collaterals set the pace. Swiss Med. Wkly. 2017, 147, w14538. [Google Scholar] [CrossRef]
  31. McKinley, R.; Hung, F.; Wiest, R.; Liebeskind, D.S.; Scalzo, F. A machine learning approach to perfusion imaging with dynamic susceptibility contrast MR. Front. Neurol. 2018, 9, 717. [Google Scholar] [CrossRef]
  32. Meier, R.; Lux, P.; Med, B.; Jung, S.; Fischer, U.; Gralla, J.; Reyes, M.; Wiest, R.; McKinley, R.; Kaesmacher, J. Neural network–derived perfusion maps for the assessment of lesions in patients with acute ischemic stroke. Radiol. Artif. Intell. 2019, 1, e190019. [Google Scholar] [CrossRef] [PubMed]
  33. Cereda, C.W.; Christensen, S.; Campbell, B.C.V.; Mishra, N.; Mlynash, M.; Levi, C.; Straka, M.; Wintermark, M.; Bammer, R.; Albers, G.W.; et al. A benchmarking tool to evaluate computer tomography perfusion infarct core predictions against a DWI standard. Br. J. Pharmacol. 2016, 36, 1780–1789. [Google Scholar] [CrossRef] [Green Version]
  34. Kudo, K.; Sasaki, M.; Yamada, K.; Momoshima, S.; Utsunomiya, H.; Shirato, H.; Ogasawara, K. Differences in CT perfusion maps generated by different commercial software: Quantitative analysis by using identical source data of acute stroke patients. Radiology 2010, 254, 200–209. [Google Scholar] [CrossRef] [PubMed] [Green Version]
  35. Fahmi, F.; Marquering, H.; Streekstra, G.; Beenen, L.; Velthuis, B.; van Bavel, E.; Majoie, C. Differences in CT perfusion summary maps for patients with acute ischemic stroke generated by 2 software packages. Am. J. Neuroradiol. 2012, 33, 2074–2080. [Google Scholar] [CrossRef] [Green Version]
  36. Kudo, K.; Christensen, S.; Sasaki, M.; Østergaard, L.; Shirato, H.; Ogasawara, K.; Wintermark, M.; Warach, S. Accuracy and reliability assessment of CT and MR perfusion analysis software using a digital phantom. Radiology 2013, 267, 201–211. [Google Scholar] [CrossRef] [PubMed]
  37. Zussman, B.M.; Boghosian, G.; Gorniak, R.J.; Olszewski, M.E.; Read, K.M.; Siddiqui, K.M.; Flanders, A.E. The relative effect of vendor variability in CT perfusion results: A method comparison study. Am. J. Roentgenol. 2011, 197, 468–473. [Google Scholar] [CrossRef] [PubMed]
  38. Rava, R.A.; Snyder, K.V.; Mokin, M.; Waqas, M.; Zhang, X.; Podgorsak, A.R.; Allman, A.B.; Senko, J.; Bhurwani, M.M.S.; Hoi, Y.; et al. Assessment of computed tomography perfusion software in predicting spatial location and volume of infarct in acute ischemic stroke patients: A comparison of Sphere, Vitrea, and RAPID. J. NeuroInterv. Surg. 2021, 13, 130–135. [Google Scholar] [CrossRef]
  39. Rekik, I.; Allassonnière, S.; Carpenter, T.K.; Wardlaw, J.M. Medical image analysis methods in MR/CT-imaged acute-subacute ischemic stroke lesion: Segmentation, prediction and insights into dynamic evolution simulation models. A critical appraisal. NeuroImage Clin. 2012, 1, 164–178. [Google Scholar] [CrossRef] [Green Version]
  40. Maier, O.; Menze, B.; von der Gablentz, J.; Häni, L.; Heinrich, M.P.; Liebrand, M.; Winzeck, S.; Basit, A.; Bentley, P.; Chen, L.; et al. ISLES 2015—A public evaluation benchmark for ischemic stroke lesion segmentation from multispectral MRI. Med. Image Anal. 2017, 35, 250–269. [Google Scholar] [CrossRef] [Green Version]
  41. Winzeck, S.; Hakim, A.; McKinley, R.; Pinto, J.A.; Alves, V.; Silva, C.; Pisov, M.; Krivov, E.; Belyaev, M.; Monteiro, M.; et al. ISLES 2016 and 2017—Benchmarking ischemic stroke lesion outcome prediction based on multispectral MRI. Front. Neurol. 2018, 9, 679. [Google Scholar] [CrossRef]
  42. Ho, K.C.; Scalzo, F.; Sarma, K.V.; El-Saden, S.; Arnold, C.W. A temporal deep learning approach for MR perfusion parameter estimation in stroke. In Proceedings of the 2016 23rd International Conference on Pattern Recognition (ICPR), Cancun, Mexico, 4–8 December 2016; IEEE: Piscataway, NJ, USA, 2016; pp. 1315–1320. [Google Scholar]
  43. Hess, A.; Meier, R.; Kaesmacher, J.; Jung, S.; Scalzo, F.; Liebeskind, D.; Wiest, R.; McKinley, R. Synthetic Perfusion Maps: Imaging Perfusion Deficits in DSC-MRI with Deep Learning; Springer International Publishing: New York, NY, USA, 2019; pp. 447–455. [Google Scholar]
  44. Ulas, C.; Tetteh, G.; Thrippleton, M.J.; Armitage, P.A.; Makin, S.D.; Wardlaw, J.M.; Davies, M.E.; Menze, B. Direct Estimation of Pharmacokinetic Parameters from DCE-MRI Using Deep CNN with Forward Physical Model Loss; Springer: Berlin/Heidelberg, Geramany, 2018; pp. 39–47. [Google Scholar]
  45. Pinto, A.; Amorim, J.; Hakim, A.; Alves, V.; Reyes, M.; Silva, C.A. Prediction of stroke lesion at 90-day follow-up by fusing raw DSC-MRI with parametric maps using deep learning. IEEE Access 2021, 9, 26260–26270. [Google Scholar] [CrossRef]
  46. Hakim, A.; Christensen, S.; Winzeck, S.; Lansberg, M.G.; Parsons, M.W.; Lucas, C.; Robben, D.; Wiest, R.; Reyes, M.; Zaharchuk, G. Predicting infarct core from computed tomography perfusion in acute ischemia with machine learning: Lessons from the ISLES challenge. Stroke 2021, 52, 2328–2337. [Google Scholar] [CrossRef] [PubMed]
  47. Pinto, A.; Pereira, S.; Meier, R.; Wiest, R.; Alves, V.; Reyes, M.; Silva, C.A. Combining unsupervised and supervised learning for predicting the final stroke lesion. Med. Image Anal. 2021, 69, 101888. [Google Scholar] [CrossRef] [PubMed]
  48. Pinto, A.; McKinley, R.; Alves, V.; Wiest, R.; Silva, C.A.; Reyes, M. Stroke lesion outcome prediction based on MRI imaging combined with clinical Information. Front. Neurol. 2018, 9, 1060. [Google Scholar] [CrossRef]
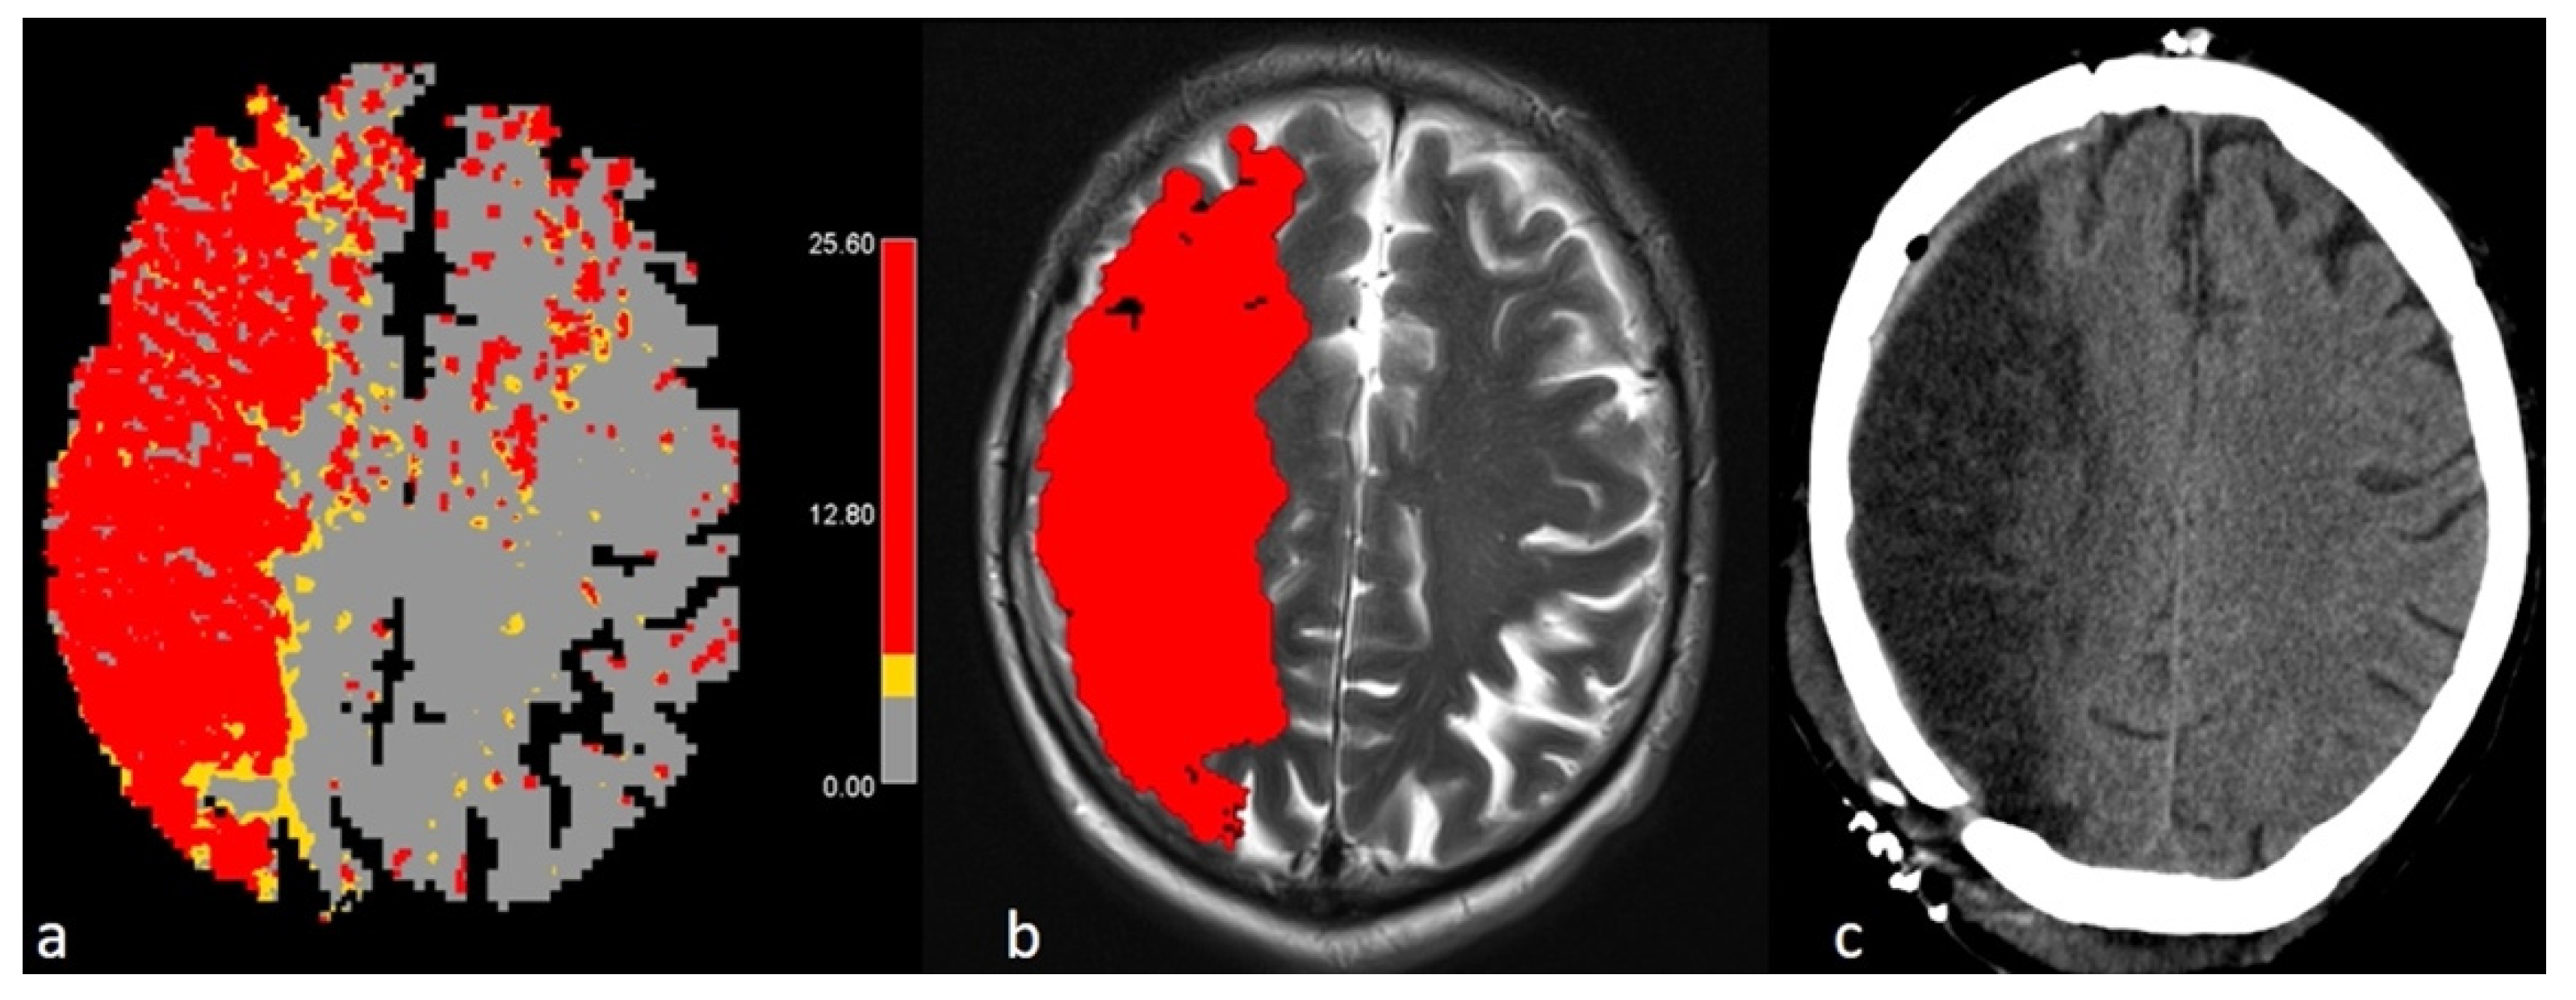
Figure 1. Example of a 61-year-old male patient with occlusion of the right MCA, and a TICI 0 score after therapy. Tmax image showing the critical hypoperfusion (>6 s) (a). The estimated infarction prediction by FASTER is superimposed on the T2 image (b). Follow-up CT showing the final infarction (c).
Ctn 05 00021 g001
Figure 2. Bland Altmann plot for the differences between the predicted volumes of FASTER and the manually segmented final infarction volumes.
Ctn 05 00021 g002
Figure 3. Linear correlation curve of the manually defined (x-axis) and automatically predicted (y-axis) final infarction volumes.
Ctn 05 00021 g003
Figure 4. Graph showing the relation between NIHSS (black line) and the percentage of volume difference (volume difference between the estimated volume and the true infarction volume in relation to the true infarction volume).
Ctn 05 00021 g004
Figure 5. Boxplot diagram of the comparison between the predicted final infarction volumes by FASTER and the manually segmented final infarction volumes on follow-up imaging, divided according to TICI score: TICI 0 (green) and TICI 3 (blue).
Ctn 05 00021 g005
Figure 6. Bland Altmann plot for the differences in the volume of tissue at risk as estimated by FASTER and calculated by the threshold method.
Ctn 05 00021 g006
Figure 7. Linear correlation curve of the penumbra between the threshold method (x-axis) and FASTER (y-axis).
Ctn 05 00021 g007
Figure 8. Boxplot diagram of the comparison between the volumes of tissue at risk as estimated by FASTER and the manual delineation based on the Tmax threshold, divided according to TICI score: TICI 0 (green) and TICI 3 (blue).
Ctn 05 00021 g008
Figure 9. Graph showing the relation between NIHSS (black line) and the absolute volume difference of the penumbra (the difference between the estimated penumbra volume by FASTER and the volume of Tmax > 6 s).
Ctn 05 00021 g009
Table 1. Demographics and infarction core and penumbra volumes.
NumberAgeGenderNIHSSTime to Imaging (min)Time to i.v. Thrombolysis (min)Time to DSA (min)Time to Thrombectomy /i.a. Thrombolysis (min)TICIFollow-UpInfarction Core FASTER (cm3)Final Infarction Ground Truth (cm3)Penumbra FASTER (cm3)Penumbra Tmax > 6 s (cm3)
161m22120--2832950CT303.1270.7248.9273.1
279m1976--1502150CT420.6192.9270.0312.8
364f11180--2393130FLAIR86.874.996.578.6
486f7172180245--0CT31.62.34.246.1
554f0217230450--0FLAIR31.30.534.726.9
656m22149--2112683T22.784.548.3N/A
769f22240--3603903FLAIR32.784.0220.6207.0
832m14250--3103703CT9.30.0123.5147.9
970m151051501922523FLAIR0.430.64.7N/A
1073m101141501882533T21.60.7218.1192.7
1161f151231521543303T26.815.2206.5164.4
1267m151682002602903T217.79.8219.7192.4
1386m111101401832003T20.10.8117.689.9
1472m211001351942053FLAIR45.664.4157.2146.8
1573f61141602012273T20.32.850.30.5
1645m1485--1952073T223.526.2121.4149.0
1759f15102--2222353T29.225.3217.4170.1
1855m1983--1501943T235.6160.4173.5199.0
1958m14748--8408603T218.312.5254.6233.5
2070f6260--3435033T20.016.321.146.4
2151m13104--1661803T25.721.1102.1103.6
2272m13107--1902043FLAIR1.26.6255.3272.1
2376m13831401572003T23.110.6130.095.3
2485f16----**3FLAIR13.45.3253.6220.6
2576m152172502792813CT23.435.595.1141.9
2678m11103--1581643FLAIR2.255.8256.8225.6
2763m376--1711903FLAIR3.463.4113.2112.6
2884f15148--1952223CT8.417.4169.8152.8
2963f11127--1532193FLAIR4.96.8117.595.2
3071f24----**3FLAIR40.251.8282.4250.5
3174f1396--1271763FLAIR0.51.6181.3139.9
* Unknown symptom onset.
Publisher’s Note: MDPI stays neutral with regard to jurisdictional claims in published maps and institutional affiliations.