1. Introduction
The rising prominence of additive manufacturing can be clearly observed in the upward trend of patent applications related to the technology [
1]. Fused deposition modeling (FDM) is among the most widely adopted additive manufacturing technologies and, yet accurate cost estimation remains challenging, particularly due to the limited consideration of tooling wear. Existing cost models typically rely on time-based assumptions, which often fail to capture the actual wear behavior of critical consumables such as nozzles. This paper presents an extension of a previously established FDM cost estimation framework by introducing a volumetric wear-based calculation method. In contrast to the time-based approach, the proposed volumetric model accounts for nozzle degradation as a function of extruded material volume, providing a closer representation of real wear mechanisms. The methodology is applied across representative scenarios with different model-to-support ratios, where the volumetric approach shows significant deviations from the traditional time-based estimation. These differences highlight cases where the time-based model over- or underestimates tooling costs, leading to systematic errors in part cost prediction. By integrating volumetric wear into the overall cost framework, the refined model delivers more accurate estimates of total part cost and enhances the economic reliability of FDM cost analysis, supporting better-informed decision-making in both prototyping and small-batch manufacturing contexts. The capacity of AM to accommodate high part diversity is especially valuable during product development phases, when frequent design iterations and modifications are required. However, this high degree of variability also poses challenges for cost estimation, as the wide range of possible geometries and process parameters complicates the establishment of standardized cost models [
2]. Since there is a multifaceted relationship between manufacturing costs and process parameters, it is essential to record the manufacturing parameters in a standardized manner to ensure that all characteristics of the printed part remain reproducible and comparable. Efforts in this direction are currently ongoing, focusing on improving documentation practices and promoting standardization across the field [
3]. The printing parameters all influence manufacturing costs, yet their analysis is currently focused more on understanding their impact on part performance, which itself remains a complex and challenging area of research to achieve accurate estimations on lifecycles of parts [
4].
In general, the competitiveness of AM technology can be assessed with the break-even curves. This represents the intersection point of the per-unit cost curves for traditionally manufactured and additively manufactured parts. As the number of parts increases, the cost per unit for additive manufacturing decreases slightly or remains nearly constant, while the cost per unit for traditional manufacturing decreases more significantly due to economies of scale. The point where the two curves intersect is known as the break-even point—this indicates the production volume at which the cost of manufacturing one part is the same with both methods. Beyond this point, traditional manufacturing becomes more cost effective per unit than additive manufacturing [
5].
During a literature review, it was observed that cost estimation models for additive manufacturing technologies rely on different approaches and also depends on the variation [
6,
7]. These approaches include break-down, operation-based, parametric, and activity-based models. Most models build upon the frameworks of Hopkins and Ruffo, but they decompose the cost structure into different components [
8,
9]. According to the break-down principle, costs are typically divided into material cost, pre-processing, processing, and postprocessing costs. However, there is also a study that categorizes costs into purchase, machine operation, material, and labor costs [
10,
11]. The type of decomposition strongly depends on the additive technology to which the cost model is tailored (e.g., SLS, SLA, FDM, or PolyJet) [
12]. Therefore, even before constructing a model, it is crucial to determine which technology is being considered, since generalization across all process categories would be very difficult. In the case of the activity-based approach, the estimation is based on the time requirements of the activities within the process [
13,
14]. Here, the additive manufacturing workflow itself serves as the reference, but, again, providing accurate estimations remains challenging due to the differences in the characteristics of each technology.
Most existing cost estimation models for FDM either neglect nozzle wear entirely or assume a time-based depreciation approach; this simplification is often due to the lack of reliable wear data. However, some manufacturers have begun providing nozzle lifespan estimates based on the total extruded material volume, and a study investigated this problem [
15]. This suggests that a volume-based wear model may offer a more accurate and scalable alternative—particularly in cases involving abrasive materials or high material throughput—providing further motivation for the approach presented in this paper. The primary objective of this work is to address a gap identified in the existing literature by offering a different perspective that has not been explored thus far. Specifically, by incorporating a more accurate consideration of tool wear into the volumetric model, a more precise theoretical estimation of tool costs can be achieved. It should be emphasized, however, that this study constitutes a computational investigation rather than an experimental one; consequently, the actual practical outcomes will be presented in connection with ongoing experimental research.
2. Methodology
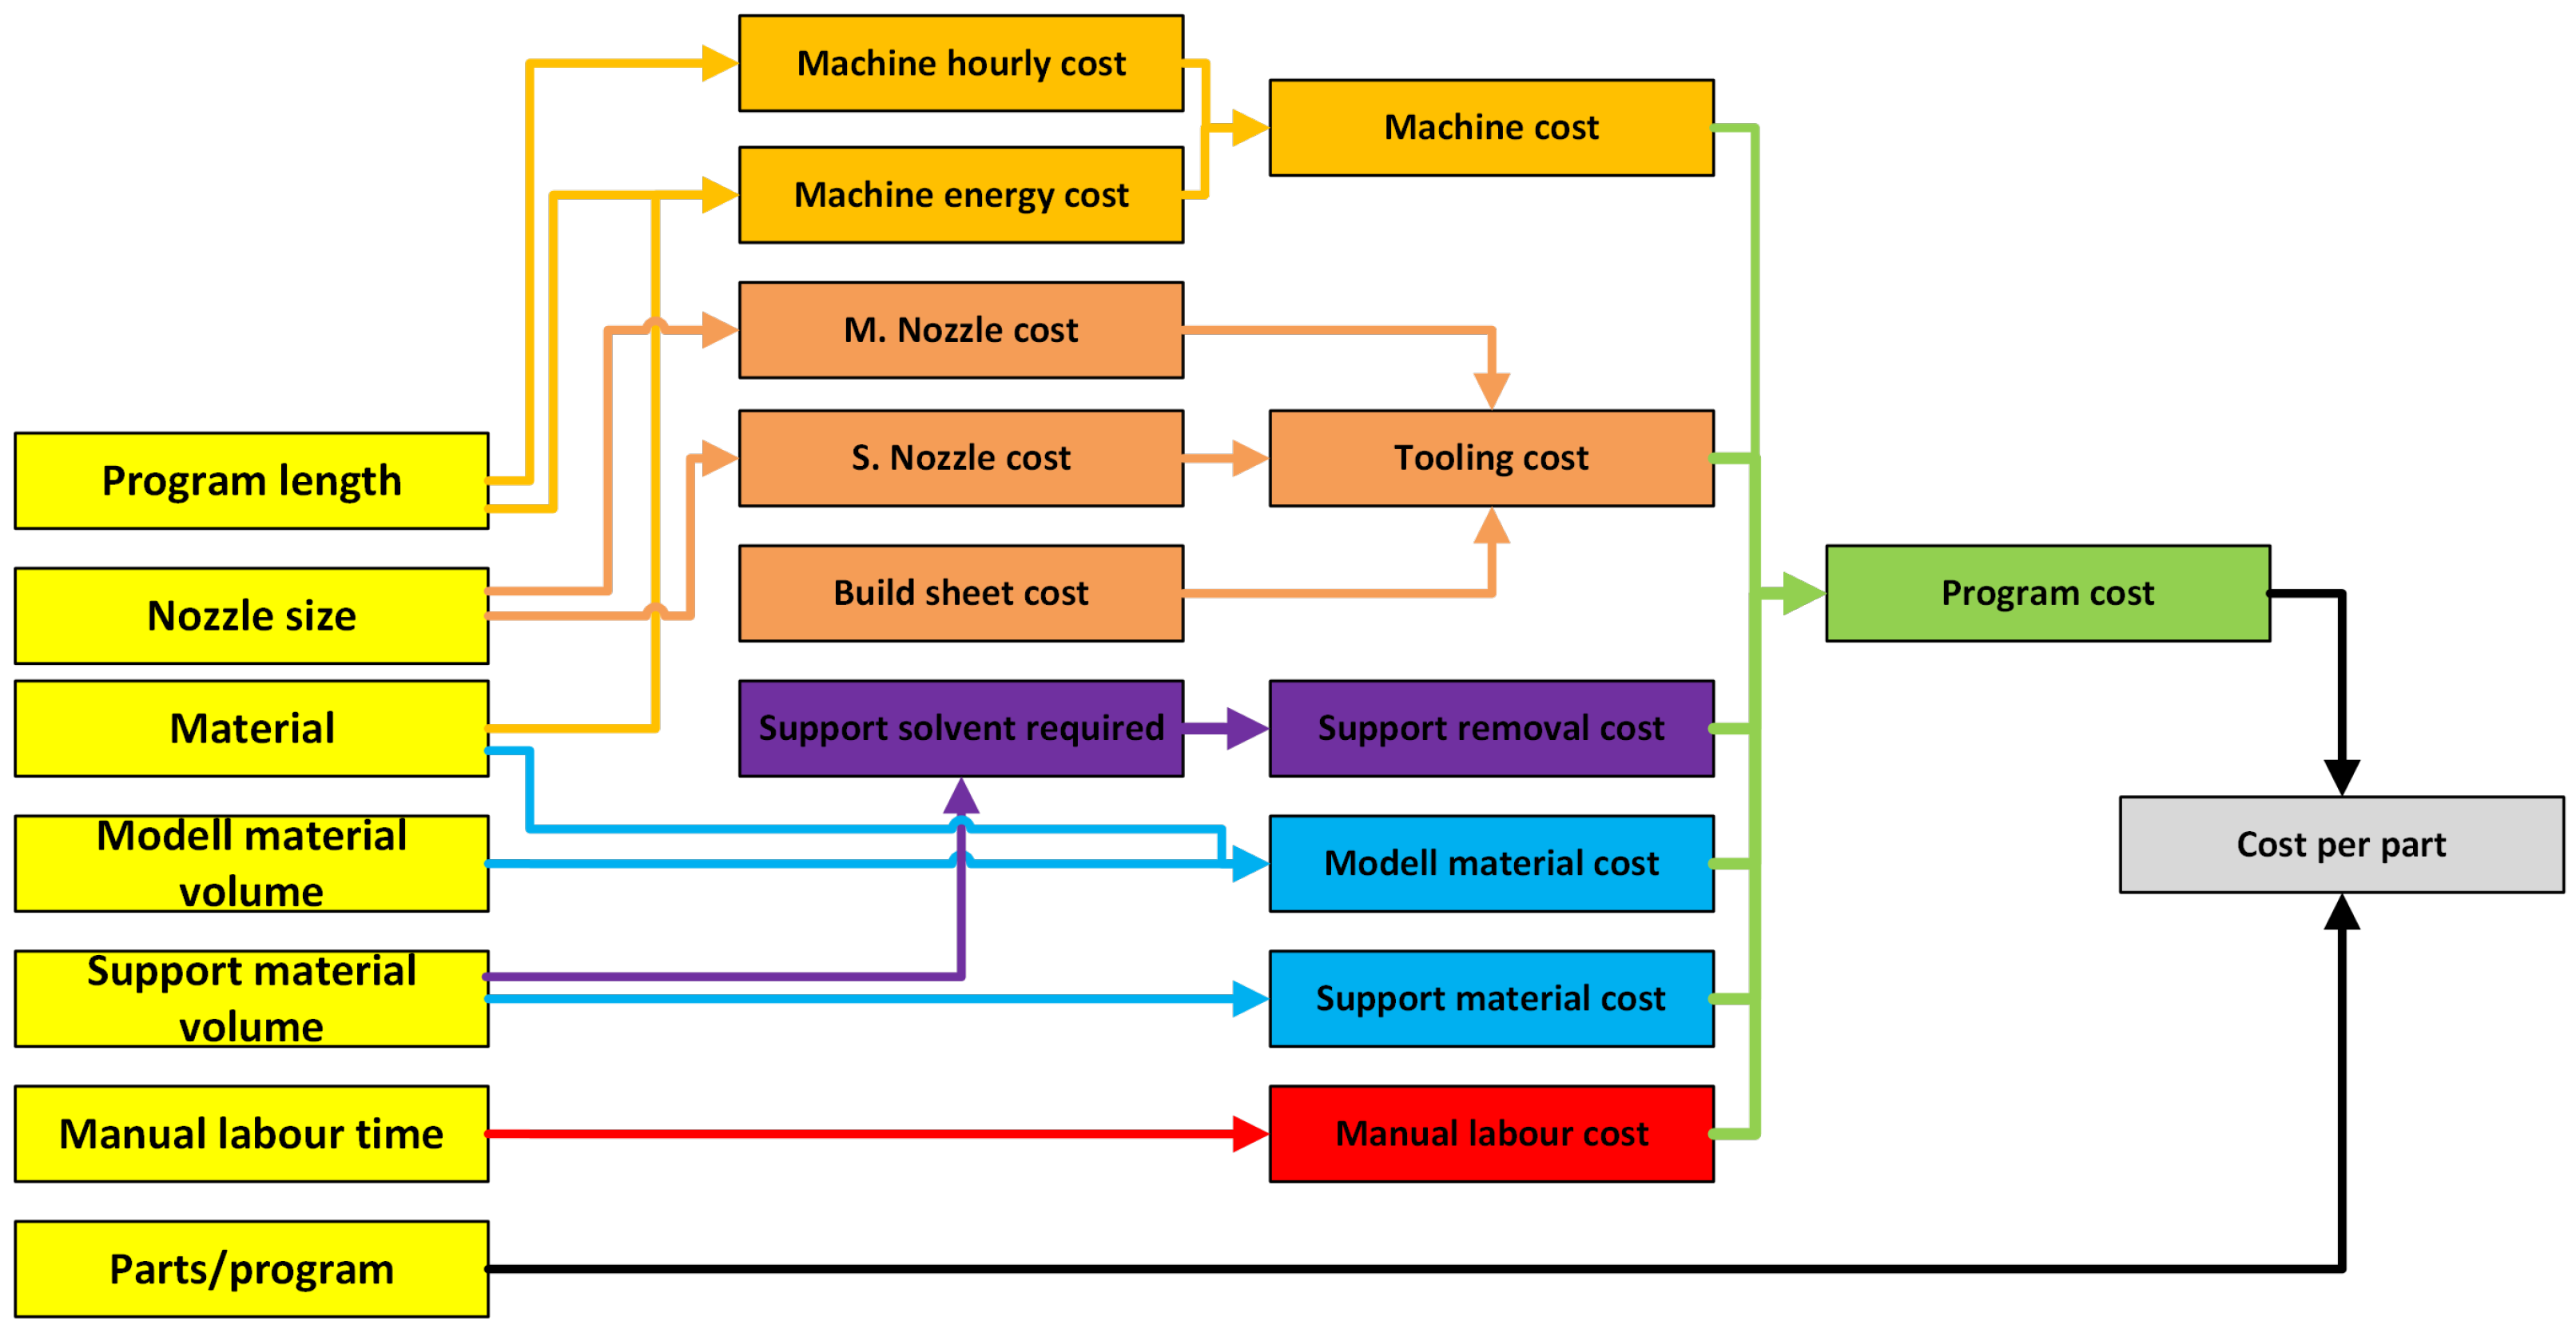
Calculating the cost of a part is complicated due to the numerous parameters and their complex relations, as shown in
Figure 1 using a similar breakdown view as in other articles [
16]. In this framework we separate the costs into five categories (material costs, support solving costs, machine costs, tooling costs, and labor costs). Each of these categories requires several inputs to calculate the value of their correspondent costs. For the inputs (yellow in
Figure 1), the calculation model only requires parameters that the slicing software provides or that the user has knowledge of. This method differs from other cost calculations because it considers several aspects of the manufacturing system that many researchers did not study into detail. This workflow was specifically developed for a Stratasys Fortus 450mc machine (Minneapolis, MN, USA. Stratasys GmbH) and GrabCAD slicing software (v1.103.12.560011) manufacturing system. All the calculation values presented in the next sections are information and prices specified by the company, Stratasys [
17]. The cost components cover all the main system components of the AM process, except the design phase, as we focus on the manufacturing process itself regardless of the geometry or number of parts [
18]. In future developments, the model will be extended to include machine investment and maintenance cost estimation, enabling its use beyond the Stratasys system and making it applicable to a broader range of industrial and desktop FDM platforms. To apply the model to different machines, these input values must be adjusted accordingly. This can be achieved by obtaining the necessary data directly from the manufacturer or through empirical measurement. In particular, tool (nozzle) wear is a sensitive and system-specific parameter, and reliable data are often limited; therefore, users may need to estimate alues based on observed wear behavior under comparable conditions.
2.1. Calculating Material Costs
The required material volumes were given by the slicing software, so the material costs could easily be calculated. In addition, the specific price of the materials are needed for Equation (
3).
where
is the volume of the model material,
is the specific price of model material in currency/ccm,
is the volume of the support material,
is the specific price of the support material,
and
the cost of model material and support, respectively.
2.2. Cost of Support Material Removal
The postprocessing time required for support material removal largely depends on the amount of support used and the method of removal. To reduce costs and improve efficiency, it is advisable to manually remove as much support material as possible, since this is generally faster and less resource-intensive than chemical methods. However, certain geometries—such as internal channels, enclosed cavities, or thin-walled structures—may not allow for manual removal or doing so could risk damaging the part. To address these cases, some studies propose a classification system that assigns a postprocessing factor to quantify the complexity of postprocessing for a given part. This factor makes it possible to weight the estimated time and cost of postprocessing according to the geometric challenges involved [
19]. This cost component should be optional in the total cost estimation. If the support structure can be removed without chemical dissolution, the associated cost is accounted for under labor costs, as manual removal involves no additional expenses beyond human resources. However, if chemical dissolution is required, the following calculation must be performed:
where
is the volume of support material to be solved,
is the specific price of solvent in currency/ccm,
is the time spent by the part in the tank,
is the energy consumption of the heater tank, and
is the specific price of electricity.
2.3. Machine Operation Costs
For the calculation model we suggest separating the machine cost into tooling costs (degradation of nozzle and wear of the build sheet) and machine costs (general maintenance costs and energy consumption). In case of the machine operation costs, the depreciation of the machine is considered in addition to the maintenance cost, which can be easily determined and specified as an hourly rate. Finally as the price of the electricity and the power consumption of the machine is known, we can also add the energy consumption for a program as a function of time. Equations (
3) and (
4) summarize the general costs of the machine for a printing program without the tooling costs. This way, the cost of consumables are considered more accurately.
where
is the cost depreciation of the machine converted to an hourly rate,
is the cost of maintenance converted into an hourly rate,
is the average energy consumption of the machine,
is the specific price of electricity, and
is the length of the program.
It should be emphasized that, although other studies have addressed the acquisition costs of manufacturing equipment (the printer and the solvent tank), this factor was not integrated into the current model [
20]. The focus of this work was accurately capturing the cost implications of production demands that vary in terms of part quantity and geometry. In future stages of this research, the integration of machine investment costs is planned, in order to enable precise cost estimation for the preparation and planning of complete production line systems.
2.4. Tooling Costs
The degradation of the nozzle results in a drop in the quality of printed parts. The nozzle’s outlet hole geometry changes to a larger size, which also changes the required extrusion speed to achieve the desired extrusion rate or volumetric speed. Some printers are fitted with optical sensors, which can be used to check the extrusion rate so that the quality remains the same, but each hot end has a volumetric speed limit above which the quality of extrusion and the part cannot be guaranteed (near the limit underextrusion, lower-layer adhesion appears). This is the reason that the lifespan of a nozzle for industrial printers is defined by the manufacturer both in time and extruded material volume. The problem with the time-dependent calculation is that it gives a higher cost value compared to the extruded-volume-based calculation. The reason for this is that the time-based calculation does not separate the auxiliary and primary motions. The wear only happens when material is extruded through the nozzle, which only happens during the primary motions [
15]. Therefore, when calculating the wear of a nozzle, the extruded volume is much more precise. Furthermore, the other component of the consumables is the bed sheet. These plates also wear out after a couple of prints, so we have to consider their lifespan. It is more cost effective to maximize the used area of a sheet and place the parts so it can wear evenly. If we have all the necessary information, such as the prices and lifespans of these consumables, we can calculate the tooling cost for a program with Equation (
5) as follows:
where
is the price of the bed sheet,
is the price of the model tip,
is the max. extruded filament volume of the tip in its life cycle,
is the volume of the model. With these, we can estimate the cost of the wear during the printing program.
,
, and
are similar variables but for the support material tip and structure.
2.5. Labor Costs
Additive manufacturing is an automated process; however, a machine operator is always needed to set the machine up, deal with its problems, and schedule the programs. Even the parts that do not need support structures have to be handled for storing, packing, or documenting. This means that a segment of a part’s cost is related to human labor [
21]. With the workers hourly wage, the postprocessing time, and the machine setup time, it is possible to calculate the cost of labor with Equation (
6).
2.6. Total Cost of Part
With all the aforementioned cost components, the total value of a part can be calculated with the sum of these costs (Equation (
7)):
Equation (
7) includes all the cost items that are explicitly considered and addressed by the proposed model. In comparison with other cost estimation models, the design phase of the part is not included; in the case of contract printing services, the design is not necessarily developed by the manufacturer. Slicing and machine preparation are only reflected in the labor cost component as a function of time. Furthermore, overhead costs are not incorporated into the model, since they are highly context-dependent and difficult to generalize; their accurate estimation relies heavily on the specific manufacturing environment and the organizational structure of the company. Finally, assembly costs are not included as a separate item, as they can be readily integrated into the labor cost component. Apart from these, all other items commonly referenced in the literature are accounted for in the cost model [
22].
2.7. Testing Scenarios
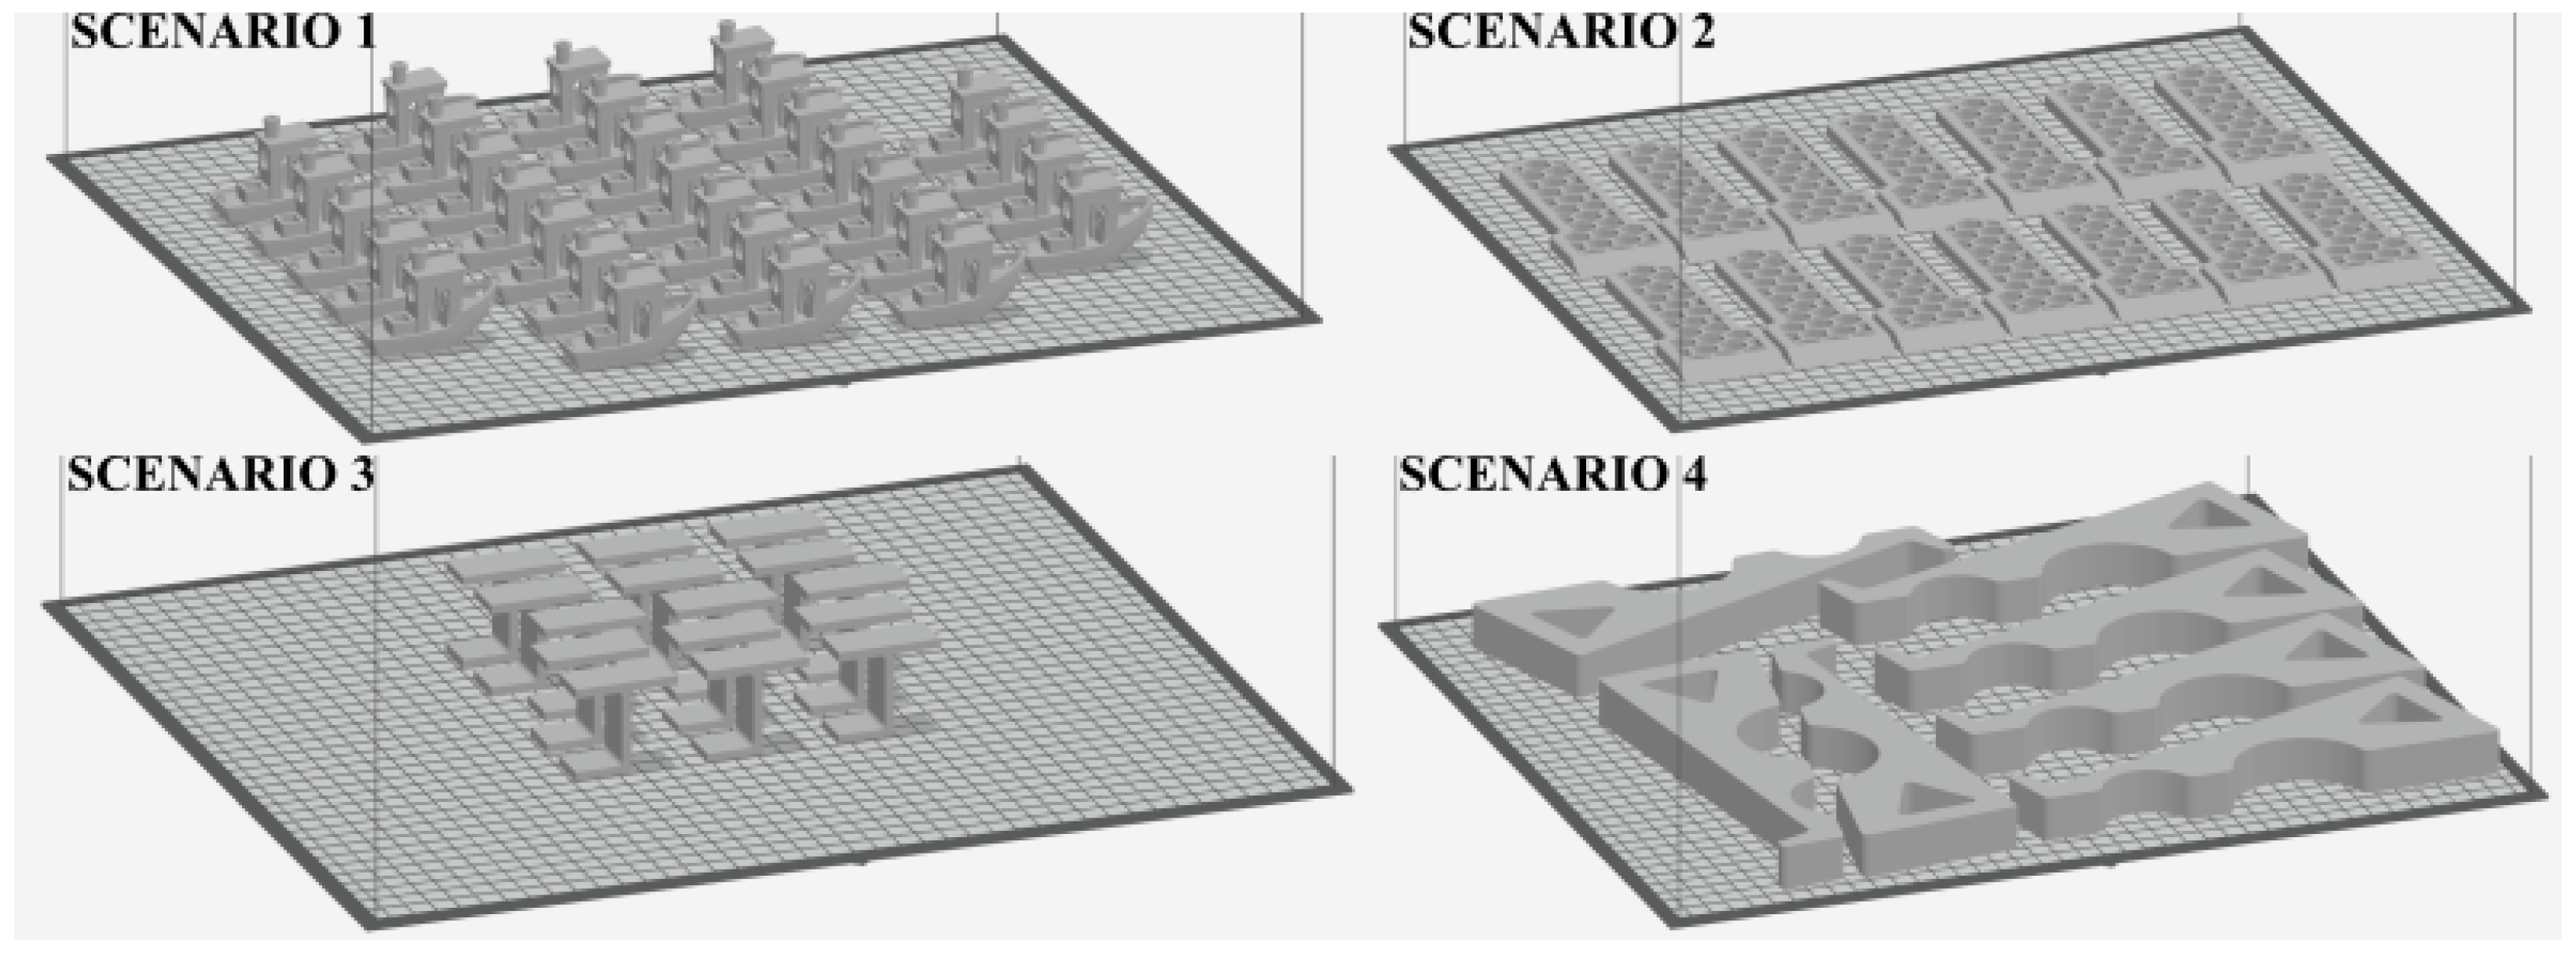
To validate the proposed cost calculation framework, several scenarios were analyzed involving parts of varying sizes, production quantities, and support needs. For each scenario, the material consumption and estimated build time were calculated using representative slicing data (GrabCAD output of build time, model, and support material volume). These values were then used to assess how different nozzle cost allocation methods (specifically, a time-dependent model versus an extruded-volume-based model) impact overall cost estimation. The comparative analysis helped to highlight the practical implications of nozzle wear modeling in FDM cost prediction. The settings of the scenarios are listed in
Table 1, and the models used are in
Figure 2.
Figure 2.
Models of the various parts used in the different scenarios to simulate different type of geometries. From left to right: 3D Benchy [
23], hex scraper [
24], laptop stand [
25], and support test part [
26].
Figure 2.
Models of the various parts used in the different scenarios to simulate different type of geometries. From left to right: 3D Benchy [
23], hex scraper [
24], laptop stand [
25], and support test part [
26].
In the first scenario, the large-scale production of a workpiece with a more complex geometry is simulated. This case is interesting due to the extensive build time, frequent printhead changes, and the high number of parts produced. In the second scenario, production is simulated using a stiffer material, with low layer height and no support structures (just the raft, which cannot be turned off). The aim here is to achieve a significantly higher ratio of model material to support material. The third scenario involves the simulation of a geometry that requires a relatively small amount of model material but a proportionally higher amount of support material, accompanied by frequent material changes. Finally, in the fourth scenario, the production of large-sized parts requiring minimal support is simulated using a tall layer height in order to maximize model material output.
The presented cost estimation model differs primarily from the others in that tooling costs are separated from machine-related costs. This distinction is made because it is assumed that, in the case of tooling, time-based calculation and averaging can significantly distort the results compared to actual costs. For this reason, in the following section, only the tooling costs are analyzed across the discussed scenarios, comparing the time-based model with the model based on the amount of extruded material. All calculations are expressed in Hungarian Forints (HUF), as the available pricing data for nozzles, materials, and build trays were provided in this currency. The comparison is visualized per scenario as a function of part quantity, production time, and the amount of extruded material. The orientation and layout of the maximum quantity programs are shown on
Figure 3.
3. Discussion
3.1. Scenario 1
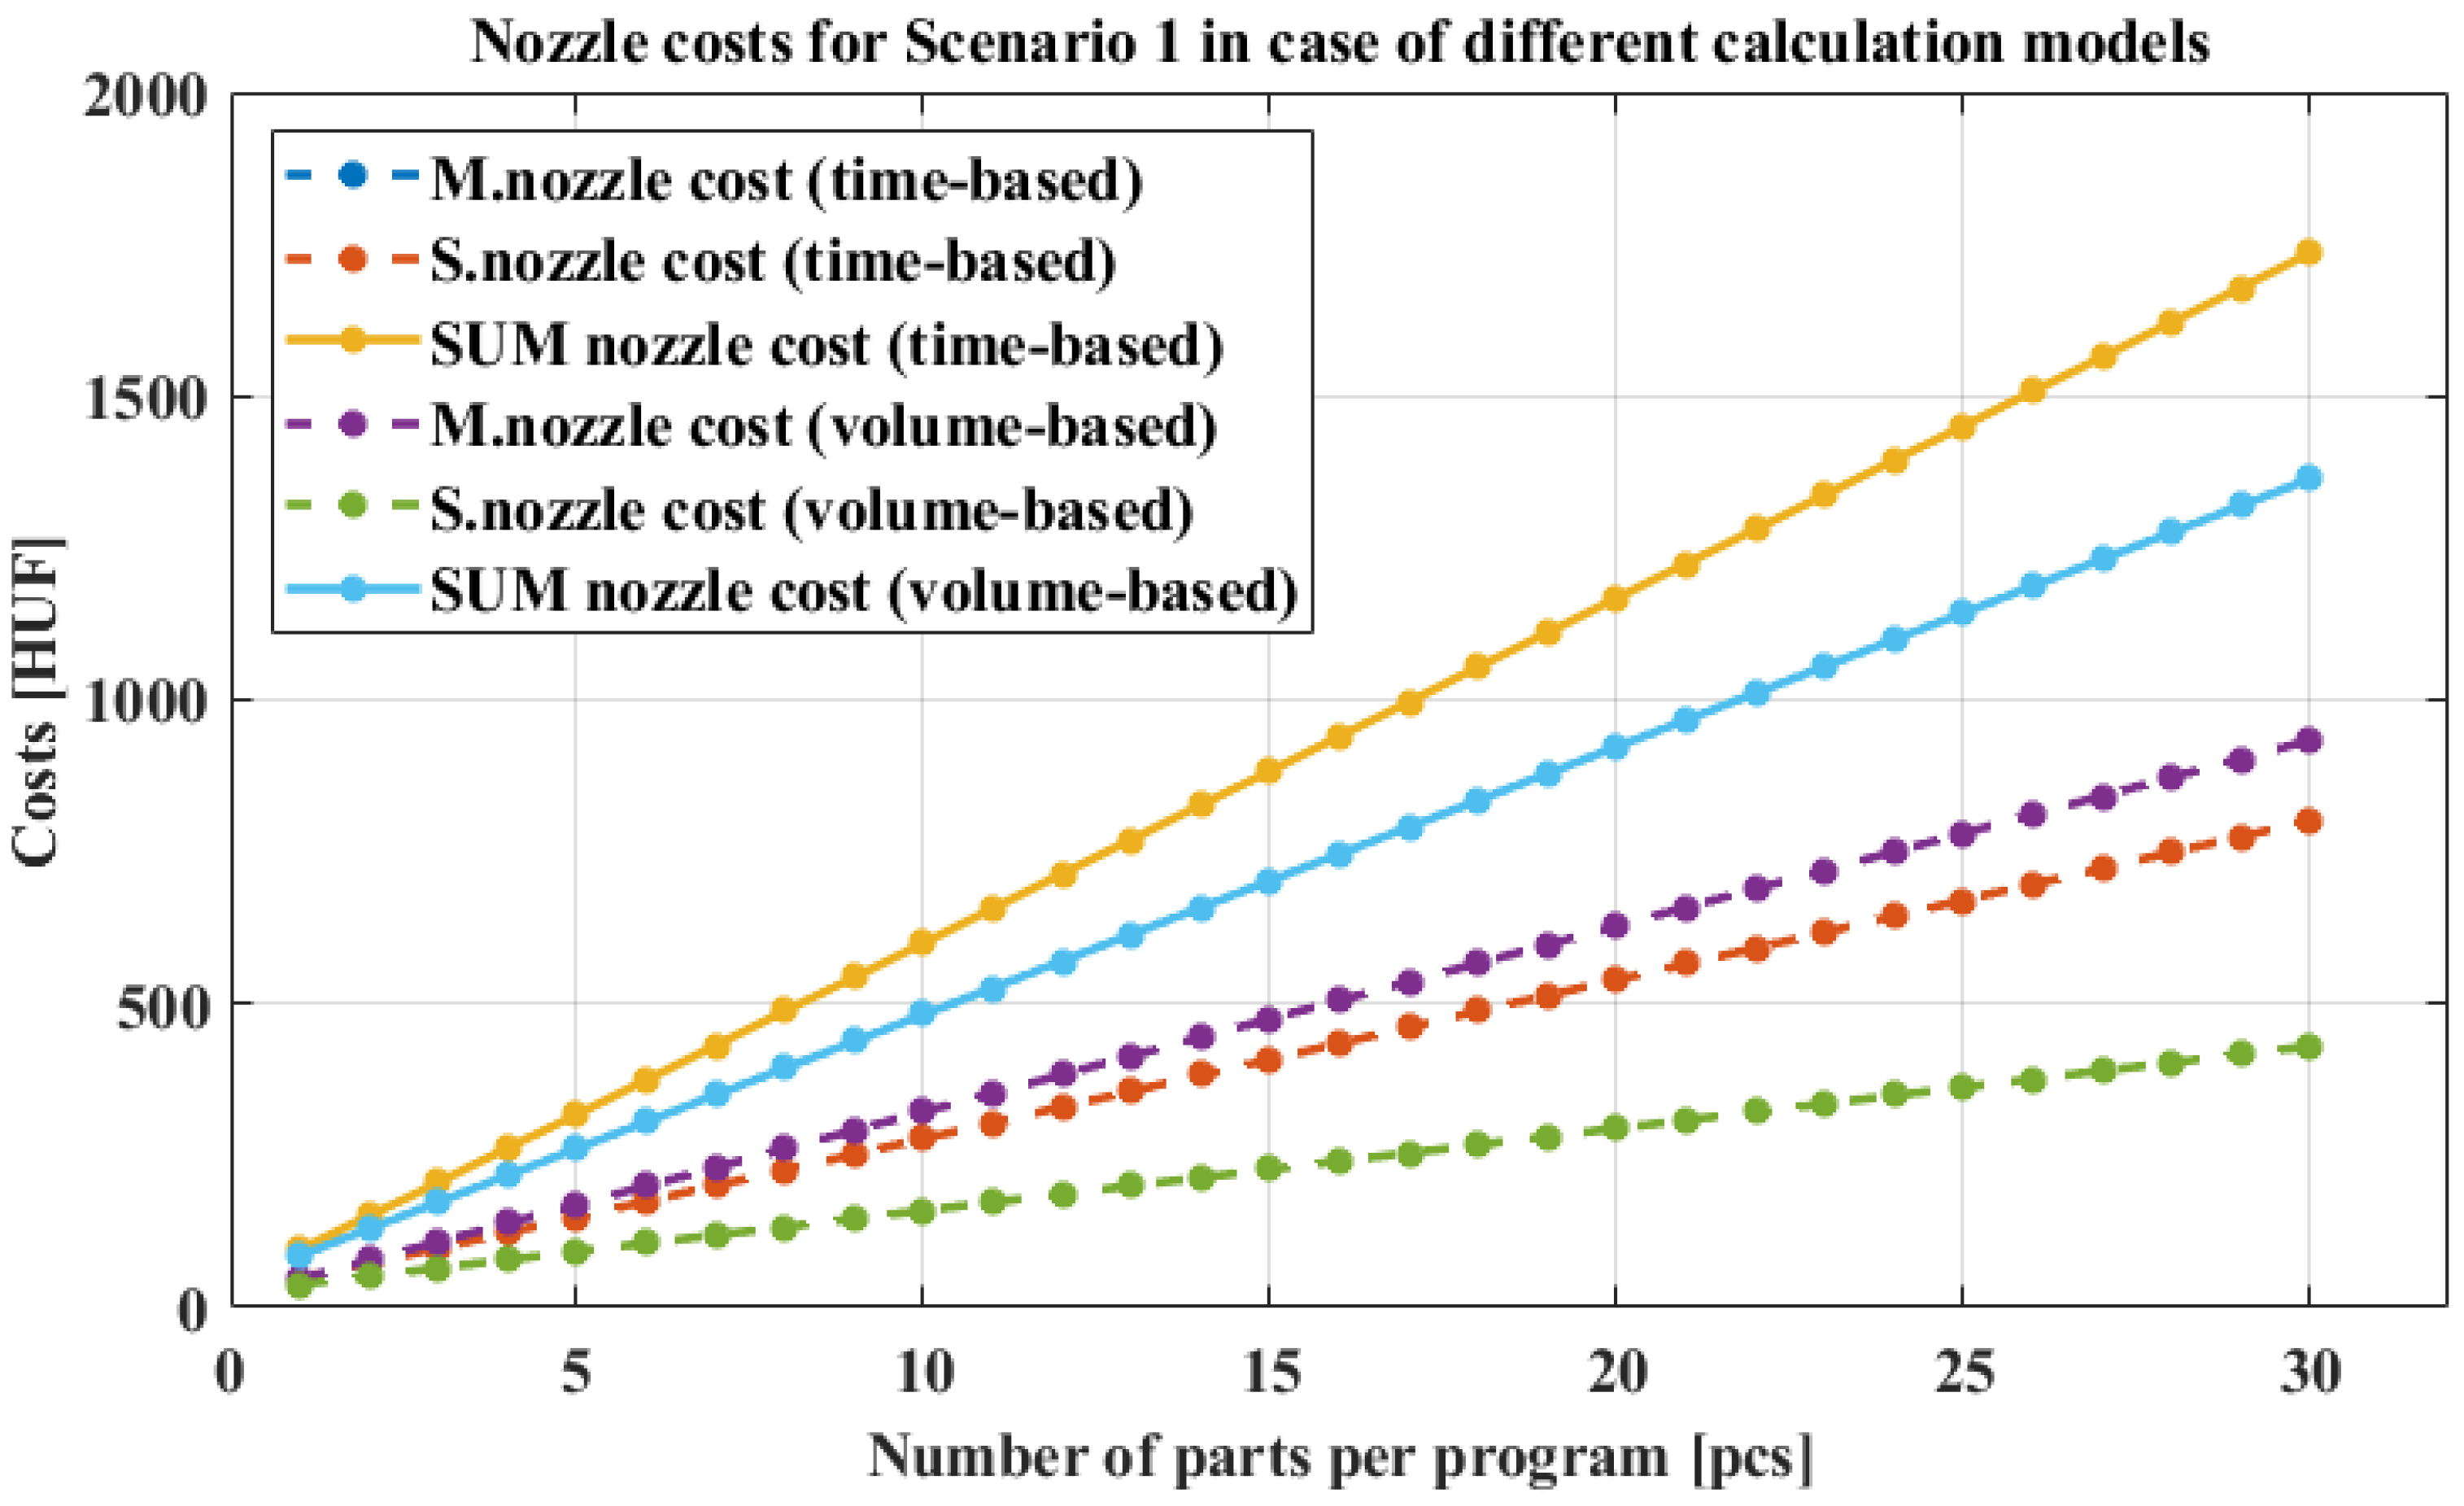
In the first scenario we collected the data from the slicer regarding the material and time requirement starting from a single Benchy model up to a fully populated build plate containing 30 parts. As the number of parts increases, the utilization of the build sheet improves, resulting in a decrease in the per-part cost from this perspective. In case of the nozzle-wear-related costs,
Figure 4 shows the nozzle costs as a function of printed parts. To compare the two calculation methods, we need a common unit between the printing time and extruded material volume. The part number is related to both of them. The data points on the graphs represent exact values corresponding to each part count evaluated. The two solid lines represent the given method’s summarized nozzle costs, and the dashed lines are the model and support nozzle costs.
It can be observed that when nozzle wear is calculated based on time, both the model and support nozzles are assumed to wear equally, leading to identical and significant cost increases. However, this does not reflect real-world behavior and highlights a major inaccuracy in this calculation method as, in practice, the two nozzles are not used equally during printing. Their usage largely depends on the geometry of the printed parts. In contrast, the volume-based calculation captures this uneven nozzle usage more accurately, and the resulting costs are lower and have different rates compared to the time-based costs.
When analyzing cost evolution, it becomes evident in the time-based model that the values associated with the support material nozzle increase more steeply than the volume-based support nozzle costs. This is due to the fact that the program analyzed in this scenario requires relatively little support material, yet the unit wear cost for the support nozzle is high (22.85 HUF/h, which is calculated from the price of the nozzle and the estimated lifespan given by Stratasys, which is 2000 printing hours). The difference in material demand is well illustrated by the differing slopes of the curves. In the volumetric model, the unit wear cost is 2.53 HUF/cm3 for the model material if the tip price is HUF 45,700 (07.10. data) and 3.38 HUF/cm3 for the support material if the tip price is HUF 45,700 (07.10. data). For the time-based costs, the two nozzles’ curves are the same as they use the same parameters, but we can also observe that, for the volume-based components, the model nozzle cost is a bit higher, and the support nozzle cost is significantly lower. This illustrates the better fit and adaptivity of the method to the scenario.
3.2. Scenario 2
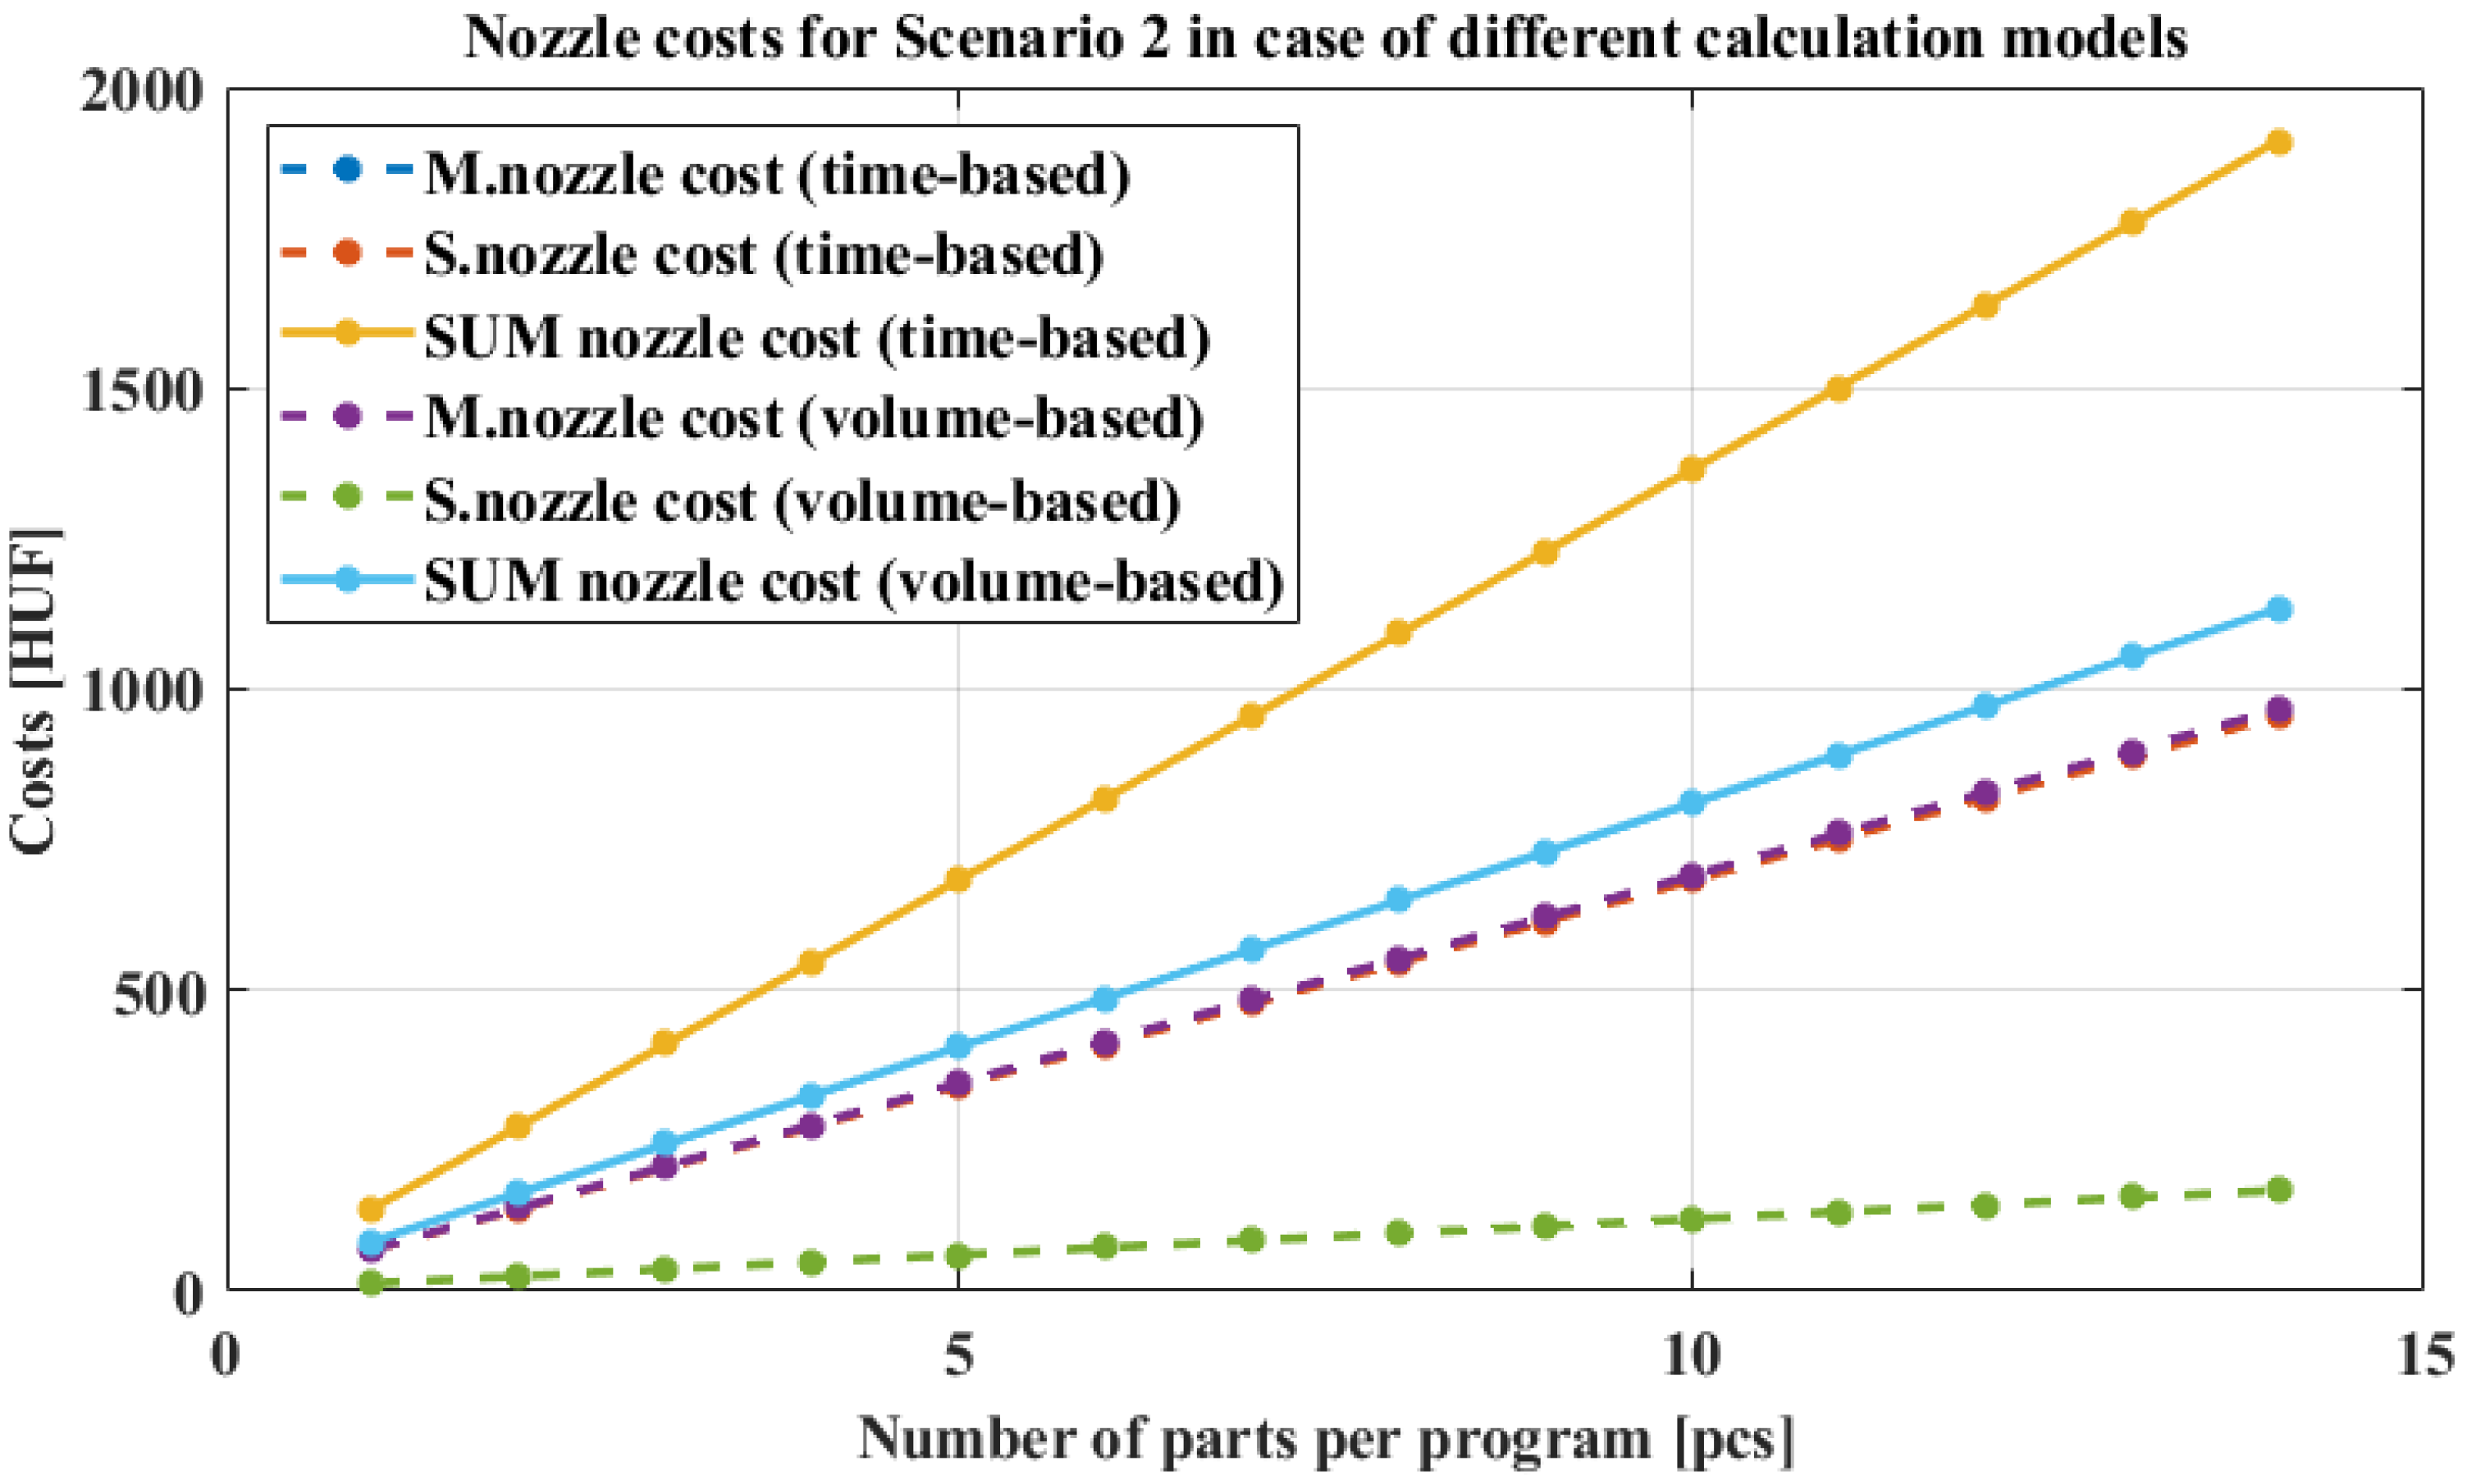
In the second scenario, where the parts are printed with fine resolution—resulting in long print times but requiring significantly less support material—the difference between the model nozzle costs is smaller. In addition, the model itself contains more wall surfaces, which is also a factor because the printer head moves slower when printing them. This might lead to overall higher costs; however, the more critical aspect is the magnitude of the differences observed between the two calculation models. Based on the values shown in
Figure 5, it can be concluded that the volume-based model once again more accurately reflects the difference in demand between model and support materials. Furthermore, the resulting cost values are more precise in this case as well, with a larger difference. The model misleadingly assumes that the support nozzle operates continuously alongside the model nozzle, regardless of actual usage. In contrast, the volume-based cost calculation shows more pronounced differences between the curves for support and model materials compared to the first scenario. This, however, further confirms that the support nozzle is in fact used only minimally, and the volumetric approach captures this behavior much more accurately.
3.3. Scenario 3
In the third scenario (
Figure 6), the material ratio is reversed, as significantly more support material is required than model material. This also allows for examining to what extent the calculation methods account for the uneven usage of the print heads. Furthermore, it is important to consider that the specified lifespan of support nozzles is shorter, making their unit wear more expensive. However, the manufacturer did not specify this difference in terms of time. Therefore, in this scenario, it is not surprising that, with increased use of support material, the support nozzle incurs significantly higher costs. In contrast, the cost of the model material nozzle is much closer to that calculated based on time.
Precisely due to the significantly higher usage of support material, the cost components were also reversed in the volumetric calculation. As a result, the total cost in this case exceeded the time-based values, which further verifies the sensitivity of the calculation method.
3.4. Scenario 4
In the fourth scenario (
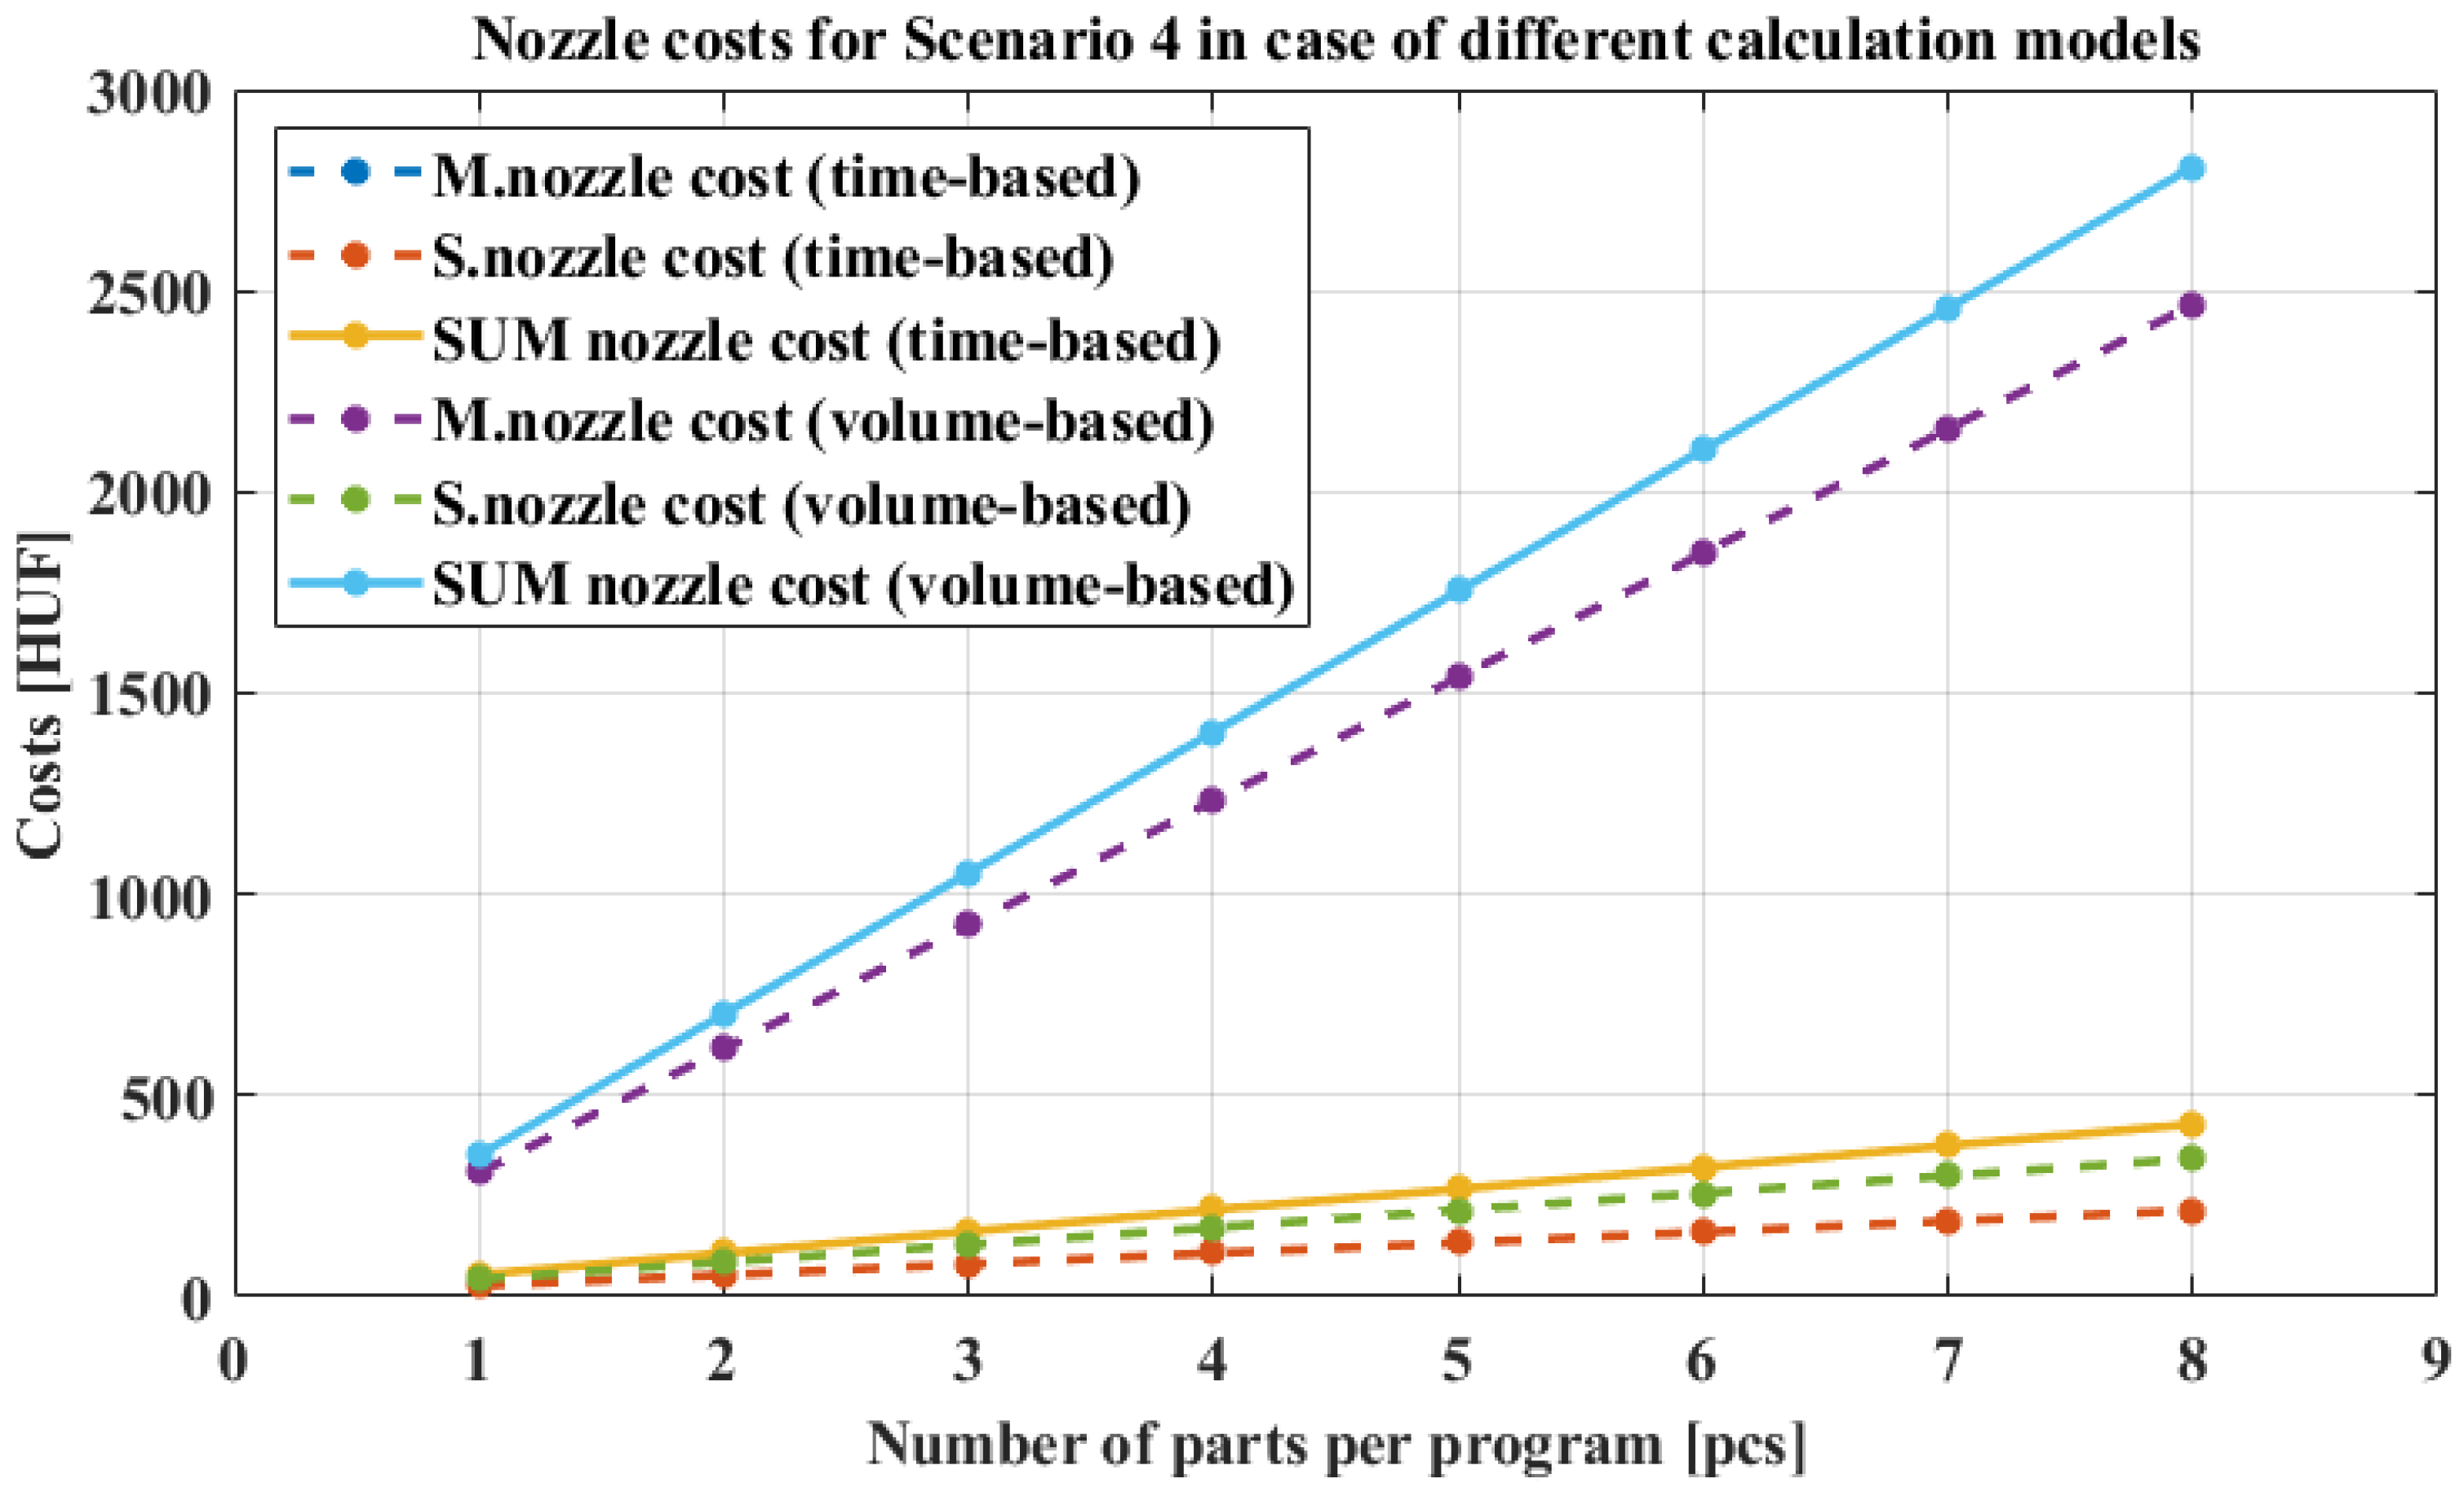
Figure 7), the aim is to simulate large parts that do not require support and have few walls, that is, simple geometries. The total costs clearly show that, in this case as well, the volumetric method yields higher estimates. Despite the small amount of support material, the support nozzle cost calculated using the volumetric method is higher than the model nozzle cost from the time-based calculation. This may be due to the lower infill density of the part and the fact that a larger portion consists of model material. Accordingly, the print head can operate at higher speeds, resulting in shorter print times. The issue here is that the time-based model no longer overestimates the cost but rather underestimates it because it does not account for the fact that, although the program time is short, a significantly larger amount of material is extruded, which leads to greater wear on the nozzle.
3.5. Bed Sheet Cost Component
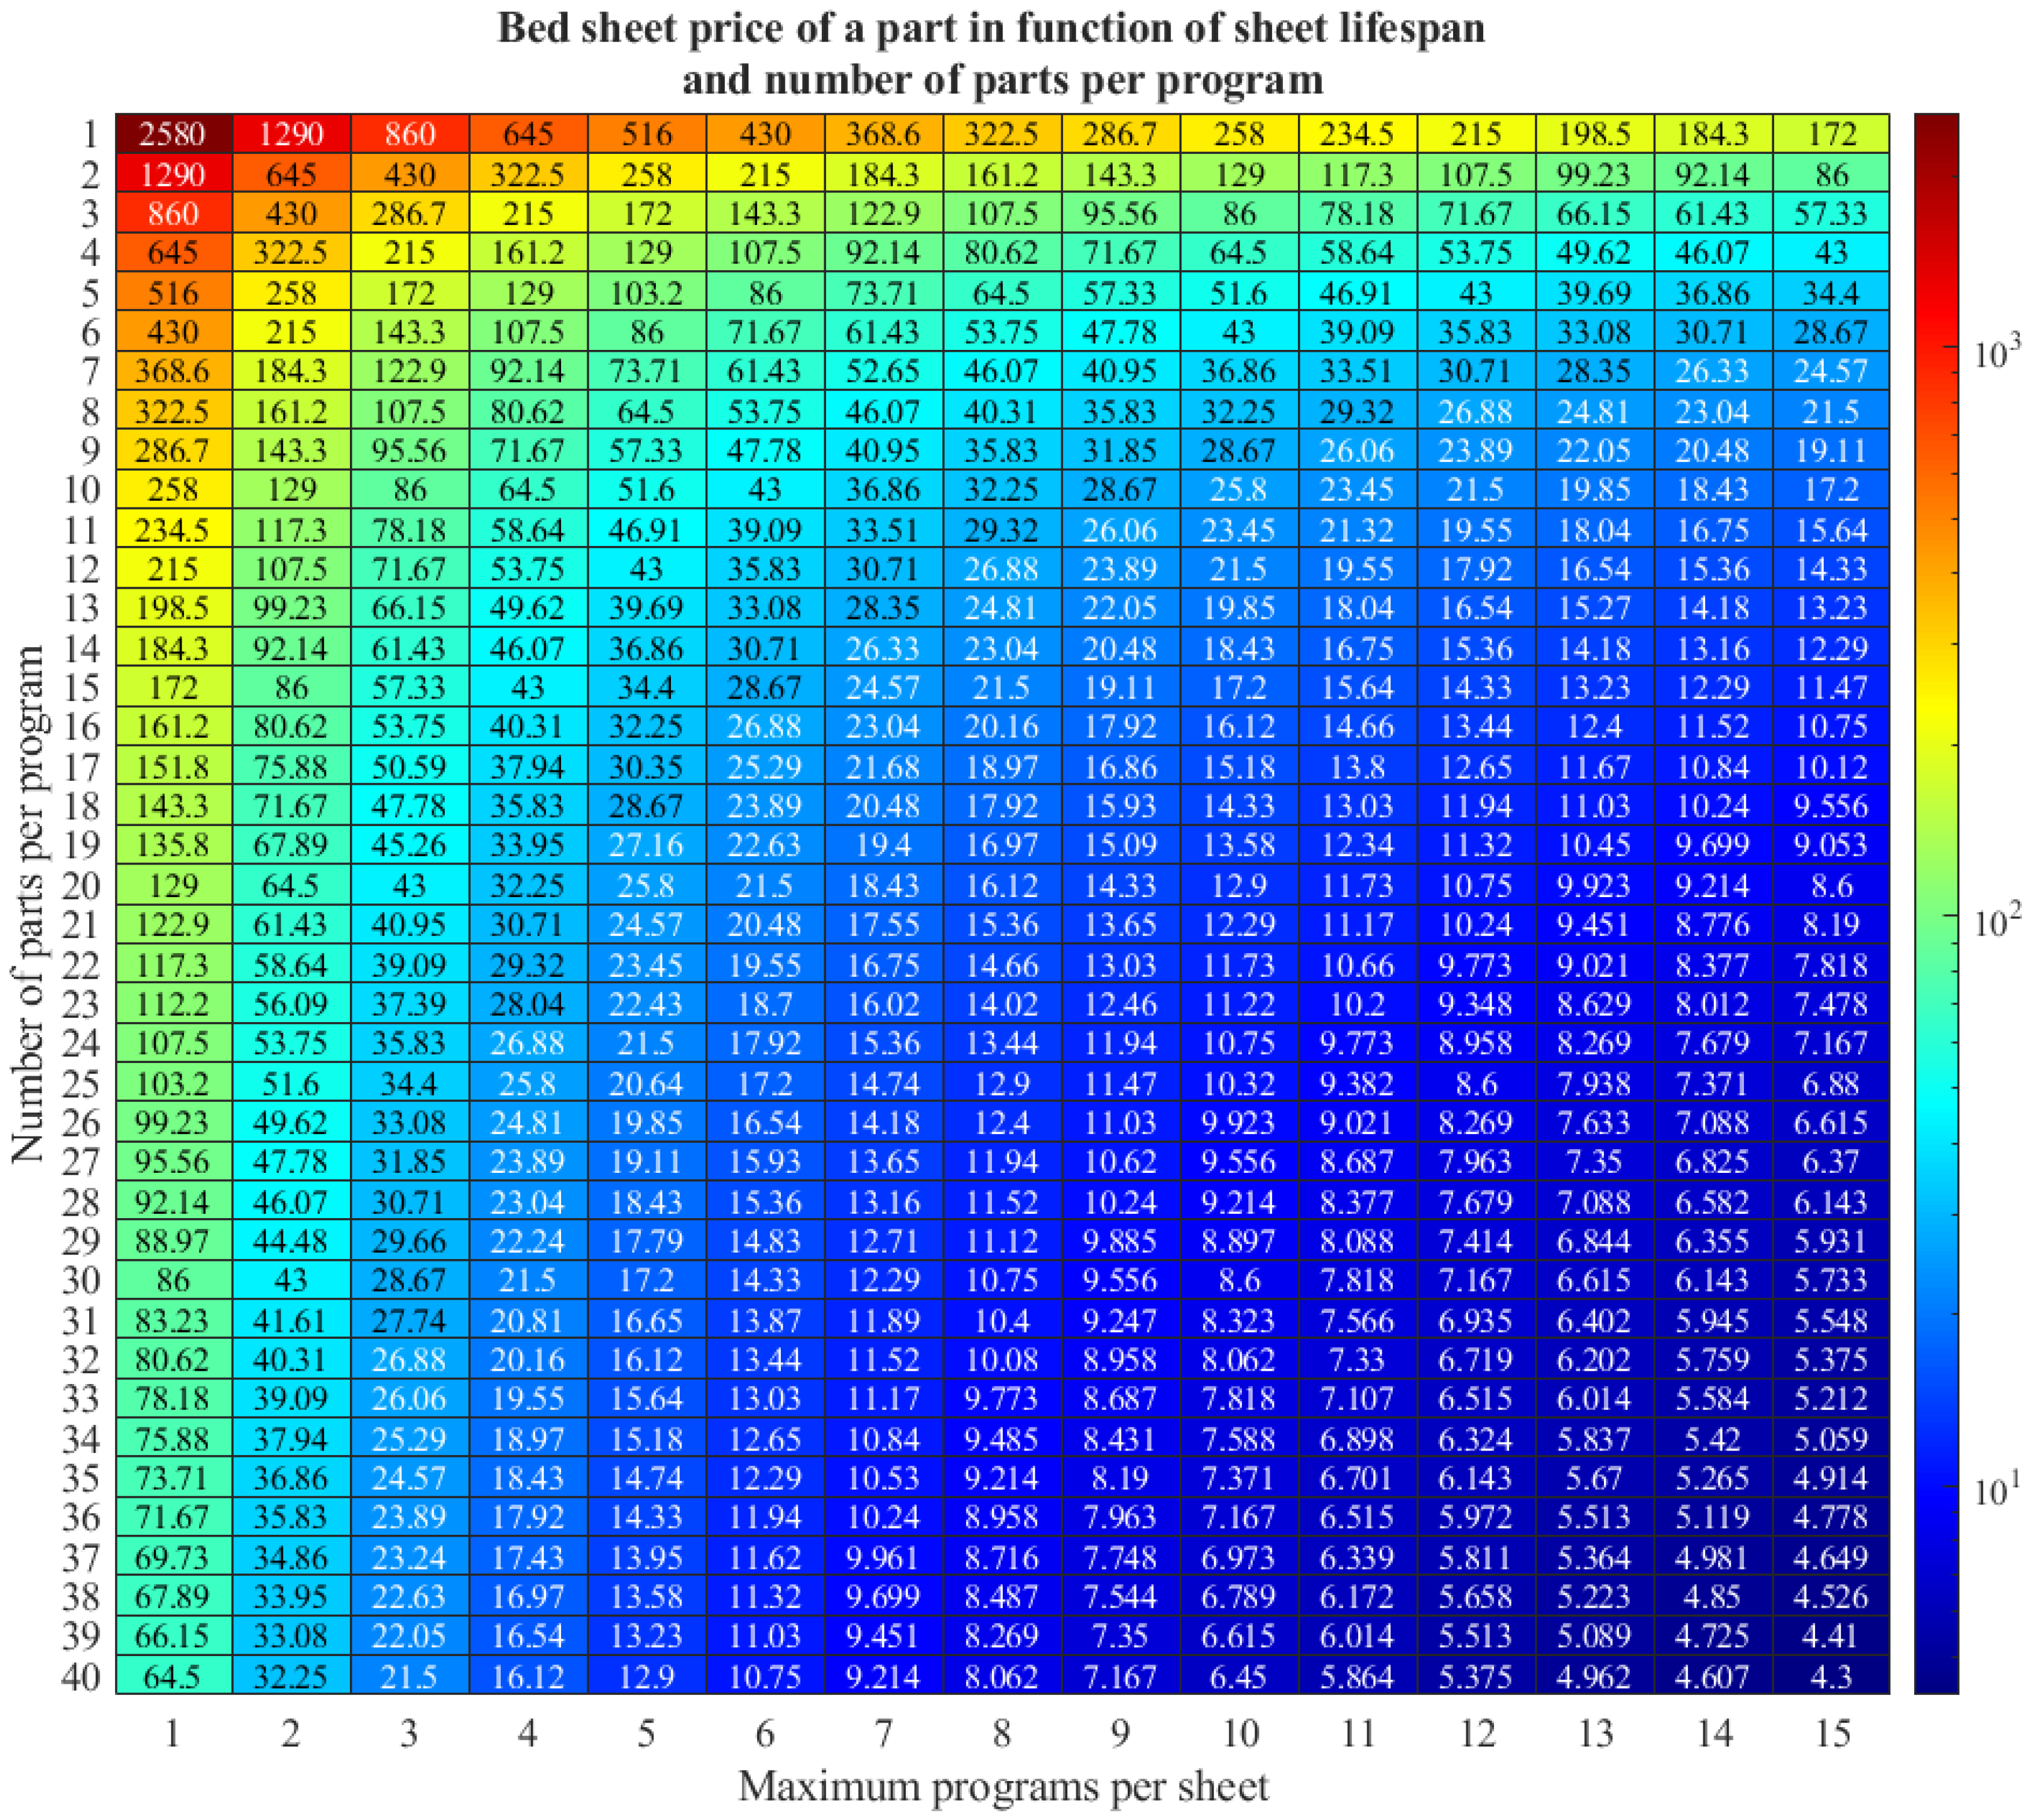
Another important component of the tooling cost is the cost associated with the build sheet. The cost impact of the build sheet is strongly dependent on the number of parts produced, as well as on how many times a single sheet can be reused for a given program. According to the recommendation provided by Stratasys, each build sheet is intended for one-time use [
17]. In practice, however, it has been observed that for certain materials—such as ASA—a single sheet can be reused up to 10–15 times, provided it is properly cleaned and has not sustained damage during part removal. Reusing the build sheet not only leads to a reduction in tooling costs but also contributes to improved sustainability, as consumables are utilized more efficiently.
Figure A1 illustrates the variation in build sheet costs as a function of the number of reuse cycles and the number of parts produced per program. This is also a factor that must be taken into consideration, as it can represent a non-negligible portion of the overall costs. However, it strongly depends on the size and material of the printed parts.
Figure 7.
Nozzle costs for model and support nozzles as a function of part number in scenario 4.
Figure 7.
Nozzle costs for model and support nozzles as a function of part number in scenario 4.
3.6. Total Part Cost
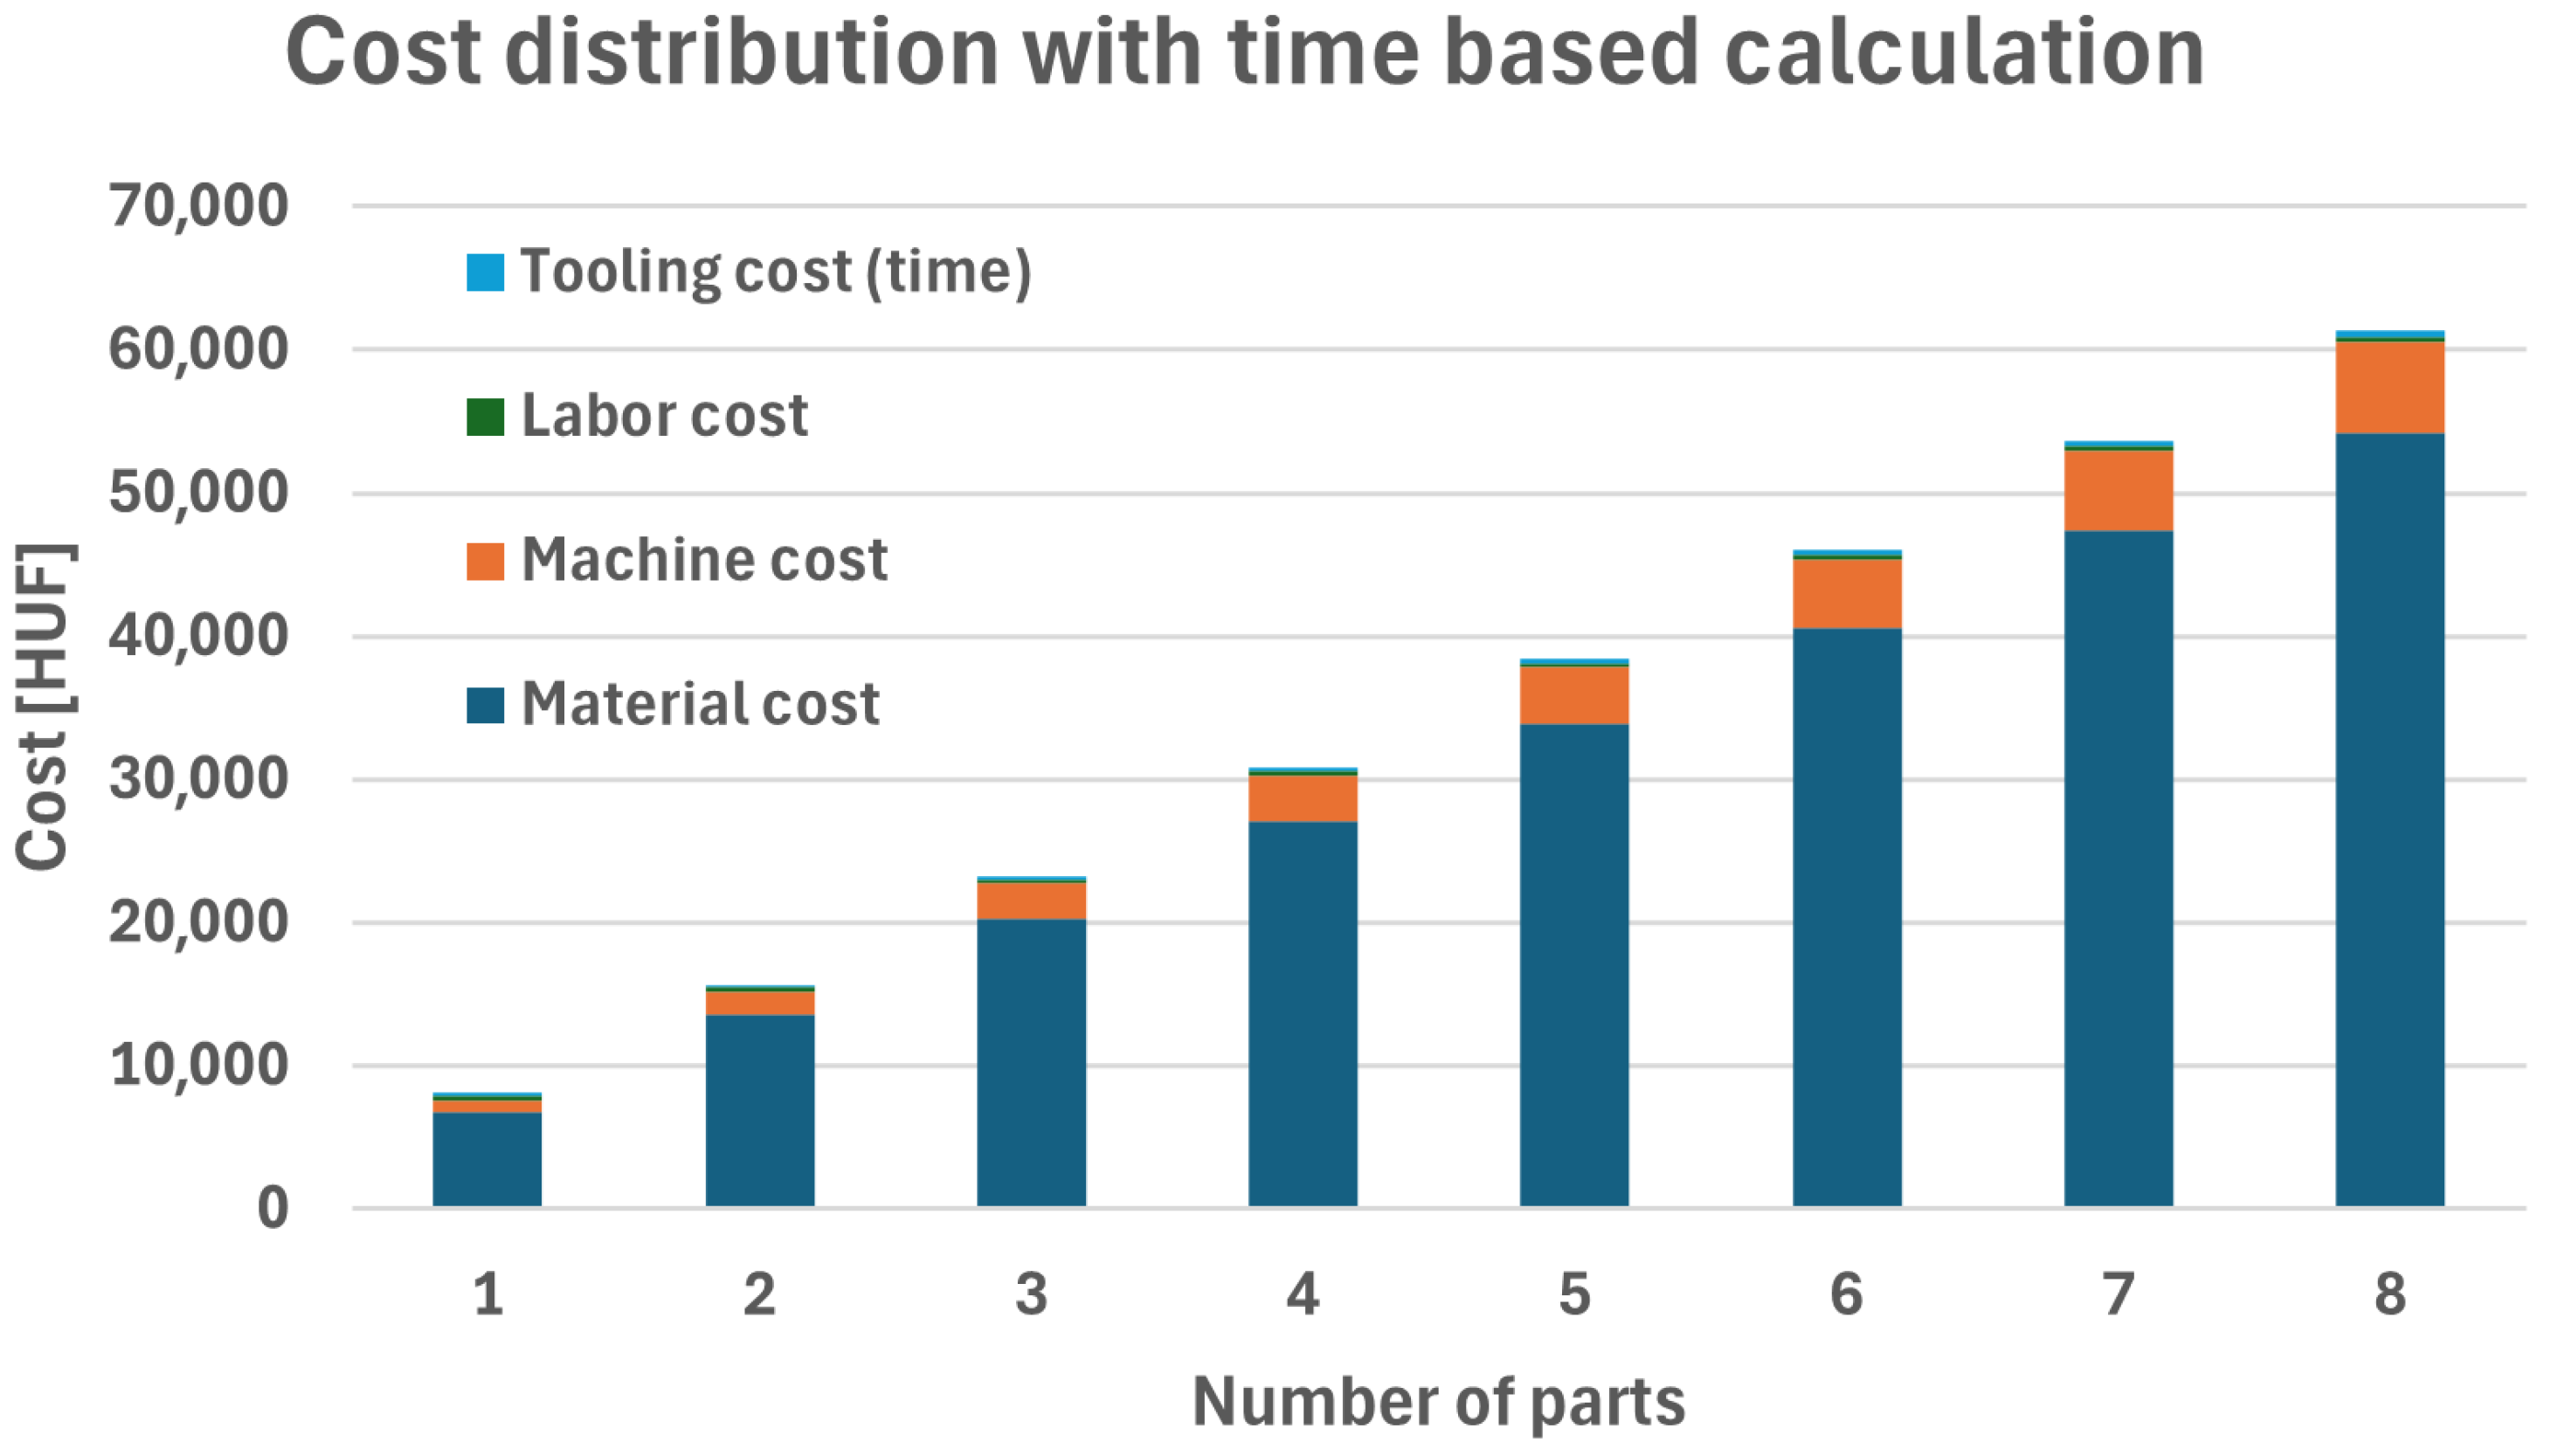
To illustrate the proposed computational approach, its impact on the total cost is demonstrated through the fourth scenario. As shown in
Figure 8 and
Figure 9, the material cost represents the largest component, followed by the machine cost, and, finally, the tooling cost. Since the revised calculation methodology is applied exclusively to the tooling cost, the changes in the relative proportions of these cost components are of primary importance. Even in the selected scenario highlighted here, the figures clearly indicate that significant differences emerge in the distribution of the total cost when considering the tooling component. Under the time-based calculation, the share of tooling cost within the total cost ranges between 2.7% and 0.7%, whereas with the volumetric approach, this proportion lies between 6.2% and 4.4%. Thus, it can be concluded in theory that in this scenario the time-based estimation underestimates tool wear, while the volumetric method maintains a higher relative proportion depending on material usage.
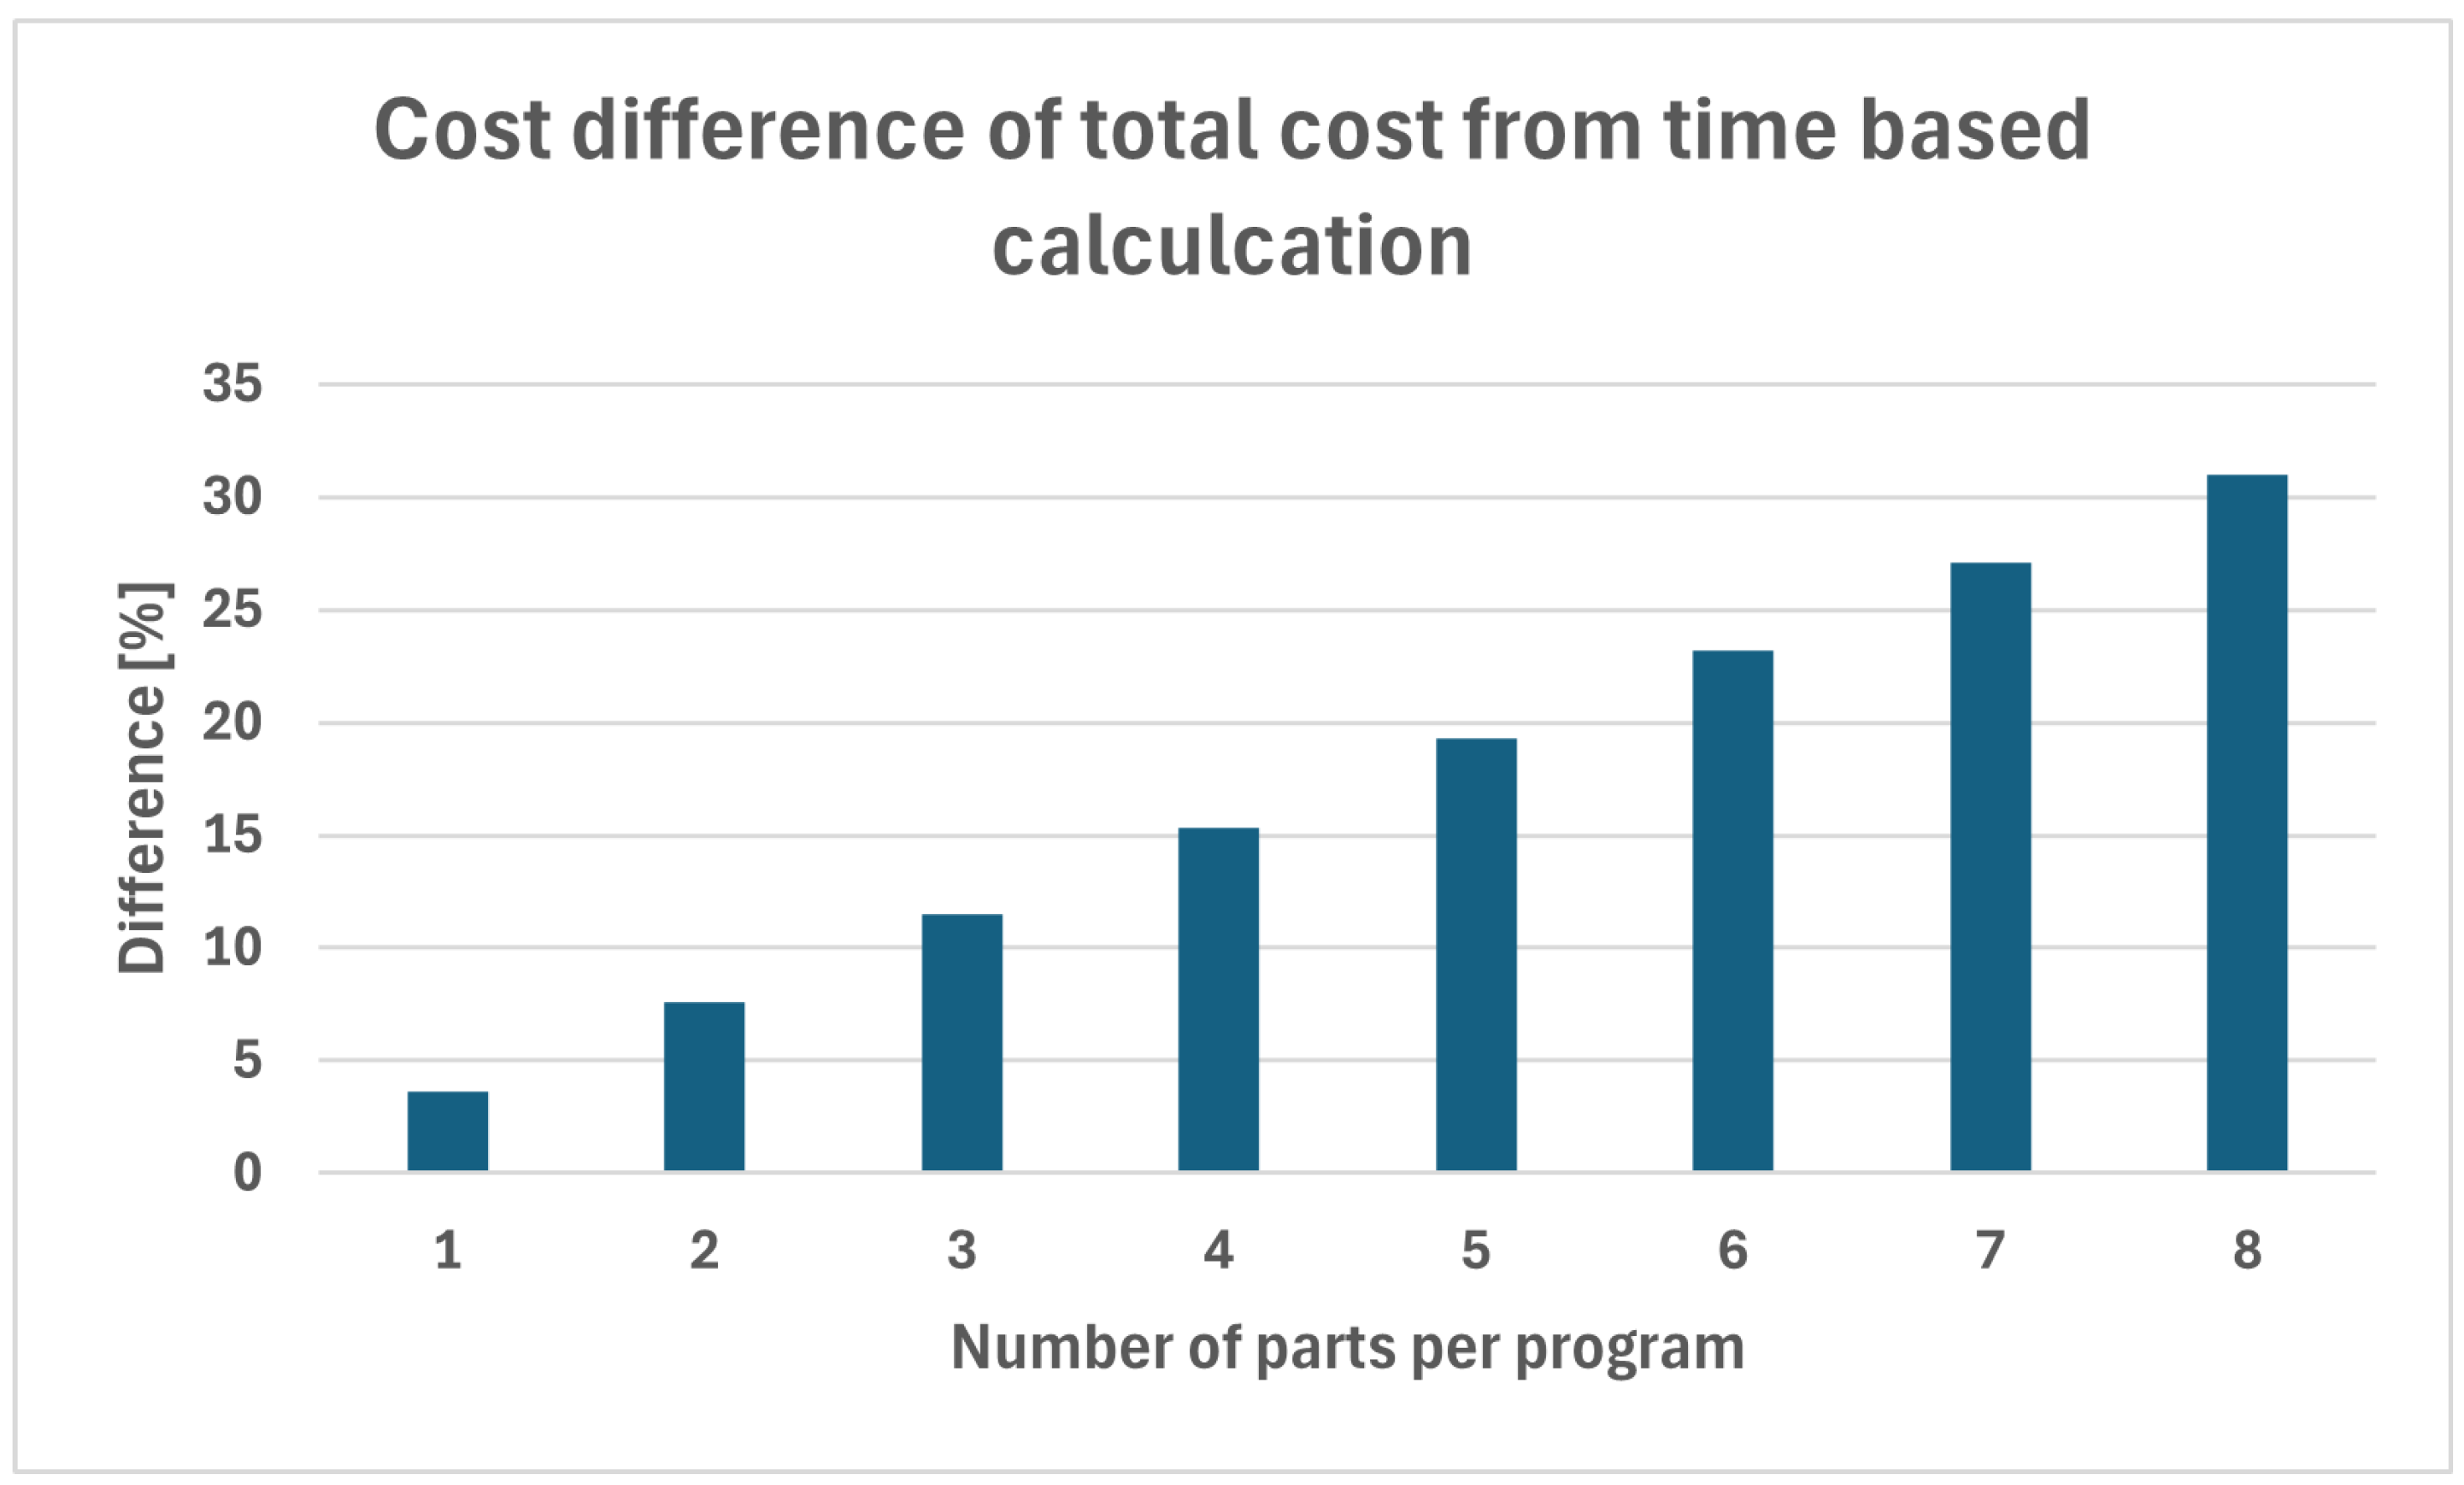
Figure 10 illustrates the deviation between the per-part cost calculated using the volumetric approach and that obtained through the time-based estimation. As the number of parts within a single program increases, the total costs also rise; thus, it is not surprising that the two calculation methods exhibit increasing divergence. Since a higher part count also implies a longer processing time, the inherent “inaccuracy” of time-based wear estimation becomes more pronounced. Naturally, a single scenario cannot fully capture the model performance; therefore, the authors’ objective is to further demonstrate the differences in greater depth through practical, real-world examples of varying nature.
4. Conclusions
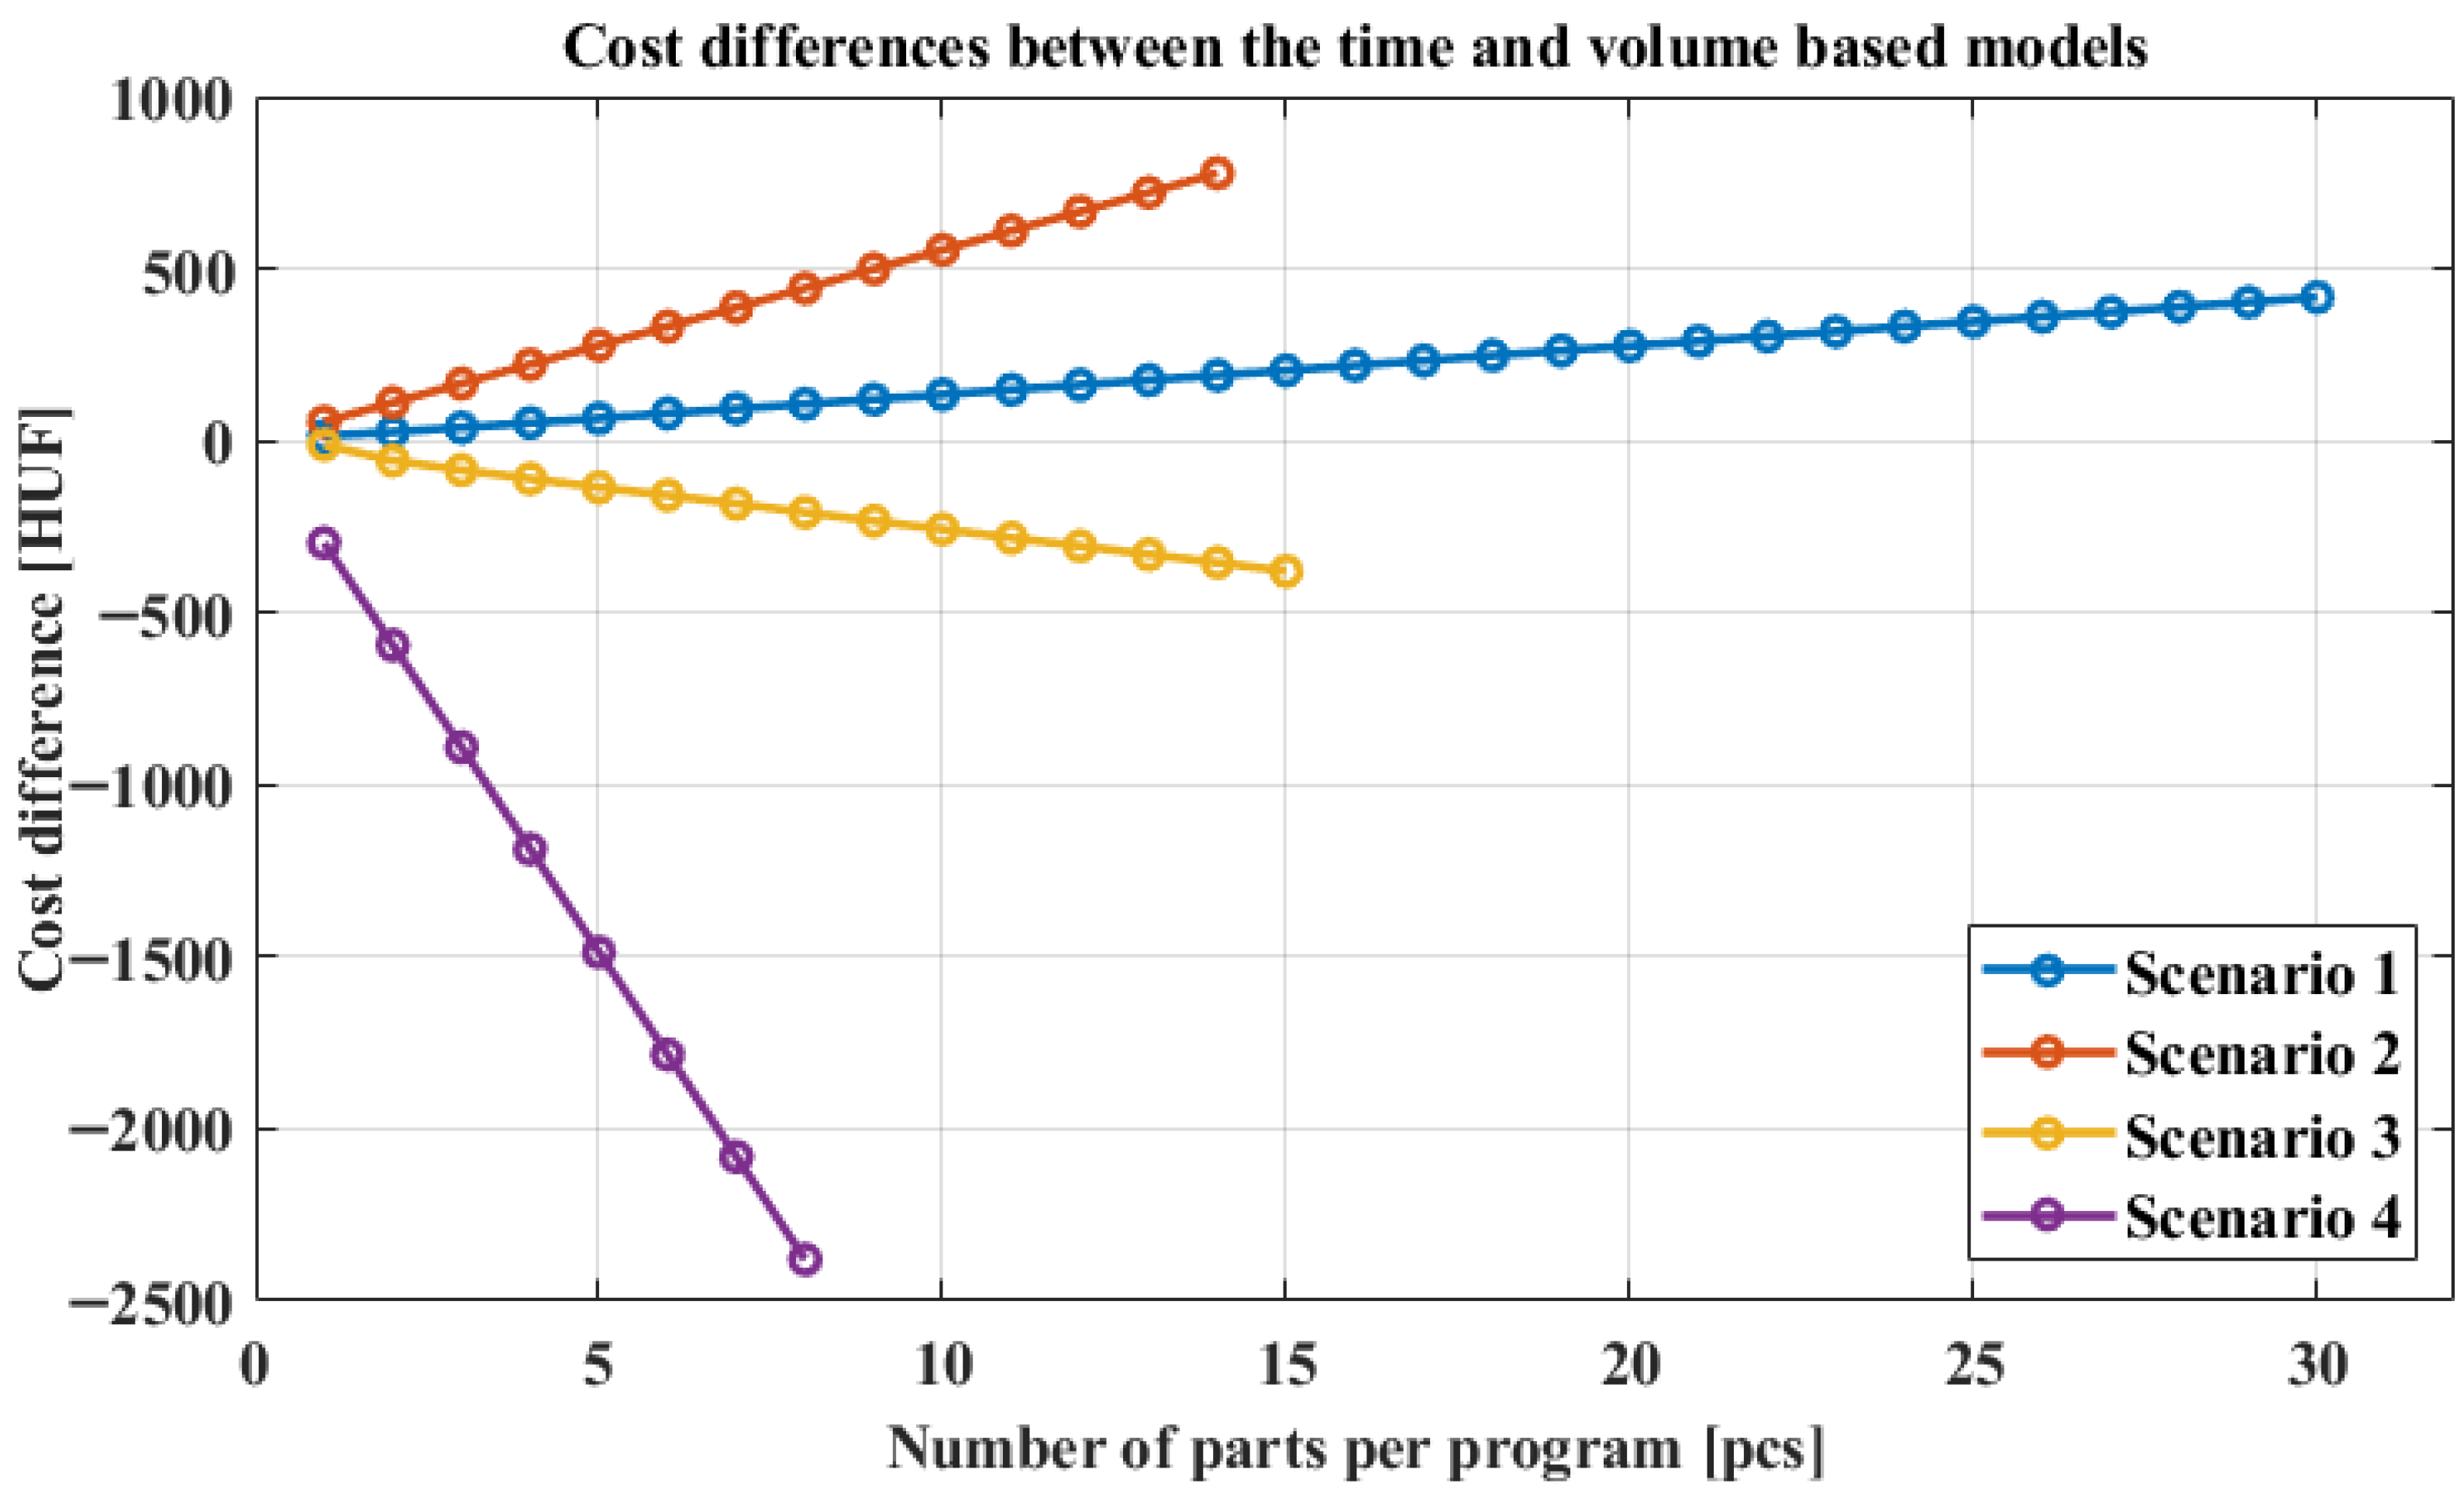
In the previous section, we highlighted the significant cost differences that can arise between time-based and extruded-volume-based wear calculations in
Figure 11. We illustrated the differences in nozzle costs observed in the presented scenarios (it is important to note that these still do not reflect the total tooling cost). Based on the nature of the scenarios, several conclusions can be drawn.
As the number of printed parts increases, the differences between the models continuously grow and become clearly observable. The first two scenarios (Benchy and scraper) involve parts with cross-sections where the proportion of wall structures is relatively high compared to the internal infill. To ensure dimensional accuracy and surface quality, the printhead moves more slowly when printing walls, which increases the overall build time. In these two scenarios, the main difference lies in the ratio of model material to support material required. In the first case, the amounts are nearly equal, whereas in the second case, support material is only required for the construction of the raft. Accordingly, an overestimation occurs in the second scenario due to excessive wear being attributed to the support-material-extruding nozzle. The volumetric model detects this discrepancy, resulting in significantly increasing error between the two methods as part quantity grows. A similar effect occurs in the Benchy scenario as well; however, the time-based model produces a smaller error in this case, which means that the deviation becomes significant only for larger part counts. Overall, it can be stated that in scenarios where the geometry of the part leads to a low material extrusion rate per time (Sencario 1: 15.34 cm3/h and Scenario 2: 7.28 cm3/h at maximum part count) or where there is a large discrepancy between the required model and support material, the time-based cost estimation tends to overestimate expenses. In contrast, the volumetric model captures these variations more accurately and reflects lower, more realistic costs.
In scenarios three and four (support test part and Ssand), the material extrusion rate per time is higher (Scenario 3: 19.02 cm3/h and Scenario 4: 81.26 cm3/h at maximum part count). In these cases, the volumetric model yields higher cost estimates, as more material is extruded per unit time, which results in greater nozzle wear. Although the third scenario also involves a large difference between the model and support material requirements, the lifespan of the support-material nozzle is significantly lower, resulting in a higher unit cost per volume extruded. Therefore, when substantial amounts of model or support material are extruded—either due to simpler part geometries or bulky support structures—the volumetric method yields higher cost estimates. The time-based method underestimates these, as it only accounts for the total build time, without considering the actual workload imposed on the nozzles during that period.
5. Summary
In this study, a cost estimation model specifically designed for FDM technology was refined to produce more accurate results regarding the tool and part costs. The main strength of the proposed model lies in its consideration of nozzle wear as a function of the volume of extruded material, which results in significantly higher accuracy compared to traditional time-based calculations. The model’s effectiveness was demonstrated through representative example scenarios. Beyond the detailed analysis of each scenario, a broader understanding was gained regarding the specific conditions under which this new approach provides the most accurate results. It was also revealed that the most reliable way to characterize such manufacturing programs is by evaluating the material extrusion rate per unit time. This metric can serve as a useful indicator for predicting the general nature and resource demands of a manufacturing job even before execution. This indicator heavily relies on the geometry of the parts, which is similar to other approaches, but does not exclusively need correct results [
27]. This indicator is intended to be utilized in future developments and refinements of the model, as its potential makes it a valuable metric for characterizing the complexity and nature of manufacturing jobs.
The presented examples successfully demonstrate that the detailed volumetric cost estimation model is significantly more capable of accurately reflecting the characteristics of various manufacturing programs, regardless of geometric complexity, part quantity, or support structure requirements. With this work, our explicit goal is to contribute to the development of a sufficiently accurate cost estimation method in addition to PBF-based additive manufacturing technologies, specifically for MEX processes. The initial steps of this development, along with the key differences compared to existing models, have been outlined in this study exclusively with an industrial printer ecosystem. Although substantial gaps still exist in current cost modeling approaches, it is evident that no universal model can be applied to all additive manufacturing processes. Instead, cost models must be specifically tailored to each technology group. The presented model is a modification of an existing cost model tailored for FDM in which tool wear—previously not explicitly considered—is now incorporated into the estimation. Accordingly, in its current form the model can only be applied to FDM technology, specifically to the Stratasys system. However, by introducing empirical values, it can be adapted to any other available FDM or FFF system as well. Achieving this generalization, along with validating the model’s efficiency and accuracy through the production and analysis of functional parts, forms part of the authors’ future work.
Author Contributions
Conceptualization, B.L.S.; methodology, B.L.S.; software, B.L.S.; validation, B.L.S. and P.F.; formal analysis, B.L.S.; investigation, B.L.S.; resources, B.L.S.; data curation, B.L.S.; writing—original draft preparation, B.L.S.; writing—review and editing, B.L.S. and P.F.; visualization, B.L.S.; supervision, P.F.; project administration, B.L.S. and P.F.; funding acquisition, B.L.S. All authors have read and agreed to the published version of the manuscript.
Funding
This research received no external funding.
Data Availability Statement
All necessary data required to reproduce the results are available upon reasonable request by contacting the corresponding author B.L.S.
Acknowledgments
During the preparation of this study, the authors used ChatGPT 5, for the purposes of translation and grammar correction. The authors have reviewed and edited the output and take full responsibility for the content of this publication.
Conflicts of Interest
The authors declare no conflicts of interest.
Abbreviations
The following abbreviations are used in this manuscript:
| AM | Additive Manufacturing |
| CNC | Computer Numeric Control |
| FDM | Fused Deposition Modelling |
| FFF | Fused Filament Fabrication |
| ABS | Acrylonitrile Butadiene Styrene |
| ASA | Acrylonitrile Styrene Acrylate |
| PA12 | Polyamide-12 |
| PBF | Powder Bed Fusion |
Appendix A
Figure A1.
Build sheet price per part for different sheet lifespans and number of parts per program.
Figure A1.
Build sheet price per part for different sheet lifespans and number of parts per program.
References
- Cavallo, F.; Ceulemans, J.; Gasner, B.; Martinez, M.G.; Grilli, M.; Ménière, Y.; Mayoral, J.L.M.; Papanikolaou, V.; Radev, B.; Rudyk, I.; et al. Innovation Trends in Additive Manufacturing: Patents in 3D Printing Techologies. 2023. Available online: https://link.epo.org/web/service-support/publications/en-additive-manufacturing-study-2023-full-study.pdf (accessed on 10 July 2025).
- Pálfi, T.; Ficzere, P. Aerodynamic Study of Different Types of Wingtip Devices. Period. Polytech. Transp. Eng. 2025, 53, 77–86. [Google Scholar] [CrossRef]
- Wolarek, L.; Seregi, B.L.; Ficzere, P. Proposal of Parameter Control Designation System of Additively Manufactured Parts. Des. Mach. Struct. 2024, 14, 84–94. [Google Scholar] [CrossRef]
- Ficzere, P. Introductory Analysis for Fatigue Testing of MEX Parts. Period. Polytech. Mech. Eng. 2025, 69, 274–277. [Google Scholar] [CrossRef]
- Niaki, M.K.; Fabio, N. The Management of Additive Manufacturing; Springer: Birmingham, UK, 2018; pp. 182–191. [Google Scholar]
- Zhou, L.; Miller, J.; Vezza, J.; Mayster, M.; Raffay, M.; Justice, Q.; Al Tamimi, Z.; Hansotte, G.; Sunkara, L.D.; Bernat, J. Additive Manufacturing: A Comprehensive Review. Sensors 2024, 24, 2668. [Google Scholar] [CrossRef] [PubMed]
- Gao, W.; Zhang, Y.; Ramanujan, D.; Ramani, K.; Chen, Y.; Williams, C.B.; Wang, C.C.L.; Shin, Y.C.; Zhang, S.; Zavattieri, P.D. The status, challenges, and future of additive manufacturing in engineering. Comput.-Aided Des. 2015, 69, 65–89. [Google Scholar] [CrossRef]
- Ruffo, M.; Tuck, C.; Hague, R. Cost estimation for rapid manufacturing-laser sintering production for low to medium volumes. Proc. Inst. Mech. Eng. Part B J. Eng. Manuf. 2006, 220, 1417–1427. [Google Scholar] [CrossRef]
- Hopkinson, N.; Dicknes, P. Analysis of rapid manufacturing—Using layer manufacturing processes for production. Proc. Inst. Mech. Eng. Part C J. Mech. Eng. Sci. 2003, 217, 31–39. [Google Scholar] [CrossRef]
- Atzeni, E.; Salmi, A. Economics of additive manufacturing for end-usable metal parts. Int. J. Adv. Manuf. Technol. 2012, 62, 1147–1155. [Google Scholar] [CrossRef]
- Sungshik, Y.; David, R. Build Time and Cost Models for Additive Manufacturing Process Selection. In Proceedings of the ASME Design Engineering Technical Conference, Chicago, IL, USA, 12–15 August 2012; p. 2. [Google Scholar] [CrossRef]
- Khanna, N.; Salvi, H.; Karaş, B.; Fairoz, I.; Shokrani, A. Cost Modelling for Powder Bed Fusion and Directed Energy Deposition Additive Manufacturing. J. Manuf. Mater. Process. 2024, 8, 142. [Google Scholar] [CrossRef]
- Christian, L.; Ulrich, J.; Matthias, H.; Rainer, K. Analyzing Product Lifecycle Costs for a Better Understanding of Cost Drivers in Additive Manufacturing. In Proceedings of the 23rd Annual International Solid Freeform Fabrication Symposium—An Additive Manufacturing Conference, SFF 2012, Austin, TX, USA, 6–8 August 2012. [Google Scholar]
- Schröder, M.; Falk, B.; Schmitt, R. Evaluation of Cost Structures of Additive Manufacturing Processes Using a New Business Model. Procedia CIRP 2015, 30, 311–316. [Google Scholar] [CrossRef]
- Joana, M.; Leonardo, S.; Henrique, I.; Ana, P.; Jorge, A. Effects of nozzle material and its lifespan on the quality of PLA parts manufactured by FFF 3D Printing. Eng. Manuf. Lett. 2022, 1, 20–27. [Google Scholar] [CrossRef]
- Mahadik, A.; Masel, D. Implementation of Additive Manufacturing Cost Estimation Tool (AMCET) Using Break-down Approach. Procedia Manuf. 2018, 17, 70–77. [Google Scholar] [CrossRef]
- Stratsys Support 450 mc 3D Printer User Guide. Available online: https://support.stratasys.com/-/preview-pdf/public1/fdm-technical-resources/printers/fortus-380mc-450mc/fortus-450mc-k1-series-user-guide---english.pdf (accessed on 10 July 2025).
- Eyers, D.R.; Potter, A.T. Industrial additive manufacturing: A manufacturing systems perspective. Comput. Ind. 2017, 92–93, 208–218. [Google Scholar] [CrossRef]
- Asami, K.; Herzog, D.; Deutschmann, T.; Röver, T.; Kelbassa, I.; Emmelmann, C. Methodology for Cost Estimation Using Characteristic Factors in Additive Manufacturing. J. Jpn. Soc. Powder Powder Metall. 2025, 72, S75–S82. [Google Scholar] [CrossRef]
- Griffin, C.; Hale, J.; Jin, M. A framework for assessing investment costs of additive manufacturing. Prog. Addit. Manuf. 2022, 7, 903–915. [Google Scholar] [CrossRef]
- Wahlström, T.; Sahlström, J. Additive Manufacturing in Production. Master’s Thesis, Lund University, Lund, Sweden, 2016. [Google Scholar]
- Re, D.; Di Biccari, C.; Corallo, A. A Cost Model for Additive Manufacturing in Construction. IOP Conf. Ser. Earth Environ. Sci. 2022, 1101, 092014. [Google Scholar] [CrossRef]
- 3D Benchy by Prusa Research. Available online: https://www.printables.com/model/3161-3d-benchy (accessed on 1 July 2025).
- HexScraper–Printbed Scraper by Visle. Available online: https://www.printables.com/model/122894-hexscraper-printbed-scraper (accessed on 1 July 2025).
- Laptop Stand by the Mabur. Available online: https://www.printables.com/model/63523-laptop-stand (accessed on 1 July 2025).
- Support Test by FaultyData. Available online: https://www.printables.com/model/198420-support-test (accessed on 1 July 2025).
- Maier, O.; Ellsel, C.; Göhlich, D. Assessing additive manufacturing suitability of metal parts: A geometry-focused methodology. Discov. Appl. Sci. 2025, 7, 778. [Google Scholar] [CrossRef]
| Disclaimer/Publisher’s Note: The statements, opinions and data contained in all publications are solely those of the individual author(s) and contributor(s) and not of MDPI and/or the editor(s). MDPI and/or the editor(s) disclaim responsibility for any injury to people or property resulting from any ideas, methods, instructions or products referred to in the content. |
© 2025 by the authors. Licensee MDPI, Basel, Switzerland. This article is an open access article distributed under the terms and conditions of the Creative Commons Attribution (CC BY) license (https://creativecommons.org/licenses/by/4.0/).
