Article

Unveiling Surface Roughness Trends and Mechanical Properties in Friction Stir Welded Similar Alloys Joints Using Adaptive Thresholding and Grayscale Histogram Analysis

by
Haider Khazal
1,
Azzeddine Belaziz
2,
Raheem Al-Sabur
1,*,
Hassanein I. Khalaf
1 and
Zerrouki Abdelwahab
2
1
Mechanical Department, Engineering College, University of Basrah, Basrah 61004, Iraq
2
Center of Research in Mechanics CRM, Constantine 25017, Algeria
*
Author to whom correspondence should be addressed.
J. Manuf. Mater. Process. 2025, 9(5), 159; https://doi.org/10.3390/jmmp9050159
Submission received: 1 April 2025 / Revised: 10 May 2025 / Accepted: 13 May 2025 / Published: 14 May 2025
(This article belongs to the Special Issue Advances in Dissimilar Metal Joining and Welding)

Abstract

Surface roughness plays a vital role in determining surface integrity and function. Surface irregularities or reduced quality near the surface can contribute to material failure. Surface roughness is considered a crucial factor in estimating the fatigue life of structures welded by FSW. This study attempts to provide a deeper understanding of the nature of the surface formation and roughness of aluminum joints during FSW processes. In order to form more efficient joints, the frictional temperature generated was monitored until reaching 450 °C, where the transverse movement of the tool and the joint welding began. Hardness and tensile tests showed that the formed joints were good, which paved the way for more reliable surface roughness measurements. The surface roughness of the weld joint was measured along the weld line at three symmetrical levels using welding parameters that included a rotational speed of 1250 rpm, a welding speed of 71 mm/min, and a tilt angle of 1.5°. The average hardness in the stir zone was measured at 64 HV, compared to 50 HV in the base material, indicating a strengthening effect induced by the welding process. In terms of tensile strength, the FSW joint exhibited a maximum force of 2.759 kN. Average roughness (Rz), arithmetic center roughness (Ra), and maximum peak-to-valley height (Rt) were measured. The results showed that along the weld line and at all levels, the roughness coefficients (Rz, Ra, and Rt) gradually increased from the beginning of the weld line to its end. The roughness Rz varies from start to finish, ranging between 9.84 μm and 16.87 μm on the RS and 8.77 μm and 13.98 μm on the AS, leveling off slightly toward the end as the heat input stabilizes. The obtained surface roughness and mechanical properties can give an in-depth understanding of the joint surface forming and increase the ability to overcome cracks and defects. Consequently, this approach, using adaptive thresholding image processing coupled with grayscale histogram analysis, yielded significant understanding of the FSW joint’s surface texture.

1. Introduction

Since its early invention in the 1990s, FSW has developed into a solid-state welding process that is interested in welding not only light metals but also composites, polymers, and even other metals like steel [1,2,3]. The primary motivation for FSW’s popularity is its ability to produce defect-free joints with relatively little distortion compared to fusion welding, such as arc welding [4]. FSW’s working principle, which enables it to fuse metals below the melting points of the base materials, has made this type of welding of considerable industrial interest, especially in aerospace applications [5].
Aluminum alloy 6061 is in the aluminum 6000 series, the main elements of which are magnesium and silicon. This alloy has the characteristics of medium strength, good corrosion resistance, weldability, no deformation after processing, and a good oxidation effect. Various industrial structural parts, including structural materials, ships, and precision machinery, widely utilize Aluminum 6061 due to its specific strength and high corrosion resistance [6,7].
The finely distributed micro-irregularities of a surface, such as roughness, waviness, and shape, are referred to as surface roughness [8]. In all types of welding, whether fusion or solid-state welding, there is a significant correlation between joint surface roughness and the extent of subsequent crack and defect formation [9]. This directly affects performance, fatigue life, and surface resistance to corrosion and wear [10]. In FSW, surface roughness arises from complex material flow dynamics, tool geometry, and process parameters, such as tool rotational speed, traverse speed, and axial force [11,12]. It is well established that FSW joints are not entirely free of defects, particularly residual stresses, which can influence surface quality, mechanical performance, and even surface roughness [13,14].
To ensure high-quality FSW joints and optimize the welding process-related surface roughness, it is imperative to comprehend these aspects. Bhushan and Sharma [13] studied the effect of rotational speed and welding speed on the roughness of AA6061-T651 joints welded by FSW. They found that intermediate speeds, such as 1400 rpm, and a welding speed of 20 mm/min can significantly reduce the surface roughness levels, which can increase the joint life. By varying the welding parameters of feed speed and welding rotational speed, Chinchanikar et al. [15] explored the roughness of AA6063 aluminum alloy and discovered that increasing the welding parameters in the FSW process could enhance the surface smoothness. In addition, they showed that tripling the rotation speed to about 960 rpm had positive results in reducing the roughness of the surface. In a similar vein, Salina Budin et al. [16] showed that raising the tool’s rotational speed to 1790 rpm could smooth the surface and make the FSW joint surface less rough. This resulted in a substantial decrease in flaws in FSW-welded copper alloys. Gaikwad and Chinchanikar [17] tested the roughness of AA7075-T651 aluminum alloy under three ranges of tool rotation speeds (1000, 1400, and 2000 rpm) with two different transverse speeds. They discovered that lower rotational speeds resulted in less roughness and higher hardness. Abdullah et al.’s [18] results are not consistent with the previous study on using aluminum alloy AA7020-T6. In that study, they found that increasing the tool rotational speed leads to increasing the surface roughness of the joint welded by FSW when they compared the results obtained from using three rotational speeds: 1200 rpm, 1400 rpm, and 1600 rpm. Osman and Tamin [19] investigated the effect of pin geometry on the surface roughness of FSW joints in AA6061-T6 aluminum alloy by using three different pin configurations: square, thread, and hexagon. The study showed that a square pin could give joint surface roughness up to 0.85 μm, corresponding to the maximum tensile strength obtained. EL-Ghazawi et al. [20] examined the roughness of FSW joints at the beginning, middle, and end using different rotational and transverse speeds in AA 6063 aluminum alloy welded by FSW. The study showed that the speed of the rotational tool has a greater effect than the welding speed on the roughness of the joint surface, and the higher rotation tool rotational speed produces a better surface roughness quality, which can reach 7.990 μm. Hassan et al. [21] demonstrated that when welding AA2024-T3 aluminum alloy with AA6061-T6, the decrease in surface roughness of the FSW joints improves the microstructure and enhances the contact between the two surfaces when exposed to corrosive environments. Eisa and Mabrouk [22] confirmed that tool rotation speed is the most influential factor in the roughness of the FSW joint. At the beginning of the welding process, the surface roughness (Ra) can be relatively high, but it can improve toward the end. The use of high welding speed, up to 160 mm/min, exacerbates the resulting joint roughness. Sanjeev et al. [23] looked at how different shapes of tool pins affected the surface roughness of an aluminum–lithium alloy during FSW on both the advancing side (AS) and the retreating side (RS). The study showed that using a hybrid tool pin (HTP) can increase the smoothness of the FSW joint.
The mechanical and microstructural characteristics of FSW joints have been the subject of much research, although surface roughness analysis has gotten relatively less attention. This gap is significant because surface imperfections can affect the overall integrity of the FSW joint by indicating underlying problems such as voids, cracks, or inappropriate material flow. The goal of this study is to find out how surface roughness changes over time in aluminum alloys that are friction stir welded. To achieve this, we will carefully look at roughness parameters like average surface roughness (Ra), mean peak-to-valley height (Rz), and maximum peak-to-valley height (Rt). The investigation includes measurements taken at strategic points along and near the welding line to capture spatial variations induced by the FSW process. In addition, the effect of friction-generated heat at the beginning of the welding process was studied. Tensile and hardness tests further enhanced the results by determining the quality of the resulting joints. Finally, a combination of adaptive thresholding image processing and grayscale histogram analysis was applied to examine the FSW joint surface characteristics more deeply.

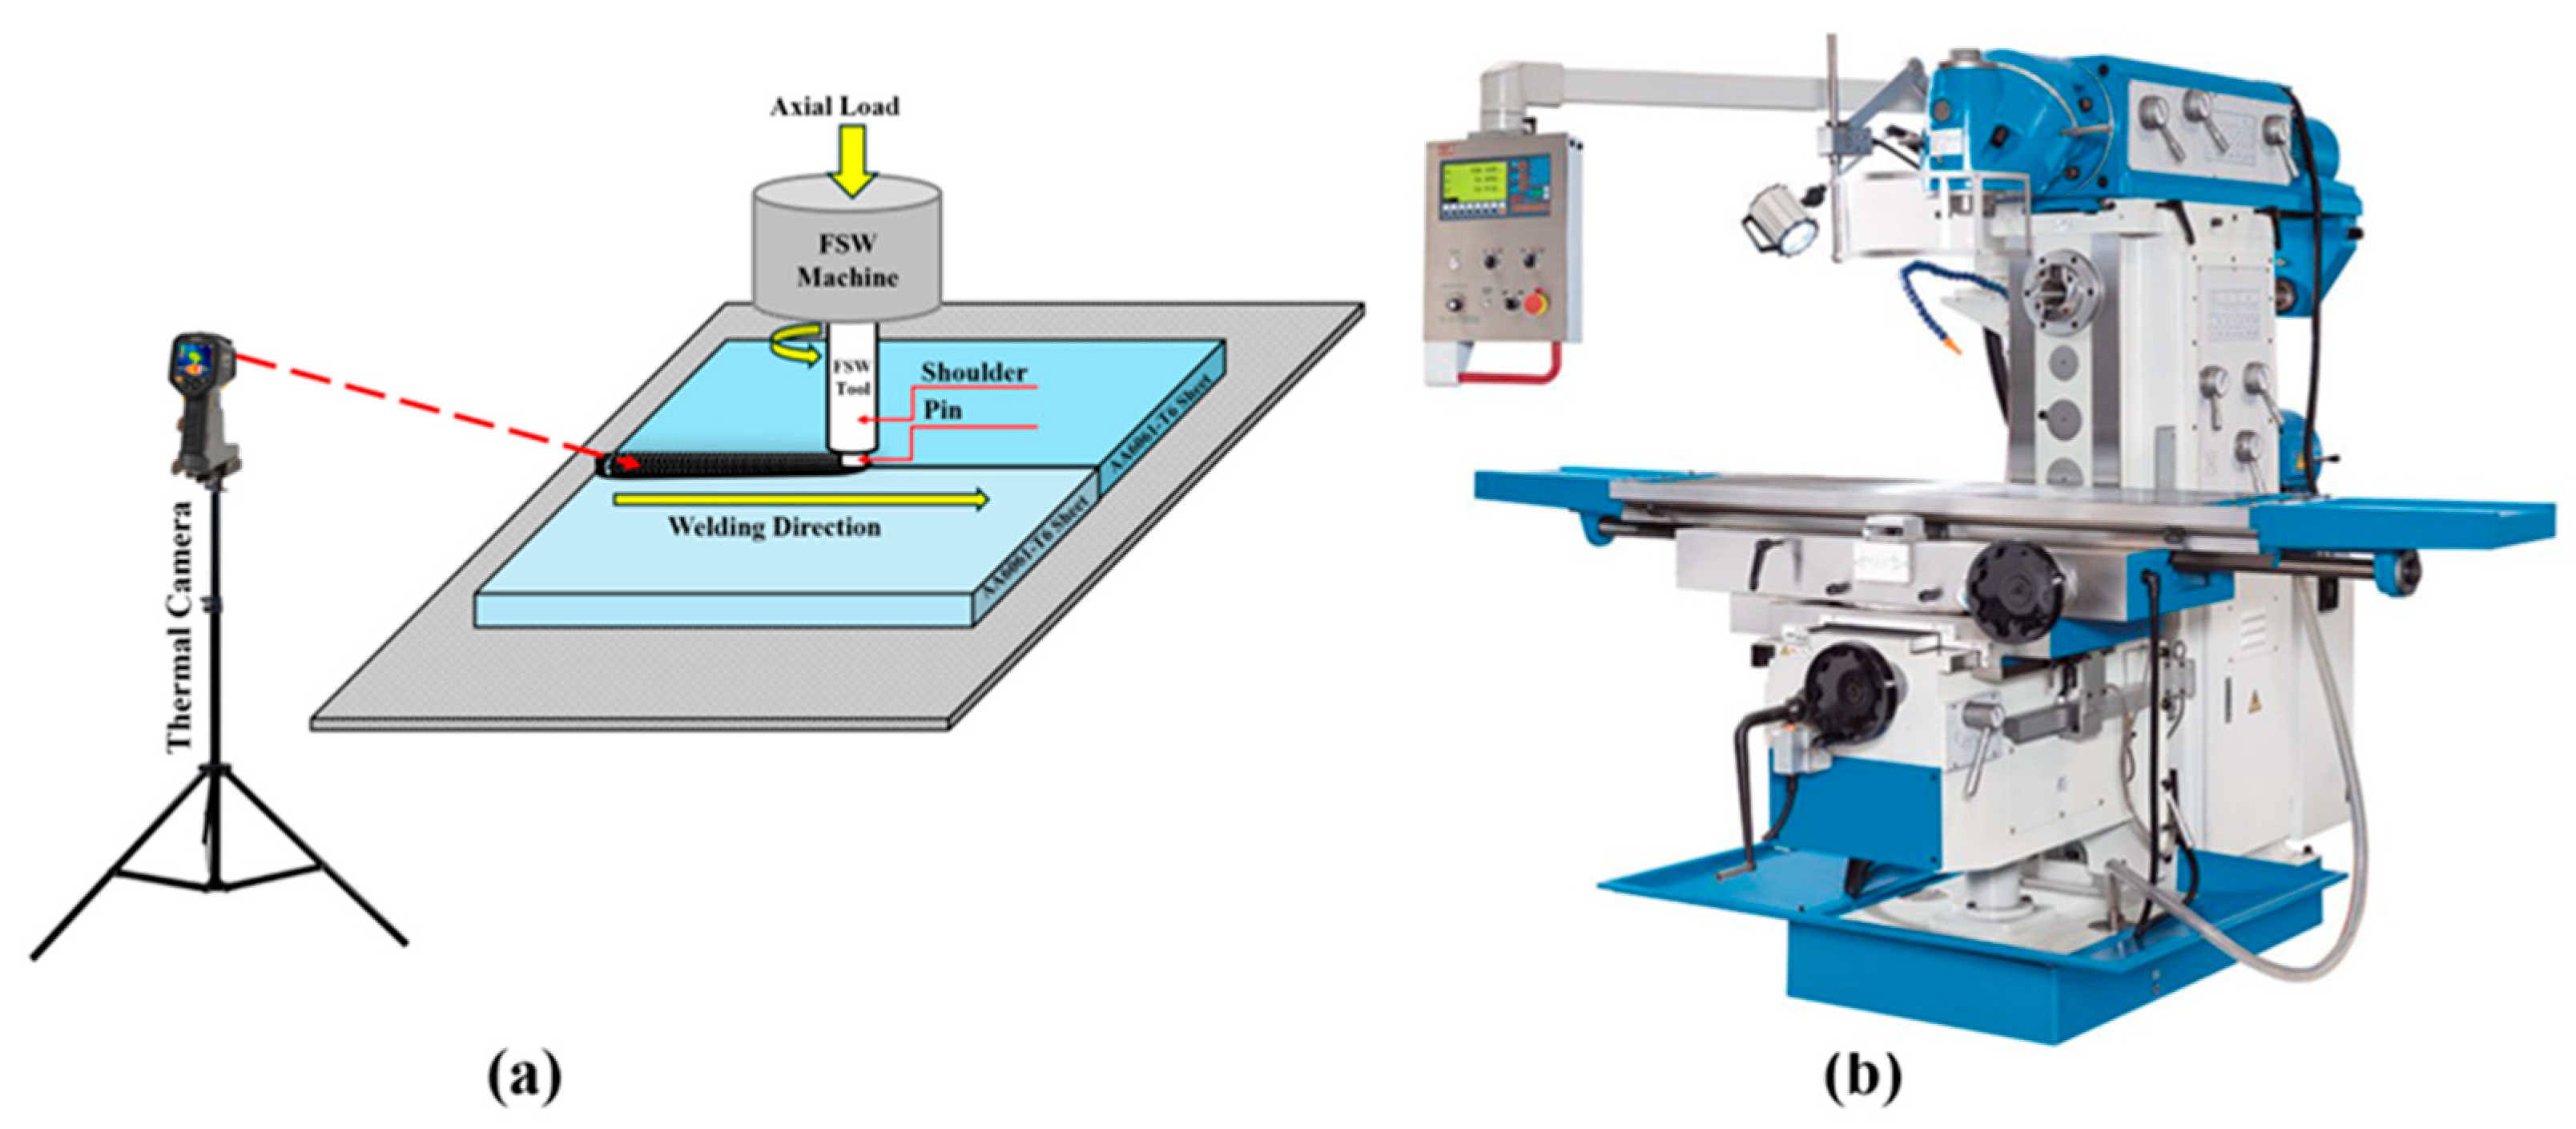
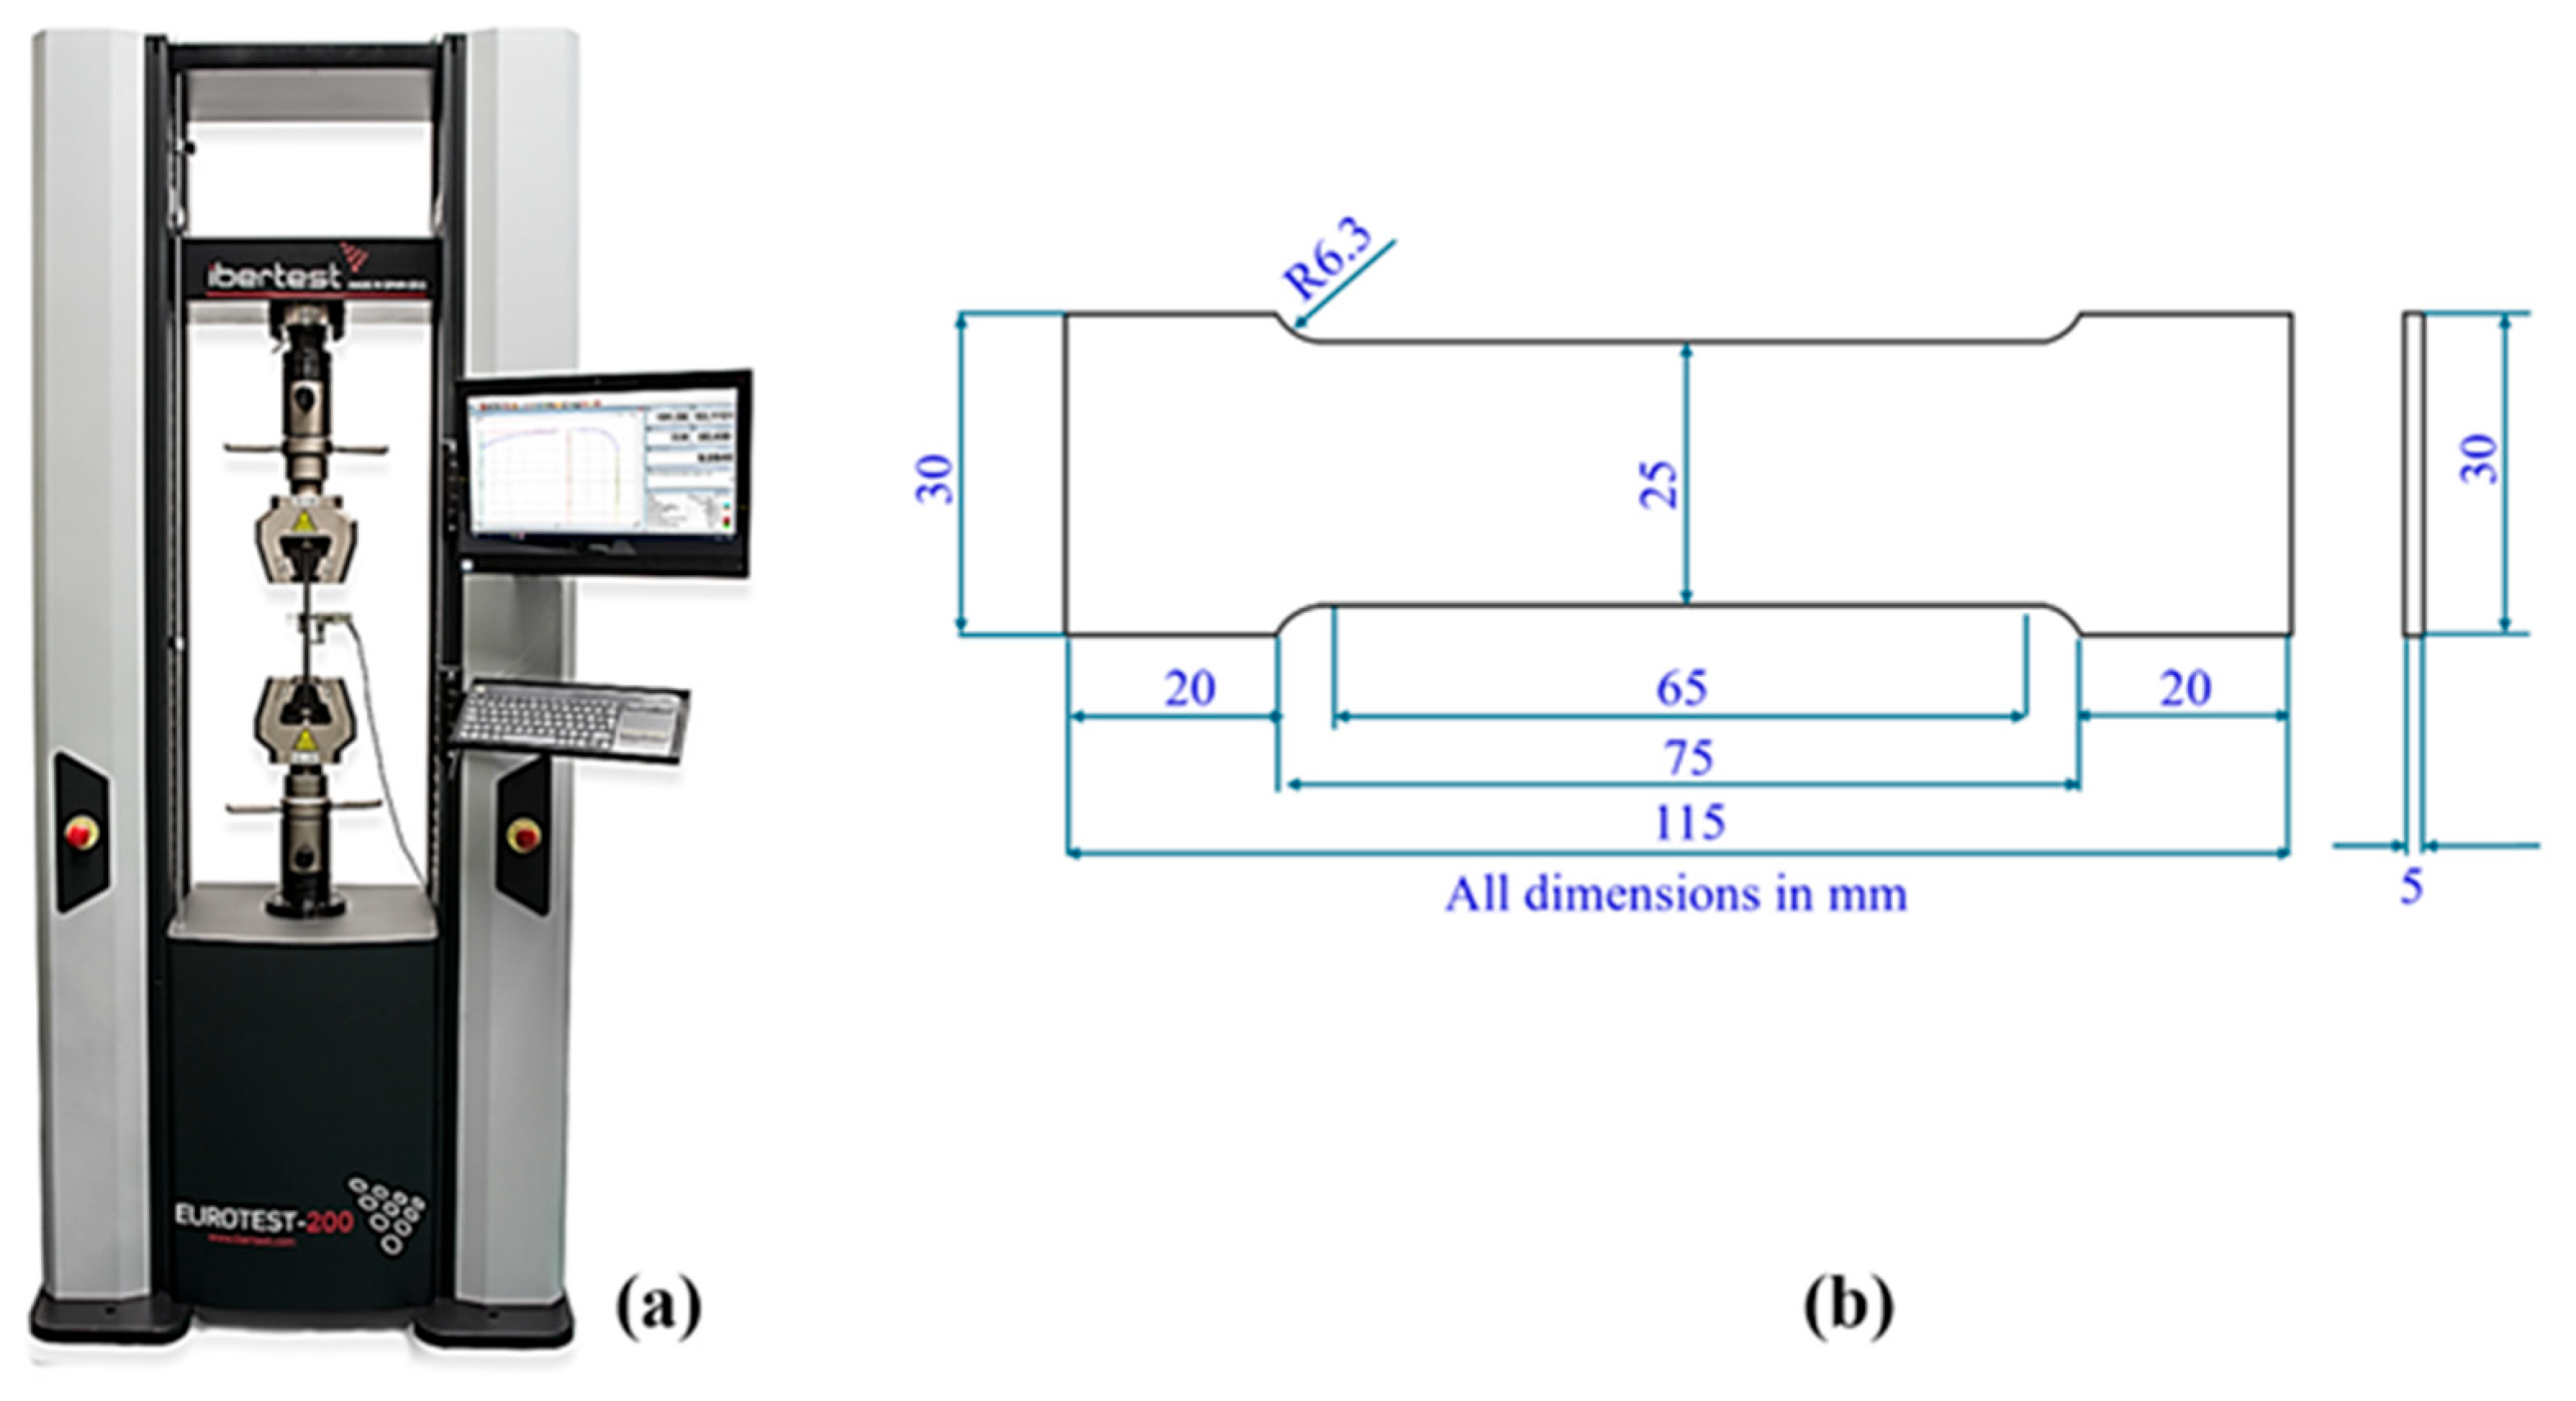
2. Materials and Methods

The FSW machine utilizes a non-consumable tool, a punch with a shoulder and a pin, to simultaneously rotate and transversely join two workpieces along the desired weld line as shown in Figure 1a. Rotational speed, welding speed, and tool tilt angle are of great importance in friction stir welding studies.
In this study, FSW was conducted on a Knuth UWF 6 (KNUTH Werkzeugmaschinen GmbH, Hamburg, Germany) universal milling machine, as shown in Figure 1b. The selected machine’s digital control system facilitated the positioning of the tool holder along the x, y, and z axes, with the z-axis determining the tool’s plunge depth into the workpiece. The milling machine is 1600 mm × 360 mm table dimensions, tool rotational speed of 1800 rpm which satisfied the requirement of the current study. The thermal imaging camera PCE-TC 38 (PCE Instruments UK Ltd., Southampton, UK) performed the temperature profile analysis where it was fixed using stand as shown in Figure 1a.
The FSW tool was prepared from XC48 steel, with a shoulder diameter and length of 20 and 95 mm, respectively. The pin configuration was 7 mm in diameter and 4.5 mm in length. The XC48 steel tool’s chemical composition is 0.42% C, 0.029% S, 0.7% Mn, 0.042% P, and 0.38% Si, while its yield strength was 468 MPa [24].
The standard EN-AW AA6061-T6 aluminum alloy, with the chemical composition including 0.80% Si, 0.70% Fe, 0.05% Cu, 0.15% Mn, 0.05% Mg, 0.35% Cr, 0.25% Zn, 0.15% Ti, and the rest Al, was used with temper O. Two plates made of aluminum alloy AA6061-T6 (250 × 100 × 5 mm) were butt joints prepared and joined using FSW. This study adopted a rotational speed of 1250 rpm, a welding speed of 71 mm/min, and a tilt angle of 1.5°, based on numerous previous studies that dealt with aluminum alloys during FSW. Each FSW joint was visually inspected.
The EUROTEST-300 universal machine (S.A.E. IBERTEST, Madrid, Spain), with a 300 KN capacity, is used to investigate the mechanical properties of the FSW joints. The tensile test specimens were prepared according to ISO 6892-1 [25]. Figure 2 illustrates the dimensions of the tensile specimen and the universal tensile machine.
Microhardness testing was conducted using a universal hardness tester (INNOVATEST Europe BV, Limburg, The Netherlands) equipped with a camera and monitor. Samples were sectioned perpendicular to the weld, then mounted, polished, and etched to reveal the microstructure before microhardness testing, following standard metallographic procedures. Roughness measurement is an important aspect of this study, as it attempts to determine the amount of roughness generated in FSW joints and to understand it more deeply. Roughness measurement points on the welded structure were acquired using the handheld surface roughness tester PCE-RT 1200 (PCE Instruments UK Ltd., Southampton, UK).

3. Results and Discussion

3.1. Temperature Profile Analysis

The primary purpose of using a thermal camera is to monitor the temperature of the two aluminum sheets during the process. It should be noted that the thermal camera used in this study records only the surface temperature. Embedded thermocouples or numerical thermal modeling techniques would be necessary to assess temperature distribution through the material thickness, which is out of this study’s purpose. The FSW temperatures were measured using a thermal imaging camera along the weld and at a specific distance from the joint. When the heat generated between the aluminum sheets and the rotating FSW tool reaches approximately 450 °C, sufficient for metal flow, the tool begins its transverse movement along the welding line. When the temperature in the contact area between the shoulder and the two workpieces reached 450 °C, it was observed that there was a temperature gradient along the welding line (sheets length = 250 mm) as shown in Figure 3. The closer points had higher temperatures and gradually decreased until the edge of the aluminum sheets. The process of waiting, which involved solely rotating the tool without any transverse movement until the friction temperature reached 450 °C, significantly enhanced the tool’s transverse movement and streamlined the fluid flow process. This process is considered as a type of pre-heating and is often used in many types of welding, such as submerged arc welding [26]. Typically, pre-heating gives higher tensile strength than the normal process [27,28].

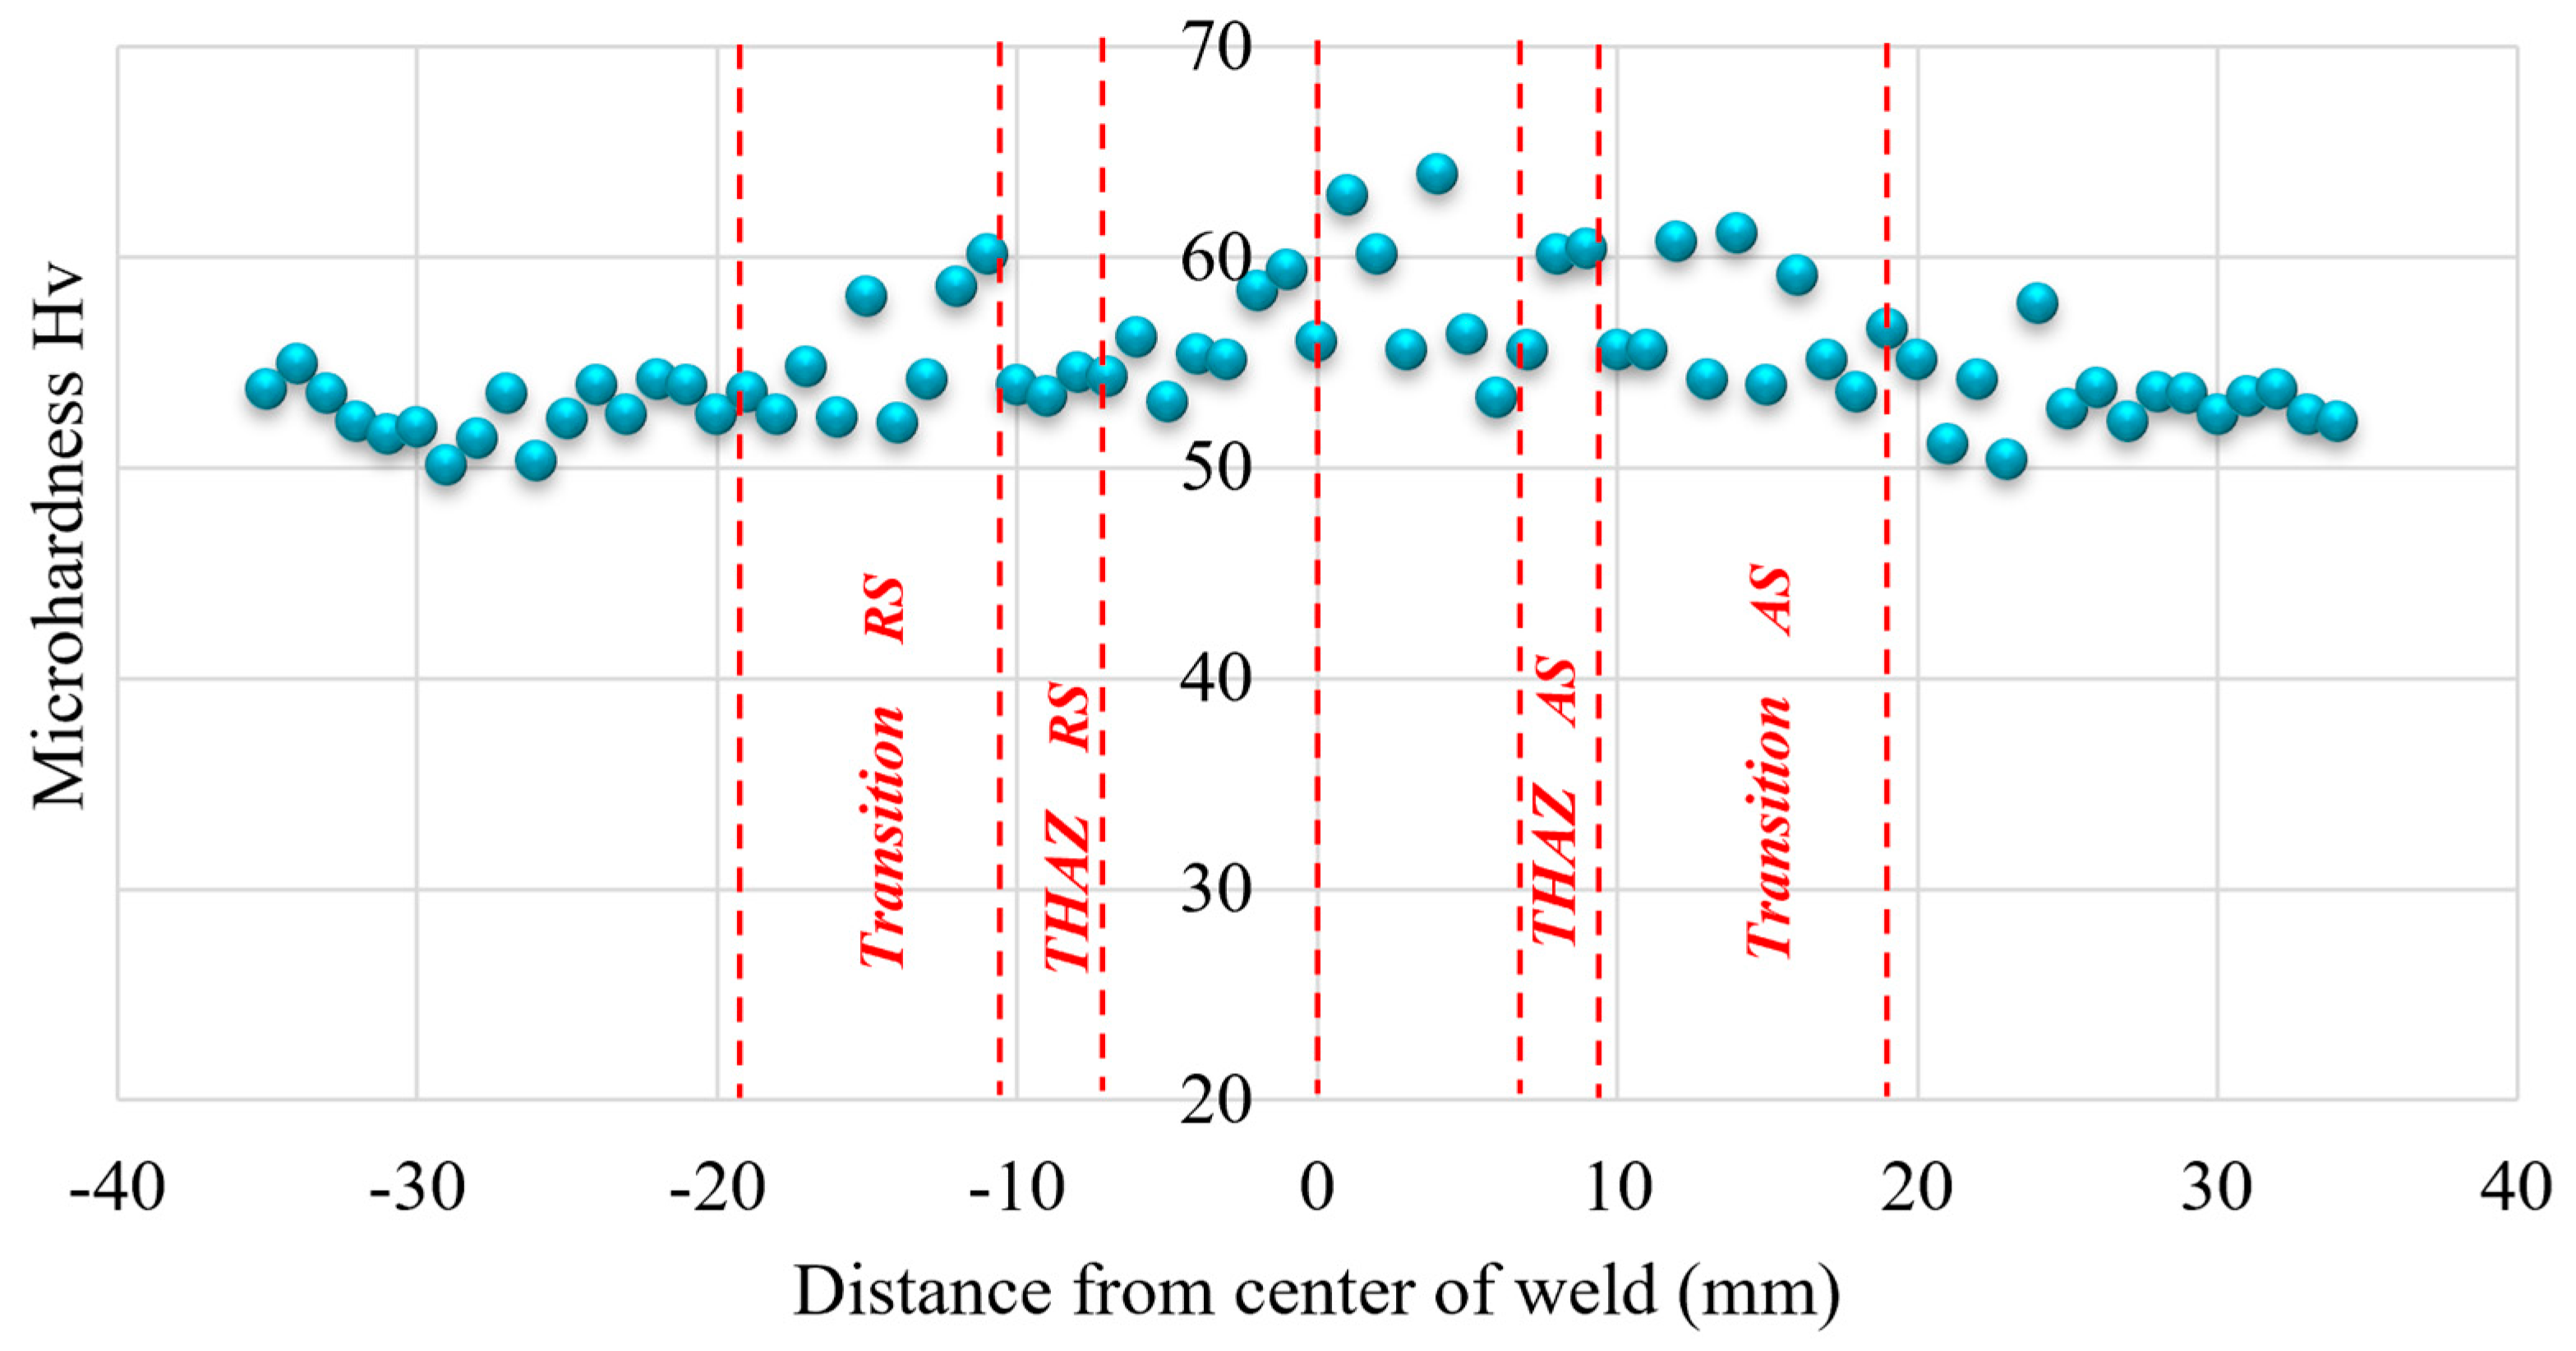
3.2. Tensile Strength and Hardness

In this study, AA6061-T6 aluminum alloy plates were joined using friction stir welding, performed at a tool rotational speed of 1250 rpm, a traverse speed of 71 mm/min, and a tool tilt angle set at 1.5° which were considered according to previous studies. ISO 6892-1 qualified both the welded and base metal specimens. Three specimens were examined for each test, and the average values were dependent. In general, the yield and tensile strength of the AA6061-T6 aluminum alloys were higher in the base metal than in the FSW joint according to the force–displacement curves from the tensile tests of the base metal and the FSW welded specimens. The difference was significant, reaching more than 50% at yield, but decreased significantly to 17% when comparing the ultimate strengths where the maximum force reached 3.248 kN in base metal compared with 2.759 kN in FSW joints, as shown in Table 1.
Many factors contribute to the significant differences in yield strength (>50% decrease) and ultimate tensile strength (17% decrease) between the base metal and the FSW joints in aluminum alloy during FSW. One of the primary causes is that the base metal frequently exhibits a microstructure that has been work-hardened or precipitation-hardened, resulting in a higher yield compared to FSW joints. This is because high temperatures can significantly alter the microstructure of the FSW joints, leading to the formation of irregular grain structures or heterogeneous zones that may adversely affect surface quality and mechanical performance [29,30]. Moreover, heating aluminum alloys during FSW can lead to grain growth and softening in the heat-affected zone (HAZ) and the stir zone (SZ), resulting in lower yield strength than the base metal [31,32]. The maximum tensile strength in the tensile test decreases to about 17% due to the material’s ability to resist fracture under tensile load. Despite the softening in FSW joints compared to the base metal, the solid-state nature of aluminum welding maintains the joint’s high load-bearing capacity, avoiding fusion defects like porosity and cracking. There was not much difference in elongation, as the elongation of the welded samples was less than that of the base metal samples.
Hardness measurements were carried out on cross-sections of FSW joints using a microhardness tester. Specimens taken from the advanced side (AS) were used as the starting point. The microhardness of different welded plates was measured according to the Vickers hardness test. The Vickers microhardness test was conducted according to ISO 6507-1 [33]. Microhardness testing at different points of the FSW joint was employed. Vickers hardness profile data were measured at selected points of the two welded sheets, as shown in Figure 3. Hardness results reveal a higher Vickers microhardness in the stir zone than the base material. The base metal (BM) regions showed the lowest hardness values, ranging from 50 HV to 52 HV, while the core region (welding nuggets) in contact with the metals showed the highest peaked values, ranging from 62 HV to 64 HV. The average hardness in the stir zone was measured at 64 HV, compared to 50 HV in the base material, indicating that the welding process resulted in a strengthening effect.
A dispersion of hardness is noted in the thermomechanically affected zone (TMAZ). The FSW process induces plastic deformation, leading to the dispersion of microhardness in the THAZ [34]. A strongly plastically deformed microstructure characterizes THAZ. Moreover, Figure 4 indicates the transition region during FSW, which refers to the area between the stir zone (SZ) and the thermomechanically affected zone (TMAZ) [35,36]. This region exhibits a gradual transition in microstructure and mechanical properties due to the combined effects of heat and mechanical deformation.

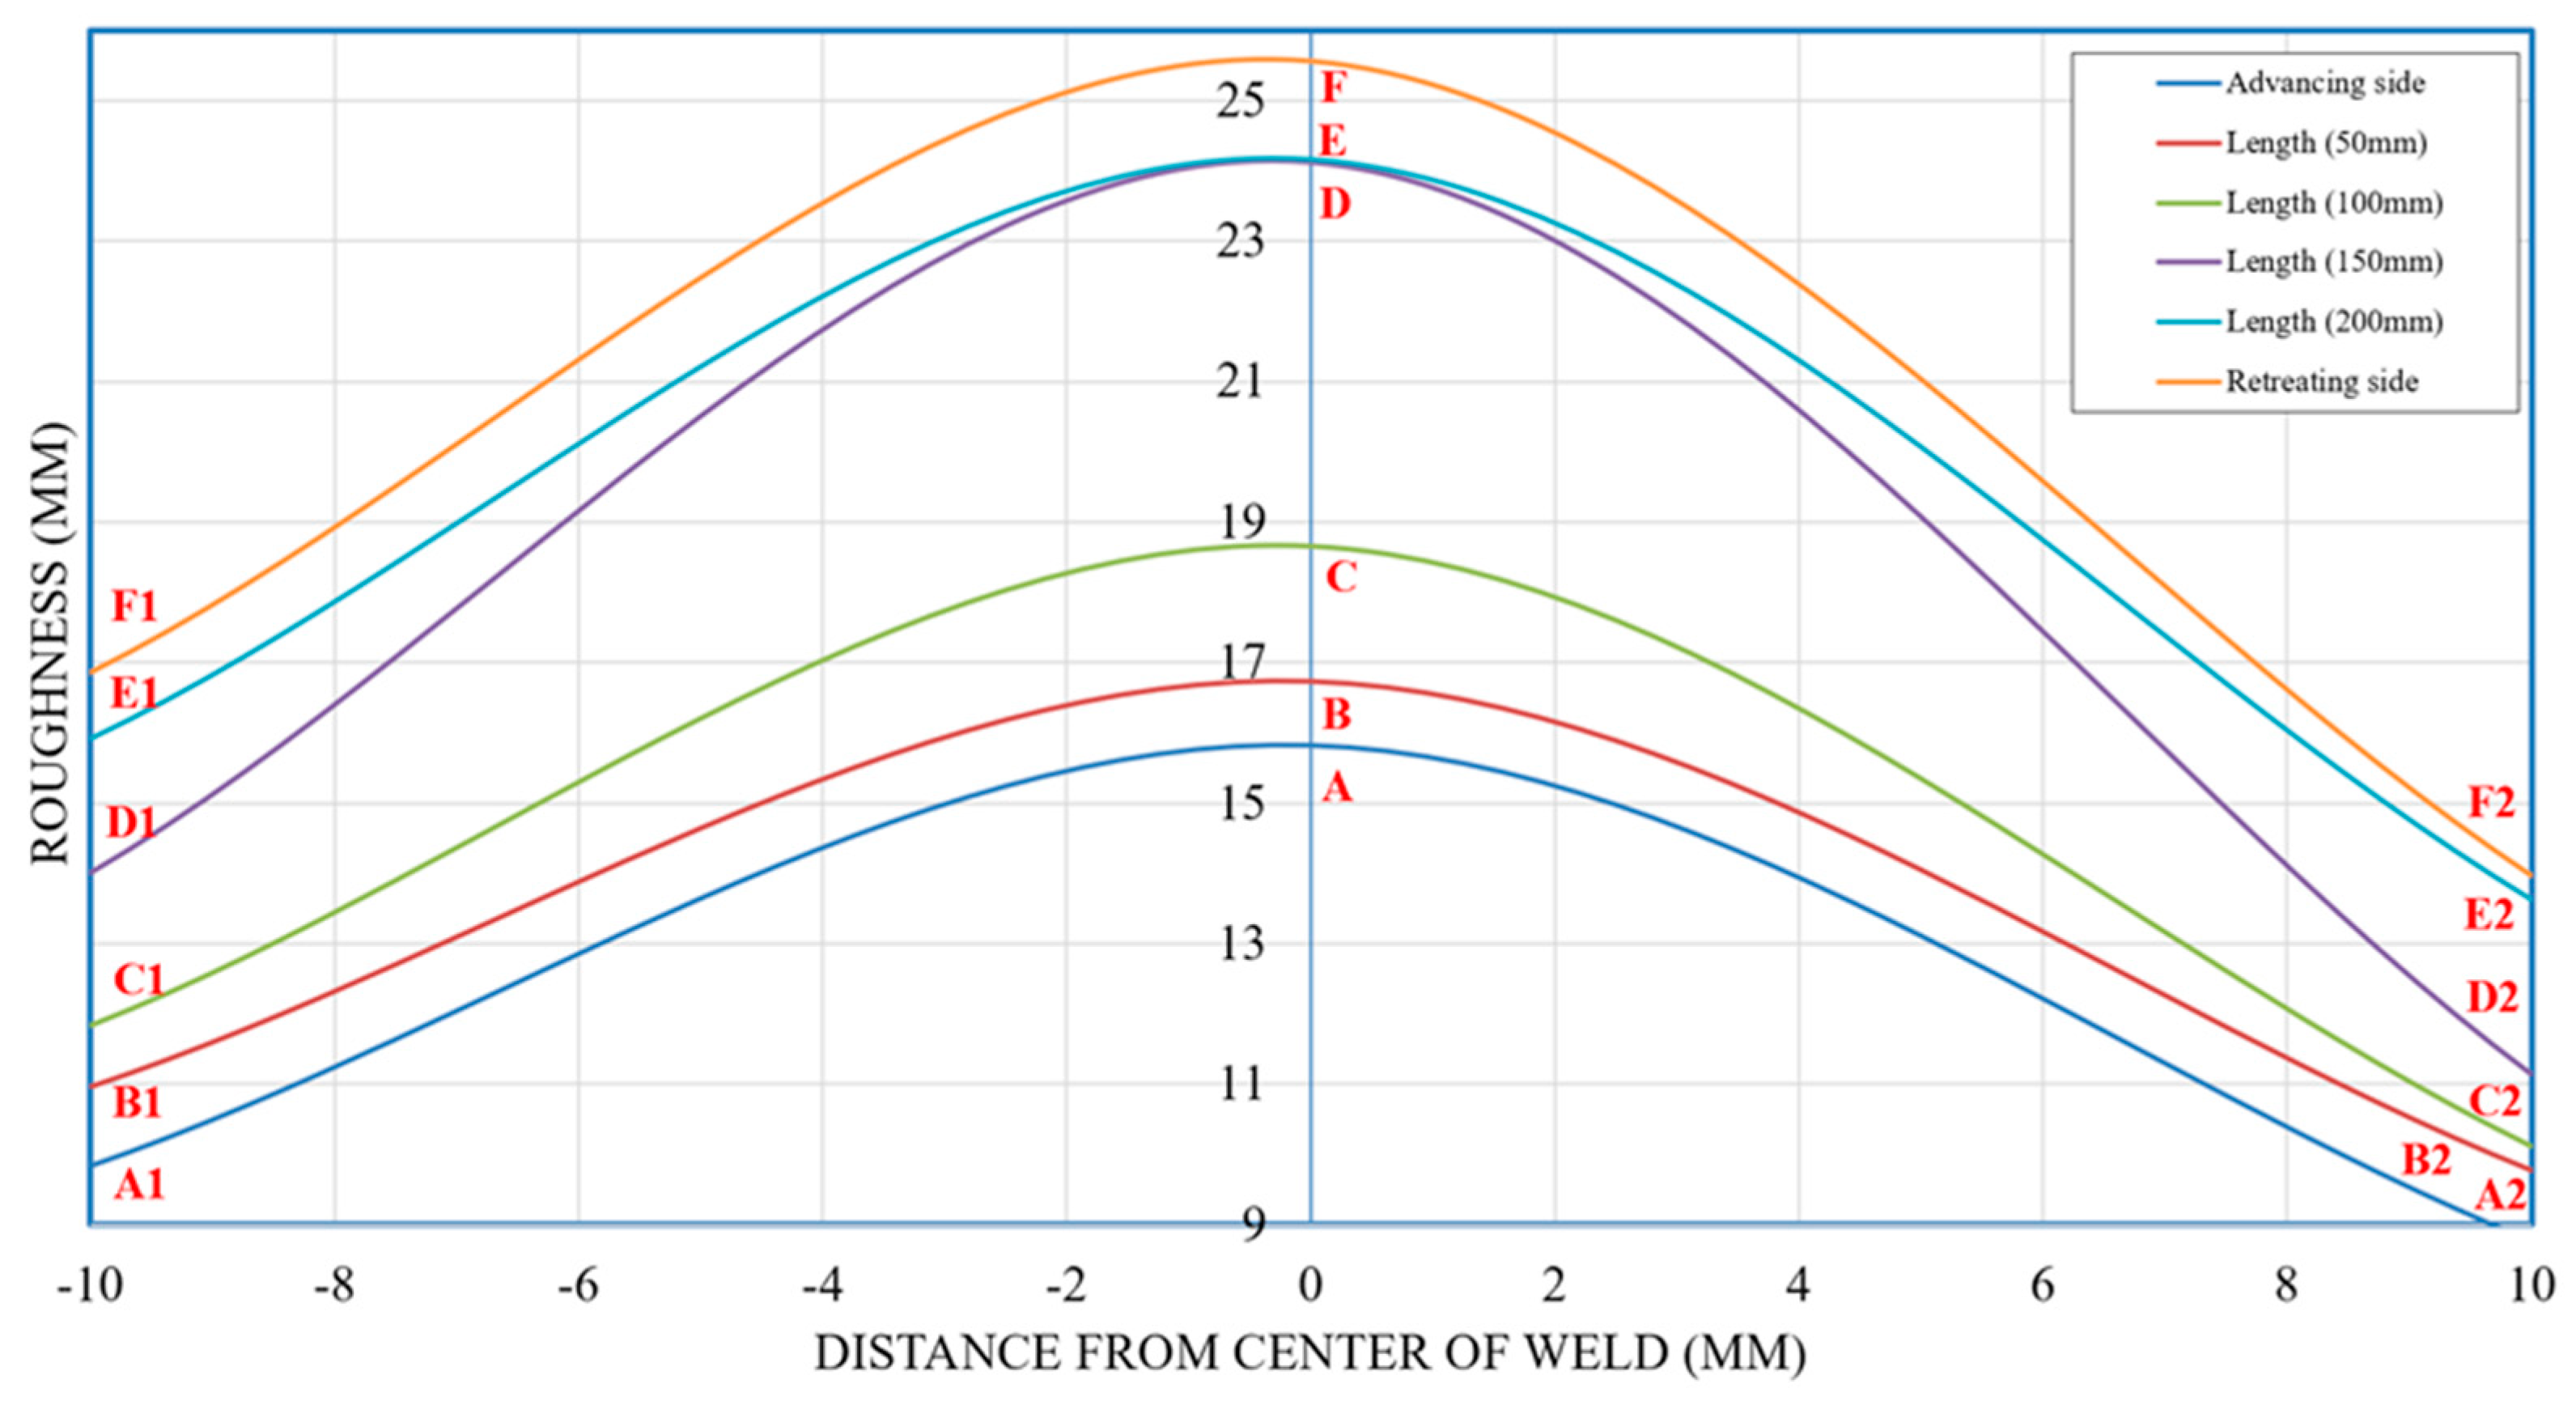
3.3. Surface Roughness Analysis

As a non-destructive test, the image obtained from an optical microscope is of great importance in the surface roughness studies of FSW joints [12,37]. These images can distinguish grooves, scratches, and tool marks that contribute to the rough surface. In addition, they can provide an accurate basis for measuring the surface roughness parameters of Rt (total roughness height), Rz (mean peak-to-valley height), and Ra (average roughness). All these data can be a fundamental basis for controlling the welding parameters to obtain the best performance of the joint, especially when the tests are combined with other supporting tests such as tensile and hardness tests.
In this study, 18 points were examined by optical microscope to determine the surface roughness. Six points were selected along the weld line (A, B, C, D, E, and F) with 50 mm between each point. In addition, 12 corresponding points were selected, six of which were on the right sheet of the weld joint (A1, B1, C1, D1, E1, and F1) and six on the left sheet of the weld joint (A2, B2, D2, E2, and F2).
The macrostructure at the points on the weld line shows that there is inhomogeneity at the beginning of the weld region (see point A) in Figure 5. Then, some scattered gaps appear as we move away (points B, C, and D). These gaps disappear, and the homogeneity of the weld region improves until reaching the end of the weld line (see points E and F). The inhomogeneity at the beginning of the weld can be explained by the tool engaging with the material, causing uneven material flow due to incomplete plastic deformation [38,39]. In addition, the continued transverse movement of the tool and its continued flow into the metal can lead to even a slight oscillation that is sufficient to cause some scattered spots and defects [40]. As the process continues, the metal becomes more weldability due to the increased heat resulting from friction, thus enhancing material plasticity and improving material flow, which contributes to significantly reducing spots and defects.
Figure 6 shows the macrostructure of the six points (A1, B1, C1, D1, E1, and F1) located in the weld joint of the right-side sheet corresponding to the previous points. All the images in this figure were captured under identical imaging conditions and magnification. The key distinction between them lies in their respective positions along the weld line, representing different distances from the start of the welding zone. Inhomogeneity gets worse at point A1, and that spots and other flaws become more common from point B1 until they slowly go away at point C1, where they do not exist anymore except for possible underfilling caused by more heat. The streaks are minimal at this point; they are located in the vicinity of the tool shoulder, where the tool needs to provide both mixing and friction with the material to be welded. These functions quickly degrade the tool as the rotating material experiences friction at the tool/plate interface and mix with the pin, leading to plastic deformation. Therefore, the friction between the tool and the plate in this intermediate zone generates the majority of the heat.
The presence of metal flashes, particularly at D1 and F1, warrants notice [41]. The reason for the presence of these metal flashes may be that the selected points are the ends of the weld region boundaries. Thus, the high rotational speed causes insufficient material flow, which causes protrusions in these areas, causing what are known as metal flashes [42].
Figure 7 illustrates the macrostructure of the final points of the tool’s rotation relative to the left sheet in the welding joint (A2, B2, C2, D2, E2, and F2). The FSW joint exhibits a few minor flaws. Welding flaws are irregularities, discontinuities, blemishes, or inconsistencies in the weld surface of welded pieces [43,44]. Such weld joint defects can lead to part and assembly rejection, costly repairs, significant reductions in performance under operating conditions, and, in the worst-case scenario, catastrophic failures.

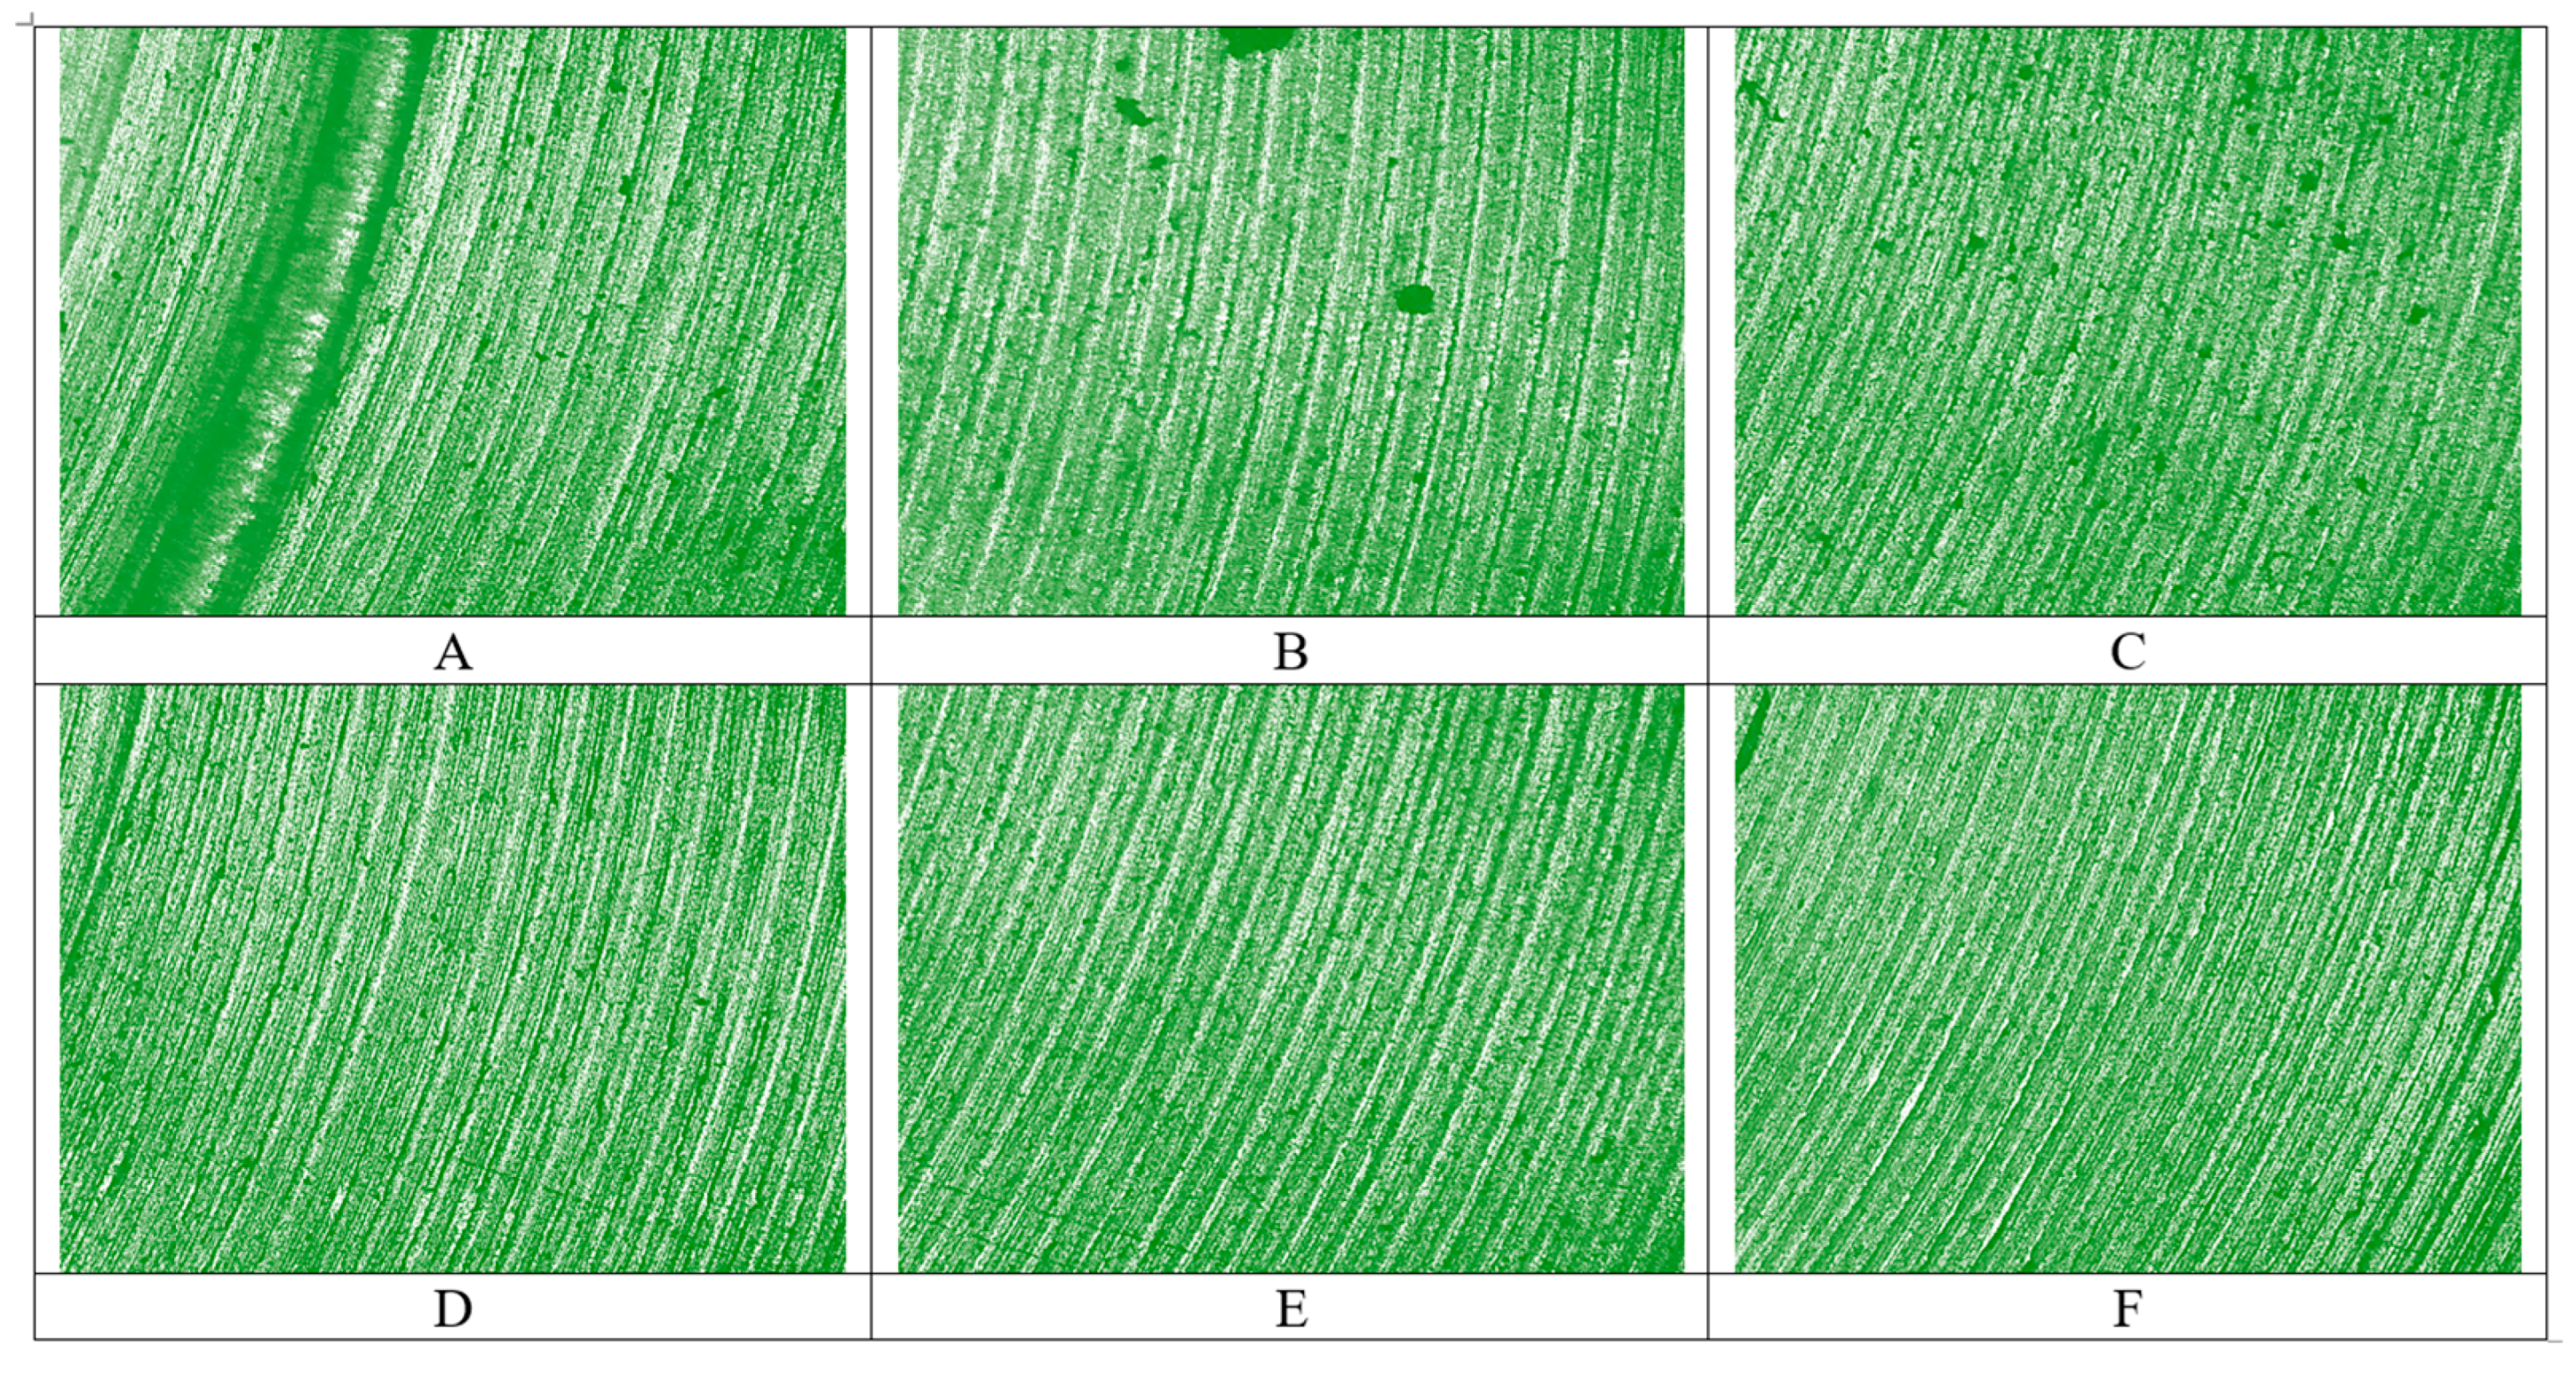
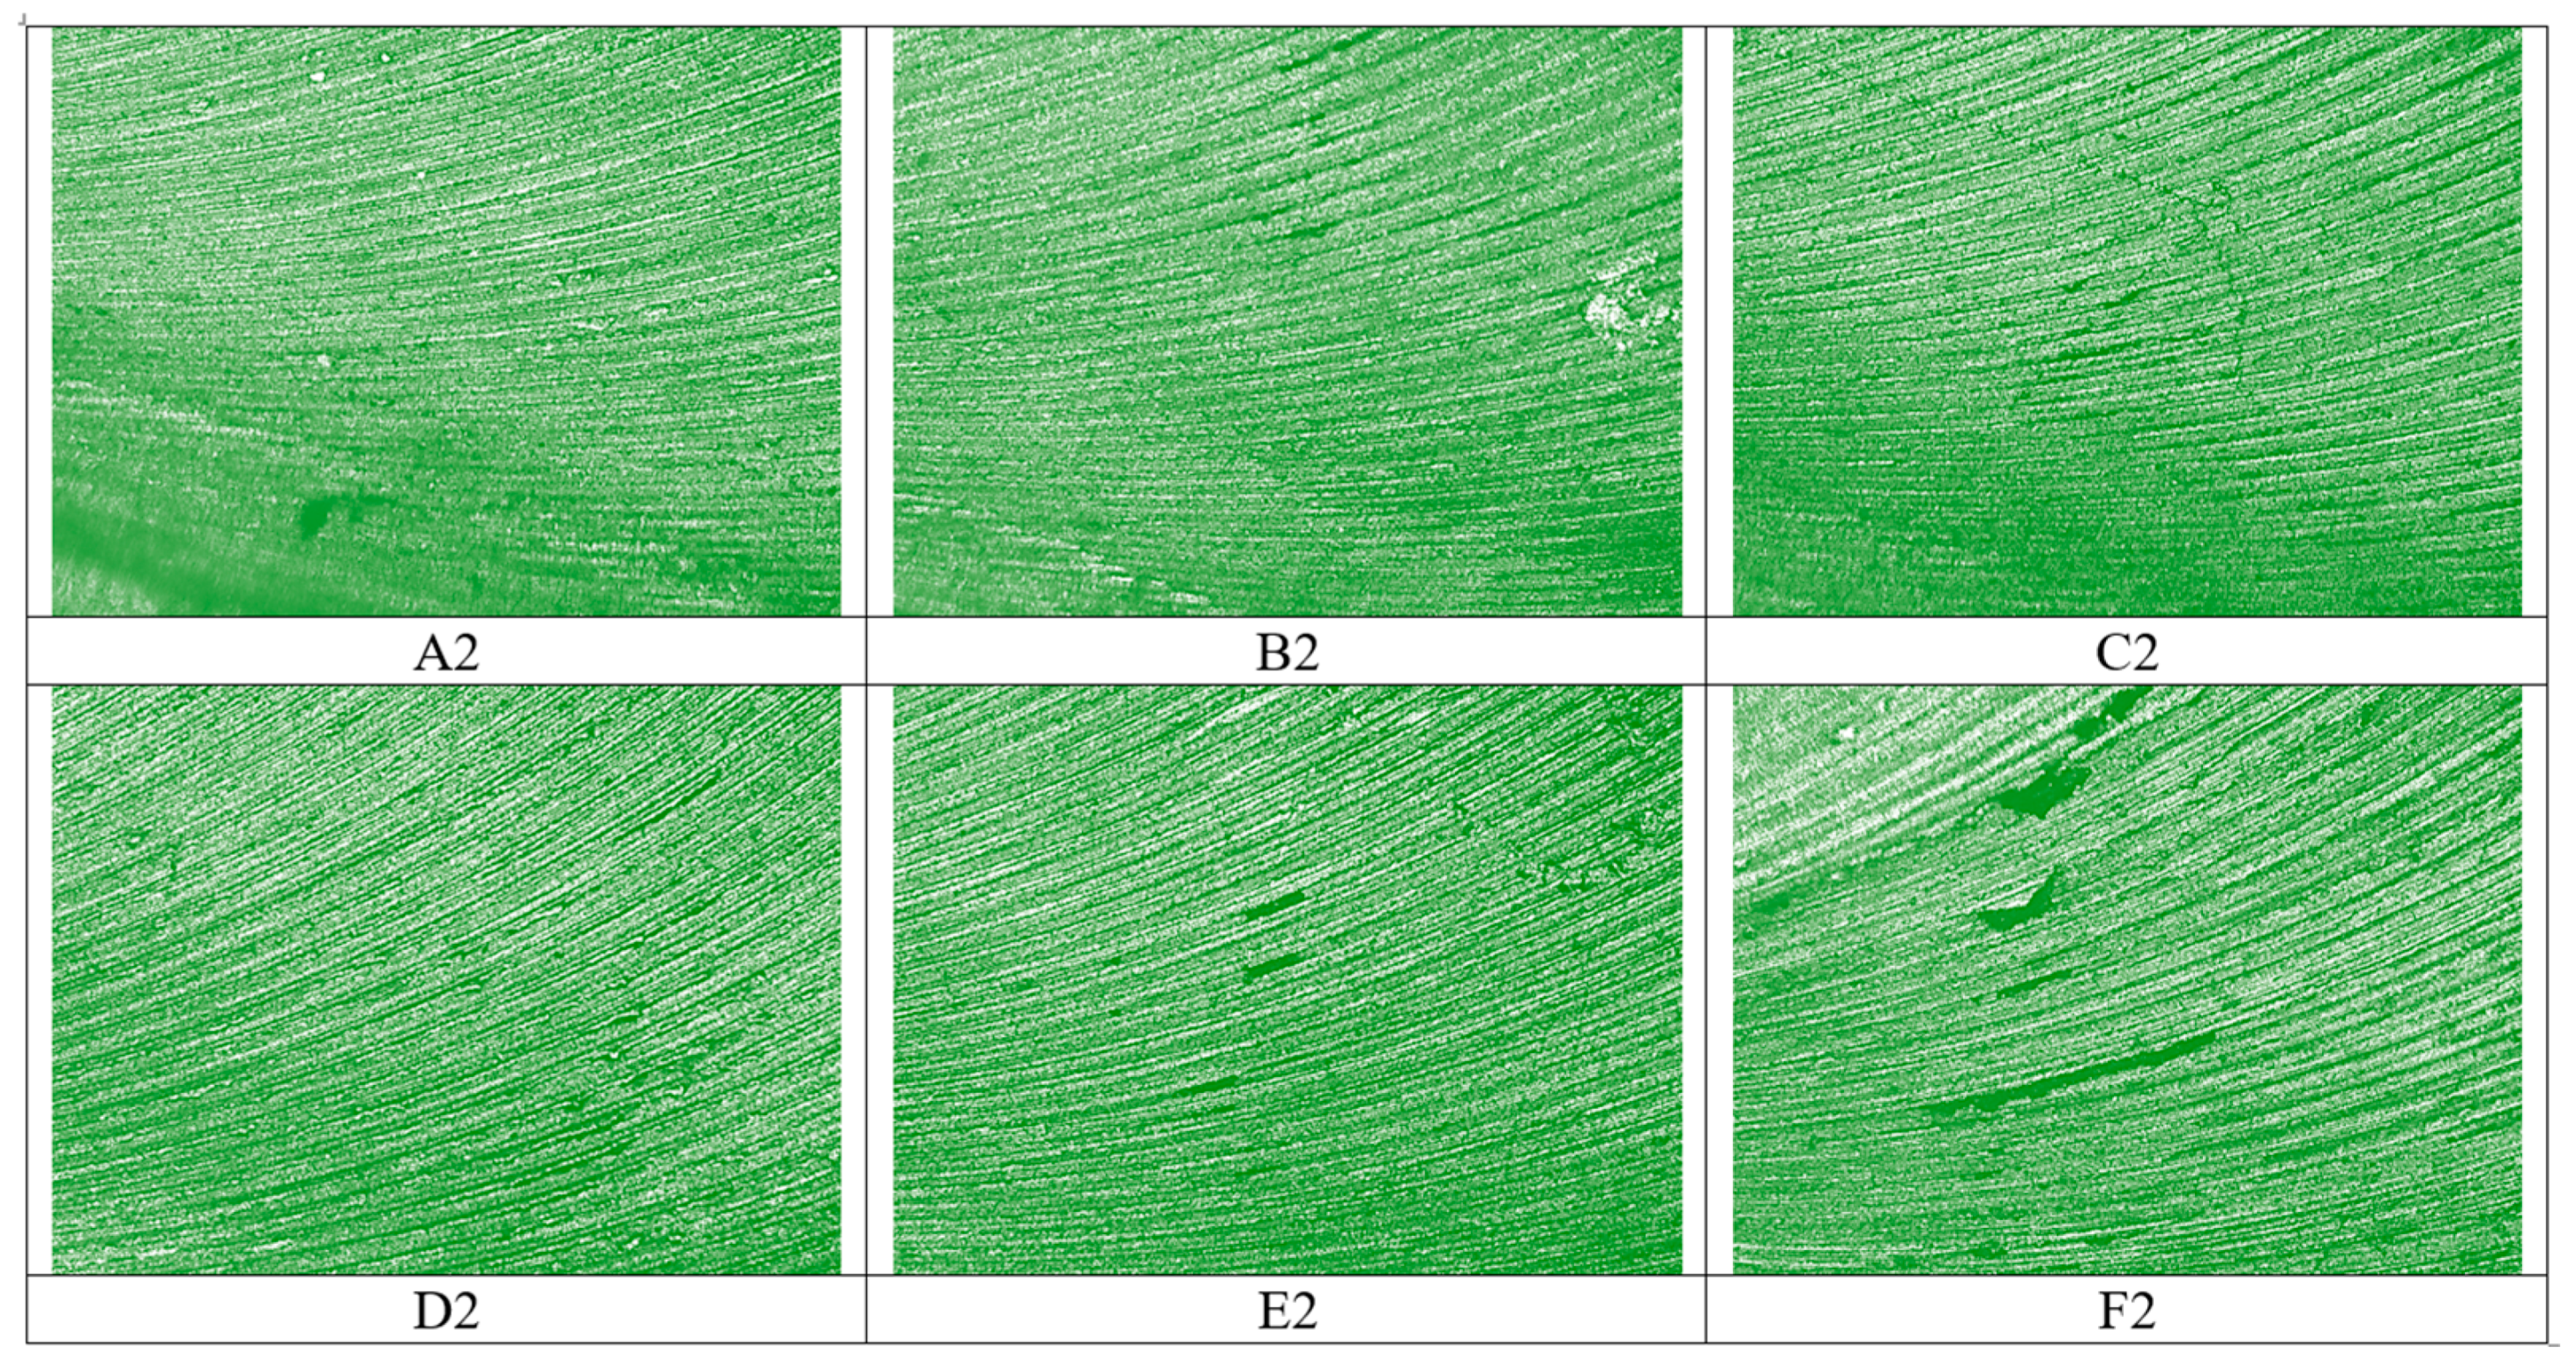
3.4. FSW Surfaces Topography Evaluation

Several methods are used to measure the roughness of surfaces, some of which are contact-based, and others are non-contact-based, and the devices can be portable. For the purpose of measuring average roughness (Rz), arithmetic centers roughness (Ra), and maximum peak-to-valley height (Rt) in the joint welded by FSW, the PCE-RT1200 m based on ISO 3274 [45] was used. The roughness mechanism ensures more reliable measurements by operating the probe at a constant speed and in a horizontal motion, with the option to deviate vertically. The device probe deviates and produces an inductive displacement of the weld joint under test.
The positions of points in this section match those in the previous section. In this study, the shoulder diameter was 20 mm, so the edges of the weld joint can be located 10 mm to the left and right of the weld line and will be referred to as levels −10 and 10, respectively, while the points located in the middle of the weld line will be referred to as level 0. Table 2 indicates values of (Rz), arithmetic centers roughness (Ra), and maximum peak-to-valley height (Rt) in the joint welded by FSW, respectively.
Regarding the roughness (level 0), it can be observed that there is an increasing pattern in the surface roughness of the Ra, Rz, and Rt values from the beginning of the weld at point A to point F. The values of Ra increased from 5.6 μm at point A to 9.04 μm at point F, Rz from 15.83 μm at point A to 25.56 μm at point F, and Rt increased from 15.99 μm at point A to 26.4 μm at point F. It can also be observed that the highest roughness values are often achieved at the ends of the weld near points E and F, which can be attributed to the possibility of some defects or unfilled areas. The inconsistent material flow with the welding progress and the possibility of tool wear can also explain the continuous increase in roughness from the beginning of the weld to its end [46].
The situation was not very different at the corresponding locations 10 m to the left of the weld line (Level −10) as the values continued to increase as we moved away from the beginning of the weld line to its end. However, compared to Level 0, the surface roughness is generally lower, indicating less mechanical disruption. The peak of Ra was achieved at point D, while its value ranged from 3.88 μm to 6.48 μm. Regarding Rz, it ranged from 9.84 μm to 16.87 μm and Rt from 9.94 μm to 17.24 μm. For each Rz and Rt, the peaking was achieved at point F. Peaks at points D, E, and F suggest material flash or irregular material displacement caused by tool stirring [47].
The last roughness inspection was examined at level 10 (10 mm right of the welding line); the Ra ranges from 3.11 μm to 4.12 μm, the Rz ranges from 8.77 μm to 13.98 μm, and the Rt ranges from 9.52 to 14.56, which shows the smoothest surface roughness values compared with level 0 and level −10. The relative decrease in roughness values indicates more positive results because higher smoothness reflects relatively good weld quality, and this can be attributed to the decrease in thermal variation and material flow as one moves away from the center of the weld line.
In the FSW process, the material flow on the advancing side (AS) differs from that on the retreating side (RS). The data show that the AA6061-T6 alloy weld has higher surface roughness values along the whole length of the weld. This is because the tool shoulder penetrates the material, changing the surface and creating ridges in the surface profile along the weld. As shown in Figure 8, the roughness Rz varies from start to finish, ranging between 9.84 μm and 16.87 μm on the RS and 8.77 μm and 13.98 μm on the AS, leveling off slightly toward the end as the heat input stabilizes.

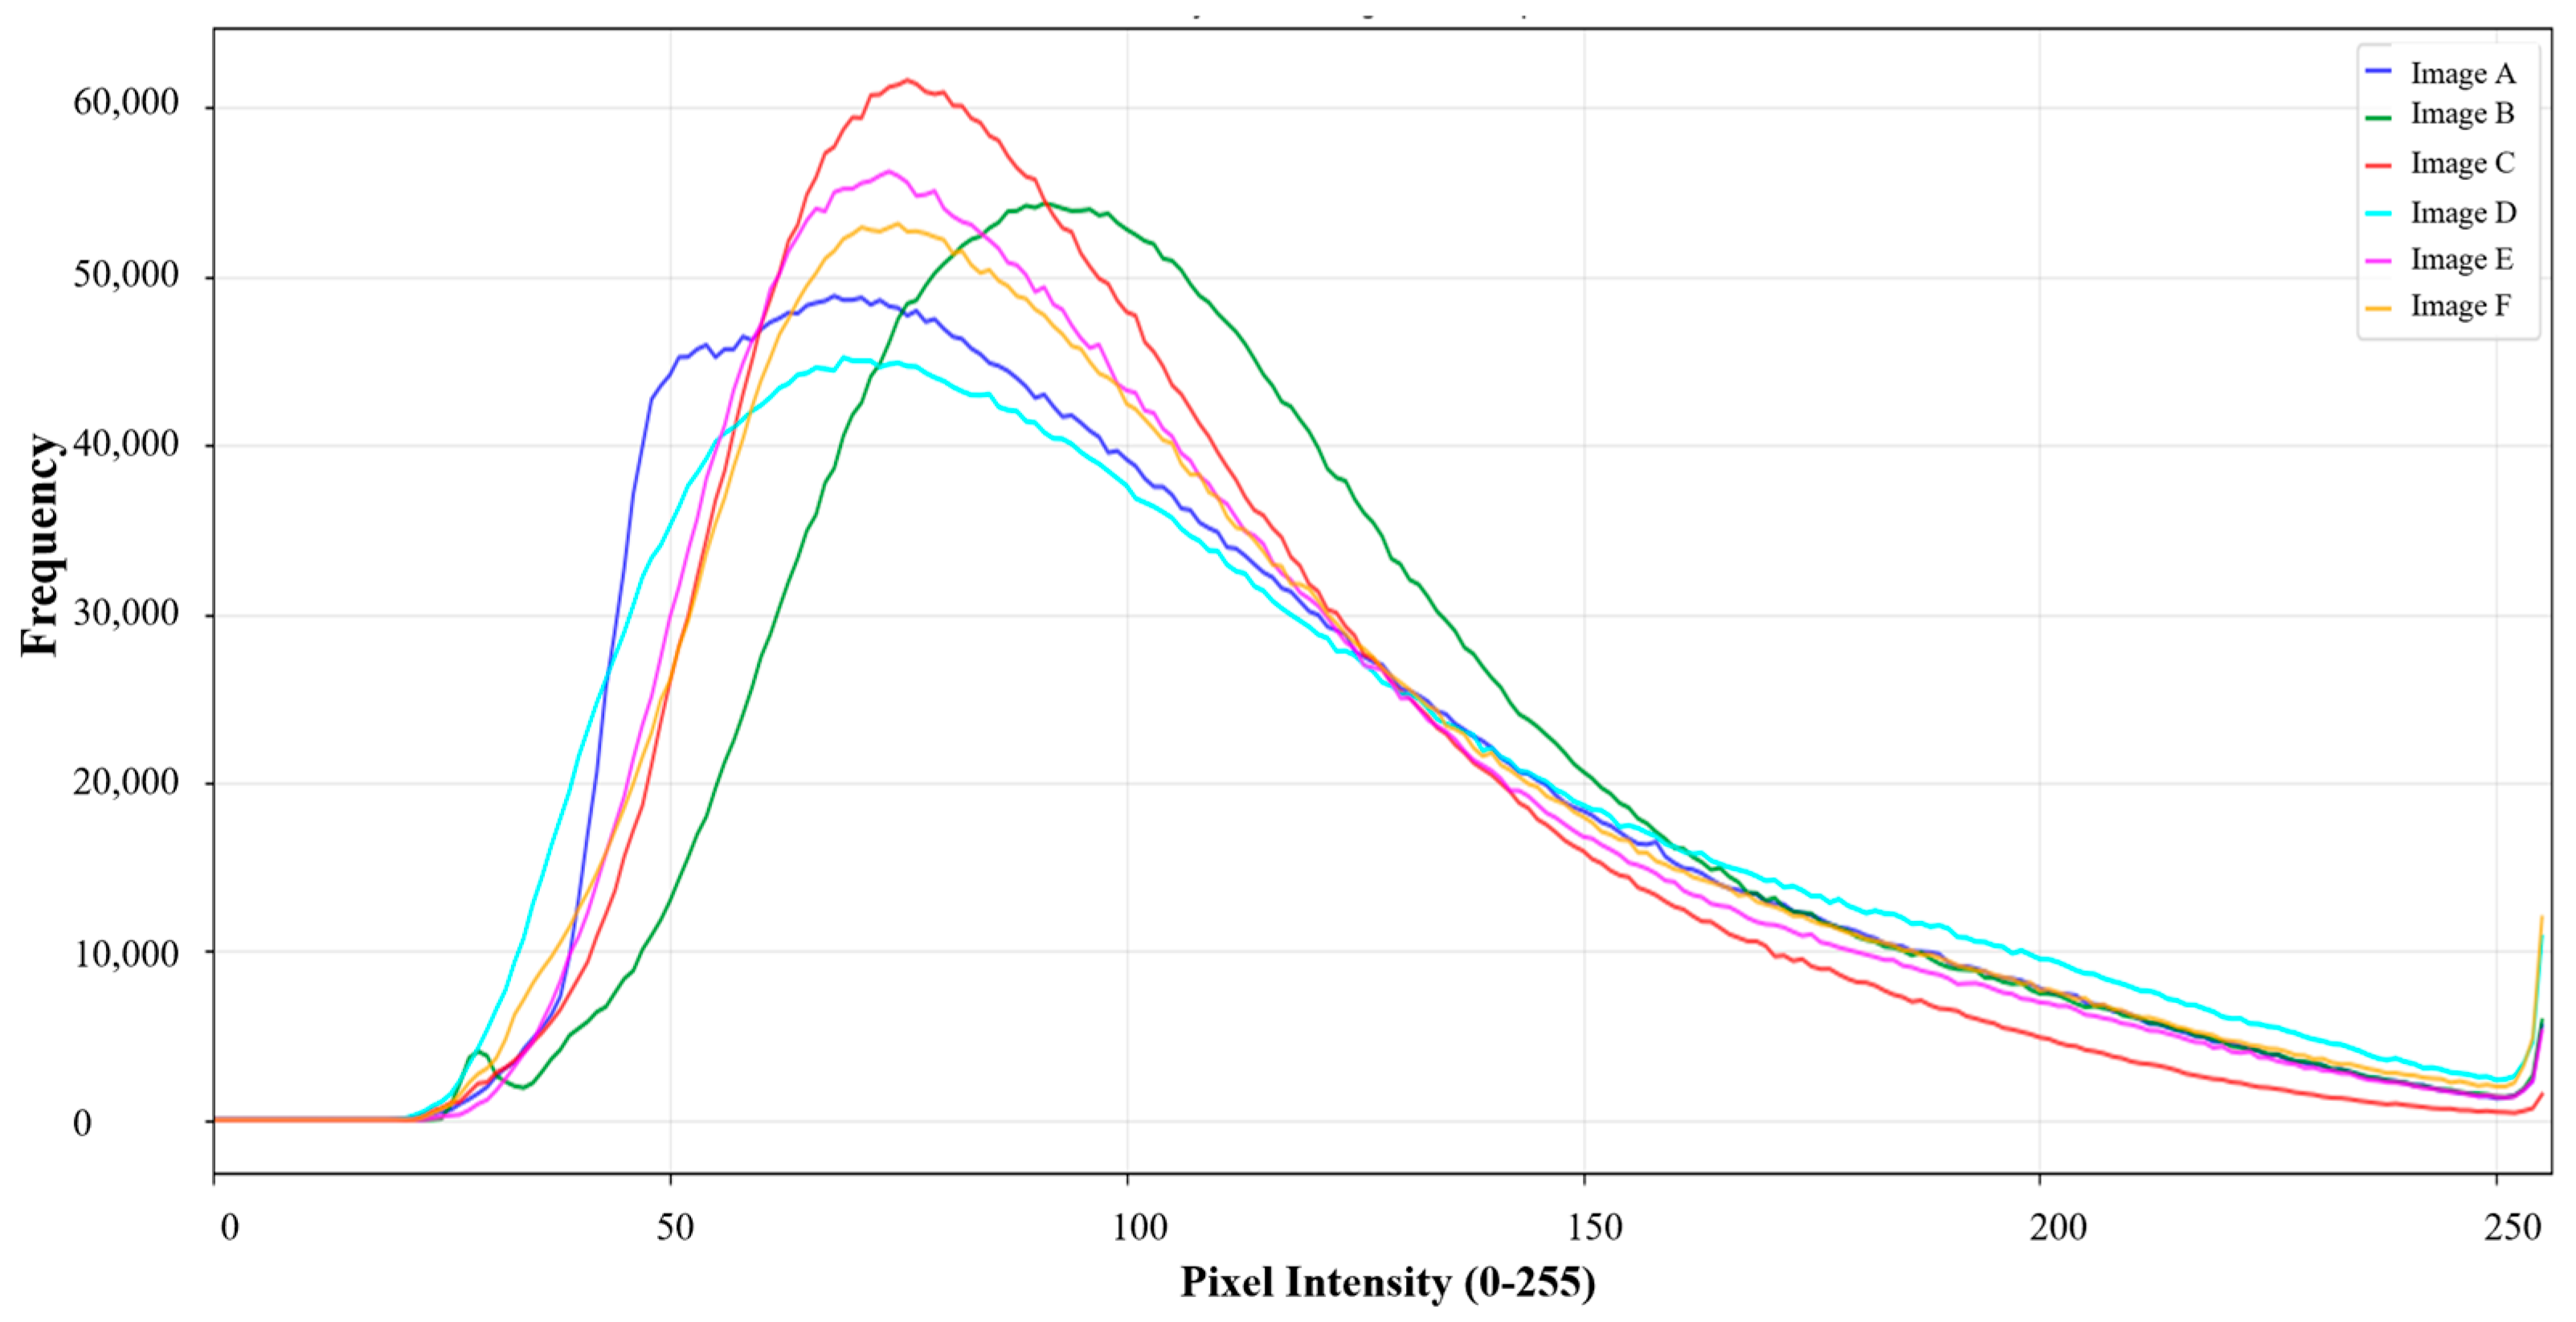
3.5. Weld Joint Image Analysis

The image analysis was performed using Python version 3.10.12 within the Google Colab environment. Adaptive thresholding techniques were applied to extract critical features from the images. Specifically, Gaussian adaptive thresholding was used, which computes the threshold for smaller regions of the image, thereby allowing for more effective segmentation under varying lighting conditions. Before thresholding, all images were converted to grayscale and subjected to Gaussian blurring to reduce noise and enhance edge detection. The histogram-based analysis supported accurate segmentation and identification of key image regions related to defect characterization and feature boundaries.
In structural integrity studies, weld image analysis is a powerful tool [48]. It is classified as a type of non-destructive testing that contributes to assessing weld quality without damaging the workpiece. This section explores the application of adaptive thresholds and histogram analysis to friction stir welding images, aiming to characterize surface properties, assess weld quality, and determine their relationship to surface roughness. The results are analyzed by examining six points along the weld line, separated by 50 mm. After the FSW process was completed, six equidistant points (A, B, C, D, E, and F) were examined using standard optical microscopy. Then, the adaptive thresholding and grayscale histogram were applied to them. Adaptive thresholding is an image processing technique to further visualize and compare the surface features at these points while the grayscale histogram compares them. These images were then qualitatively analyzed for visual characteristics related to surface roughness, such as the presence and prominence of ripples, texture, and any visible irregularities. After that, adaptive thresholding was used on each image to separate the surface features (maybe telling the difference between roughness peaks and valleys).
The roughness was visible in the original images, and the ripples were diagonal at point A. The roughness then began to decrease markedly at point B. It gradually reduced at points C, D, and E, making the surface appear smoother and indicating a clear improvement in the welding process. The increased metal flow, resulting from the increased frictional temperature between the workpiece and itself, explains this improvement [13,37]. Finally, point F indicated a possible slight increase in visual roughness compared to the middle section (C, D, and E), with the ripples again becoming more prominent, although not as pronounced as at point A. This increase can be explained by the fact that the welding process is nearing completion with the keyhole forming [49,50].
To evaluate the quality of welded regions and identify defect patterns, digital image processing techniques were applied. For isolating the welded region, especially under non-uniform lighting, Gaussian adaptive thresholding proved effective. This approach calculates thresholds by considering the weighted sum of nearby pixel values, a technique well suited for highlighting local contrasts and boundaries. These thresholded images then underwent further analysis using grayscale histograms. This step allowed for the classification of how pixel intensities were distributed within the welded zone. Typically, areas with low intensity and inconsistent patterns were linked to porosity, lack of bonding, or voids. In contrast, uniform intensity generally suggested a sound weld. This combination of adaptive thresholding and histogram analysis offered a robust method for differentiating between defect-free and defective regions, contributing to a more quantitative assessment of weld quality.
Adaptive thresholding was applied to segment the peaks and troughs of the surface roughness. However, the results were inconsistent: At point A, a fine, sparse pattern was observed, and it did not effectively capture the prominent ripples observed in the original image. A clear improvement in capturing the prominent ripples and better articulation of the surface roughness was observed at the remaining points. Points C, D, and E exhibited relatively fine, sparse patterns, which can be interpreted as a smoother surface but lacked a clear definition of the ripple structures. For point F, the processed images had a slightly better feature definition and coherence than images C, D, and E. This meant that the surface was rougher, which matched what we saw with our own eyes. Overall, the adaptive thresholding showed changes in surface roughness along the roughest weld seam (point A), then a drop in roughness in the middle (points C, D, and E), and finally, a small rise at the end of the section that was studied (point F). Figure 9 shows the image processing of points (A, B, C, D, E, and F) along the weld line using adaptive thresholding.
A histogram is a graphical representation of the distribution of pixel intensities in an image [51]. When the histograms of different photos are similar, the surface characteristics at those positions are relatively consistent [52]. In contrast, if the histograms show significant variations, it indicates differences in surface texture or features at those positions. Grayscale conversion reduces each pixel’s color information to a single intensity value, ranging from 0 (black) to 255 (white) [47,53]. Figure 10 represents the histograms of the six images (A, B, C, D, E, and F). The X-axis of the image represents the pixel intensity values, while the Y-axis represents the frequency or count of pixels with a particular intensity value.
The histograms of all six images share similar characteristics, indicating a convergence of structural or surface characteristics across the examined weld regions. Peak frequencies for all images range between 4000 and 6500, indicating that the most common pixel intensity values occur within this frequency range, with corresponding pixel intensity values between 50 and 100.
Most of the examined images lacked dark areas along the weld line, as the frequency remained close to zero, from 0 to 50 pixels. Interestingly, as pixel intensity increased, particularly between 50 and 75 pixels, there was a sharp increase in frequency. This sharp increase can be explained by prominent features or regions in images that often fall within this intensity range, possibly related to the thermal or mechanical effects of the welding process on the aluminum [54]. This similarity in behavior reflects that the overall FSW process was satisfactory and that the metal surface texture was encouraging for most of the examined points with varying frequency values. The difference in peak frequency values between 4000 and 6500 can be due to grain boundaries or other microscopic features captured by the optical microscope. Later, when the pixel intensity exceeds 75, there is a much longer, gradual decline from the peak region, covering a pixel intensity range of 75–225, with the frequency eventually approaching zero. This gradual decline indicates a decrease in the brightest areas or features in the images.

4. Conclusions

Friction stir welding has recently received increasing attention, especially in light metals such as aluminum, where this type of welding has become the most widely used. The quality of the FSW joint surface directly influences the quality of the formed FSW joint. The smoother the welded surface, the less likely it is to form cracks and defects. This study adopted an innovative approach to measure surface roughness, first ensuring joint strength through a temperature inspection test before welding and then exploring the mechanical properties of the FSW joint. The roughness of the surface was adopted through eighteen points distributed regularly across three levels. The first level is in the center of the weld line, and the second and third levels are 10 mm away from both sides. The conclusion highlights the following key points:
  • Monitoring the temperature before starting the welding process with a thermal camera can effectively contribute to obtaining a highly efficient weld joint. It was more suitable and effective to wait until the friction temperature reached 450 °C before moving the tool transversely.
  • The macrostructure at the beginning of the weld line exhibits inhomogeneity, followed by the appearance of scattered gaps as we move away. Eventually, the homogeneity of the weld region improves until it reaches the end of the weld line.
  • At the level of −10, the inhomogeneity macrostructure gets worse at the beginning of the welding line, and those spots and other flaws become more pronounced at different positions.
  • From the beginning of the weld point A to point F, the surface roughness of the Ra, Rz, and Rt values shows an increasing pattern in the weld roughness (level 0). The situation remained similar at the corresponding locations 10 m to the left of the weld line (Level −10), with the value continuing to increase as we moved away from the beginning of the weld line to its end.
  • The material flow on the advancing side (AS) is different from that on the retreating side (RS). Moreover, the roughness Rz varies from start to finish, ranging between 9.84 μm and 16.87 μm on the RS and 8.77 μm and 13.98 μm on the AS, leveling off slightly toward the end.
  • Although a direct quantitative correlation was not established, the results indicate that regions exhibiting lower surface roughness also demonstrated higher tensile strength and microhardness. This relationship suggests that smoother weld surfaces may indicate improved material consolidation and microstructural uniformity within the stir zone.
  • Adaptive thresholding image processing and grayscale histogram analysis provided valuable insights into the roughness characteristics of the FSW joint, enhancing the understanding of its microstructural features and consistency along the weld line.

Author Contributions

Conceptualization, H.K. and H.I.K.; methodology, A.B. and R.A.-S.; software, H.K. and H.I.K.; validation, R.A.-S.; formal analysis, H.I.K.; investigation, H.K.; resources, A.B. and H.I.K.; data curation, Z.A.; writing—original draft preparation, A.B. and R.A.-S.; writing—review and editing, A.B. and Z.A.; visualization, Z.A. and R.A.-S.; supervision, R.A.-S.; project administration, R.A.-S. All authors have read and agreed to the published version of the manuscript.

Funding

This research received no external funding.

Data Availability Statement

The data presented in this study are available on request.

Acknowledgments

This work has been conducted within a special research project in the Center of Research in Mechanics (CRM)—Constantine (Algeria). The authors wish to thank the (CRM) for their moral support in carrying out this investigation.

Conflicts of Interest

The authors declare no conflicts of interest.

References

  1. Al-Sabur, R.; Serier, M.; Siddiquee, A.N. Analysis and construction of a pneumatic-powered portable friction stir welding tool for polymer joining. Adv. Mater. Process. Technol. 2023, 10, 1052–1066. [Google Scholar] [CrossRef]
  2. Khalaf, H.I.; Al-Sabur, R. Friction Stir Techniques Exploring Fracture and Fatigue Behavior in Hybrid Composite Joints. In Utilizing Friction Stir Techniques for Composite Hybridization; IGI Global: Hershey, PA, USA, 2024; Chapter 7; pp. 108–134. [Google Scholar] [CrossRef]
  3. Khalaf, H.I.; Al-Sabur, R.; Demiral, M.; Tomków, J.; Łabanowski, J.; Abdullah, M.E.; Derazkola, H.A. The Effects of Pin Profile on HDPE Thermomechanical Phenomena during FSW. Polymers 2022, 14, 4632. [Google Scholar] [CrossRef] [PubMed]
  4. Karmakar, S.; Swarnkar, R.; Pal, S.K. A novel zero tool defect accelerated friction stir thin sheet welding technique for automotive light-weight structural component fabrication with dissimilar material. Mater. Chem. Phys. 2024, 316, 107759. [Google Scholar] [CrossRef]
  5. Zhang, M.; Cao, Z.; Zheng, G.; Zuo, D.; Guo, C.; Wang, Y. Quasi-static tensile failure mechanism analysis of CFRP/Al countersunk electromagnetic riveted joints with different rivet-hole clearances. Eng. Fail. Anal. 2024, 155, 107759. [Google Scholar] [CrossRef]
  6. Singh, V.P.; Kumar, D.; Mahto, R.P.; Kuriachen, B. Microstructural and Mechanical Behavior of Friction-Stir-Welded AA6061-T6 and AZ31 Alloys with Improved Electrochemical Corrosion. J. Mater. Eng. Perform. 2023, 32, 4185–4204. [Google Scholar] [CrossRef]
  7. Kumar, M.; Das, A.; Ballav, R. Influence of the Zn interlayer on the mechanical strength, corrosion and microstructural behavior of friction stir-welded 6061-T6 aluminium alloy and AZ61 magnesium alloy dissimilar joints. Mater. Today Commun. 2023, 35, 105509. [Google Scholar] [CrossRef]
  8. Mogahzy, Y. Friction and surface characteristics of synthetic fibers. In Friction in Textile Materials; Elsevier: Oxford, UK, 2008; pp. 292–328. [Google Scholar] [CrossRef]
  9. Han, C.; Liu, Q.; Cai, Z.; Sun, Q.; Huo, X.; Fan, M.; Li, K.; Pan, J. The effect of microstructure on the fatigue crack growth behavior of Ni-Cr-Mo-V steel weld metal. Int. J. Fatigue 2023, 176, 107859. [Google Scholar] [CrossRef]
  10. Fan, K.; Liu, D.; Liu, Y.; Wu, J.; Shi, H.; Zhang, X.; Zhou, K.; Xiang, J.; Wahab, M.A. Competitive effect of residual stress and surface roughness on the fatigue life of shot peened S42200 steel at room and elevated temperature. Tribol. Int. 2023, 183, 108422. [Google Scholar] [CrossRef]
  11. Das, D.; Bag, S.; Pal, S.; Amin, M.R. A Finite Element Model for the Prediction of Chip Formation and Surface Morphology in Friction Stir Welding Process. J. Manuf. Sci. Eng. Trans. ASME 2022, 144, 041015. [Google Scholar] [CrossRef]
  12. Prabhakar, D.A.P.; Korgal, A.; Shettigar, A.K.; Herbert, M.A.; Chandrashekharappa, M.P.G.; Pimenov, D.Y.; Giasin, K. A Review of Optimization and Measurement Techniques of the Friction Stir Welding (FSW) Process. J. Manuf. Mater. Process. 2023, 7, 181. [Google Scholar] [CrossRef]
  13. Bhushan, R.K.; Sharma, D. Investigation of mechanical properties and surface roughness of friction stir welded AA6061-T651. Int. J. Mech. Mater. Eng. 2020, 15, 7. [Google Scholar] [CrossRef]
  14. Farhang, M.; Farahani, M.; Nazari, M.; Sam-Daliri, O. Experimental Correlation Between Microstructure, Residual Stresses and Mechanical Properties of Friction Stir Welded 2024-T6 Aluminum Alloys. Int. J. Adv. Des. Manuf. Technol. 2022, 15, 1–9. [Google Scholar] [CrossRef]
  15. Chinchanikar, S.; Gharde, S.; Gadge, M. Investigation of tool forces, weld bead micro-hardness and surface roughness during friction stir welding of Aluminium 6063 alloy. Adv. Mater. Process. Technol. 2022, 8 (Suppl. 1), 231–239. [Google Scholar] [CrossRef]
  16. Budin, S.; Hyie, K.M.; Maideen, N.C. The influence of rotational speed on welding strength and surface roughness of friction stir welded copper. J. Tribol. 2022, 32, 69–78. [Google Scholar]
  17. Gaikwad, V.S.; Chinchanikar, S. Investigation on surface roughness, ultimate tensile strength, and microhardness of friction stir welded AA7075-T651 joint. Mater. Today Proc. 2021, 46, 8061–8065. [Google Scholar] [CrossRef]
  18. Abdullah, I.; Mohammed, S.S.; Abdallah, S.A. Artificial neural network modelling of the surface roughness of friction stir welded AA7020-T6 aluminum alloy. Eng. Res. J. Shoubra Fac. Eng. 2020, 46, 1–5. [Google Scholar] [CrossRef]
  19. Osman, M.H.; Tamin, N. Influence of tool pin profile on the mechanical strength and surface roughness of AA6061-T6 overlap joint friction stir welding. J. Mech. Eng. Sci. 2023, 17, 9576–9585. [Google Scholar] [CrossRef]
  20. EL-Ghazawi, F.; Abdelhakeem, A.; Mohammed, S.; Mahmoud, T. Experimental study on the effect of tool rotational speed and welding speed on surface quality of FSW AA6063-O aluminum alloy. Eng. Res. J. 2021, 47, 57–65. [Google Scholar] [CrossRef]
  21. Hassan, K.S.; Abbass, M.K.; Mohammed, M.T. Effect of surface finishing on microstructure and corrosion behavior of friction stir welded joints for dissimilar aluminum alloys (AA2024-T3 with AA6061-T6). IOP Conf. Ser. Mater. Sci. Eng. 2021, 1105, 012047. [Google Scholar] [CrossRef]
  22. Eisa, A.; Mabrouk, O. Influence of process parameters of friction stir welding (FSW) on the mechanical properties and the surface quality of welded joint. ERJ Eng. Res. J. 2022, 45, 51–64. [Google Scholar] [CrossRef]
  23. Kumar, S.; Sethi, D.; Choudhury, S.; Das, R.; Saha, S.C.; Roy, B.S. Effect of tool pin profiles on surface roughness of friction stir welded 2050-T84 Al-Cu-Li alloys. J. Mines Met. Fuels 2022, 70, 108–113. [Google Scholar] [CrossRef]
  24. Belaziz, A.; Bouamama, M.; Zahaf, S. Experimental study of the influence of the surface roughness on the friction stir welding of FSW joints. Mater. Proc. 2022, 8, 9. [Google Scholar] [CrossRef]
  25. EN ISO 6892-1:2019; Metallic Materials—Tensile Testing—Part 1: Method of Test at Room Temperature. BSI: London, UK, 2019.
  26. Jassim, R.J.; Lieth, H.M.; Al-Sabur, R.; Alsahlani, A. Influence of welding parameters on optimization of the tensile strength and peak temperature in AISI 1020 alloy joints welded by SAW. AIP Conf. Proc. 2022, 2660, 020042. [Google Scholar] [CrossRef]
  27. Aydin, M. Effects of welding parameters and pre-heating on the friction stir welding of UHMW-polyethylene. Polym. Plast. Technol. Eng. 2010, 49, 595–601. [Google Scholar] [CrossRef]
  28. Kumar, R.; Kumar, M.; Trivedi, V.; Bhatnagar, R. Evaluation of mechanical and microstructural properties of cast iron with effect of pre heat and post weld heat treatment. Int. J. Mech. Eng. 2017, 4, 1–6. [Google Scholar] [CrossRef]
  29. Kermanidis, A.T.; Tzamtzis, A. An experimental approach for estimating the effect of heat affected zone (HAZ) microstructural gradient on fatigue crack growth rate in aluminum alloy FSW. Mater. Sci. Eng. A 2017, 691, 110–120. [Google Scholar] [CrossRef]
  30. Zhang, H.; Wang, Z.; Xue, P.; Li, J.; Wang, W.; Ni, D.; Liu, F.; Xiao, B.; Ma, Z. Eliminating heat-affected zone of nuclear heat-resistant steel joint via low-temperature friction stir welding. Mater. Sci. Eng. A 2024, 916, 147340. [Google Scholar] [CrossRef]
  31. Abnar, B.; Gashtiazar, S.; Javidani, M. Friction Stir Welding of Non-Heat Treatable Al Alloys: Challenges and Improvements Opportunities. Crystals 2023, 13, 576. [Google Scholar] [CrossRef]
  32. Khalaf, H.I.; Al-Sabur, R.; Abdullah, M.E.; Kubit, A.; Derazkola, H.A. Effects of Underwater Friction Stir Welding Heat Generation on Residual Stress of AA6068-T6 Aluminum Alloy. Materials 2022, 15, 2223. [Google Scholar] [CrossRef]
  33. ISO 6507-1; Metallic Materials—Vickers Hardness Test. International Standard ISO: Geneva, Switzerland, 2018; Volume 2018.
  34. Uday, M.B.; Ahmad-Fauzi, M.N.; Noor, A.M.; Rajoo, S. An insight into microstructural evolution during plastic deformation in AA6061 alloy after friction welding with alumina-YSZ composite. Mech. Mater. 2015, 91, 50–63. [Google Scholar] [CrossRef]
  35. Yang, Q.; Mironov, S.; Sato, Y.S.; Okamoto, K. Material flow during friction stir spot welding. Mater. Sci. Eng. A 2010, 527, 4389–4398. [Google Scholar] [CrossRef]
  36. Buffa, G.; Ducato, A.; Fratini, L. FEM based prediction of phase transformations during friction stir welding of Ti6Al4V titanium alloy. Mater. Sci. Eng. A 2013, 581, 56–65. [Google Scholar] [CrossRef]
  37. Belaziz, A.; Bouamama, M.; Elmeguenni, I.; Zahaf, S. Experimental study of the roughness variation of friction stir welding FSW. Mater. Phys. Mech. 2023, 51, 115–125. [Google Scholar] [CrossRef]
  38. Gao, Y.; Liu, H.; Du, S.; Zhang, Q.; Li, D.; Zuo, Y.; Li, X. Inhomogeneity of microstructure evolution in stir zone of 2195Al thick-plate FSW joints. Mater. Sci. Eng. A 2024, 896, 146265. [Google Scholar] [CrossRef]
  39. Wahab, M.A.; Dewan, M.W.; Huggett, D.J.; Okeil, A.M.; Liao, T.W.; Nunes, A.C. Challenges in the detection of weld-defects in friction-stir-welding (FSW). Adv. Mater. Process. Technol. 2019, 5, 258–278. [Google Scholar] [CrossRef]
  40. Patel, M.M.; Badheka, V.J. A review on friction stir welding (FSW) process for dissimilar aluminium to steel metal systems. Mater. Manuf. Process. 2024, 38, 91–115. [Google Scholar] [CrossRef]
  41. Jassim, A.K.; Al-Subar, R.K. Studying the Possibility to Weld AA1100 Aluminum Alloy by Friction Stir Spot Welding. Int. J. Mater. Metall. Eng. 2017, 11, 10008041. [Google Scholar]
  42. Marazani, T.; Jeje, S.O.; Shongwe, M.B.; Malatji, N. Mass flash reduction strategies in friction stir processing of aluminum alloys: A review. Eng. Rep. 2024, 6, e12981. [Google Scholar] [CrossRef]
  43. Ferreira, A.C.; Campanelli, L.C.; Suhuddin, U.F.H.; de Alcântara, N.G.; dos Santos, J.F. Investigation of internal defects and premature fracture of dissimilar refill friction stir spot welds of AA5754 and AA6061. Int. J. Adv. Manuf. Technol. 2020, 106, 3523–3531. [Google Scholar] [CrossRef]
  44. Belalia, S.E.; Serier, M.; Al-Sabur, R. Parametric Analysis for Torque Prediction in Friction Stir Welding Using Machine Learning and Shapley Additive Explanations. J. Comput. Appl. Mech. 2024, 55, 113–124. [Google Scholar] [CrossRef]
  45. ISO 3274; Geometrical Product Specifications (GPS)—Surface Texture: Profile Method—Nominal Characteristics of Contact (Stylus) Instruments. International Standard ISO: Geneva, Switzerland, 2018; Volume 2018.
  46. Alkhafaji, A.; Camas, D.; Lopez-Crespo, P.; Al-Asadi, H. The Influence of Tool Geometry on the Mechanical Properties and the Microstructure of AA6061-T6 Aluminum Alloy Friction Stir Spot Welding. Materials 2023, 16, 4135. [Google Scholar] [CrossRef] [PubMed]
  47. Bahedh, A.S.; Mishra, A.; Al-Sabur, R.; Jassim, A.K. Machine learning algorithms for prediction of penetration depth and geometrical analysis of weld in friction stir spot welding process. Metall. Res. Technol. 2022, 119, 305. [Google Scholar] [CrossRef]
  48. Dong, S.; Sun, X.; Xie, S.; Wang, M. Automatic defect identification technology of digital image of pipeline weld. Nat. Gas Ind. B 2019, 6, 399–403. [Google Scholar] [CrossRef]
  49. Hossfeld, M. Shoulderless friction stir welding: A low-force solid state keyhole joining technique for deep welding of labile structures. Prod. Eng. 2022, 16, 389–399. [Google Scholar] [CrossRef]
  50. Tamadon, A.; Baghestani, A.; Bajgholi, M.E. Influence of WC-Based Pin Tool Profile on Microstructure and Mechanical Properties of AA1100 FSW Welds. Technologies 2020, 8, 34. [Google Scholar] [CrossRef]
  51. Burger, W.; Burge, M.J. Histograms and Image Statistics; Springer International Publishing: Cham, Switzerland, 2022. [Google Scholar] [CrossRef]
  52. Vetrivel, A.; Gerke, M.; Kerle, N.; Vosselman, G. Identification of damage in buildings based on gaps in 3D point clouds from very high resolution oblique airborne images. ISPRS J. Photogramm. Remote Sens. 2015, 105, 61–78. [Google Scholar] [CrossRef]
  53. Sen Gupta, S.; Kwon, T.H.; Kim, K.D. Color Based Image Processing Techniques to Detect Oxide Film During Welding. In Proceedings of the International Conference on Electronics, Information, and Communication (ICEIC), Barcelona, Spain, 19–22 January 2020. [Google Scholar] [CrossRef]
  54. Ranjan, R.; Khan, A.R.; Parikh, C.; Jain, R.; Mahto, R.P.; Pal, S.; Pal, S.K.; Chakravarty, D. Classification and identification of surface defects in friction stir welding: An image processing approach. J. Manuf. Process. 2016, 22, 237–253. [Google Scholar] [CrossRef]
Figure 1. (a) FSW scheme with thermal camera. (b) Universal milling machine as FSW machine.
Jmmp 09 00159 g001
Figure 2. (a) Tensile machine and (b) tensile specimen preparation according to ISO 6892-1.
Jmmp 09 00159 g002
Figure 3. Temperature distribution along welding line at the beginning of the FSW process.
Jmmp 09 00159 g003
Figure 4. Microhardness profile through an FSW joint.
Jmmp 09 00159 g004
Figure 5. Macrostructure analysis for welding joints of FSW along the welding line points.
Jmmp 09 00159 g005
Figure 6. Macrostructure analysis for welding joints of FSW along the welding line points (right sheet).
Jmmp 09 00159 g006
Figure 7. Macrostructure analysis for welding joints of FSW along the welding line points (left sheet).
Jmmp 09 00159 g007
Figure 8. Roughness distribution along the FSW region.
Jmmp 09 00159 g008
Figure 9. Adaptive thresholding image processing along the weld line of the FSW joint (a) at point A, (b) at point B, (c) at point C, (d) at point D, (e) at point E, and (f) at point F.
Jmmp 09 00159 g009
Figure 10. Grayscale histograms comparison along the FSW region.
Jmmp 09 00159 g010
Table 1. Principal mechanical characteristics of the base material (MB) and welded FSW.
MaterialYield Force (kN)Max Force (KN)Elongation (mm)
Base material2.8303.2485.51
Welded FSW1.8012.7593.50
Table 2. Topography parameters Rz, Ra, and Rt at different positions.
ParameterLevelABCDEF
Rz (μm)−103.883.845.36.484.824.83
05.65.926.68.488.549.04
103.113.573.463.944.044.12
Ra (μm)−109.8410.9711.8414.0115.9216.87
015.8316.7418.6624.1224.1625.56
108.779.7810.1211.1413.6313.98
Rt (μm)−109.9411.0812.7214.2415.1217.24
015.9916.918.8525.4425.8126.4
109.529.8810.3611.2513.7314.56
Disclaimer/Publisher’s Note: The statements, opinions and data contained in all publications are solely those of the individual author(s) and contributor(s) and not of MDPI and/or the editor(s). MDPI and/or the editor(s) disclaim responsibility for any injury to people or property resulting from any ideas, methods, instructions or products referred to in the content.

