Abstract
Low-carbon steels, such as ER70S-6, are typically considered resistant to phase transformations due to their high critical cooling rate. However, this study investigates how the manufacturing process and specimen geometry influence heat dissipation, potentially leading to localized grain size variations that impact mechanical properties. To analyze these effects, samples were fabricated using Laser Wire-Feed Additive Manufacturing (LWAM) with different geometries, and their hardness and microstructural characteristics were evaluated. Vickers microhardness tests were performed along the specimens to assess local variations, while dilatometry measurements were conducted to determine thermal expansion coefficients for future integration into finite element models (FEMs) of residual stress distribution. The results reveal that differences in heat dissipation during fabrication lead to grain size heterogeneity, affecting hardness at a microscopic scale and overall mechanical performance. These findings highlight the importance of considering thermal history and geometry in LWAM-fabricated components to ensure consistent material properties.
1. Introduction
Additive Manufacturing (AM), commonly referred to as 3D printing or rapid prototyping, is a technique for fabricating physical objects by sequentially adding layers of material. Initially, AM was primarily used to create visual prototypes during product development. However, advancements in material science have enabled the production of durable and precise components using AM, with minimal material waste compared to traditional subtractive manufacturing methods [1].
AM has found applications across diverse industries, including automotive, aerospace, medical, dental, and fashion. According to the American Society for Testing and Materials (ASTM), AM encompasses seven main process categories, though only a subset is applicable to metals [2]. Metal Additive Manufacturing (MAM) can be broadly classified into two major categories: Powder Bed Fusion (PBF) processes, which employ thermal energy to selectively fuse metal powders, and Direct Energy Deposition (DED) processes, which use thermal energy to melt and deposit material to build parts [2,3].
The DED category includes five key processes: Direct Metal Deposition (DMD), Laser Engineered Net Shaping (LENS), Laser Metal Deposition (LMD), Wire Arc Additive Manufacturing (WAAM), and Laser Wire-Feed Additive Manufacturing (LWAM) [4]. Each offers unique advantages for fabricating metallic components. In this paper, Laser Wire-Feed Metal Additive Manufacturing (LWAM), also referred to as Laser Metal Deposition with Wire, employs one or more laser beams to melt a metallic wire and deposit it onto a substrate. In this process, the material—typically a metal alloy—is continuously fed into the focal point of the laser beam [5]. The intense heat from the laser melts the wire, creating a molten pool at the interface between the wire and the substrate [6,7], as depicted in Figure 1. This continuous material feed enables precise and controlled deposition onto the target surface.
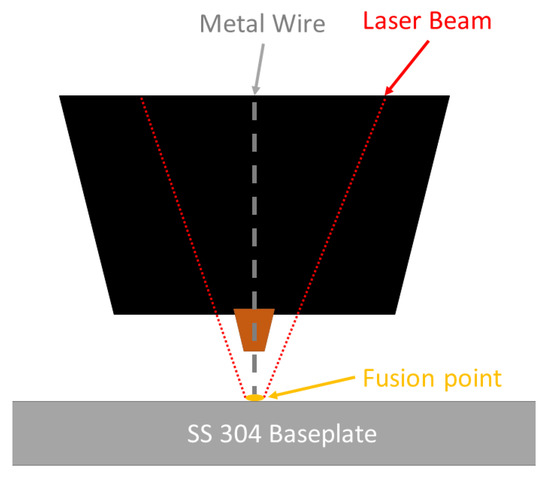
Figure 1.
Schematic representation of the Laser Wire-Feed Additive Manufacturing (LWAM) process, illustrating the continuous feeding of metallic wire into the focal point of the laser beam and the formation of a molten pool at the interface with the substrate.
Laser Wire Additive Manufacturing (LWAM) technology offers significant advantages from an industrial perspective, primarily due to its relatively low equipment and material costs compared to other additive manufacturing methods. One of its key benefits is the use of metallic wire instead of powder, which simplifies industrial operations by minimizing the risk of explosion. Furthermore, the flexibility of this technology allows it to be implemented with closed systems or extended to robotic arms, effectively removing the limitations of a fixed working bed. This adaptability, combined with the ease of switching between feedstock materials, makes LWAM particularly well-suited for the fabrication of gradient materials.
Despite these advantages, the LWAM process introduces structural complexities due to the high thermal gradients inherent to its operation. These gradients, which can be influenced by parameters such as scanning speed, laser power, and deposition path strategies, play a crucial role in determining the final microstructure and mechanical properties of the deposited material. Therefore, it is essential to conduct detailed studies on the behavior of materials under specific working conditions. Establishing clear relationships between processing parameters and the resulting properties is critical for optimizing LWAM processes, enabling the tailored fabrication of materials with predictable and desirable characteristics.
Low-carbon steels are widely utilized across various industrial sectors due to their favorable mechanical properties, cost efficiency, and versatility. These materials are particularly essential in the automotive and construction industries, where they account for approximately 55% of a vehicle’s total weight [8].
In recent years, Wire Arc Additive Manufacturing (WAAM) technology has been increasingly employed to fabricate lightweight components using low-carbon steels for industrial applications [9,10]. Haden et al. demonstrated that low-carbon steel (ER70S) manufactured using WAAM exhibits mechanical properties comparable to those obtained through conventional, non-additive manufacturing techniques [11]. In contrast, other researchers highlighted the influence of key parameters, such as build direction, heat flow, and deposition path, on microstructure evolution [12,13].
Despite the growing body of research on WAAM, no studies have specifically examined the application of Laser Wire Additive Manufacturing (LWAM) to low-carbon steels or its influence on mechanical properties. Understanding this relationship is crucial for the industrial adoption of LWAM in manufacturing components from these alloys.
In LWAM, ER70S-6 low-carbon steel is commonly used due to its established application in welding and its good processability. Traditionally, studies have focused on the influence of process parameters, often assuming that the effects of thermal history and build orientation are secondary. However, these factors are inherently present in additive manufacturing processes and can significantly affect the resulting microstructure and mechanical properties. This study emphasizes the importance of fabrication orientation and thermal cycling, demonstrating that, even under fixed process parameters, variations in thermal history lead to measurable differences in grain size, hardness, and tensile properties. The results establish a baseline of variability linked to intrinsic process characteristics, which should be considered in future studies to accurately isolate and assess the effects of specific process parameters on material behavior.
2. Materials
This study focused on the use of ER70S-6 welding wires, a low-alloy carbon steel or mild steel material conforming to American Welding Society (AWS) [14]. The manufacturer’s specifications for the chemical composition are summarized in Table 1. With a melting temperature range of from 1425 to 1485 °C, the material’s low carbon content promotes a high critical cooling rate, which reduces the likelihood of martensite formation in the microstructure. It has been demonstrated that the addition of 0.1% C to a Fe–1.5 Mn alloy significantly slows down the γ→α transformation. Within 2 s, ferrite phase grains consume the austenite grains, and subsequent grain growth occurs as long as the temperature remains above 650 °C [15]. This intrinsic property minimizes the potential for martensite formation during additive manufacturing, which could mitigate the microstructural anisotropy typically associated with phase transformations driven by the high thermal gradients inherent to the LWAM process.

Table 1.
Wire chemical composition of ER70S-6 according to manufacturer.
3. Methods
3.1. Specimen Fabrication
Test specimens were fabricated using a Meltio M450 machine (Meltio, Jaén, Spain), which operates with six laser beams at a 976 nm wavelength to melt a metal wire. Prior to printing, the Meltio Horizon slicer, which is its own slicing software for the Meltio system, was used to prepare the parts. In both directions, a layer thickness of 0.8 mm, an infill line width of 1 mm, and an infill density of 100% were used, with a laser power of 1000 W and a feed rate of 300 mm/min. These parameters resulted in a deposited energy density of 250 J/mm3.
To obtain tensile test specimens, two large block-shaped samples were fabricated, resembling a loaf of bread, to allow subsequent extraction of the specimens. One block was manufactured such that the tensile specimens were oriented horizontally within the XY plane, while the other was built with the specimens aligned vertically along the XZ plane. This approach ensures that the influence of the build orientation on the mechanical properties can be systematically analyzed.
In Figure 2, the sample from which the XZ specimens were extracted via metallographic sectioning is shown, along with the specified dimensions. The left image shows the as-built sample prior to specimen extraction, while the schematic on the right details the positions from which the tensile specimens were obtained. The block was sectioned into 12 distinct vertical regions, between A (left) and Z (right), which were used for the tensile test. The red dashed lines indicate the cutting planes used to extract the specimens.
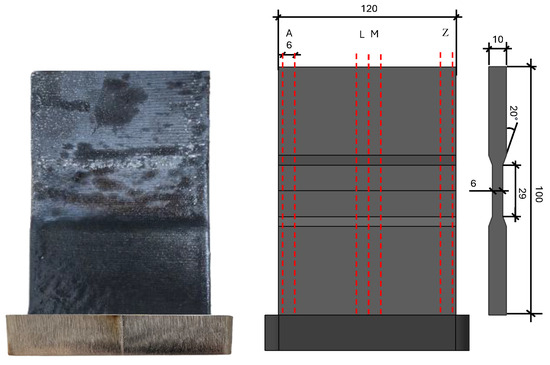
Figure 2.
Sample manufactured for extracting specimens with the specified dimensions in the XZ plane.
In Figure 3 it can be observed the extraction of tensile test specimens from a block fabricated in the XY plane. The image on the left shows the as-built sample before specimen extraction, while the schematic on the right details the locations from which tensile specimens were obtained. The block was sectioned into 14 tensile stress specimens, all of them obtained from the same bulk manufactured. The red dashed lines indicate the cutting planes used to isolate the tensile specimens in order to evaluate the material behavior across different sections of the fabricated component.
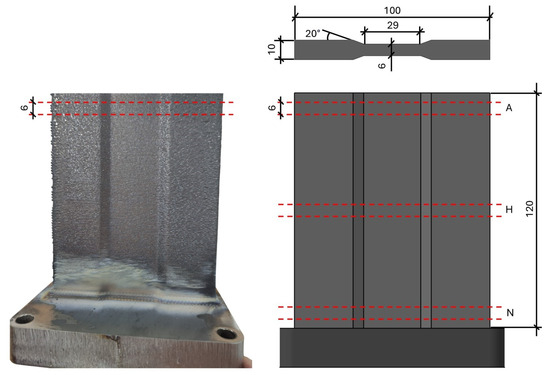
Figure 3.
Sample manufactured for extracting specimens with the specified dimensions in the XY plane.
The printing process follows a layer-by-layer deposition strategy, starting from the base and progressively building upwards. Each layer consistently begins at the same fixed point on one end of the sample, referred to as the “origin”. The laser initiates deposition at this origin, progressing along the layer until completion, at which point it returns to the starting position to begin the next layer. The fabrication method (Figure 4) involves an outer contour deposition, where the perimeter of the layer is first outlined, followed by an inner contour deposition, in which the interior is filled. The infill pattern alternates in a cross-hatched manner between successive layers to enhance structural uniformity and optimize material distribution.
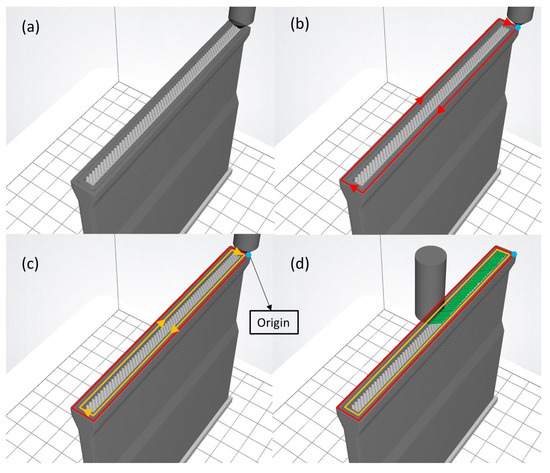
Figure 4.
Schematic representation of the printing path, with origin and orientation marked. Arrows indicates printing path: (a) base layer where the metal is deposited (grey), (b) outer contour deposition (red), (c) inner contour deposition (yellow), and (d) crossed infill pattern for structural integrity (green).
3.2. Microhardness Measurements
For the microhardness testing, the specimens were polished using abrasive sandpapers up to a grit size of 1200 to achieve a smooth and reflective surface, ensuring accurate measurement conditions. The tests were conducted using a Metrotec Innovatest (Metrotec, Lezo, Spain) durometer, following the UNE EN ISO 6507-1:2018 standard [16]. The hardness measurements were performed along a traverse line positioned at the mid-thickness of the z-surface, with incremental steps of 5 mm between each measurement point. The microhardness tests were conducted using a load of 500 g and a dwell time of 10 s.
Each measurement series was repeated three times on the same specimen, ensuring that the spacing between repeated measurements exceeded five times the indentation diagonal length and that all measurement points were located at least three diagonals away from the specimen edges.
3.3. Dilatometric Measurements
A dilatometric analysis was conducted to obtain the actual thermal expansion coefficients of the samples. These coefficients were subsequently incorporated into finite element simulations to accurately predict and analyze potential residual stresses. Dilatometric analysis was performed using a Netzsch Dilatometer Gerätebau 402 EP model. Samples with dimensions of 10 × 10 × 6 mm and parallel faces were prepared to meet the equipment’s requirements.
3.4. Mechanical Characterization
Mechanical characterization was conducted in accordance with the ASTM-E8/E8M standard [17] subsize specimens. Tensile tests were performed using a Metrotec MTE-300 (Metrotec, Lezo, Spain) machine equipped with a 50 kN load cell and operating at a load rate of 3 mm/min following ISO 6892-1 [18]. The specimens were secured using tabs, and elongation was measured using an NCS YYU-25/25 extensometer (NCS, Shanghai, China). Data obtained were processed to obtain the real strain and stress, in order to obtain the real values of the yield and ultimate stress for each coupon.
3.5. Grain Size Distribution
The grain size was measured following the ASTM E112 intersection method, which estimates the average grain size by counting the number of grain boundary intersections along predefined lines. This method provides a statistically robust evaluation of grain size distribution by relating the number of intersections to the mean linear intercept length.
The specimens were polished to a final stage using 1 µm diamond suspension to achieve a high-quality surface finish. After polishing, they were etched with 2% Nital to reveal the grain boundaries. Micrographs were taken at ×100 magnification for three distinct regions of each tensile specimen. In the horizontally printed samples (XY plane), the analyzed regions correspond to the origin, center, and end of the specimen, while, in the vertically printed samples (XZ plane), the regions were defined as the bottom, center, and top of the specimen. To ensure statistical significance, more than 10 images per zone were analyzed.
The intersection method was applied to each micrograph using eight evenly spaced lines, where grain boundary intersections were manually marked. This process generated a grain size distribution for each region. The analysis was performed using a MATLAB-based program (version 2023a) [19] specifically designed for automated grain size measurement, ensuring accuracy and consistency across all images.
For subsequent analysis, the cumulative distribution function (CDF) of grain sizes in each zone was calculated. The CDF represents the probability that a randomly selected grain has a size smaller than or equal to a given value, allowing a direct comparison of grain size distributions between different regions of the specimen. This approach provides insight into grain growth heterogeneity along the build direction and its potential influence on mechanical properties.
3.6. Virtual Simulation of Thermal History
The implementation of advanced software tools to predict thermal behavior during the manufacturing process is critical for identifying zones prone to thermal accumulation. This is essential because variations in heat dissipation lead to different cooling rates within the same part, which directly impacts grain size, creating zones with dissimilar properties along the printed component. The heat distribution is further influenced by factors such as the contact area and the positioning of the part on the build plate. Thermal history simulations were conducted for both positions of the bulk analyzed in the present study to analyze these effects.
The simulations employed the Ansys Mechanical with the DED module. A mesh size of 1 mm was selected to balance computational efficiency and thermal resolution, particularly considering the scale of the samples. The model employed SOLID278 elements, with material activation based on a user-defined “kill-and-birth” approach, using an activation volume of 200 mm3. The activation volume dictates the selection of elements corresponding to the G-code sequence of the printing process. Also, based on the volume activated and the material deposition rate, the step of calculus is adjusted dynamically. The lumped layer method was applied, grouping layers to simplify computation. Convection was applied with a minimal coefficient (1 × 10−⁵ W/mm2 °C) and radiation was neglected. The simulation focused on capturing the thermal gradients and cooling rates during fabrication, enabling correlation with the observed microstructural and mechanical variations.
To ensure accurate results, essential parameters such as material properties, mesh size, and activation volume per simulation step were consolidated in Table 2, along with other relevant simulation settings.

Table 2.
Summary of the key simulation parameters used in the Ansys DED module, including material properties, thermal and mechanical characteristics, and computational settings. The simulation follows a “kill-and-birth” element approach with a lumped layer method to approximate the real printing process. Material properties marked with (*) were obtained from ASME BPVC standards [20].
This study analyzes the temperature variation over time in the printed part and records the temporal temperature fluctuations at specific nodes. This aims to identify the differing cooling rates that arise in various regions during printing, which significantly influence grain growth.
4. Results and Discussion
4.1. Microhardness Measurements
Figure 5 presents the average microhardness values measured at different positions along test specimens XZ, with the corresponding standard deviation at each point. The results illustrate the hardness variation along the specimen’s length, highlighting differences between the bottom regions and the top one. As expected, microhardness varies along the build direction due to the inherent microstructure distribution.
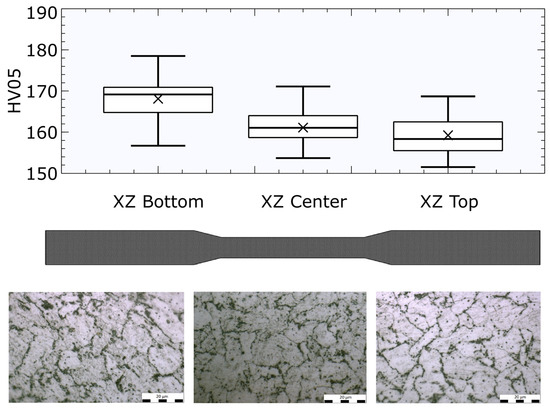
Figure 5.
Hardness average measurements HV05 grouped in three zones along the XZ orientation. The cross indicates the mean value, the whiskers represent the minimum and maximum values, the box spans from the first quartile to the third quartile, and the horizontal line inside the box represents the median. Microstructure images are shown.
Figure 6 illustrates the hardness distribution across the XY plane of the specimen. The box plot shows that the average hardness values remain relatively consistent throughout the sample. However, a slight decrease in hardness can be observed on the right side of the specimen, suggesting localized variations that may be associated with differences in heat dissipation during the manufacturing process. These variations influence the grain size distribution, which, in turn, affects the hardness of the material. The increased standard deviation observed in the microhardness measurements of specimen XY-left may be attributed to local heterogeneity in grain size and potential microstructural discontinuities. This region corresponds to the starting edge of the build path, where repeated laser retraction and heat accumulation could introduce localized thermal anomalies.
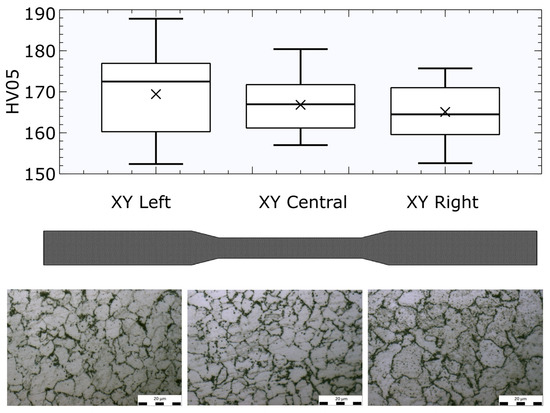
Figure 6.
Hardness average measurements HV05 grouped in three zones along the XY orientation, The cross indicates the mean value, the whiskers represent the minimum and maximum values, the box spans from the first quartile to the third quartile, and the horizontal line inside the box represents the median. Microstructure images are shown.
Table 3 provides a summary of the microhardness values for XZ and XY represented in Figure 5 and Figure 6.

Table 3.
Summary of the HV05 for XZ orientation and XY orientation.
4.2. Dilatometric Measurement
Figure 7 illustrates the results of the dilatometric analysis, revealing a linear behavior of the thermal expansion coefficient up to approximately 728 °C. In the temperature range of from 50 °C to 725 °C, the measured linear thermal expansion coefficient is 13.9063 × 10−⁶ K−1. Beyond this point, a decrease in slope is observed, corresponding to the onset of austenite formation as the material crosses the A1 transformation temperature in the Fe-C phase diagram. Under equilibrium conditions, this temperature would be associated with the presence of approximately 6% austenite.
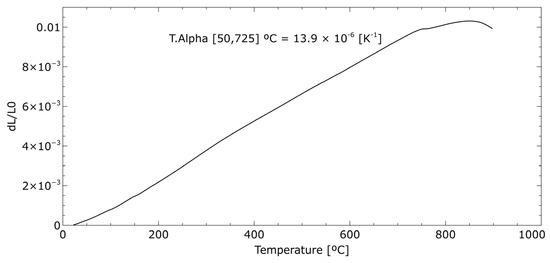
Figure 7.
Measurement obtained from dilatometric analysis, showing a thermal expansion coefficient of 13.9 × 10⁻⁶ K−1 in the temperature range of 50–725 °C.
However, the apparent reduction in slope beyond 750 °C is not solely due to phase transformation. In addition to the progressive formation of austenite, the transition from BCC (ferritic) to FCC (austenitic) involves a rearrangement of atoms that typically induces a change in volume. The FCC structure is more densely packed than BCC, generally leading to a volume contraction during the phase transformation. As a result, above 750 °C, not only is a portion of the material transforming into austenite, but the packing efficiency change also contributes to the observed expansion behavior. These two effects overlap, making the interpretation of thermal expansion in this temperature range more complex.
4.3. Mechanical Characterization
Tensile test specimens were extracted from the two large block-shaped samples, with one set fabricated in the XY direction (horizontal) and the other in the XZ direction (vertical). The results are summarized in Table 4, reporting Young’s modulus, yield strength, ultimate tensile strength (UTS), and true stress at fracture for representative specimens extracted from different regions of each block.

Table 4.
Summary of tensile properties for selected specimens fabricated in XY (horizontal) and XZ (vertical) orientations. For the XY specimens, positions refer to the height within the block (top, middle, bottom). For XZ specimens, positions are defined relative to the deposition path (start, middle, end). Values are presented as mean ± standard deviation.
Representative specimens from the extremes of each block are displayed: XZ-A-XZ-Z for vertically printed (XZ) specimens and XY-A-XY-N for horizontally printed (XY) specimens. Horizontally printed specimens (XY) exhibited higher yield strength and UTS values compared to vertically printed specimens (XZ). Specifically, the highest yield strength was recorded in specimen XY-N, located at the bottom of the horizontally printed block, reaching 472 MPa, while vertically printed specimens, such as XZ-L, showed lower values around 355 MPa.
This trend can be attributed to differences in thermal history during fabrication. Horizontally printed parts benefit from more uniform heat dissipation along the plane, leading to finer and more homogeneous grain structures. In contrast, vertically printed specimens experience greater heat accumulation near the upper regions of the build, promoting grain coarsening and reducing mechanical strength. The true fracture stress values followed a similar trend, supporting the conclusion that microstructural differences driven by thermal gradients significantly affect the fracture behavior.
Additionally, the Young’s modulus values remained relatively stable across different specimens, with slight variations likely linked to local microstructural heterogeneities but not to global differences in build orientation.
These findings confirm that build orientation and thermal history must be considered critical variables influencing the mechanical performance of LWAM-fabricated low-carbon steels, even when process parameters are maintained at a constant level.
4.4. Virtual Simulation of Thermal History
The results obtained from the virtual simulation of the printing process were analyzed for both bulk orientations within the printing bed. Figure 8 and Figure 9 present the maximum temperature obtained across time while printing and a representation of the final step before the cooling period. Additionally, the thermal history of the layers of interest has been included. These curves provide insights into the differences in cooling rates between the regions near the base plate and those located at the top of the bulk. Additionally, in the thermal history, a series of key points of interest has been highlighted. As illustrated in Figure 8, the thermal history of each layer initiates with activation, wherein the material is heated to its melting temperature, followed by a cooling phase. The subsequent thermal evolution is predominantly governed by the thermal influence of the upper layers through heat conduction. It is particularly noteworthy in the case of the bottom layer (Figure 8a) that, due to its proximity to the build plate, a pronounced thermal gradient is observed. After initial melting and cooling, the bottom layer experiences reheating caused by the heat conducted from the upper layers. However, convective heat losses dominate, preventing the layer from maintaining elevated temperatures. This indicates that, although the layer is reheated after cooling, the thermal influence is insufficient to sustain high temperatures, resulting in distinct thermal behaviour compared to the mid and top layers.
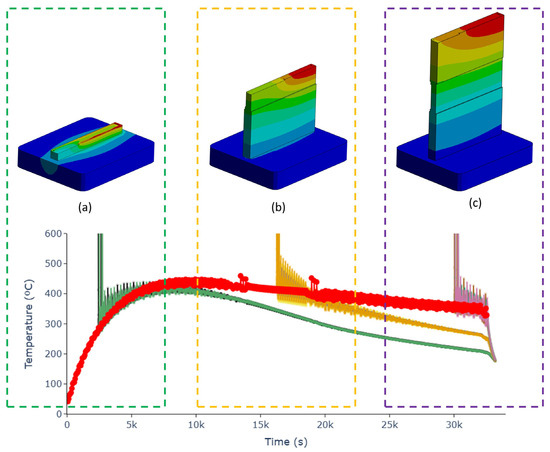
Figure 8.
Thermal history of the bulk oriented along the XZ direction. The thermal history shown in red represents the maximum temperature reached at each simulation step. Layers of interest corresponding to the heights where microstructure and hardness were measured are also indicated: (a) bottom layer (green), (b) mid layer (yellow), and (c) top layer (purple).
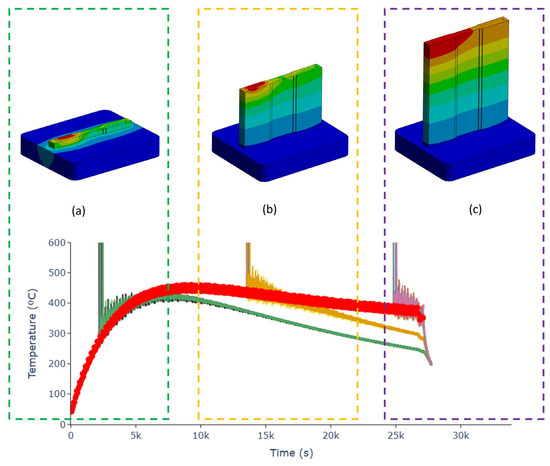
Figure 9.
Thermal history of the bulk oriented along the XY direction. The thermal history shown in red represents the maximum temperature reached at each simulation step. Layers of interest corresponding to the heights where microstructure and hardness were measured are also indicated: (a) bottom layer (green), (b) mid layer (yellow), and (c) top layer (purple).
Analyzing the results for the bulk oriented along the printing direction XZ (Figure 8), it is observed that the cooling rate near the base plate is higher compared to the middle and top zones, where the temperatures reached 380 °C in mid layer and 340 °C at the top, while, near the baseplate, 270 °C is reach. This means that, for the same period of time, the cooling rate near the baseplate in the bottom layer is 28% higher. For the bulk positioned perpendicular to the bed XY (Figure 9), a similar cooling rate trend is observed. The region near the base plate exhibits a cooling rate higher than that of the middle and top zones. These variations in cooling rates directly correlate with the observed differences in hardness and grain size. This consistency in cooling behavior between orientations, founded on virtual simulations, reinforces the findings related to hardness and grain size distribution. As seen in Figure 6, the little difference between the middle and top cooling rates helps in understanding the non-statistical difference between zones found.
However, when comparing the two orientations, differences emerge in the global maximum temperature curves. While both exhibit a similar pattern—temperature increases with height until reaching a threshold where the growth rate slows and stabilizes—the absolute temperatures achieved differ slightly. The bulk XZ oriented with a horizontal (flat) orientation reaches lower peak temperatures compared to the vertically printed bulk. As a result, the mean cooling rate in the flat-oriented bulk is 8% higher, leading to a more pronounced reduction in grain size due to the accelerated cooling process. These findings highlight the influence of part orientation on thermal history and microstructural evolution.
4.5. Grain Size
Figure 10 presents the grain size distribution and cumulative distribution functions (CDF) for the horizontally printed (XY) specimen. The top section of the figure displays the individual grain size distributions and CDFs for the three analyzed regions, while the lower section, positioned beneath the specimen, compares the cumulative distributions across all regions.
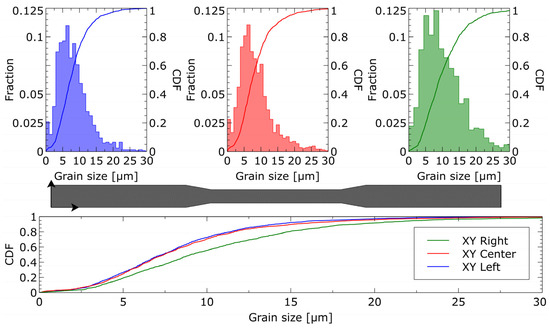
Figure 10.
Grain size distribution and cumulative distribution functions (CDFs) for the horizontally printed (XY) specimen. The top section presents the individual grain size distributions and CDFs for the origin, center, and end regions. The bottom section, positioned beneath the specimen, compares the cumulative distributions of the three regions, highlighting differences in grain growth across the sample.
The results indicate that the D50 grain size (median grain size) is approximately 7–8 µm in the origin and center regions, whereas, in the end region, it increases to around 10 µm. The cumulative distribution graph highlights that the grain size distributions in the origin and center regions are similar, while the end region exhibits noticeably larger grains, diverging from the other two zones. This variation suggests an influence of heat accumulation and dissipation patterns during fabrication.
Figure 11 presents the grain size distribution and cumulative distribution functions (CDF) for the vertically printed (XZ) specimen. Next to the specimen image, the individual grain size distributions and CDFs for the bottom, center, and top regions are shown, while the right section compares the cumulative distributions across these regions.
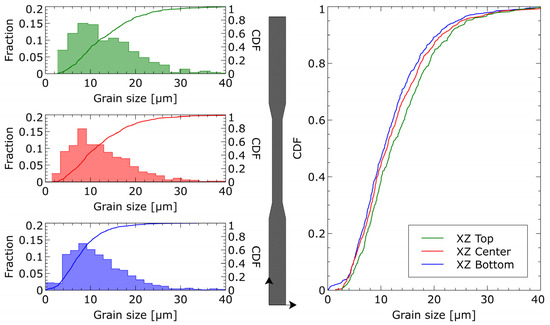
Figure 11.
Grain size distribution and cumulative distribution functions (CDFs) for the vertically printed (XZ) specimen. The left section presents the specimen alongside the individual grain size distributions and CDFs for the bottom, center, and top regions. The right section compares the cumulative distributions, showing a shift toward larger grain sizes as the build height increases.
The results indicate that the D50 grain size (median grain size) is 10.6 µm at the bottom, 11.12 µm in the center, and increases to 12 µm at the top of the specimen. The cumulative distribution graph highlights a progressive shift toward larger grain sizes as the build height increases, suggesting an influence of thermal cycling and heat accumulation during fabrication.
In Figure 12 can be observed the cumulative distribution functions (CDFs) of grain size for the horizontally (XY) and vertically (XZ) printed specimens, considering all grains across all analyzed sections. The results reveal distinct grain size distributions between the two orientations. While the mean grain size differs (8.8 µm for XY and 11.2 µm for XZ), the key observation is the effect of heat dissipation on the overall grain size distribution, highlighting the influence of the fabrication process on microstructural evolution.
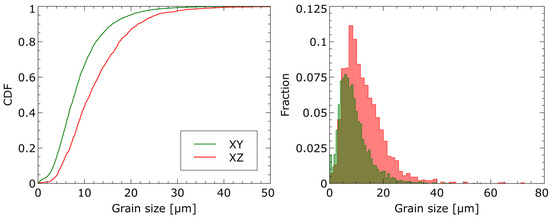
Figure 12.
Cumulative distribution functions (CDFs) of grain size for the horizontally (XY-green) and vertically (XZ-red) printed specimens, considering all grains across all analyzed sections. The graph highlights the differences in grain size distribution between both orientations, emphasizing the influence of heat dissipation during the manufacturing process.
To evaluate the correlation between grain size and hardness, a Hall–Petch-type relationship was established by plotting the average Vickers hardness values measured in each region of the XY and XZ specimens against the inverse square root of the corresponding grain size expressed in μm−1/2. A linear regression was performed (Figure 13), fitted to a Hall–Petch type equation, and the resulting trend follows the expression Hv05 = 107 + 185·d−1/2, with a moderate correlation coefficient (R2 = 0.88). Given the inherent variability in hardness measurements, this result should be considered an approximation based on the data obtained in this study. However, the observed values are consistent with typical Hall–Petch behavior reported for ferritic steels, supporting the influence of grain refinement on hardness evolution.
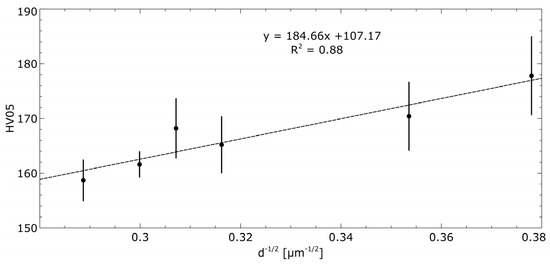
Figure 13.
Relationship between Vickers hardness (Hv) and the inverse square root of grain size (d−1/2), illustrating a Hall–Petch-type behavior. The data correspond to average values measured in different regions of the XY and XZ specimens. A linear fit yields the equation Hv = 184.66·d−1/2 + 107.17, with a coefficient of determination R2 = 0.88. Error bars represent the standard deviation of each hardness measurement group.
5. Conclusions
This study analyzed the influence of the Laser Wire-Feed Additive Manufacturing (LWAM) process on the microstructure and mechanical properties of ER70S-6 low-carbon steel. Despite the expected resistance of this material to phase transformations, the results demonstrate that the manufacturing process and specimen geometry significantly affect heat dissipation, leading to localized variations in grain size and mechanical behavior.
The grain size distribution varied along the printed specimens, influenced by thermal accumulation and cooling rates. In the horizontally printed samples (XY plane), the D50 grain size was approximately 7–8 µm at the origin and center, increasing to 10 µm at the end. In the vertically printed samples (XZ plane), grain growth followed a progressive increase, with D50 values of 10.6 µm, 11.12 µm, and 12 µm at the bottom, center, and top, respectively.
The microhardness distribution followed the grain size trends, confirming the influence of grain refinement on local mechanical response.
Tensile test results showed a direct correlation between grain size and mechanical performance, with horizontally printed samples exhibiting higher ultimate tensile strength (UTS) and yield strength due to finer grains and more uniform heat dissipation. The vertically printed samples displayed lower strength values, attributed to coarser grains and heat accumulation effects.
Dilatometric measurements provide accurate thermal expansion coefficients, which can enhance finite element modeling (FEM) of residual stresses.
Virtual thermal history simulations confirmed differences in cooling rates across the specimen, further explaining the observed microstructural variations. These findings highlight the importance of heat management strategies in LWAM to achieve uniform mechanical properties and predict microstructural behavior more accurately.
These findings underscore the importance of process optimization in LWAM, particularly in controlling heat dissipation to achieve consistent mechanical properties. Future work should focus on residual stress modeling, fatigue behavior, and post-processing techniques to enhance the structural integrity of LWAM-fabricated components.
Author Contributions
Conceptualization, D.G.-L. and J.G.-M.-C.; data curation, D.G.-L.; formal analysis, D.G.-L. and J.G.-M.-C.; funding acquisition, R.B.; investigation, D.G.-L., J.G.-M.-C. and R.B.; methodology, R.B.; project administration, R.B.; resources, D.G.-L. and J.G.-M.-C.; software, J.G.-M.-C.; supervision, R.B.; validation, J.G.-M.-C.; visualization, S.C.; writing—original draft, D.G.-L. and J.G.-M.-C.; writing—review and editing, S.C. and R.B. All authors have read and agreed to the published version of the manuscript.
Funding
This research received no external funding.
Data Availability Statement
The data that support the findings of this study are available on request from the corresponding author.
Acknowledgments
The authors acknowledge the financial support of Nebrija University. Jesús G-M Caraballo especially acknowledges the financial support received from the Banco Santander and the Nebrija University fellowship. The authors would also like to express their gratitude to Gabriel Chaves Robledo and Álvaro Jesús Luengo Gutiérrez for their help in preparing samples.
Conflicts of Interest
The authors declare no conflicts of interest.
References
- Smith, J.; Xiong, W.; Yan, W.; Lin, S.; Cheng, P.; Kafka, O.L.; Wagner, G.J.; Cao, J.; Liu, W.K. Linking Process, Structure, Property, and Performance for Metal-Based Additive Manufacturing: Computational Approaches with Experimental Support. Comput. Mech. 2016, 57, 583–610. [Google Scholar] [CrossRef]
- Kawalkar, R.; Dubey, H.K.; Lokhande, S.P. A Review for Advancements in Standardization for Additive Manufacturing. Mater. Today Proc. 2022, 50, 1983–1990. [Google Scholar] [CrossRef]
- Yan, L.; Chen, Y.; Liou, F. Additive Manufacturing of Functionally Graded Metallic Materials Using Laser Metal Deposition. Addit. Manuf. 2020, 31, 100901. [Google Scholar] [CrossRef]
- Lalegani Dezaki, M.; Serjouei, A.; Zolfagharian, A.; Fotouhi, M.; Moradi, M.; Ariffin, M.K.A.; Bodaghi, M. A Review on Additive/Subtractive Hybrid Manufacturing of Directed Energy Deposition (DED) Process. Adv. Powder Mater. 2022, 1, 100054. [Google Scholar] [CrossRef]
- Noori Rahim Abadi, S.M.A.; Mi, Y.; Kisielewicz, A.; Sikström, F.; Choquet, I. Influence of Laser-Wire Interaction on Heat and Metal Transfer in Directed Energy Deposition. Int. J. Heat Mass Transf. 2023, 205, 123894. [Google Scholar] [CrossRef]
- Ma, L.; Liu, Z.; Feng, C.; Zhang, B.; Pang, M.; Feng, Q.; Wang, Y. Investigation on Forming Process and Product Properties of Laser Wire-Feed Additive Manufacturing for High-Quality Metal Thin-Walled Parts. J. Mater. Eng. Perform. 2024. [Google Scholar] [CrossRef]
- Abuabiah, M.; Mbodj, N.G.; Shaqour, B.; Herzallah, L.; Juaidi, A.; Abdallah, R.; Plapper, P. Advancements in Laser Wire-Feed Metal Additive Manufacturing: A Brief Review. Materials 2023, 16, 2030. [Google Scholar] [CrossRef] [PubMed]
- Islam, T.; Rashed, H.M.M.A. Classification and Application of Plain Carbon Steels. In Reference Module in Materials Science and Materials Engineering; Elsevier: Amsterdam, The Netherlands, 2019; ISBN 9780128035818. [Google Scholar] [CrossRef]
- Greer, C.; Nycz, A.; Noakes, M.; Richardson, B.; Post, B.; Kurfess, T.; Love, L. Introduction to the Design Rules for Metal Big Area Additive Manufacturing. Addit. Manuf. 2019, 27, 159–166. [Google Scholar] [CrossRef]
- Laghi, V.; Palermo, M.; Gasparini, G.; Girelli, V.A.; Trombetti, T. Experimental Results for Structural Design of Wire-and-Arc Additive Manufactured Stainless Steel Members. J. Constr. Steel Res. 2020, 167, 105858. [Google Scholar] [CrossRef]
- Haden, C.V.; Zeng, G.; Carter, F.M.; Ruhl, C.; Krick, B.A.; Harlow, D.G. Wire and Arc Additive Manufactured Steel: Tensile and Wear Properties. Addit. Manuf. 2017, 16, 115–123. [Google Scholar] [CrossRef]
- Dekis, M.; Tawfik, M.; Egiza, M.; Dewidar, M. Unveiling the Characteristics of ER70S-6 Low Carbon Steel Alloy Produced by Wire Arc Additive Manufacturing at Different Travel Speeds. Met. Mater. Int. 2024, 31, 325–338. [Google Scholar] [CrossRef]
- Le, V.T.; Mai, D.S.; Hoang, Q.H. A Study on Wire and Arc Additive Manufacturing of Low-Carbon Steel Components: Process Stability, Microstructural and Mechanical Properties. J. Brazilian Soc. Mech. Sci. Eng. 2020, 42, 480. [Google Scholar] [CrossRef]
- AWS A5.18/A5.18M:2021; Specification for Carbon Steel Electrodes and Rods for Gas Shielded Arc Welding. American Welding Society: Miami, FL, USA, 2021.
- Takata, N.; Tsukahara, T.; Kobayashi, S.; Takeyama, M. Microstructure Control of Dual-Phase Steels through Hot-Dip Al–Mg–Si Alloy Coating Process. ISIJ Int. 2016, 56, 319–325. [Google Scholar] [CrossRef]
- ISO 6507-1:2018; Metallic Materials—Vickers Hardness Test—Part 1: Test Method. ISO: Geneva, Switzerland, 2018.
- ASTM E8/E8M-21; Standard Test Methods for Tension Testing of Metallic Materials. ASTM International: West Conshohocken, PA, USA, 2021.
- ISO 6892-1:2019; Metallic Materials—Tensile Testing—Part 1: Method of Test at Room Temperature. ISO: Geneva, Switzerland, 2019.
- Meister, S. Grain and Particle Analysis with Line Intersection Method. MATLAB Central File Exchange. Available online: https://www.mathworks.com/matlabcentral/fileexchange/35203-grain-and-particle-analysis-with-line-intersection-method (accessed on 14 March 2025).
- ASME Boiler and Pressure Vessel Committee on Materials. 2010 ASME Boiler and Pressure Vessel Code: Section II, Part D—Properties (Metric); American Society of Mechanical Engineers: New York, NY, USA, 2010. [Google Scholar]
Disclaimer/Publisher’s Note: The statements, opinions and data contained in all publications are solely those of the individual author(s) and contributor(s) and not of MDPI and/or the editor(s). MDPI and/or the editor(s) disclaim responsibility for any injury to people or property resulting from any ideas, methods, instructions or products referred to in the content. |
© 2025 by the authors. Licensee MDPI, Basel, Switzerland. This article is an open access article distributed under the terms and conditions of the Creative Commons Attribution (CC BY) license (https://creativecommons.org/licenses/by/4.0/).