Article

Quasi-Static Compressive Behavior and Energy Absorption Performance of Polyether Imide Auxetic Structures Made by Fused Deposition Modeling

1
AECC Beijing Institute of Aeronautical Materials, Beijing 100095, China
2
Belarusian State Technological University, 220006 Minsk, Belarus
3
Beijing Institute of Graphene Technology, Beijing 100094, China
*
Author to whom correspondence should be addressed.
J. Manuf. Mater. Process. 2025, 9(5), 155; https://doi.org/10.3390/jmmp9050155
Submission received: 31 March 2025 / Revised: 5 May 2025 / Accepted: 7 May 2025 / Published: 9 May 2025

Abstract

Auxetic structures have garnered considerable interest for being lightweight and exhibiting superior properties such as an excellent energy absorption capability. In this paper, re-entrant and missing rib square grid auxetic structures were additively manufactured via the fused deposition modeling technique using two types of polyether imide materials: ULTEM 9085 and ULTEM 1010. In-plane quasi-static compressive tests were carried out on the proposed structures at different relative densities to investigate the Poisson’s ratio, equivalent modulus, deformation behavior, and energy absorption performance. Finite element simulations of the compression process were conducted, which confirmed the deformation behavior observed in the experiments. It was found that the Poisson’s ratio and normalized equivalent Young’s modulus of ULTEM 9085 and ULTEM 1010 with the same geometries were very close, while the energy absorption of the ductile ULTEM 9085 was significantly higher than that of the brittle ULTEM 1010 structures. Furthermore, a linear correlation exists between the relative density and specific energy absorption of missing rib square grid structures within the investigated relative density range, whereas the relationship for re-entrant structures follows a power law. This study provides a better understanding of how material properties influence the deformation behavior and energy absorption characteristics of auxetic structures.

1. Introduction

Auxetic structures, which expand upon stretching and contract upon compression, typically exhibit a negative Poisson’s ratio (NPR) effect [1]. These structures are known for their extraordinary properties, including high energy absorption [2,3], superior fracture toughness [4,5], notable indentation resistance [6,7], and enhanced shear stiffness [8,9]. Their outstanding performance and lightweight characteristic make auxetic structures suitable for a range of applications, such as in the aerospace, automobile, sport, and medical fields [10,11,12,13]. A particularly appealing feature of auxetic structures is their energy absorption capacity, which is beneficial for impact-resistant honeycomb, automobile crash boxes, explosion protection, sports injury prevention, and so on [14,15,16,17].
Among all sorts of auxetic geometries, re-entrant models are particularly prominent in research for their mechanical properties and energy absorption characteristics, studied extensively through theoretical, simulation, and experimental methods. Yang et al. [18] studied the impact energy absorption of a re-entrant auxetic honeycomb and compared it with a traditional hexagonal honeycomb, discovering that the re-entrant honeycomb dissipated more impact energy in the transverse direction and had great potential to be used in body protective devices. Studies about explosion protection of re-entrant structures [19,20,21] have shown that re-entrant honeycomb had better resistance against blast loading than non-auxetic honeycomb due to its auxetic behavior, exhibiting localized stiffness and better energy absorption. Through the modification of re-entrant geometry such as embedding ligaments [22,23], combined with other geometries [24,25], and hierarchical structures [26,27], the mechanical and energy absorption performance of re-entrant structures can be further improved. As compared with re-entrant architectures, missing rib models based on square grid geometries, also called cross-chiral or swastika models, have received much less attention so far. Smith et al. [28] firstly proposed a kind of missing rib auxetic foam that is similar to a network of ribs with biaxial symmetry but with a proportion of cell ribs removed; then, samples of this model were manufactured by Gaspar et al. [29] and the NPR phenomenon was confirmed. Lim [30] showed that the lozenge and square grid type of missing rib geometries were analogous to the tetrachiral and anti-tetrachiral ones based on the deformation mechanism. Farrugia et al. [31] further assessed the deformation mode of a missing rib square grid architecture by numerical and experimental methods, finding that the ratio of the thickness of the ligament to that of the crossed ligaments influenced the deformation mechanisms. The square grid with thinner ligaments was akin to the anti-tetrachiral type and allowed for a more negative Poisson’s ratio. Few studies have investigated the energy absorption performance of auxetic structures with missing ribs [32,33]. Mahesh et al. [34] found that a missing rib model possessed higher compressive strength parameters and specific energy absorption (SEA) than the hexagonal re-entrant structures. Zhang et al. [35] designed a novel anti-missing rib lozenge lattice metamaterial with distinct negative Poisson’s ratio (NPR) characteristics and a superior SEA capacity, and the stiffness and auxeticity were enhanced by introducing lateral and longitudinal auxiliary ribs. The missing rib lattice exhibited more stable auxetic behavior over a large range of strains than a chiral structure [36], which is another significant type of auxetic architecture. Research on the deformation mechanism and energy absorption performance of missing rib auxetic structures has been insufficient, thus necessitating further investigation.
Due to the complex configurations of auxetic lattices, additive manufacturing (AM) techniques are well suited to fabricate these structures [37]. For thermoplastic materials, one of the most commonly used AM methods is fused deposition modeling (FDM), which is effective for producing complex lattice structures [38]. Common FDM materials such as polylactic acid, acrylonitrile butadiene styrene, polyamide, polycarbonate, and polyethylene terephthalate glycol have been extensively utilized in the construction of auxetic structures [32,34,39,40]. Special engineering plastics, also known as high-performance thermoplastics, including polyether ether ketone, polyether ketone ketone, polyetherimide polyphenylene sulfide, polysulfone, etc., have been more and more used as high-performance materials to fabricate FDM parts [41,42] due to their excellent mechanical strength, high temperature resistance, remarkable chemical resistance, and the other advantages. ULTEM 9085 and ULTEM 1010, which are two grades of polyetherimide (PEI) materials most commonly used for FDM manufacturing, offer outstanding thermal resistance, a high strength-to-weight ratio, and broad chemical resistance. ULTEM 9085 is FST-compliant and certified for use in aircraft components, which is more bending-resistant and ductile, and exhibits smaller anisotropy in FDM-manufactured parts than ULTEM 1010. Meanwhile, ULTEM 1010 is slightly stronger and more heat-resistant, and thus is less prone to thermal expansion [43]. Only a limited number of studies [44,45,46,47] have reported special engineering plastics as AM materials to fabricate auxetic structures. He et al. [46] fabricated re-entrant structures using four materials including polyamide (PA), carbon fiber (CF)-reinforced PA (PA/CF), PEEK, and PEEK/CF, and showed that the compression deformation mode of auxetic structure were similar, which was not dependent on the material type. Nevertheless, when there is a significant disparity in material ductility or relative density, the material type may substantially affect the deformation mode of auxetic structures. Andrew et al. [47] reported the energy absorption and piezoresistive self-sensing performance of 3D printed CF/PEEK lattices with hexagonal, chiral, and re-entrant topologies of the same relative density. Under in-plane quasi-static compression, the elastic moduli of the CF/PEEK lattices were found to be significantly higher than those of the neat PEEK lattices, but the SEA values of the CF/PEEK lattices were found to be lower than those of the neat PEEK lattices, due to the relatively brittle behavior of the CF/PEEK composite. Therefore, both stiffness and toughness, which are generally mutually conflicting, affect the energy absorption performance of auxetic structures, making the influence of the material type more complicated. The extraordinary mechanical properties of high-performance engineering plastics are particularly advantageous for the energy absorption characteristics of auxetic structures. As representative polymers in this category, ULTEM 1010 and 9085 exhibit distinct material behaviors, making it highly important to investigate how their different properties affect the deformation mechanisms and energy absorption performance of auxetic structures under quasi-static compression at varying relative densities.
In this study, ULTEM 9085 and ULTEM 1010 were utilized as filaments for the fabrication of re-entrant and missing rib square grid structures via the FDM technique. The Poisson’s ratio, equivalent modulus, deformation behavior, and energy absorption performance of the two auxetic geometries under quasi-static compression loading were examined through a combination of experimental testing and finite element analysis. The correlation between specific energy absorption and relative density for two kinds of auxetic structures fabricated from different PEI materials were also clarified.

2. Materials and Methods
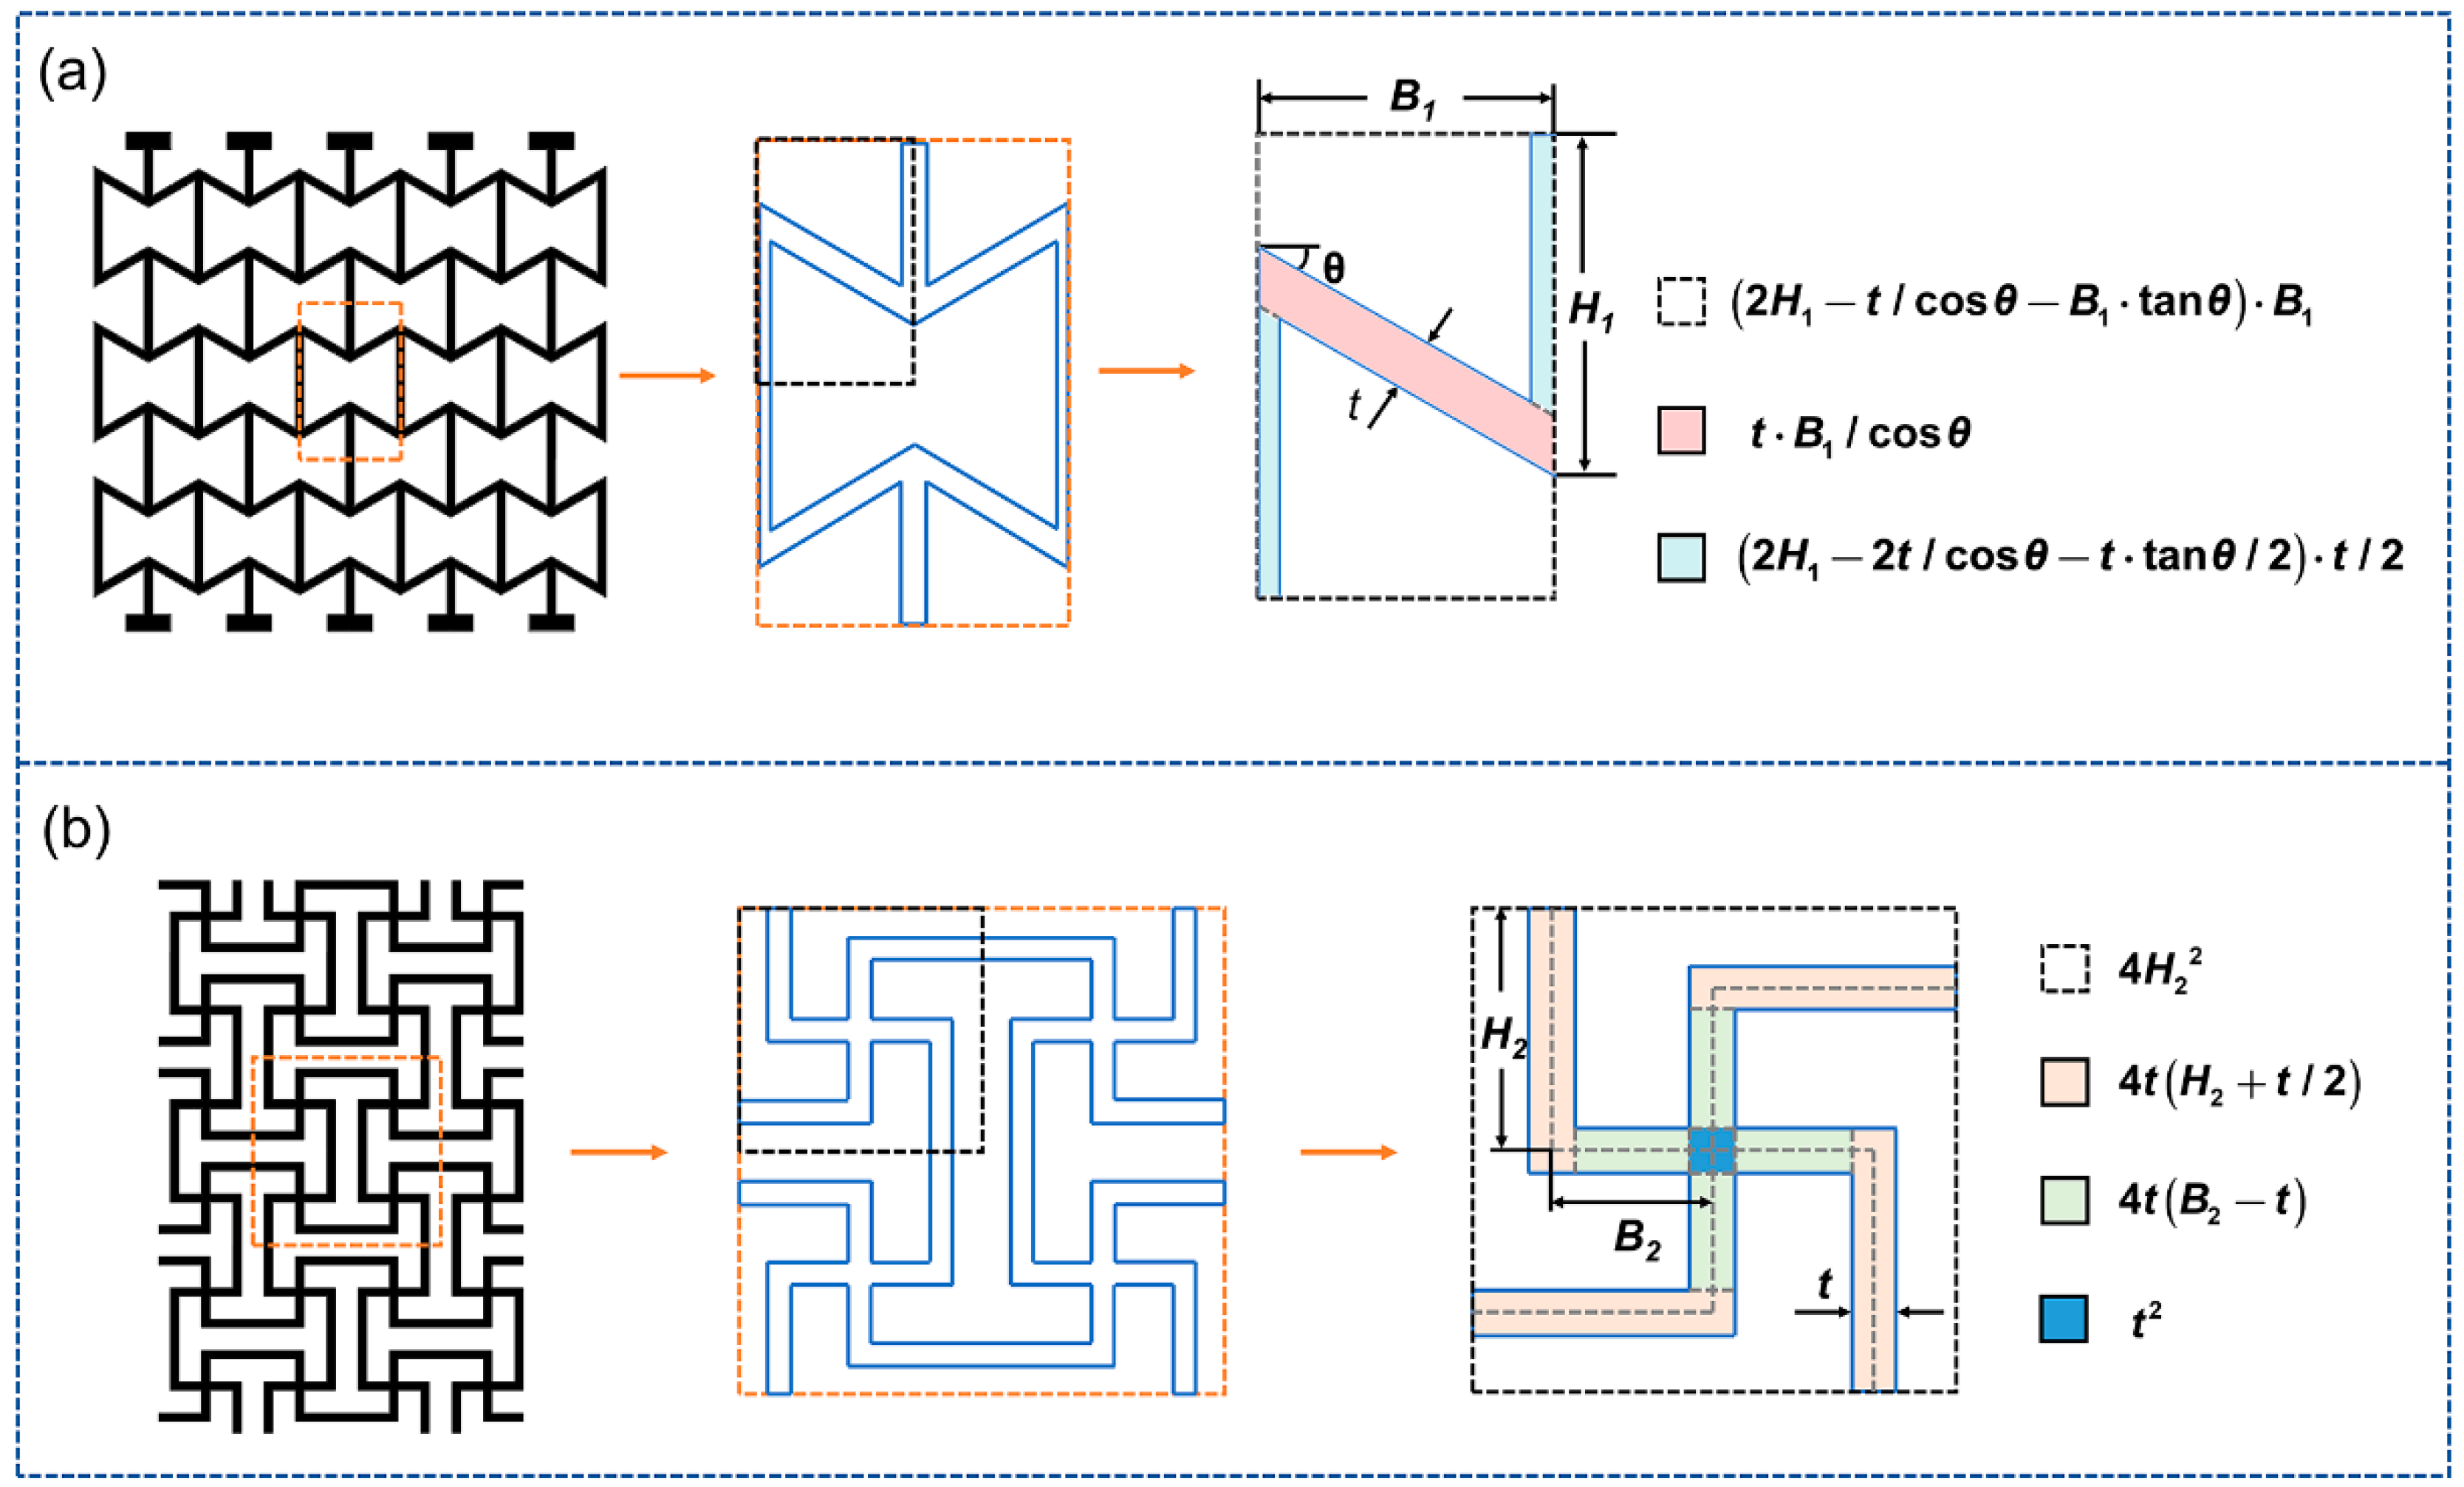
2.1. Geometries

Configurations of the re-entrant (RE) and missing rib square grid (MRSG) structures are shown in Figure 1a,b. The RE specimens were designed with 5 × 3 unit cells and MRSG specimens were 2 × 3 unit cells. The geometric parameters of the RE structure are as follows: H1, B1, t, and θ are the length of half vertical struts, the width of inclined struts, the wall thickness, and the initial inclination angle, respectively. In this study, the angle of θ was kept constant as 30°, and H1 was designed to be equal to the length of the inclined strut; thus, the ratio of B1/H1 is also a constant, denoted as k1. The structure parameters of the MRSG unit cell are marked as follows: H2, B2, and t are the length of half vertical ribs, the length of half horizontal ribs, and the wall thickness. The ratio of H2/B2 is denoted as k2, which is designed as a constant of 1.5. The selection of k1 and k2 ensures relatively uniform material distribution, preventing premature strut contact during deformation, thereby reducing the chances of premature structural failure. The thickness of the lattice walls of RE structures was designed to be the same as that of MRSG structures, which was set as 1.52 mm, three times the nozzle diameter of the FDM machine. Based on the above geometry parameters, the relative density formulas of the RE and MRSG lattices can be expressed as Equations (1) and (2):
ρ R ¯ = ρ R ρ s = S R S 1 = t B 1 / cos θ + ( 2 H 1 2 t / cos θ t tan θ ) t / 2 B 1 ( 2 H 1 t / cos θ B 1 tan θ )
ρ M ¯ = ρ M ρ s = S M S 2 = 4 t H 2 + t / 2 + 4 t B 2 t + t 2 4 H 2 2
Here, ρR and ρM are the densities of the RE and MRSG lattices, ρs is density of the parent material, SR and S1 represent the area of material occupied and total XY plane of unit cell of RE structures, and SM and S2 describe the same parameters of MRSG structures. In this study, RE specimens with relative densities of 0.14, 0.20, 0.24, 0.28, 0.32, 0.36, and 0.40 and MRSG specimens with relative densities of 0.20, 0.25, 0.30, 0.35, 0.40, 0.45, and 0.50 were prepared. According to Equations (1) and (2), with given relative densities and the known value of k1 and k2, the values of H1, B1, H2, and B2 for all geometries can be determined by solving the equations, as presented in Table 1. The out-of-plane thickness of the RE and MRSG specimens was designed as one-fifth of the in-plane width to ensure the stability of RE and MRSG specimens in the Z direction when compressed.

2.2. Raw Materials and FDM Process
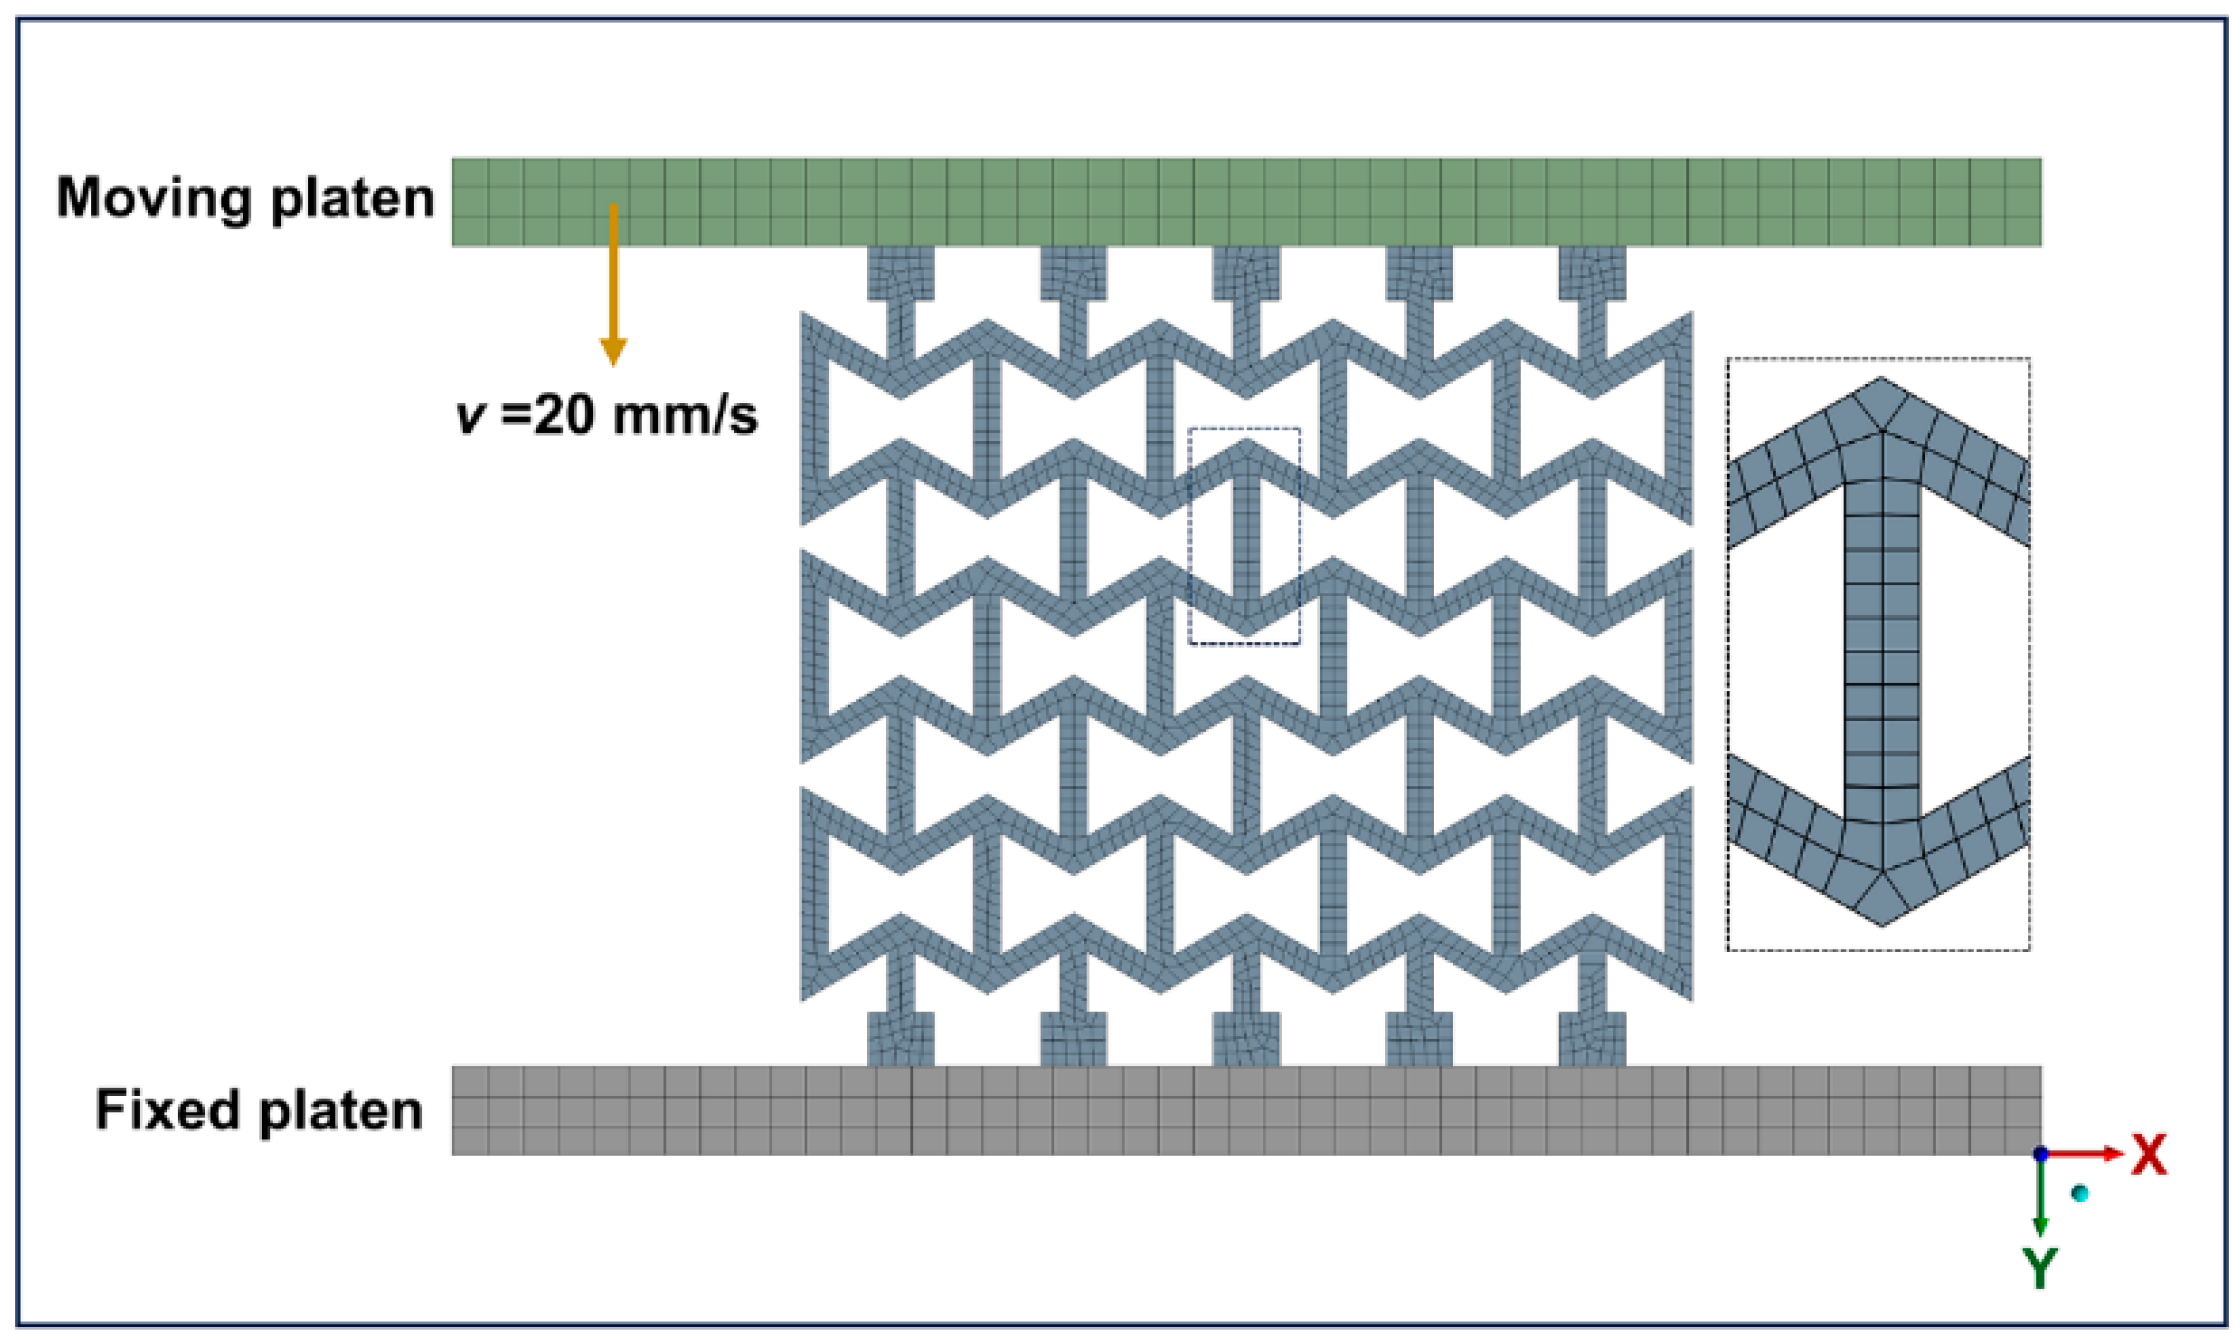
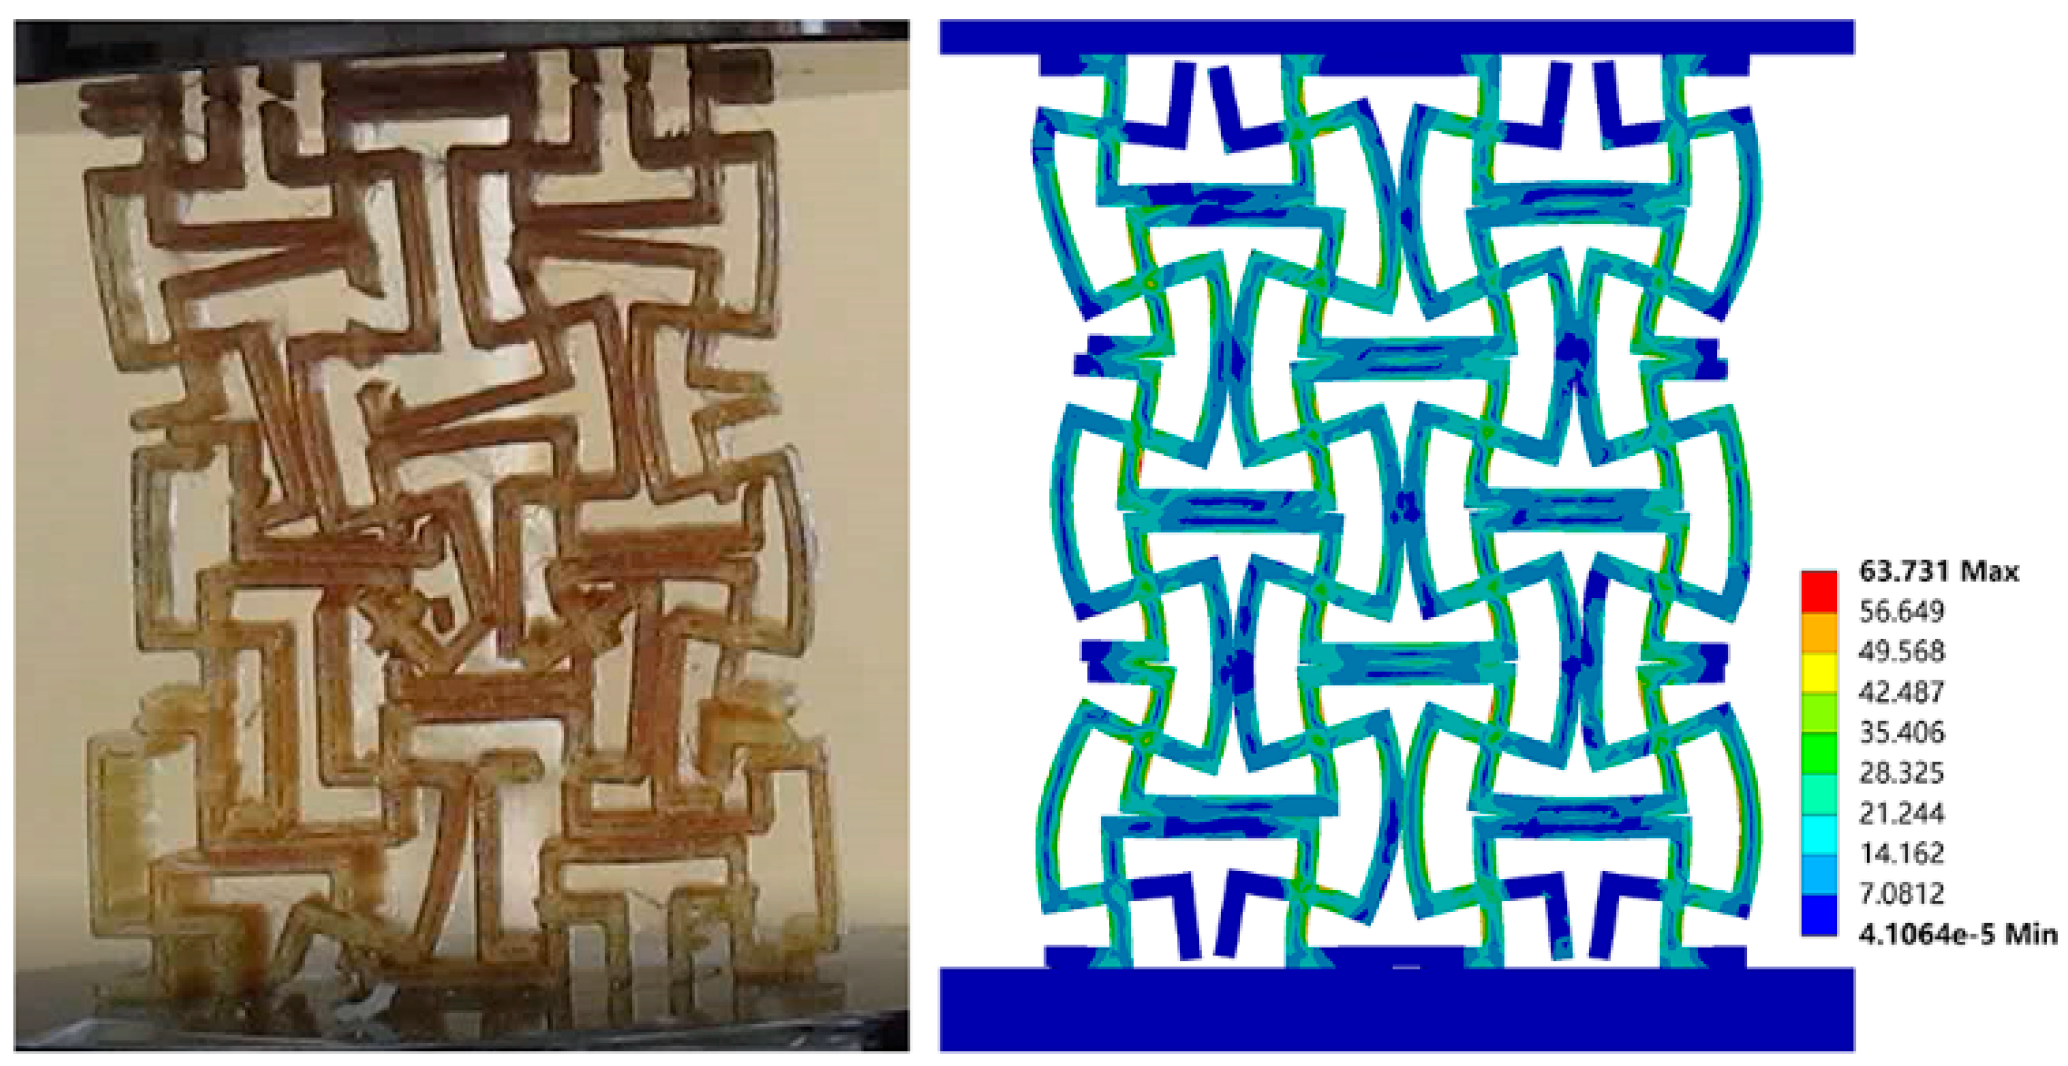
The ULTEM 9085 and ULTEM 1010 filaments used in this study were purchased from Stratasys. Standard tensile coupons of ULTEM 9085 and ULTEM 1010 were printed in the XY printing orientation using the FDM technique and tested according to the ASTM D638 standard to investigate the tensile mechanical properties of the parent materials for the auxetic structures. Tensile tests were conducted at a speed of 5 mm/s using a 50 kN MTS machine. The strain–stress curves of ULTEM 9085 and ULTEM 1010 are shown in Figure 2. The results indicate that ULTEM 9085 exhibits a lower ultimate tensile strength, significantly higher strain at break, and a slightly lower Young’s modulus compared to ULTEM 1010.
The tensile coupons and auxetic structures were printed using a Fortus 450 mc (Stratasys) device with a T16 nozzle. The nozzle diameter was 0.508 mm; printing speed was 30 mm/s; and nozzle temperature, build chamber temperature, and build plate temperature were 380 °C, 160 °C, and 180 °C, respectively. The contour width and layer thickness were 0.508 and 0.254 mm, respectively. A 45°/45° deposition raster angle, 100% filling density, and three contour numbers were adopted.

2.3. FE Simulation

Finite element (FE) models were developed using ANSYS/LS-DYNA to simulate the behavior of RE and MRSG specimens under quasi-static uniaxial compression. A typical model is illustrated in Figure 3. The geometries of the RE and MRSG structures, along with two platens positioned at the top and bottom, were imported into the FE software. The material of the platens was structural steel, while the auxetic structure was made of ULTEM 9085 or 1010. An elastic–plastic multilinear isotropic hardening material model, based on the uniaxial tensile test data, was adopted. The basic material properties used are shown in Table 2. The element size of the XY face of the auxetic structures was set to 0.76 mm, which is half of the wall thickness. The contact type between the platens and the auxetic samples was defined as frictional, with a friction coefficient of 0.3. A body interaction was introduced to prevent self-penetration of the structures. The bottom platen was completely fixed, and a uniaxial velocity of 20 mm/s was applied to the upper platen in the Y direction.

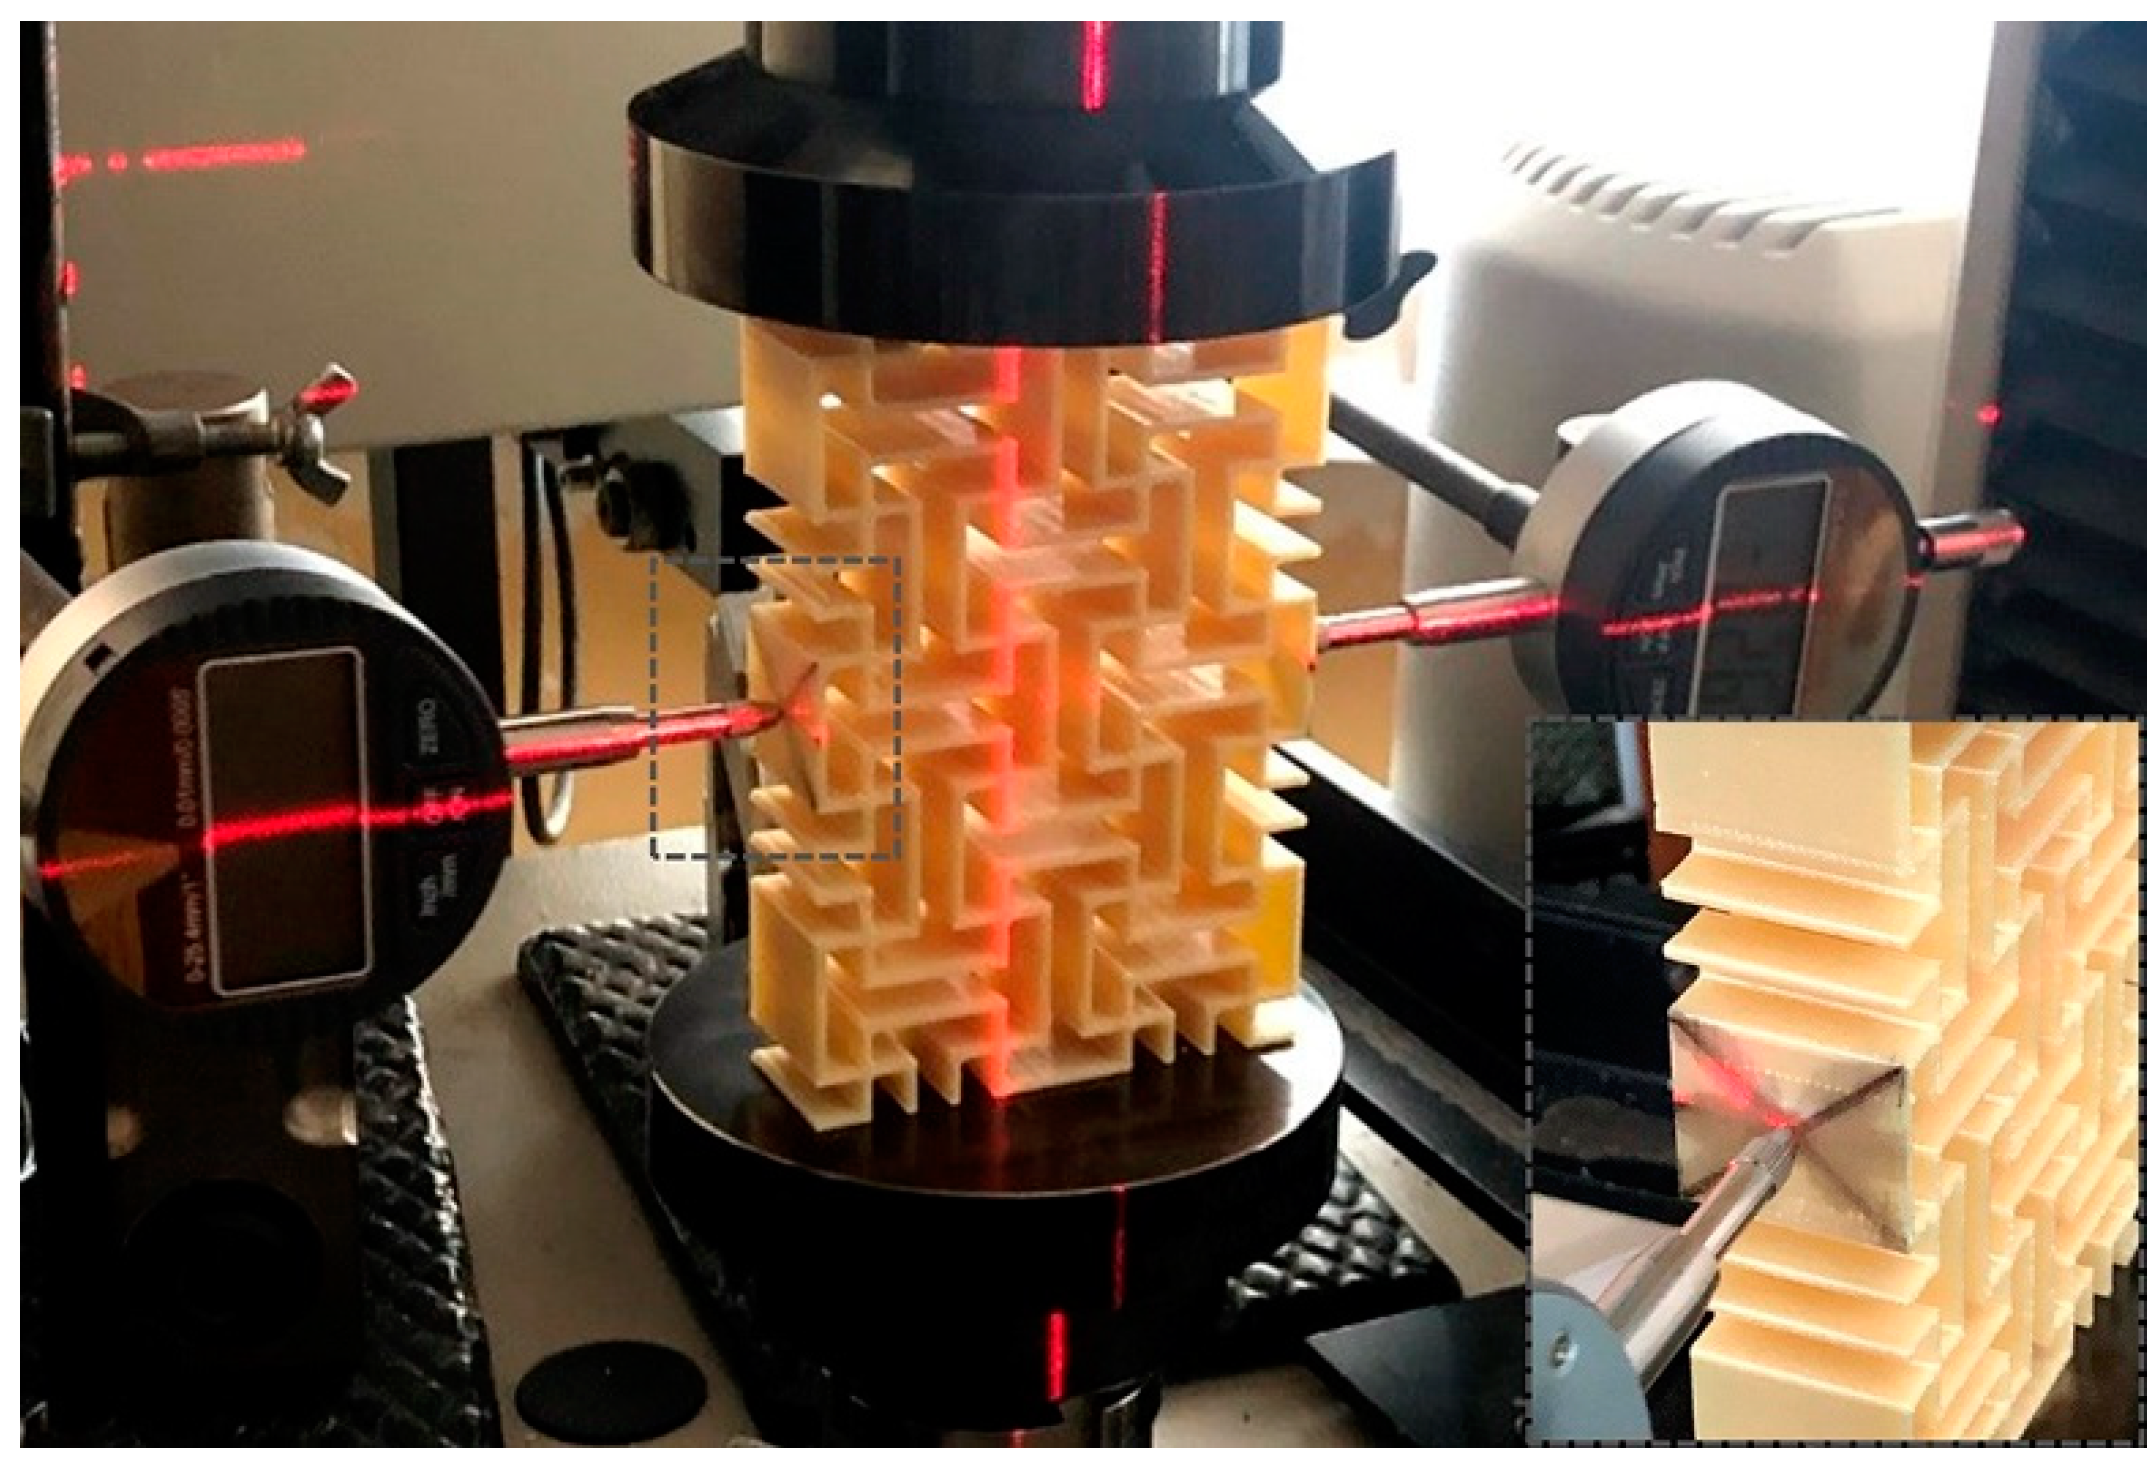
2.4. Quasi-Static Compression Experiments

Uniaxial quasi-static compressive tests were conducted using an MTS Criterion 43 machine equipped with a 50 kN load cell at a constant speed of 0.5 mm/s. The samples were compressed to densification along the Y direction, and the displacement and force data in the Y direction were recorded by the machine. To calculate Poisson’s ratio, the lateral displacement was measured using two digital indicators rigidly fixed on tripods, as shown in Figure 4. The indenter of each digital indicator was in close contact with the specimen’s side surface using a specialized tip, and a laser level meter was employed to ensure proper alignment of the digital indicator bars.

3. Results

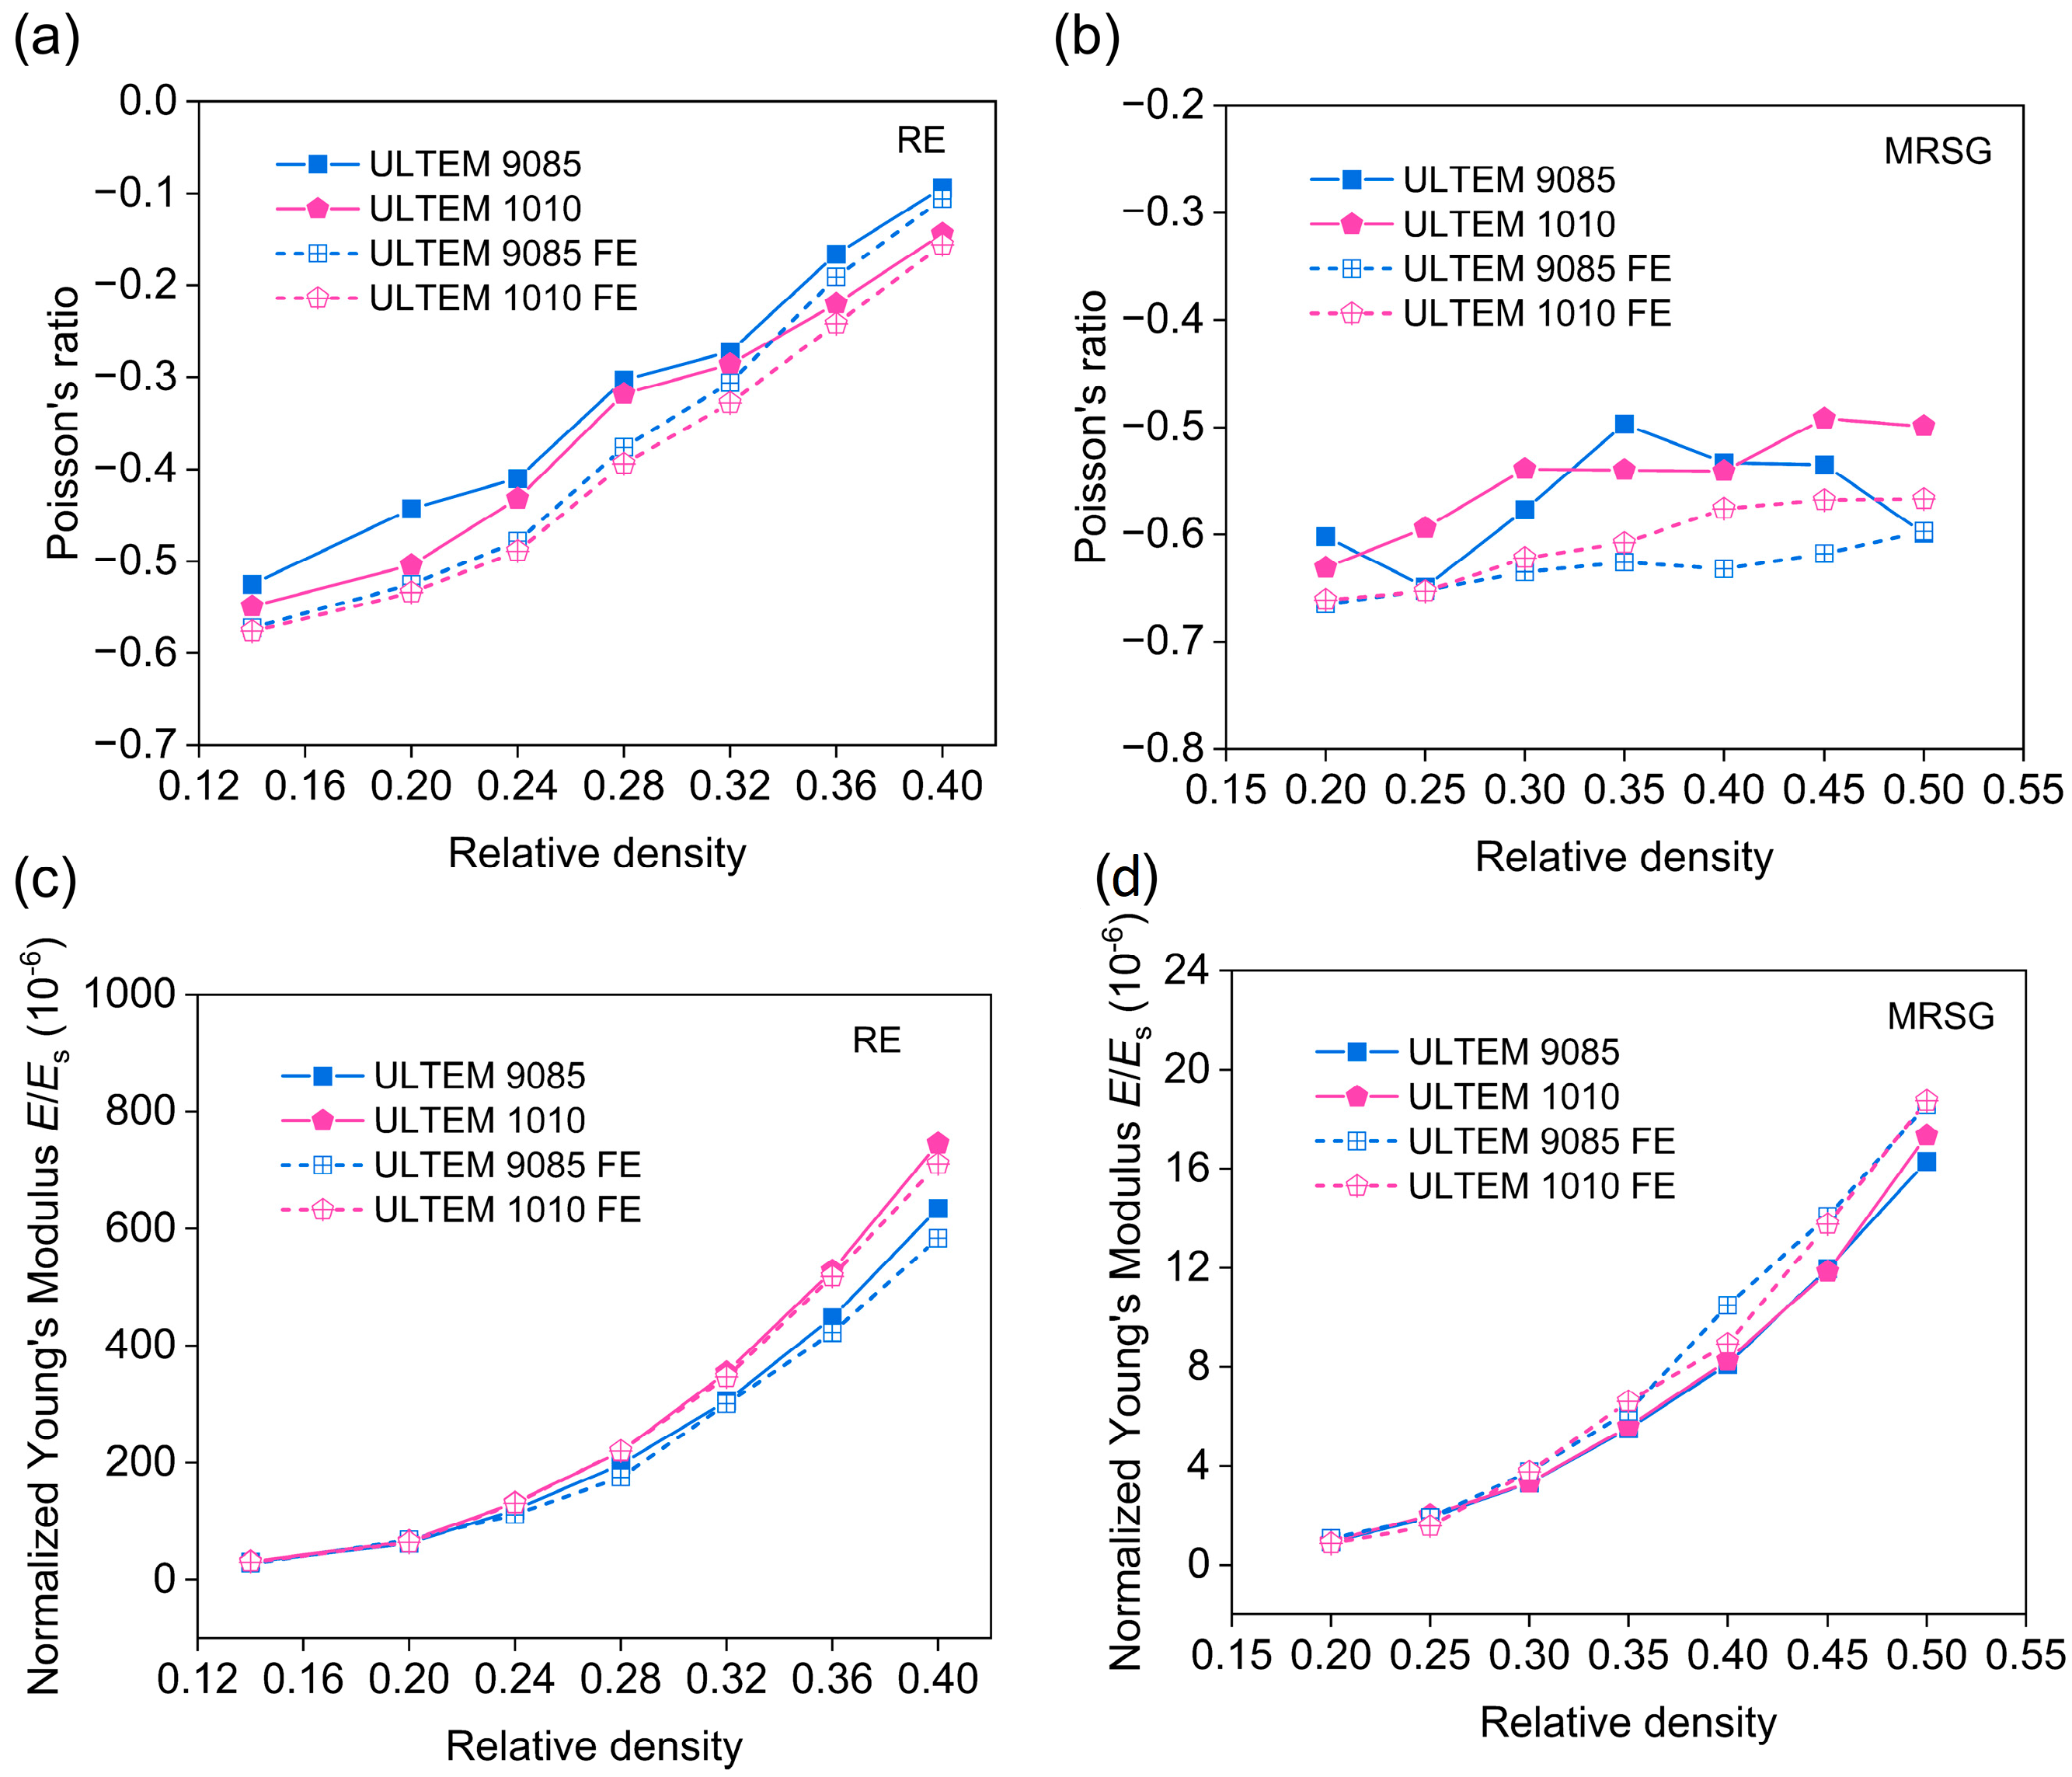
3.1. Poisson’s Ratio and Equivalent Young’s Modulus

The Poisson’s ratios of RE and MRSG auxetic structures fabricated from ULTEM 9085 and ULTEM 1010 were determined by plotting the relative longitudinal strain against the relative transverse strain, performing linear fitting, and taking the negative slopes as the Poisson’s ratio. The simulated Poisson’s ratio was obtained by adding probes at the midpoint of the model’s sides (the same position as the digital indicators) to record the longitudinal and transverse displacements. The experimental and simulated results of the Poisson’s ratios for RE and MRSG structures of different materials against their relative densities are shown in Figure 5a,b. The equivalent Young’s moduli during the elastic deformation stage were also studied, as shown in Figure 5c,d.

3.2. Deformation Behavior

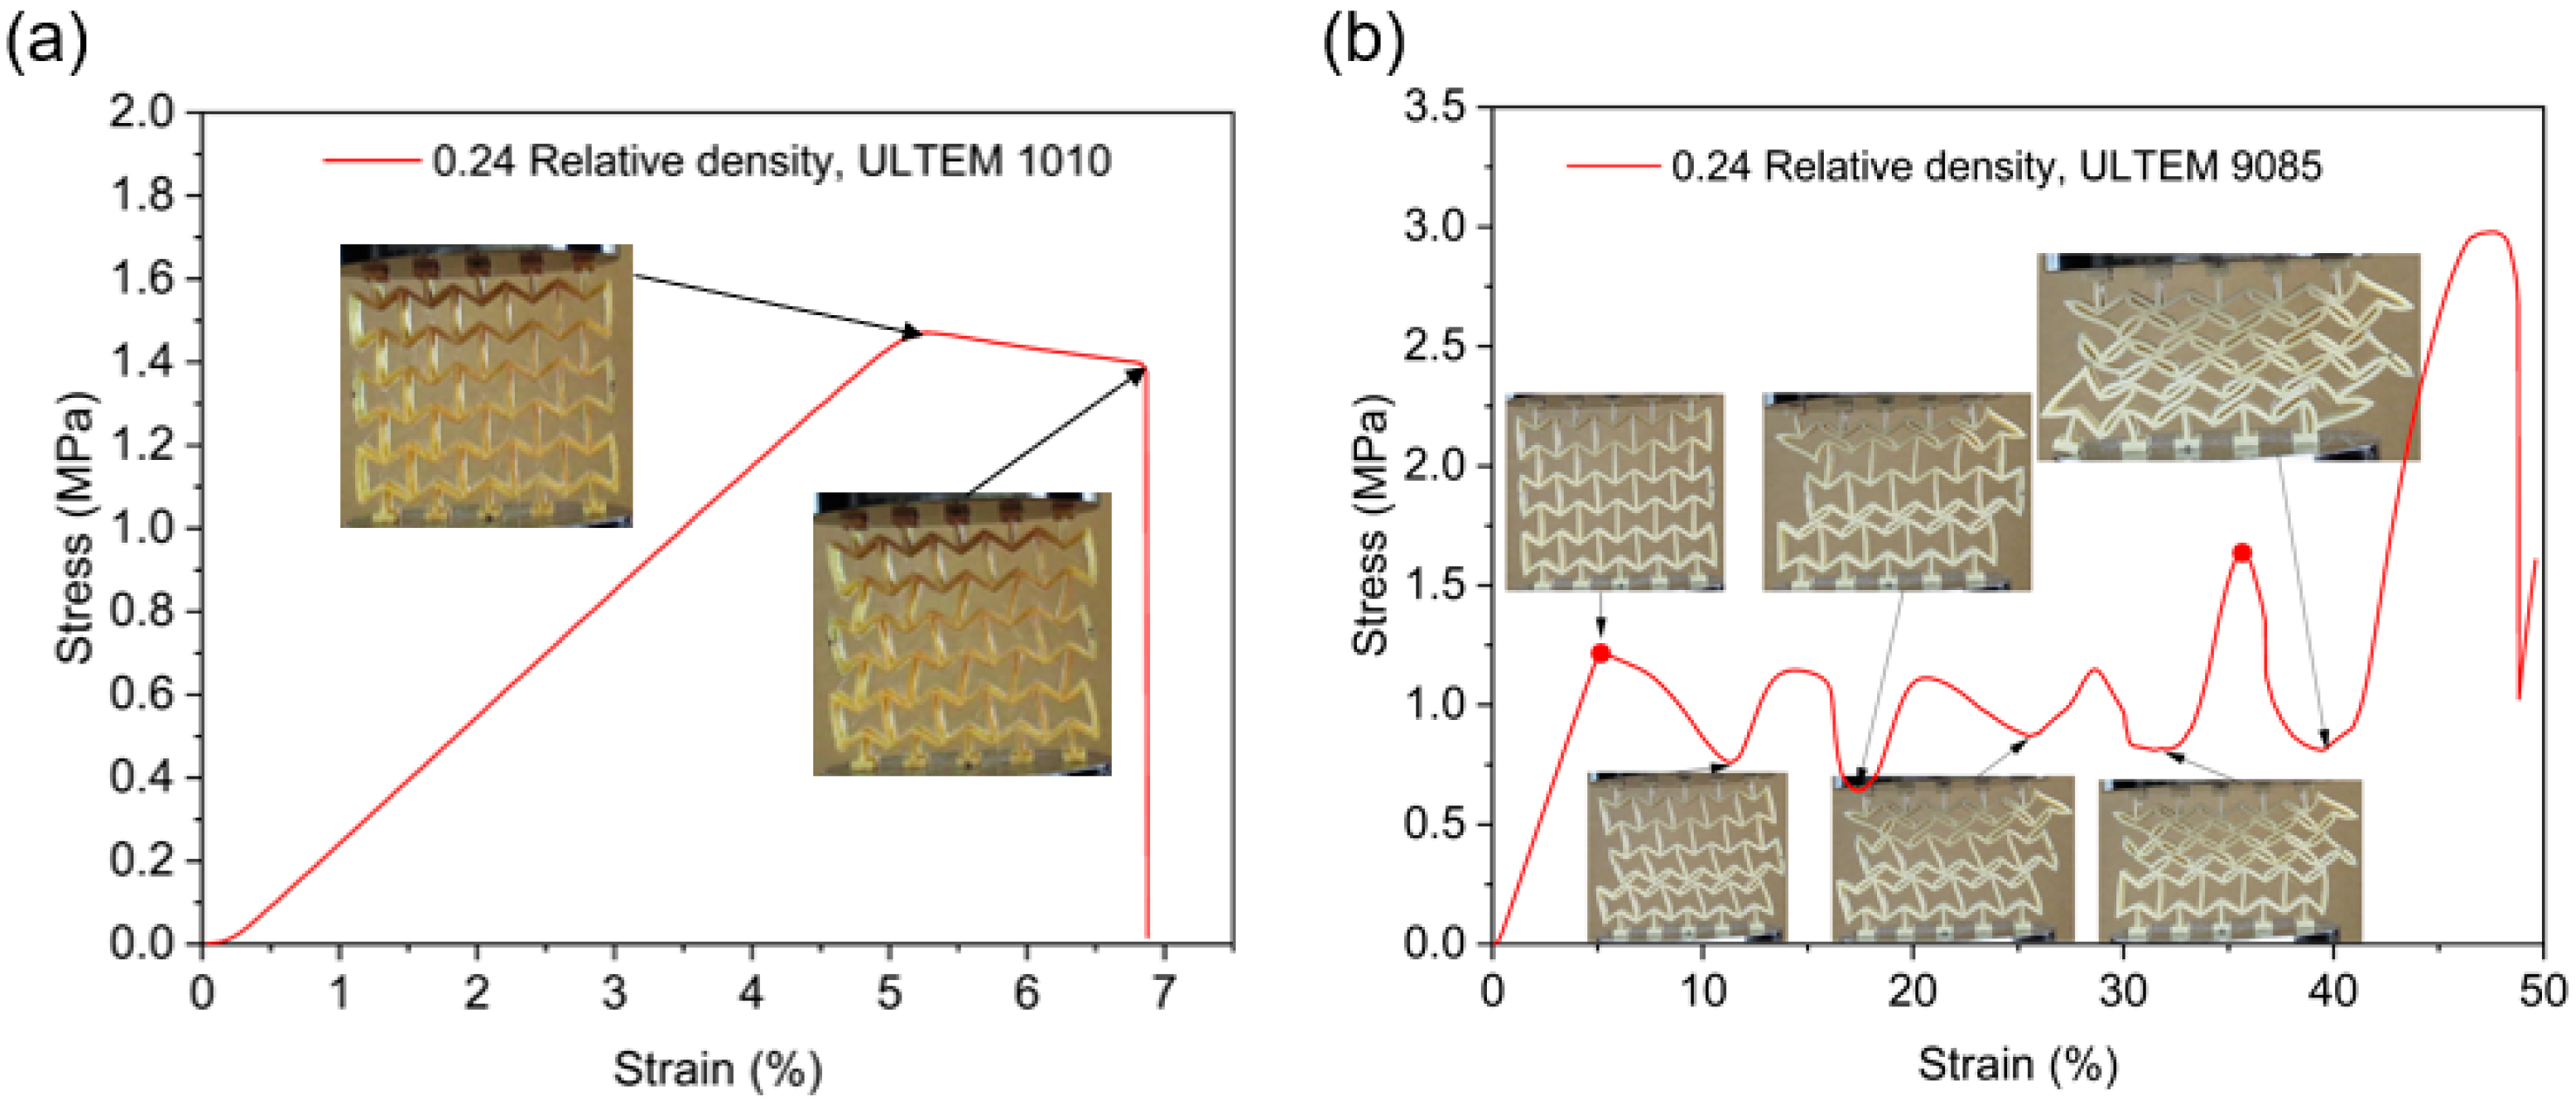
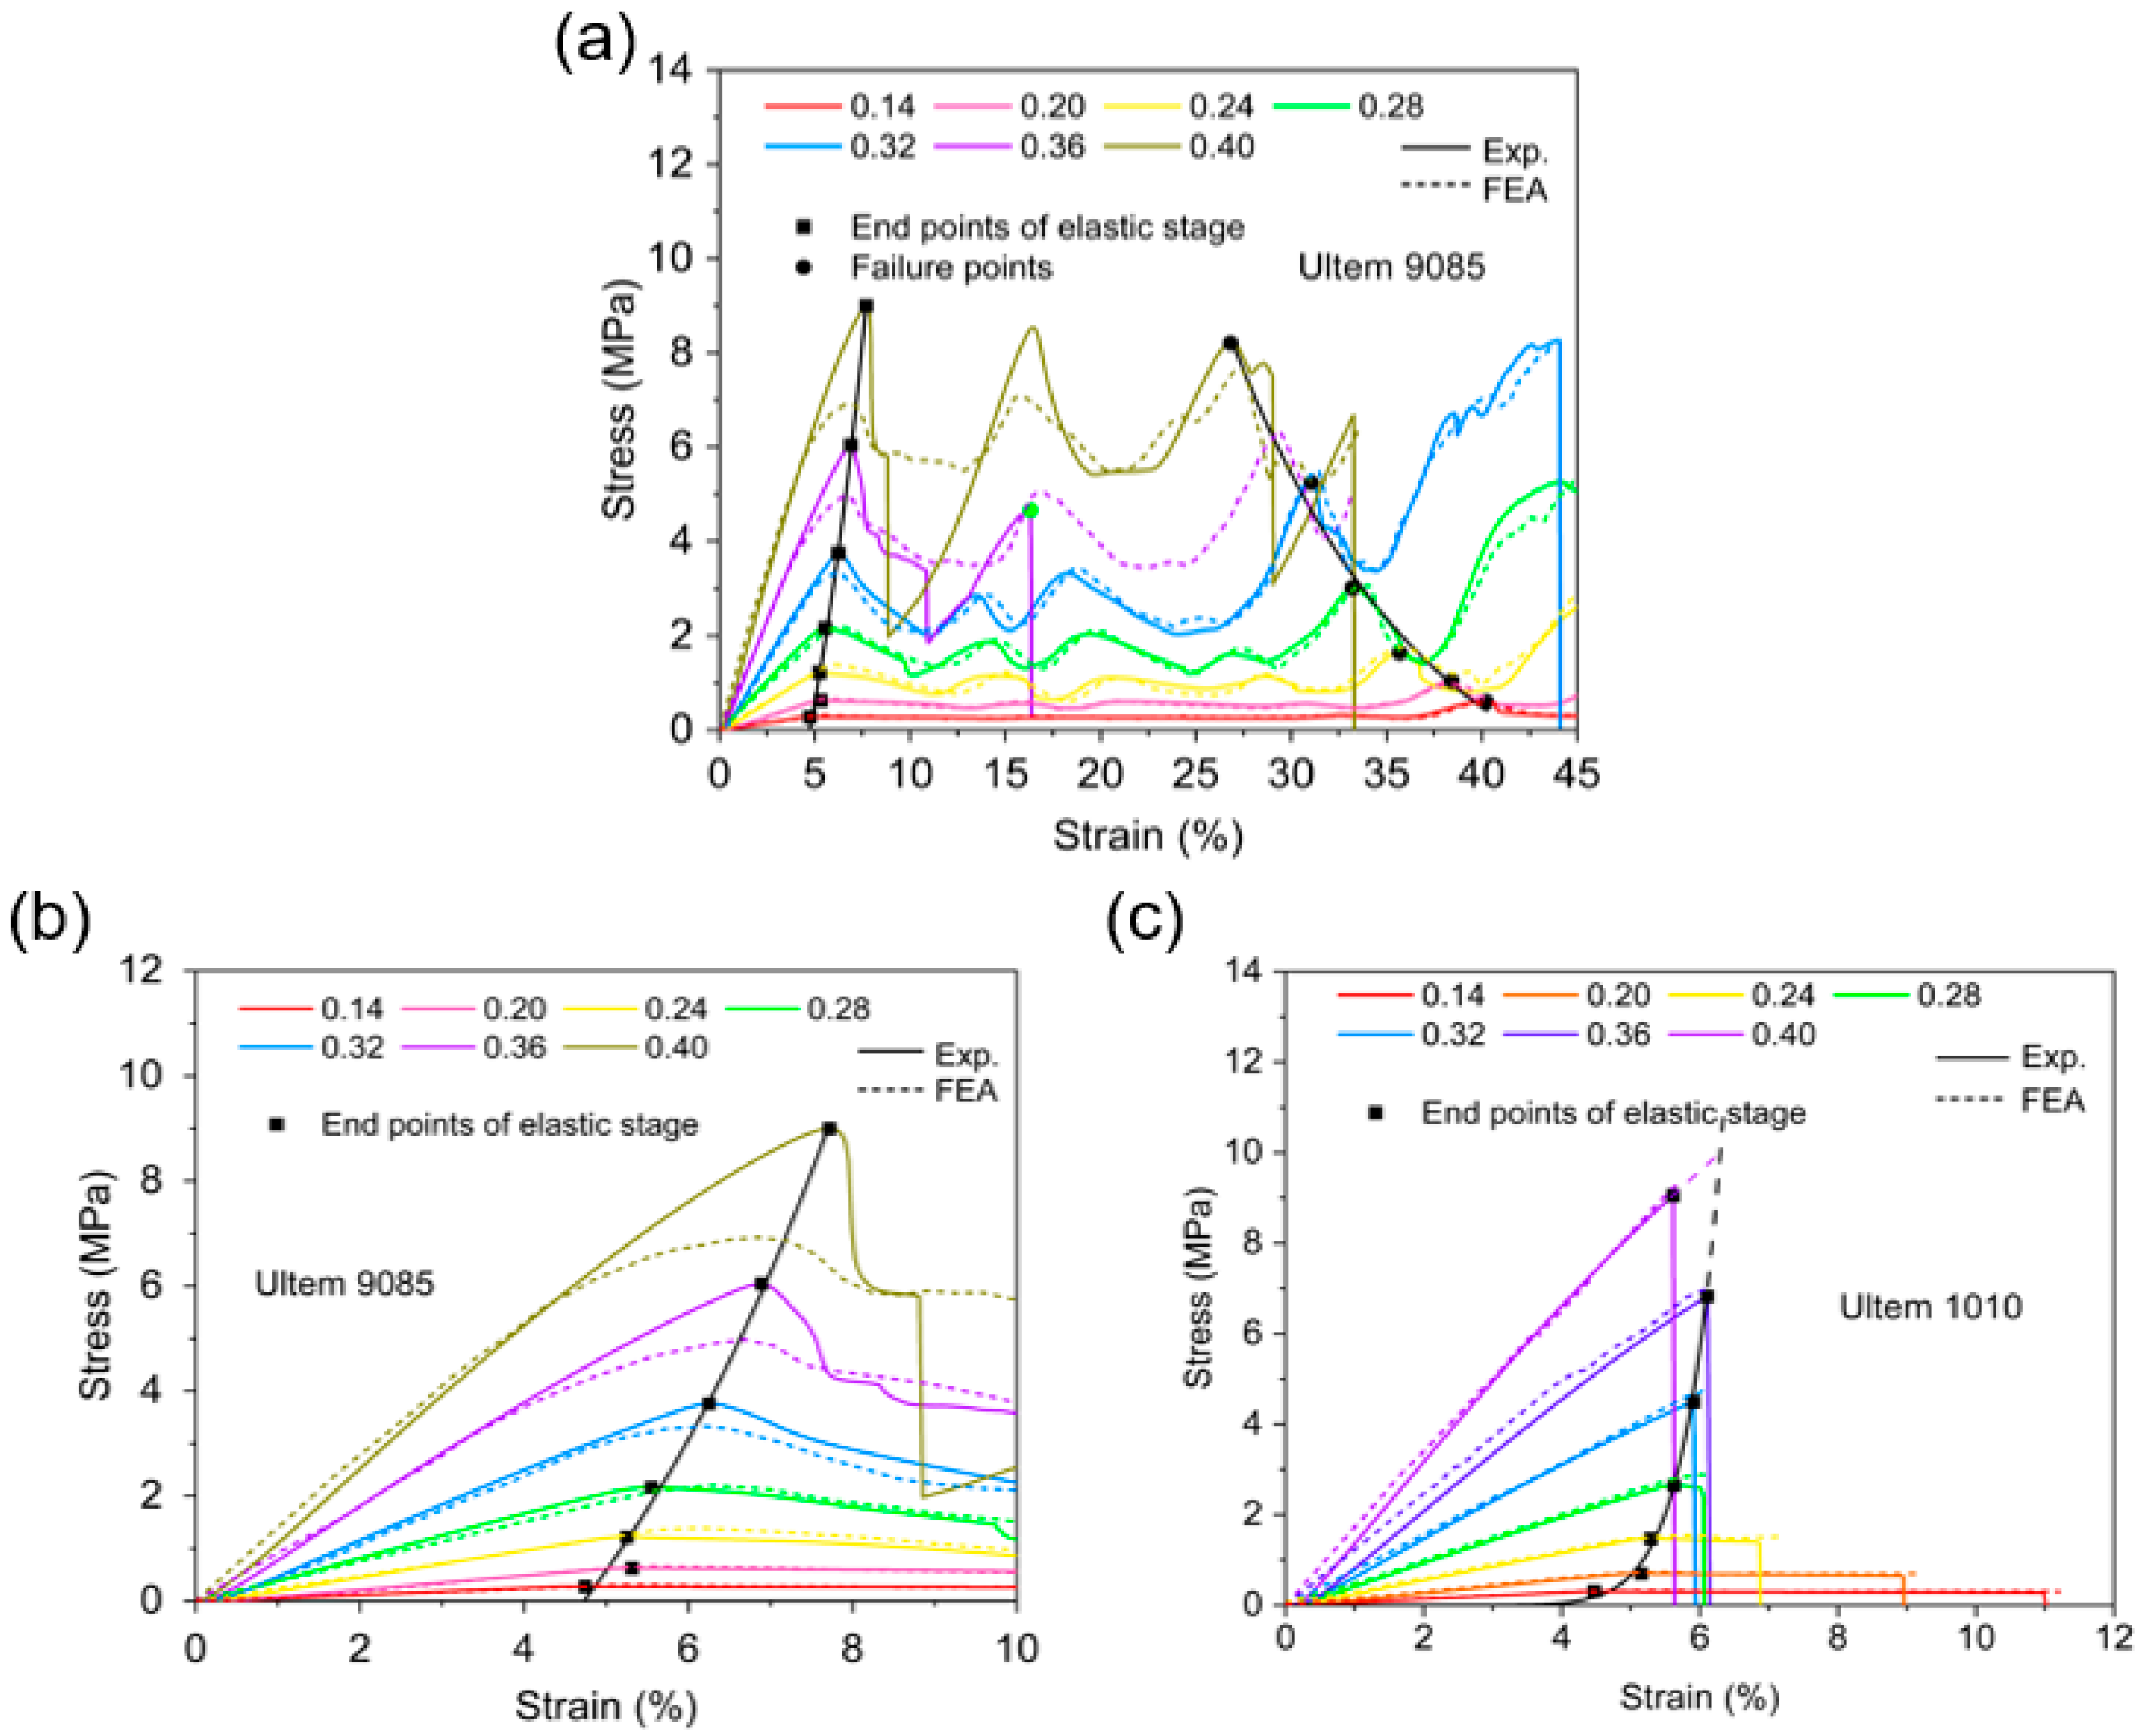
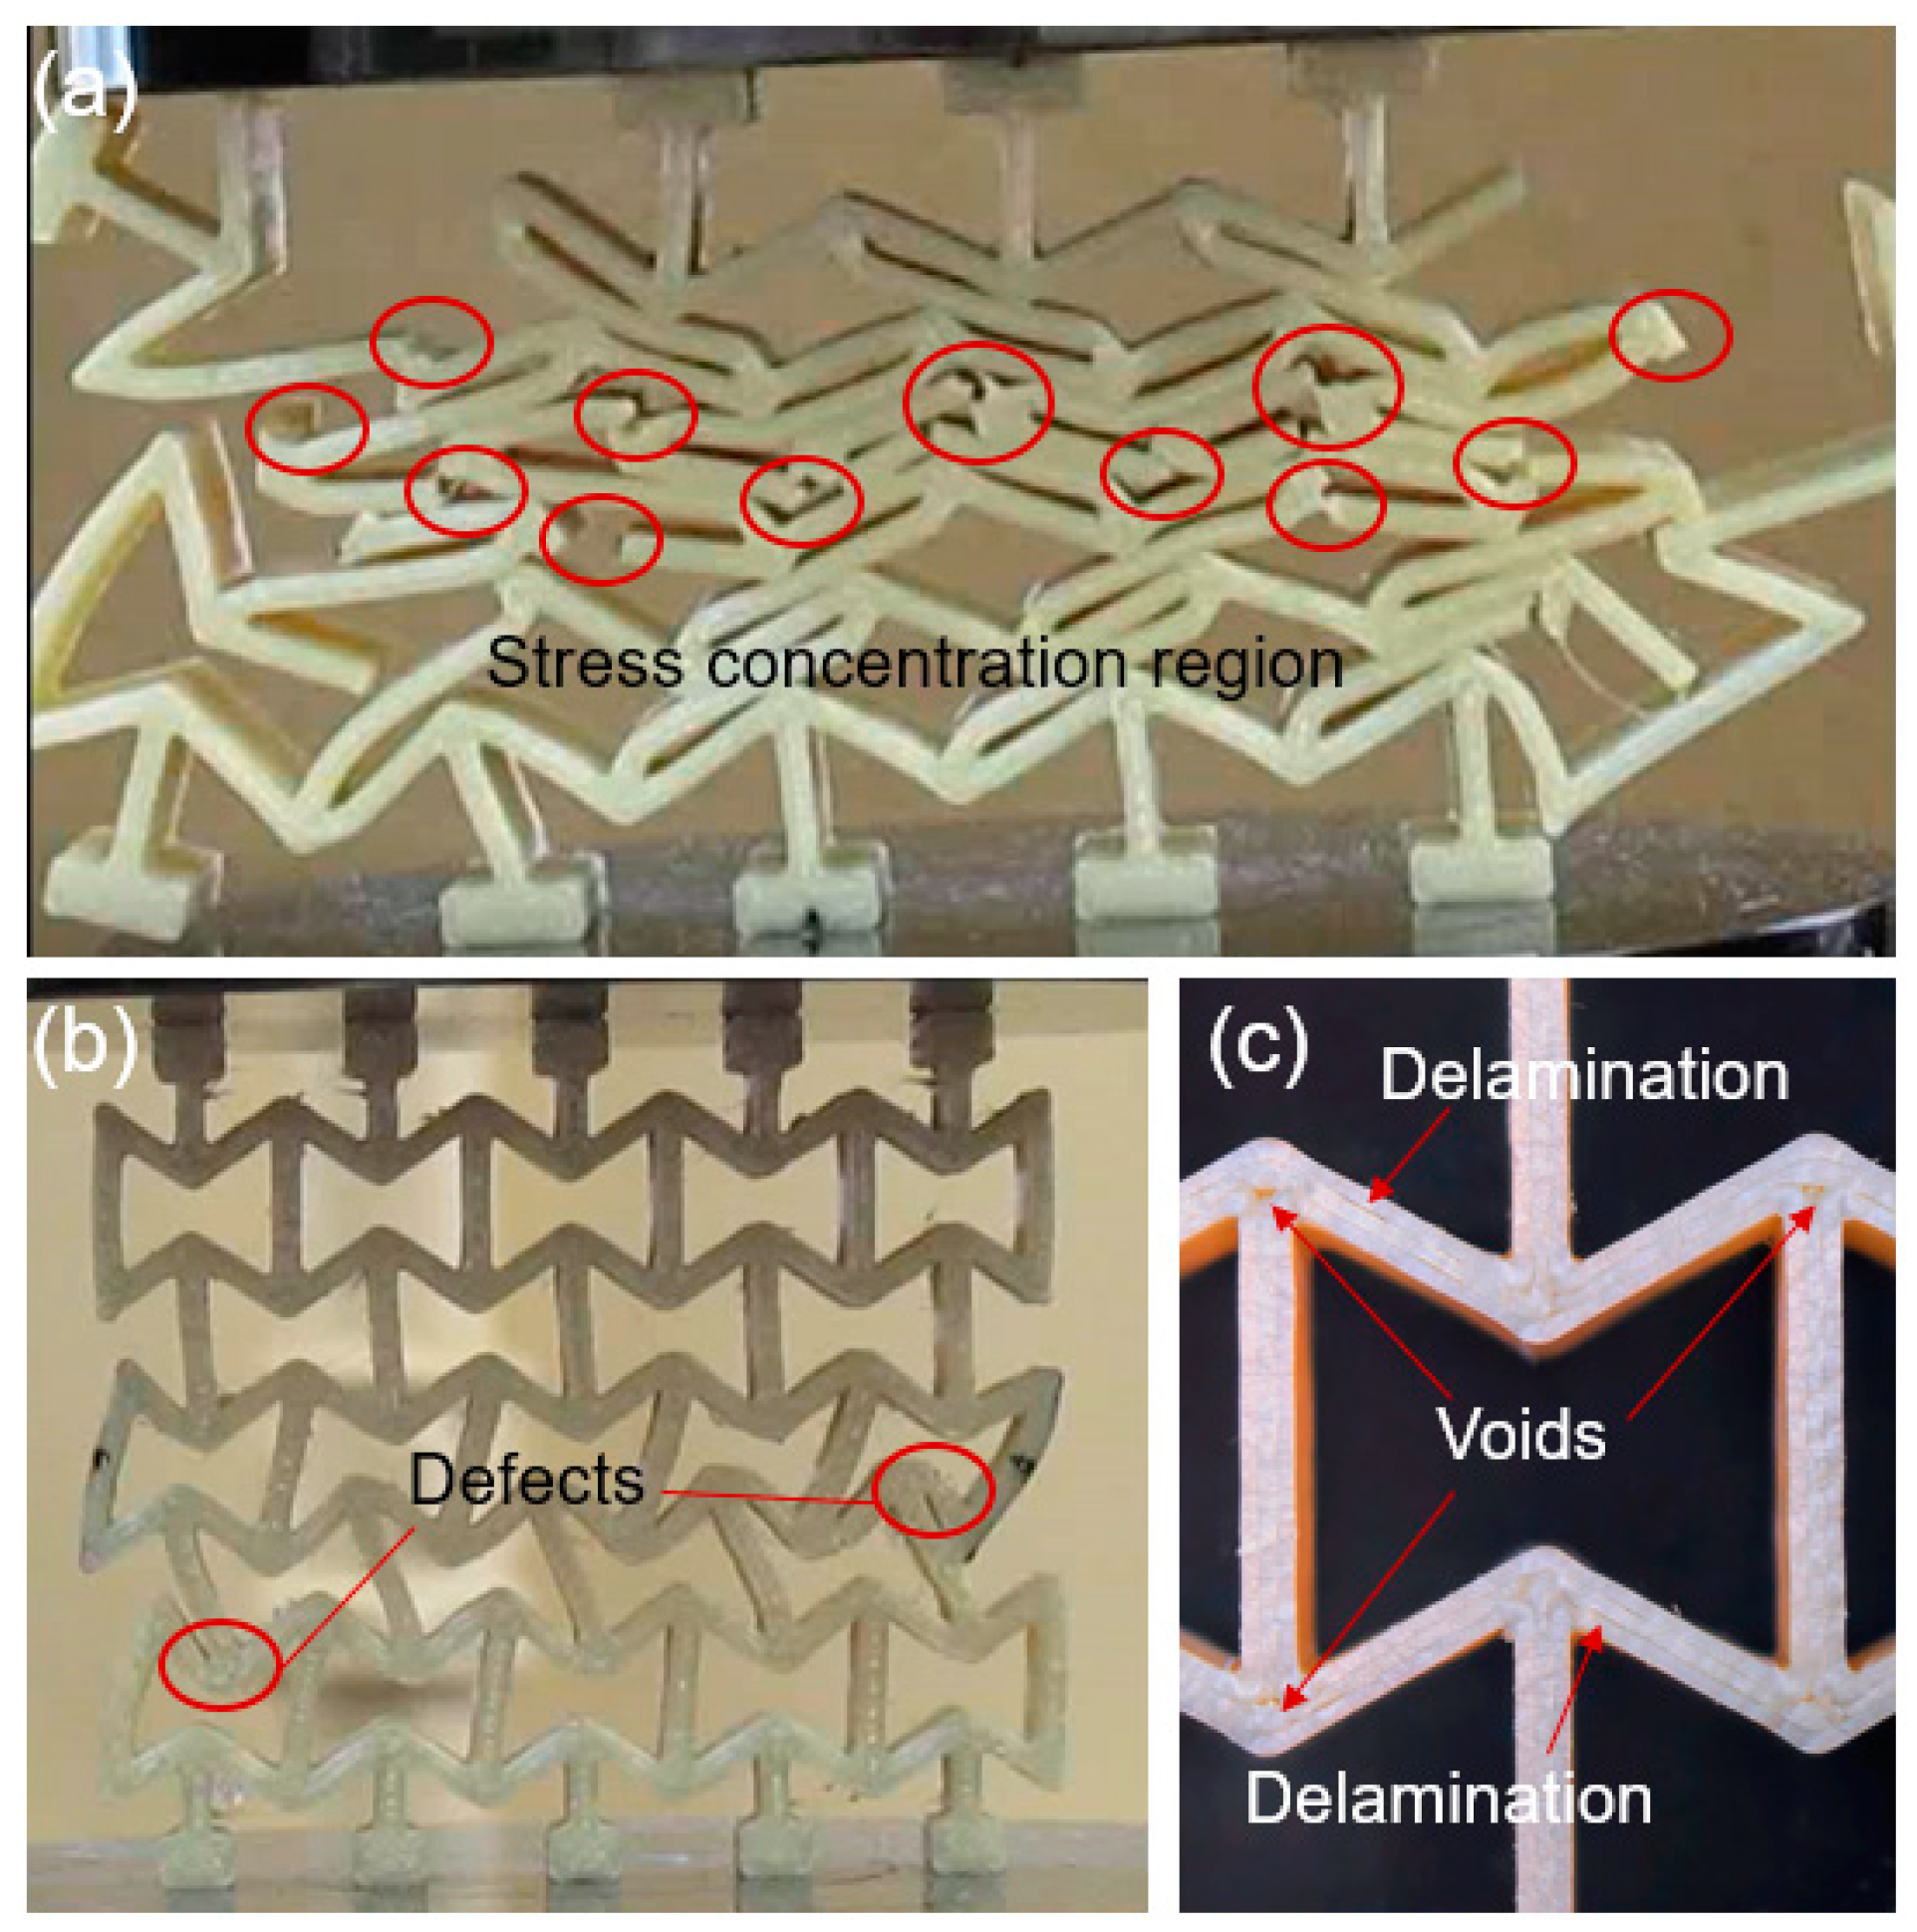
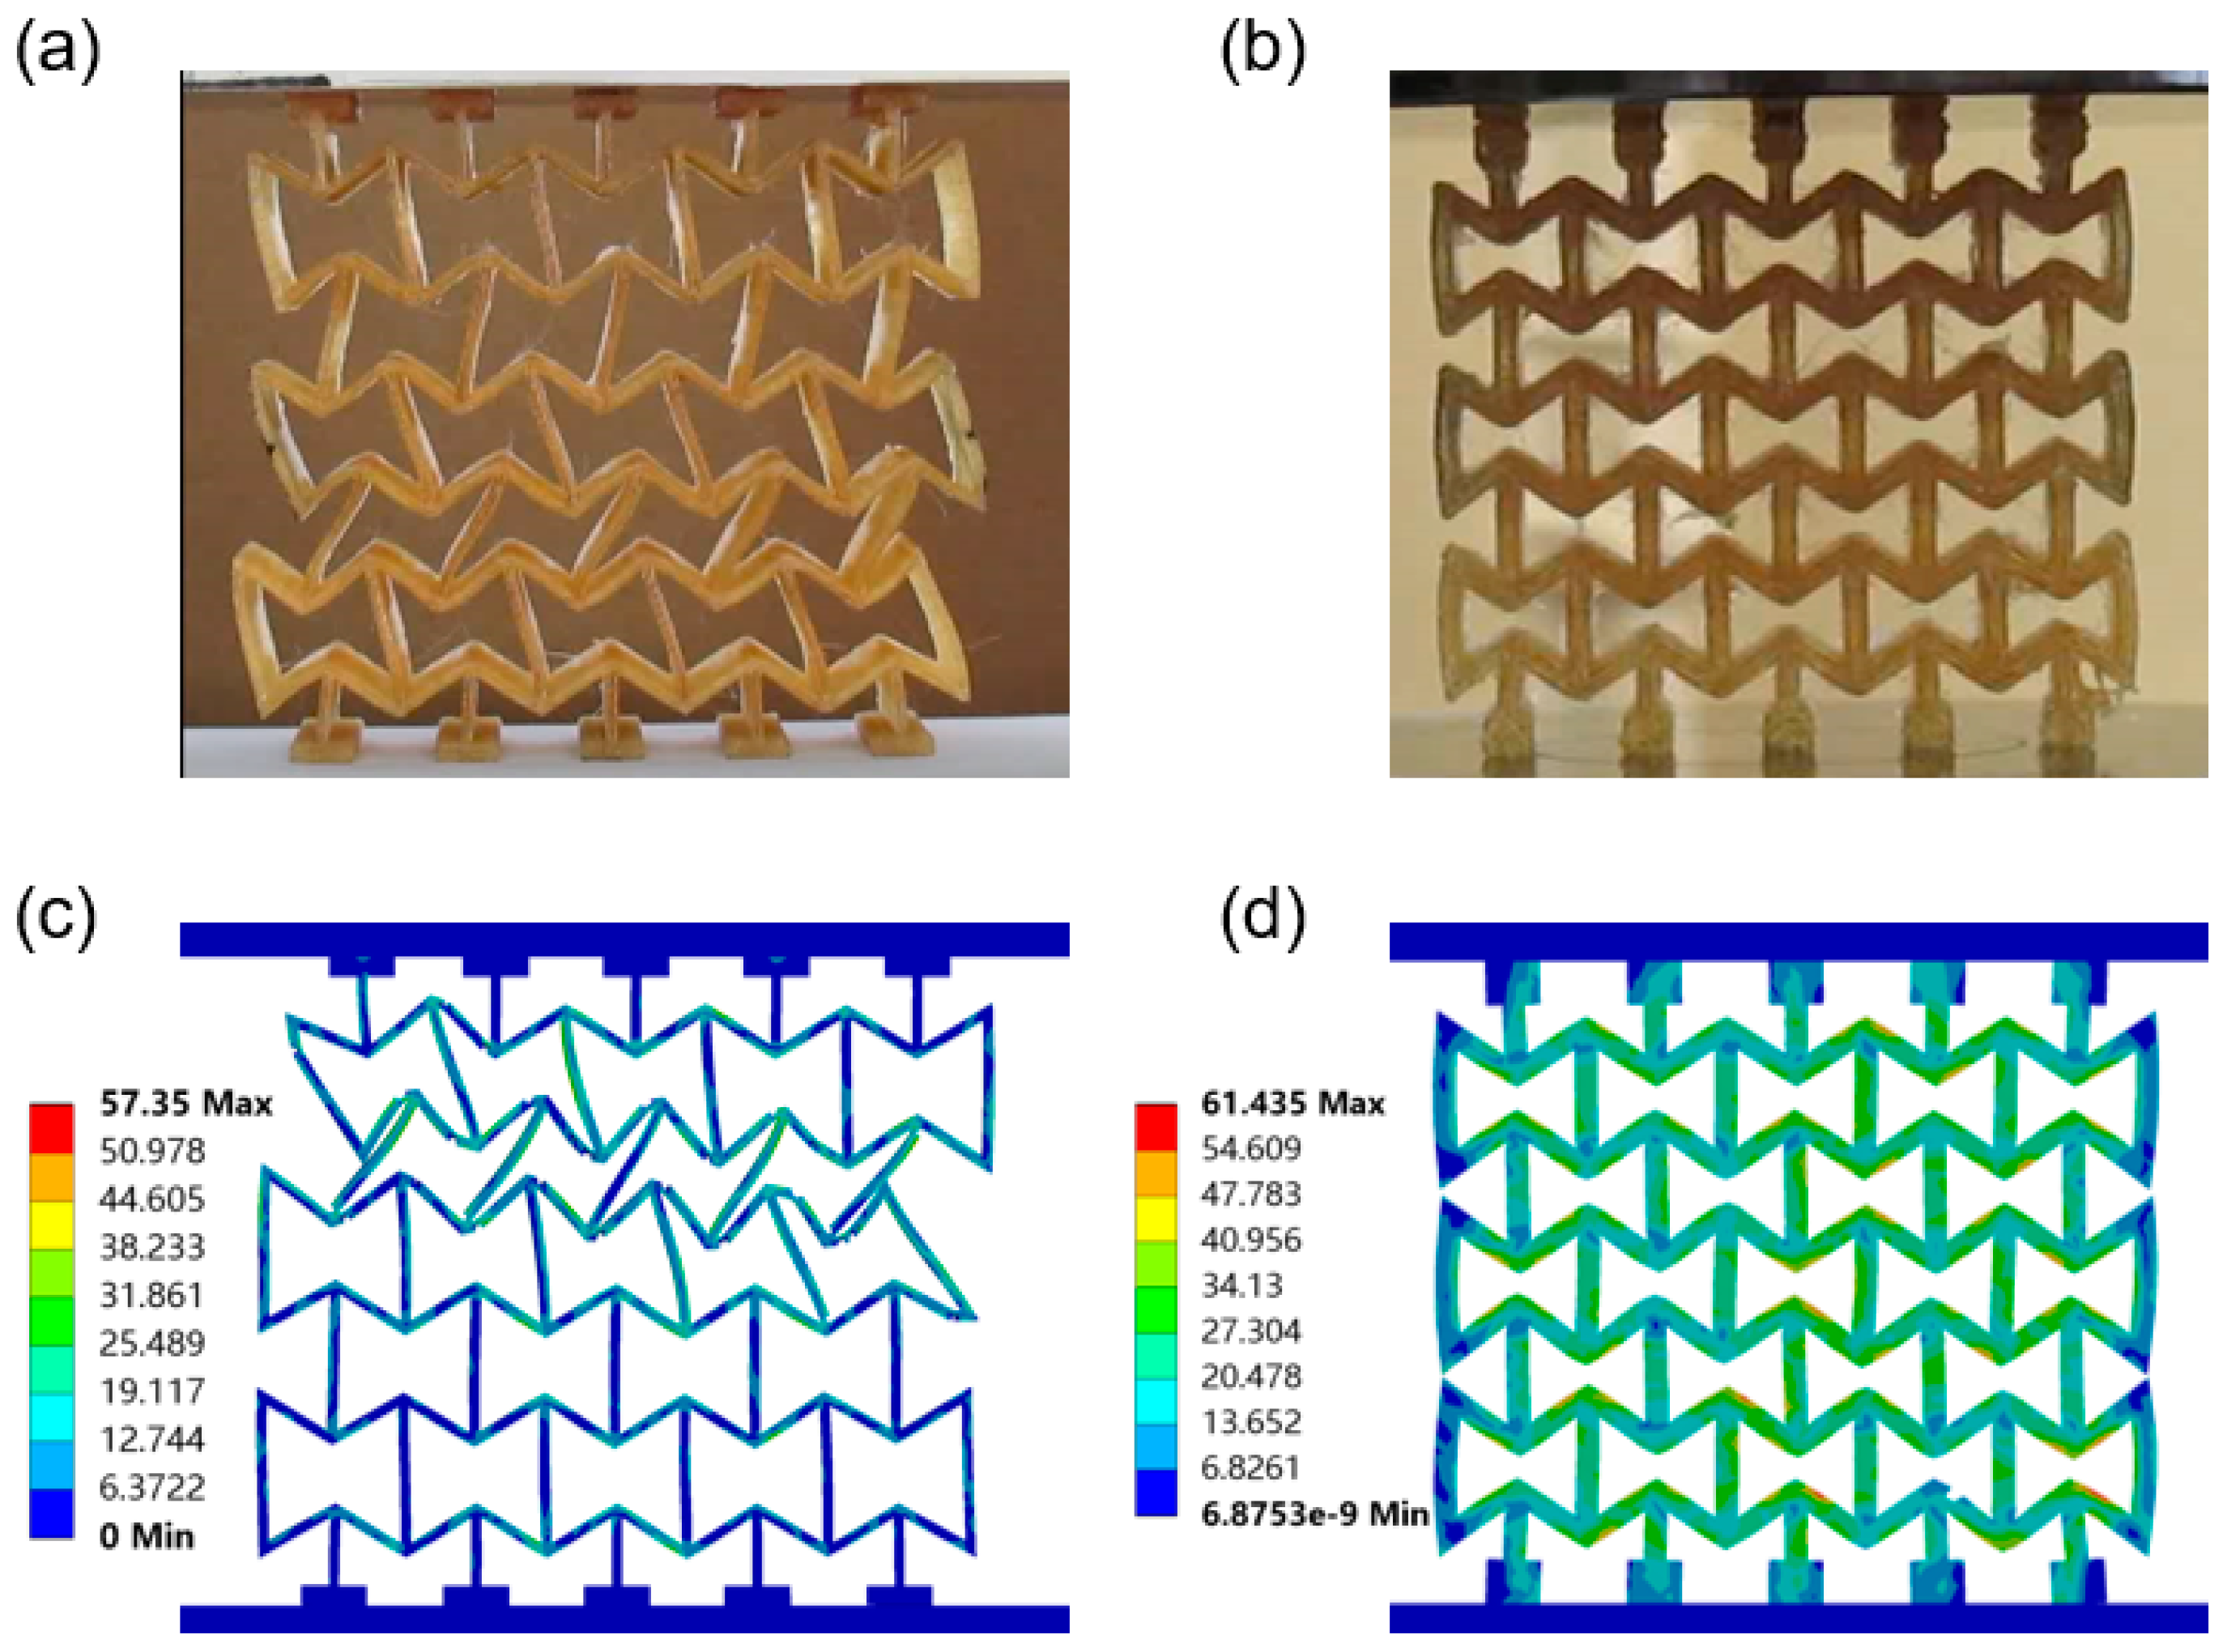
3.2.1. RE Structures

During the compression process of the samples, the deformation videos were recorded using a camera and analyzed in conjunction with the stress–strain curves. Figure 6a,b show the stress–strain curves and deformation photos at typical points for RE structures with a relative density of 0.24, prepared from different ULTEM materials.
Figure 7a,c present the experimental and simulated stress–strain curves of ULTEM 1010 and ULTEM 9085 RE structures under uniaxial compressive loading at various relative densities. Figure 7b exhibits the elastic stage curves of ULTEM 9085 RE structures.
Figure 8 presents the experimental and simulated deformation behavior of ULTEM 9085 RE structures, enabling a comparison of the deformation behavior between low- and high-relative-density cases.
Figure 9a shows a photo of a ULTEM 9085 structure after densification and damage. Figure 9b shows the case of a 0.36 relative density ULTEM 9085 RE structure, which had defects embedded in the intersection area during the additive manufacturing process. This phenomenon can be more clearly observed in Figure 9c. During the printing process of the RE structures, the re-entrant intersection serves as discontinuity points in material deposition, where incomplete material filling frequently occurs, leading to the formation of void defects. In addition to void defects, inadequate bonding between adjacent deposition contours may also result in delamination defects.
Figure 10a,b display experimental deformation images before the final fracture of the ULTEM 1010 RE structures at relative densities of 0.20 and 0.40, and Figure 10c,d show the simulated final damage images.

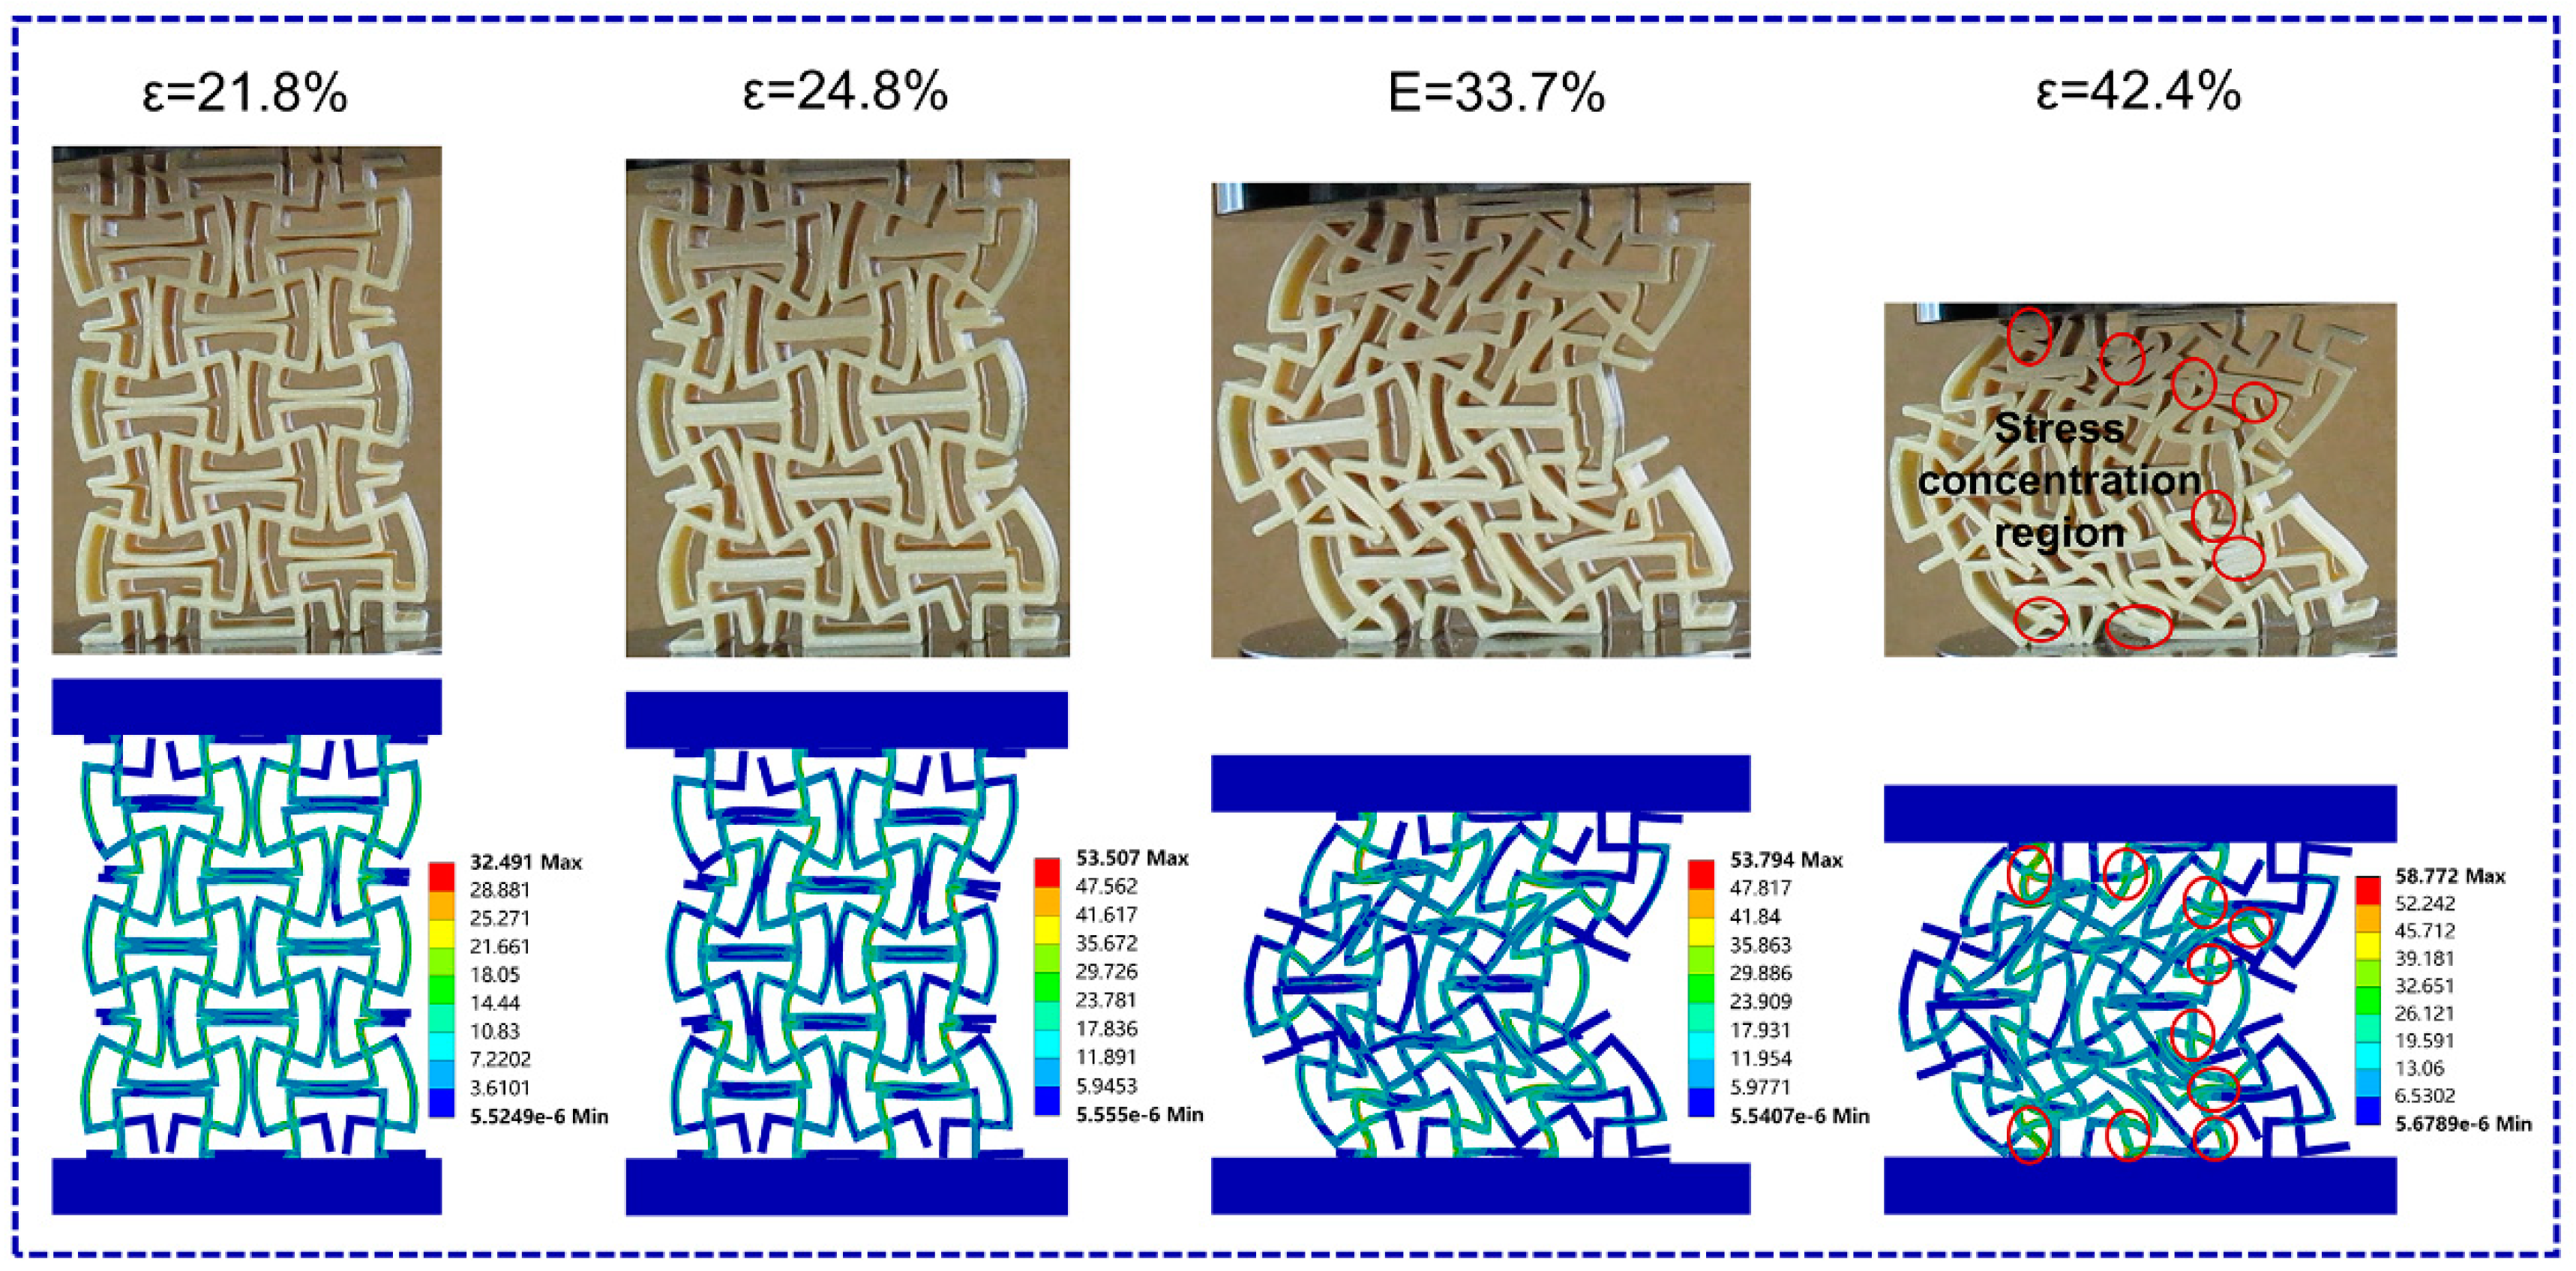
3.2.2. MRSG Structures

Figure 11a,b display the deformation processes of MRSG structures with ULTEM 1010 and ULTEM 9085 at a relative density of 0.20, respectively.
Figure 12a,b shows the experimental and simulated stress–strain curves of ULTEM 1010 and ULTEM 9085 MRSG structures under uniaxial compressive loading at various relative densities.
Figure 13 shows the experimental deformation photos of the ULTEM 9085 MRSG structure at a relative density of 0.30, along with the simulation results. Figure 14 demonstrates the damage mechanism of the ULTEM 1010 MRSG structure.

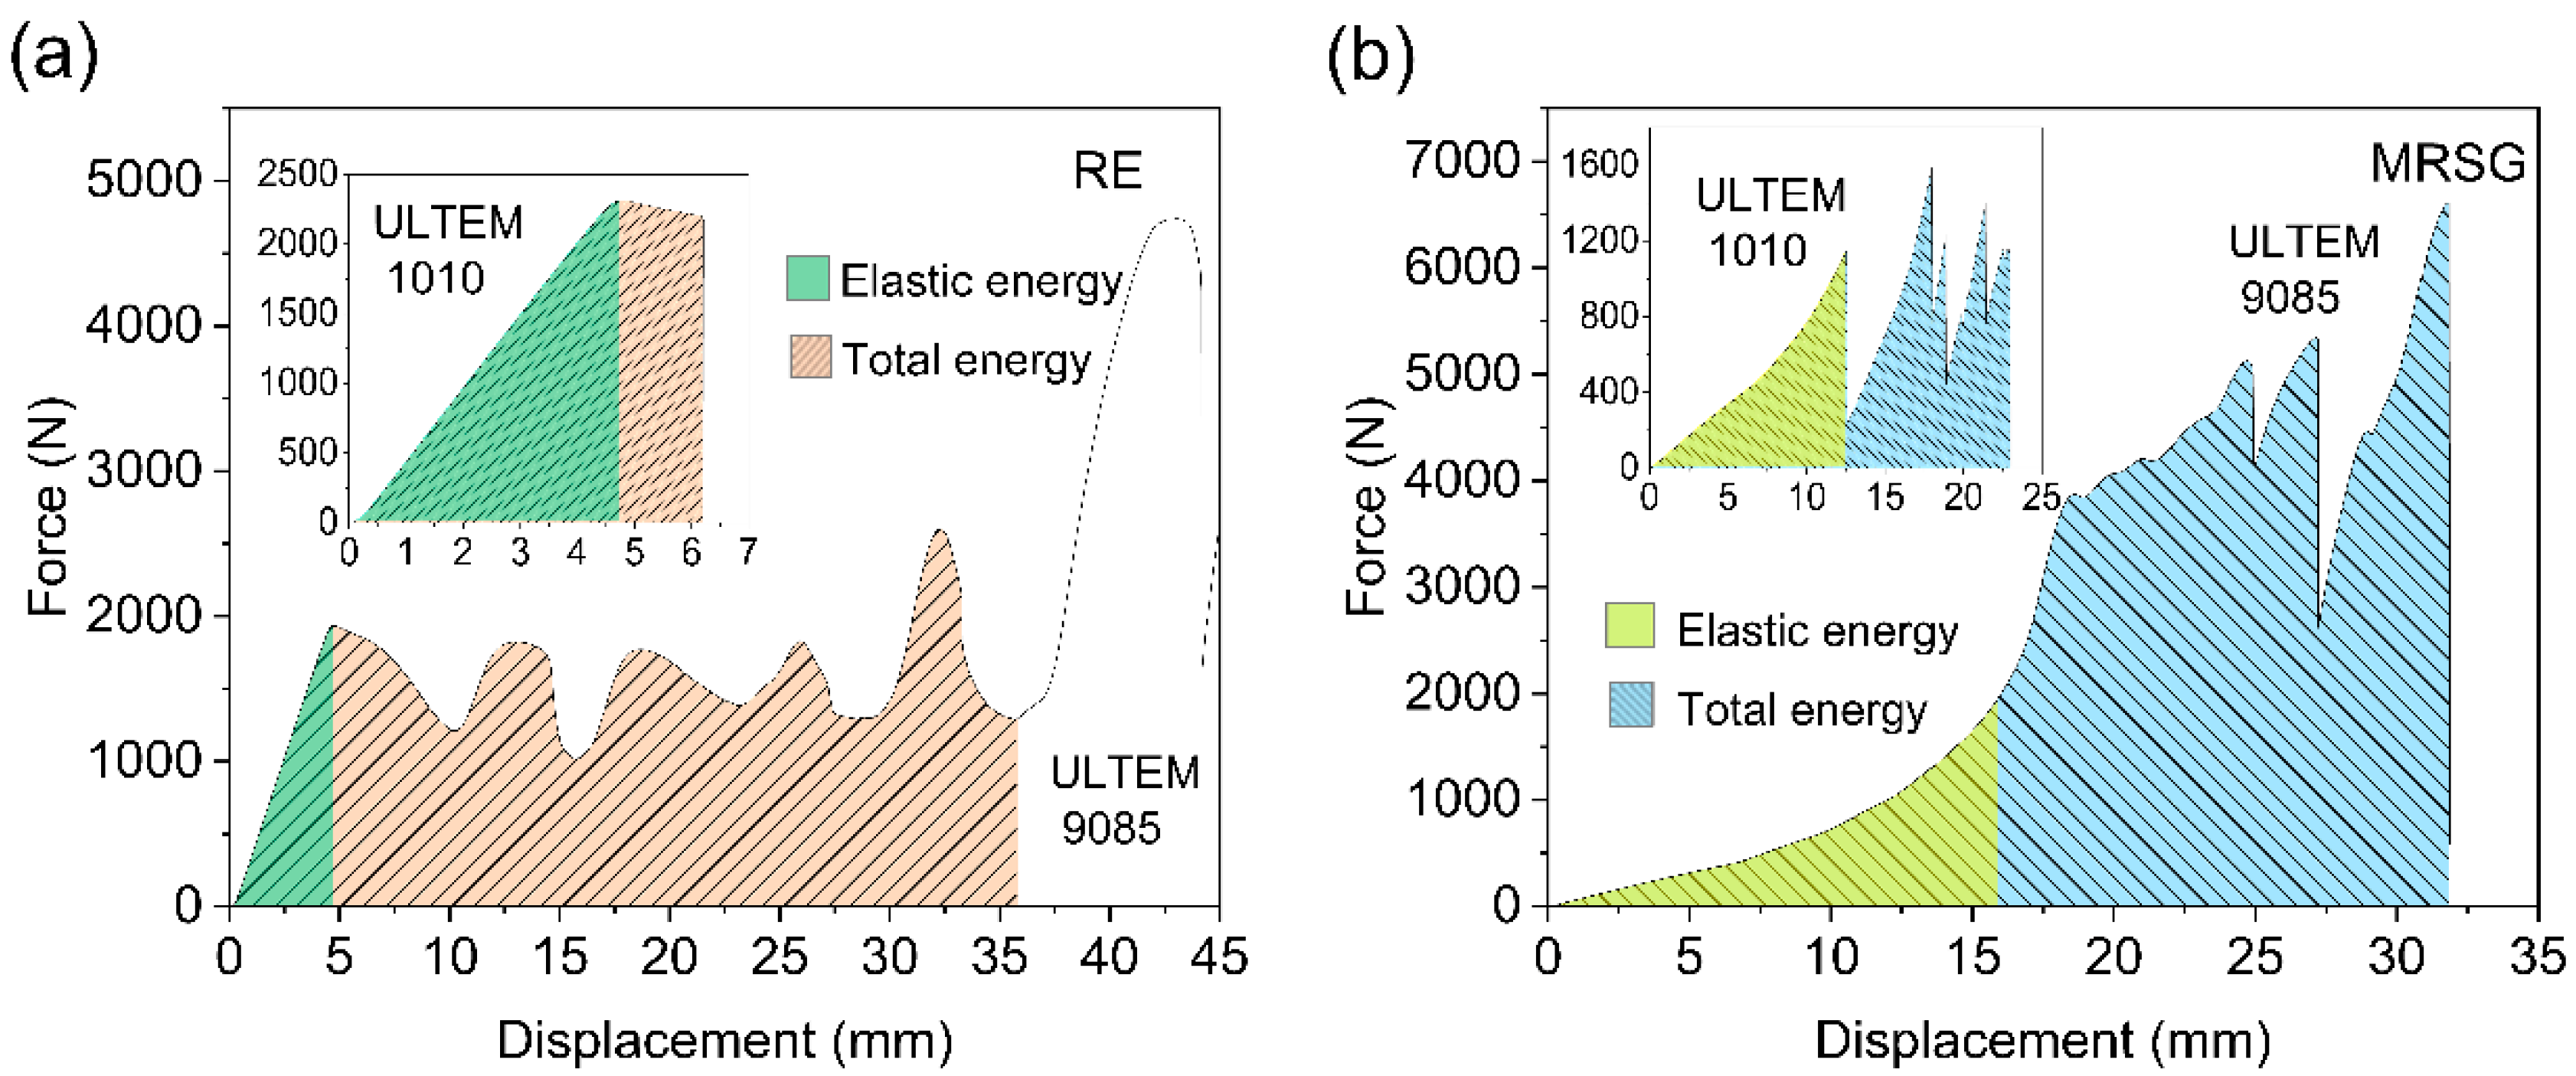
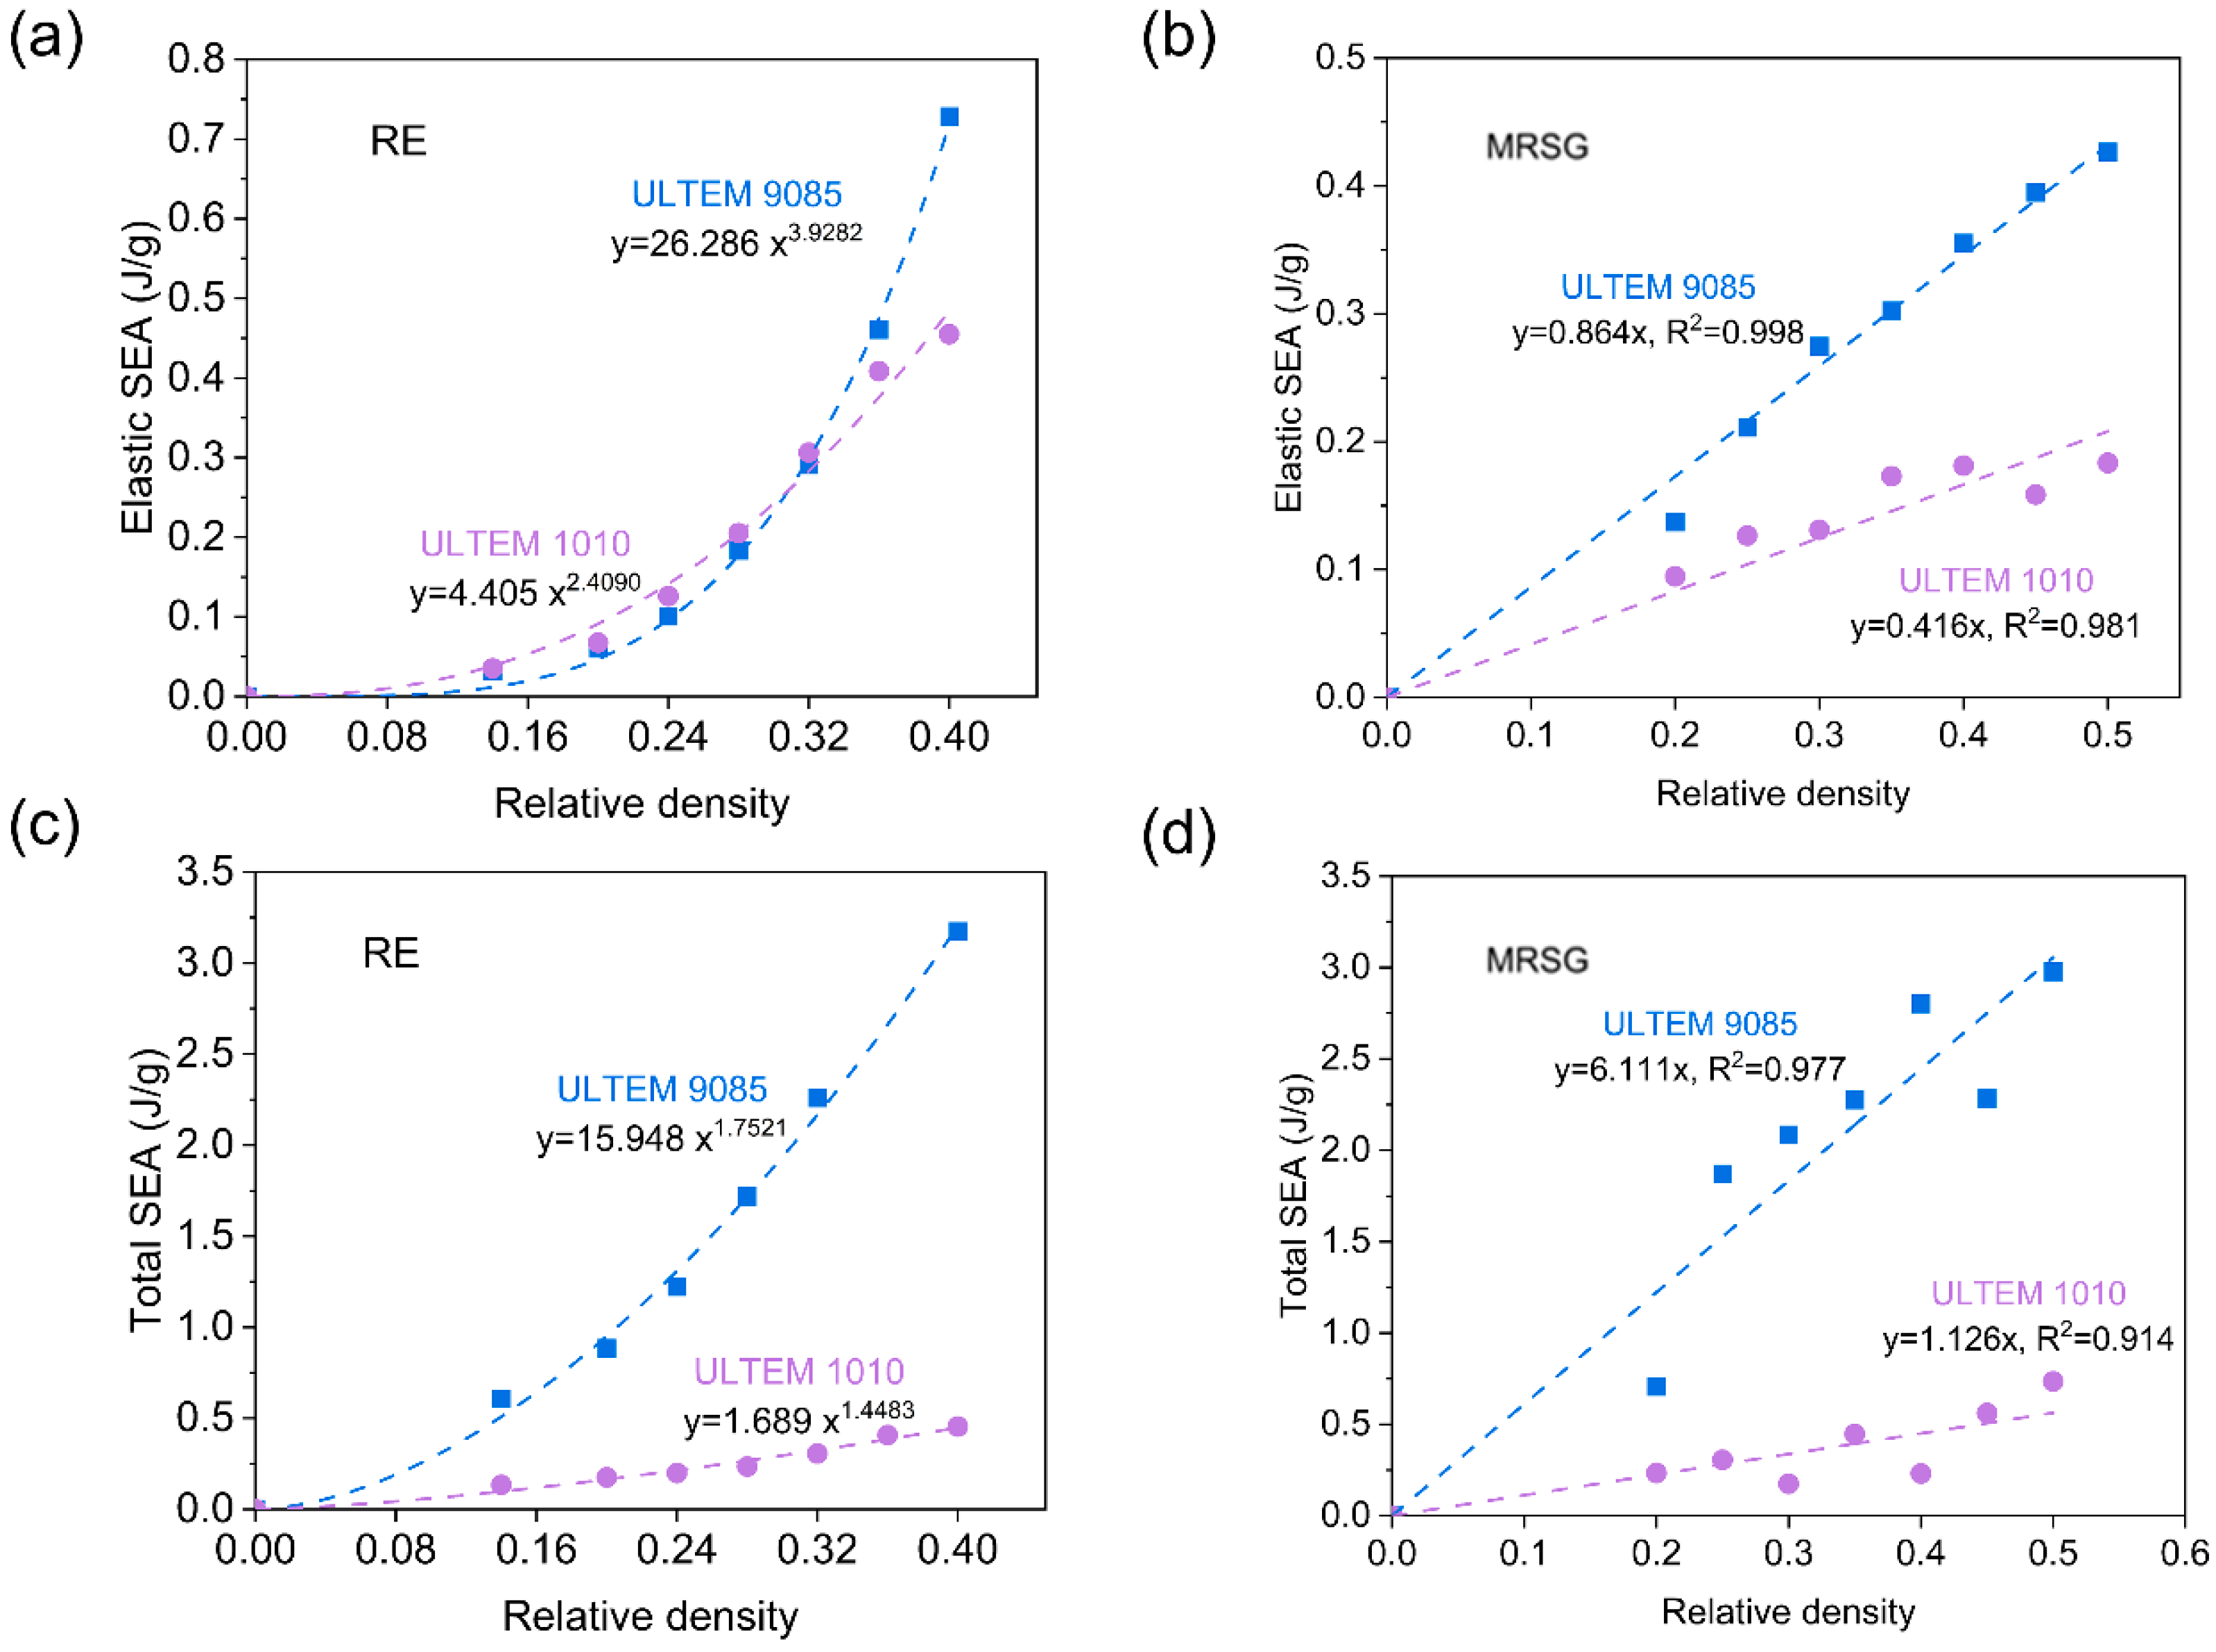
3.3. Energy Absorption

By integrating the force–displacement curves of auxetic structures, their energy absorption performance can be determined. As shown in Figure 15, the area under the curve during the elastic deformation stage represents the elastic energy absorption, while the area under the curve before densification or failure represents the total energy absorption. The specific energy absorption (SEA) was calculated by dividing the energy by the mass of the auxetic structure. Figure 16a–d show the SEA results of RE and MRSG structures with different materials.
Figure 17 illustrates a summary of the SEA performance of additively manufactured re-entrant and modified re-entrant structures from the literature [48,49,50,51,52,53,54,55].

4. Discussion

4.1. Poisson’s Ratio and Equivalent Young’s Modulus

Poisson’s ratio is defined as the negative of the ratio of lateral strain to the axial strain when a material is subjected to uniaxial tension or compression. Poisson’s ratio is typically a positive value, but auxetic structures, as demonstrated in this study, can exhibit a negative Poisson’s ratio due to their unique structure and deformation mechanisms within a certain strain range. The results from Figure 5a,b indicate that for both RE and MRSG structures, ULTEM 9085 and ULTEM 1010 exhibit negligible differences in Poisson’s ratio at the same relative density. This suggests that within the elastic deformation range, Poisson’s ratio of RE and MRSG structures is more closely related to the structural parameters than to the type of material. As the relative density increases, the Poisson’s ratio of RE structures shows a significant upward trend, and it is expected that when the relative density increases to a certain extent, the negative Poisson’s ratio effect of RE structures will disappear, transitioning to a conventional deformation mode.
The Poisson’s ratio of the MRSG structures does not change significantly with increasing relative density within the studied range, showing only a slight increasing trend, and the negative Poisson’s ratio effect is more pronounced over a larger relative density range compared to that of the RE structures. The MRSG structures are similar to the anti-tetrachiral structures based on their deformation mechanism. By analogy to the numerical calculations of Poisson’s ratio for anti-tetrachiral structures [56], the Poisson’s ratio is mainly related to the B/H ratio. In this work, this parameter remains constant; thus, the Poisson’s ratio does not change significantly with increasing relative density. The finite element analysis results are generally consistent with the experimental results, with the Poisson’s ratio values being slightly lower than the experimental values. This discrepancy may be attributed to defects in the actual manufactured structures and differences between the simulation model and the actual experimental process.
The results from Figure 5c,d show that the normalized equivalent Young’s modulus of the same structure made from ULTEM 9085 at the same relative density differs very little with that of ULTEM 1010, and both increase significantly with increasing relative density. The above results indicate that during the elastic deformation stage, the Poisson’s ratio and equivalent Young’s modulus of RE and MRSG auxetic structures are not significantly influenced by the properties of the parent material but are closely related to the structural configuration parameters.

4.2. Deformation Behavior

4.2.1. RE Structures

It can be observed from Figure 6b that the RE structure of ULTEM 9085 underwent three stages: the elastic stage, the plateau stage, and the densification stage. During the elastic stage, the inclined struts were subjected to pressure and rotated, resulting in an increase in the inclination angles of the structure and inward movement of the vertical struts. Consequently, the RE structure exhibited lateral contraction under axial compression, generating a negative Poisson’s ratio effect. Following the elastic stage, the structure entered the elastoplastic plateau phase, where the elastic cell walls bent and then collapsed due to plastic buckling. Once one row of cells collapsed, the next row behaved in a similar way. This row-by-row collapse led to stress fluctuations, where the stress no longer continuously rose with increasing strain but entered a plateau period. After all of the rows had collapsed, the entire structure began to densify, with stress rapidly increasing until the structure ultimately failed. ULTEM 1010 exhibited an elastic deformation stage similar to that of ULTEM 9085. However, due to the material’s inherent brittleness, it underwent brittle fracture during the buckling of the struts, leading to structural failure. Consequently, it did not show complete plateau and densification stages, as shown in Figure 6a.
Figure 7a,c demonstrate that within the relative density range of 0.14 to 0.28, the RE structures of ULTEM 1010 underwent an elastic deformation phase followed by buckling deformation of a single row, showing a short stress plateau, and then brittle fracture. In the relative density range of 0.32 to 0.40, the RE structures experienced brittle fracture during the elastic deformation phase, leading to structural failure without entering the plateau stage. The strain values at the end of the elastic stage for RE structures increased slightly with increasing relative density, except for the relative density of 0.40. ULTEM 9085 followed a similar increasing trend of strain values across the entire investigated relative density range, as shown in Figure 7b. This may be attributed to the fact that as the relative density increased, the ratio of the cell wall thickness to the wall length became larger, making the walls less prone to buckling and thus slightly extending the elastic deformation phase. At a relative density of 0.40 for ULTEM 1010, the structure failed by fracture before completing the elastic stage, causing the fracture strain to decrease. For ULTEM 9085 within the relative density range of 0.14 to 0.28, the plateau phase exhibited a complete set of five stress peaks and valleys before entering the densification phase, indicating row-by-row collapse. In the relative density range of 0.32 to 0.40, the number of stress peaks and valleys decreased, primarily due to increased structural stiffness with higher relative density, making buckling deformation harder to occur and leading to simultaneous deformation of two or more rows. The experimental and simulated deformation processes in Figure 8a,b corroborate this observation, where the collapse of the RE structure at a relative density of 0.20 was clearly row by row, while at a relative density of 0.32, the third and fourth rows deformed almost simultaneously, resulting in an indistinct fourth peak. Figure 7 and Figure 8 demonstrate that the simulated results are in good agreement with the experimental outcomes.
Figure 9a shows a photo of a ULTEM 9085 structure after densification and damage, where fractures predominantly occurred at the stress concentration regions at the junctions of the struts. Figure 9b displays the case of a 0.36 relative density ULTEM 9085 RE structure, which had defects embedded in the intersection area during the additive manufacturing process. These defects led to premature partial fractures during the deformation process. Thus, the stress–strain curve in Figure 7b at a relative density of 0.36 exhibits an early termination due to structural fracture. As can be observed in Figure 9c, void defects tend to occur at re-entrant junctions. Since these regions are stress concentration zones, severe defects may cause vulnerable sites where fracture initiates preferentially. To mitigate this issue, the printing process can be optimized by adjusting the deposition path to avoid coincident discontinuity points between adjacent layers, and regulating the overlap ratio to minimize porosity defects.
It is evident from Figure 10 that at a relative density of 0.20, fractures primarily occurred in the row where buckling deformation took place, with the intersection area of the vertical and inclined walls being the stress concentration region where fracture initiated first. This finding is consistent with the behavior observed in ULTEM 9085. At a relative density of 0.40, the structure was still in the elastic deformation phase at the time of failure, and the stress was more uniformly distributed throughout the structure.

4.2.2. MRSG Structures

It can be observed from Figure 11 that the deformation process of the ULTEM 9085 MRSG structure also had three stages: the elastic deformation stage, the row-by-row collapse stage, and the densification stage. The MRSG structure did not exhibit the typical plateau phase; instead, the stress continued to increase with strain in the second stage, although at a slower rate compared to the elastic stage. The row-by-row deformation mode also led to peaks in the curve. Once all rows had collapsed, the stress rapidly increased with strain, leading to the densification stage and structural failure. Similarly to the RE structure, ULTEM 9085 underwent a complete three-stage deformation process, with the second collapse stage being elastoplastic, during which the material retained its intact structure. In contrast, after the completion of the elastic deformation stage of the ULTEM 1010 structure, as the strain further increased, the fragile region of the structure began to fracture, with the stress still increasing quickly. So, unlike the ULTEM 9085-based MRSG structures, those manufactured from ULTEM 1010 did not show a slower stress increasing stage. After a short buckling period, the structure fails directly due to brittle fracture.
It is evident that ULTEM 1010 exhibited small brittle fracture peaks at the transition from the elastic deformation phase to the buckling deformation phase, indicating that some vulnerable regions of the structure began to fail as soon as asymmetric buckling initiated. Subsequently, the stress rapidly increased with strain, and the structure experienced brittle fracture and overall failure before the first row of unit cells completed the buckling collapse. The strain at the end of the elastic phase and at the failure points gradually decreased with increasing relative density. This is attributed to the increased structural stiffness at higher relative densities, which led to a faster stress increase and, consequently, a faster brittle fracture failure. For the ULTEM 9085 MRSG structures, after completing the uniformly symmetric deformation of the elastic phase, asymmetric buckling deformation occurred, with the stress increasing rapidly to a yielding point. The structure then began to experience elastoplastic collapse, with the stress continuing to increase at a slower rate until the structure ultimately failed. Similarly to ULTEM 1010, the strain at the end of the elastic phase, the initial collapse points, and the failure points all decreased with increasing relative density. The simulation results are generally consistent with the experimental outcomes. However, partial structural fractures at the end of the elastic phase were not observed in the experimental stress–strain curves of ULTEM 1010. This difference may be due to the existence of defects in the actual manufactured samples, which were prone to partial fracture under stress concentration.
Figure 13 exhibits that, during the elastic deformation phase, the primary deformation of the structure was primarily due to the bending of the longitudinal struts, which exhibited higher stress compared to the transverse struts, as seen in the stress contour image. The bending of the longitudinal struts caused the central parts of the square grids to rotate, resulting in a contraction in the transverse direction, thereby demonstrating a negative Poisson’s ratio effect. As the longitudinal deformation progressed, the middle row of the MRSG structure was extruded. During this process, stress concentrations formed at the central part of the square grids and the densified regions of the upper and bottom rows, resembling a “>” shape. The deformation photos showed that the damage mostly occurred in these stress concentration regions. Figure 14 shows that stress concentrated at the cross-centers and the longitudinal struts of the ULTEM 1010 structure, and the experimental photos showed that most of the damage also occurred in these locations, so the simulation and experimental results were found to be in good agreement.

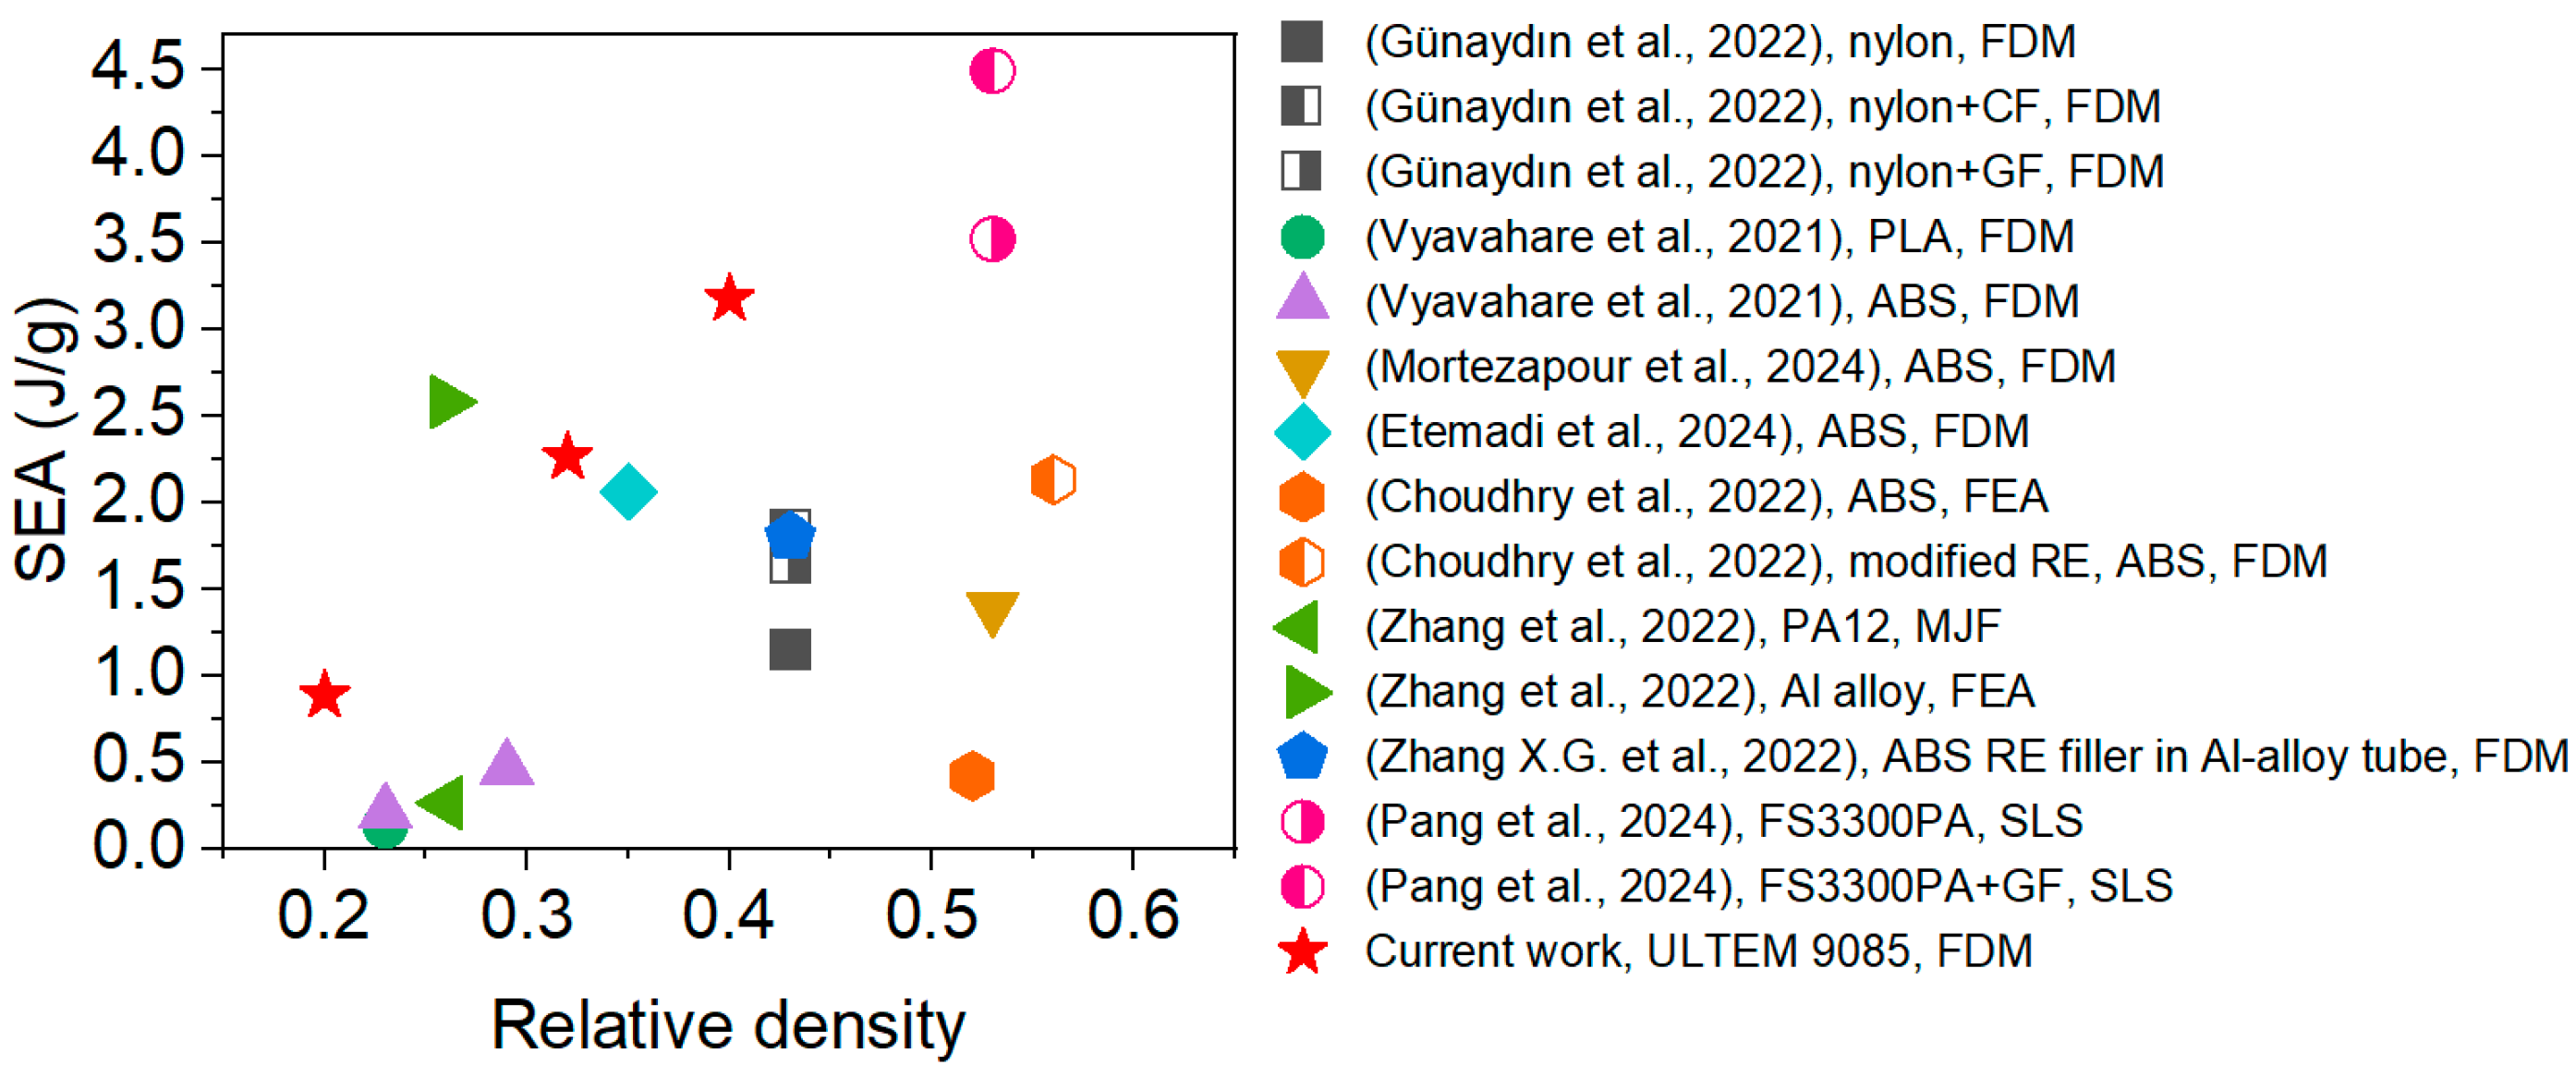
4.3. Energy Absorption

Figure 16 indicates that for both ULTEM materials, the elastic and total SEA of the RE and MRSG structures increase with increasing relative density. The fitting analysis revealed that the elastic and total SEA of the RE structures follow a power function relationship with relative density, while for the MRSG structures, the relationship is closer to linear. Additionally, for both the RE and MRSG structures, the SEA values of the ULTEM 9085 structures are higher than those of the ULTEM 1010 structures. This is attributed to the better toughness of ULTEM 9085, which exhibits a higher elongation at break and a longer elastoplastic collapse phase, enabling greater energy absorption. In contrast, ULTEM 1010, being more brittle, fails quickly under stress due to brittle fractures, resulting in an inferior energy absorption capability. The above results illustrate the significance of material properties on the energy absorption performance of auxetic structures. For materials with comparable elastic modulus, those with better toughness exhibit superior energy absorption capabilities. Therefore, materials that are both strong and tough are the best choices for energy-absorbing structures to achieve excellent performance. ULTEM 9085 is one of the most outstanding polymers that effectively balances strength and toughness, making it an excellent candidate for energy absorption applications.
It can be observed from Figure 17 that the ULTEM 9085 structures in the current study are located in the upper left region of the graph, indicating a high SEA performance at lower relative densities and a superior SEA performance compared to polymeric material structures from other studies.

5. Conclusions

This work has investigated the Poisson’s ratio, effective Young’s modulus, deformation behavior, failure mechanism, and energy absorption performance of RE and MRSG auxetic structures fabricated from ULTEM 9085 and ULTEM 1010 materials using the FDM technique under quasi-static uniaxial compression loading. A good agreement was found between the experimental and FE simulation results. The following conclusions can be drawn from this study:
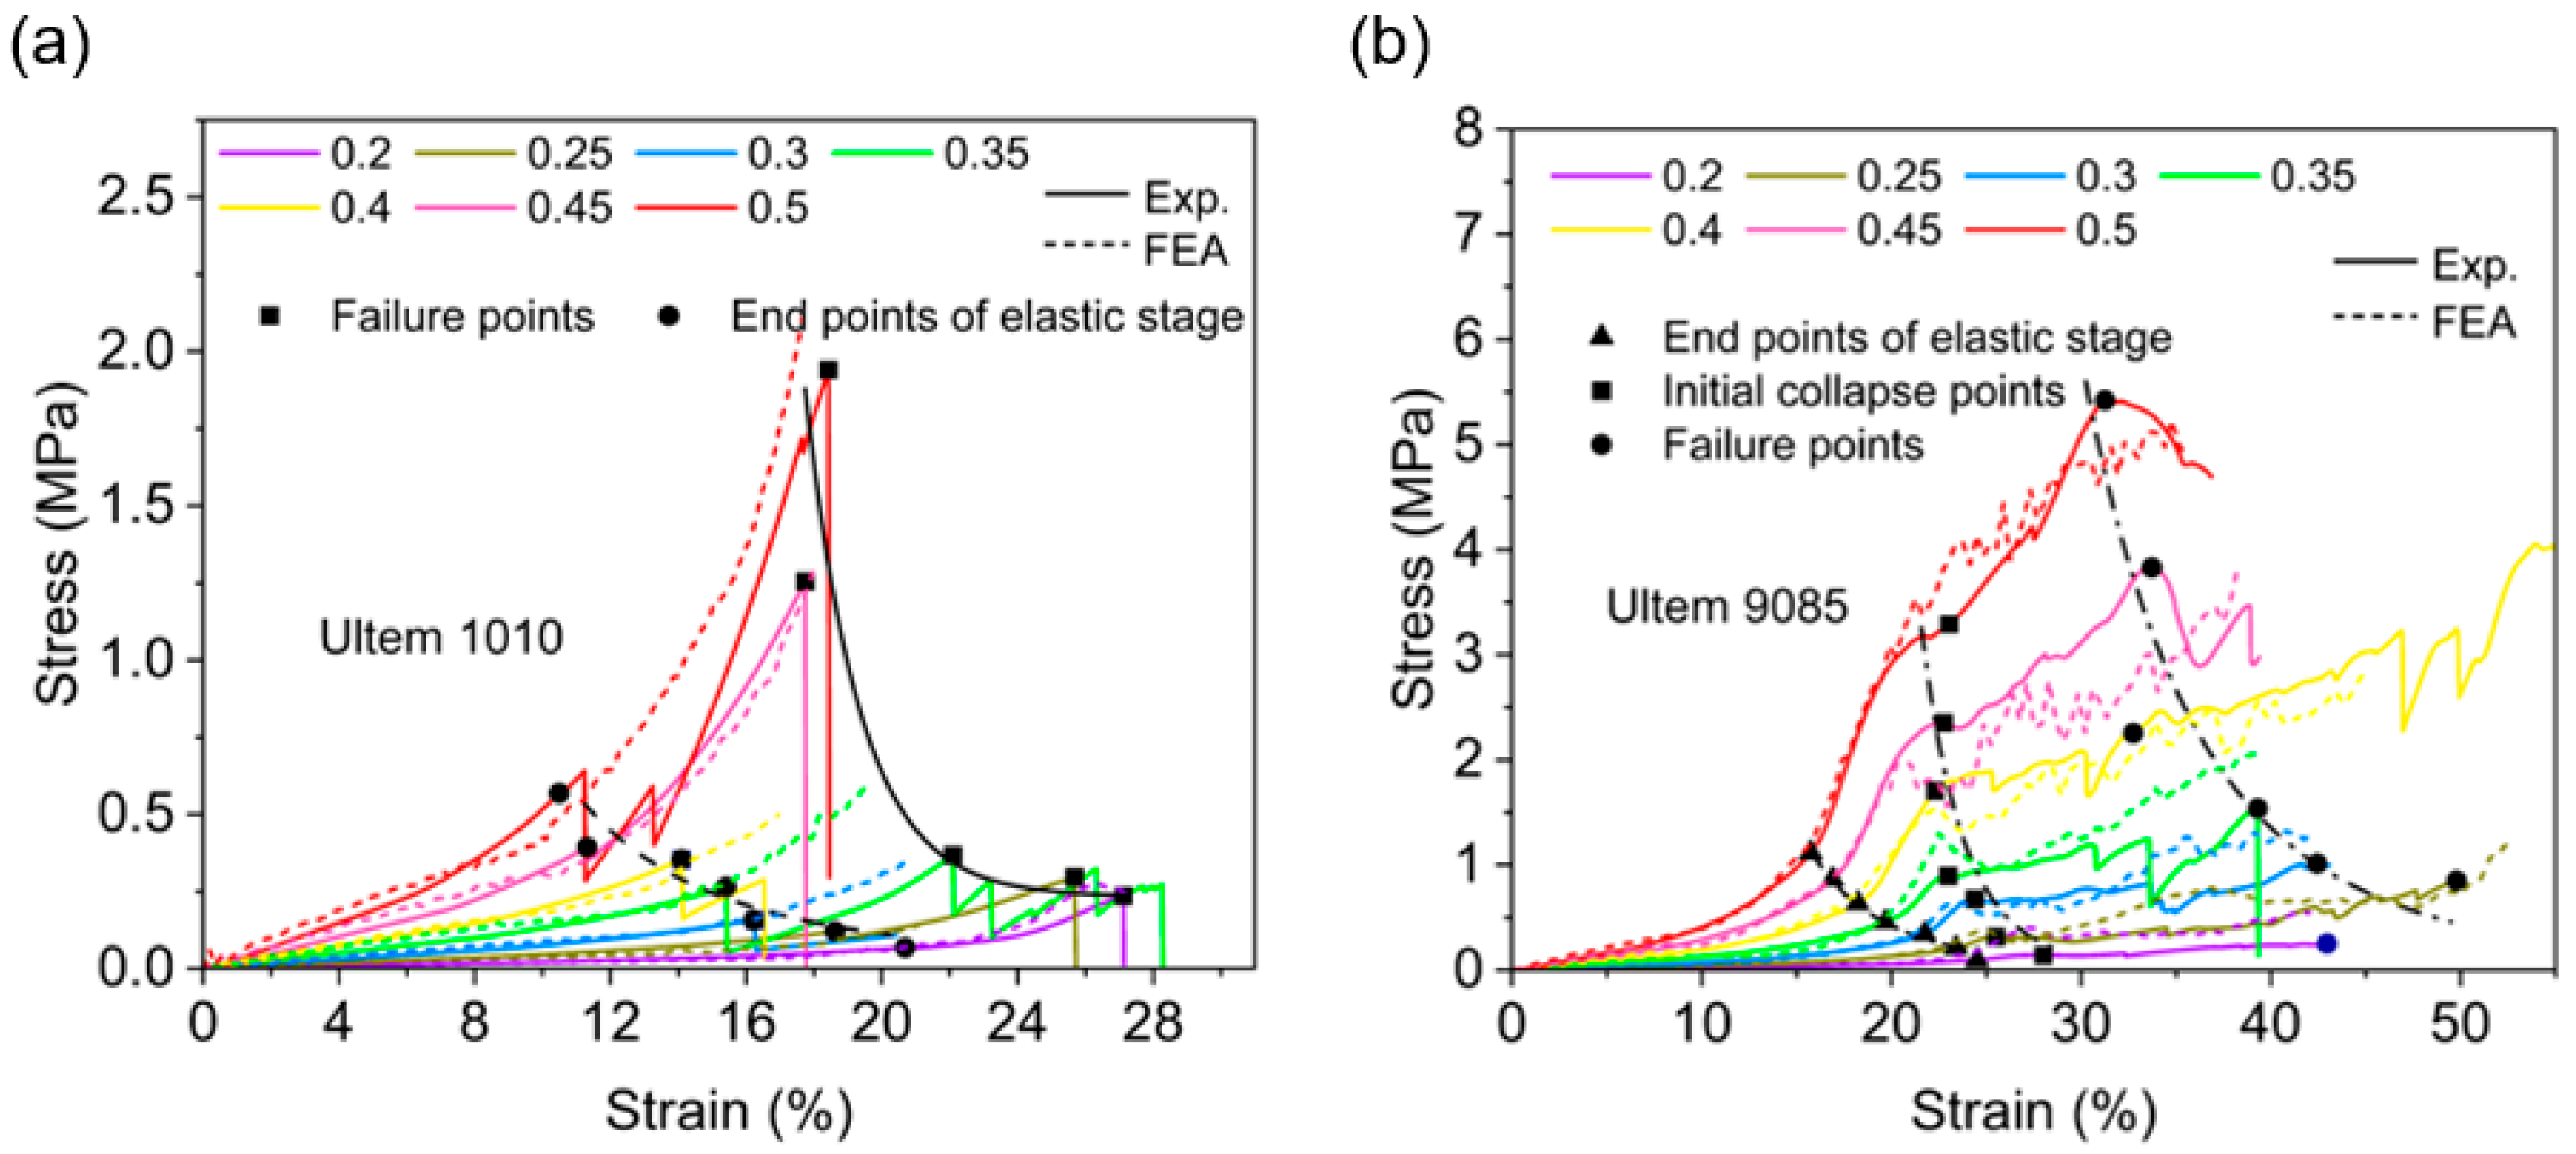
  • In the elastic deformation stage, the Poisson’s ratio and equivalent Young’s modulus of the RE and MRSG auxetic structures are not significantly related to the properties of the parent material but are closely related to the structural configuration parameters.
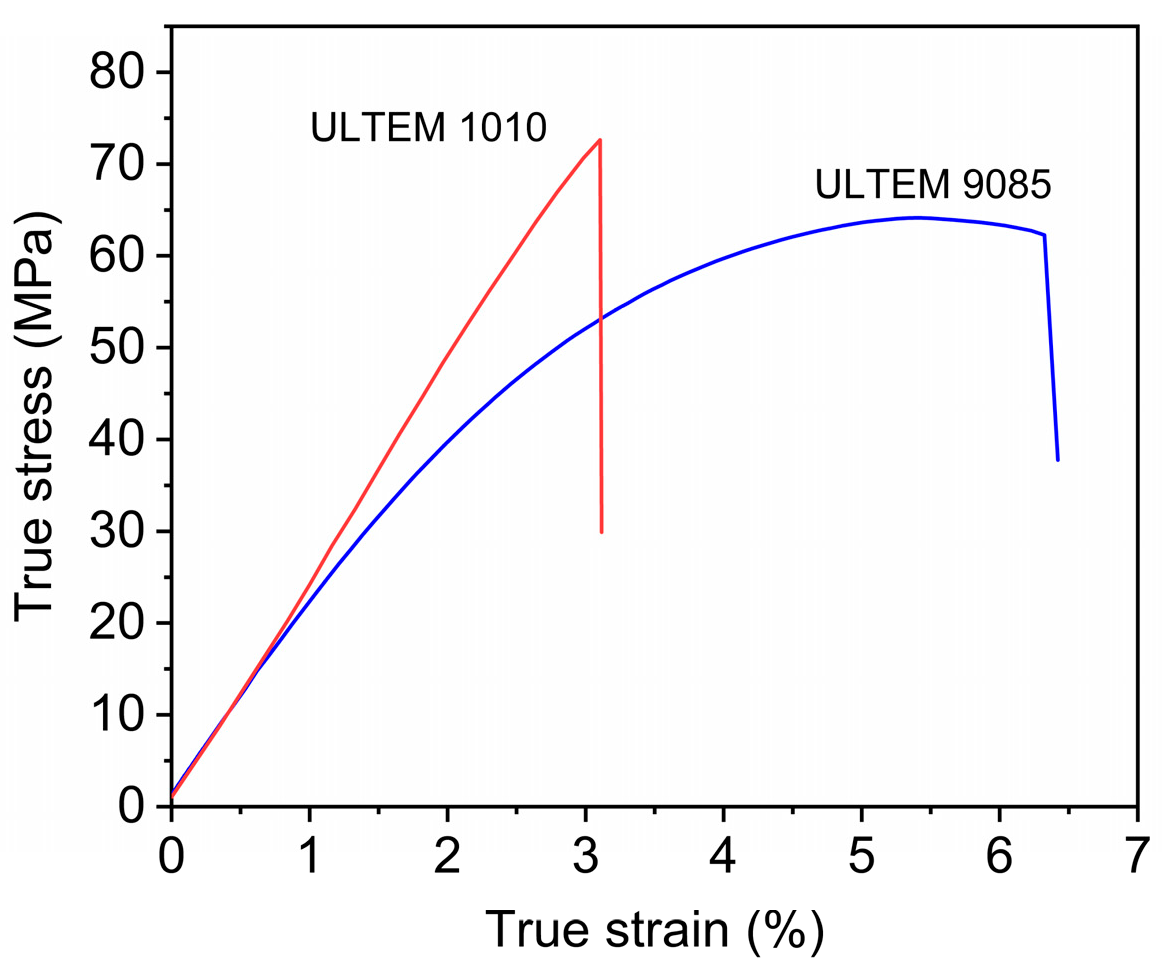
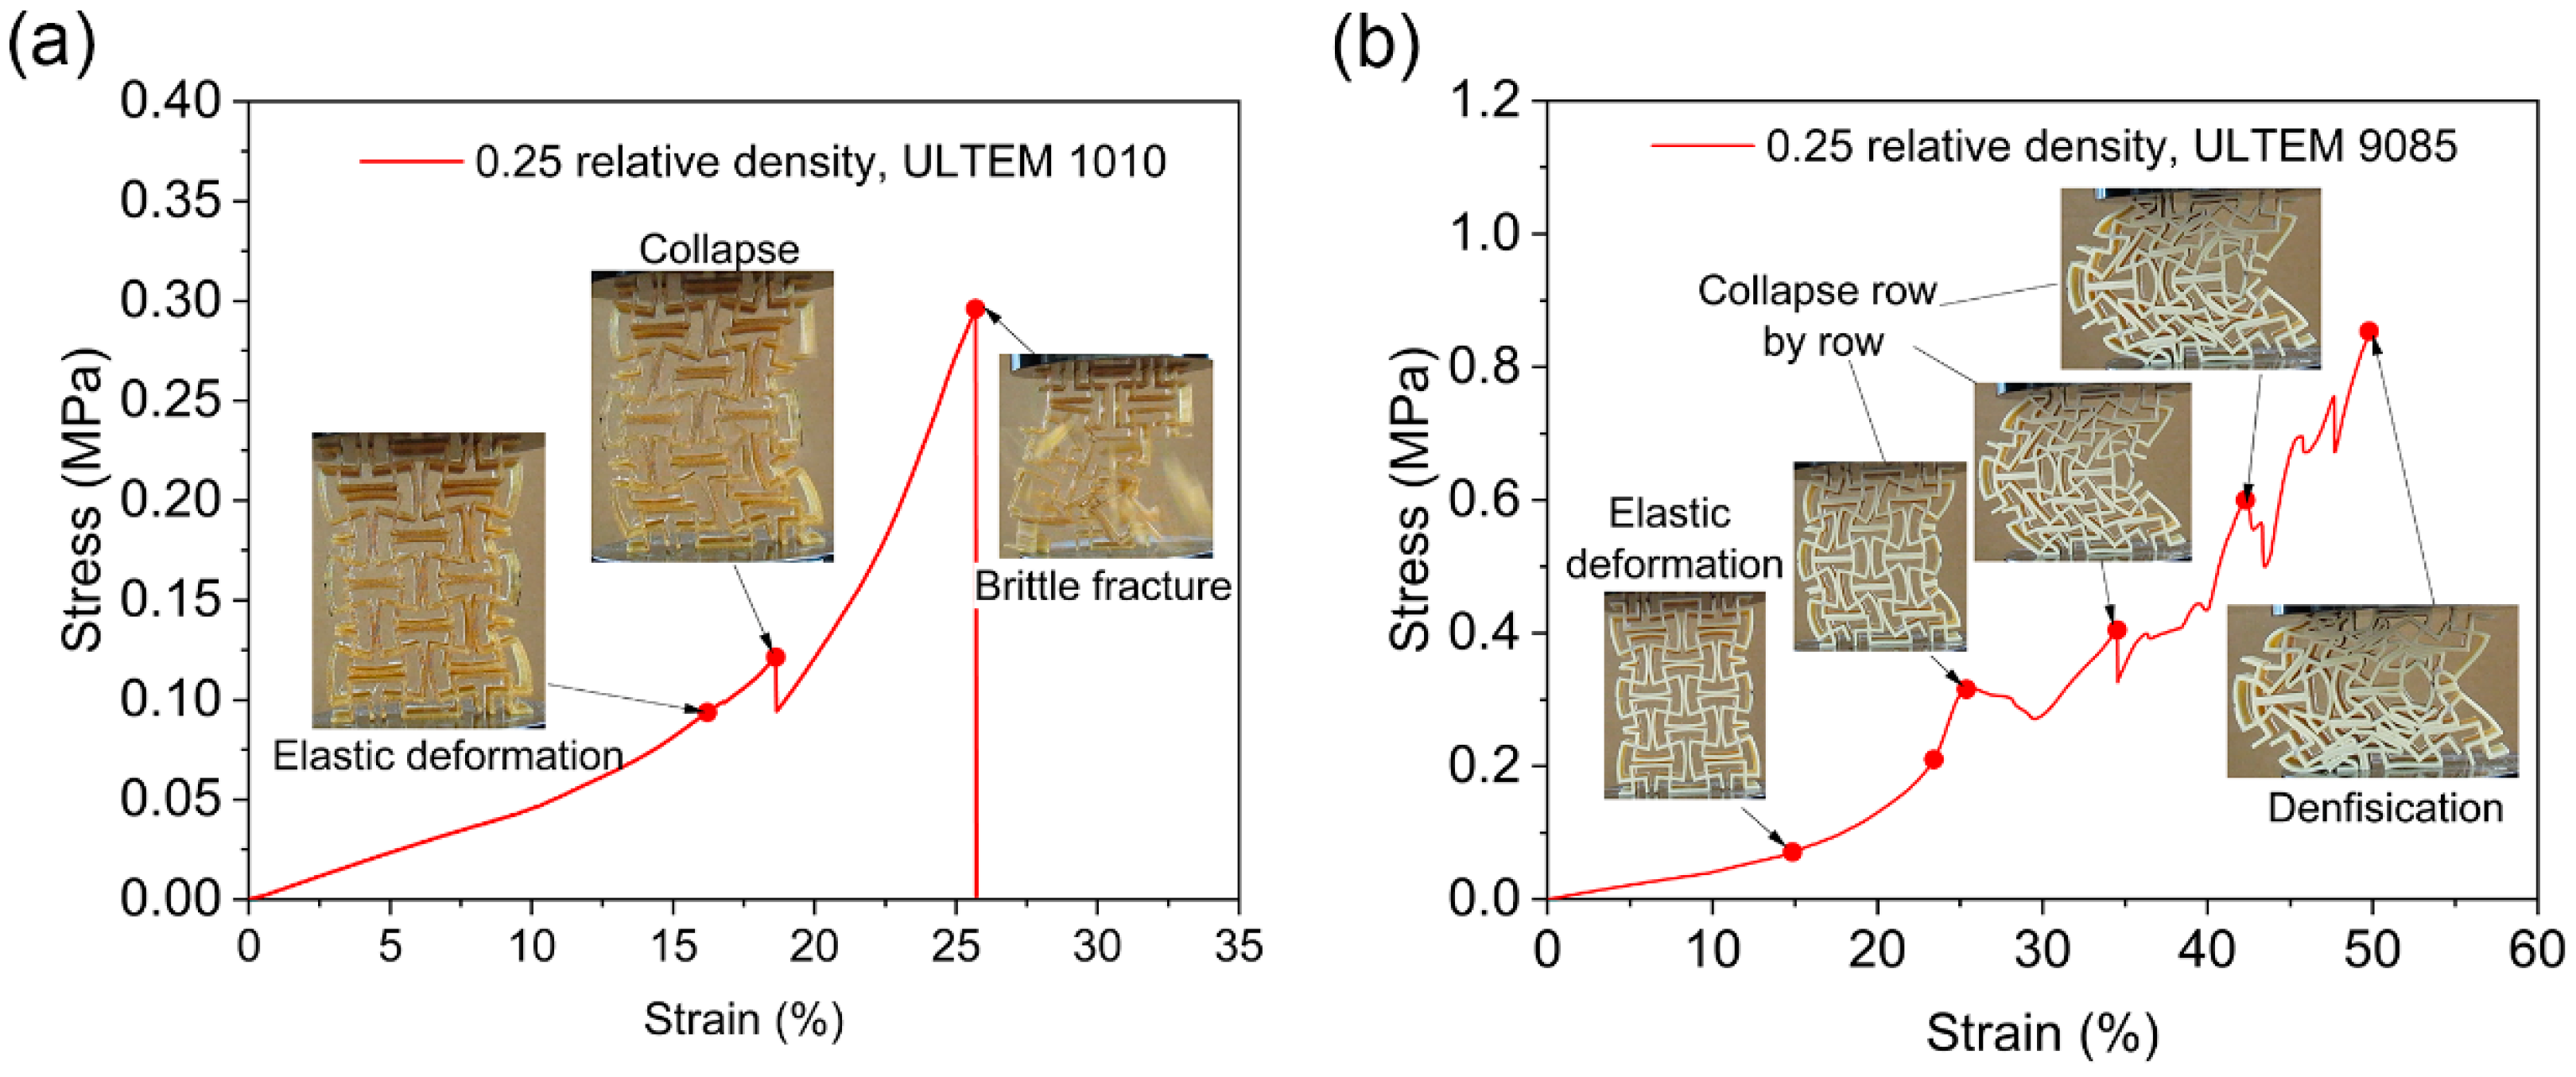
  • The deformation behavior of the ULTEM 9085 auxetic structures exhibited three stages: elastic stage, plateau stage, and densification stage, while the ULTEM 1010 structures only underwent the elastic stage or the elastic and early buckling stages. The damage mode of the ULTEM 9085 structures was elastoplastic yielding failure, which was different from the brittle fracture mode of the ULTEM 1010 structures.
  • The energy absorption of the ductile ULTEM 9085 structures was significantly higher than that of the brittle ULTEM 1010 structures. A linear correlation exists between the relative density and SEA of MRSG structures in the studied relative density range, whereas the RE structures follow a power function relationship.
This study sheds light on how material properties influence the deformation behavior and energy absorption performance of auxetic structures. It is confirmed that strong and ductile materials like ULTEM 9085 can significantly enhance the energy absorption performance of auxetic structures, thus demonstrating great potential for use in a variety of fields.

Author Contributions

J.X., conceptualization, methodology, formal analysis, visualization, writing—original draft; L.A., resources, methodology, validation, project administration; H.N., investigation; S.H., formal analysis; Y.C., writing—review and editing; Y.H., visualization; J.T., formal analysis; S.D., funding acquisition; C.Y., supervision, project administration, writing—review and editing. All authors have read and agreed to the published version of the manuscript.

Funding

This research received no external funding.

Data Availability Statement

The dataset is available on request from the authors.

Acknowledgments

The authors are very grateful for the support granted by the staff of the International Development Department of BIAM for their translation work, which has facilitated smoother communication between BIAM and BSTU.

Conflicts of Interest

The authors declare no conflicts of interest.

Abbreviations

The following abbreviations are used in this manuscript:
NPRNegative Poisson’s ratio
AMAdditive manufacturing
FDMFused deposition modeling
PEIPolyetherimide
RERe-entrant
MRSGMissing rib square grid
FEFinite element
FSTFlame smoke toxicity
SEASpecific energy absorption

References

  1. Evans, K.E.; Nkansah, M.A.; Hutchinson, I.J.; Rogers, S.C. Molecular network design. Nature 1991, 353, 124. [Google Scholar] [CrossRef]
  2. Gao, Q.; Liao, W.H. Energy absorption of thin walled tube filled with gradient auxetic structures-theory and simulation. Int. J. Mech. Sci. 2021, 201, 106475. [Google Scholar] [CrossRef]
  3. Hu, Q.; Zhang, X.; Zhang, J.; Lu, G.; Tse, K.M. A review on energy absorption performance of auxetic composites with fillings. Thin-Walled Struct. 2024, 205, 112348. [Google Scholar] [CrossRef]
  4. Yang, S.; Chalivendra, V.B.; Kim, Y.K. Fracture and impact characterization of novel auxetic Kevlar®/Epoxy laminated composites. Compos. Struct. 2017, 168, 120–129. [Google Scholar] [CrossRef]
  5. Wagih, A.; Mahmoud, H.A.; Lubineau, G. 3D printed auxetic metal stiffener for lightweight metal-composite T-joints with high strength and toughness. Mater. Des. 2024, 241, 112963. [Google Scholar] [CrossRef]
  6. Hu, L.L.; Zhou, M.Z.; Deng, H. Dynamic indentation of auxetic and non-auxetic honeycombs under large deformation. Compos. Struct. 2019, 207, 323–330. [Google Scholar] [CrossRef]
  7. Li, T.T.; Liu, F.; Wang, L.F. Enhancing indentation and impact resistance in auxetic composite materials. Compos. Part B-Eng. 2020, 198, 108229. [Google Scholar] [CrossRef]
  8. Cheng, H.C.; Scarpa, F.; Panzera, T.H.; Farrow, I.; Peng, H.X. Shear Stiffness and Energy Absorption of Auxetic Open Cell Foams as Sandwich Cores. Phys. Status Solidi B-Basic Solid State Phys. 2019, 256, 1800411. [Google Scholar] [CrossRef]
  9. Zhang, Y.; Sun, L.; Ren, X.; Zhang, X.Y.; Tao, Z.; Xie, Y.M. Design and analysis of an auxetic metamaterial with tuneable stiffness. Compos. Struct. 2022, 281, 114997. [Google Scholar] [CrossRef]
  10. Alderson, A.; Alderson, K.L. Auxetic materials. Proc. Inst. Mech. Eng. Part G-J. Aerosp. Eng. 2007, 221, 565–575. [Google Scholar] [CrossRef]
  11. Balan, P.M.; Mertens, A.J.; Bahubalendruni, M. Auxetic mechanical metamaterials and their futuristic developments: A state-of-art review. Mater. Today Commun. 2023, 34, 105285. [Google Scholar] [CrossRef]
  12. Nguyen, H.; Fangueiro, R.; Ferreira, F.; Nguyen, Q. Auxetic materials and structures for potential defense applications: An overview and recent developments. Text. Res. J. 2023, 93, 5268–5306. [Google Scholar] [CrossRef]
  13. Wei, L.L.; Zhao, X.; Yu, Q.; Zhu, G.H. A novel star auxetic honeycomb with enhanced in-plane crushing strength. Thin-Walled Struct. 2020, 149, 106623. [Google Scholar] [CrossRef]
  14. Foster, L.; Peketi, P.; Allen, T.; Senior, T.; Duncan, O.; Alderson, A. Application of Auxetic Foam in Sports Helmets. Appl. Sci.-Basel 2018, 8, 354. [Google Scholar] [CrossRef]
  15. Günaydin, K.; Gülcan, O.; Türkmen, H.S. Experimental and numerical crushing performance of crash boxes filled with re-entrant and anti-tetrachiral auxetic structures. Int. J. Crashworthiness 2023, 28, 649–663. [Google Scholar] [CrossRef]
  16. Luo, F.; Zhang, S.L.; Yang, D.Q. Anti-Explosion Performance of Composite Blast Wall with an Auxetic Re-Entrant Honeycomb Core for Offshore Platforms. J. Mar. Sci. Eng. 2020, 8, 182. [Google Scholar] [CrossRef]
  17. Wang, H.; Lu, Z.X.; Yang, Z.Y.; Li, X. A novel re-entrant auxetic honeycomb with enhanced in-plane impact resistance. Compos. Struct. 2019, 208, 758–770. [Google Scholar] [CrossRef]
  18. Yang, C.; Vora, H.D.; Chang, Y. Behavior of auxetic structures under compression and impact forces. Smart Mater. Struct. 2018, 27, 025012. [Google Scholar] [CrossRef]
  19. Imbalzano, G.; Linforth, S.; Ngo, T.D.; Lee, P.V.S.; Tran, P. Blast resistance of auxetic and honeycomb sandwich panels: Comparisons and parametric designs. Compos. Struct. 2018, 183, 242–261. [Google Scholar] [CrossRef]
  20. Qi, C.; Remennikov, A.; Pei, L.Z.; Yang, S.; Yu, Z.H.; Ngo, T.D. Impact and close-in blast response of auxetic honeycomb-cored sandwich panels: Experimental tests and numerical simulations. Compos. Struct. 2017, 180, 161–178. [Google Scholar] [CrossRef]
  21. Kalubadanage, D.; Remennikov, A.; Ngo, T.; Qi, C. Close-in blast resistance of large-scale auxetic re-entrant honeycomb sandwich panels. J. Sandw. Struct. Mater. 2021, 23, 4016–4053. [Google Scholar] [CrossRef]
  22. Li, D.; Yin, J.H.; Dong, L.; Lakes, R.S. Strong re-entrant cellular structures with negative Poisson’s ratio. J. Mater. Sci. 2018, 53, 3493–3499. [Google Scholar] [CrossRef]
  23. Chen, Z.Y.; Wang, Z.; Zhou, S.W.; Shao, J.W.; Wu, X. Novel Negative Poisson’s Ratio Lattice Structures with Enhanced Stiffness and Energy Absorption Capacity. Materials 2018, 11, 1095. [Google Scholar] [CrossRef]
  24. Fu, M.H.; Chen, Y.; Hu, L.L. Bilinear elastic characteristic of enhanced auxetic honeycombs. Compos. Struct. 2017, 175, 101–110. [Google Scholar] [CrossRef]
  25. Wang, G.X.; Deng, X.L. In-plane mechanical behavior design of novel re-entrant and hexagonal combined honeycombs. Mater. Today Commun. 2024, 40, 109729. [Google Scholar] [CrossRef]
  26. Li, D.; Yin, J.H.; Dong, L.; Lakes, R.S. Numerical analysis on mechanical behaviors of hierarchical cellular structures with negative Poisson’s ratio. Smart Mater. Struct. 2017, 26, 025014. [Google Scholar] [CrossRef]
  27. Hou, J.H.; Li, D.; Dong, L. Mechanical behaviors of hierarchical cellular structures with negative Poisson’s ratio. J. Mater. Sci. 2018, 53, 10209–10216. [Google Scholar] [CrossRef]
  28. Smith, C.W.; Grima, J.N.; Evans, K.E. A novel mechanism for generating auxetic behaviour in reticulated foams: Missing rib foam model. Acta Mater. 2000, 48, 4349–4356. [Google Scholar] [CrossRef]
  29. Gaspar, N.; Ren, X.; Smith, C.; Grima, J.; Evans, K. Novel honeycombs with auxetic behaviour. Acta Mater. 2005, 53, 2439–2445. [Google Scholar] [CrossRef]
  30. Lim, T.C. Analogies across auxetic models based on deformation mechanism. Phys. Status Solidi-Rapid Res. Lett. 2017, 11, 1600440. [Google Scholar] [CrossRef]
  31. Farrugia, P.S.; Gatt, R.; Lonardelli, E.Z.; Grima, J.N.; Evans, K.E. Different Deformation Mechanisms Leading to Auxetic Behavior Exhibited by Missing Rib Square Grid Structures. Phys. Status Solidi B-Basic Solid State Phys. 2019, 256, 1800186. [Google Scholar] [CrossRef]
  32. Xu, Y.; Šavija, B. Auxetic cementitious composites (ACCs) with excellent compressive ductility: Experiments and modeling. Mater. Des. 2024, 237, 112572. [Google Scholar] [CrossRef]
  33. Fíla, T.; Zlámal, P.; Jiroušek, O.; Falta, J.; Koudelka, P.; Kytýř, D.; Doktor, T.; Valach, J. Impact Testing of Polymer-filled Auxetics Using Split Hopkinson Pressure Bar. Adv. Eng. Mater. 2017, 19, 1700076. [Google Scholar] [CrossRef]
  34. Mahesh, V.; Maladkar, P.G.; Sadaram, G.S.; Joseph, A.; Mahesh, V.; Harursampath, D. Experimental investigation of the in-plane quasi-static mechanical behaviour of additively-manufactured polyethylene terephthalate/organically modified montmorillonite nanoclay composite auxetic structures. J. Thermoplast. Compos. Mater. 2022, 36, 4021–4041. [Google Scholar] [CrossRef]
  35. Zhang, Y.; Ma, L.-H.; Xu, H.-Q.; Zhou, W. A novel anti-missing-rib lozenge lattice metamaterial with enhanced mechanical properties. Mater. Today Commun. 2024, 38, 108151. [Google Scholar] [CrossRef]
  36. Zhu, Y.L.; Jiang, S.H.; Li, J.; Pokkalla, D.K.; Wang, Q.Y.; Zhang, C.Z. Novel Isotropic Anti-Tri-Missing Rib Auxetics with Prescribed In-Plane Mechanical Properties Over Large Deformations. Int. J. Appl. Mech. 2021, 13, 2150115. [Google Scholar] [CrossRef]
  37. Jiang, D.R.; Thissen, H.; Hughes, T.C.; Yang, K.; Wilson, R.; Murphy, A.B.; Nguyen, V. Advances in additive manufacturing of auxetic structures for biomedical applications. Mater. Today Commun. 2024, 40, 110045. [Google Scholar] [CrossRef]
  38. Gromat, T.; Gardan, J.; Saifouni, O.; Makke, A.; Recho, N. Generative design for additive manufacturing of polymeric auxetic materials produced by fused filament fabrication. Int. J. Interact. Des. Manuf.-Ijidem 2023, 17, 2943–2955. [Google Scholar] [CrossRef]
  39. Dziewit, P.; Platek, P.; Janiszewski, J.; Sarzynski, M.; Grazka, M.; Paszkowski, R. Mechanical Response of Additive Manufactured Regular Cellular Structures in Quasi-Static Loading Conditions-Part I Experimental Investigations. In Proceedings of the 7th International Conference on Mechanics and Materials in Design (M2D), Albufeira, Portugal, 11–15 June 2017; pp. 1061–1074. [Google Scholar]
  40. Farrokhabadi, A.; Veisi, H.; Gharehbaghi, H.; Montesano, J.; Behravesh, A.H.; Hedayati, S.K. Investigation of the energy absorption capacity of foam-filled 3D-printed glass fiber reinforced thermoplastic auxetic honeycomb structures. Mech. Adv. Mater. Struct. 2023, 30, 758–769. [Google Scholar] [CrossRef]
  41. Ding, S.L.; Zou, B.; Wang, P.; Ding, H.J. Effects of nozzle temperature and building orientation on mechanical properties and microstructure of PEEK and PEI printed by 3D-FDM. Polym. Test. 2019, 78, 105948. [Google Scholar] [CrossRef]
  42. Retolaza, J.; Gondra, K.; Ansola, R.; Allue, A. Mechanical research to optimize parameter selection for PPS material processed by FDM. Mater. Manuf. Process. 2022, 37, 1332–1338. [Google Scholar] [CrossRef]
  43. Appalsamy, T.; Hamilton, S.L.; Kgaphola, M.J. Tensile Test Analysis of 3D Printed Specimens with Varying Print Orientation and Infill Density. J. Compos. Sci. 2024, 8, 121. [Google Scholar] [CrossRef]
  44. Michelis, P.; Spitas, V. Numerical and experimental analysis of a triangular auxetic core made of CFR-PEEK using the Directionally Reinforced Integrated Single-yarn (DIRIS) architecture. Compos. Sci. Technol. 2010, 70, 1064–1071. [Google Scholar] [CrossRef]
  45. Ren, L.; Wu, W.; Ren, L.; Song, Z.; Liu, Q.; Li, B.; Wu, Q.; Zhou, X. 3D Printing of Auxetic Metamaterials with High-Temperature and Programmable Mechanical Properties. Adv. Mater. Technol. 2022, 7, 2101546. [Google Scholar] [CrossRef]
  46. He, P.; Wang, S.; Zhang, M.; Sang, L.; Tong, L.; Hou, W. Compression performance of 3D-printed thermoplastic auxetic structures. Thin-Walled Struct. 2024, 197, 111558. [Google Scholar] [CrossRef]
  47. Andrew, J.J.; Alhashmi, H.; Schiffer, A.; Kumar, S.; Deshpande, V.S. Energy absorption and self-sensing performance of 3D printed CF/PEEK cellular composites. Mater. Des. 2021, 208, 109863. [Google Scholar] [CrossRef]
  48. Günaydın, K.; Rea, C.; Kazancı, Z. Energy absorption enhancement of additively manufactured hexagonal and re-entrant (auxetic) lattice structures by using multi-material reinforcements. Addit. Manuf. 2022, 59, 103076. [Google Scholar] [CrossRef]
  49. Vyavahare, S.; Kumar, S. Numerical and experimental investigation of FDM fabricated re-entrant auxetic structures of ABS and PLA materials under compressive loading. Rapid Prototyp. J. 2021, 27, 223–244. [Google Scholar] [CrossRef]
  50. Mortezapour, A.R.; Monazzah, A.H.; Sarfaraz, R.; Sameezadeh, M. Energy absorption of multi-scale hierarchically graded auxetic structures: Experimental and simulation methods. Prog. Addit. Manuf. 2024, 10, 291–308. [Google Scholar] [CrossRef]
  51. Etemadi, E.; Hosseinabadi, M.; Taghizadeh, M.; Scarpa, F.; Hu, H. Enhancing the energy absorption capability of auxetic metamaterials through auxetic cells within re-entrant circular units. Eng. Struct. 2024, 315, 118379. [Google Scholar] [CrossRef]
  52. Choudhry, N.K.; Panda, B.; Kumar, S. In-plane energy absorption characteristics of a modified re-entrant auxetic structure fabricated via 3D printing. Compos. Part B Eng. 2022, 228, 109437. [Google Scholar] [CrossRef]
  53. Zhang, X.; Hao, H.; Tian, R.; Xue, Q.; Guan, H.; Yang, X. Quasi-static compression and dynamic crushing behaviors of novel hybrid re-entrant auxetic metamaterials with enhanced energy-absorption. Compos. Struct. 2022, 288, 115399. [Google Scholar] [CrossRef]
  54. Zhang, X.G.; Jiang, W.; Zhang, Y.; Luo, C.; Zhang, X.Y.; Han, D.; Hao, J.; Teng, X.C.; Xie, Y.M.; Ren, X. Energy absorption properties of composite tubes with hexagonal and re-entrant honeycomb fillers. Constr. Build. Mater. 2022, 356, 129298. [Google Scholar] [CrossRef]
  55. Pang, L.; Ma, Y.; Song, X.; Wang, H.; Wang, L.; Peng, W.; Wan, Y.; Feng, R. Experimental and simulation study on effects of material and loading direction on the quasi-static compression behavior of re-entrant honeycomb structure. Mater. Today Commun. 2024, 39, 109005. [Google Scholar] [CrossRef]
  56. Gatt, R.; Attard, D.; Farrugia, P.S.; Azzopardi, K.M.; Mizzi, L.; Brincat, J.P.; Grima, J.N. A realistic generic model for anti-tetrachiral systems. Phys. Status Solidi B-Basic Solid State Phys. 2013, 250, 2012–2019. [Google Scholar] [CrossRef]
Figure 1. Intact geometry models, unit cells, parameters, and relative density calculation schemes of (a) re-entrant (RE) structures; (b) missing rib square grid (MRSG) structures.
Jmmp 09 00155 g001
Figure 2. The true strain–stress curves of ULTEM 9085 and 1010 FDM tensile coupons.
Jmmp 09 00155 g002
Figure 3. A typical FE model of RE structure compressed in Y direction.
Jmmp 09 00155 g003
Figure 4. The devices for lateral displacement test. The contact detail between indenter tip and the sample is shown in enlarged view.
Jmmp 09 00155 g004
Figure 5. (a) The Poisson’s ratio of RE structures; (b) the Poisson’s ratio of MRSG structures; (c) the normalized Young’s modulus of RE structures; (d) the normalized Young’s modulus ofMRSG structures with different ULTEM materials.
Jmmp 09 00155 g005
Figure 6. The deformation behavior of RE structures with (a) ULTEM 1010; (b) ULTEM 9085 at 0.24 relative density.
Jmmp 09 00155 g006
Figure 7. Experimental and FEA strain–stress curves of RE structures: (a) ULTEM 9085; (b) elastic stage of ULTEM 9085; (c) ULTEM 1010.
Jmmp 09 00155 g007
Figure 8. The experimental and simulated deformation behavior of RE structures with ULTEM 9085 material: (a) 0.20 relative density; (b) 0.32 relative density.
Jmmp 09 00155 g008
Figure 9. (a) The damage photo of ULTEM 9085 RE structure at 0.24 relative density; (b) the defects in 0.36 relative density RE structure of ULTEM 9085; (c) the voids and delamination defects in ULTEM 9085 RE structures.
Jmmp 09 00155 g009
Figure 10. The experimental and simulated damage modes of RE structures with ULTEM 1010 material: (a,c) 0.20 relative density; (b,d) 0.40 relative density.
Jmmp 09 00155 g010
Figure 11. The deformation process of MRSG structures with different ULTEM materials at relative density of 0.25: (a) ULTEM 1010; (b) ULTEM 9085.
Jmmp 09 00155 g011
Figure 12. Experimental and FEA strain–stress curves of MRSG structures with (a) ULTEM 1010; (b) ULTEM 9085 material.
Jmmp 09 00155 g012
Figure 13. The experimental and simulated deformation behavior of 0.30 relative density MRSG structure of ULTEM 9085 material.
Jmmp 09 00155 g013
Figure 14. The experimental and simulated damage images of 0.35 relative density MRSG structure of ULTEM 1010 material.
Jmmp 09 00155 g014
Figure 15. The determination method of energy absorption of elastic stage and total energy absorption of (a) RE structure; (b) MRSG structure.
Jmmp 09 00155 g015
Figure 16. (a) SEA of elastic stage of RE structures; (b) SEA of elastic stage of MRSG structures; (c) total SEA of RE structures; (d) total SEA of MRSG structures.
Jmmp 09 00155 g016
Figure 17. Studies on SEA performance at different relative densities of re-entrant and modified re-entrant structures via additive manufacturing.
Jmmp 09 00155 g017
Table 1. Geometric parameters of RE and MRSG structures with different relative densities.
Relative Density (RE)H1 (mm)B1 (mm)Relative Density (MRSG)H2 (mm)B2 (mm)
0.1416.7914.540.2012.478.31
0.2011.7810.200.259.936.62
0.249.838.510.308.235.49
0.288.447.310.357.024.68
0.327.406.410.406.114.08
0.366.595.710.455.413.60
0.405.945.140.504.843.23
Table 2. The basic material properties of ULTEM 9085 and 1010 used in FE analysis.
MaterialsDensity (g/cm3)Young’s Modulus (MPa)Poisson’s Ratio
ULTEM 90851.3421470.40
ULTEM 10101.2722890.38
Disclaimer/Publisher’s Note: The statements, opinions and data contained in all publications are solely those of the individual author(s) and contributor(s) and not of MDPI and/or the editor(s). MDPI and/or the editor(s) disclaim responsibility for any injury to people or property resulting from any ideas, methods, instructions or products referred to in the content.

