
Leveraging Intelligent Machines for Sustainable and Intelligent Manufacturing Systems


Abstract
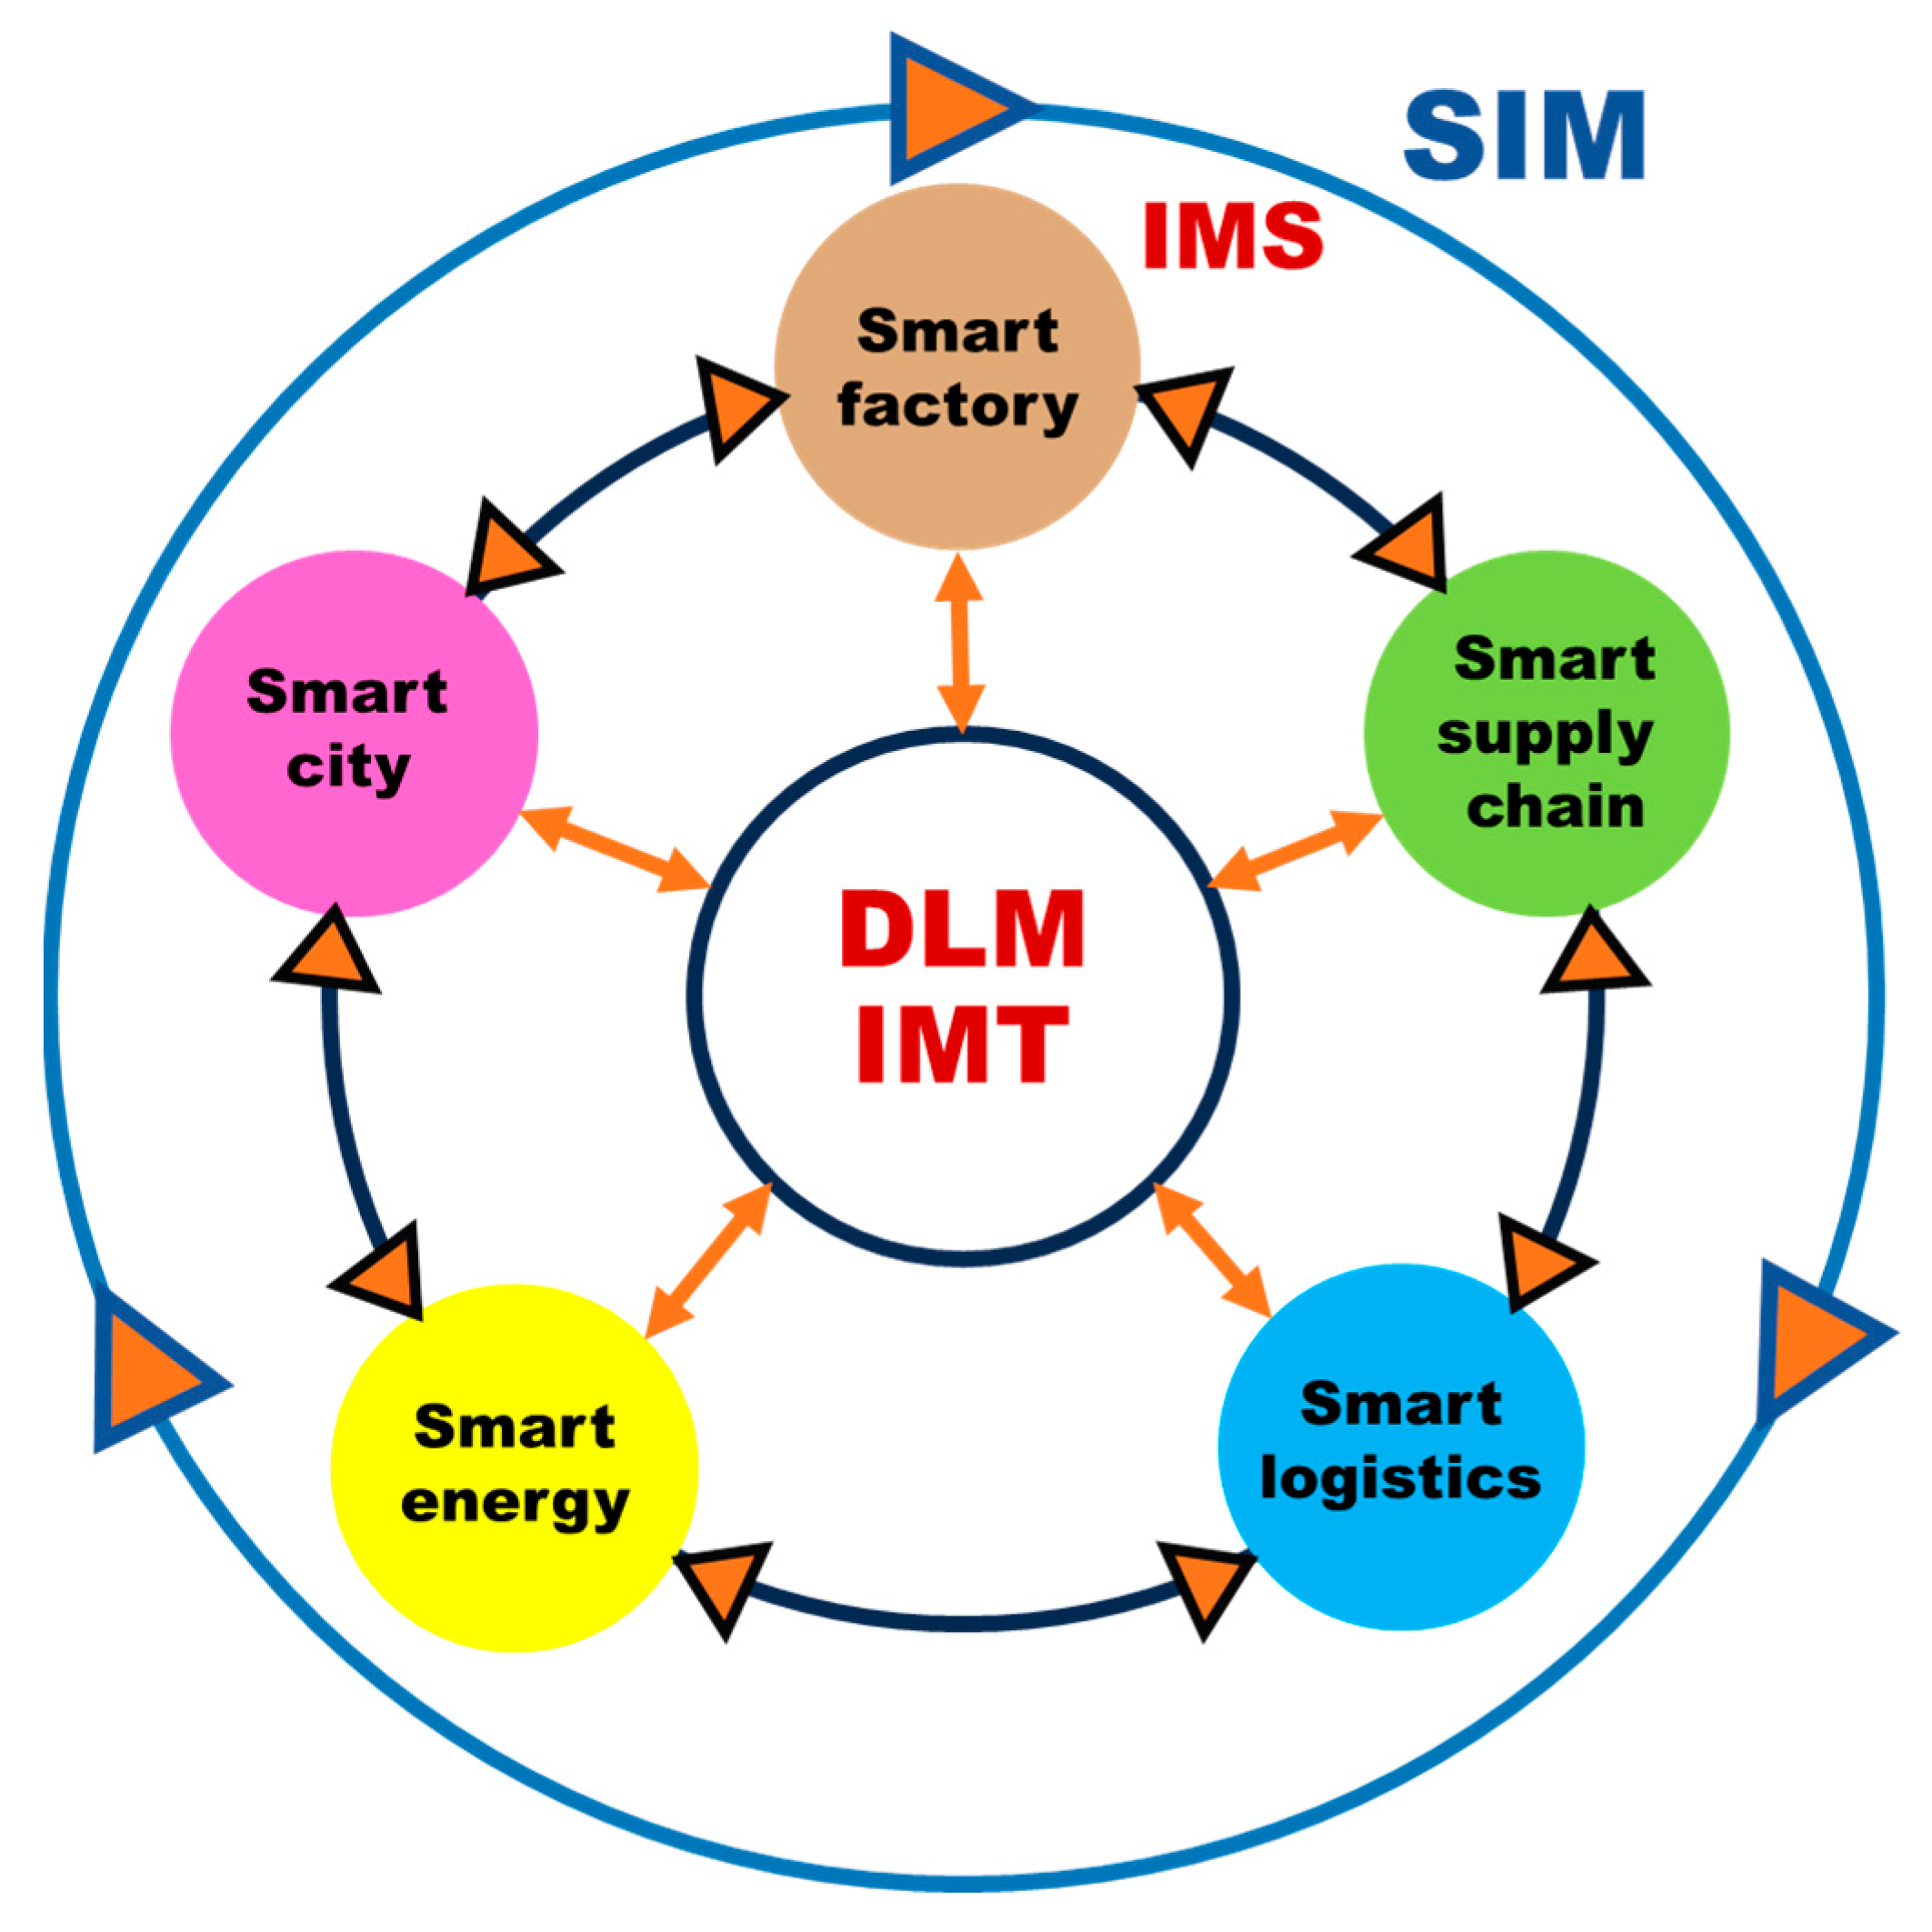
:1. Introduction
2. Relations of Decomposed Cutting Forces Versus Surface Roughness with Straightness and Roundness
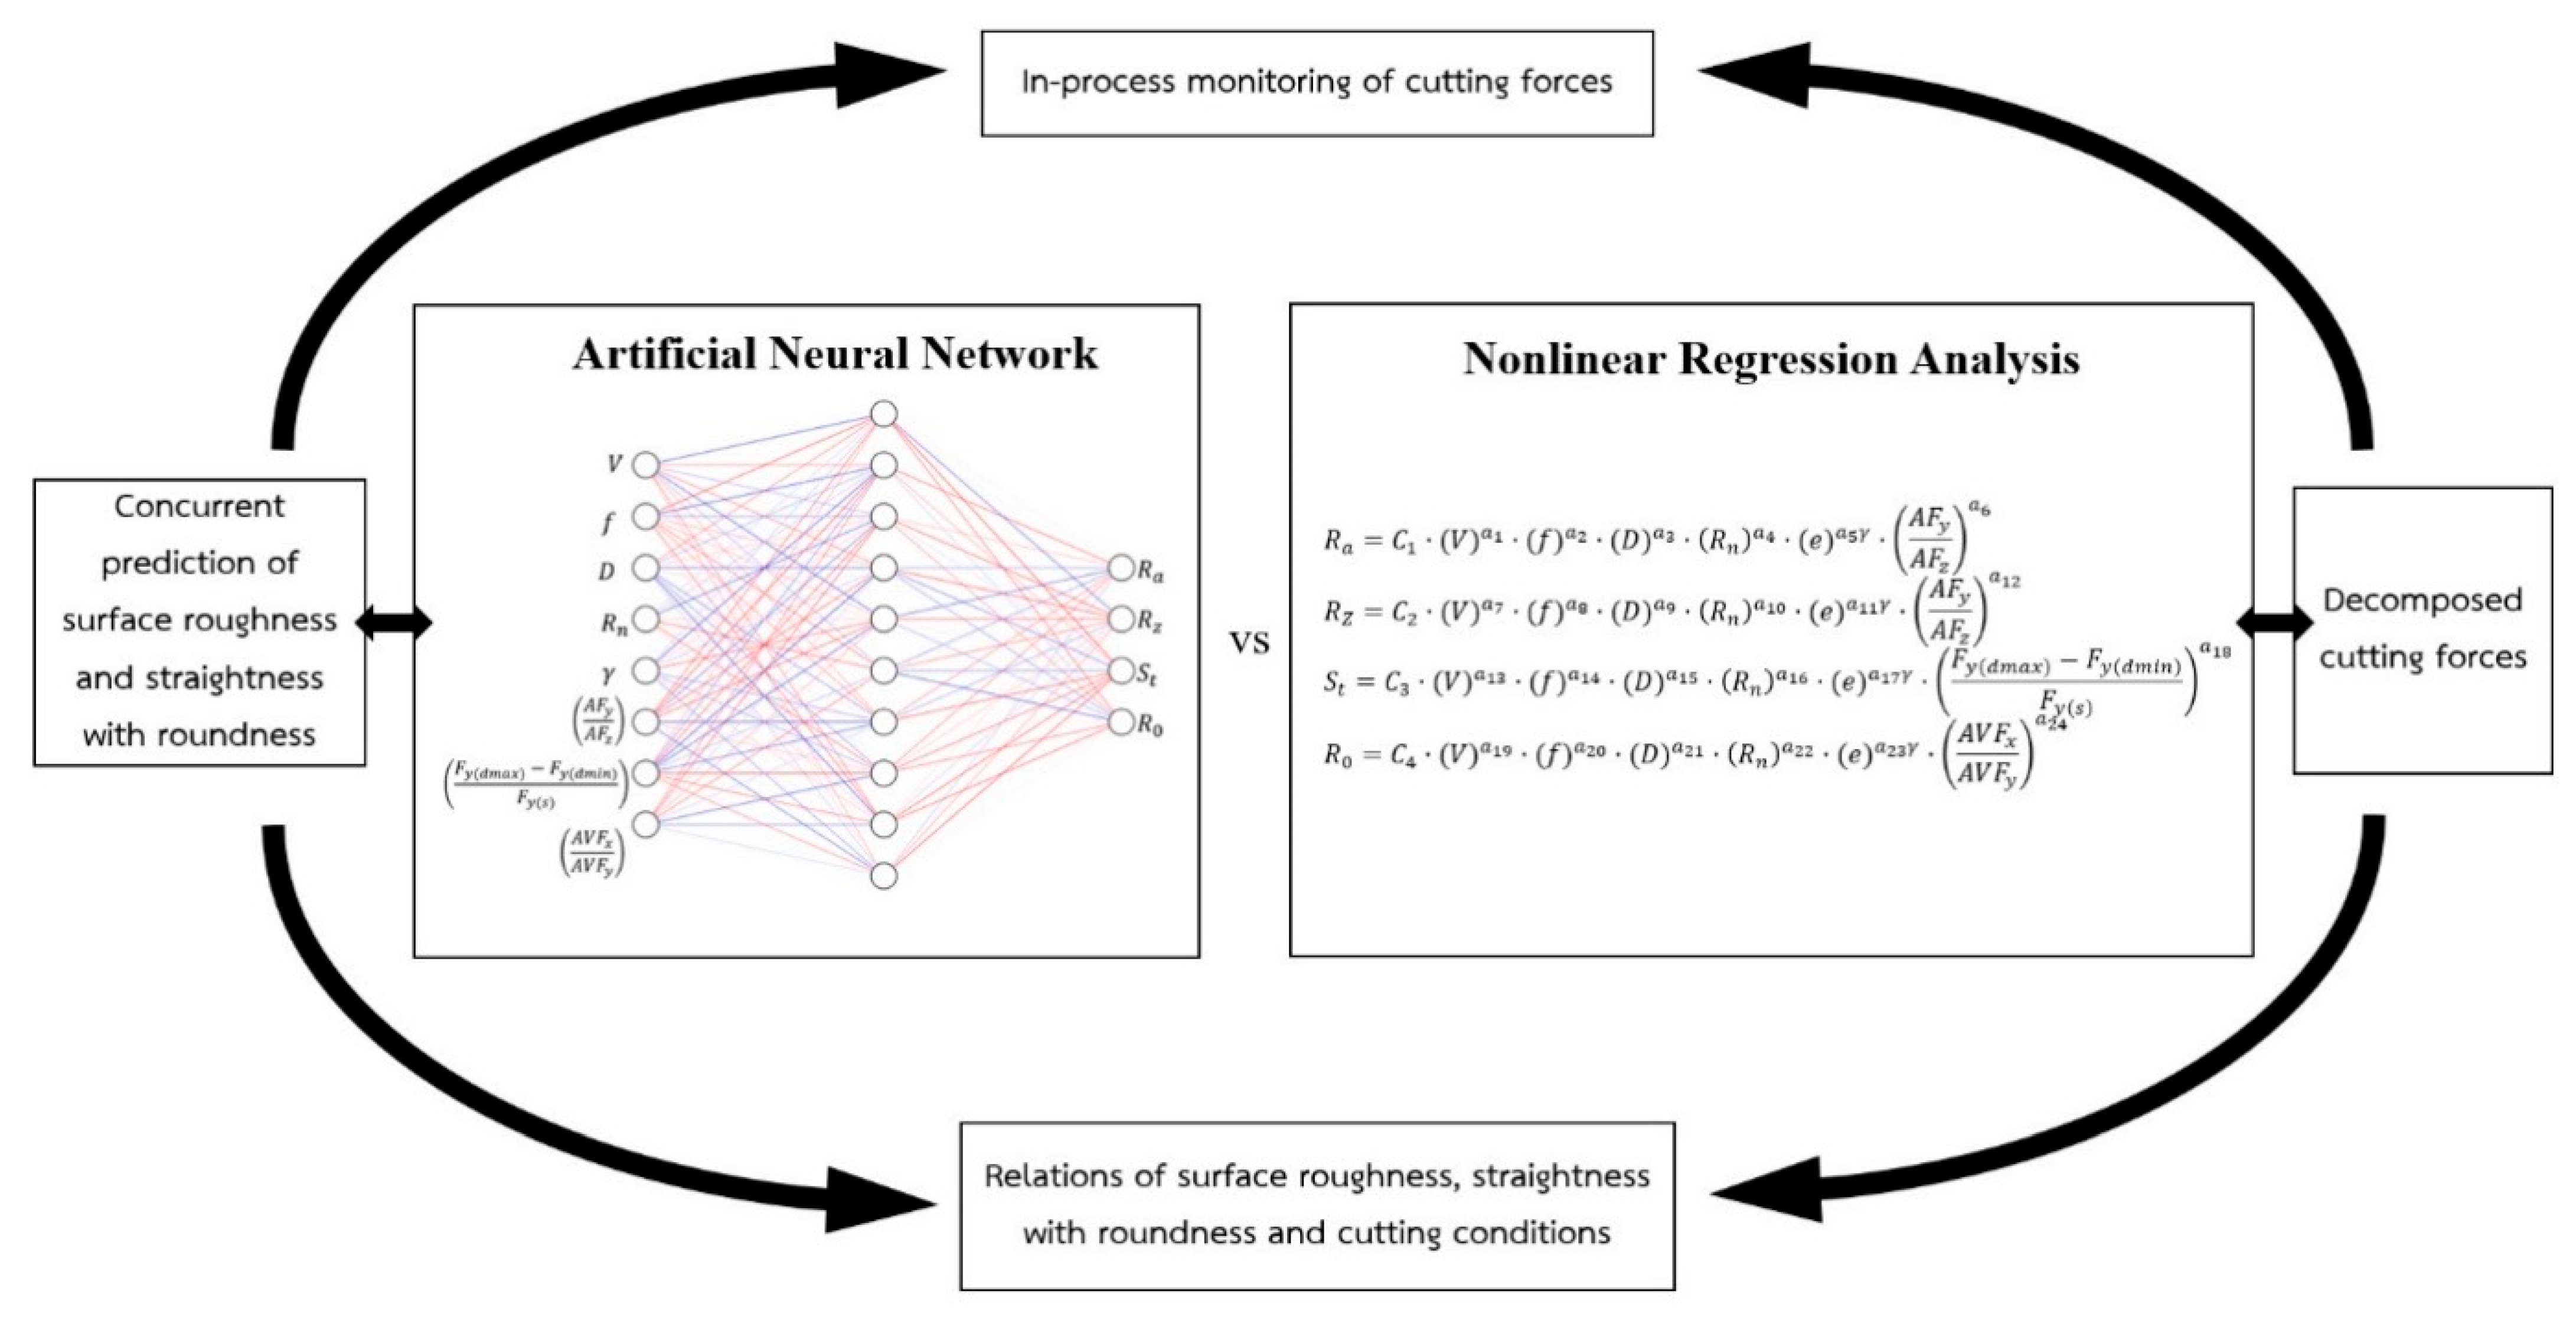
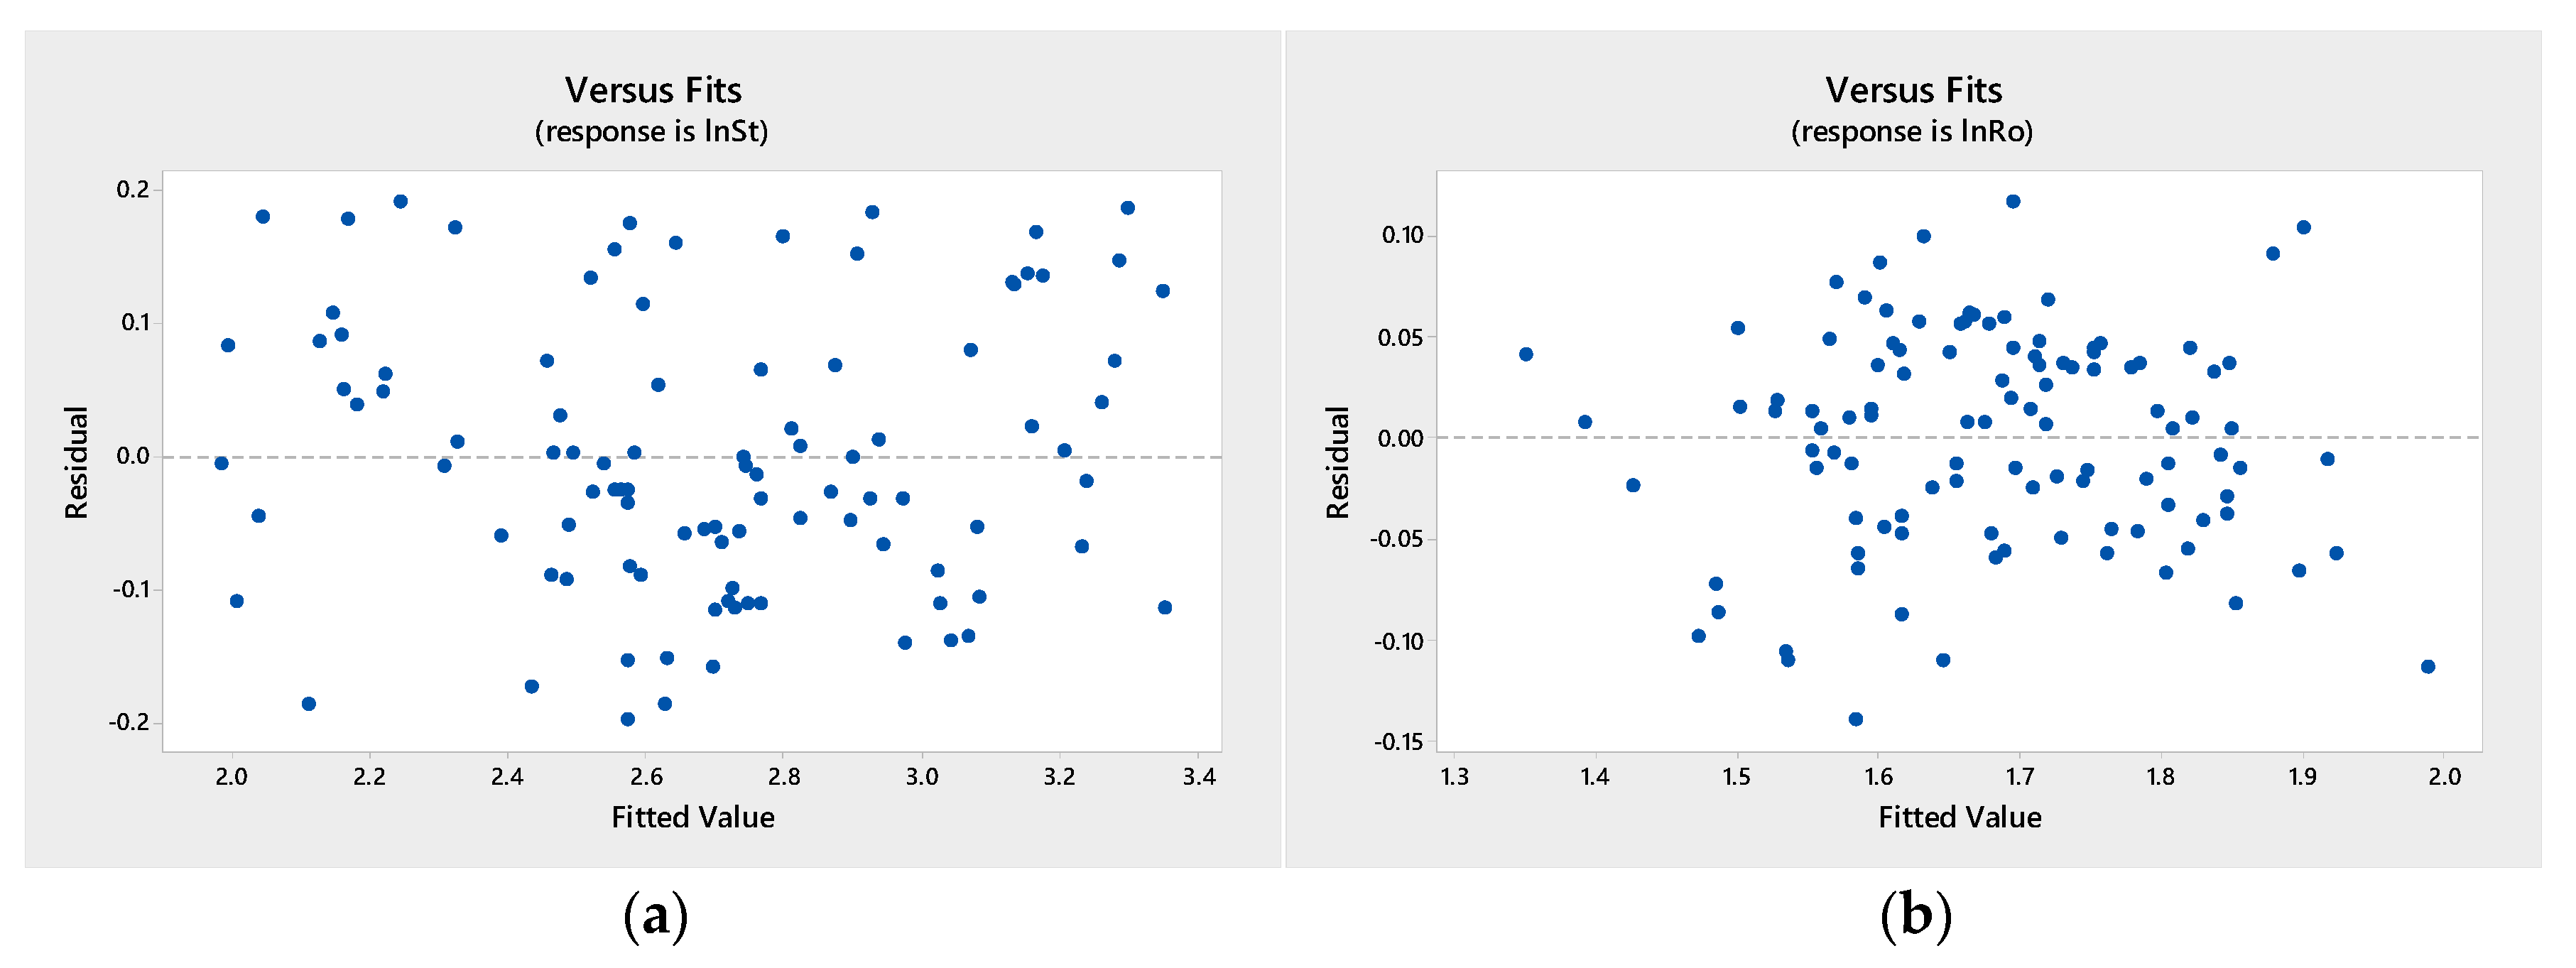
3. In-Process Prediction of Surface Roughness and Straightness with Roundness
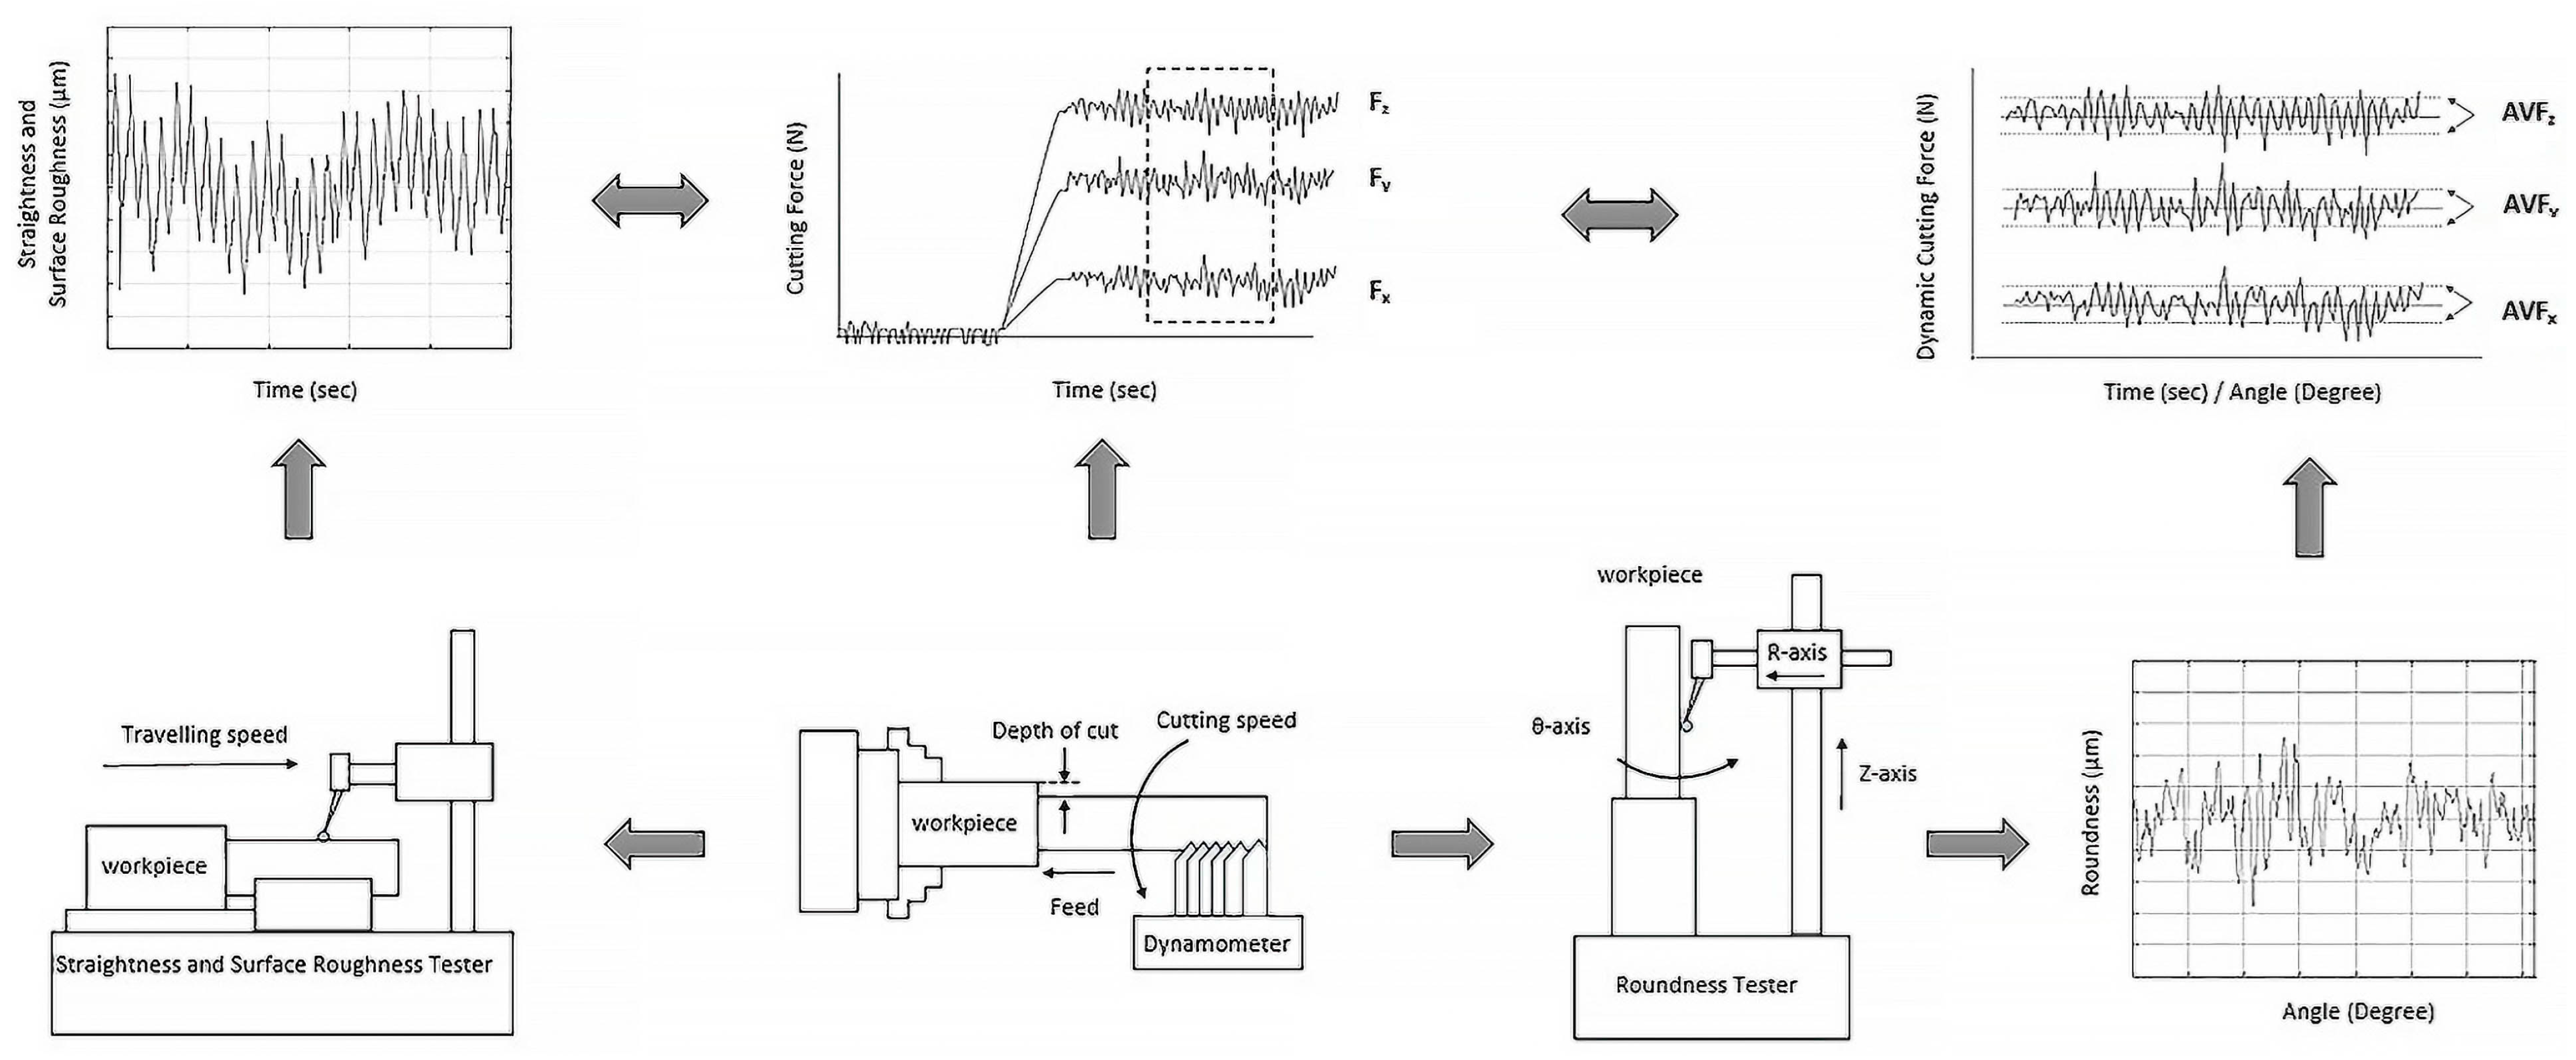
4. Experimental Setup and Cutting Conditions
- (1)
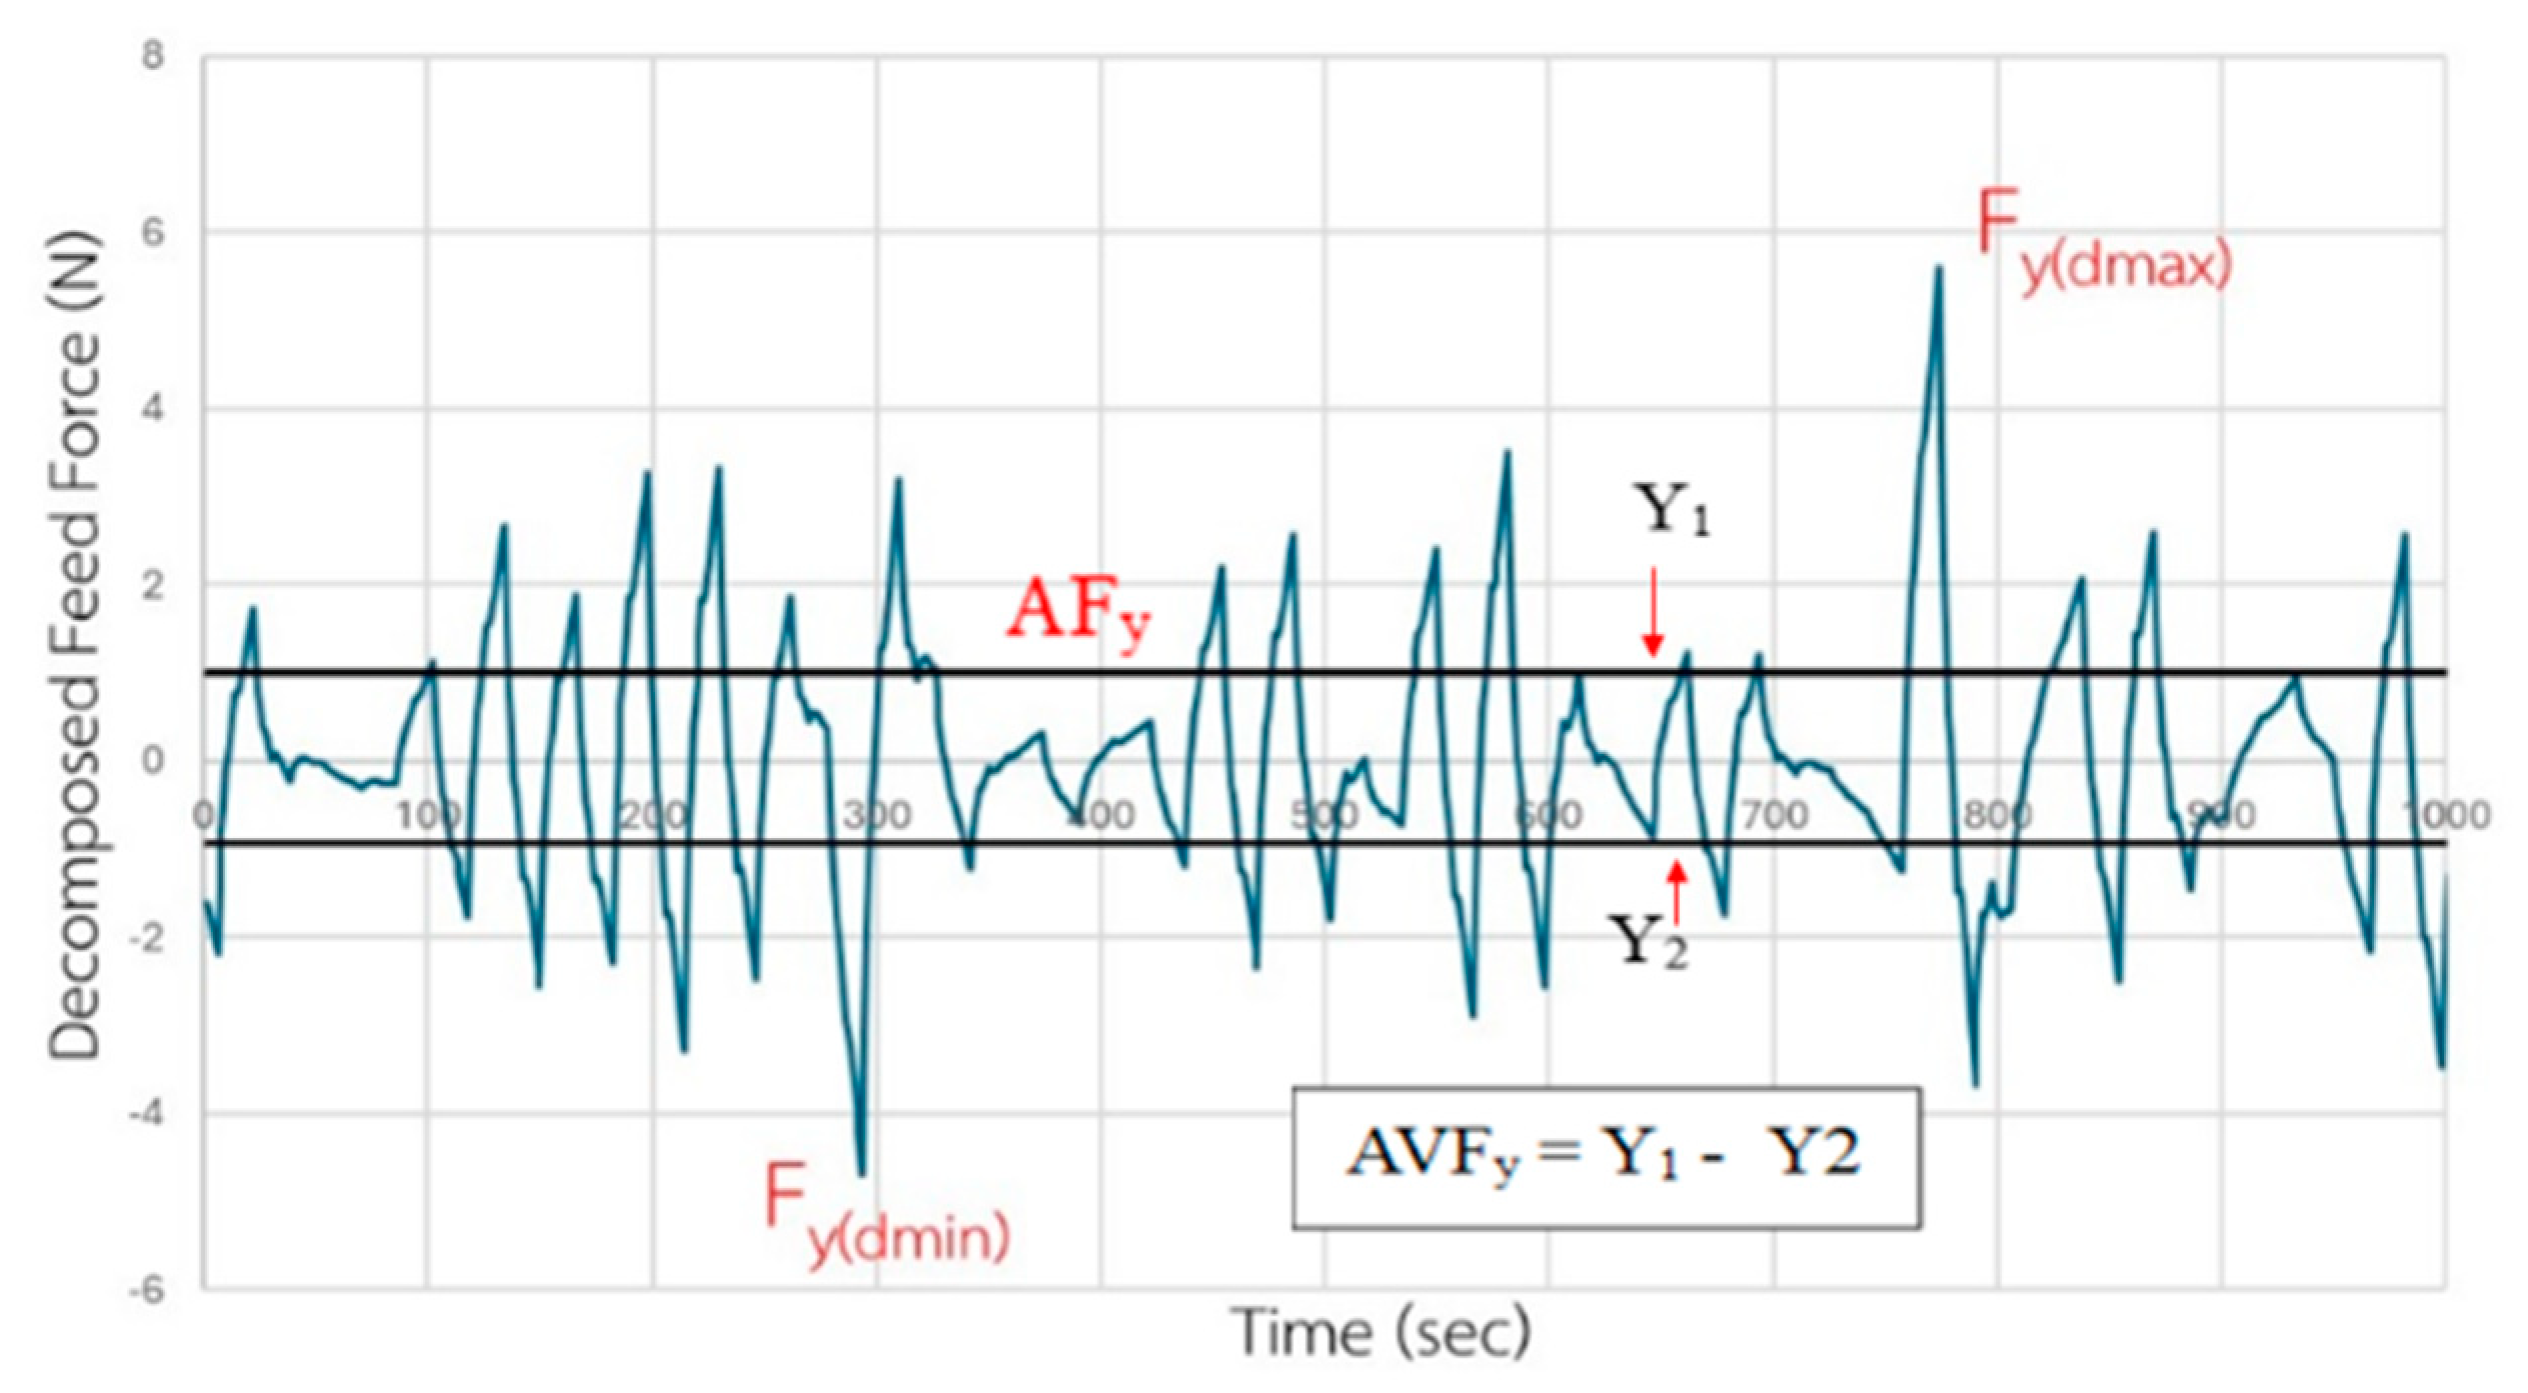
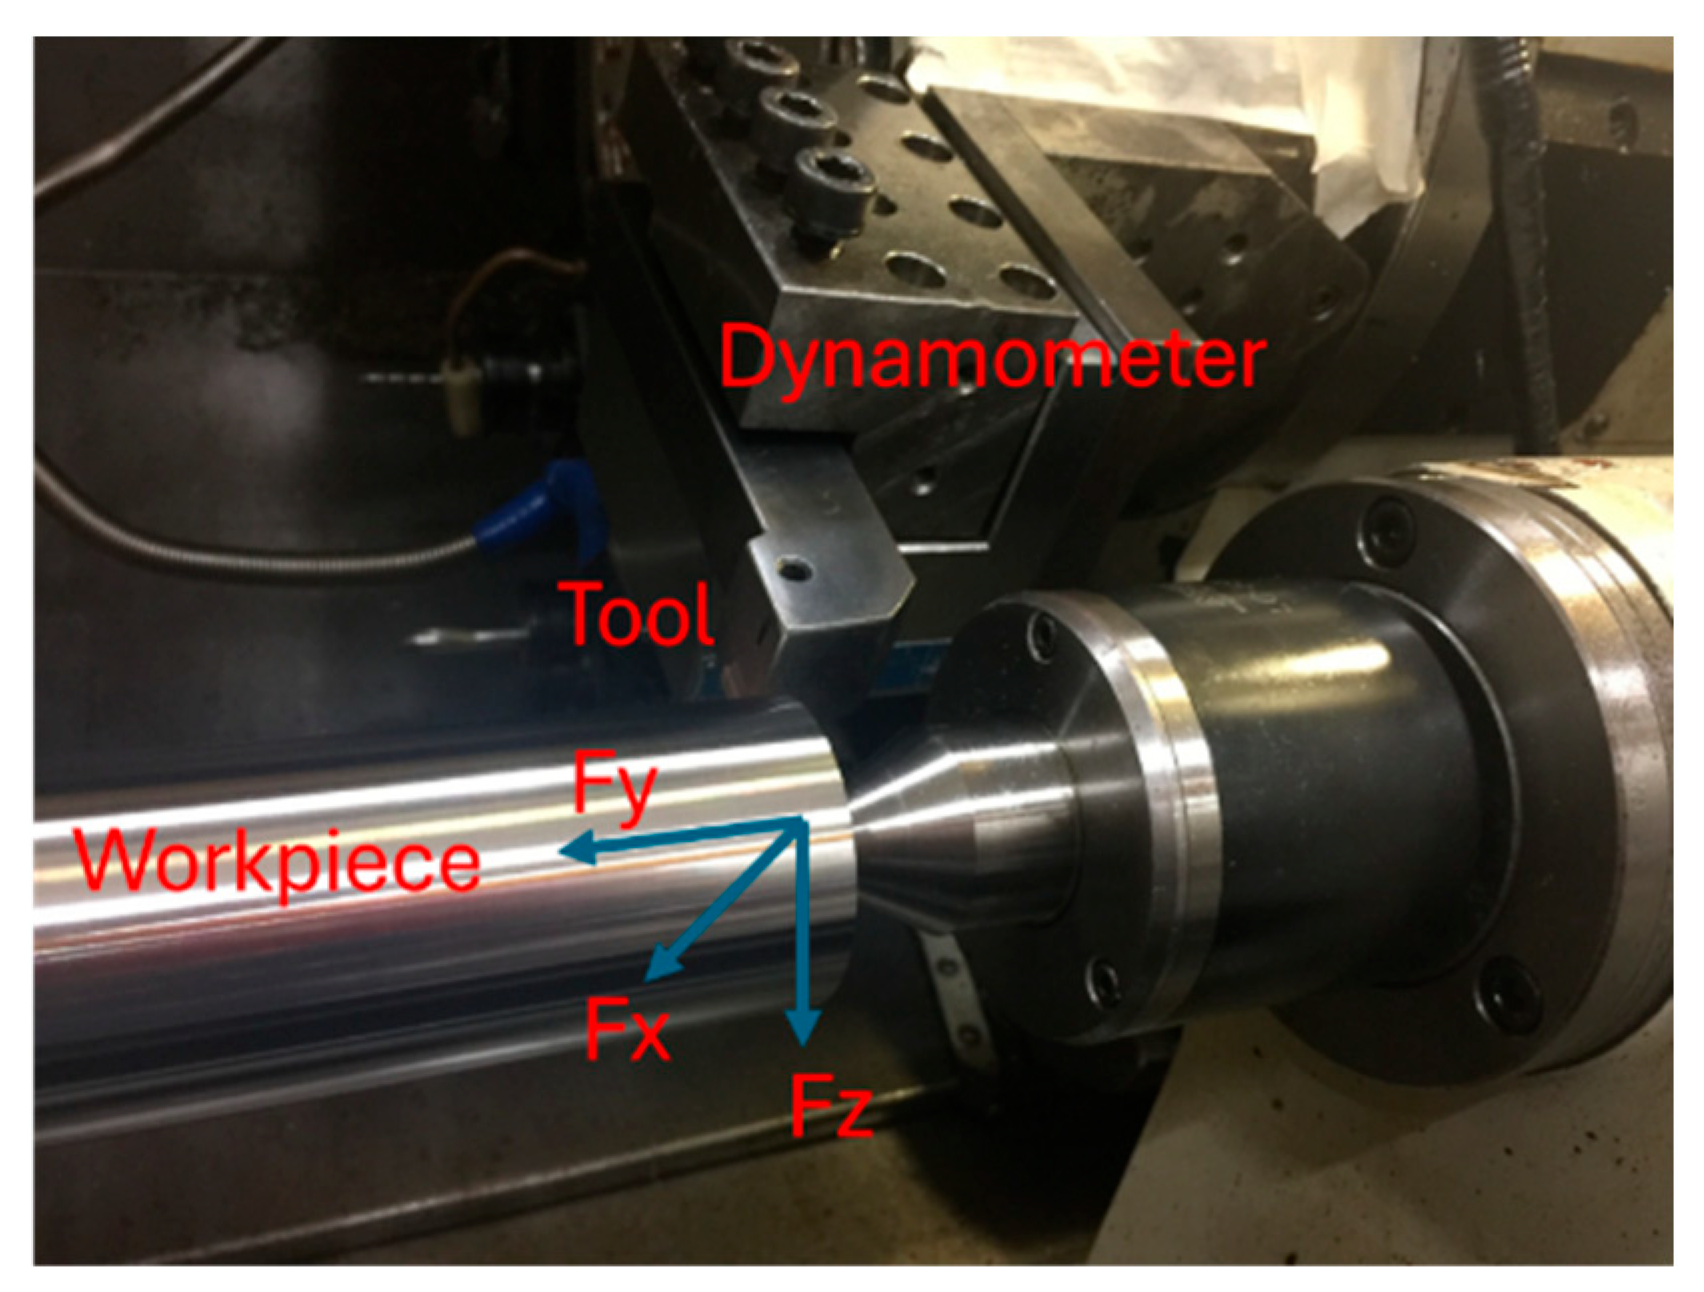
- Record the decomposed cutting forces under the major cutting conditions.
- (2)
- Monitor the corresponding time records of the surface roughness, straightness, and roundness profile with the decomposed cutting forces in the time and frequency domains.
- (3)
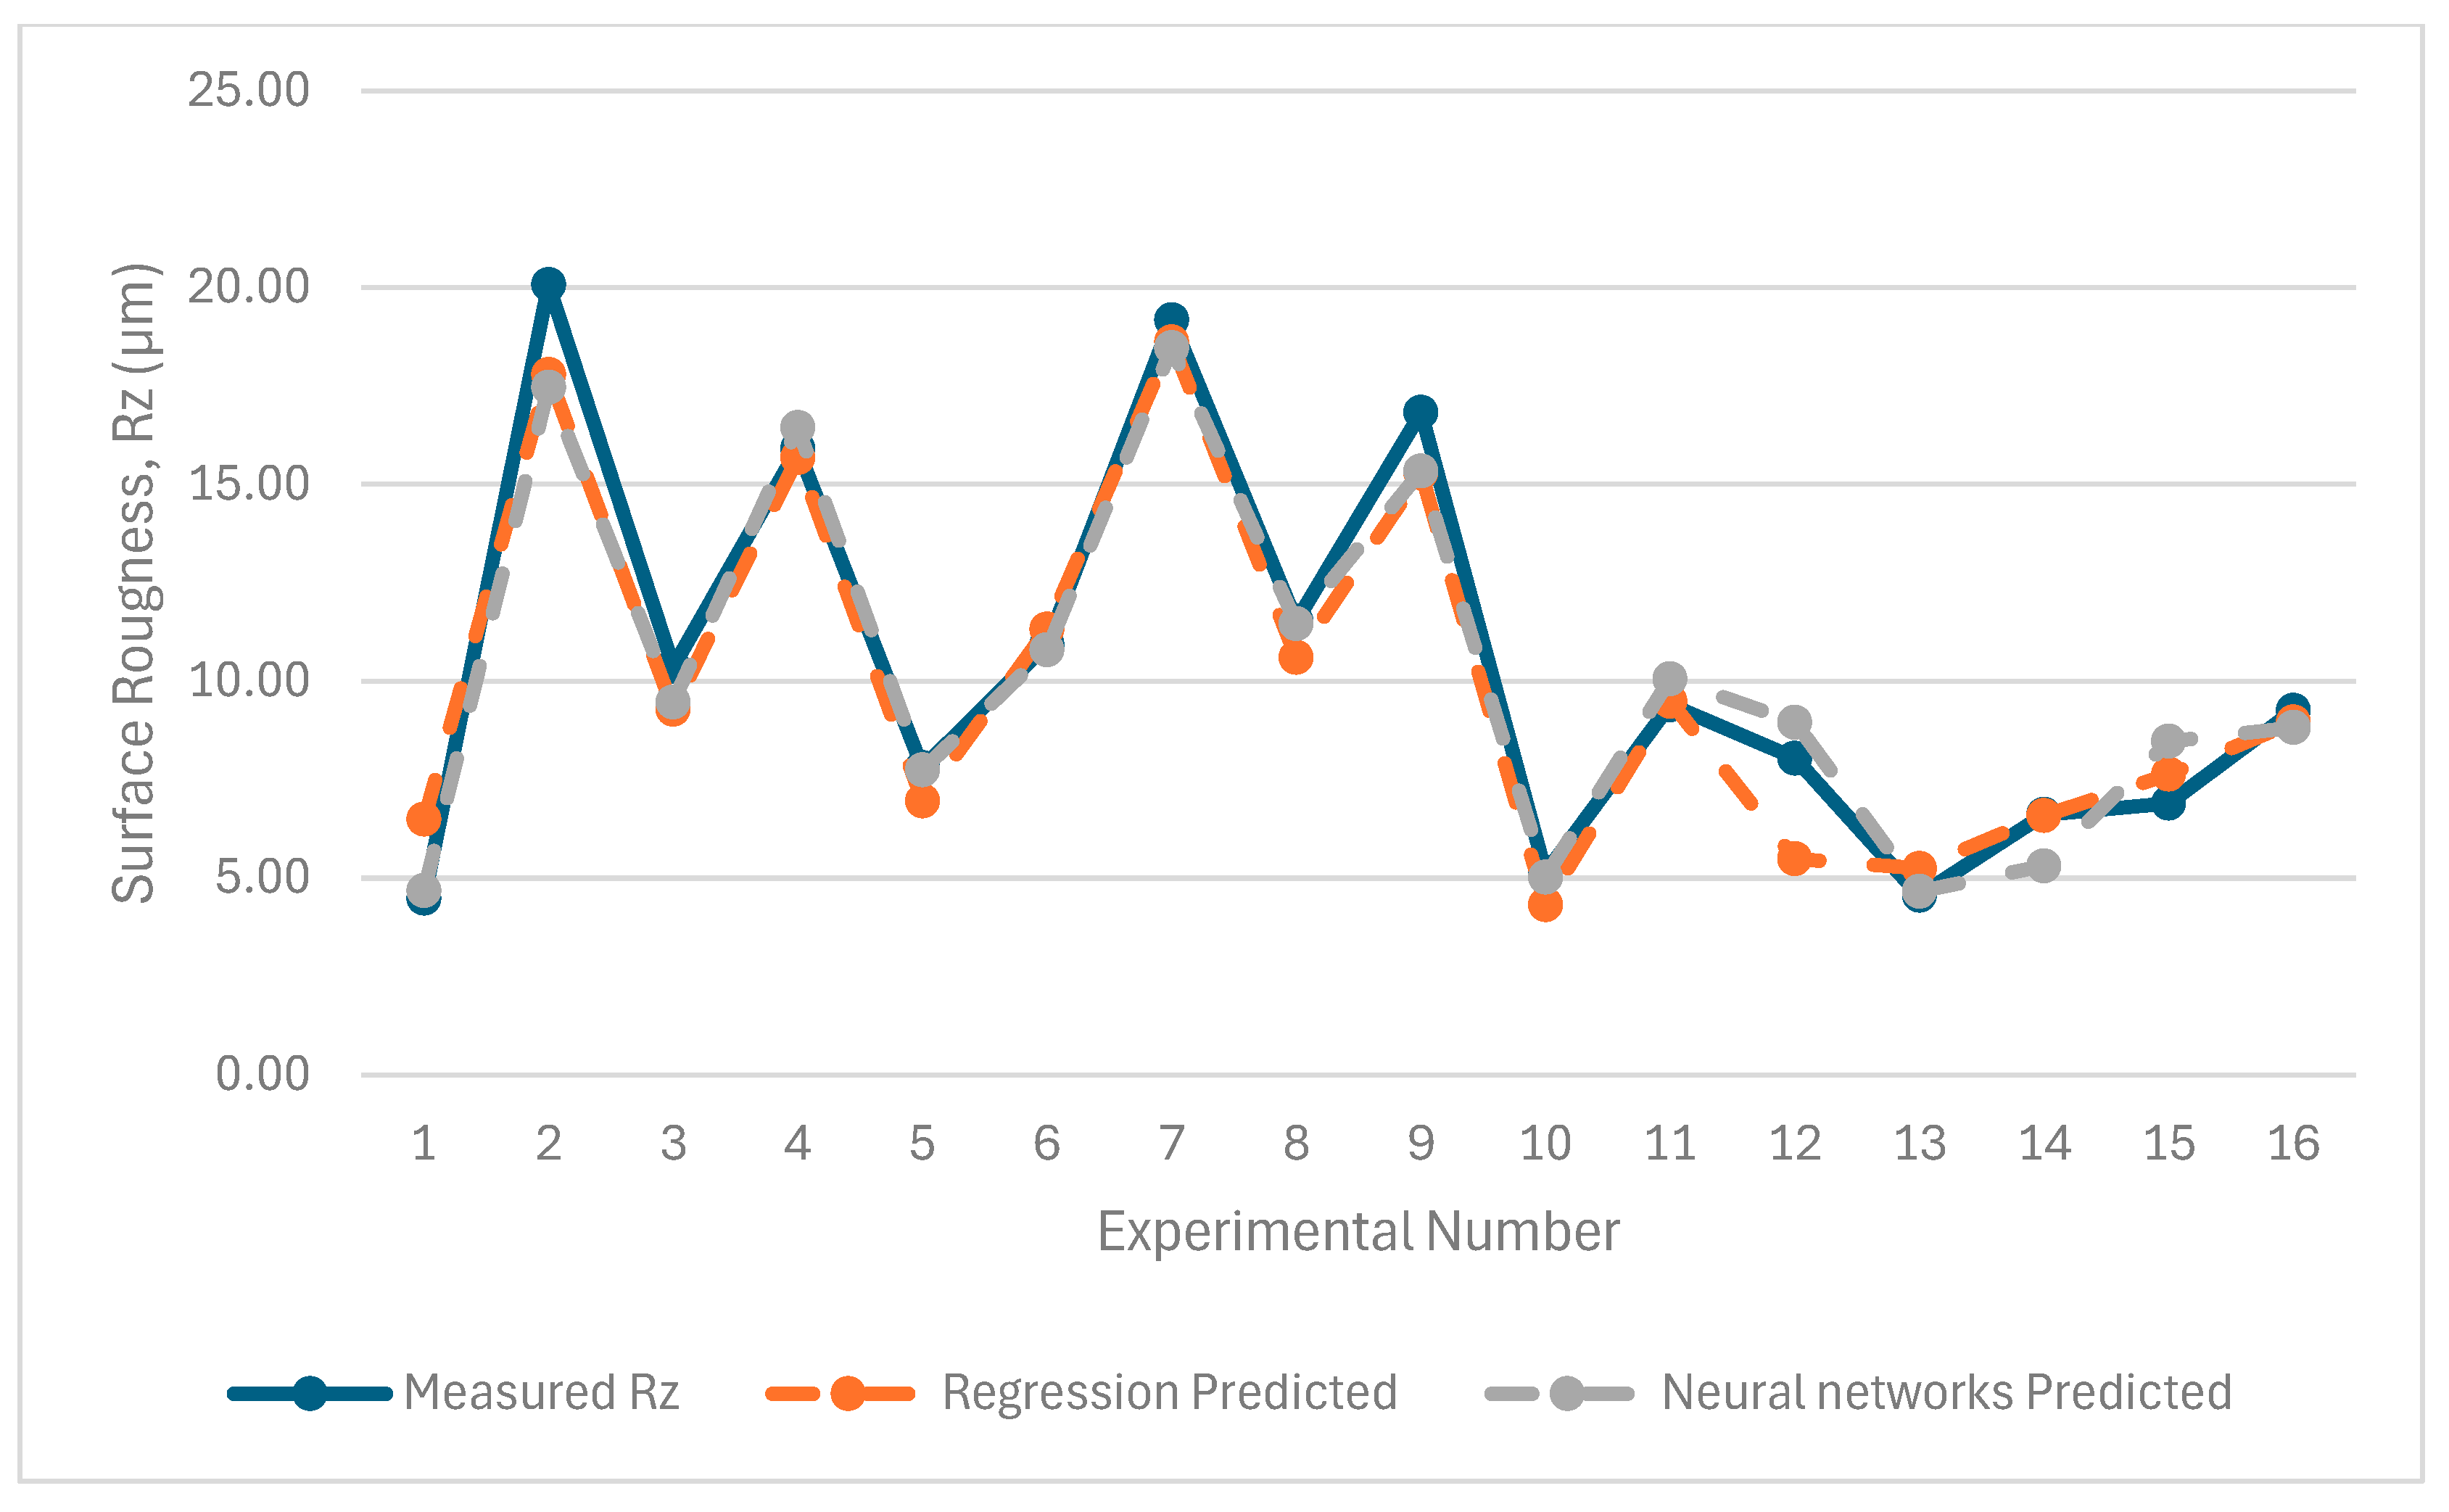
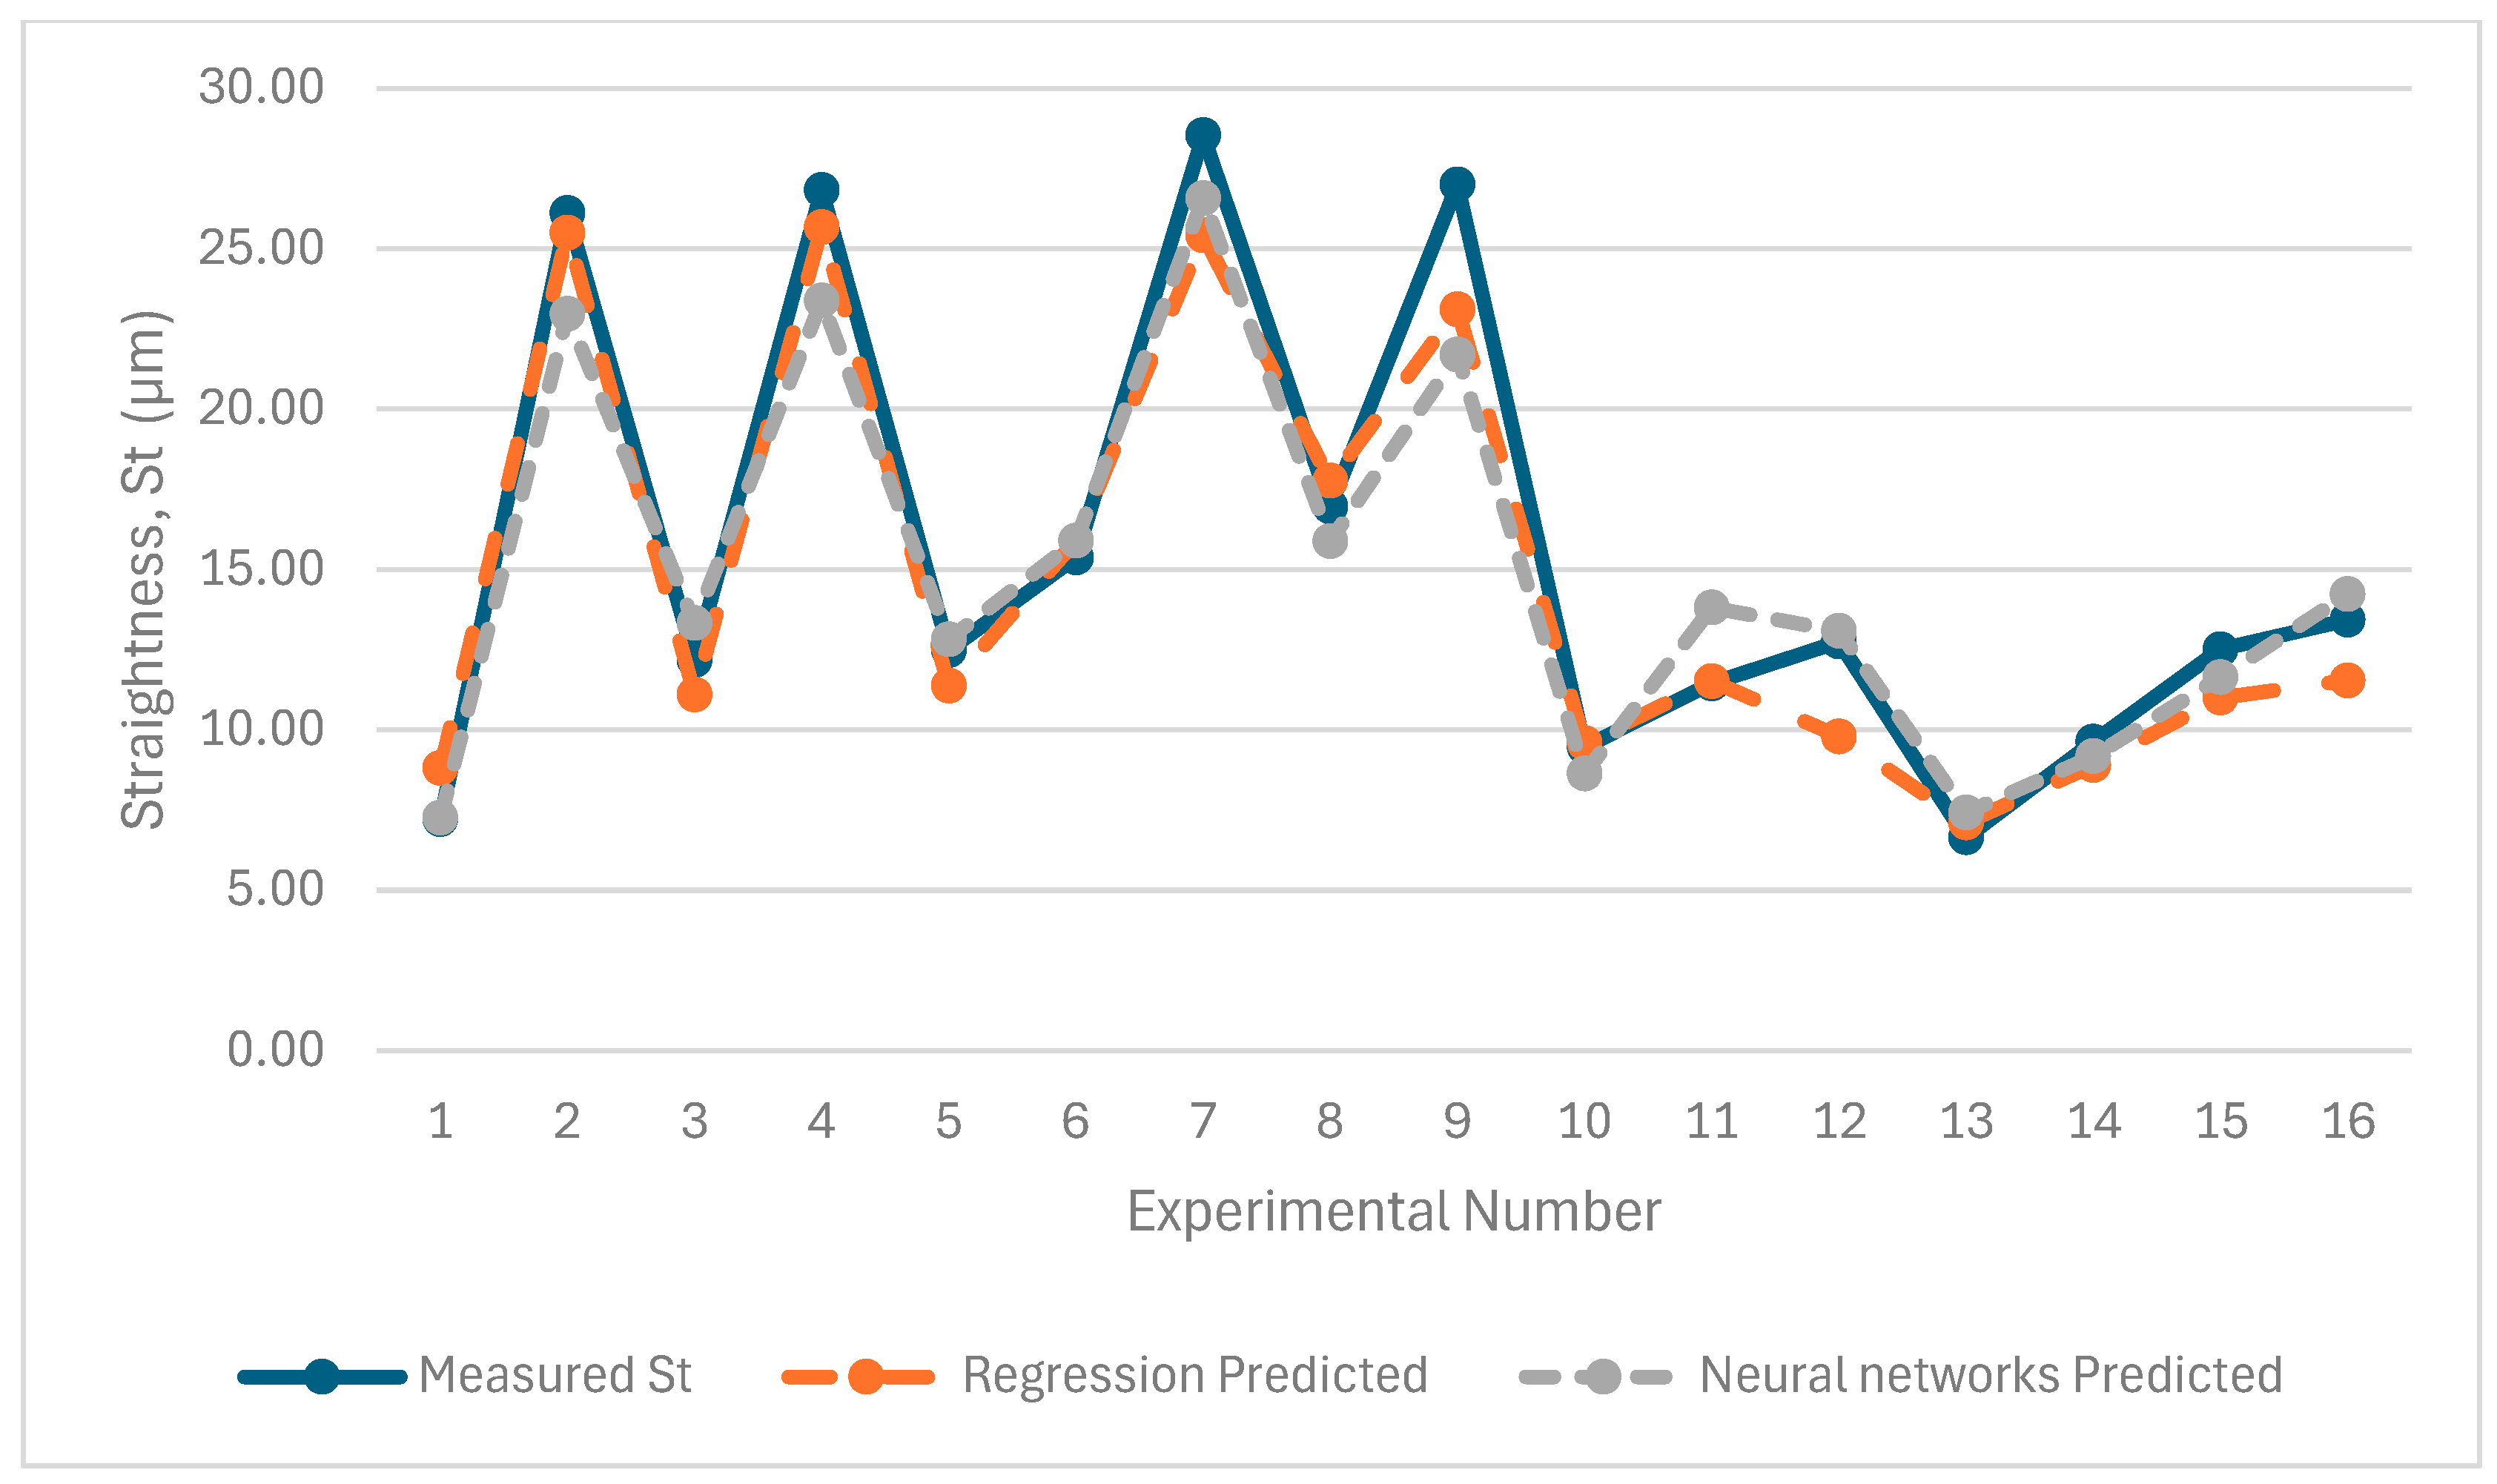
- Measure the surface roughness, straightness, and roundness profiles for each cutting condition.
- (4)
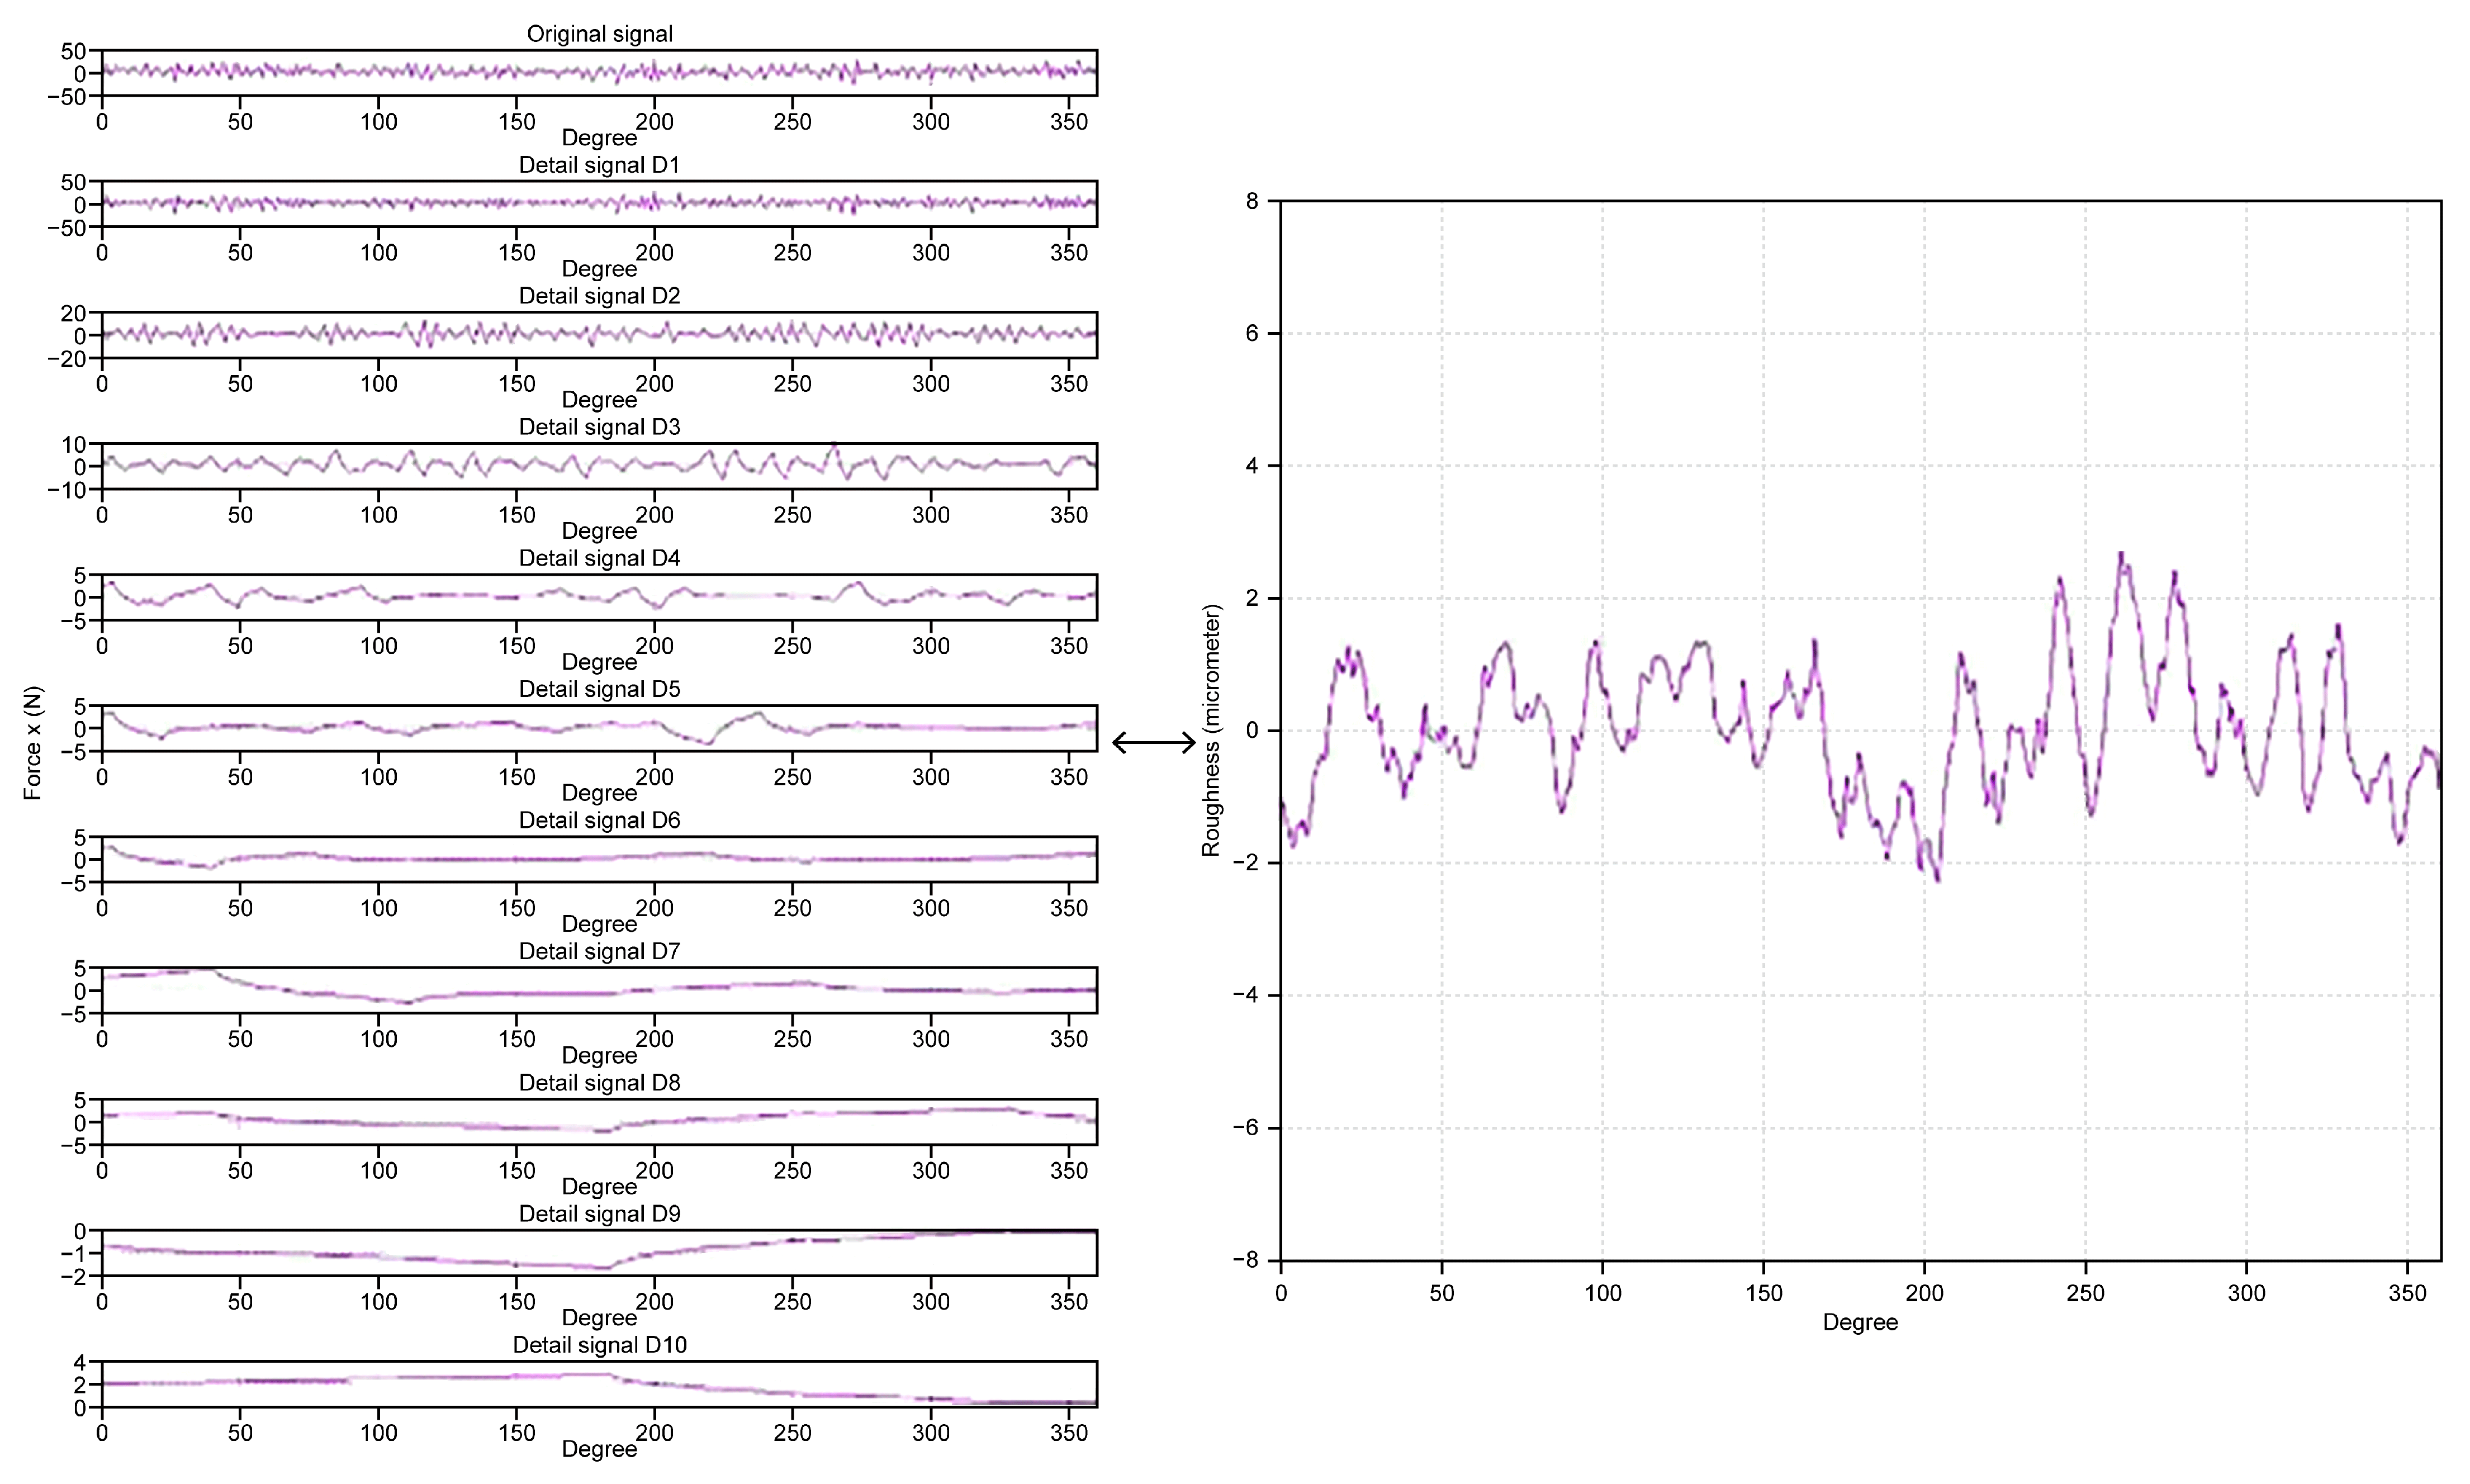
- Compute the ratios of decomposed cutting forces of , , and on the 8th level of the wavelet transform, respectively.
- (5)
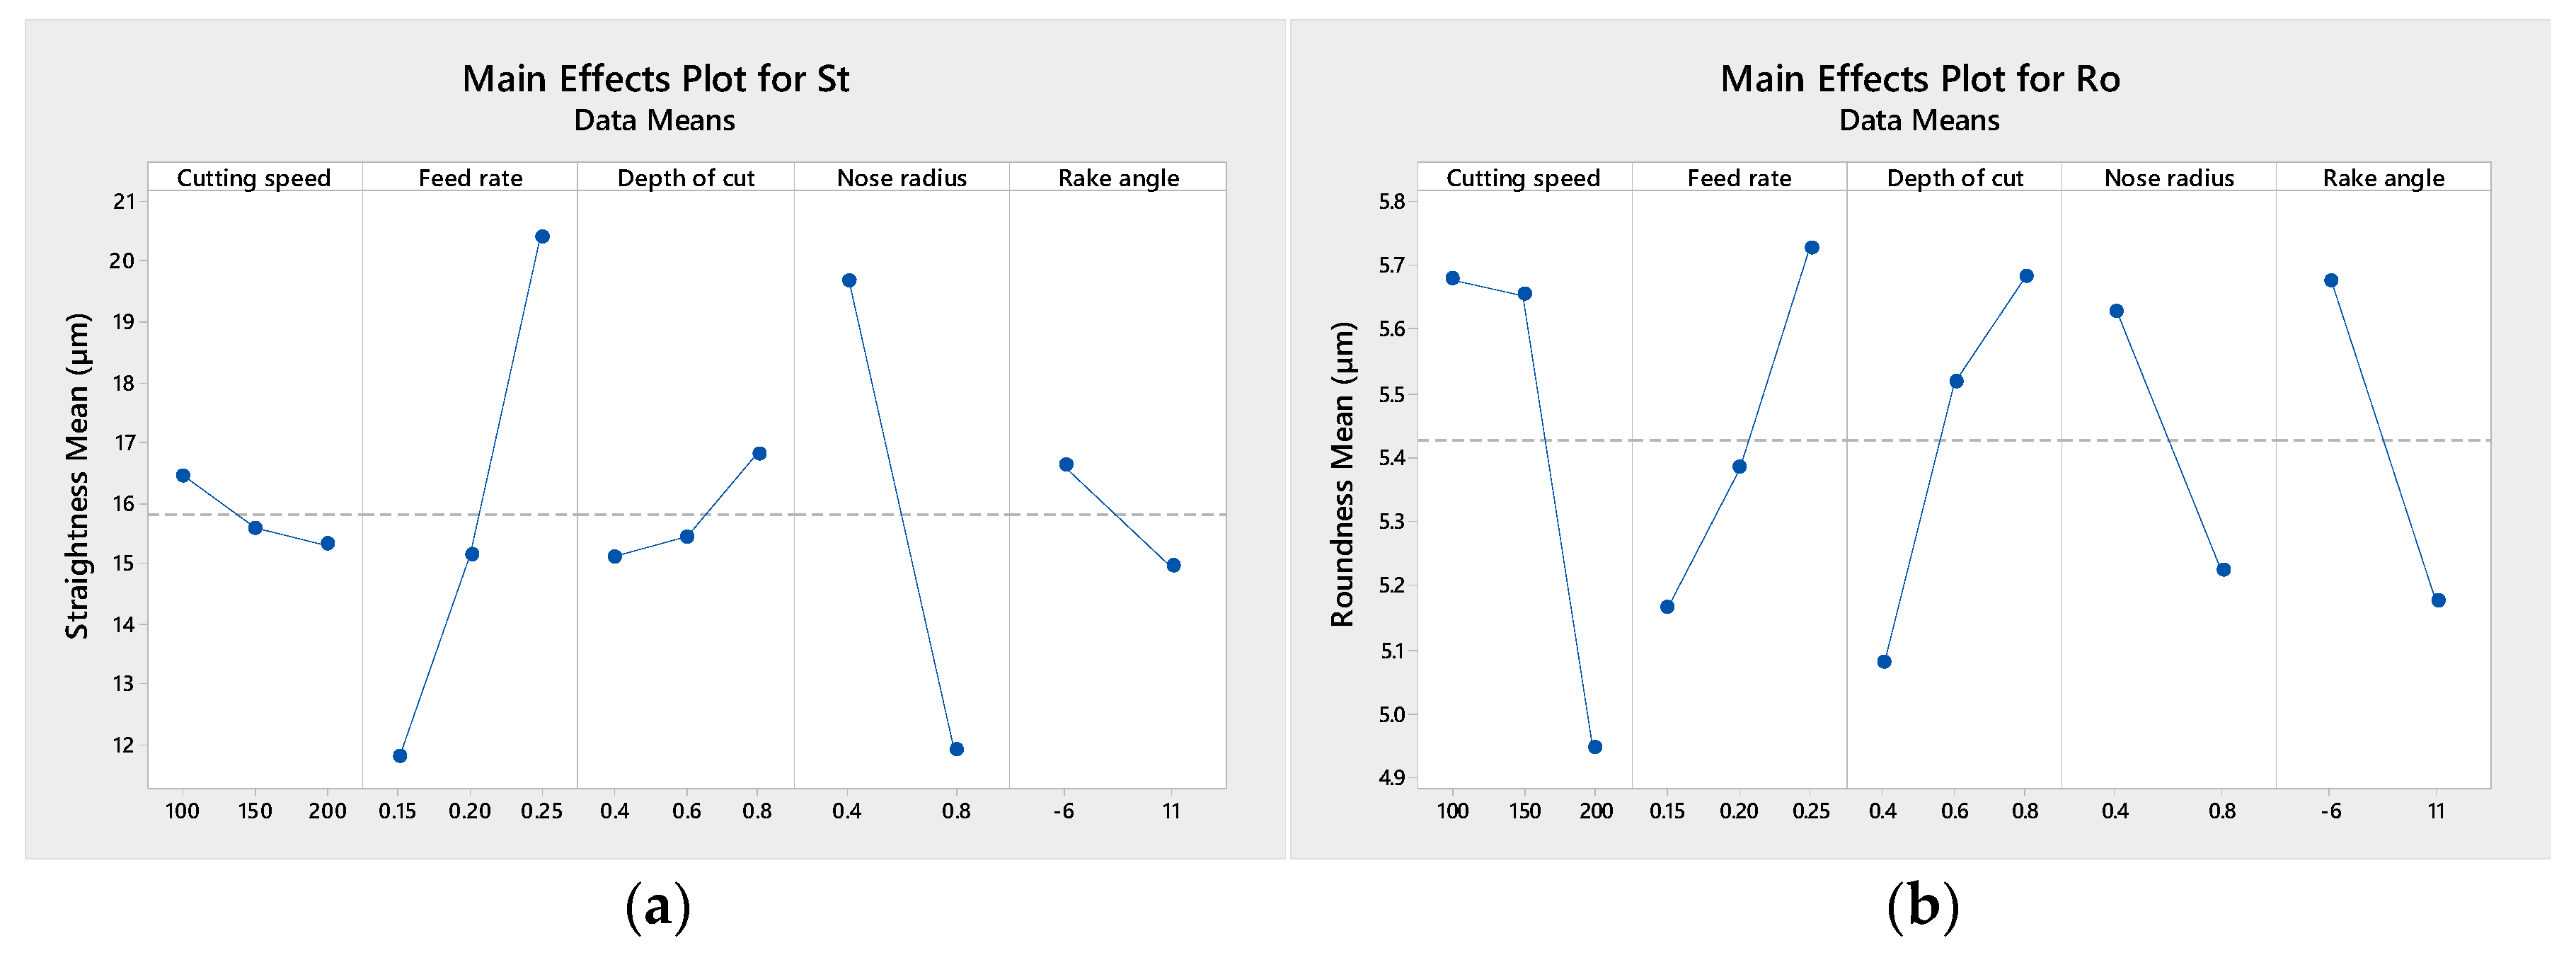
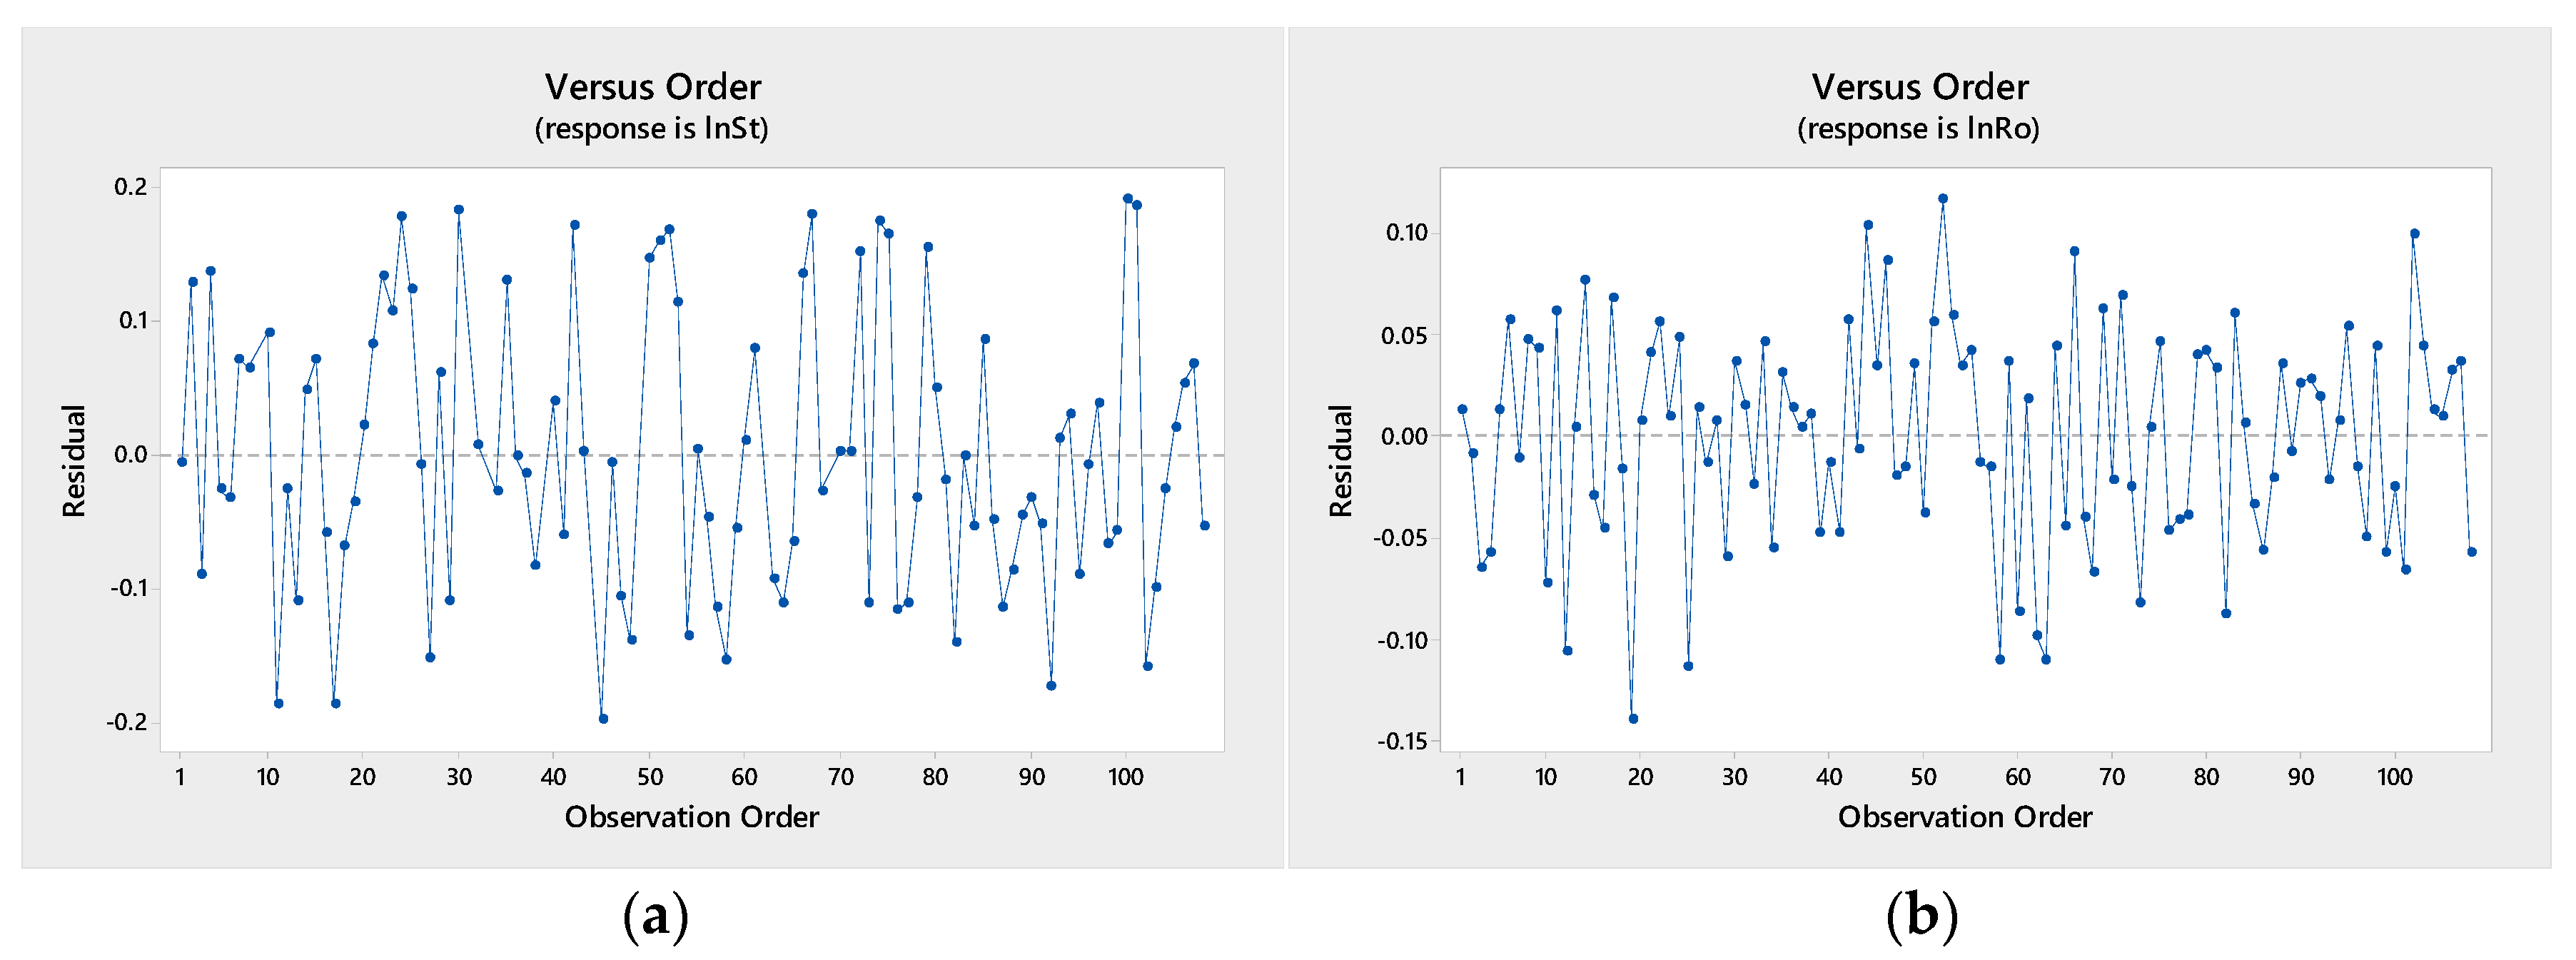
- Analyse the experimental data from steps (1) to (4) before optimising models (1) to (4) by utilising statistical analyses.
- (6)
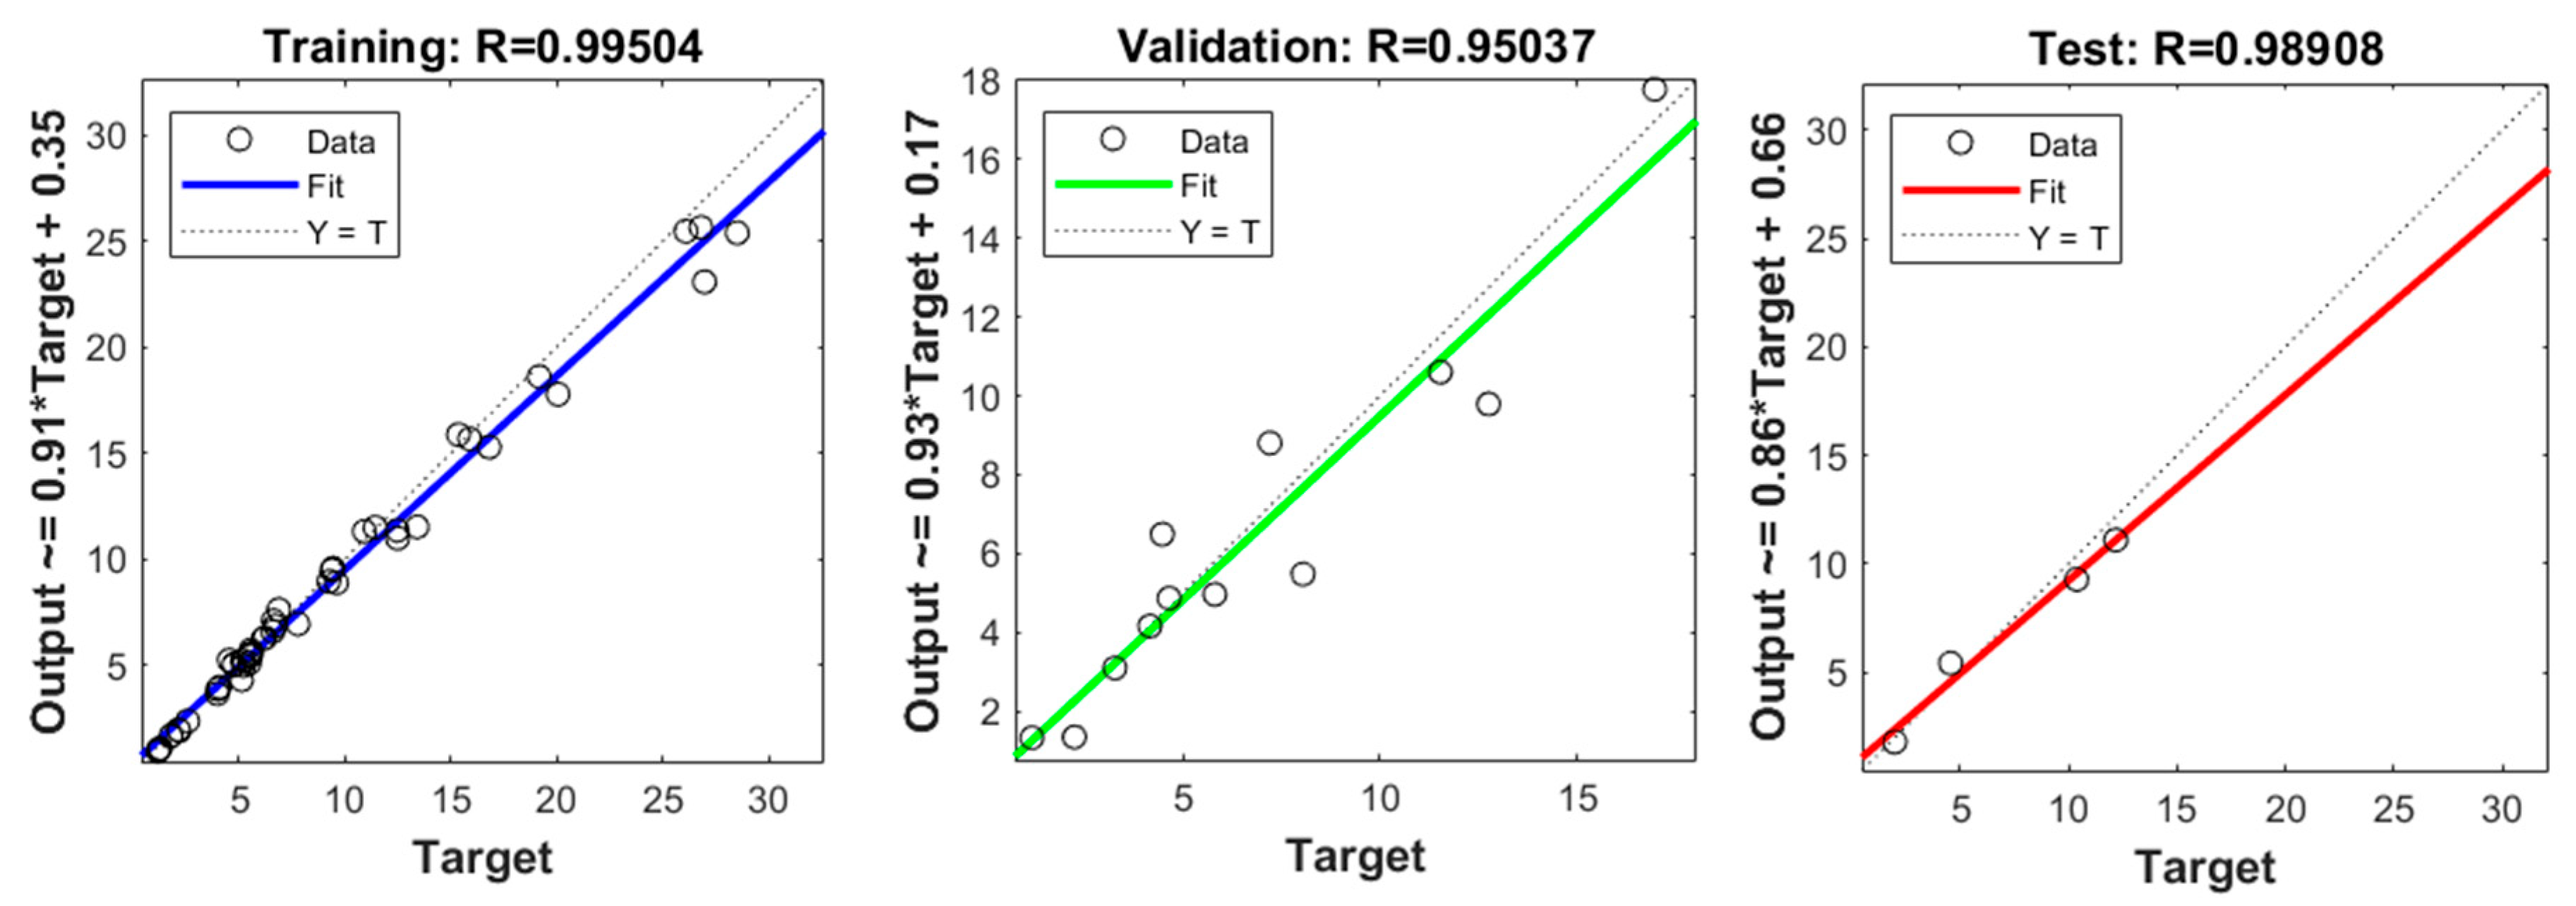
- Determine the feed-forward backpropagation neural network system for the average surface roughness (Ra), the surface roughness (Rz), the straightness (St), and the roundness (Ro) with the ratios of decomposed cutting forces under major cutting conditions to obtain the highest prediction accuracy or correlation coefficient (R).
- (7)
- Verify and compare the experimentally obtained equations from the above step (5) with the neural network system from step (6).
5. Experimental Results and Discussions
6. Conclusions
Author Contributions
Funding
Data Availability Statement
Acknowledgments
Conflicts of Interest
References
- Kumar, K.A.; Ratnam, C.; Rao, K.V.; Murthy, B.S.N. Experimental studies of machining parameters on surface roughness, flank wear, cutting forces and work piece vibration in boring of AISI 4340 steels: Modelling and optimization approach. SN Appl. Sci. 2019, 1, 26. [Google Scholar] [CrossRef]
- Ali, S.H.R.; Mohamed, H.H.; Bedewy, M.K. Identifying Cylinder Liner Wear using Precise Coordinate Measurements. Int. J. Precis. Eng. Manuf. 2009, 10, 19–25. [Google Scholar] [CrossRef]
- Ansari, H.R.; Zarei, M.J.; Sabbaghi, S.; Keshavarz, P. A new comprehensive model for relative viscosity of various nanofluids using feed-forward back-propagation MLP neural networks. Int. Commun. Heat Mass Transf. 2018, 91, 158–164. [Google Scholar] [CrossRef]
- Apostolou, G.; Ntemi, M.; Paraschos, S.; Gialampoukidis, I.; Rizzi, A.; Vrochidis, S.; Kompatsiaris, I. Novel framework for quality control in vibration monitoring of CNC machining. Sensors 2024, 24, 307. [Google Scholar] [CrossRef] [PubMed]
- Bin, H.; Kai, J.B. Digital twin-based sustainable intelligent manufacturing: A review. Int. J. Adv. Manuf. Technol. 2021, 9, 1–21. [Google Scholar] [CrossRef]
- Liu, S.; Bao, J.; Zheng, P. A review of digital twin-driven machining: From digitisation to intellectualisation. J. Manuf. Syst. 2023, 67, 361–378. [Google Scholar] [CrossRef]
- Aralikatti, S.S.; Ravikumar, K.N.; Kumar, H.; Nayaka, H.S.; Sugumaran, V. Comparative study on tool fault diagnosis methods using vibration signals and cutting force signals by machine learning technique. Struct. Durab. Health Monit. 2020, 14, 127. [Google Scholar] [CrossRef]
- Ascher, S.; Sloan, W.; Watson, I.; You, S. A comprehensive artificial neural network model for gasification process prediction. Appl. Energy 2022, 320, 119289. [Google Scholar] [CrossRef]
- Badru, D.; Singh, D.K. Analysis and effect of input parameters on surface roughness and tool flank wear in turning operation. Int. J. Eng. Sci. Technol. 2012, 4, 2759–2765. [Google Scholar]
- Benardos, P.G.; Vosniakos, G.C. Predicting surface roughness in machining: A review. Int. J. Mach. Tools Manuf. 2023, 43, 833–844. [Google Scholar] [CrossRef]
- Bhushan, R.K. Impact of nose radius and machining parameters on surface roughness, tool wear and tool life during turning of AA7075/SiC composites for green manufacturing. Mech. Adv. Mater. Mod. Process. 2020, 6, 1. [Google Scholar] [CrossRef]
- Bilski, J.; Smoląg, J.; Kowalczyk, B.; Grzanek, K.; Izonin, I. Fast computational approach to the Levenberg-Marquardt algorithm for training feedforward neural networks. J. Artif. Intell. Soft Comput. Res. 2023, 13, 45–61. [Google Scholar] [CrossRef]
- Chigirinsky, Y.L.; Krainev, D.V.; Frolov, E.M. Transformation of narratives of the cutting operation theory in passing to the «digit». Sci. Intensive Technol. Mech. Eng. 2024, 6, 3–12. [Google Scholar] [CrossRef]
- Coit, D.W.; Jackson, B.T.; Smith, A.E. Static neural network process models: Considerations and case studies. Int. J. Prod. Res. 1998, 36, 2953–2967. [Google Scholar] [CrossRef]
- Du, C.; Ho, C.L.; Kaminski, J. Prediction of product roughness, profile, and roundness using machine learning techniques for a hard turning process. Adv. Manuf. 2021, 9, 206–215. [Google Scholar] [CrossRef]
- Gao, D.; Liao, Z.; Lv, Z.; Lu, Y. Multi-scale statistical signal processing of cutting force in cutting tool condition monitoring. Int. J. Adv. Manuf. Technol. 2015, 80, 1843–1853. [Google Scholar] [CrossRef]
- Garcia Plaza, E.; Nunez Lopez, P.J.; Beamud Gonzalez, E.M. Multi-sensor data fusion for real-time surface quality control in automated machining systems. Sensors 2018, 18, 4381. [Google Scholar] [CrossRef]
- Guo, J.; Han, R. A united model of diametral error in slender bar turning with a follower rest. Int. J. Mach. Tools Manuf. 2006, 46, 1002–1012. [Google Scholar] [CrossRef]
- Han, R.; Cui, B.; Guo, J. In-Process Monitoring of Dimensional Errors in Turning Slender Bar Using Artificial Neural Networks. Comput. Support. Coop. Work. Des. 2006, 4402, 277–286. [Google Scholar] [CrossRef]
- Hu, Z.; Jiang, G.; Mei, X.; Yun, X.; Zhang, Y. Online prediction of milling inner hole roundness error based on accurate SSEM value extraction. Shock. Vib. 2019, 2019, 6049316. [Google Scholar] [CrossRef]
- Hua, Y.; Liu, Z. Effects of cutting parameters and tool nose radius on surface roughness and work hardening during dry turning Inconel 718. Int. J. Adv. Manuf. Technol. 2018, 96, 2421–2430. [Google Scholar] [CrossRef]
- Ivanova, T.N.; Muyzemnek, A.Y. Determining the modes of layerwise laser welding of corrosion-resistant steel plates. University proceedings. Volga Region. Eng. Sci. 2023, 1, 159–170. (In Russian) [Google Scholar] [CrossRef]
- Jáuregui, J.C.; Reséndiz, J.R.; Thenozhi, S.; Szalay, T.; Jacsó, Á.; Takács, M. Frequency and time-frequency analysis of cutting force and vibration signals for tool condition monitoring. IEEE Access 2018, 6, 6400–6410. [Google Scholar] [CrossRef]
- Kanovic, Z.; Vukelic, D.; Simunovic, K.; Prica, M.; Saric, T.; Tadic, B.; Simunovic, G. The modelling of surface roughness after the ball burnishing process with a high-stiffness tool by using regression analysis, artificial neural networks, and support vector regression. Metals 2022, 12, 320. [Google Scholar] [CrossRef]
- Kasim, M.S.; Hafiz, M.S.A.; Ghani, J.A.; Haron, C.H.C.; Izamshah, R.; Sundi, S.A.; Mohamed, S.B.; Othman, I.S. Investigation of surface topology in ball nose end milling process of Inconel 718. Wear 2019, 426, 1318–1326. [Google Scholar] [CrossRef]
- Khandey, U. Optimization of Surface Roughness, Material Removal Rate and Cutting Tool Flank Wear in Turning Using Extended Taguchi Approach. Ph.D. Thesis, National Institute of Technology, Rourkela, India, 28 May 2009. [Google Scholar]
- Kilic, B.; Aguirre, A.; Raman, S. Inspection of the cylindrical surface feature after turning using coordinate metrology. Int. J. Mach. Tools Manuf. 2007, 47, 1893–1903. [Google Scholar] [CrossRef]
- Kusiak, A. Smart manufacturing must embrace big data. Nature 2018, 554, 23–25. [Google Scholar] [CrossRef]
- Kwak, J.S. Application of wavelet transform technique to detect tool failure in turning operations. Int. J. Adv. Manuf. Technol. 2006, 28, 1078–1083. [Google Scholar] [CrossRef]
- Liang, S.Y.; Hecker, R.L.; Landers, R.G. Machining process monitoring and control: The state-of-the-art. J. Manuf. Sci. Eng. 2004, 126, 297–310. [Google Scholar] [CrossRef]
- Liotto, G.; Wang, C. Straightness measurement of a long guide way A comparison of dual-beam laser technique and optical collimator. In Proceedings of the 2nd International Symposium on Precision Mechanical Measurements, Beijing, China, 24–28 August 2004. [Google Scholar]
- Lu, C. Study on prediction of surface quality in machining process. J. Mater. Process. Technol. 2008, 205, 439–450. [Google Scholar] [CrossRef]
- Lu, Y. Industry 4.0: A survey on technologies, applications and open research issues. J. Ind. Inf. Integr. 2017, 6, 1–10. [Google Scholar] [CrossRef]
- Manjunath, K.; Tewary, S.; Khatri, N.; Cheng, K. Monitoring and predicting the surface generation and surface roughness in ultraprecision machining: A critical review. Machines 2021, 9, 369. [Google Scholar] [CrossRef]
- Mayer, R.; Phan, A.; Cloutier, G. Prediction of diameter errors in bar turning: A computationally effective model. Appl. Math. Model. 2000, 24, 943–956. [Google Scholar] [CrossRef]
- Moreira, L.C.; Li, W.D.; Lu, X.; Fitzpatrick, M.E. Supervision controller for real-time surface quality assurance in CNC machining using artificial intelligence. Comput. Ind. Eng. 2019, 127, 158–168. [Google Scholar] [CrossRef]
- Nallusamy, S. Enhancement of productivity and efficiency of CNC machines in a small scale industry using total productive maintenance. Int. J. Eng. Res. Afr. 2016, 25, 119–126. [Google Scholar] [CrossRef]
- Ntemi, M.; Paraschos, S.; Karakostas, A.; Gialampoukidis, I.; Vrochidis, S.; Kompatsiaris, I. Infrastructure monitoring and quality diagnosis in CNC machining: A review. CIRP J. Manuf. Sci. Technol. 2022, 38, 631–649. [Google Scholar] [CrossRef]
- Parenti, P.; Leonesio, M.; Bianchi, G. Model-based adaptive process control for surface finish improvement in traverse grinding. Mechatronics 2016, 36, 97–111. [Google Scholar] [CrossRef]
- Płodzień, M.; Żyłka, Ł.; Stoić, A. Modelling of the face-milling process by toroidal cutter. Materials 2023, 16, 2829. [Google Scholar] [CrossRef]
- Rahman, M.A.; Saleh, T.; Jahan, M.P.; McGarry, C.; Chaudhari, A.; Huang, R.; Tauhiduzzaman, M.; Ahmed, A.; Mahmud, A.A.; Bhuiyan, M.S.; et al. Review of intelligence for additive and subtractive manufacturing: Current status and future prospects. Micromachines 2023, 14, 508. [Google Scholar] [CrossRef]
- Raut, M.; Verma, D.D.S. To improve quality and reduce rejection level through quality control. Int. J. Recent Innov. Trends Comput. Commun. 2017, 5, 764–768. [Google Scholar]
- Selvaraj, P.; Radhakrishnan, P.; Adithan, M. An integrated approach to design for manufacturing and assembly based on reduction of product development time and cost. Int. J. Adv. Manuf. Technol. 2009, 42, 13–29. [Google Scholar] [CrossRef]
- Shawky, A.M.; Elbestawi, M.A. In-process evaluation of workpiece geometrical tolerances in bar turning. Int. J. Mach. Tools Manuf. 1996, 36, 33–46. [Google Scholar] [CrossRef]
- Srinivasan, R.S.; Wood, K.L.; McAdams, D. Functional tolerancing: A design for manufacturing methodology. In Proceedings of the In International Design Engineering Technical Conferences and Computers and Information in Engineering Conference, Boston MA, USA, 17–20 September 1995; Volume 17179, pp. 465–482. [Google Scholar]
- Stathatos, E.; Tzimas, E.; Benardos, P.; Vosniakos, G.C. Convolutional neural networks for raw signal classification in CNC turning process monitoring. Sensors 2024, 24, 1390. [Google Scholar] [CrossRef] [PubMed]
- Subramanian, K. Finishing methods using multipoint or random cutting edges. In Surface Engineering; ASM International: Almere, The Netherland, 1994; pp. 90–109. [Google Scholar]
- Sukthomya, W.; Tannock, J.D. Taguchi experimental design for manufacturing process optimisation using historical data and a neural network process model. Int. J. Qual. Reliab. Manag. 2005, 22, 485–502. [Google Scholar] [CrossRef]
- Sung, A.N.; Ratnam, M.M.; Loh, W.P. Effect of tool nose profile tolerance on surface roughness in finish turning. Int. J. Adv. Manuf. Technol. 2015, 76, 2083–2098. [Google Scholar] [CrossRef]
- Tangjitsitcharoen, S. Intelligent Monitoring of Tool Wear and Quality Control of Roughness with Roundness in CNC Turning. Int. J. Adv. Manuf. Technol. 2024, 135, 2337–2354. [Google Scholar] [CrossRef]
- Tangjitsitcharoen, S.; Chanthana, D. In-process prediction of roundness based on dynamic cutting forces. Int. J. Adv. Manuf. Technol. 2017, 94, 2229–2238. [Google Scholar] [CrossRef]
- Tangjitsitcharoen, S.; Haruetai, L. Intelligent monitoring and prediction of tool wear in CNC turning by utilising wavelet transform. Int. J. Adv. Manuf. Technol. 2018, 99, 2219–2230. [Google Scholar] [CrossRef]
- Tangjitsitcharoen, S.; Laiwatthanapaisan, W. Straightness Prediction in CNC Turning Process for Carbon Steel and Aluminum Workpieces Applying Artificial Neural Networks. Int. J. Mach. Learn. Comput. 2022, 12, 1098. [Google Scholar] [CrossRef]
- Tangjitsitcharoen, S.; Samanmit, K. Monitoring of chip breaking and surface roughness in computer numerical control turning by utilising wavelet transform of dynamic cutting forces. J. Eng. Manuf. 2017, 231, 2479–2494. [Google Scholar] [CrossRef]
- Wang, S.; Wan, J.; Zhang, D.; Li, D.; Zhang, C. Towards smart factory for industry 4.0: A self-organised multi-agent system with big data based feedback and coordination. Comput. Netw. 2016, 101, 158–168. [Google Scholar] [CrossRef]
- Wong, S.Y.; Chuah, J.H.; Yap, H.J. Technical data-driven tool condition monitoring challenges for CNC milling: A review. Int. J. Adv. Manuf. Technol. 2020, 107, 4837–4857. [Google Scholar] [CrossRef]
- Wang, X.; Da, Z.J.; Balaji, A.K.; Jawahir, I.S. Performance-based predictive models and optimization methods for turning operations and applications: Part 3—Optimum cutting conditions and selection of cutting tools. J. Manuf. Process. 2007, 9, 61–74. [Google Scholar] [CrossRef]
- Yang, B.D.; Menq, C.H. Compensation for form error of end-milled sculptured surfaces using discrete measurement data. Int. J. Mach. Tools Manuf. 1993, 33, 725–740. [Google Scholar] [CrossRef]
- Yoon, M.C.; Chin, D.H. Cutting force monitoring in the endmilling operation for chatter detection. Proc. Inst. Mech. Eng. Part B: J. Eng. Manuf. 2005, 219, 455–465. [Google Scholar] [CrossRef]
- Zębala, W.; Plaza, M. Comparative study of 3-and 5-axis CNC centers for free-form machining of difficult-to-cut material. Int. J. Prod. Econ. 2014, 158, 345–358. [Google Scholar] [CrossRef]


| Parameter | Value |
|---|---|
| Cutting Tool | Coated Carbide |
| Workpiece | S45C |
| Cutting Speed (m/min) | 100, 150, 180, 200, 260 |
| Feed Rate (mm/rev) | 0.1, 0.15, 0.2, 0.25, 0.3 |
| Depth of Cut (mm) | 0.2, 0.4, 0.5, 0.6, 0.8 |
| Nose Radius (mm) | 0.4, 0.8 |
| Rake Angle (degree) | –6, +11 |
| Cutting Tool | Coated Carbide |
|---|---|
| Cutting condition | Dry cutting |
| Workpiece | S45C |
| Cutting speed (m/min) | 100, 150, 200 |
| Feed rate (mm/rev) | 0.15, 0.2, 0.25 |
| Depth of cut (mm) | 0.4, 0.6, 0.8 |
| Nose radius (mm) | 0.4, 0.8 |
| Rake angle (degree) | −6, +11 |
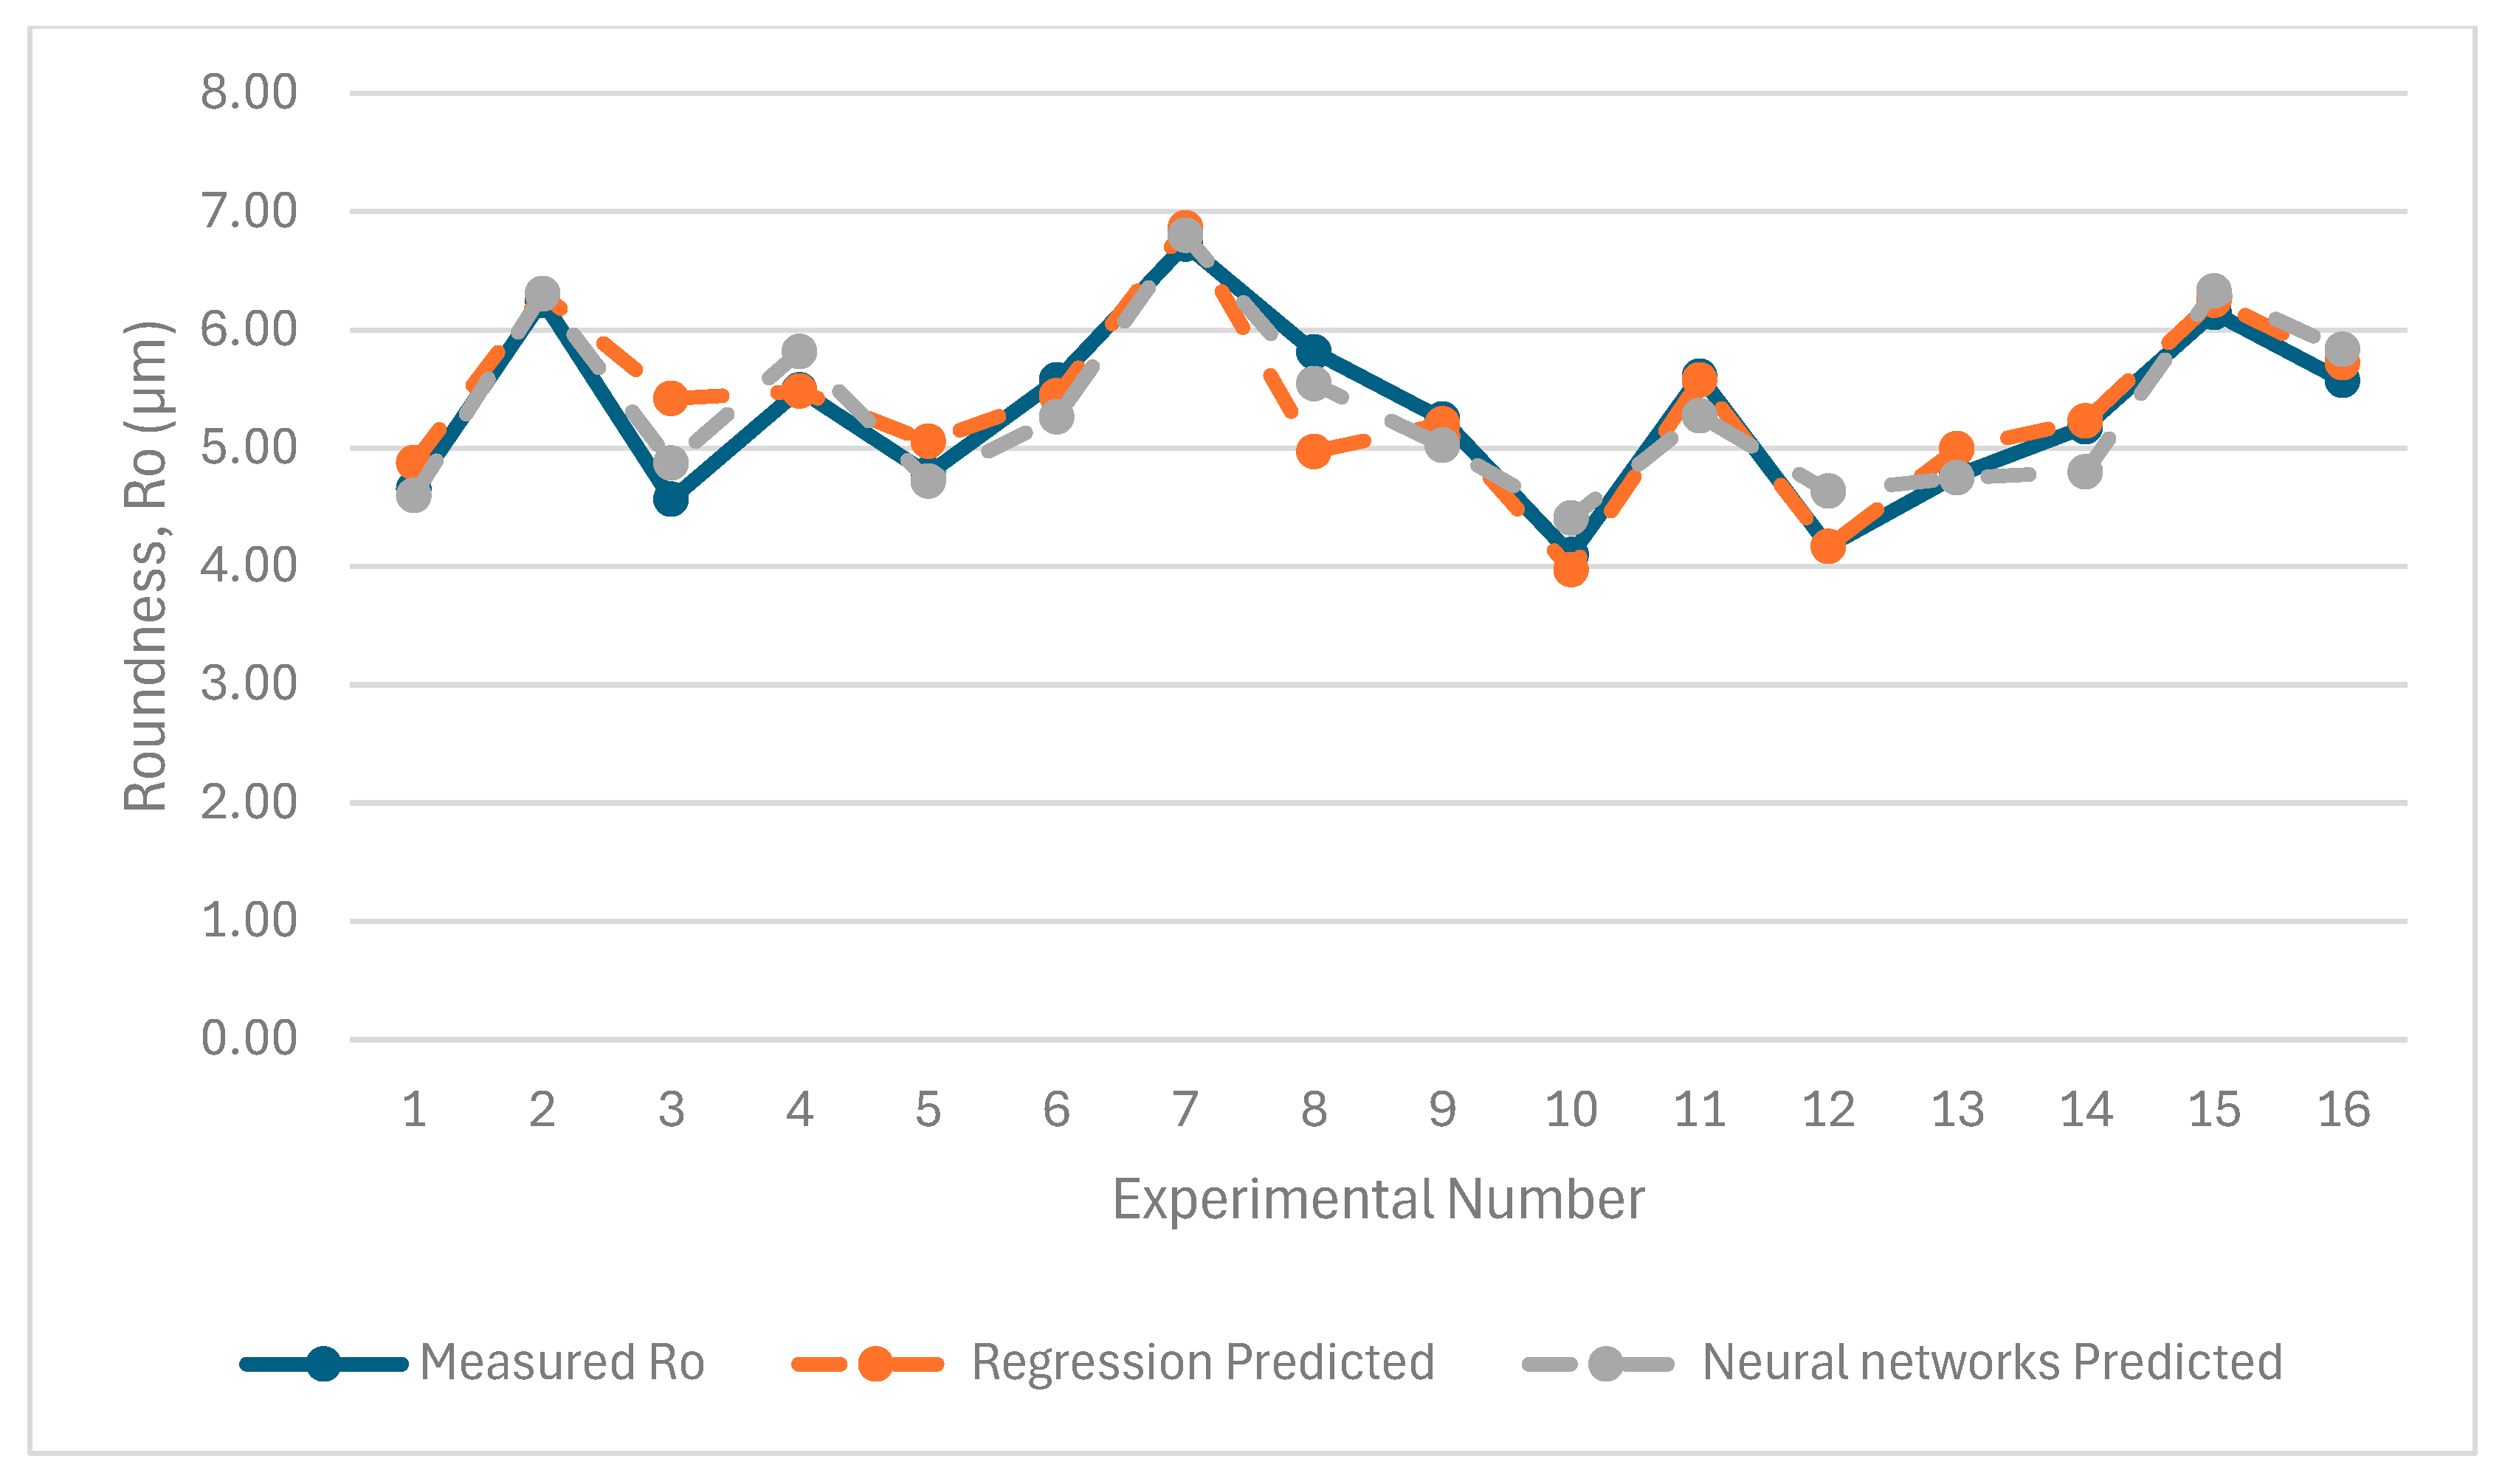
| In-Process Prediction System | Prediction Accuracy | |||
|---|---|---|---|---|
| Average Surface Roughness (Ra) | Surface Roughness (Rz) | Straightness (St) | Roundness (Ro) | |
| Nonlinear regression models | 92.10% | 92.82% | 91.55% | 95.52% |
| Trained neural network | 88.08% | 88.70% | 90.89% | 96.02% |
Disclaimer/Publisher’s Note: The statements, opinions and data contained in all publications are solely those of the individual author(s) and contributor(s) and not of MDPI and/or the editor(s). MDPI and/or the editor(s) disclaim responsibility for any injury to people or property resulting from any ideas, methods, instructions or products referred to in the content. |
© 2025 by the authors. Licensee MDPI, Basel, Switzerland. This article is an open access article distributed under the terms and conditions of the Creative Commons Attribution (CC BY) license (https://creativecommons.org/licenses/by/4.0/).
Share and Cite
Tangjitsitcharoen, S.; Suksomcheewin, N.; Faccia, A. Leveraging Intelligent Machines for Sustainable and Intelligent Manufacturing Systems. J. Manuf. Mater. Process. 2025, 9, 153. https://doi.org/10.3390/jmmp9050153
Tangjitsitcharoen S, Suksomcheewin N, Faccia A. Leveraging Intelligent Machines for Sustainable and Intelligent Manufacturing Systems. Journal of Manufacturing and Materials Processing. 2025; 9(5):153. https://doi.org/10.3390/jmmp9050153
Chicago/Turabian StyleTangjitsitcharoen, Somkiat, Nattawut Suksomcheewin, and Alessio Faccia. 2025. "Leveraging Intelligent Machines for Sustainable and Intelligent Manufacturing Systems" Journal of Manufacturing and Materials Processing 9, no. 5: 153. https://doi.org/10.3390/jmmp9050153
APA StyleTangjitsitcharoen, S., Suksomcheewin, N., & Faccia, A. (2025). Leveraging Intelligent Machines for Sustainable and Intelligent Manufacturing Systems. Journal of Manufacturing and Materials Processing, 9(5), 153. https://doi.org/10.3390/jmmp9050153