Article

Influence of Infill Geometry and Density on the Mechanical Properties of 3D-Printed Polylactic Acid Structure

1
Faculty of Special Technology, Alexander Dubcek University of Trenčín, 911 06 Trenčín, Slovakia
2
Department of Mechanical Engineering, Faculty of Military Technology, University of Defence, 612 00 Brno, Czech Republic
3
Faculty of Industrial Technologies in Púchov, Alexander Dubcek University of Trenčín, Ivana Krasku 491/30, 020 01 Púchov, Slovakia
*
Author to whom correspondence should be addressed.
J. Manuf. Mater. Process. 2025, 9(4), 134; https://doi.org/10.3390/jmmp9040134
Submission received: 24 March 2025 / Revised: 16 April 2025 / Accepted: 17 April 2025 / Published: 18 April 2025

Abstract

:
Additive manufacturing of polymer composites, also known as 3D printing, is one of the progressive technologies in material engineering. It enables the production of parts with complex geometries while optimizing material efficiency. Polylactide (PLA) is a widely used material in additive manufacturing due to its biodegradability and suitable mechanical properties. However, its brittleness and limited thermal stability require further modifications, such as modifying the filler structure or adding reinforcing materials. This paper focuses on analyzing the influence of different filler geometries and densities on the mechanical properties of PLA parts manufactured by the fused filament deposition (FFF) method. Three basic filler structures—cubic, gyroid and rectilinear—were investigated at different density levels from 20%, 40%, 60% and 80%. Experimental tests were performed according to ASTM D638 to determine the strength characteristics of the material. In addition to mechanical tests, dynamic mechanical analysis (DMA) and thermogravimetric analysis (TG) were performed to better understand the influence of the filling geometry on the thermal stability and viscoelastic behavior of the material. Experimental tests according to ASTM D638 showed that higher filling density improves mechanical properties. At 80% filling, the tensile strength reached 21.06 MPa (cubic), 20.53 MPa (gyroid) and 20.84 MPa (linear). The elastic modulus was highest with cubic filling (1414.19 MPa). The yield strength reached 15.59 MPa (cubic), 15.52 MPa (gyroid) and 14.30 MPa (linear).

1. Introduction

The additive manufacturing of polymer composites, also known as 3D printing, is one of the most promising technologies in the field of materials engineering. Its main advantages include the ability to produce parts with complex geometries and optimize material efficiency. Polylactide (PLA) is one of the most commonly used materials in additive manufacturing due to its biodegradability and good mechanical properties, but its brittleness and limited thermal stability require further modifications [1]. Daly et al. show that different filler patterns have different effects on tensile strength, while the optimal combination of filler structure and density can significantly increase the mechanical resistance of parts [2]. The experimental and numerical analyses of Müller et al. indicate that fillers with a higher degree of layer overlap, such as hexagonal or rib-structured arrangements, exhibit better tensile strength compared to traditional rectangular or linear fillers [3]. Turaka et al. point out that at lower filler densities, strength may be reduced due to gaps between individual layers, while at too high a density, the material may be more susceptible to internal stresses and delamination [4]. According to Chacón et al., when designing 3D-printed parts, it is necessary to carefully choose not only the filler pattern but also its optimal density, which will ensure the desired balance between strength, weight and material efficiency [5]. Tian et al. state that one of the options for improving the mechanical properties of PLA composites is the use of carbon fibers. Research has shown that the integration of carbon fibers into the PLA matrix can significantly increase the tensile strength and elastic modulus, making these composites suitable for more demanding applications such as aerospace and automotive [6]. In addition, Kohutiar et al. provide a comprehensive overview of the technological approaches, properties and applications of pure and reinforced composite materials based on polyamide 6 (PA6) and polyamide 12 (PA12), while also addressing their potential use in additive manufacturing, especially in the context of optimizing mechanical properties and thermal stability [7]. Another option according to Bax et al. and Oksman et al. is the use of natural fibers such as flax or Cordenka, which provide a favorable strength-to-weight ratio and are more environmentally friendly [8,9]. In addition to the material composition itself, the filling structure of the printed parts also plays a key role. Research by Mayandi et al. showed that increasing the filler density leads to improved mechanical properties of PLA composites reinforced with chopped carbon fibers [10].
Fused deposition modeling (FDM) is an efficient 3D-printing technology that enables the production of personalized products at lower costs. Since its introduction in the 1990s, it has become widely used across various industrial sectors. Further development requires a clear understanding of the process parameters and emerging trends. This study summarizes fundamental knowledge, analyzes key parameters, and identifies current challenges [11].
The extruder nozzle diameter is also an important factor, which affects the layer distribution and mechanical properties of the printed parts. Experimental results by Czyżewski et al. suggest that larger nozzle diameters can improve the strength of the printed parts, especially in combination with optimized printing parameters [12].
In the case of PLA composites supplemented with bamboo fillers, which were studied by Vidakis et al., it was shown that higher filler density leads to better fatigue behavior of the material, thereby reducing the risk of mechanical failure [13]. The research by Kutlu et al. also focuses on numerical analyses and experimental methods for predicting the mechanical properties of PLA composites with an emphasis on optimizing additive manufacturing parameters to improve the strength and fatigue resistance [14].
The surface treatment of PLA material using DCSBD plasma discharge has been proposed as a way to improve the adhesion between individual layers of the material. This method can improve the print quality by reducing the risk of layer separation during the printing process [15].
A study by Bartosova et al. investigated the effect of accelerated electron radiation on the tribological behavior of polymeric materials, which may be relevant for optimizing the properties of 3D-printed parts [16].
The aim of this study was to analyze the effect of different types of filler geometries—gyroid, cubic and linear—at four different bulk densities (20%, 40%, 60% and 80%) on the mechanical properties of 3D-printed parts. The investigated mechanical parameters include tensile strength, yield strength, elastic modulus and ductility, which are crucial for the performance and durability of parts subjected to mechanical stress.

2. Materials and Methods

In this experiment, we investigated the effect of different geometries and filler densities on the strength properties of polylactide (PLA) produced by fused filament deposition (FFF) technology (Figure 1). Test specimens were designed and fabricated in accordance with ASTM D638, which specifies methods for determining the tensile properties of plastics.
As a material, we used PLA filament from the manufacturer Bambu Lab with a diameter of 1.75 mm. This material is widely used in 3D printing due to its biodegradability and suitable mechanical properties. Test samples were produced using a Bambu Lab P1S 3D printer (Figure 2).
For each combination of geometry and infill density, type I specimens (Figure 3) were printed with a total length of 165 mm, a parallel section width of 13 mm, and a thickness of 3.2 mm, which corresponds to the standard dimensions for tensile testing according to ASTM D638. Three different infill geometries were used: cubic (C), linear (L), and gyroid (G). Each of these geometries was applied with different infill densities: 20%, 40%, 60%, and 80%. The wall thickness of the specimens was 1.2 mm, and three layer perimeters were used, which is a standard configuration often used in additive manufacturing to ensure sufficient sample strength.
The printing parameters were set to a nozzle diameter of 0.4 mm, a printing temperature of 220 °C, a bed temperature of 55 °C, and a layer thickness of 0.2 mm. After extrusion, the samples were left at room temperature for 8 h to stabilize before testing. This process is necessary to minimize internal stresses that may arise during cooling and to ensure uniform mechanical properties of the samples. Stabilization also allows for a uniform distribution of residual stress in the material, thereby reducing the risk of inaccuracies in the measurement of mechanical parameters.
The tensile properties of the samples were tested on an Instron 5500R tensile tester (Figure 4), which allows for the precise measurement of tensile forces in accordance with the requirements of the ASTM D638 standard [17]. The device was set to a tensile speed of 5 mm/min. During the test, the force and elongation values were recorded until the sample broke. Bluehill 3 software version 3.81 was used to evaluate the measured data, which provides a detailed analysis of the mechanical properties of materials.
This methodological approach, in accordance with the ASTM D638 standard, allowed us to analyze in detail the influence of different geometries and filler densities on the mechanical properties of PLA material produced by additive technology.
Measurements during DMA analysis were performed on a dynamic-mechanical analyzer DMA Q800 from TA Instruments Faculty of Special Technology Alexander Dubcek University of Trenčín, in the temperature range from 40 °C to 100 °C, with a heating rate of 3 °C.min−1, a selected loading frequency of 10 Hz and an amplitude of 15 μm. TA Universal Analysis software ver. 4.5A was used to evaluate the curves and glass transition temperatures (Tg). Using the analysis results of the curves of the elastic modulus (E′), loss modulus (E′′) and loss angle tan δ as a function of temperature, the transition temperatures for individual materials were subsequently determined and compared. For all series of material samples, average curves of E′, E′′ and tan δ were generated from 5 measurements using OriginPro software ver. 9.1.0. The transition temperatures of E′′ and tan δ were determined from the maximum peak value (local maximum). The transition temperatures of E′ were determined by extrapolating the value of “OnSet” from the slope of the curve.

3. Results

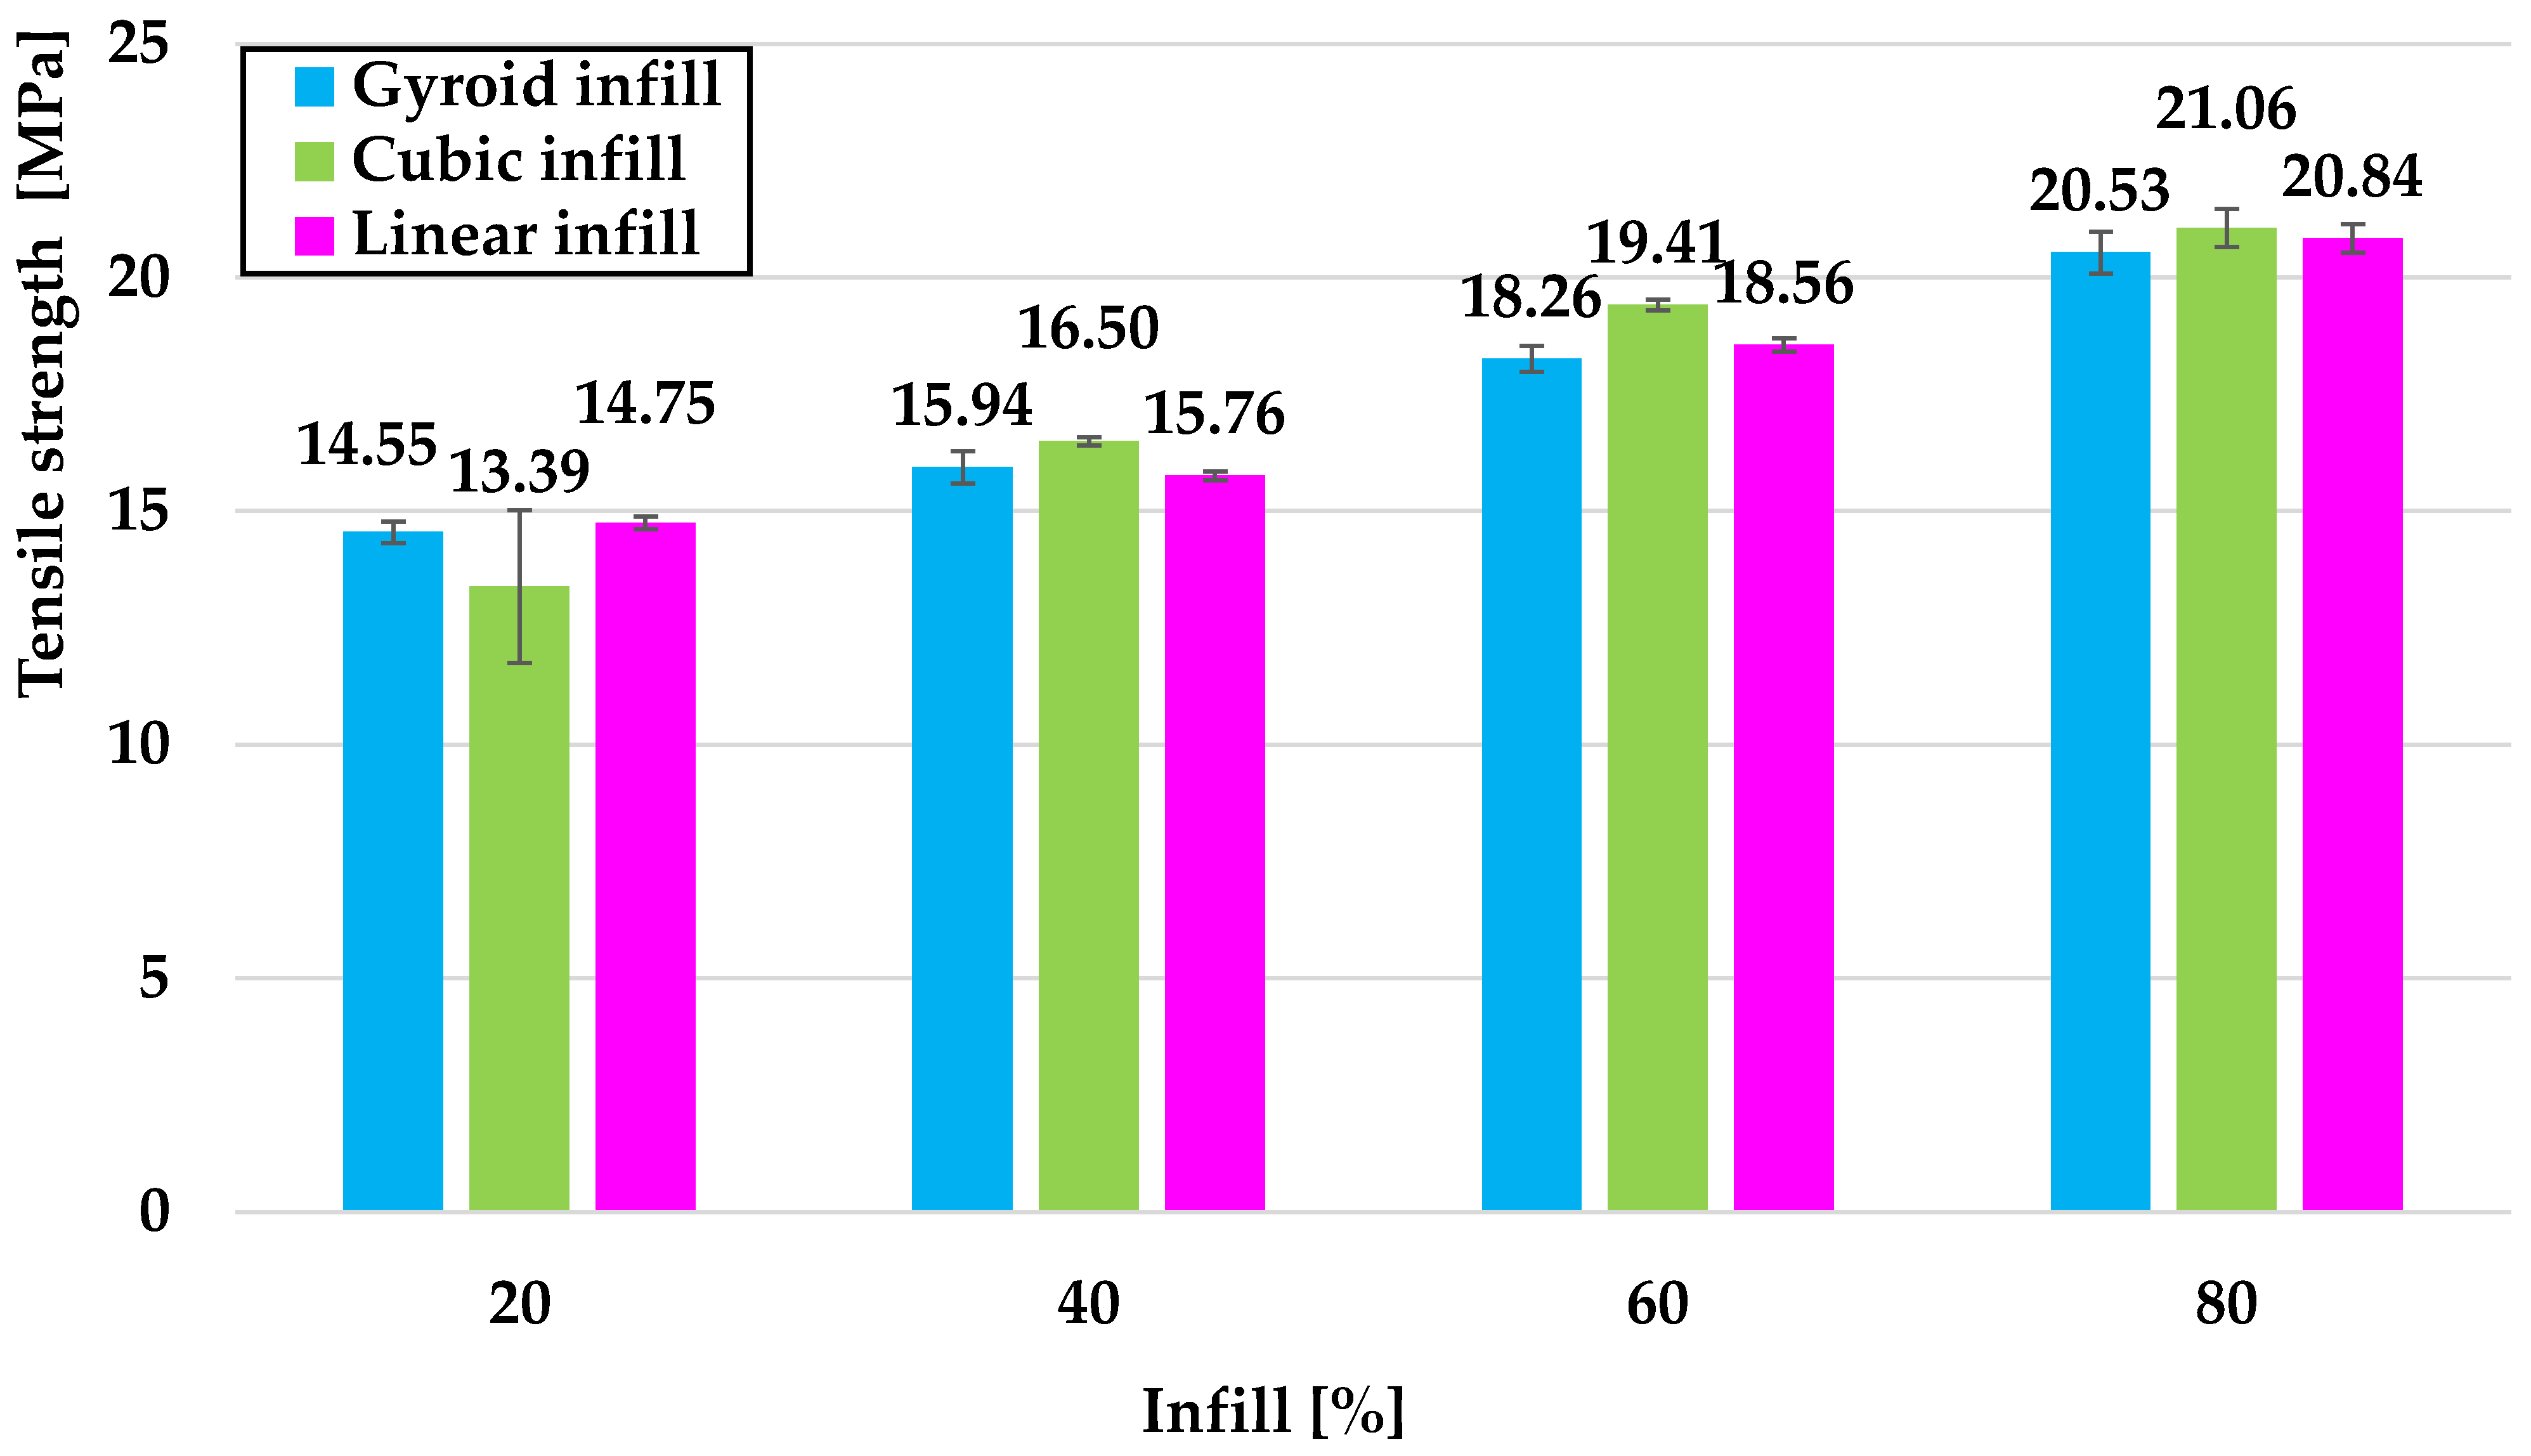
Currently, 3D printing is becoming one of the most important manufacturing technologies with its use ranging from prototyping to the production of functional parts in various industrial sectors. The mechanical properties of 3D-printed components are fundamentally influenced by printing parameters, including the infill geometry and the bulk density of the infill. These factors affect not only the strength and stiffness of the resulting part but also its ability to absorb mechanical loads and resist deformations. The correct choice of infill structure is therefore crucial in optimizing the mechanical properties and functionality of printed components. At 20% volume infill, significant differences in tensile strength were observed between the individual geometries (
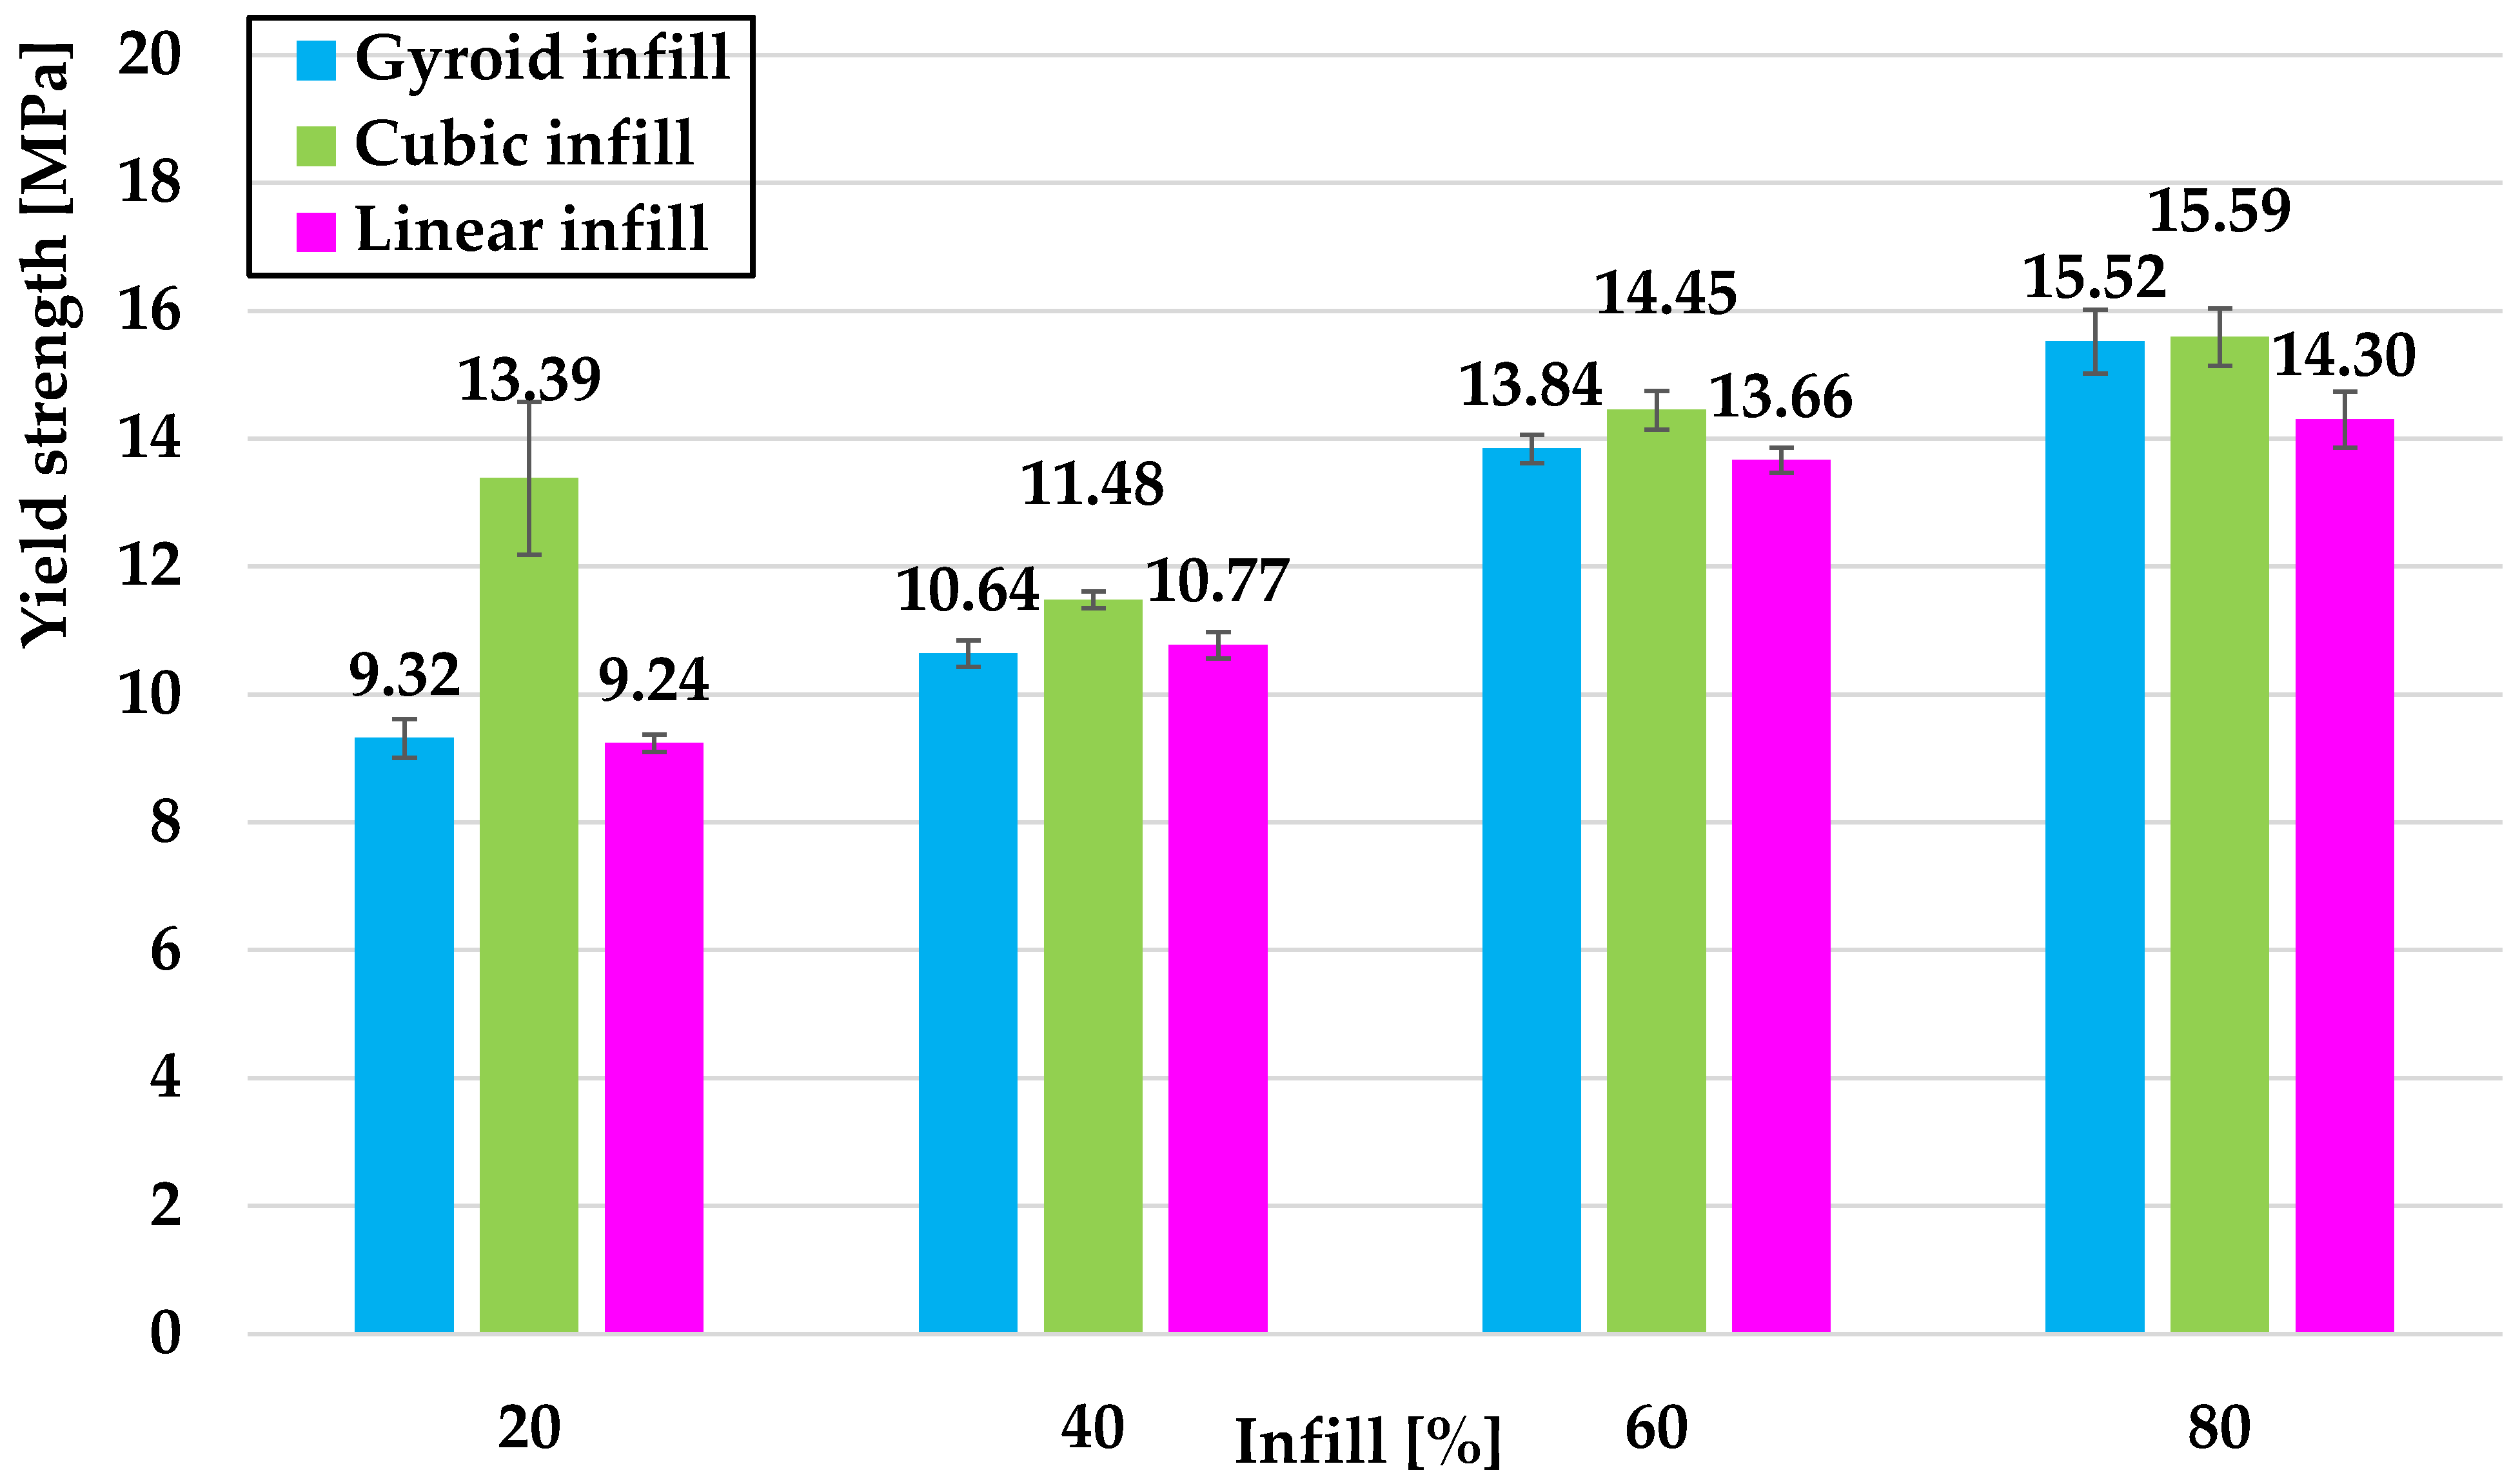
Figure 5), where the best results were achieved by the linear infill (14.75 MPa), which was closely followed by the gyroid geometry (14.55 MPa). The cubic infill showed the lowest strength (13.39 MPa). In the yield strength region (Figure 6), cubic filling dominated (13.39 MPa), while the linear (9.24 MPa) and gyroid (9.32 MPa) fillings showed similar values. The elastic modulus (Figure 7) was highest for gyroid filling (872.51 MPa), while the ductility (
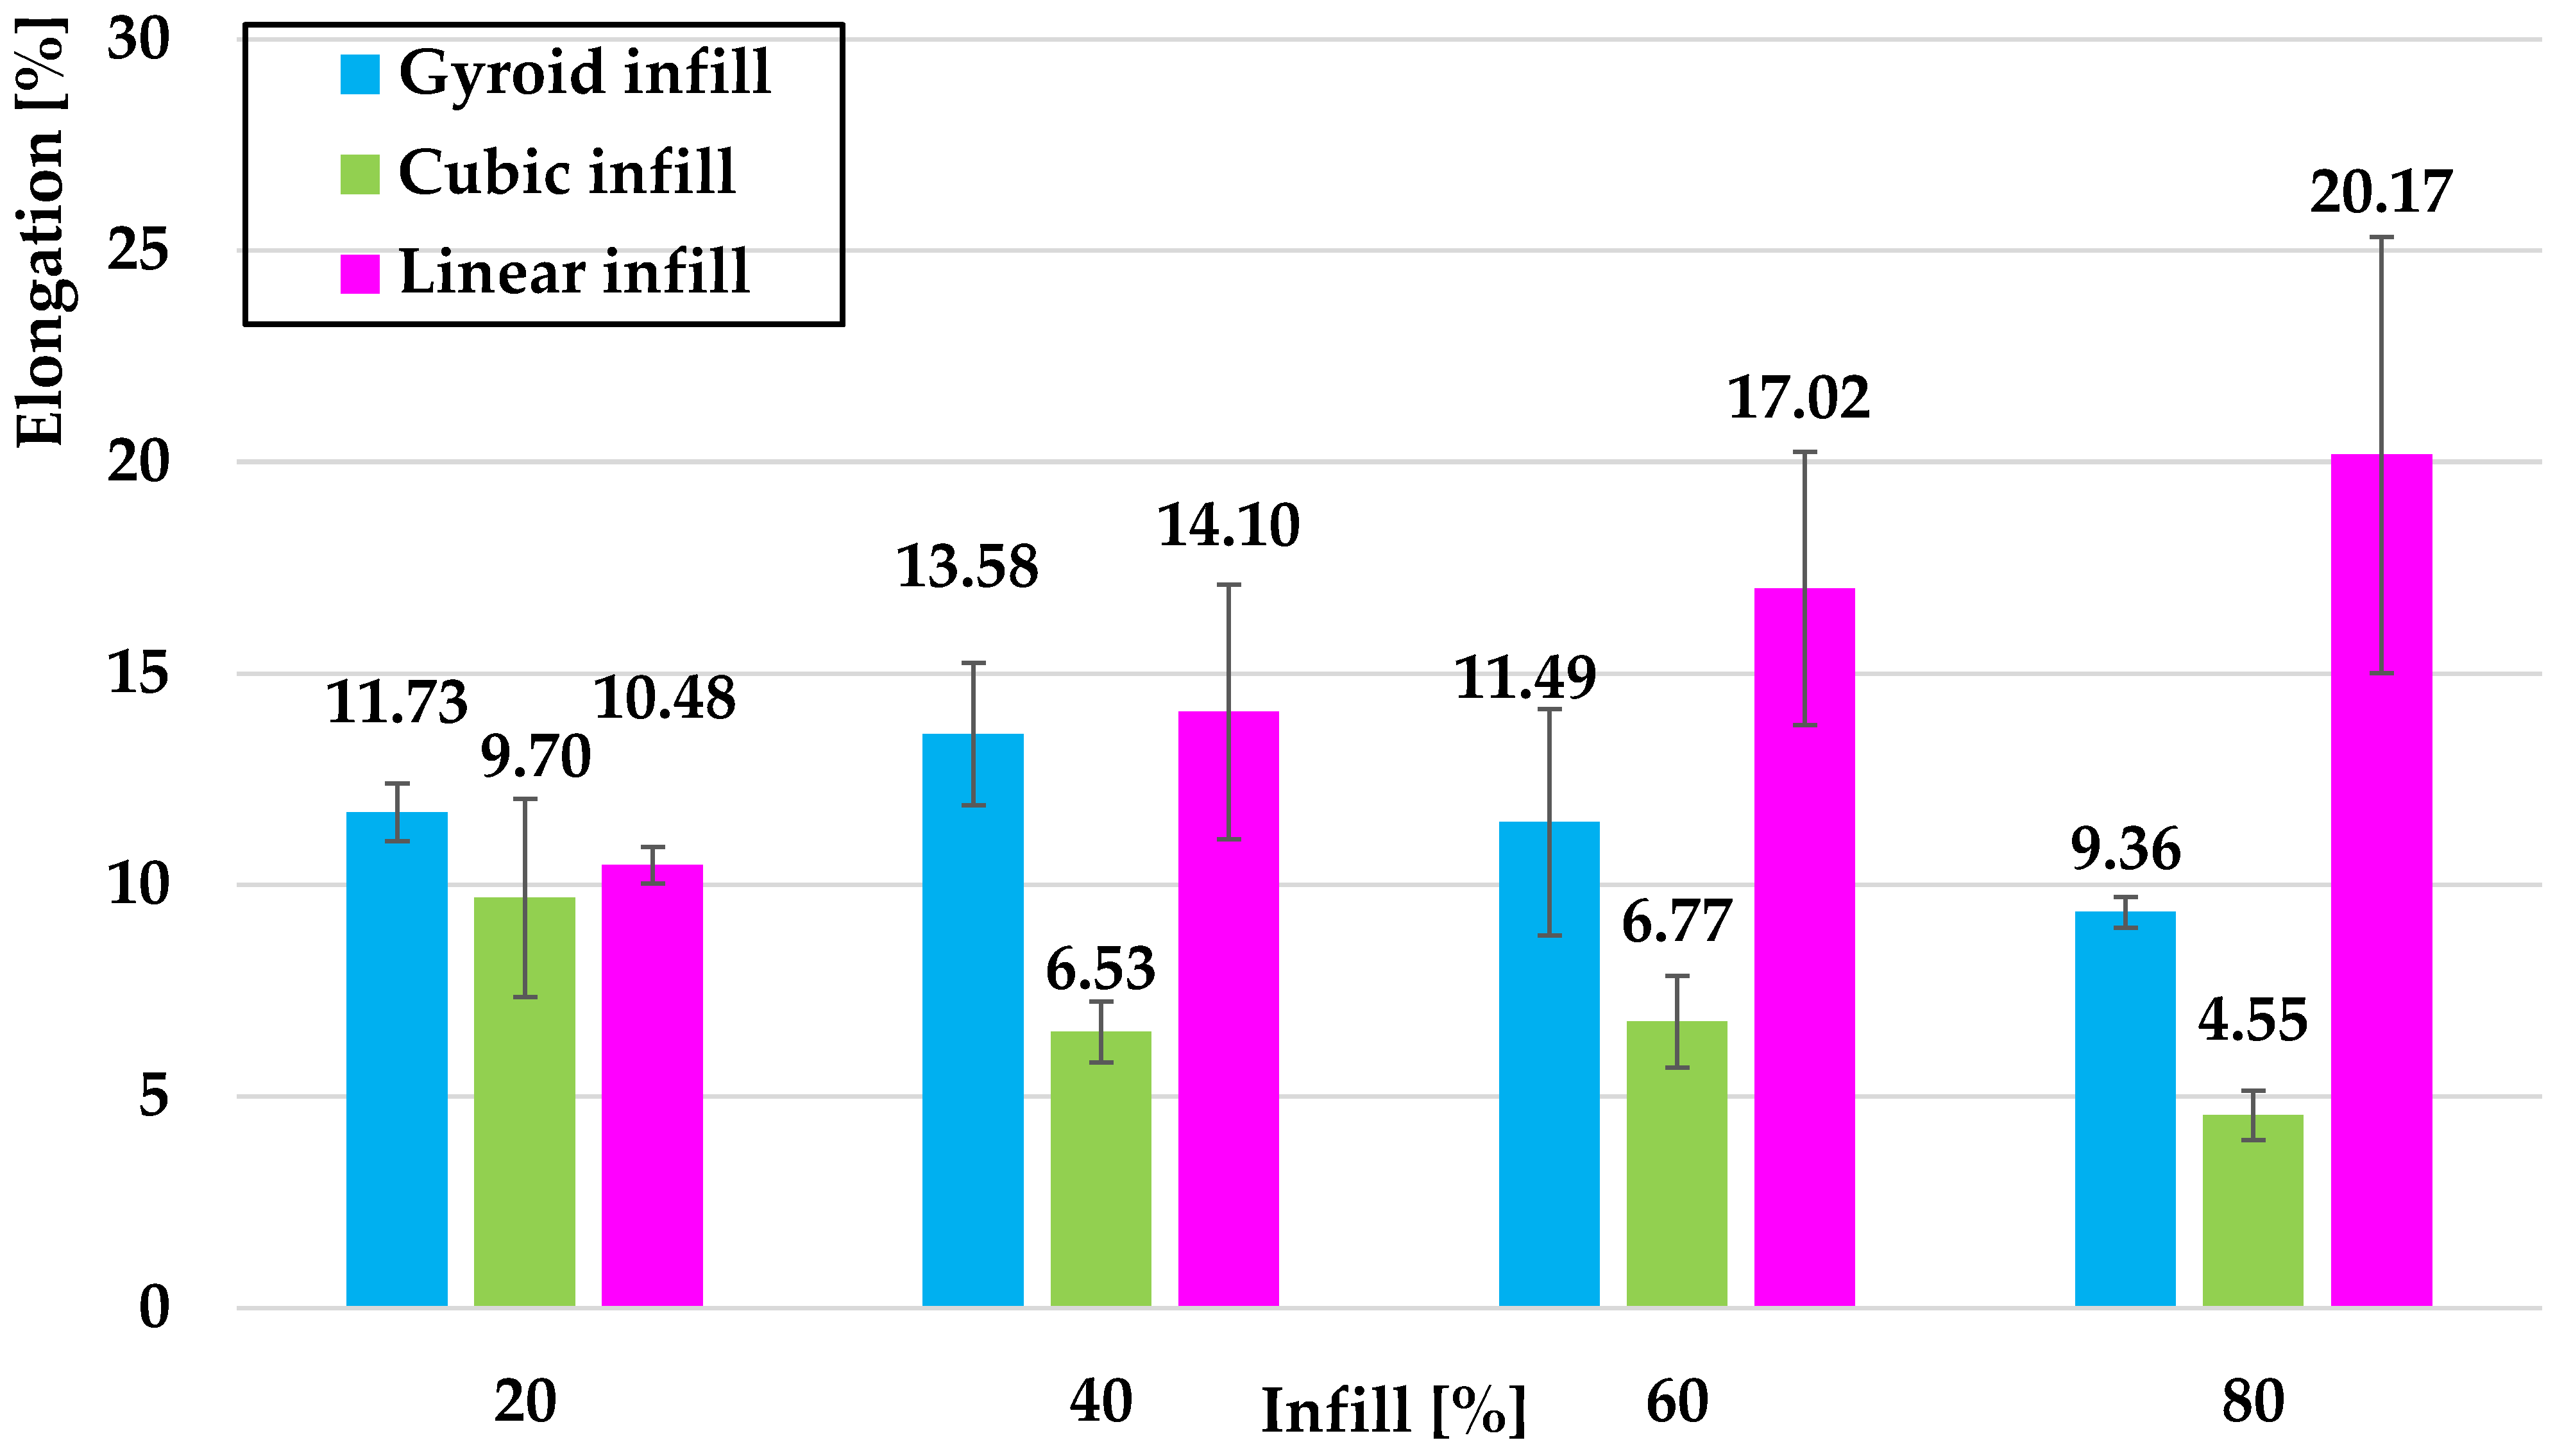
Figure 8) reached a maximum for gyroid geometry (11.73%), indicating a better ability to absorb deformations before failure. Increasing the volumetric filling to 40% improved all monitored parameters. The highest tensile strength (Figure 5) was achieved by cubic filling (16.50 MPa), which was followed by gyroid (15.94 MPa) and linear (15.76 MPa) fillings. The yield strength (Figure 6) was again highest for the cubic filling (11.48 MPa), while the gyroid (10.64 MPa) and linear (10.77 MPa) fillings achieved slightly lower values. The elastic modulus (Figure 7) improved especially for the cubic filling (1073.24 MPa), while the linear filling showed the highest elongation (Figure 8) (14.10%), which for the cubic filling was only 6.53%.
At 60% filling, the trend of improving mechanical properties was maintained. The tensile strength (Figure 5) was highest for the cubic filling (19.41 MPa), which was followed by the gyroid (18.26 MPa) and linear (18.56 MPa) fillings. The highest yield strength (Figure 6) was recorded for the cubic filling (14.45 MPa), while the gyroid (13.84 MPa) and linear (13.66 MPa) fillings reached only slightly lower values. The elastic modulus (Figure 7) again dominated for the cubic filling (1335.37 MPa), but on the contrary, the linear filling had the highest ductility (Figure 8), indicating its higher ability to absorb stress before failure. At the highest bulk density of the filling (80%), the mechanical properties stabilized. The highest tensile strength (Figure 5) was again achieved for the cubic filling (21.06 MPa), which was followed by the gyroid (20.53 MPa) and linear (20.84 MPa) fillings. The yield strength (Figure 6) showed the highest value for the cubic infill (15.59 MPa), while the gyroid infill reached 15.52 MPa and the linear infill reached 14.30 MPa. The elastic modulus (Figure 7) was the highest for the cubic infill (1414.19 MPa), while the ductility (Figure 8) reached the maximum for the linear infill (20.17%), which for the cubic infill showed the lowest value (4.55%).
The results indicate that the mechanical properties of 3D-printed structures are significantly affected by the infill geometry and bulk density of the infill. At higher infill densities, the cubic infill shows the best strength properties but with a significant loss of ductility. The linear infill excels in stress absorption before failure, while the gyroid infill represents a balanced compromise between strength, stiffness and deformation properties. This knowledge is key to optimizing the mechanical properties of 3D-printed parts depending on the requirements for strength, stiffness, and the ability to absorb mechanical loads.

3.1. Prediction of Mechanical Properties of Filling Structures

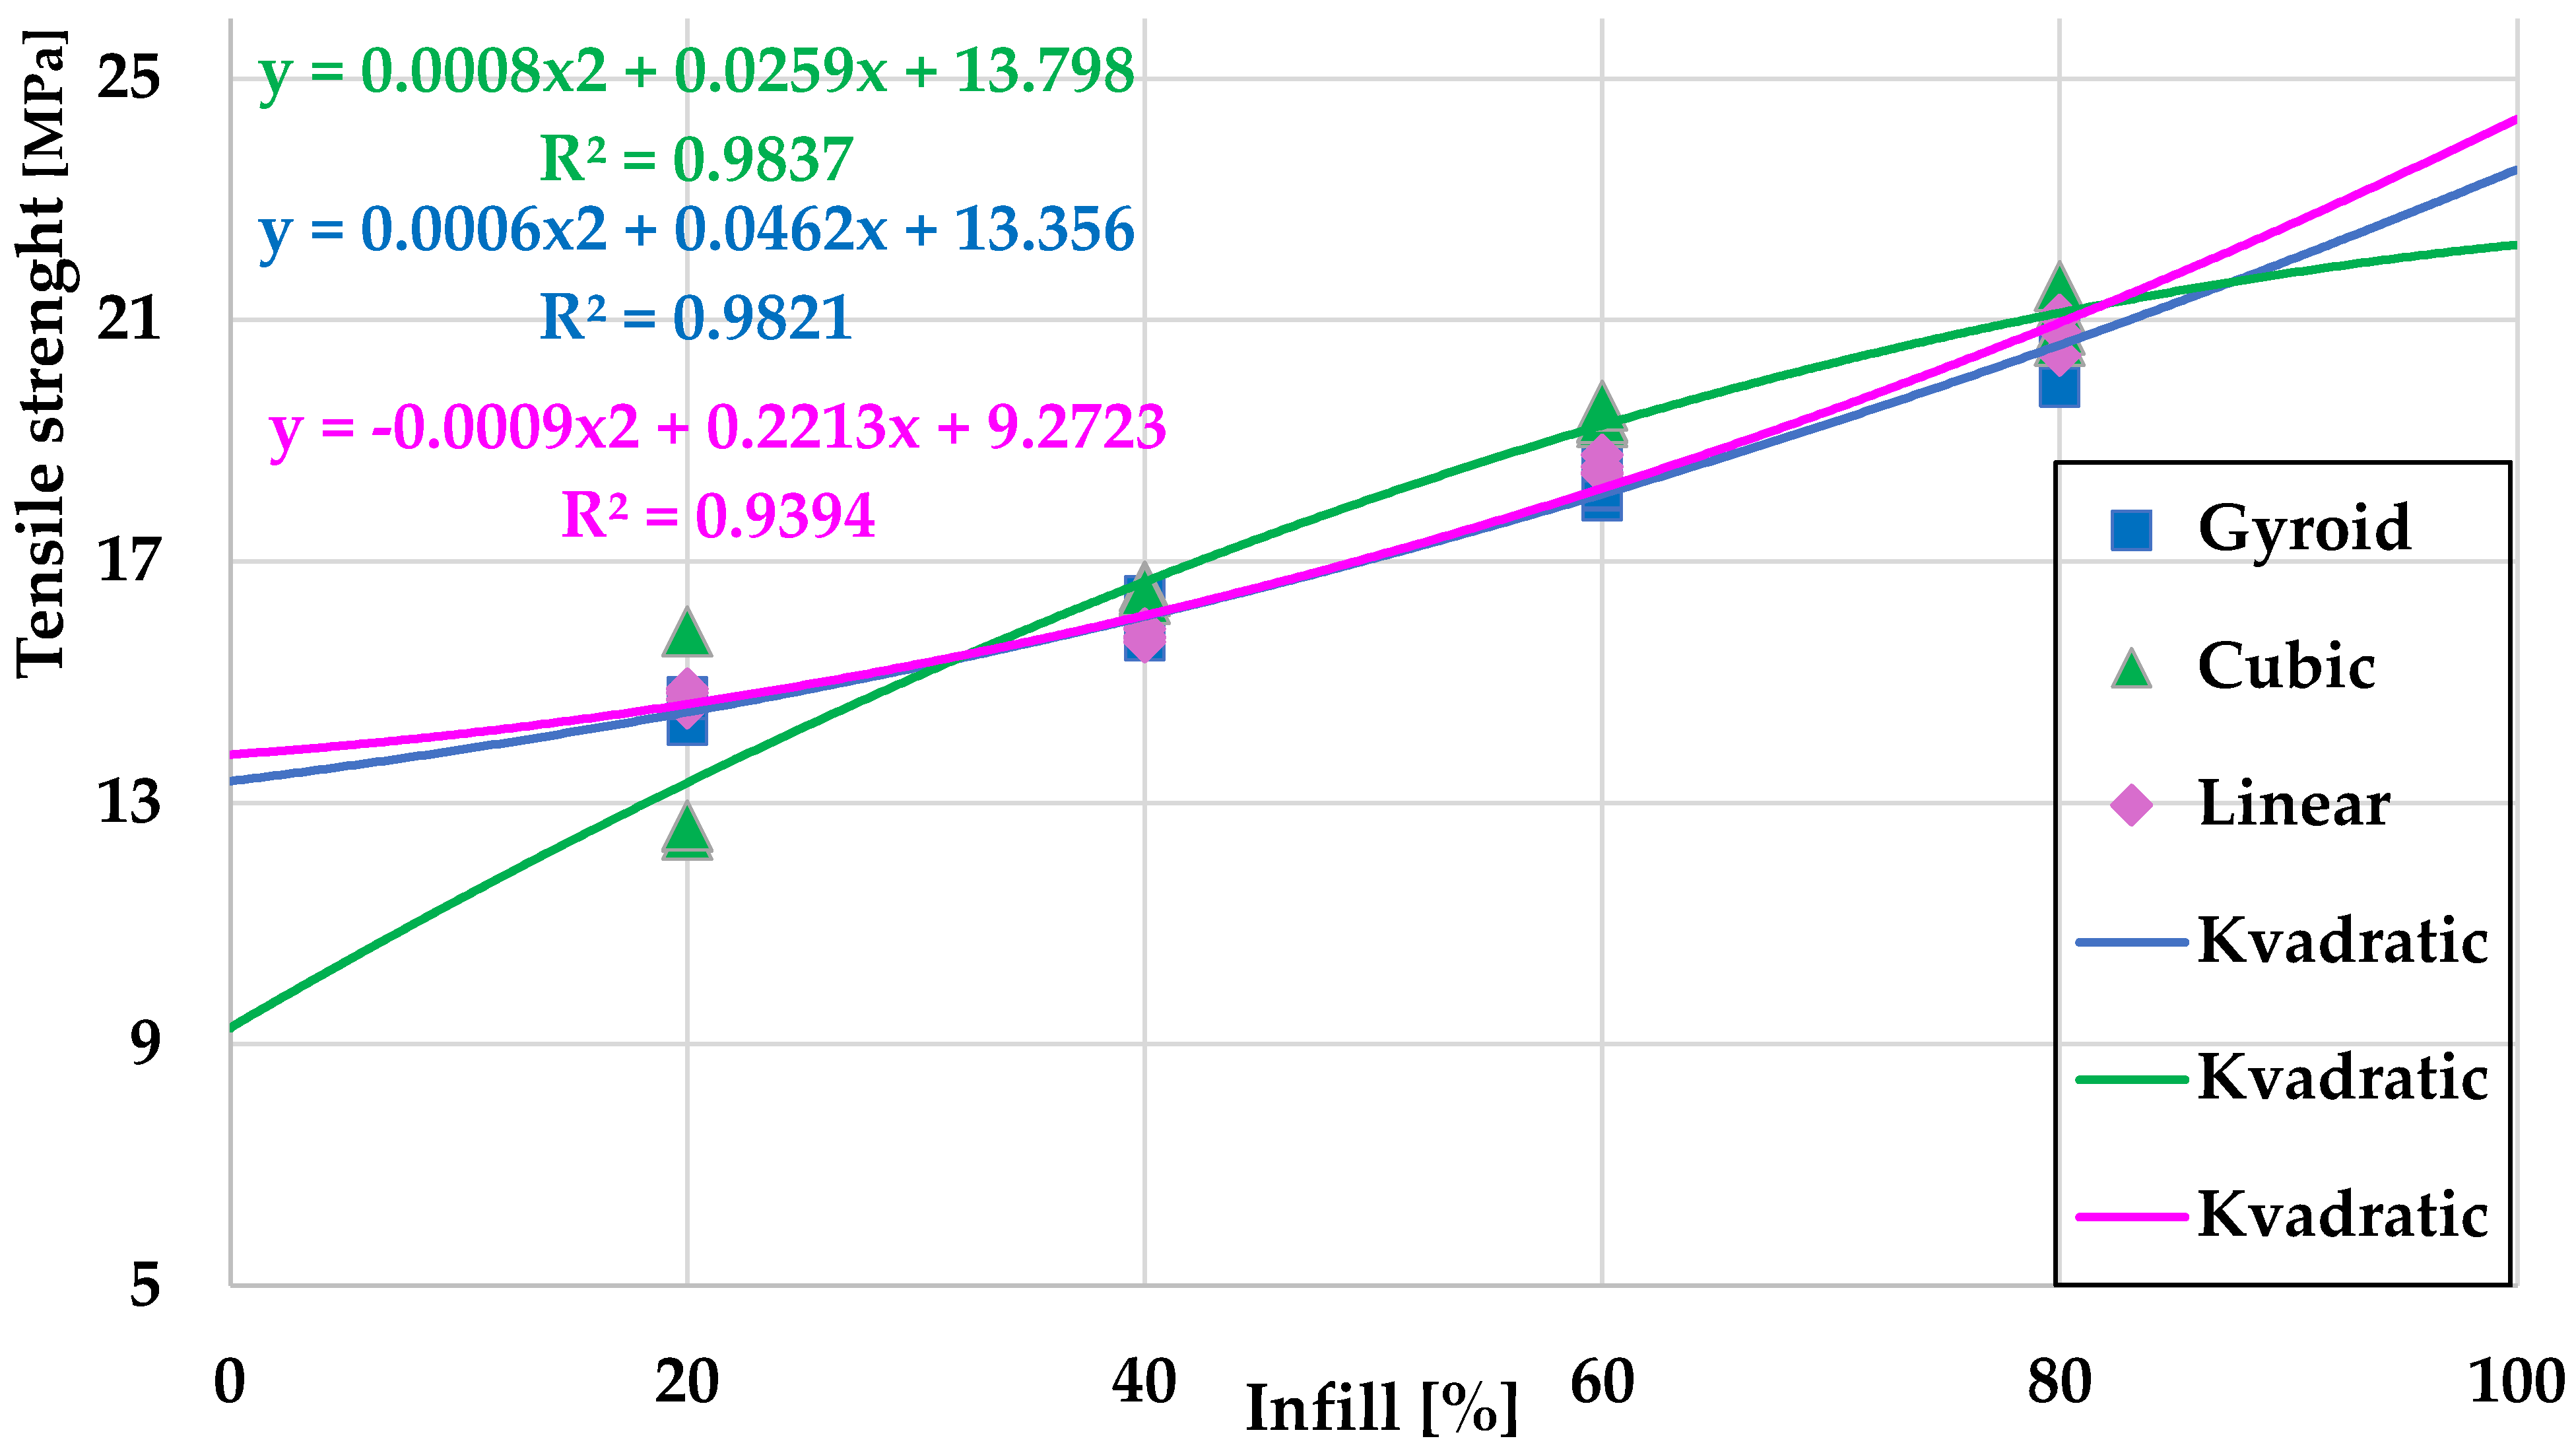
Based on the experimental data, prediction models for tensile strength, yield strength and elastic modulus were created with the analysis including all filling structures—cubic, gyroid and rectilinear. The prediction of mechanical properties (Figure 9) was carried out using quadratic regression models, which made it possible to identify nonlinear trends and more accurately describe the development of mechanical characteristics depending on the filling volume. The results showed that with increasing filling fraction, strength increases in all investigated structures with quadratic regression showing high accuracy with R2 values in the range of 0.9394–0.9837, which indicates a significant agreement of the prediction models with the experimental data. The cubic and gyroid fillings showed a similar growth trend with the cubic filling achieving slightly higher strength values at higher volume percentages. The linear infill showed a consistent but slightly lower strength increase compared to the cubic structure.
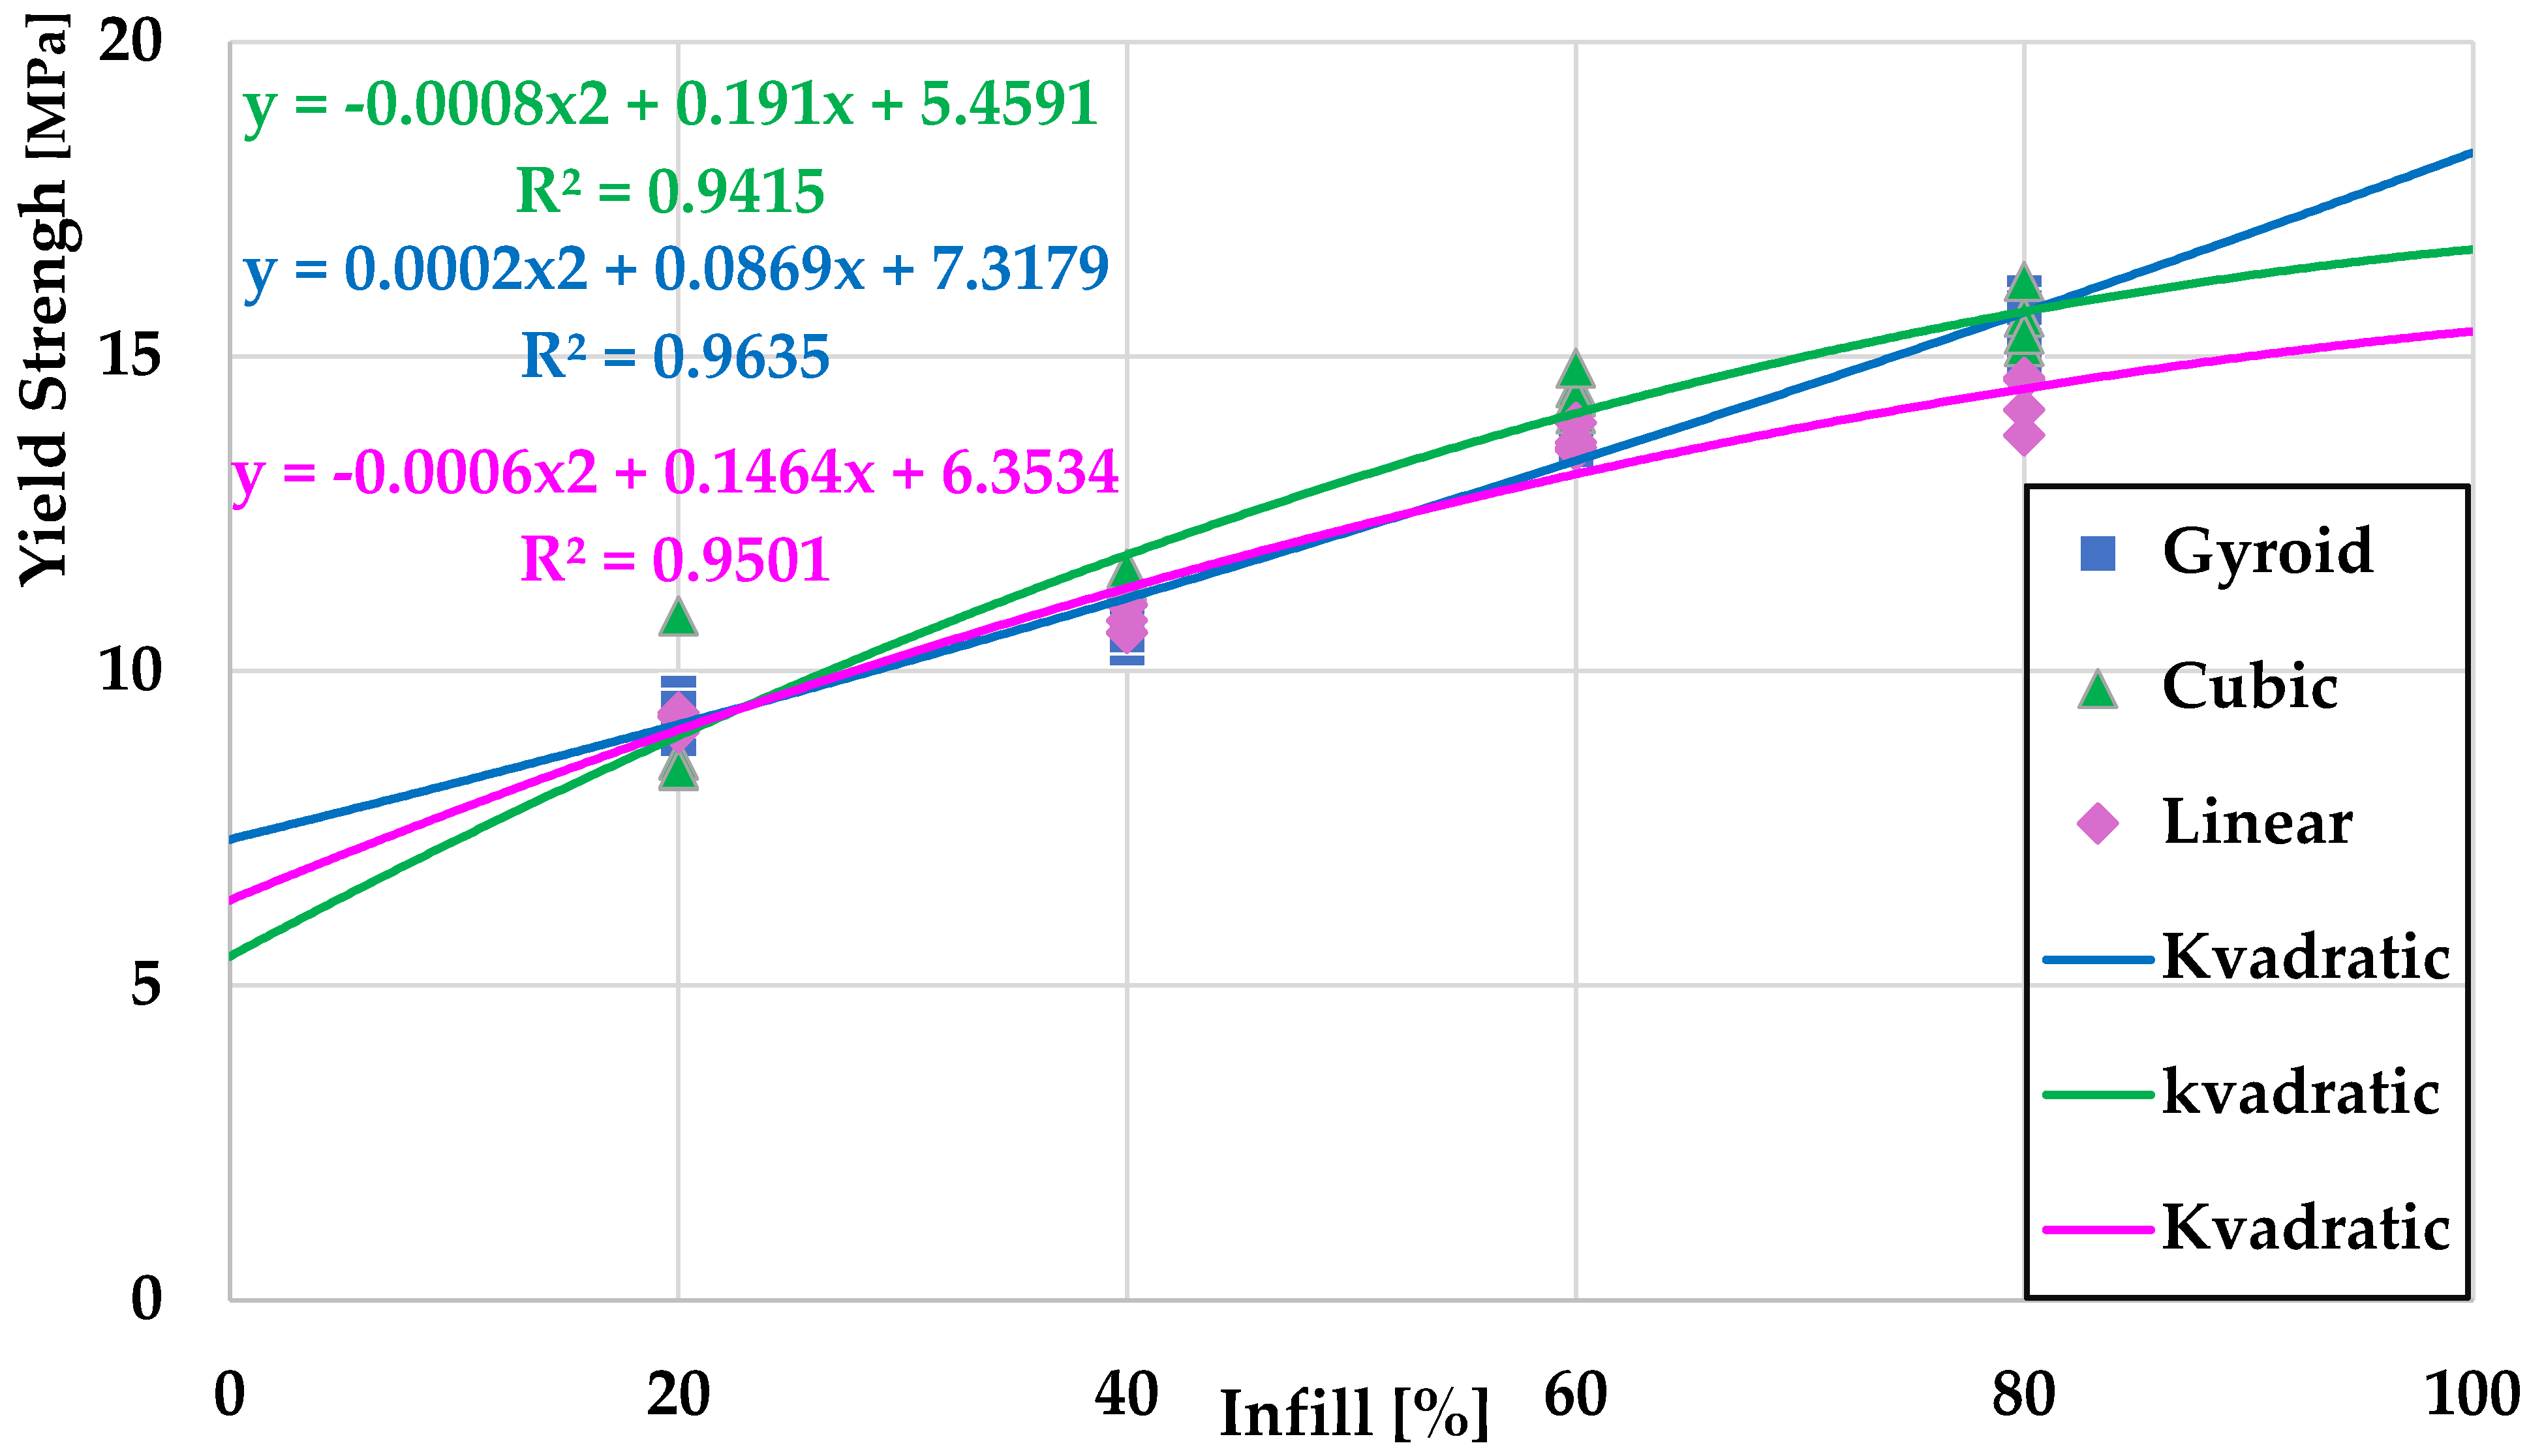
A similar trend was observed at the yield point (Figure 10), where the prediction models confirmed a nonlinear increase in strength with increasing volume filling. The R2 values reached 0.9415–0.9501, which confirms the reliability of quadratic models in predicting this mechanical characteristic. At higher volume fillings, the cubic and gyroid structures stabilized at comparable values, while the rectilinear filling slightly lagged behind. This result corresponds to experimental observations, where a higher resistance of the cubic filling to plastic deformation was identified.
In the case of the elastic modulus (Figure 11), the prediction models showed a significant increase depending on the volume of the filling with R2 values ranging from 0.9198 to 0.9427, indicating a high accuracy of the prediction trends. The highest elastic modulus at higher volume fillings was achieved by the cubic filling, which was followed by the gyroid and rectilinear fillings. This trend reflected the increased stiffness of the cubic structure, which allowed for a better distribution of mechanical load.
The results of the prediction models confirmed the nonlinear growth of mechanical properties with increasing volume filling, while the quadratic regression models provided a reliable approximation of the mechanical behavior of the material. The cubic filling systematically showed the highest values of strength and stiffness, while the gyroid filling represented a balanced alternative between strength and elasticity. The linear filling achieved slightly lower values of mechanical properties but provided higher ductility, which can be advantageous in applications requiring increased ability to absorb mechanical stress. The prediction models thus provide a useful tool for optimizing filling structures depending on the requirements for the strength, stiffness or deformation capacity of printed parts.

3.2. DMA Analysis

Dynamic mechanical analysis (DMA) is a key method for evaluating the viscoelastic properties of materials, especially polymers such as thermoplastics, thermosets and elastomers. This technique allows the measurement of the mechanical properties of materials as a function of temperature, time and frequency of the applied oscillating load. In DMA, a sample is subjected to periodic mechanical stress, and its response to such stress is analyzed. This analysis provides valuable information on the behavior of the material, such as its stiffness, damping properties and phase transitions, which is essential for optimizing materials for specific applications.

3.2.1. Storage Modulus

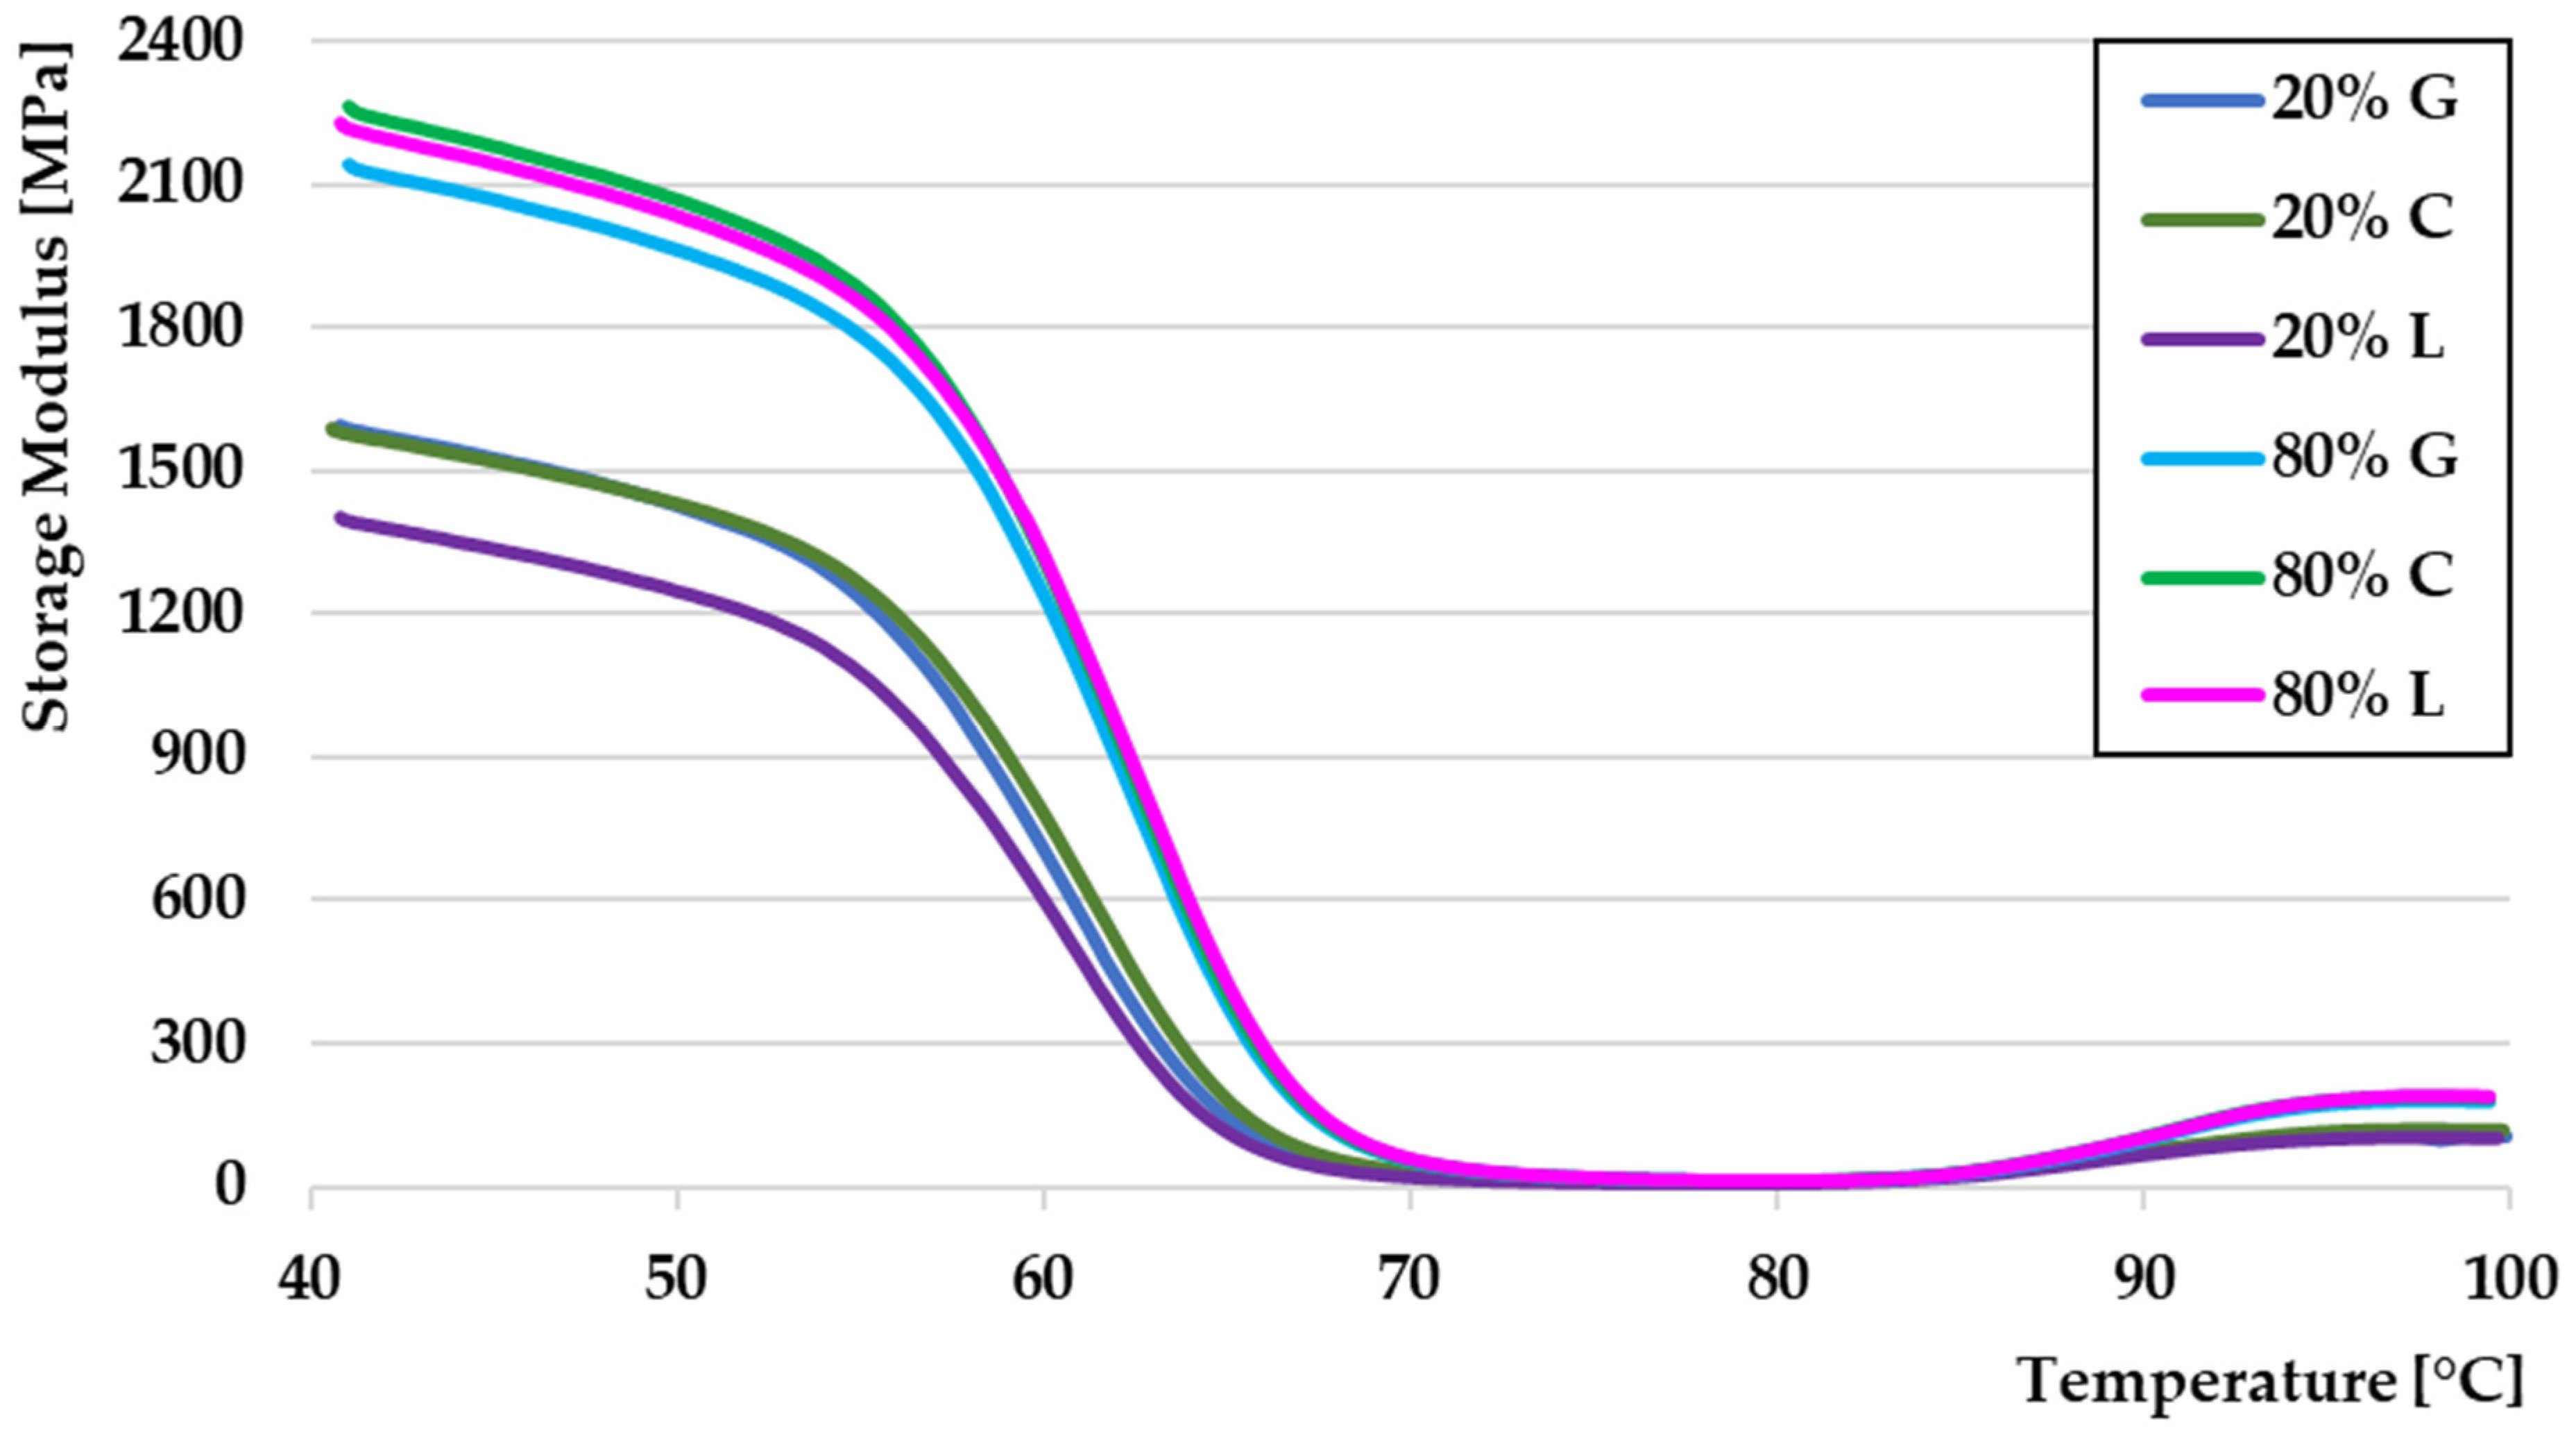
The results of the dynamic mechanical analysis (Figure 12) show a persistent dependence of the storage modulus (E’) on temperature under dynamic loading with a frequency of 1 Hz, reflecting the mechanical properties of the material under different temperature conditions.
At the beginning of the measurement, at temperatures around 40 °C, all samples are in a solid state and show high values of storage modulus. The highest stiffness is achieved by samples with 80% filling, while the samples with 20% filling have lower values, indicating that lower filling density reduces the overall strength of the material.
As the temperature increases in the range of 50–70 °C, there is a gradual decrease in the storage modulus. A significant decrease occurs at approximately 60–70 °C, which corresponds to the glass transition region (Tg), where the material passes from a solid to a softened state. In this range, it is visible that samples with a higher filler content retain higher E’ values, indicating better mechanical stability. After Tg is exceeded, the storage modulus drops sharply, and the samples lose most of their stiffness.
At temperatures above 70 °C, all samples enter a rubbery state, where the differences between them are significantly reduced. The storage modulus in this region reaches low values, which means that the material no longer has sufficient stiffness to effectively transmit mechanical loads. The differences between the samples disappear at this stage, indicating that the filler structure plays a key role only in the solid state, while at higher temperatures, its influence on the mechanical properties decreases.
A comparison between different types of fillings—cubic (C), gyroid (G) and rectilinear (L)—showed that in the solid state, there are slight differences between the individual filling geometries. Samples with gyroid filling showed slightly higher values of storage modulus compared to cubic and rectilinear filling, which may be due to a more uniform distribution of mechanical stress in the structure. At lower temperatures, samples with rectilinear filling were characterized by the lowest values of storage modulus, which indicates a lower resistance to mechanical loading in this phase.
Overall, the results confirm that higher filler density (80%) leads to improved mechanical properties at lower temperatures with different filler structures affecting the storage modulus mainly in the solid state. After exceeding Tg, the differences between the samples disappear, and the mechanical stability of the material decreases regardless of the filler structure.

3.2.2. Loss Modulus

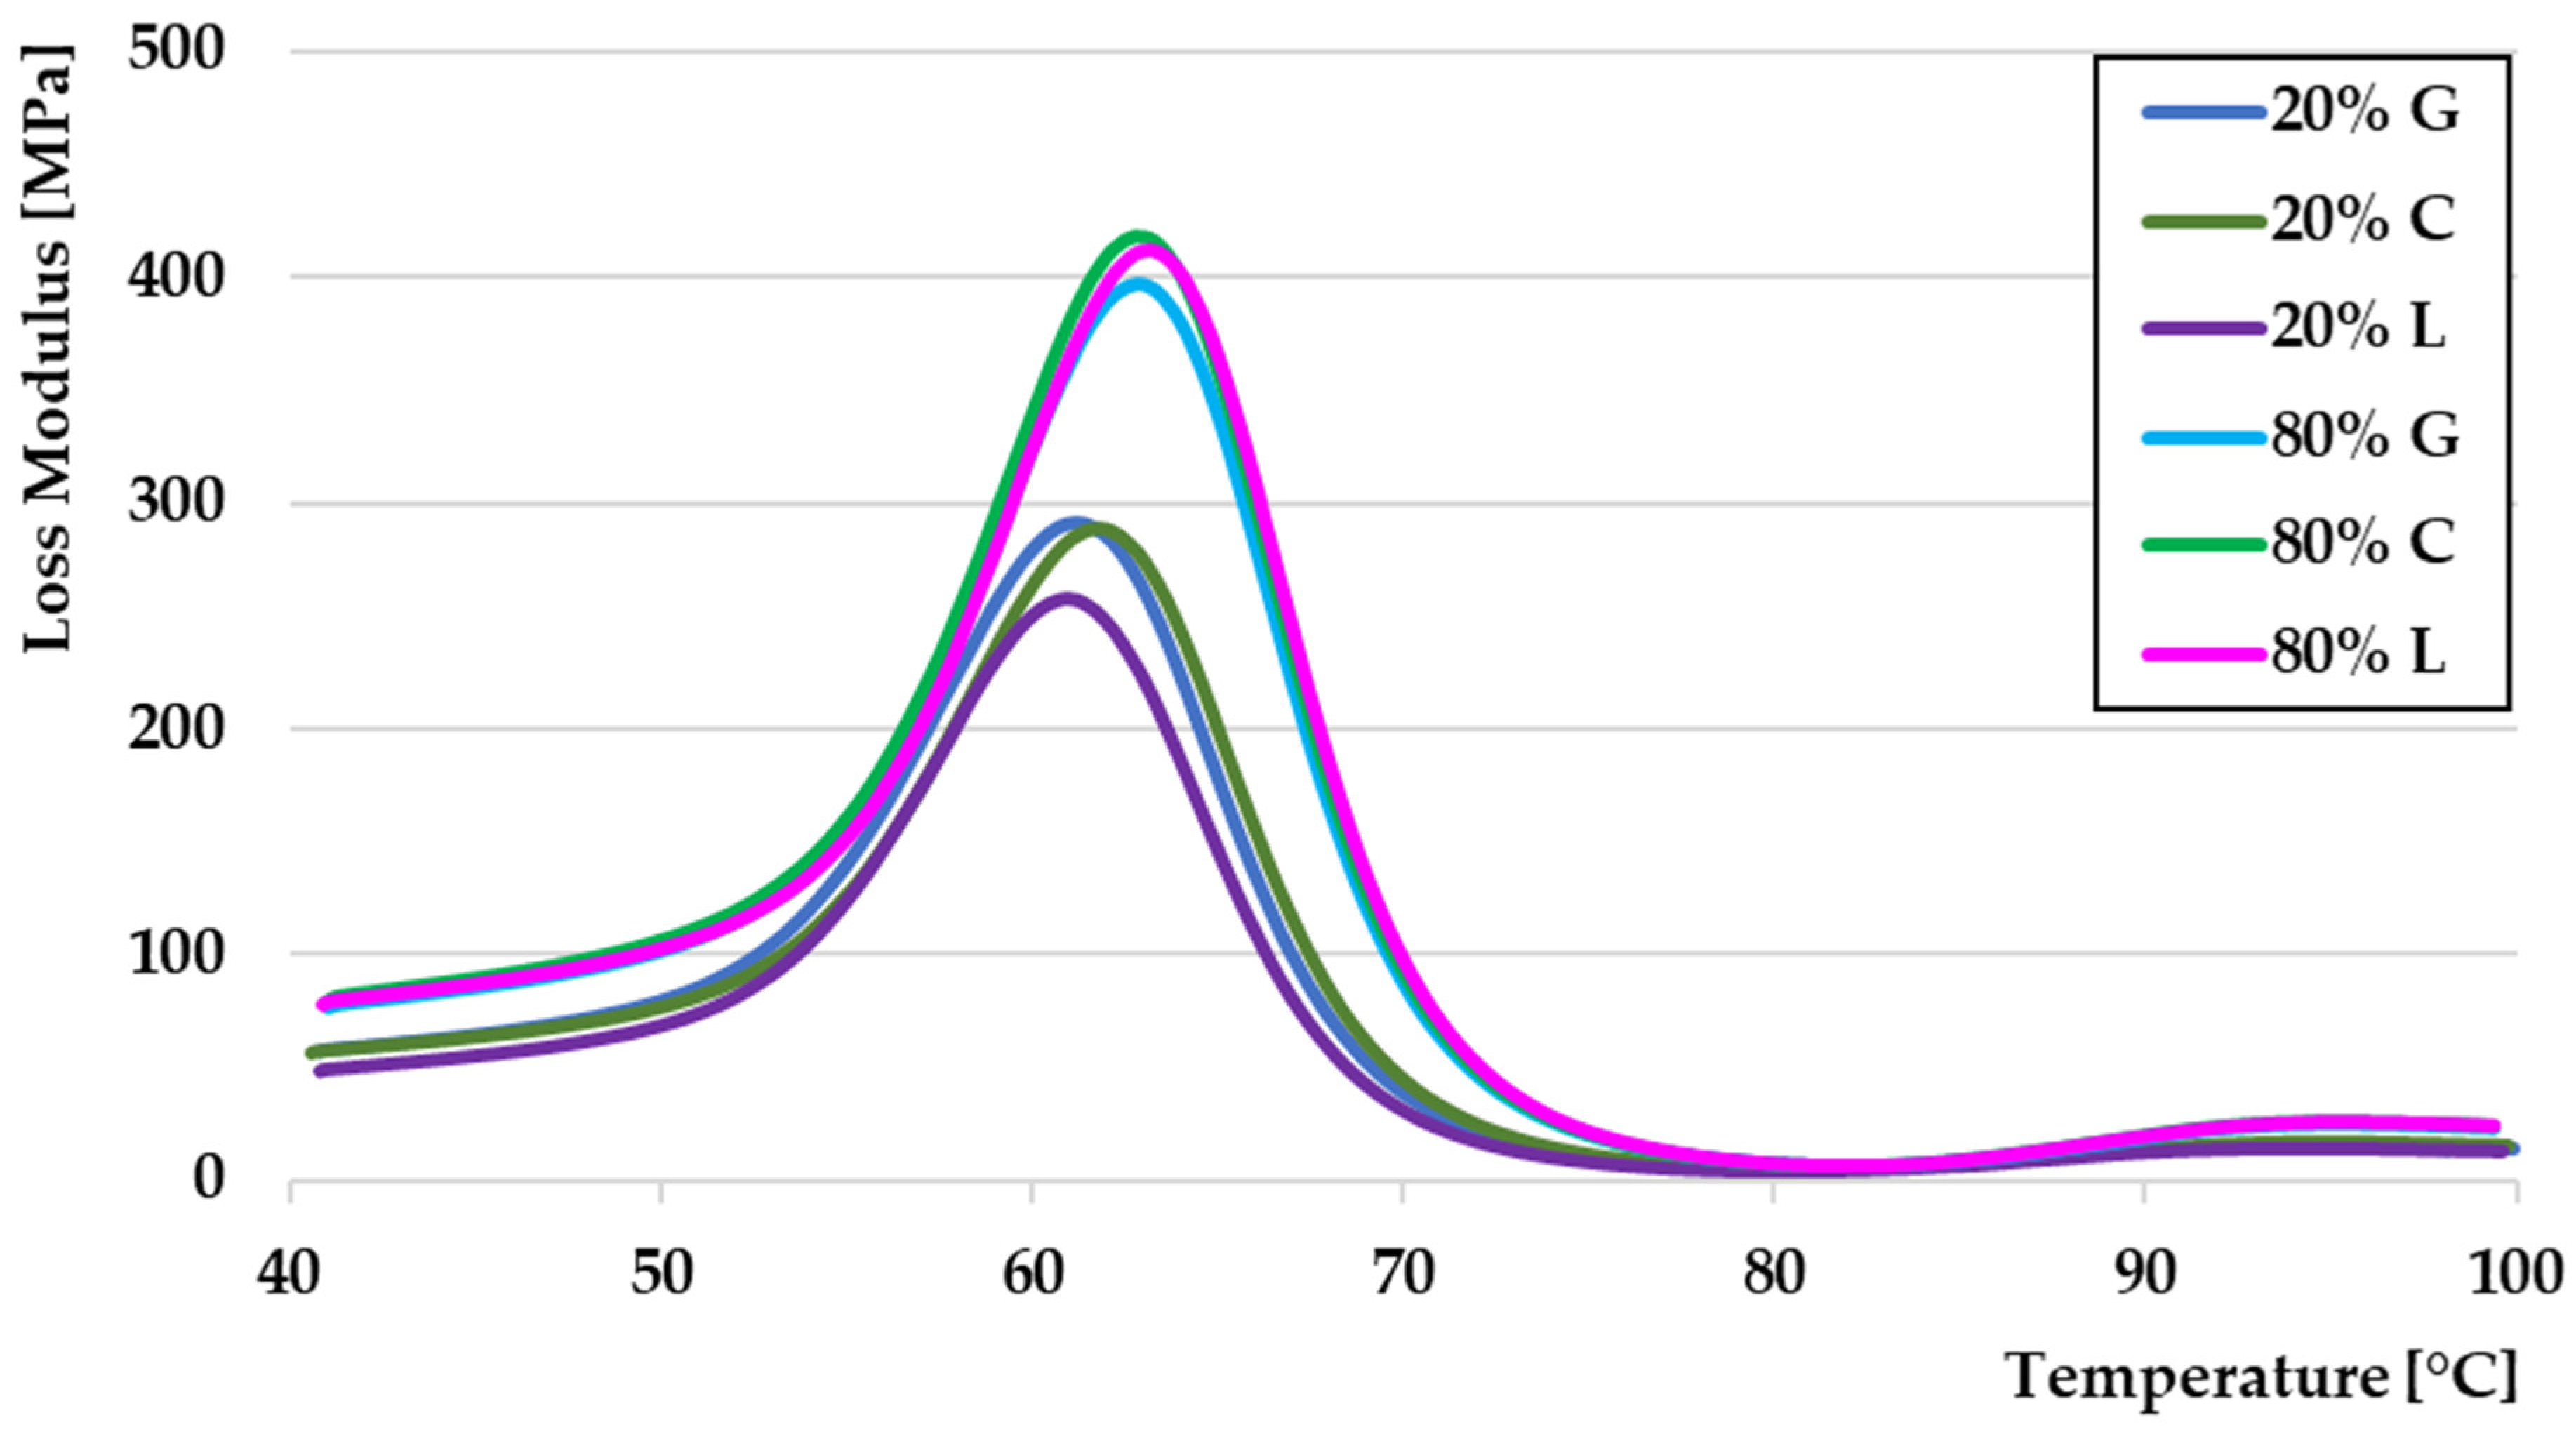
A comparison of the loss modulus (E′′) (Figure 13) for PLA material with different filling patterns and different filling densities shows significant differences in mechanical energy dissipation under 10 Hz dynamic loading.
Dynamic mechanical analysis (DMA) measurements revealed that the maximum value of the loss modulus is located in the temperature range of 60–70 °C, which correlates with the glass transition temperature (Tg) of the PLA material.
The highest loss modulus at Tg is shown by the sample with cubic filling (C) at 20% filling density, reaching approximately 500 MPa. This result indicates that the cubic structure allows for a higher rate of mechanical energy dissipation compared to other filling patterns. Gyroid (G) and linear (L) fillings show similar behavior, but linear (L) fillings achieve the lowest loss modulus values, indicating their lower ability to effectively dissipate internal stresses during dynamic loading.
The results also show the influence of the filling density on the mechanical properties of the material. Samples with a lower filling density (20%) show higher values of the loss modulus compared to samples with a filling density of 80%. This phenomenon may be due to the higher degree of internal friction between the layers at a lower filling, which leads to a higher attenuation of mechanical vibrations. Conversely, a higher filling density (80%) causes a lower loss modulus, which indicates better structural integrity and a lower rate of energy dissipation.
At higher temperatures, exceeding 80 °C, the loss modulus values are equalized between individual samples, which indicates a reduced influence of the filler structure in the rubbery state of the material. The results indicate that under dynamic loading, the choice of filler pattern and its density is a key factor in optimizing the mechanical properties of PLA, especially in the temperature range close to Tg.

3.2.3. Tan Delta

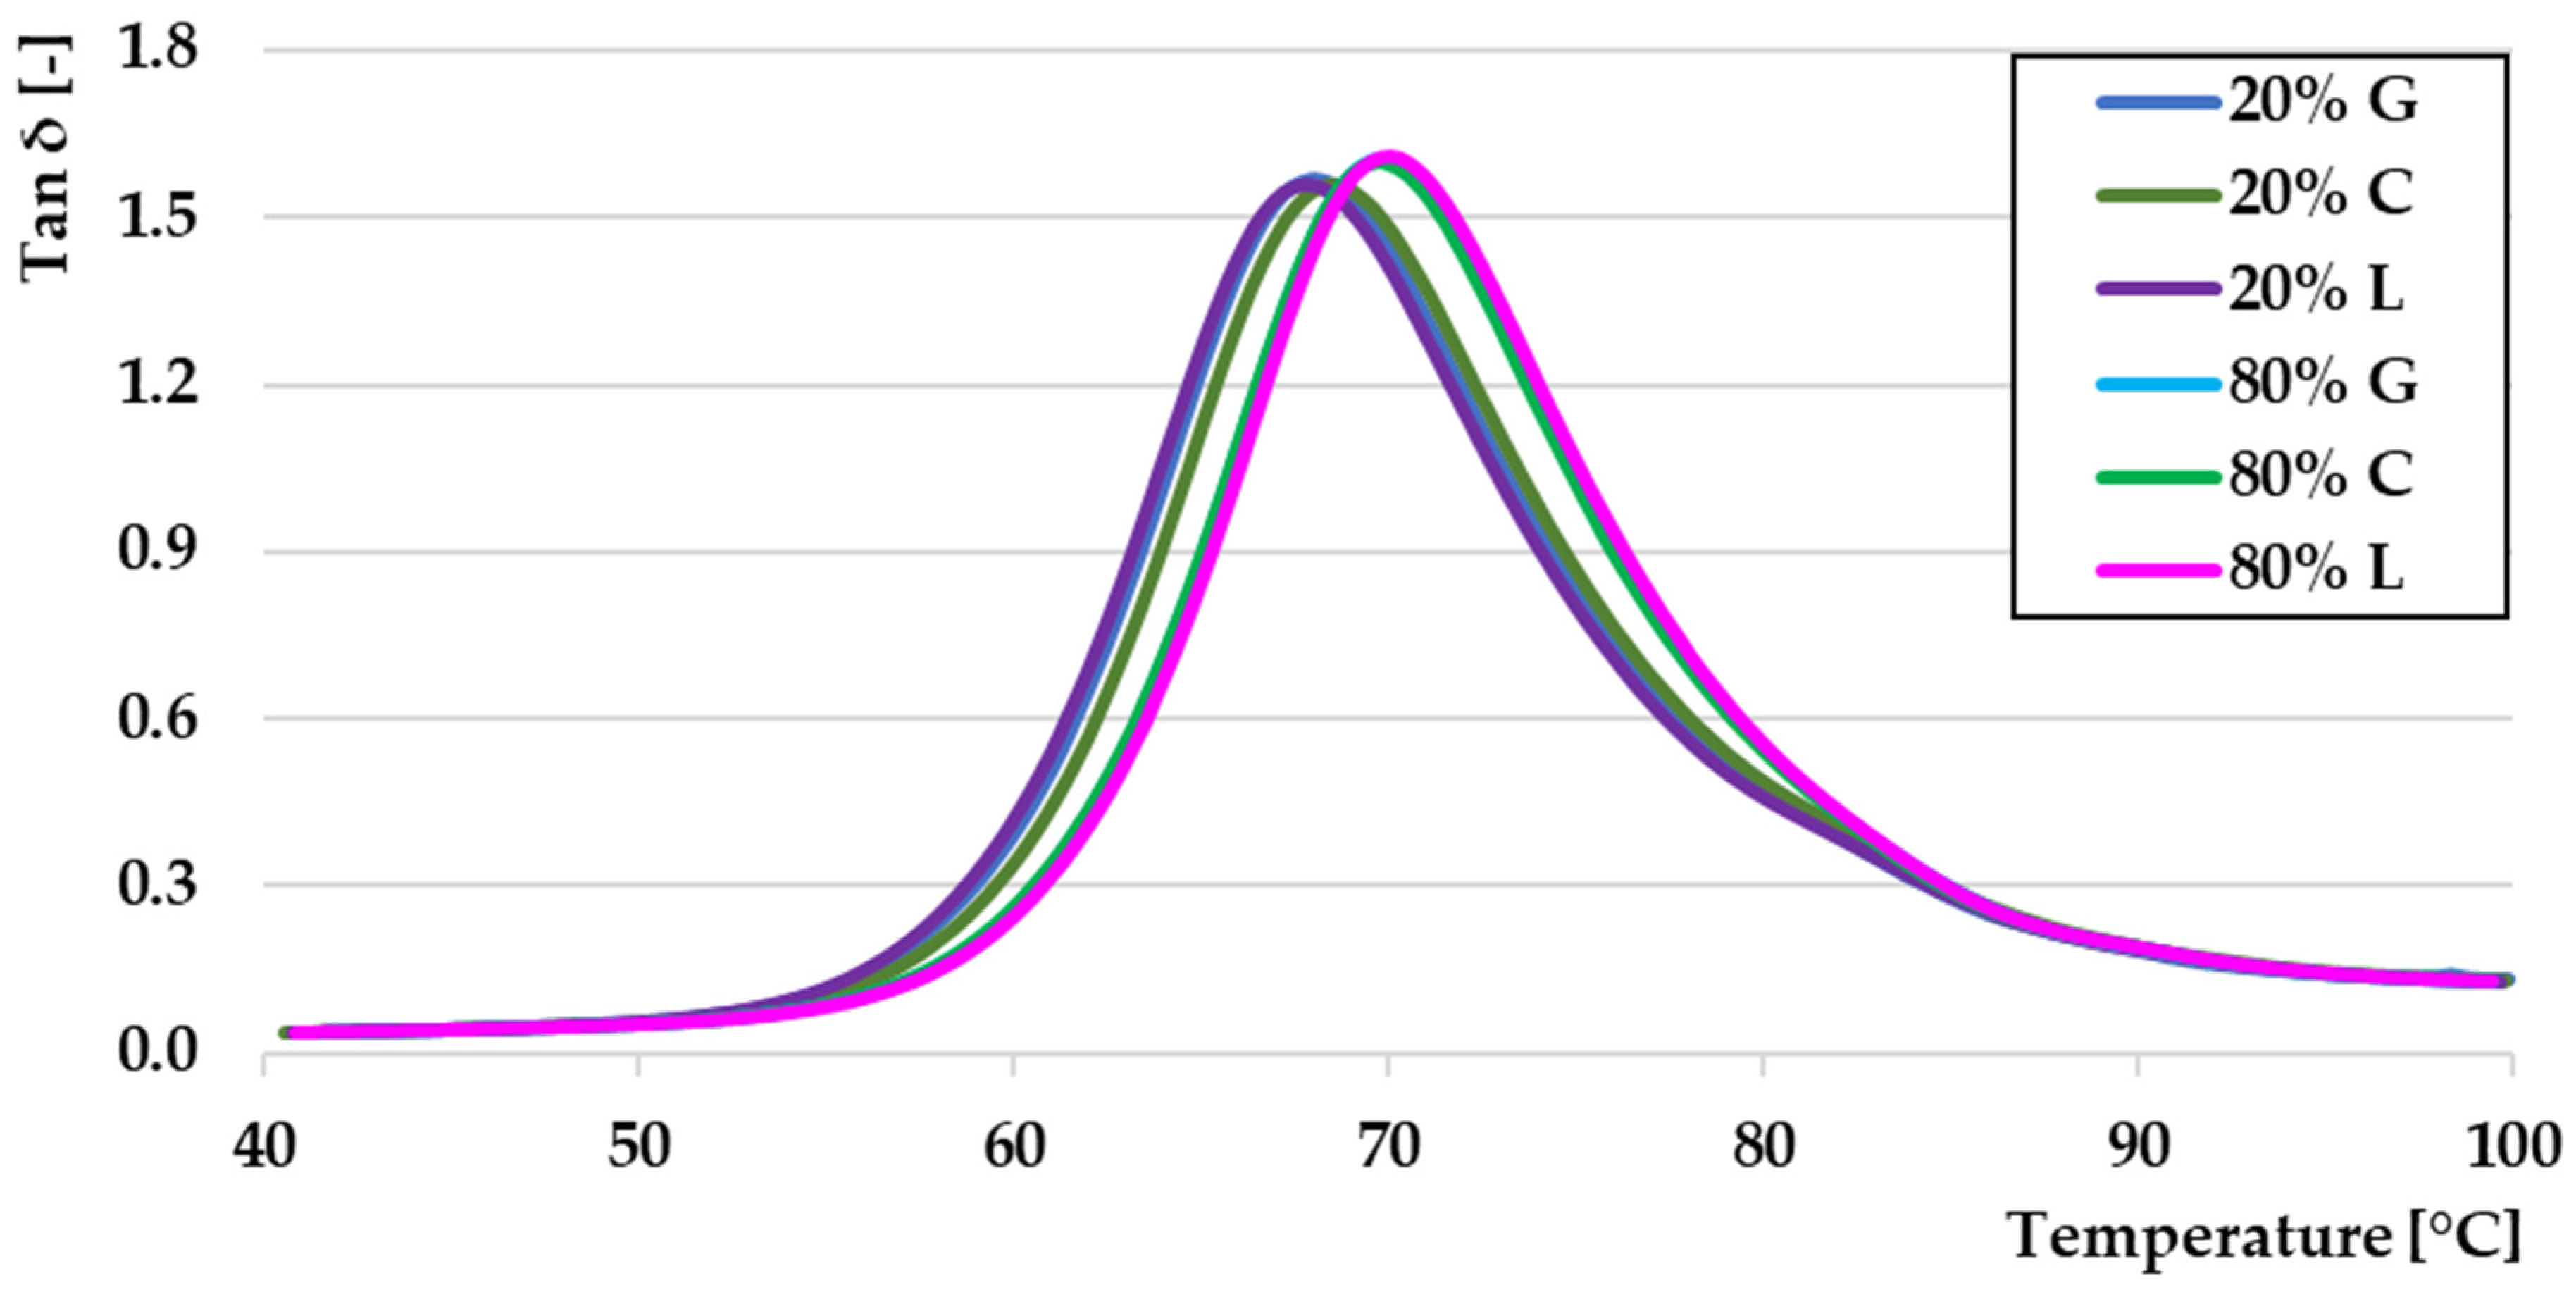
The graph shows the dependence of the loss factor (tan δ) (Figure 14) on the temperature under dynamic loading with a frequency of 10 Hz. The loss factor expresses the ratio between the loss (E″) and the storage modulus (E’) and characterizes the viscoelastic behavior of the material. Higher values of tan δ indicate a greater ability of the material to absorb mechanical energy and convert it into heat.
At low temperatures (40–50 °C), tan δ values are close to zero, indicating a predominantly elastic behavior of the material. With increasing temperature, tan δ gradually increases and reaches a maximum in the range of 65–70 °C, which corresponds to the glass transition (Tg). In this region, the material changes from a rigid to a soft state and exhibits the most pronounced viscoelastic properties. After Tg is exceeded, tan δ values decrease again, indicating that the material transitions to a rubbery state with a lower rate of internal losses.
A comparison of the samples shows that the density of the filler (20% and 80%) and its geometry (cubic, gyroid, rectilinear) have only a minimal effect on the tan δ values. All samples show a similar glass transition temperature and almost the same maximum tan δ values, indicating that the filler structure does not play a significant role in the damping properties of the material. The results confirm that the internal dissipative processes are primarily influenced by the material itself, while the filler has only a small effect on its viscoelastic behavior.

3.2.4. Glass Transition Temperature

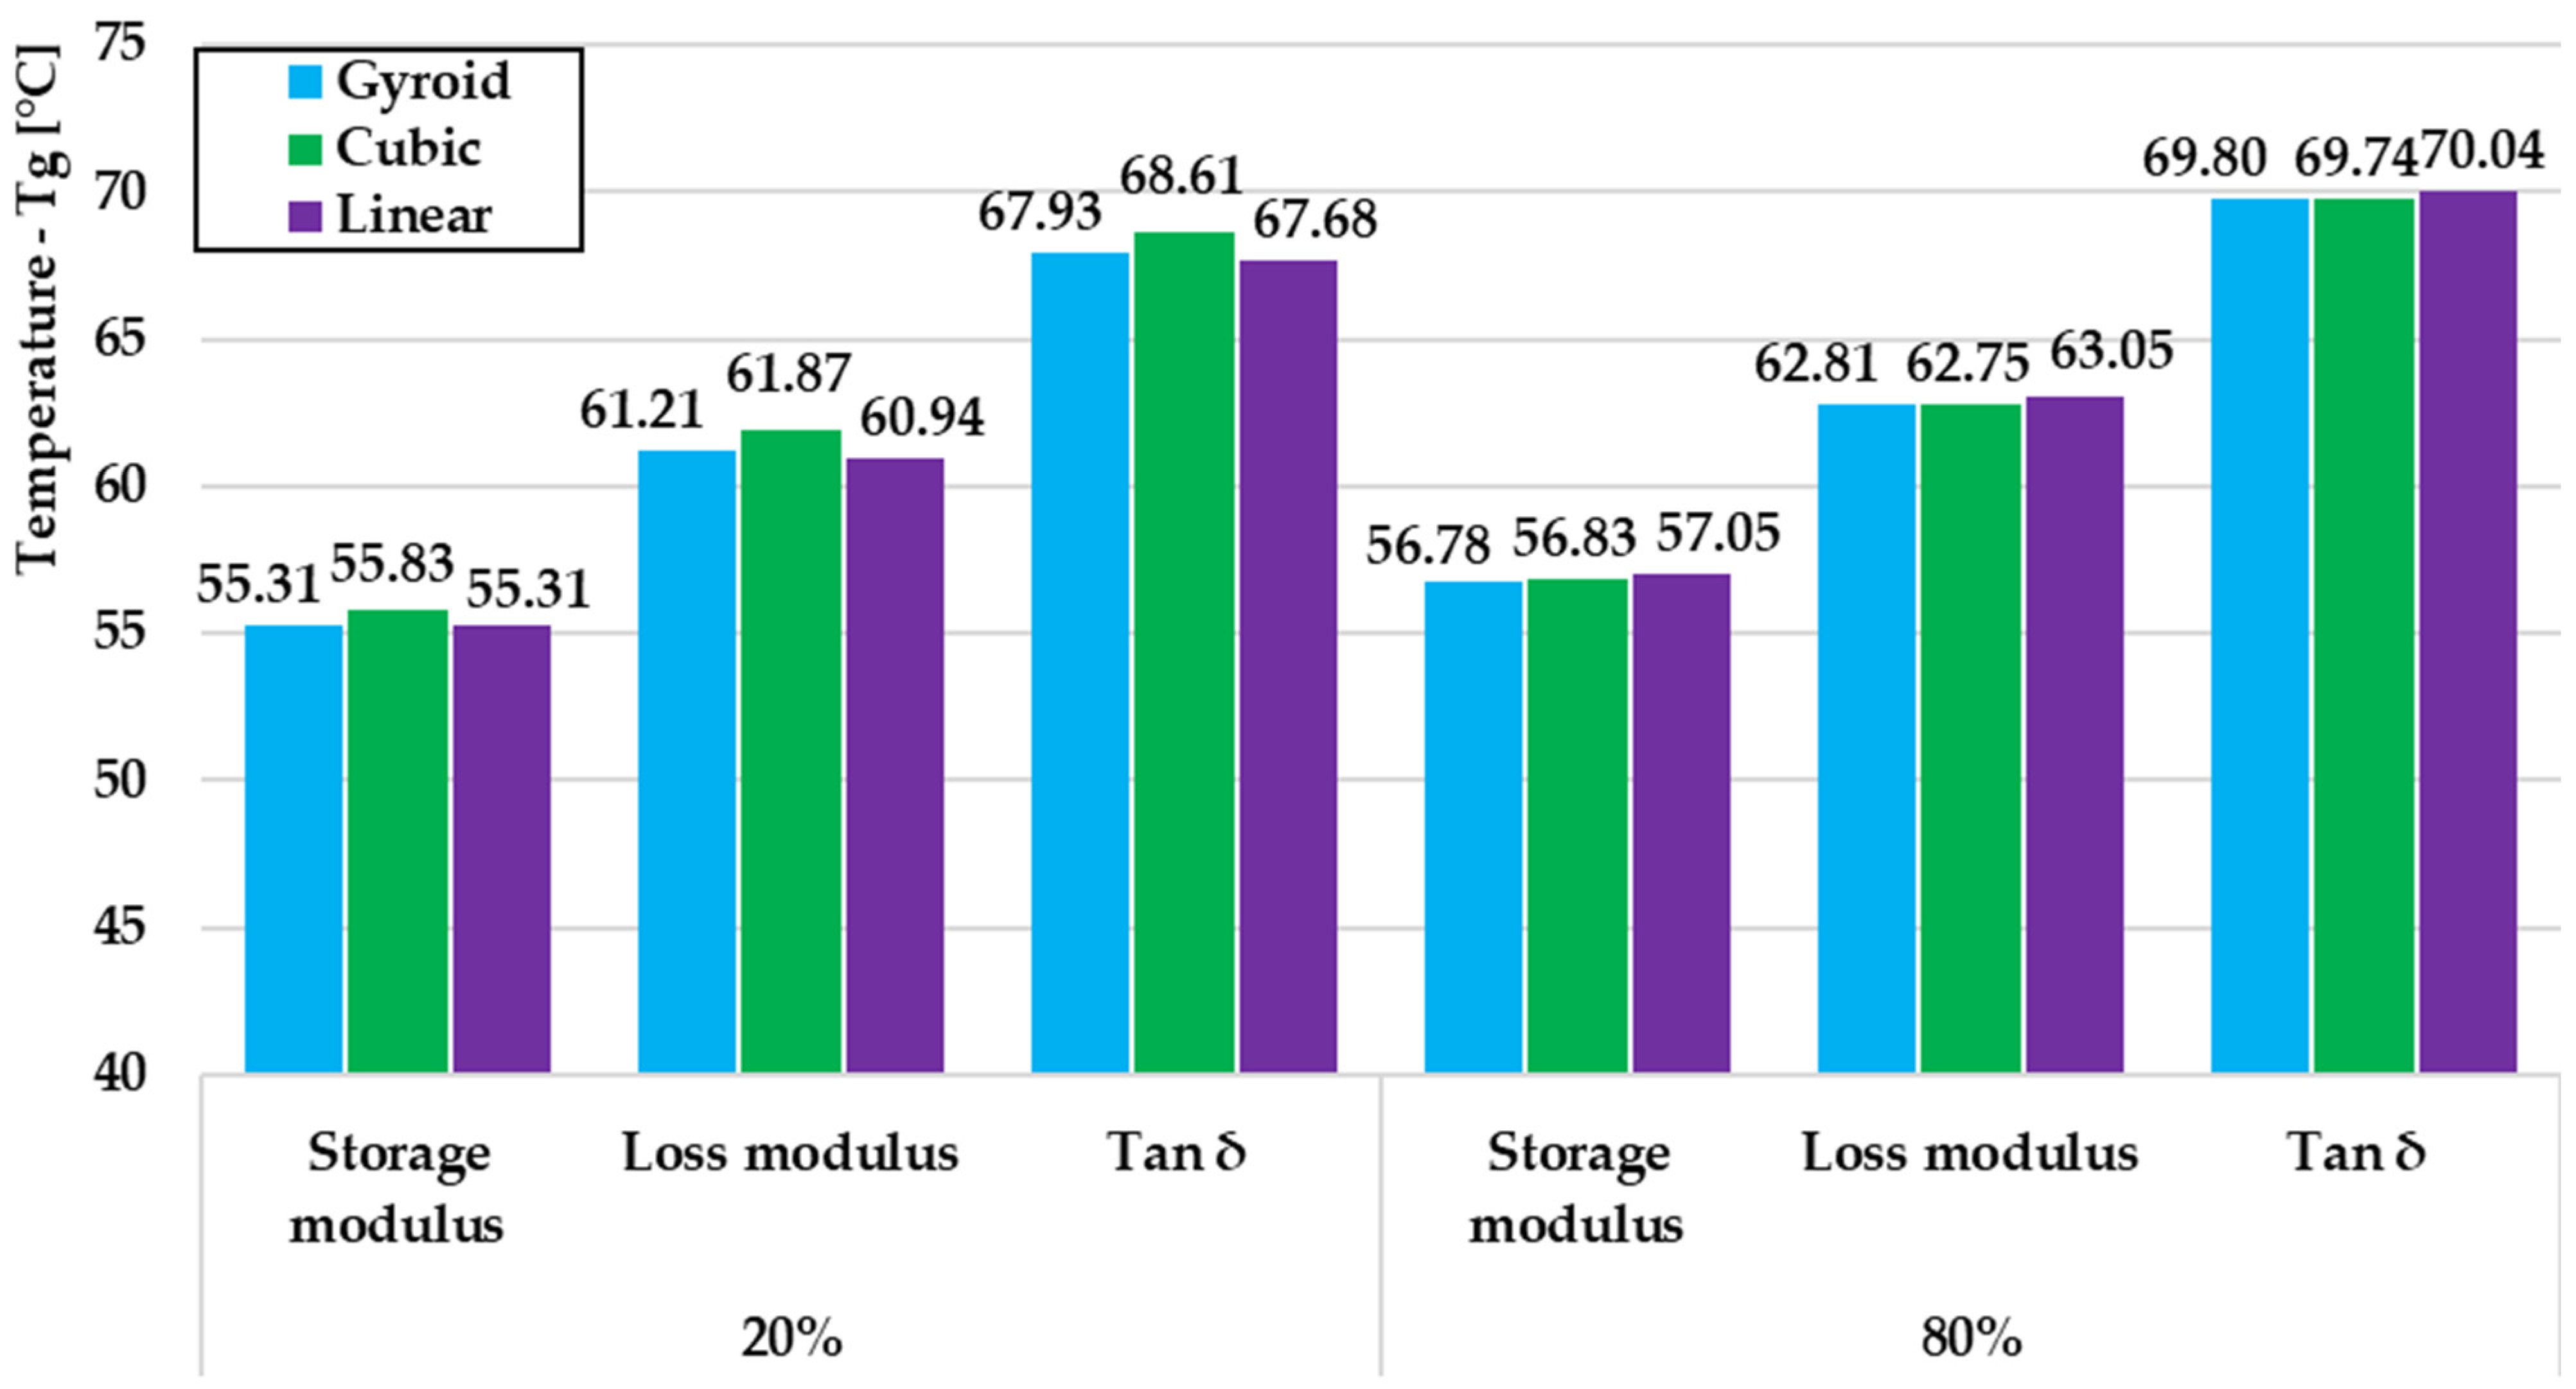
A comparison of the glass transition temperature (Tg) for PLA (Figure 15) material shows that the filler pattern and its density significantly affect the mechanical properties. At 20% filler, the cubic filler achieves the highest glass transition temperature for both the storage modulus (55.83 °C) and loss modulus (61.87 °C), indicating a higher energy dissipation capability. At tan δ, the differences between the patterns are minimized with the cubic filler again achieving the highest value.
At 80% filling, the glass transition temperature shifts to higher values, improving the thermal stability of the material. The differences between the filling patterns are less pronounced with the linear filling achieving the highest loss modulus (63.05 °C) and tan δ (70.04 °C). This trend suggests that higher filling density leads to improved resistance to temperature changes and a better preservation of mechanical properties. The results show that at lower filling densities, the cubic filling is the most effective in energy dissipation, while at higher densities, the properties of the patterns become more even. Optimization of the filling is therefore crucial for applications where high stability at elevated temperatures is required.

3.3. SEM Analysis

Scanning electron microscopy (SEM) is an effective method for analyzing the fracture surfaces of plastic samples, allowing for a detailed assessment of the fracture mechanism and microstructural properties of the material. Thanks to its high magnification and large depth of field, it provides an accurate image of surface characteristics, which is crucial for investigating failures and assessing the quality of materials.
SEM analysis of the walls of PLA samples with different filler volumes revealed significant differences in the material microstructure and the quality of layer adhesion. The comparison was performed for three types of fillers: rectilinear, gyroid and cubic, and samples with 20% and 80% filler volumes were analyzed.
  • Linear infill
At 20% infill volume (L 20%) (Figure 16a), the surface structure is rougher, with higher porosity, which indicates weaker adhesion between layers and a greater susceptibility to microcrack formation. These defects are probably the result of uneven sintering of the material during printing.
On the contrary, at 80% volume infill (L 80%) (Figure 16b), the microstructure is more compact and homogeneous. The surface texture is finer and defects are less pronounced, which indicates a more efficient sintering process. A higher volume of filling contributes to a more uniform temperature distribution during printing, thereby improving the mechanical stability of the sample.
Overall, a higher volume of rectilinear infill positively affects the quality of the sample wall, while a lower volume can lead to structural irregularities and the weakening of mechanical properties.
  • Gyroid infill
At 20% volume filling (G 20%) (Figure 16c), the surface structure of the wall is significantly stratified with visible voids and irregular transitions between layers. The material exhibits higher porosity and in some places inhomogeneous adhesion, which may indicate weaker material coherence due to uneven heat distribution during printing. This phenomenon may increase the susceptibility of the wall to delamination or microcracking under mechanical loading.
At 80% infill volume (G 80%) (Figure 16d), the microstructure of the wall is significantly more compact and homogeneous. The surface is less fragmented with fewer cracks and visibly better adhesion between layers. The higher infill volume probably ensured a more uniform temperature distribution during printing, thus eliminating defects typical of samples with lower infill volume.
The results show that a higher gyroid infill volume improves the quality of the sample wall, reduces structural defects and increases its mechanical stability. On the contrary, a lower infill volume leads to more pronounced porosity, which may negatively affect the strength of the printed part.
  • Cubic infill
At 20% volume infill (C 20%) (Figure 16e), the wall structure is significantly porous with visible voids and peeling layers. The surface is rough and stratified with microcracks and inhomogeneous material adhesion. The lower density of the cubic fill probably caused a weaker sintering of the inner layers, which can lead to a weakening of the mechanical properties and an increased susceptibility to delamination.
At 80% volume infill (C 80%) (Figure 16f), the sample wall is more compact and homogeneous with better adhesion between layers. The surface texture is less rough and the porosity is significantly lower. The higher volume infill provides a stronger internal support, thus optimizing heat distribution during printing and improving the adhesion of individual layers. This leads to a higher mechanical stability and durability of the printed part. Overall, the results indicate that a higher cubic filler volume favorably affects the structural integrity of the sample wall, reduces defects caused by discontinuous sintering, and minimizes the risk of microcracks. Conversely, a lower infill volume leads to higher porosity and possible weakening of the material, which can negatively affect its strength and durability under mechanical loading. Overall, the given images show that the microstructure of the sample walls is significantly influenced by the infill density. At a lower infill volume, structural defects such as microcracks, delamination and increased porosity are formed. On the contrary, at a higher infill volume, the material is more compact, with better layer adhesion and a more homogeneous structure, which positively affects the mechanical stability of the printed parts.
  • Linear infill
At 20% infill volume (L 20%) (Figure 17a), the microstructure is significantly porous with large voids between individual infill elements. Areas of insufficient material interconnection are visible, indicating poor adhesion during the printing process. Empty spaces between infill segments reduce the mechanical stability of the sample and can lead to local stress concentrations under mechanical loading.
At 80% infill volume (L 80%) (Figure 17b), the infill is more compact and significantly denser. The joints between individual infill segments are more homogeneous, and the porosity is significantly reduced. This difference indicates better material continuity and higher sample strength. The higher infill volume likely ensured a more uniform temperature distribution during printing, thus eliminating some of the defects typical of samples with lower infill volume.
The results show that a higher volume of rectilinear infill significantly improves the structural integrity of the sample center, reduces the occurrence of voids, and increases the overall strength of the material. Conversely, a lower infill volume leads to greater porosity and an increased risk of mechanical failure due to stress concentration in the voids.
  • Gyroid infill
At 20% infill volume (G 20%) (Figure 17c), high porosity is visible with extensive voids between individual infill segments. The bonds between the fibers are weakened and the infill structures are not sufficiently interconnected, which can lead to low mechanical stability. The surface texture is rougher, with broken edges, which indicates inhomogeneous sintering of the layers. This effect can be caused by uneven heat distribution during printing, while the lower infill volume did not allow sufficient support during sintering of the individual layers.
At 80% infill volume (G 80%) (Figure 17d), the structure is significantly more compact and better interconnected. The infill segments are more tightly connected with minimized voids and more homogeneous sintering of the material. The surface texture is smoother and the material shows better coherence between the layers. The higher infill volume in the gyroid geometry allows for more efficient temperature distribution during printing, leading to higher mechanical stability and a lower risk of delamination.
The results show that a higher gyroid infill volume significantly improves the strength and homogeneity of the material, while a lower infill volume leads to structural weakening, increased porosity and potential mechanical failure under load.
  • Cubic infill
At 20% infill volume (C 20%) (Figure 17e), the microstructure is significantly porous with large voids between the infill segments. The structure is non-uniform, with individual infill elements not sufficiently sintered, indicating poor adhesion between layers. Fragmented parts and material peeling are visible, which may be a consequence of insufficient support of the internal infill elements during printing. Increased porosity can negatively affect the mechanical properties of the sample, reducing its strength and increasing the risk of local failures under mechanical loading.
At 80% volume of infill (C 80%) (Figure 17f), the microstructure is more compact with better adhesion between individual infill elements. The visibly reduced porosity and more uniform structure indicate better sintering of the material during printing. The surface texture is more homogeneous and less prone to peeling, which indicates a higher strength and stability of the sample. The higher volume of cubic infill allows for more uniform heat distribution and minimizes structural defects caused by inconsistent sintering.
The results show that the higher volume of cubic infill significantly improves the mechanical properties of the sample, reduces the occurrence of structural defects and increases its overall strength.
Overall, the given images show that the microstructure of the center of the sample is significantly affected by the infill density. At lower infill volume, large voids are formed, and weakened connections between filling segments and increased porosity occur, which can negatively affect the mechanical stability of the material. On the contrary, at higher infill volume, the structure is more compact with more homogeneous adhesion between segments and better mechanical stability.

4. Discussion

Experimental results confirm that the choice of infill geometry and its bulk density fundamentally affect the mechanical properties of 3D-printed PLA parts. Higher infill density leads to better mechanical properties, while lower density can increase porosity and reduce strength. Lubombo and Huneault demonstrated that linear infill achieves higher tensile strength than cubic infill at the same infill density, while increasing the number of peripheral layers can improve strength by up to 84% [18]. Rismalia et al. found that gyroid infill provides a more homogeneous stress distribution, thereby reducing the risk of local failures and leading to better mechanical stability [19]. Pandzic et al. confirmed that linear infill is preferable at lower bulk densities, while cubic infill provides better stability and strength at higher densities [20]. Ambati et al. demonstrated that gyroid infill efficiently distributes stress and minimizes the risk of delamination due to its geometry, confirming its suitability for structural applications [21]. Khan et al. emphasized its ability to absorb shock loads, making it suitable for applications requiring high resistance to dynamic forces [22].
Ambati et al. addressed a similar issue to ours, but their research focused on higher fill values, namely 60%, 75%, and 90%; unlike us, they did not even specify the number of perimeters, while for the walls, they used preset values that are commonly used in printing. Yeoh et al. also focused on the influence of the shape and density of the print. Unlike us and Ambati et al., they focused on only one volume, namely 80%. These studies support our results that the influence and geometry of the print are mediated by the mechanical properties of the samples, where our study also focuses on lower print volumes, which can help in prototype production and save material while ensuring sufficient strength [21,23].
SEM microstructure analysis revealed differences in porosity and microcrack formation between different infill patterns. Yeoh et al. showed that by optimizing the infill, printing speed, and layer thickness, it is possible to achieve better strength while reducing material consumption, which was also confirmed by their SEM analyses indicating a more homogeneous microstructure with correctly set parameters [23]. Zakaria et al. pointed out the importance of correctly set production parameters for the quality of PLA nanocomposites, while the wrong combination of temperature, pressure and mixing can lead to a weakening of mechanical properties, which was also confirmed by the observation of microcracks in SEM images [24]. Based on the obtained results, it can be stated that the choice of infill geometry is crucial—cubic infill provides the highest strength at higher densities, gyroid infill represents the optimal compromise between strength and elasticity, while linear infill shows better shock absorption. SEM analysis confirmed that microstructural differences between infill patterns have a significant impact on the mechanical response of the material, thereby underlining the importance of the correct choice of infill for specific applications [25,26].

5. Conclusions

The aim of this study was to analyze the effect of gyroid, cubic and linear infill at four bulk densities (20%, 40%, 60% and 80%) on the mechanical properties of 3D-printed parts. The evaluated properties included tensile strength, yield strength, elastic modulus and elongation, which are key to the performance and durability of the parts. From the measurements, we can draw the following results:
  • Effect of infill density on mechanical properties
The mechanical properties of PLA parts are significantly affected by the infill density. Lower density leads to higher porosity and lower mechanical resistance, while higher density improves the strength and stability of the material. The linear infill increased the tensile strength by 41% (from 14.75 MPa at 20% infill to 20.84 MPa at 80% infill). Gyroid infill recorded a similar increase of 41% (from 14.55 MPa to 20.53 MPa). The highest strength increase was observed for cubic infill, where there was an improvement of up to 57% (from 13.39 MPa to 21.06 MPa).
2.
Comparison of infill geometries
At 20% infill, the linear infill achieved the highest strength (14.75 MPa), which is 1.4% higher than gyroid infill (14.55 MPa) and 10.2% higher than cubic infill (13.39 MPa).
At 80% infill, the cubic infill had the highest strength (21.06 MPa), which is 2.2% higher than gyroid infill (20.53 MPa) and 1.1% higher than linear infill (20.84 MPa).
The yield strength at 20% infill was highest for cubic infill (13.39 MPa), while gyroid and rectilinear infill showed similar values (9.32 MPa and 9.24 MPa), which are 43.6% and 44.9% less than that of cubic infill.
The modulus of elasticity increased with increasing infill density with cubic infill reaching a maximum value of 1414.19 MPa at 80% infill. This is 5.9% higher than gyroid infill (1335.37 MPa) and 31.8% higher than rectilinear infill (1073.24 MPa).
3.
SEM analysis of the microstructure of the samples
Scanning electron microscopy showed that a higher filler volume improves the layer adhesion and sintering of the material, while a lower volume causes higher porosity and structural weakening. At 20% infill, voids and weakened joints were observed with gyroid and cubic infill showing better integrity. At 80% infill, the microstructure was more compact, with rectilinear infill having the best layer adhesion, while cubic infill showed moderate internal stresses.
4.
Optimization of parameters for 3D printing
The choice of infill geometry depends on the requirements for mechanical properties. Cubic infill is suitable for maximum strength and stiffness, gyroid infill is suitable for balanced properties, and rectilinear infill is suitable for the highest ductility and shock absorption.

Author Contributions

Conceptualization, J.J.F., M.K. (Michal Krbata) and M.K. (Marcel Kohutiar); methodology, L.K. and A.D.; software, M.E. and Z.S.; validation, J.J.F., M.E. and L.K.; formal analysis, M.K. (Michal Krbata) and M.K. (Marcel Kohutiar); investigation, A.D. and M.E.; resources, Z.S. and J.J.F.; data curation, A.D. and L.K.; writing—original draft preparation, M.K. (Michal Krbata), J.J.F. and M.K. (Marcel Kohutiar); writing—review and editing, L.K. and M.E.; visualization, M.K. (Marcel Kohutiar) and Z.S.; supervision, M.K. (Michal Krbata) and J.J.F.; project administration, M.E., A.D. and L.K.; funding acquisition, M.K. (Michal Krbata). All authors have read and agreed to the published version of the manuscript.

Funding

This research received no external funding.

Data Availability Statement

Data are contained within the article.

Acknowledgments

The Project for the Development of the Organization “DZRO VARoPs” at the Department of Mechanical Engineering, University of Defence.

Conflicts of Interest

The authors declare no conflicts of interest. The funders had no role in the design of the study; in the collection, analyses, or interpretation of data; in the writing of the manuscript; or in the decision to publish the results.

References

  1. Murariu, M.; Dubois, P. PLA Composites: From Production to Properties. Adv. Drug Deliv. Rev. 2016, 107, 17–46. [Google Scholar] [CrossRef] [PubMed]
  2. Daly, M.; Tarfaoui, M.; Bouali, M.; Bendarma, A. Effects of Infill Density and Pattern on the Tensile Mechanical Behavior of 3D-Printed Glycolyzed Polyethylene Terephthalate Reinforced with Carbon-Fiber Composites by the FDM Process. J. Compos. Sci. 2024, 8, 115. [Google Scholar] [CrossRef]
  3. Müller, M.; Jirků, P.; Šlégr, V.; Mishra, R.K.; Hromasová, M.; Novotný, J. Effect of Infill Density in FDM 3D Printing on Low-Cycle Stress of Bamboo-Filled PLA-Based Material. Polymers 2022, 14, 4930. [Google Scholar] [CrossRef] [PubMed]
  4. Turaka, S.; Jagannati, V.; Pappula, B.; Makgato, S. Impact of Infill Density on Morphology and Mechanical Properties of 3D Printed ABS/CF-ABS Composites Using Design of Experiments. Heliyon 2024, 10, e29920. [Google Scholar] [CrossRef]
  5. Chacón, J.M.; Caminero, M.A.; García-Plaza, E.; Núñez, P.J. Additive Manufacturing of PLA Structures Using Fused Deposition Modelling: Effect of Process Parameters on Mechanical Properties and Their Optimal Selection. Mater. Des. 2017, 124, 143–157. [Google Scholar] [CrossRef]
  6. Tian, X.; Liu, T.; Yang, C.; Wang, Q.; Li, D. Interface and Performance of 3D Printed Continuous Carbon Fiber Reinforced PLA Composites. Compos. Part A 2016, 88, 198–205. [Google Scholar] [CrossRef]
  7. Kohutiar, M.; Kakošová, L.; Krbata, M.; Janík, R.; Fekiač, J.J.; Breznická, A.; Eckert, M.; Mikuš, P.; Timárová, Ľ. Comprehensive Review: Technological Approaches, Properties, and Applications of Pure and Reinforced Polyamide 6 (PA6) and Polyamide 12 (PA12) Composite Materials. Polymers 2025, 17, 442. [Google Scholar] [CrossRef]
  8. Bax, B.; Müssig, J. Impact and Tensile Properties of PLA/Cordenka and PLA/Flax Composites. Compos. Sci. Technol. 2008, 68, 1601–1607. [Google Scholar] [CrossRef]
  9. Oksman, K.; Skrifvars, M.; Selin, J.F. Natural Fibres as Reinforcement in Polylactic Acid (PLA) Composites. Compos. Sci. Technol. 2003, 63, 1317–1324. [Google Scholar] [CrossRef]
  10. Mayandi, K.; Rigesh, K.; Iyyappan, K.; Sethu, S. The Effect of Infill Density on Tensile Properties of 3D Printed Chopped Carbon Fiber Reinforced PLA Composites. Interactions 2024, 245, 241. [Google Scholar] [CrossRef]
  11. Enyan, M.; Amu-Darko, J.N.O.; Issaka, E.; Abban, O.J. Advances in Fused Deposition Modeling on Process, Process Parameters, and Multifaceted Industrial Application: A Review. Eng. Res. Express 2024, 6, 012401. [Google Scholar] [CrossRef]
  12. Czyżewski, P.; Marciniak, D.; Nowinka, B.; Borowiak, M.; Bieliński, M. Influence of Extruder’s Nozzle Diameter on the Improvement of Functional Properties of 3D-Printed PLA Products. Polymers 2022, 14, 356. [Google Scholar] [CrossRef]
  13. Vidakis, N.; Petousis, M.; Tzounis, L.; Moutsopoulou, A.; Velidakis, E. Quantitative Insight into the Compressive Strain Rate Sensitivity of Polylactic Acid, Acrylonitrile Butadiene Styrene, Polyamide 12, and Polypropylene in Material Extrusion Additive Manufacturing. Polymers 2022, 10, 251–269. [Google Scholar] [CrossRef]
  14. Kutlu, Y.; Yildirim, H.; Kayacan, M.C.; Onal, L. Optimizing Directed Energy Deposition of Polymers Through Melt Pool Temperature Control: Impact on Physical Properties of Polyamide 12 Parts. Prog. Addit. Manuf. 2024, 9, 2403–2412. [Google Scholar] [CrossRef]
  15. Kohutiar, M.; Janík, R.; Krbata, M.; Bartosova, L.; Jus, M.; Timárová, Ľ. Study of the Effect of Pretreatment of 3D Printed PLA Filament Modified by Plasma Discharge and Changes in Its Dynamic-Mechanical Properties. Manuf. Technol. 2023, 23, 461–467. [Google Scholar] [CrossRef]
  16. Bartosova, L.; Kohutiar, M.; Krbata, M.; Escherova, J.; Eckert, M.; Jus, M. The Influence of Accelerated Electron Irradiation on the Change of Tribological Behavior of Polymeric Materials PET, PTFE & PE2000C. Manuf. Technol. 2023, 23, 589–596. [Google Scholar]
  17. ASTM D638-22; Standard Test Method for Tensile Properties of Plastics. ASTM International: West Conshohocken, PA, USA, 2022.
  18. Lubombo, C.; Huneault, M.A. Effect of Infill Patterns on the Mechanical Performance of Lightweight 3D-Printed Cellular PLA Parts. Mater. Today Commun. 2018, 17, 214–228. [Google Scholar] [CrossRef]
  19. Rismalia, M.; Hidajat, S.C.; Permana, I.G.R.; Hadisujoto, B.; Muslimin, M.; Triawan, F. Infill Pattern and Density Effects on the Tensile Properties of 3D Printed PLA Material. J. Phys. Conf. Ser. 2019, 1402, 044041. [Google Scholar] [CrossRef]
  20. Pandzic, A.; Hodzic, D.; Milovanovic, A. Effect of Infill Type and Density on Tensile Properties of PLA Material for FDM Process. In Proceedings of the 30th International DAAAM Symposium “Intelligent Manufacturing & Automation”, Zadar, Croatia, 23–26 October 2019; pp. 545–554. [Google Scholar] [CrossRef]
  21. Ambati, S.S.; Ambatipudi, R. Effect of infill density and infill pattern on the mechanical properties of 3D printed PLA parts. Mater. Today Proc. 2022, 64, 804–807. [Google Scholar] [CrossRef]
  22. Khan, S.F.; Zakaria, H.; Chong, Y.L.; Saad, M.A.M.; Basaruddin, K. Effect of Infill on Tensile and Flexural Strength of 3D Printed PLA Parts. IOP Conf. Ser. Mater. Sci. Eng. 2018, 429, 012101. [Google Scholar] [CrossRef]
  23. Yeoh, C.K.; Cheah, C.S.; Pushpanathan, R.; Song, C.C.; Tan, M.A.; Teh, P.L. Effect of Infill Pattern on Mechanical Properties of 3D Printed PLA and cPLA. IOP Conf. Ser. Mater. Sci. Eng. 2020, 957, 012064. [Google Scholar] [CrossRef]
  24. Zakaria, Z.; Islam, M.S.; Hassan, A.; Haafiz, M.K.M.; Arjmandi, R.; Inuwa, I.M.; Hasan, M. Mechanical properties and morphological characterization of PLA/Chitosan/Epoxidized natural rubber composites. Adv. Mater. Sci. Eng. 2013, 2013, 629092. [Google Scholar] [CrossRef]
  25. Suteja, T.J.; Soesanti, A. Mechanical Properties of 3D Printed Polylactic Acid Product for Various Infill Design Parameters: A Review. J. Phys. Conf. Ser. 2020, 1569, 042010. [Google Scholar] [CrossRef]
  26. Eryildiz, M. The Effects of Infill Patterns on the Mechanical Properties of 3D Printed PLA Parts Fabricated by FDM. Ukr. J. Mech. Eng. Mater. Sci. 2021, 7, 1–8. [Google Scholar] [CrossRef]
Figure 1. Schematic representation of the 3D-printing process using the fused filament fabrication (FFF) method.
Jmmp 09 00134 g001
Figure 2. Bambulab P1S 3D printer with samples.
Jmmp 09 00134 g002
Figure 3. Demonstration of differences in internal infill and sample volume for three infill geometries: (G) gyroid infill, (C) cubic infill, and (L) linear infill, each shown at 20%, 40%, 60%, and 80% internal infill.
Jmmp 09 00134 g003
Figure 4. Tensile tester—Instron 5500R.
Jmmp 09 00134 g004
Figure 5. Dependence of tensile strength on the type of filling geometry and bulk density.
Jmmp 09 00134 g005
Figure 6. Dependence of yield strength on the type of filling geometry and bulk density.
Jmmp 09 00134 g006
Figure 7. Dependence of the elastic modulus on the type of filling geometry and bulk density.
Jmmp 09 00134 g007
Figure 8. Dependence of ductility on the type of filling geometry and bulk density.
Jmmp 09 00134 g008
Figure 9. Prediction of mechanical properties for tensile strength.
Jmmp 09 00134 g009
Figure 10. Prediction of mechanical properties for yield strength.
Jmmp 09 00134 g010
Figure 11. Prediction of mechanical properties for modulus of elasticity.
Jmmp 09 00134 g011
Figure 12. Dependence of storage modulus (E’) on temperature under dynamic loading at a frequency of 10 Hz.
Jmmp 09 00134 g012
Figure 13. Loss modulus values (measurement).
Jmmp 09 00134 g013
Figure 14. Dependence of losses on temperature with a frequency of 10 Hz.
Jmmp 09 00134 g014
Figure 15. Comparison of specimens with 20% and 80% fill density and cubic, gyroid, and linear geometries.
Jmmp 09 00134 g015
Figure 16. SEM comparison of the wall microstructure of PLA samples at different filling volumes and geometries: (a) linear infill, 20% infill volume; (b) linear infill, 80% infill volume; (c) gyroid infill, 20% infill volume; (d) gyroid infill, 80% infill volume; (e) cubic infill, 20% infill volume; (f) cubic infill, 80% infill volume.
Jmmp 09 00134 g016
Figure 17. SEM microstructure comparison of the center of PLA samples at different filler volumes and infill geometries: (a) linear infill, 20% infill volume; (b) linear infill, 80% infill volume; (c) gyroid infill, 20% infill volume; (d) gyroid infill, 80% infill volume; (e) cubic infill, 20% infill volume; (f) cubic infill, 80% infill volume.
Jmmp 09 00134 g017
Disclaimer/Publisher’s Note: The statements, opinions and data contained in all publications are solely those of the individual author(s) and contributor(s) and not of MDPI and/or the editor(s). MDPI and/or the editor(s) disclaim responsibility for any injury to people or property resulting from any ideas, methods, instructions or products referred to in the content.

