Article

Directed Energy Deposition-Laser Beam of Semi-Austenitic Precipitation-Hardening Stainless Steel

by
Alex Lourenço Barbosa
1,
Fábio Edson Mariani
1,2,*,
Fernanda Mariano Pereira
1,3,
Osvaldo Mitsuyuki Cintho
3,
Reginaldo Teixeira Coelho
2,
Piter Gargarella
4 and
Kahl Zilnyk
1
1
Competence Center in Manufacturing (CCM), Instituto Tecnológico de Aeronáutica (ITA), São José dos Campos 12228-970, SP, Brazil
2
Department of Production Engineering (SEP), Universidade de São Paulo (USP), São Carlos 13566-590, SP, Brazil
3
Department of Materials Engineering (DEMA), Universidade Estadual de Ponta Grossa (UEPG), Ponta Grossa 84010-330, PR, Brazil
4
Department of Materials Engineering (DEMa), Universidade Federal de São Carlos (UFSCAR), São Carlos 13565-905, SP, Brazil
*
Author to whom correspondence should be addressed.
J. Manuf. Mater. Process. 2025, 9(4), 114; https://doi.org/10.3390/jmmp9040114
Submission received: 17 February 2025 / Revised: 13 March 2025 / Accepted: 18 March 2025 / Published: 29 March 2025

Abstract

:
Directed Energy Deposition-Laser Beam (DED-LB) is an ideal Additive Manufacturing (AM) process to obtain very complex geometries, which can be important for several applications in industries such as aerospace and biomedical engineering. The present study aims to determine optimized DED-LB parameters for printing 17-7 PH stainless steel, a semi-austenitic precipitation-hardening alloy renowned for its exceptional combination of high yield strength, toughness, and corrosion resistance. The experimental work used different combinations of laser power, scanning speed, and powder feed rate to investigate the effects on the morphology, surface roughness, and microstructure of the deposited material. The results indicated that a powder feed rate of 4.7 g/min yielded uniform beads, reduced surface roughness, and increased substrate dilution, enhancing the metallurgical bond between the bead and substrate. Conversely, higher feed rates, such as a rate of 9.2 g/min, resulted in increased surface irregularities due to an excessive amount of partially melted powder particles. Microstructural analysis, supported by thermodynamic calculations, confirmed a ferritic–austenitic solidification mode. The austenite and ferrite fractions varied significantly, depending mainly on the substrate dilution due to the decrease in aluminum content. The combination of 400 W laser power and a 2000 mm/min scanning speed resulted in the optimal set of parameters, with an approximately 30% dilution and 80% austenite.

1. Introduction

Directed Energy Deposition-Laser Beam (DED-LB) has emerged as a promising technique in additive manufacturing (AM) processes due to its ability to produce metallic components with complex geometries [1,2,3]. This technique utilizes a high-power laser beam to melt and deposit metallic powders, creating a 3D shape layer by layer. It offers reasonable dimensional accuracy and complete design freedom, meeting the demands of various industrial sectors, such as the aerospace, automotive, and biomedical sectors [4,5,6,7]. The use of the right combination of process parameters, including laser power, scanning speed, and powder feed rate, is crucial to ensure high-quality depositions that can minimize defects, such as porosity and lack of fusion, directly influencing the mechanical properties of the manufactured component through the resulting microstructure [8,9,10,11,12,13].
Previous studies have emphasized the importance of using optimized DED-LB process parameters to achieve the desired properties in the deposited material. Ballésio et al. [10] conducted a study to identify the optimal parameters for the deposition of Super Duplex 2507 stainless steel, focusing on minimizing defects and controlling the ferrite/austenite ratio. Ma et al. [2] explored the influence of process parameters on the density and surface roughness of functionally graded AISI 316L/Inconel 718 materials, elucidating the complex interaction between these parameters and the resulting microstructures and properties in the component. Barragan et al. [12] deposited and characterized Inconel 625 beads on AISI 304 stainless-steel substrates. Through analytical parameterization studies and Computational Fluid Dynamics (CFDs) simulations, the authors determined process configurations that optimized particle concentration, deposition quality, and cooling rates, resulting in lower gas and raw material consumption, as well as promoting microstructural refinement and increased hardness in the deposited beads and layers.
Other researchers have also investigated the influence of process parameters on the surface roughness of deposited materials by DED-LB [1,13,14]. Yazar et al. [1] evaluated the relationship between process parameters and properties of AISI 316L stainless-steel beads, characterizing microstructure, hardness, and roughness. Their results demonstrated that surface roughness is inversely proportional to laser power and less influenced by scanning speed, in addition to identifying the formation of a homogeneous austenitic–martensitic microstructure under high-laser-power conditions. Núñez et al. [13] investigated roughness in AISI 316L stainless-steel and Inconel 718 parts, correlating it with the powder feed rate and volumetric energy density. The authors demonstrated that the linear mass density of the powder directly influences the surface roughness. Piscopo et al. [14] analyzed dimensional tolerances, surface roughness, and subsurface residual stresses as a function of the input energy. They observed that surface roughness is influenced by the amount of partially melted particles, which are affected by process parameters during component production.
Although extensive research has been conducted on optimizing DED-LB parameters, less attention has been devoted to certain important materials. Among them, precipitation-hardening stainless steels (PH-SSs), which are widely used due to their exceptional combination of mechanical strength, toughness, and corrosion resistance. They are classified based on their microstructure as martensitic, austenitic, or semi-austenitic. While the literature predominantly focuses on martensitic PH-SSs, semi-austenitic grades hold significant potential for applications requiring the integration of AM with machining or plastic forming (i.e., Hybrid Manufacturing—HM). Depending on the applied heat treatment sequence, semi-austenitic PH-SSs can exhibit either a ductile austenitic matrix or a high-strength, high-wear-resistance martensitic matrix reinforced by Ni(Al, Ti) and M23C6 precipitates [15]. This versatility makes semi-austenitic PH-SSs suitable for applications in different industries, from dentistry to the aerospace sector [16,17,18,19].
The present study investigated the influence of different combinations of some important DED-LB parameters, including the laser power, scanning speed, and powder feed rate, on the characteristics of deposited beads of 17-7 semi-austenitic PH-SSs. The samples were characterized using a confocal laser (CF-L) and scanning electron microscope (SEM) to determine the optimal set of parameters for achieving the desired microstructure, with adequate morphology, surface roughness and dilution, and a high austenitic fraction.

2. Materials and Methods

The 17-7 PH SS powder produced by argon-gas atomization was used as the raw material. The nominal chemical composition of the alloy is Cr 18.30%, Ni 7.80%, Al 1.20%, Mn 0.60%, Si 0.60%, C 0.09%, and Fe bal. (all chemical compositions in this paper are given as %wt). The powder exhibited a spherical morphology and a particle size distribution between 70 and 140 µm. A powder flowability of 25 s/50 g and apparent density of 4.39 g/cm3 were measured using a Hall flow meter according to ASTM B213 [20], while an absolute density of 7.633 ± 0.004 g/cm3 was determined using a He pycnometer. As a substrate, AISI 304 stainless steel (Cr 18.00%, Ni 9.00%, Mn 2.00%, Si 0.65%, C 0.08%, Fe bal.) with a thickness of 25.4 mm was used. This substrate was chosen for its chemical similarity to the 17-7 PH steel and for its wide applications as a structural material. Prior to deposition, the substrate surface was prepared by sanding with 120-grit SiC sandpaper followed by cleaning with isopropyl alcohol (C3H8O).
The deposition was performed using a 5-axis DED-LB machine (Modulo 250, BeAM Inc., Deerfield, IL, USA) equipped with a coaxial powder-feeding nozzle and a Nd:YAG fiber laser (YLR-1000-MM-WC-Y14, IPG Photonics Inc., Marlborough, MA, USA) operating at a wavelength of 1070 nm with a focused spot size of 0.8 mm in diameter. Argon-gas flow rates were maintained at 3 L/min for both central and carrier flows, and 6 L/min for the shaping flow, as per the manufacturer’s recommendations. A parameter study was conducted, varying laser power (300, 350, 400, and 450 W), scanning speed (1500, 2000, and 2500 mm/min), and powder feed rate (4.7 and 9.2 g/min). Three single-bead tracks, each measuring 50 mm in length, were deposited for each parameter set. The corresponding surface energy densities (Ed—J/mm2) were calculated using Equation (1), where P is the laser power (W), Vf is the scanning speed (mm/s), and d is the diameter of the laser beam (mm) [21,22]. The calculated values are presented in Table 1.
E d = P V f × d
Bead cross-sections were prepared using standard metallographic techniques, including cutting, mounting, grinding, and mechanical polishing with a colloidal silica suspension. Microstructural evaluation was conducted using a Tescan MIRA3 Scanning Electron Microscope (SEM). SEM analysis included Electron Backscatter Diffraction (EBSD) to identify the phases presented in the beads and to assess the dilution between the bead and the substrate, as well as Energy Dispersive X-ray Spectroscopy (EDS) to assess the chemical compositions. EBSD data were analyzed using the ATEX software suite. An Olympus OLS4100 Confocal Laser Scanning Microscope (CF-LSM) was employed to measure the surface roughness and topography of the deposited beads. Thermodynamic calculations using the CALPHAD approach were performed on the Thermo-Calc software, equipped with the TCFE 12 database for iron-rich alloys. To quantify the extent of the interaction between the deposited material and the substrate, the dilution (D) was calculated from cross-sectional images of the deposited beads using an area-based approach, as expressed by Equation (2), where Ad is the area of the deposited material and As is the area of the melted substrate. This method provides a reliable assessment of the extent of substrate melting and its contribution to the final deposit composition [12]. The areas were measured from metallographically prepared cross-sections using image analysis software.
D = A d A d + A s × 100 %

3. Results and Discussion

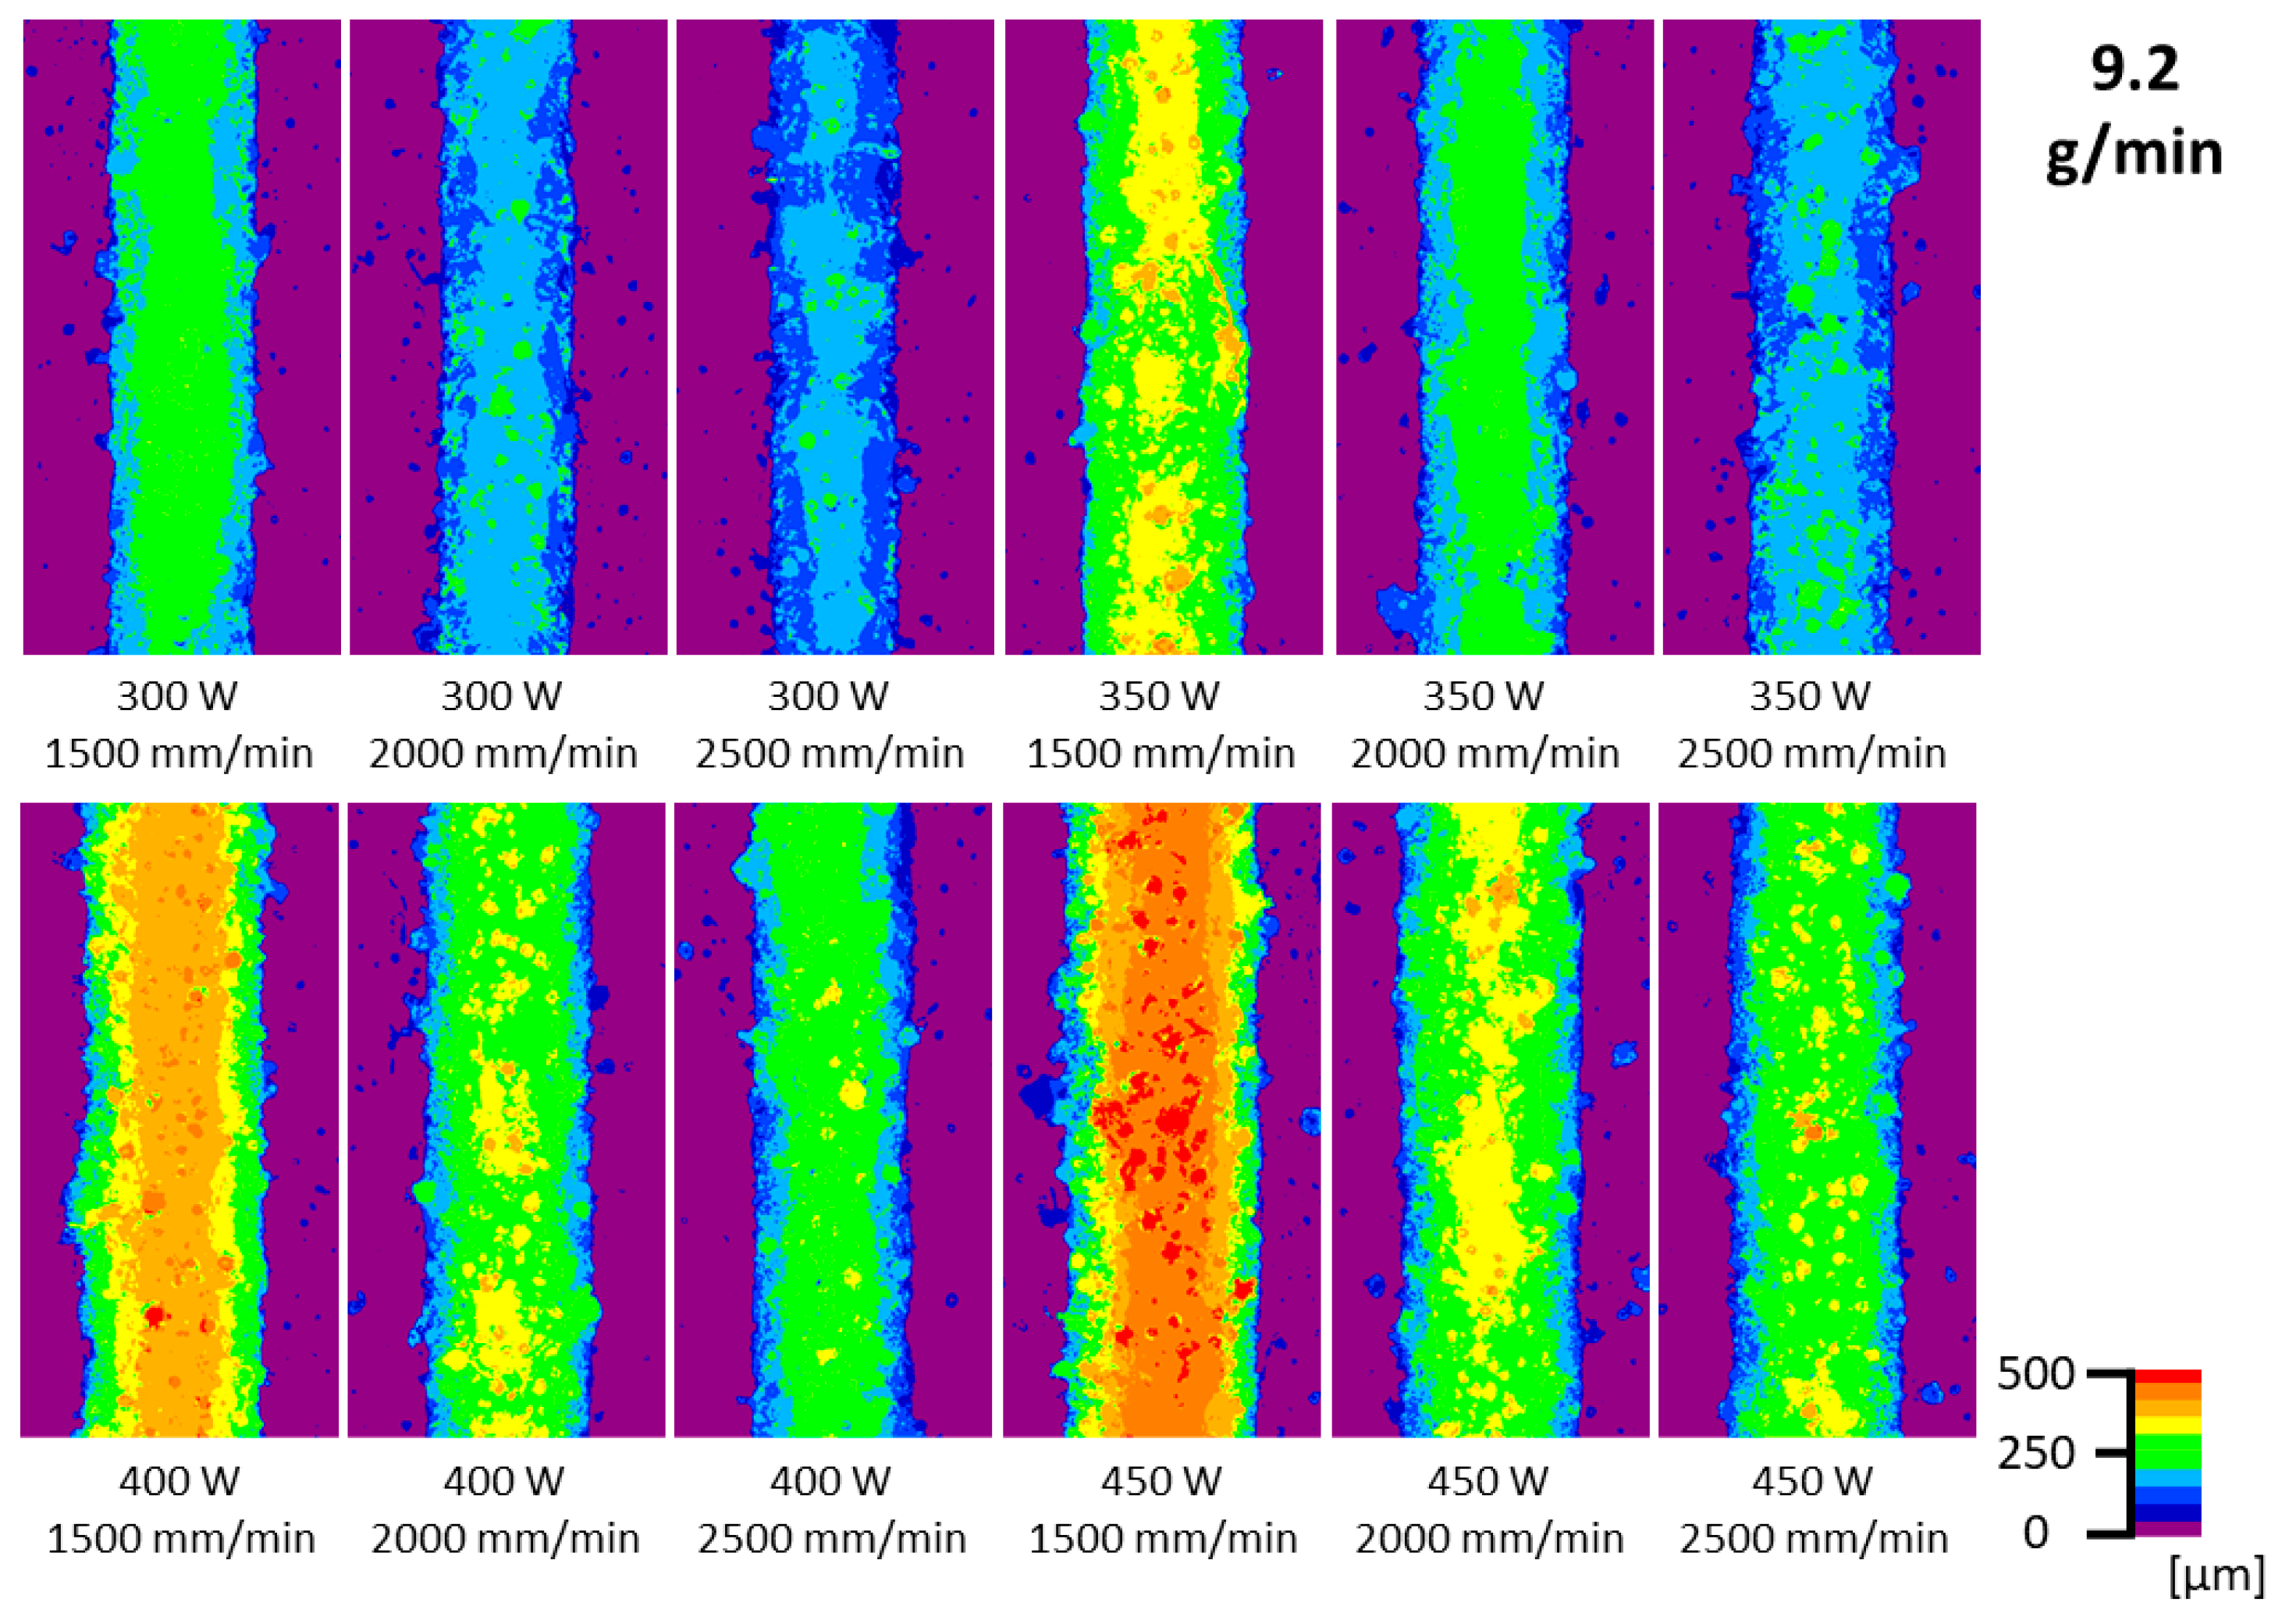
Figure 1 and Figure 2 show the Confocal Laser Scanning Microscope (CF-LSM) images, revealing the surface topography of DED-LB deposited beads.
It can be observed that increasing the laser power, while maintaining the scanning speed constant, produced wider and higher beads. This phenomenon is directly related to the energy density per unit area (Table 1), which increases proportionally with laser power. The increase in energy density intensifies the heat input, promoting the melting of a higher volume of powder under the laser area on the substrate resulting in a higher bead. Some of the powder melts and may spread wider than the melt pool. Similarly, reducing the scanning speed while maintaining the laser power constant also leads to the formation of wider and higher beads, due to the same effect of increased energy density. The lower scanning speed prolongs the interaction time between the laser beam and the melt pool, increasing the energy density. These results are in agreement with the observations of previous studies in the literature [1]. However, such effects are limited by the powder feed rate, i.e., there is a limit to those growing within the same amount of powder. After that limit, further increases in bead height and width can only be achieved by increasing the powder feed rate. Nevertheless, there is also a limit for the amount of powder that can be melted under the same laser area (spot size) and power settings. Depending on those two factors (laser power and spot size) the whole system will only be capable of achieving a limit in terms of bead height and width.
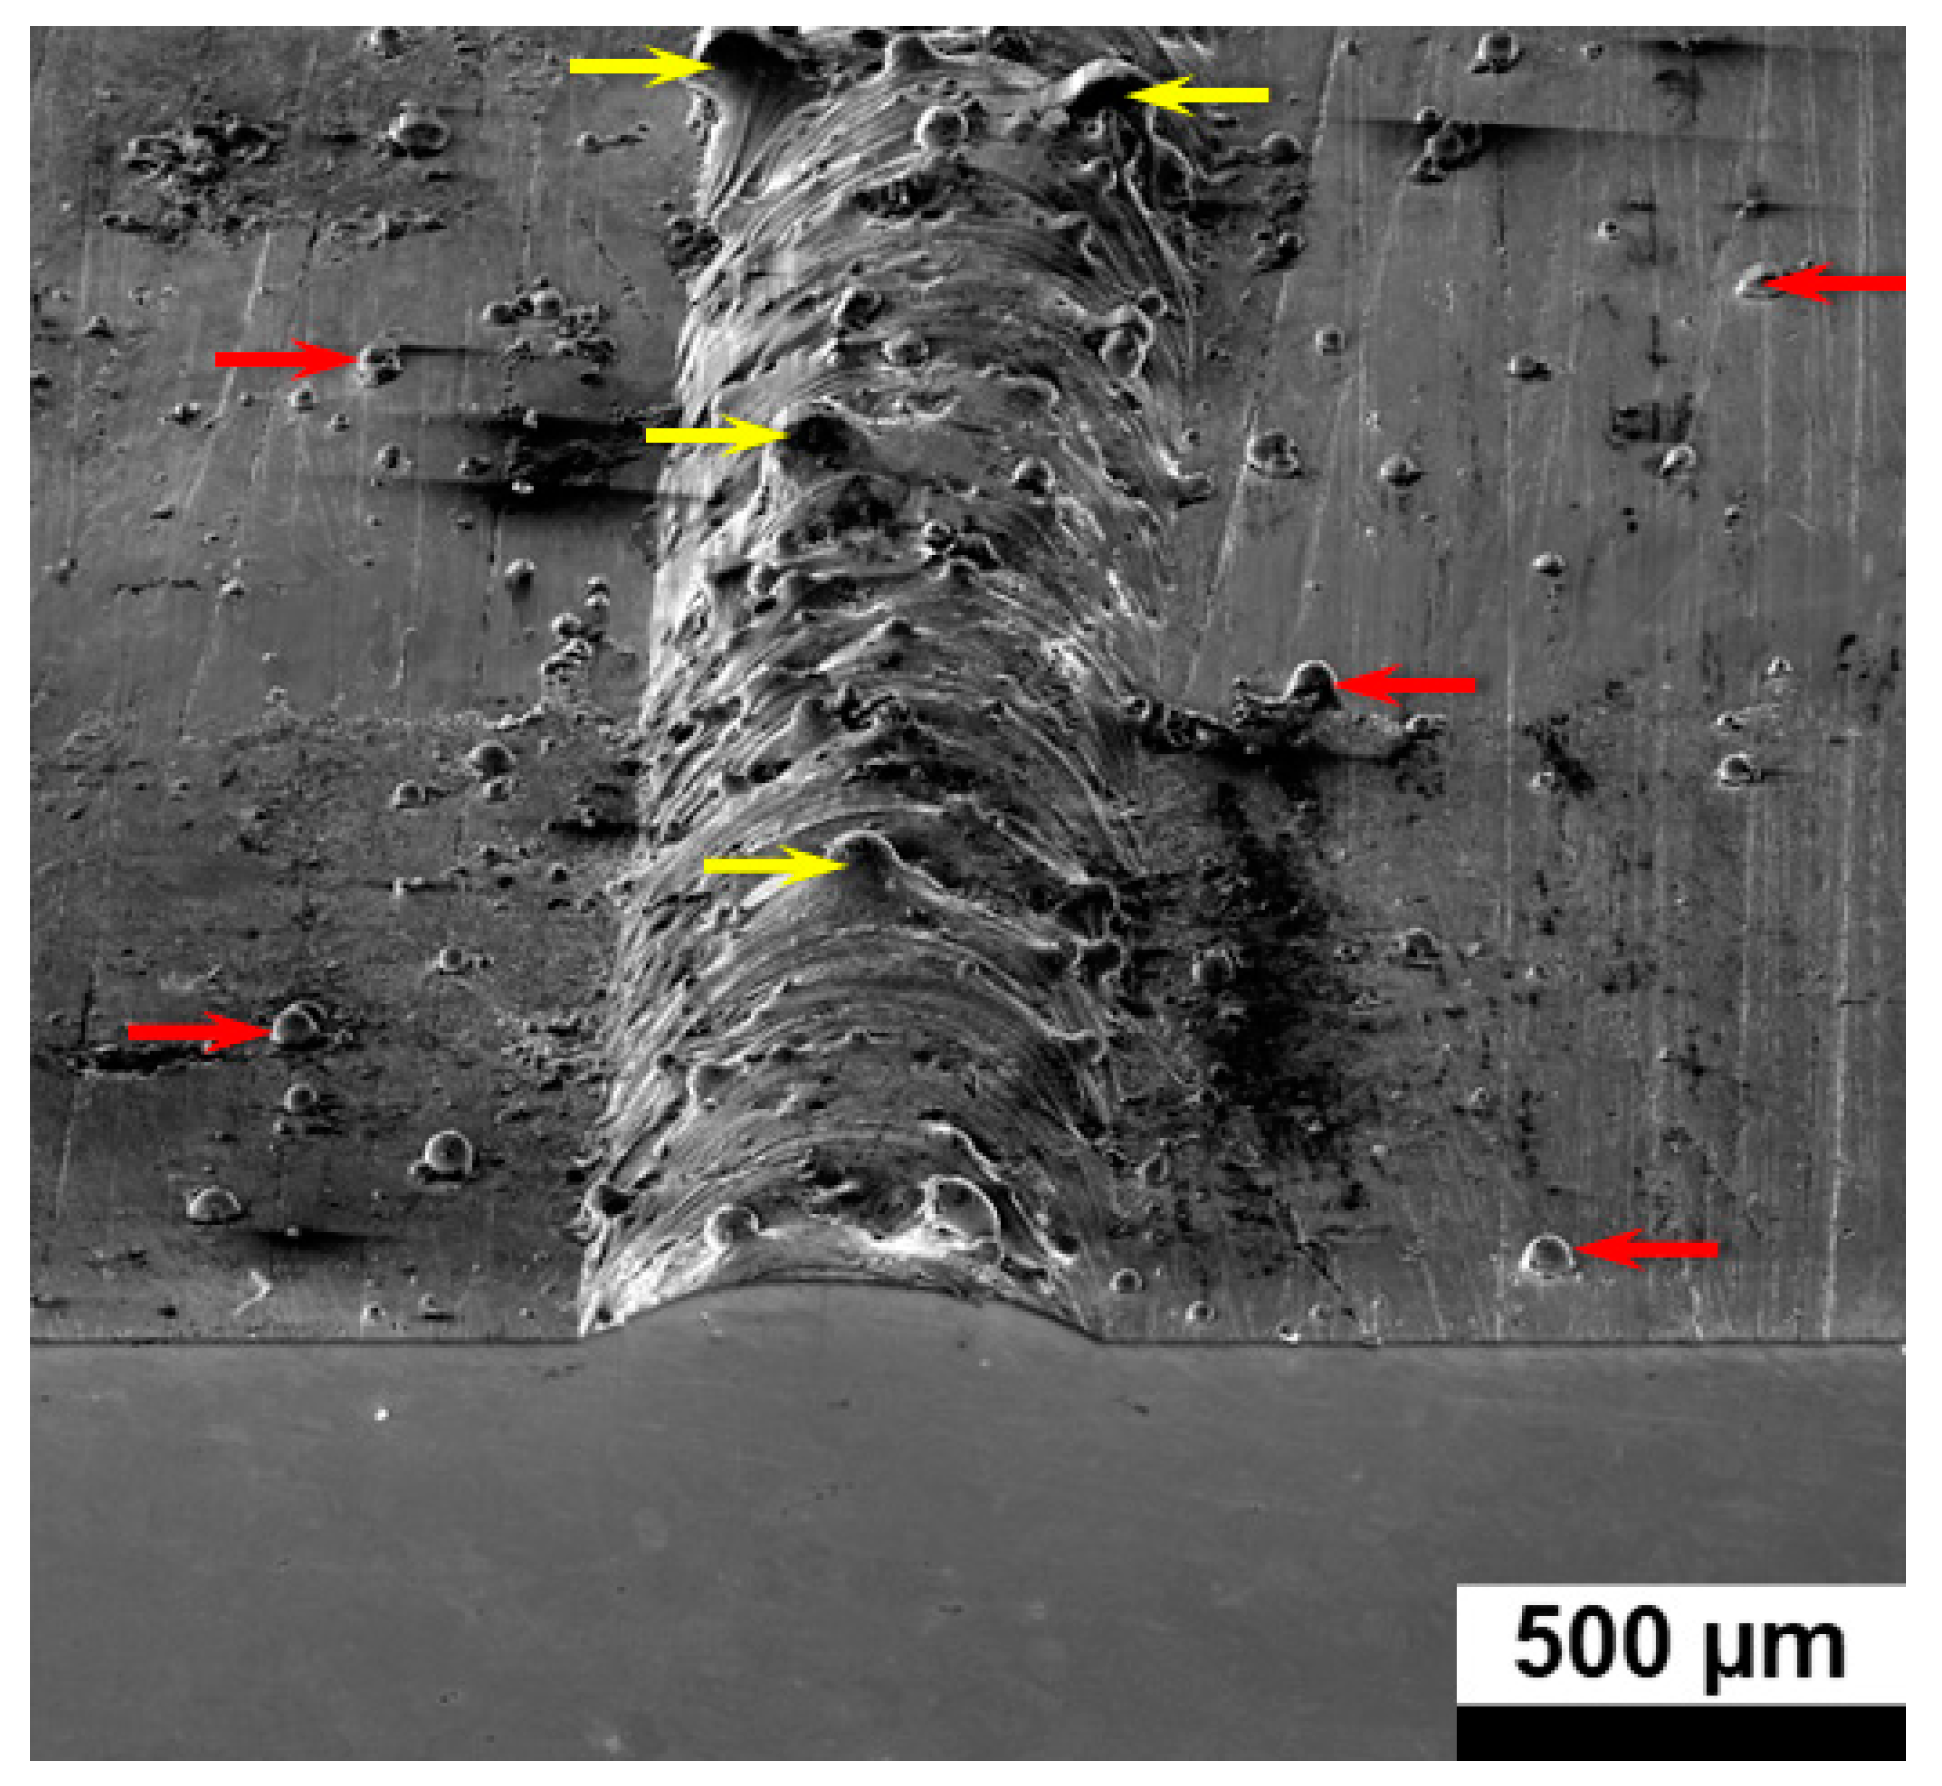
Additionally, the CF-LSM image analysis revealed the presence of partially melted powder particles adhered to the surface of the beads and on the substrate, both for the feed rates of 4.7 g/min and 9.2 g/min. Partially melted powder particles are clearly observed in the SEM image of the bead’s cross-section and its surface (Figure 3). The yellow arrows indicate the partially melted particles on the surface of the bead, while the red arrows indicate the particles on the surface of the substrate.
Table 2 and Table 3 present the surface roughness (Ra) results measured on the top of the deposited bead as a function of scanning speed and laser power, for constant powder feed rates of 4.7 g/min and 9.2 g/min, respectively.
For the powder feed rate of 4.7 g/min (Table 2), the surface roughness (Ra) of the produced beads did not show a clear trend of variation with the increase in laser power or scanning speed. The Ra values remained relatively constant (between 14.1 and 14.8 µm), indicating that at this powder feed rate, the influence of power and scanning speed on surface roughness is not a determinant factor.
Conversely, for the powder feed rate of 9.2 g/min (Table 3), the behavior of surface roughness diverges from that observed with lower rates, showing higher values. A higher powder feed rate results in a higher flow of powder into the melt pool. This leads to a substantial amount of powder particles that do not fully melt during the process. These partially melted particles increase the surface irregularity, raising the average roughness values. However, there is a trend of decreasing roughness with increasing scanning speed. At 1500 mm/min, the Ra values remain above 20 µm, regardless of laser power, whereas at 2000 and 2500 mm/min, the Ra values range between 16.4 and 17.1 µm. This difference can be attributed to the fact that, at 1500 mm/min, even with the increase in laser power, the energy density input per particle is insufficient to promote the complete melting of all of the powder, resulting in a rougher surface due to the presence of unmelted or partially melted particles.
Notably, the combination of a 1500 mm/min scanning speed and a 450 W laser power resulted in a surface roughness of 20.4 ± 5.7 µm for the 9.2 g/min feed rate, representing an increase of approximately 43.6% compared to the 14.2 ± 4.4 µm roughness observed for almost all beads obtained with the 4.7 g/min feed rate. This variation in roughness is directly attributed to the presence of partially melted powder particles during deposition, as depicted in Figure 3.
The observation that partially melted particles are the primary factor influencing surface roughness is consistent with the findings of Piscopo et al. [14]. The authors also attributed the roughness mainly to the presence of these particles, which can adhere to the surface of the beads and the substrate, resulting in a more irregular surface profile.
Although Yazar et al. [1] also observed the influence of the interaction between process parameters on the surface roughness of AISI 316L stainless steel deposited by DED-LB, they highlighted the influence of the interaction between laser power and scanning speed in the formation of different morphologies and microstructures, which can also contribute to the variation in surface roughness. However, the analysis of Piscopo et al. [14] and the results of the present study suggest that the presence of partially melted particles is the predominant factor in determining surface roughness.
Additionally, Gradl et al. [23] investigated the influence of parameters such as laser power, powder feed rate, scanning speed, and layer height on the surface texture of thin walls of NASA HR-1 alloy manufactured by DED-LB. The authors observed that surface roughness is mainly influenced by the size of the raw powder particles. However, as in other studies, they also highlight the importance of the interaction between process parameters on surface quality.
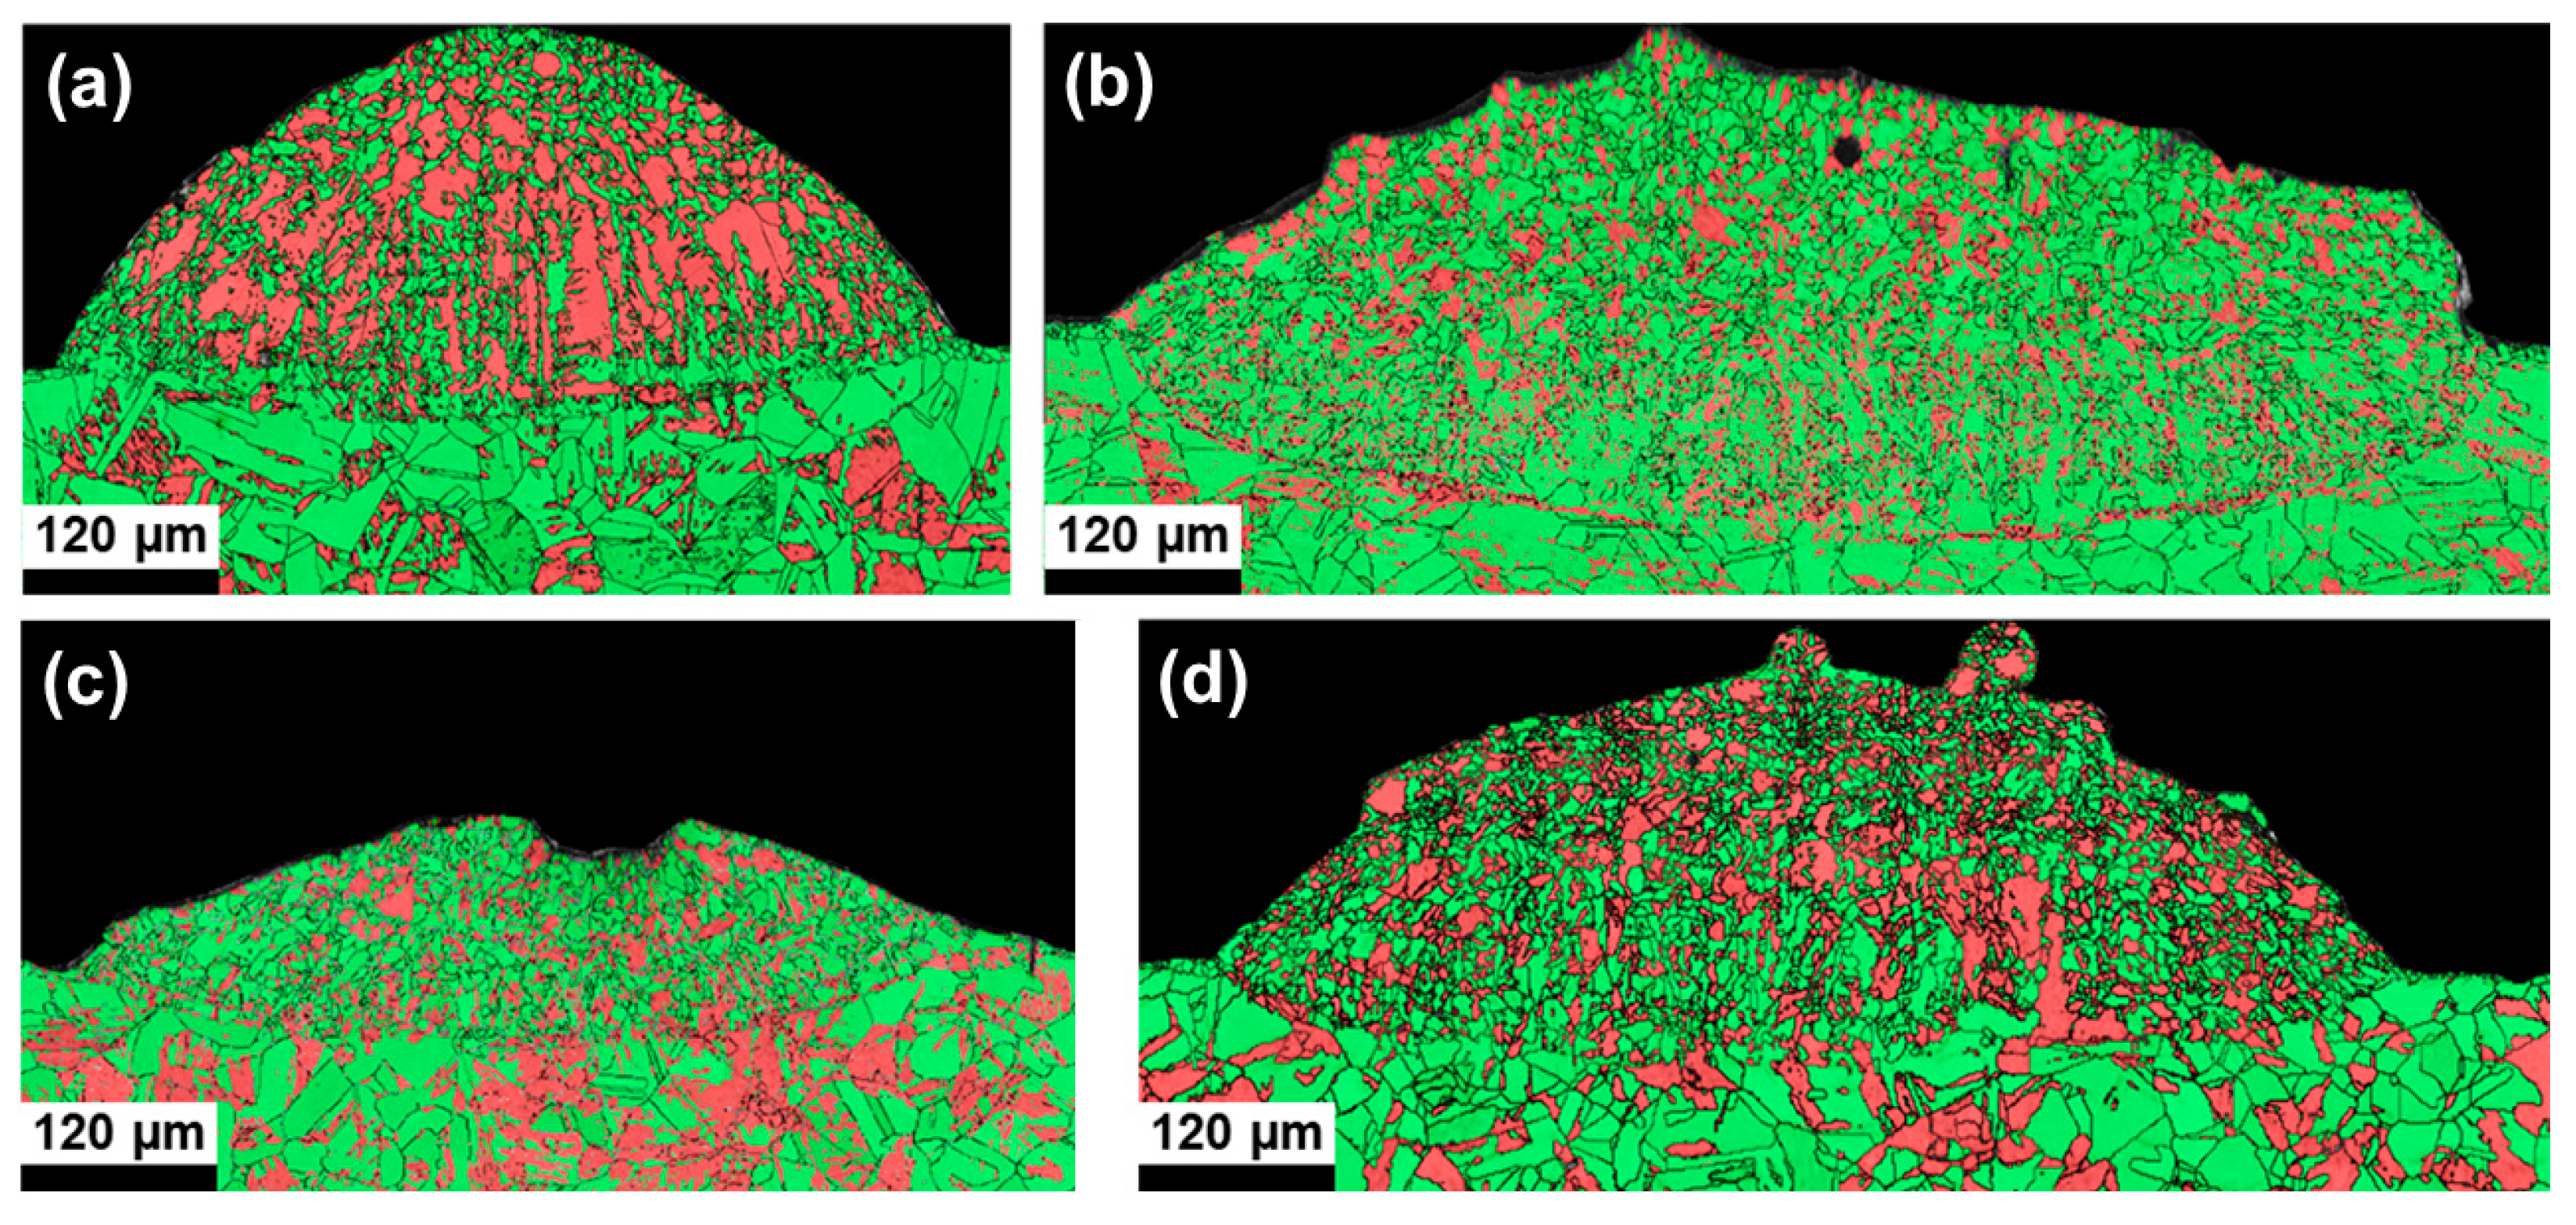
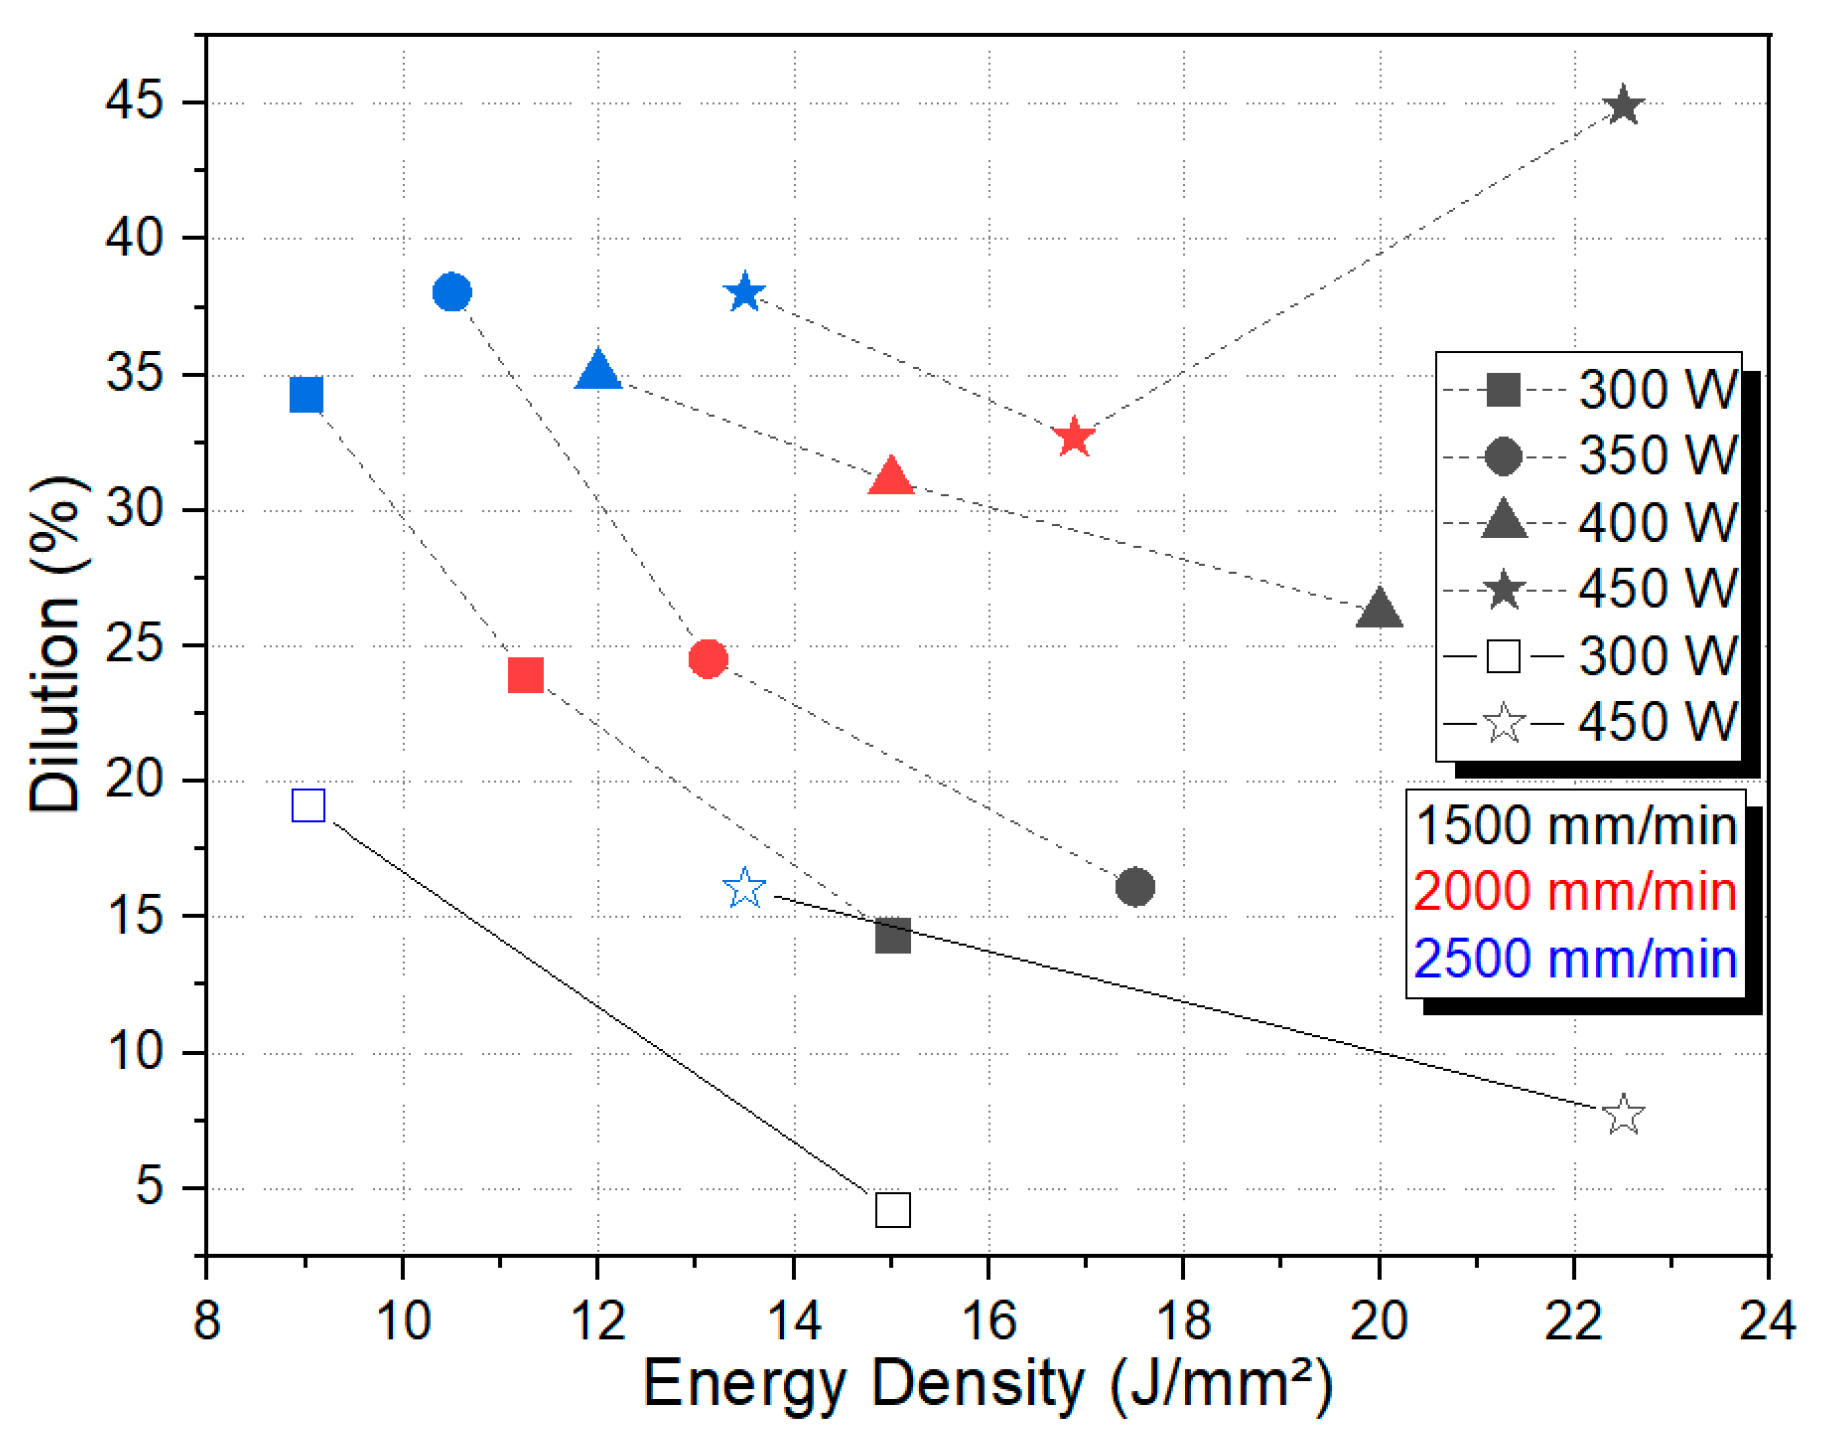
Figure 4 and Figure 5 show the phase maps from the EBSD analysis for samples deposited with 4.7 and 9.2 g/min feed rates, respectively. Both figures show the beads deposited using the following boundary conditions: 1500 mm/min and 300 W (Figure 4a and Figure 5a), 1500 mm/min and 450 W (Figure 4b and Figure 5b), 2500 mm/min and 300 W (Figure 4c and Figure 5c), and 2500 mm/min and 450 W (Figure 4d and Figure 5d). Dilution between the substrate and the DED-LB bead was calculated from the EBSD maps, following the method described in [24], and is shown in Figure 6. For the 9.2 g/min feed rate, all tested conditions resulted in dilution rates lower than the ideal value (30%). Consequently, the other samples produced with this feed rate were excluded from further analysis. Conversely, the initial screening using boundary conditions yielded dilution rates closer to the ideal range for the 4.7 g/min feed rate, justifying further EBSD analysis of all samples in this dataset.
In all maps, the austenitic microstructure of the AISI 304 substrate can be observed, represented by green areas, with the localized presence of strain-induced martensite (SIM) in red, resulting from the prior thermo-mechanical treatment of the steel plate or even from metallographic preparation artifacts [25]. AISI 304 steel is highly prone to the formation of this phase upon plastic deformation, due to its metastable FCC structure and low stacking fault energy (SFE) of approximately 21 mJ/m2, according to Equation (3) [26]. As has been reported by several authors, metastable austenitic steels tend to form SIM when their SFE is in the order of 20 mJ/m2 [27,28,29,30].
SFE (mJ/m2) = 2.2 + 1.9 Ni − 2.9 Si + 0.77 Mo + 0.5 Mn + 40 C − 0.016 Cr − 3.6 N
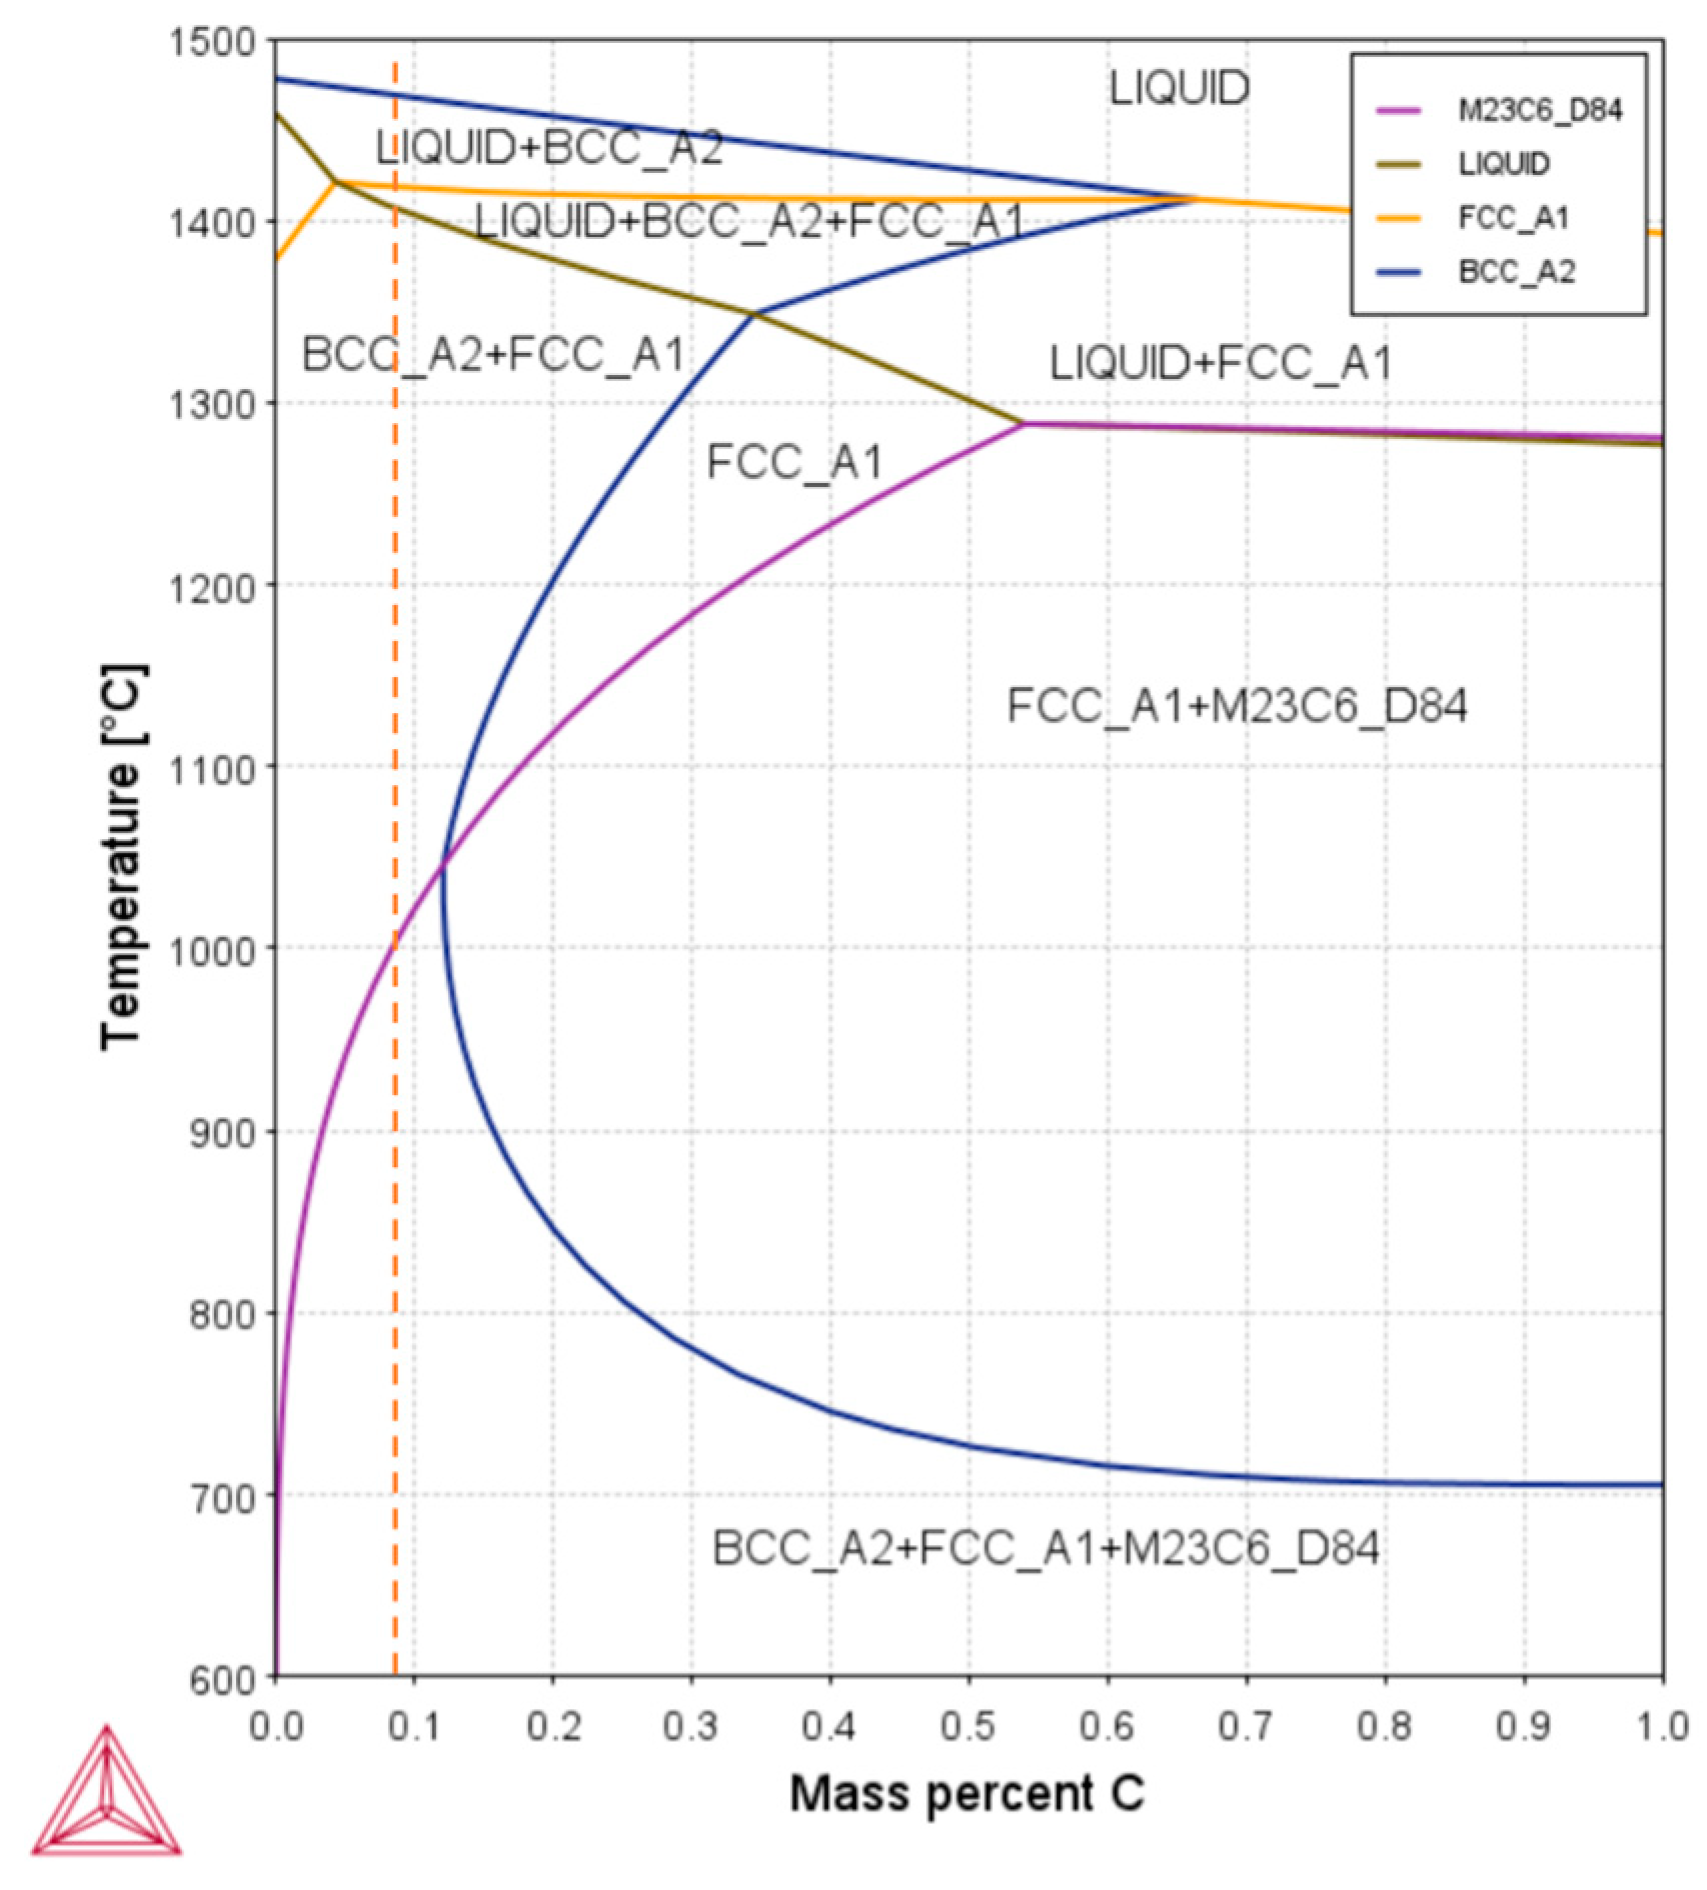
Still, according to Equation (3), 17-7 PH steel, with its nominal chemical composition, has an SFE of 19 mJ/m2 and is also susceptible to the formation of SIM. In fact, an alternative thermomechanical processing route for sheets and bars of this material involves the application of severe cold working followed by aging, eliminating the need for the conditioning heat treatment that is typically required for the formation of athermal martensite [19]. However, due to the dendritic morphology of the red regions in the beads in the phase maps of Figure 4 and Figure 5, it can be inferred that this is not SIM, but delta ferrite originating from the solidification process. Figure 7 shows an isopleth of the equilibrium phase diagram of 17-7 PH steel with varying carbon content. The composition of the alloy used in this study (0.09%wt C) is marked by the red dotted line. It can be seen from the phase diagram that the material tends to begin solidification with a ferritic microstructure, before the formation of austenite. This solidification mode is often described as a ferritic–austenitic process, also called the FA mode [31].
To quantify the expected fraction of austenite and ferrite in the solidification microstructure, the equilibrium phase fraction as a function of temperature and the Scheil–Gulliver solidification diagram were produced for the nominal composition of 17-7 PH steel. The results are shown in Figure 8.
At equilibrium (Figure 8a), 94% BCC delta ferrite is predicted to form from the liquid before austenite formation begins. After the end of solidification, the austenite content increases, consuming delta ferrite, until a maximum of approximately 83% is reached at a temperature of 1020 °C. This indicates that it is extremely difficult to obtain a completely austenitic microstructure (i.e., free of delta ferrite), regardless of the heat treatment applied to the material. Below 1020 °C, M23C6 carbide precipitation occurs, which is responsible for removing C and part of the Cr from the solid solution and facilitating the transformation of austenite into martensite after the so-called “conditioning” heat treatment [19]. Below 500 °C, the formation of two other phases is possible: Ni3Al precipitates with an ordered L12—FCC structure and the chromium-rich BCC phase arising from spinodal decomposition. The precipitation of the Ni3Al intermetallic phase is expected under equilibrium conditions. In contrast, the NiAl phase, characterized by an ordered B2 BCC structure, is more commonly reported in this alloy and is responsible for the additional hardening observed during the aging heat treatments in this material [32,33]. Meanwhile, the chromium-rich BCC structure is often associated with embrittlement, but this only occurs after prolonged heat treatments [34,35].
To take into account the effect of rapid non-equilibrium cooling typical of the DED-LB process, it is convenient to use the Scheil–Gulliver simulation, which assumes infinitely fast diffusion in the liquid and zero diffusion in the solid [36]. According to the result shown in Figure 8b, there is a supercooling of approximately 50 °C at the solidus temperature due to non-equilibrium solidification. Likewise, the formation of austenite begins at 1422 °C, compared to 1409 °C for the equilibrium process. This results in a higher fraction of austenite in the bulk solidification microstructure, of almost 18%. Observing the microstructures in Figure 4 and Figure 5, it is clear that the interior of the grains has a BCC structure (in red), surrounded by an interdendritic FCC region (in green), confirming the results of the thermodynamic calculations.
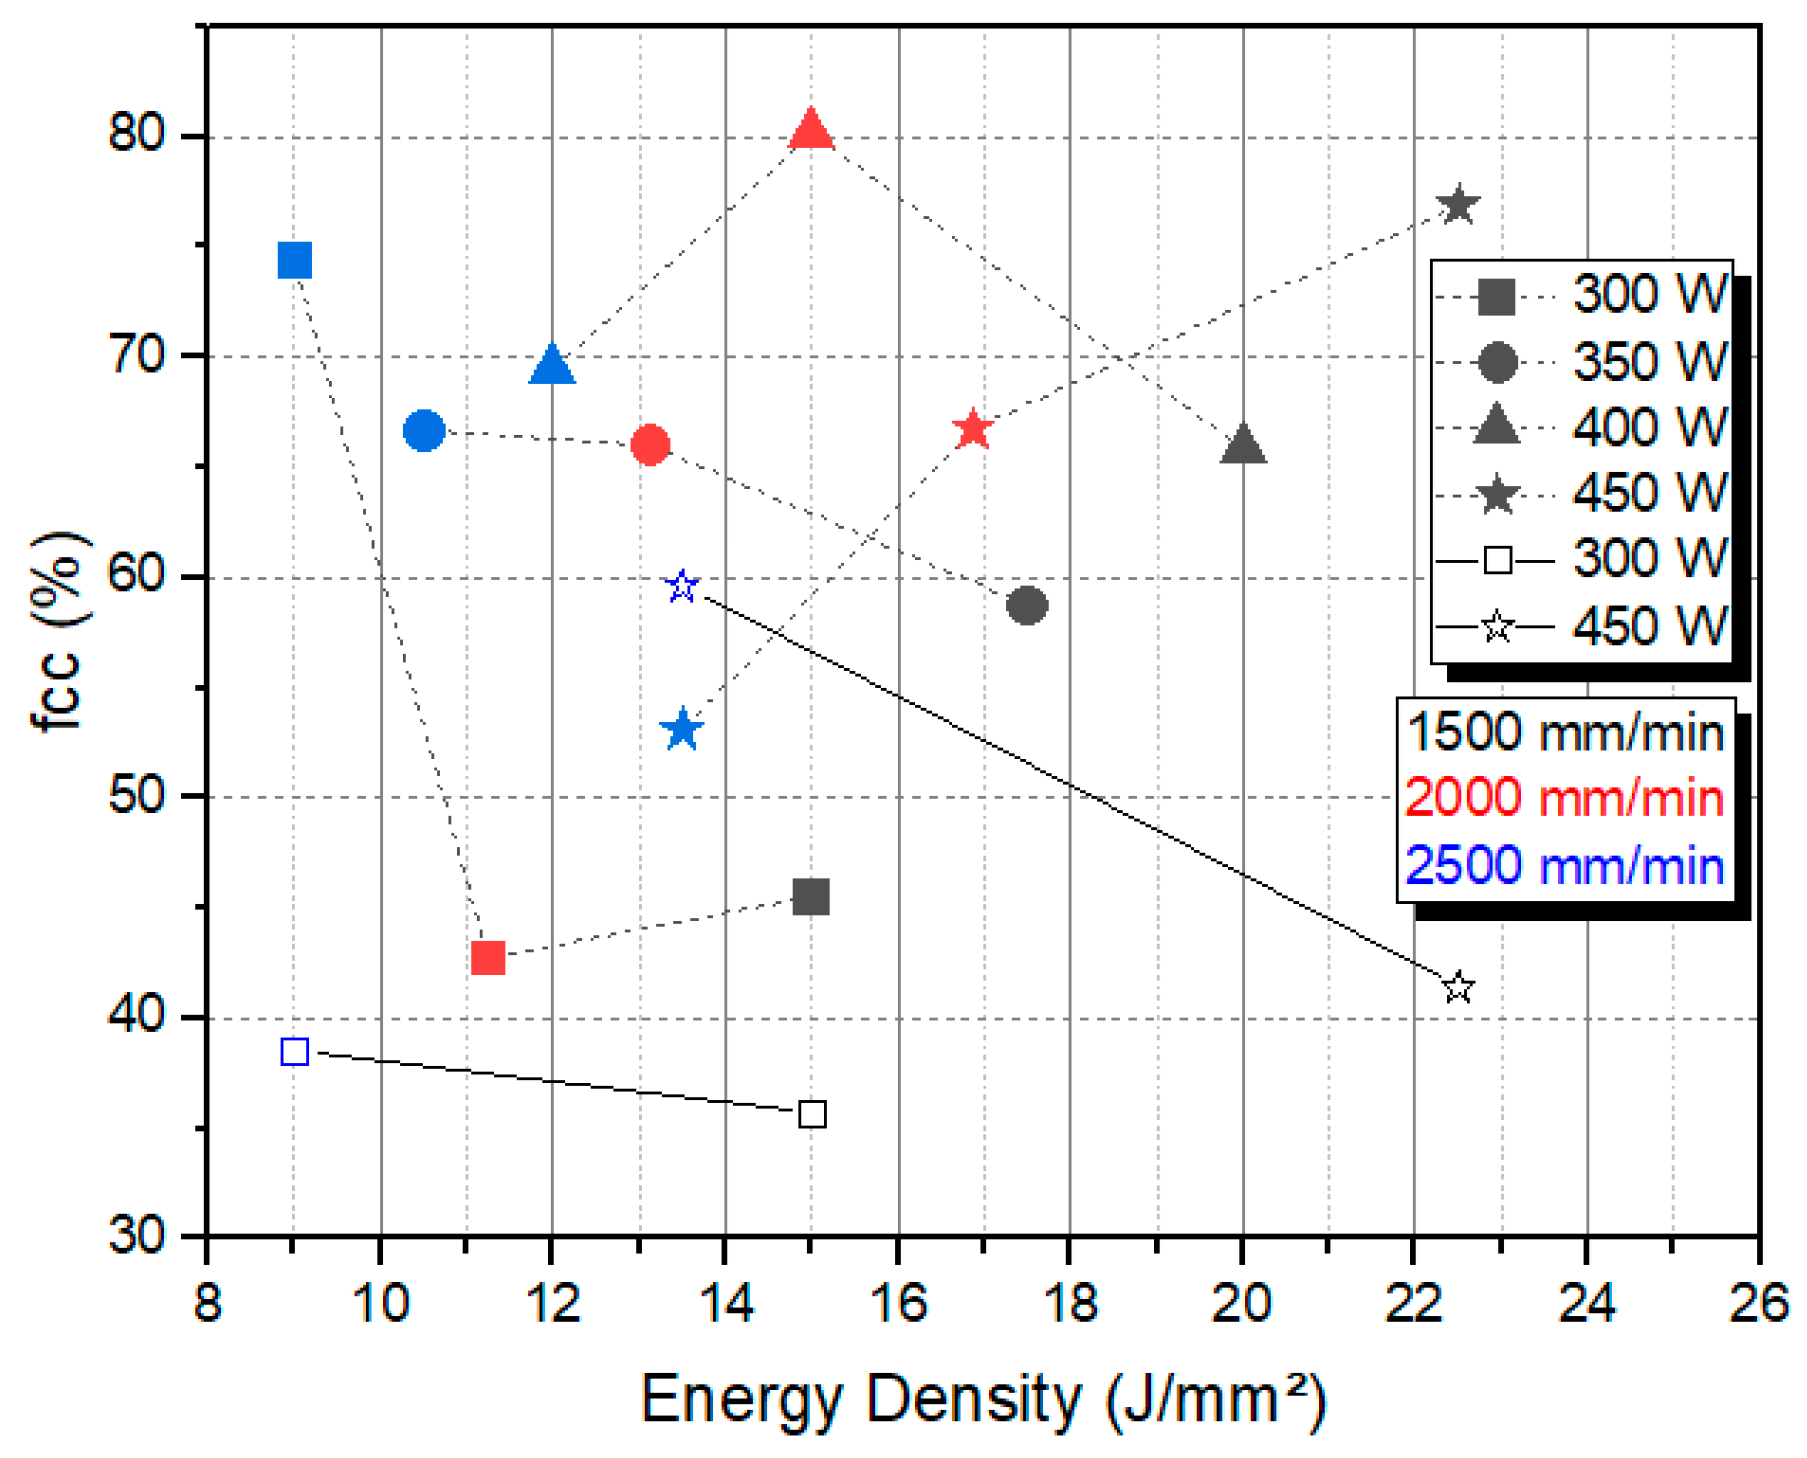
Figure 9 shows the austenitic phase fraction for samples deposited with powder feed rates of 4.7 g/min and 9.2 g/min. The phase fractions were calculated from the EBSD phase maps for the deposited beads. In the graph, closed symbols correspond to the 4.7 g/min feed rate, while open symbols represent the 9.2 g/min feed rate. The fraction of austenite in the beads varied between 36 and 80%, with no clear dependence on the parameters studied. In order to investigate the influence of dilution on possible chemical modifications during the deposition process, EDS analyses were carried out in the powder and in all samples. For the powder, the measured composition was Cr 18.1%, Ni 7.2%, Al 1.4%, Mn 0.6%, Si 0.6%, and Fe bal., which is very close to the alloy’s nominal composition.
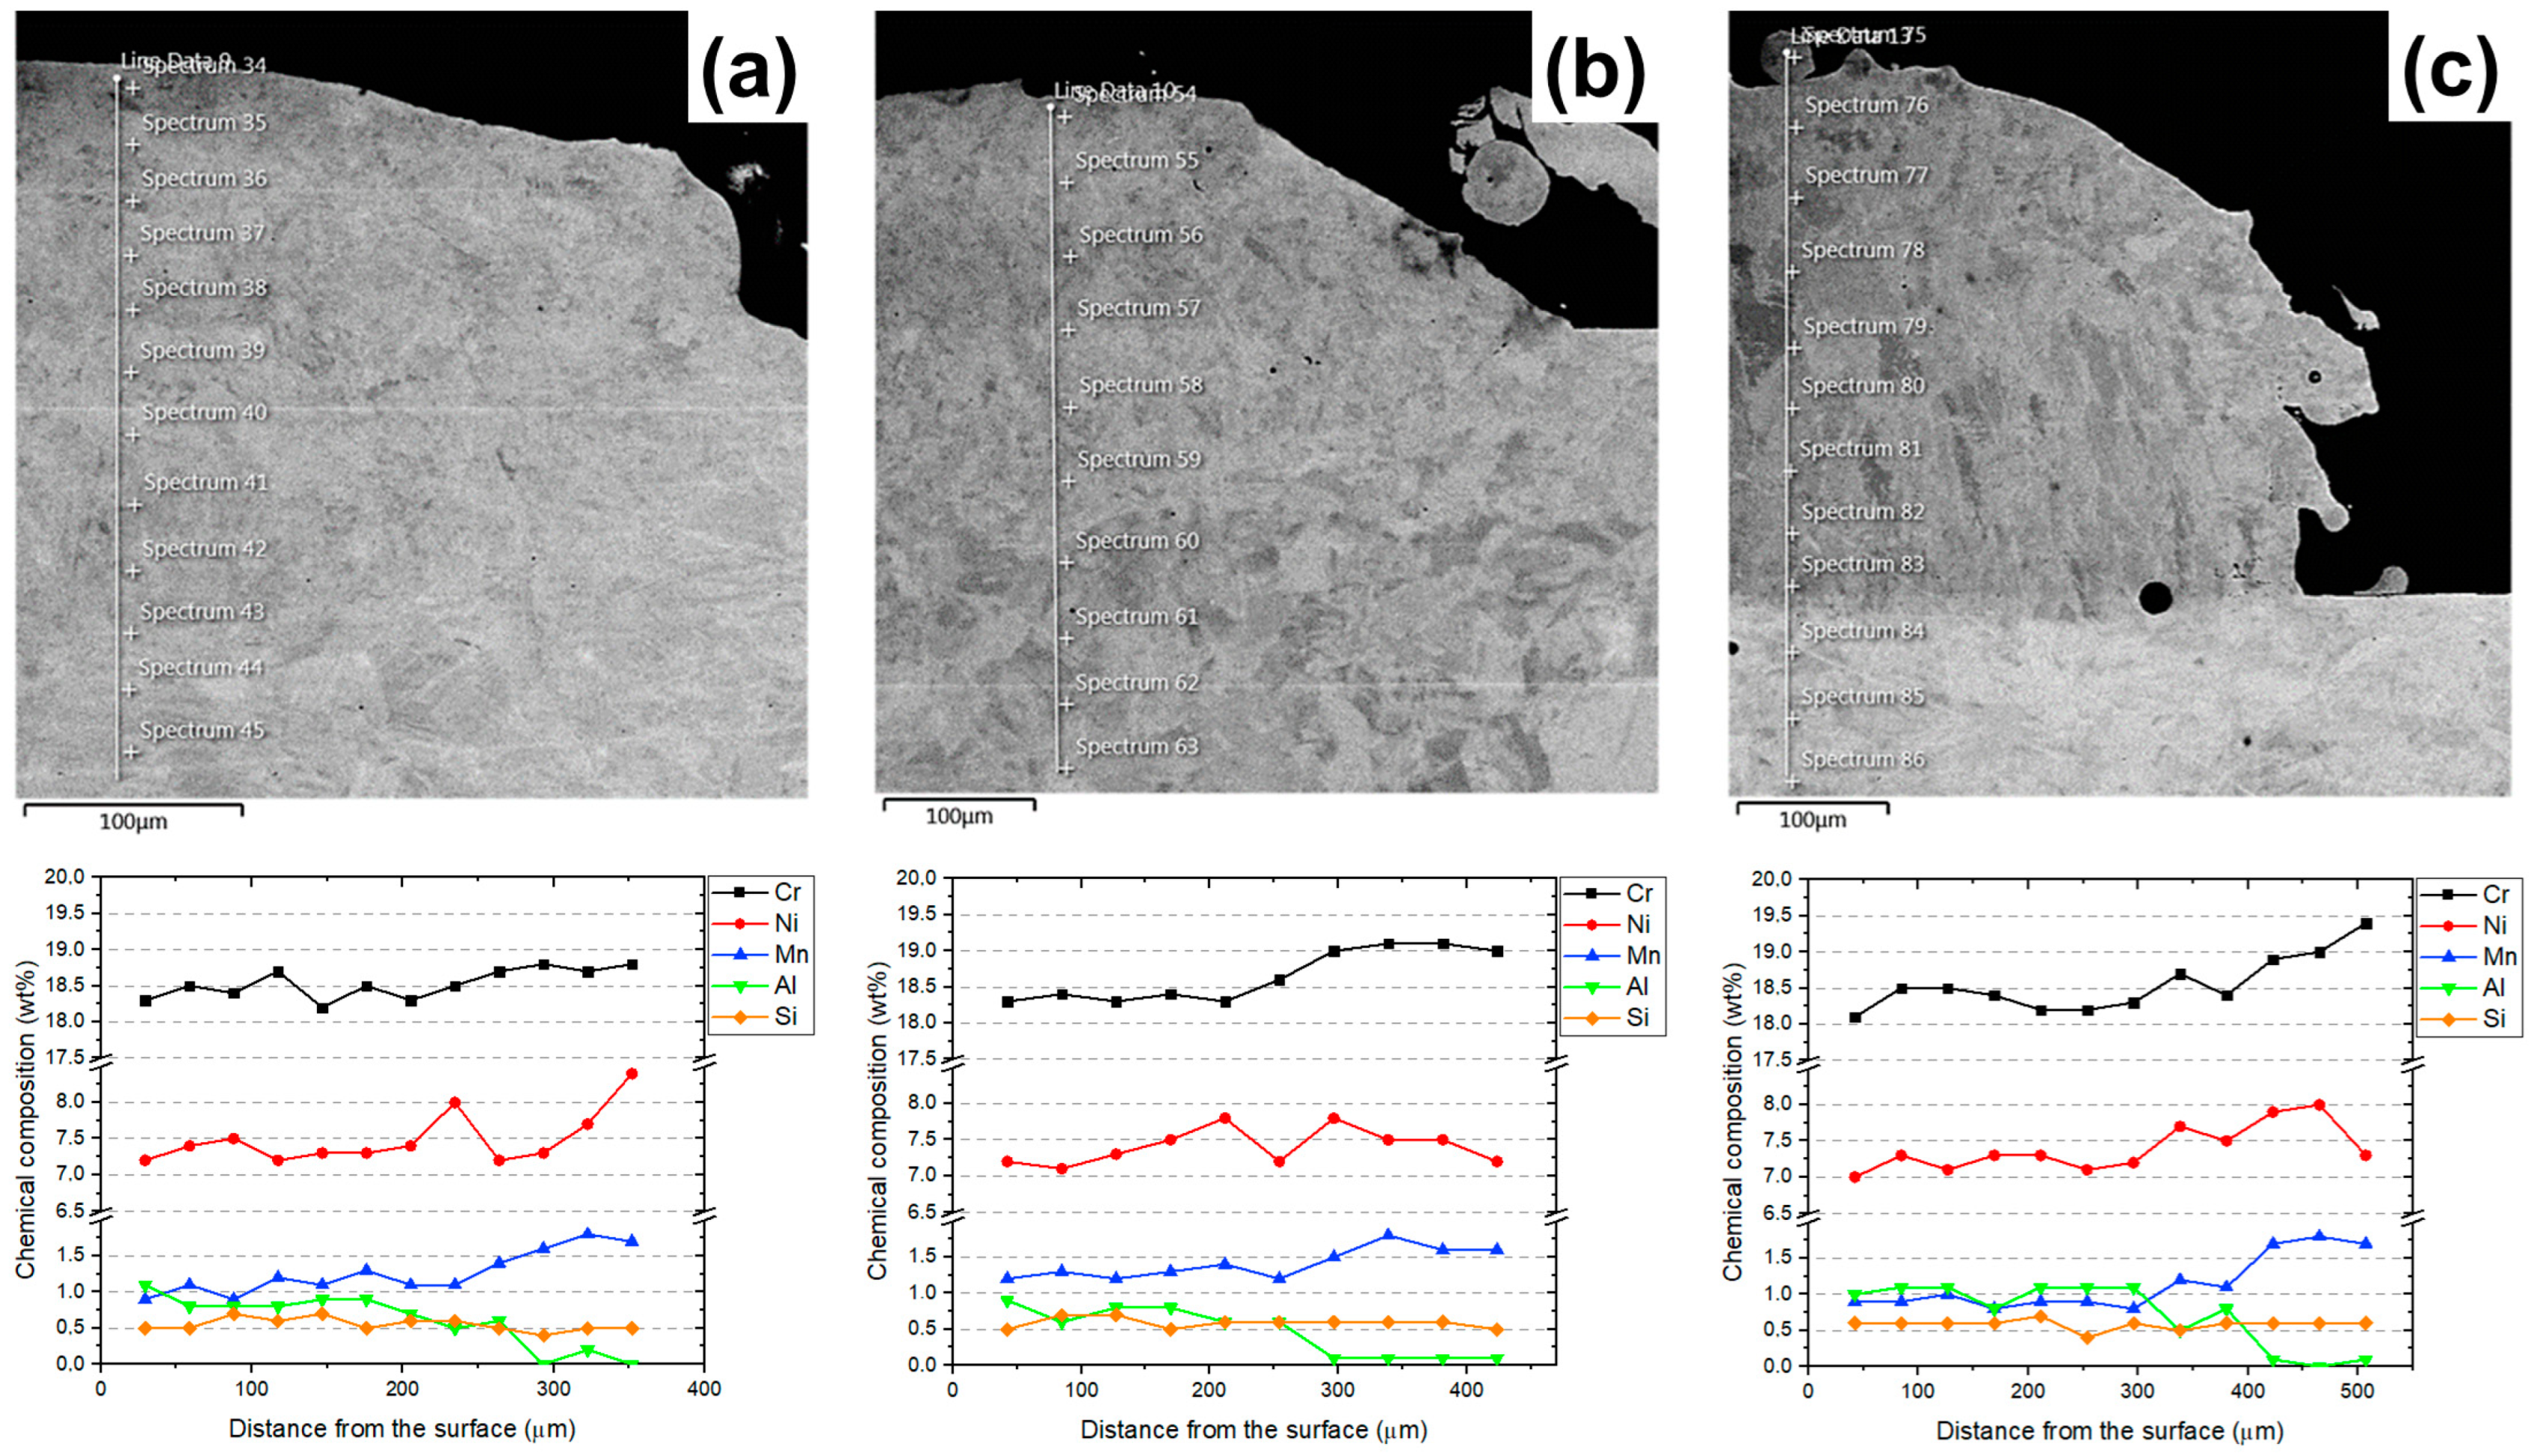
Figure 10 shows the composition profile for the samples with the highest and lowest dilutions, as well as an intermediate one. The interface between the first layer and the substrate is marked by an abrupt variation in Mn and Al contents. It can be seen that the first layer presents good chemical homogeneity and the contents of the major alloying elements (Cr and Ni) are similar regardless of the dilution. This is due to the similarity between the contents of these elements in 17-7 PH and AISI 304 steels. For this reason, the major difference between samples with different dilutions is the Al content, an alloying element present only in 17-7 PH steel.
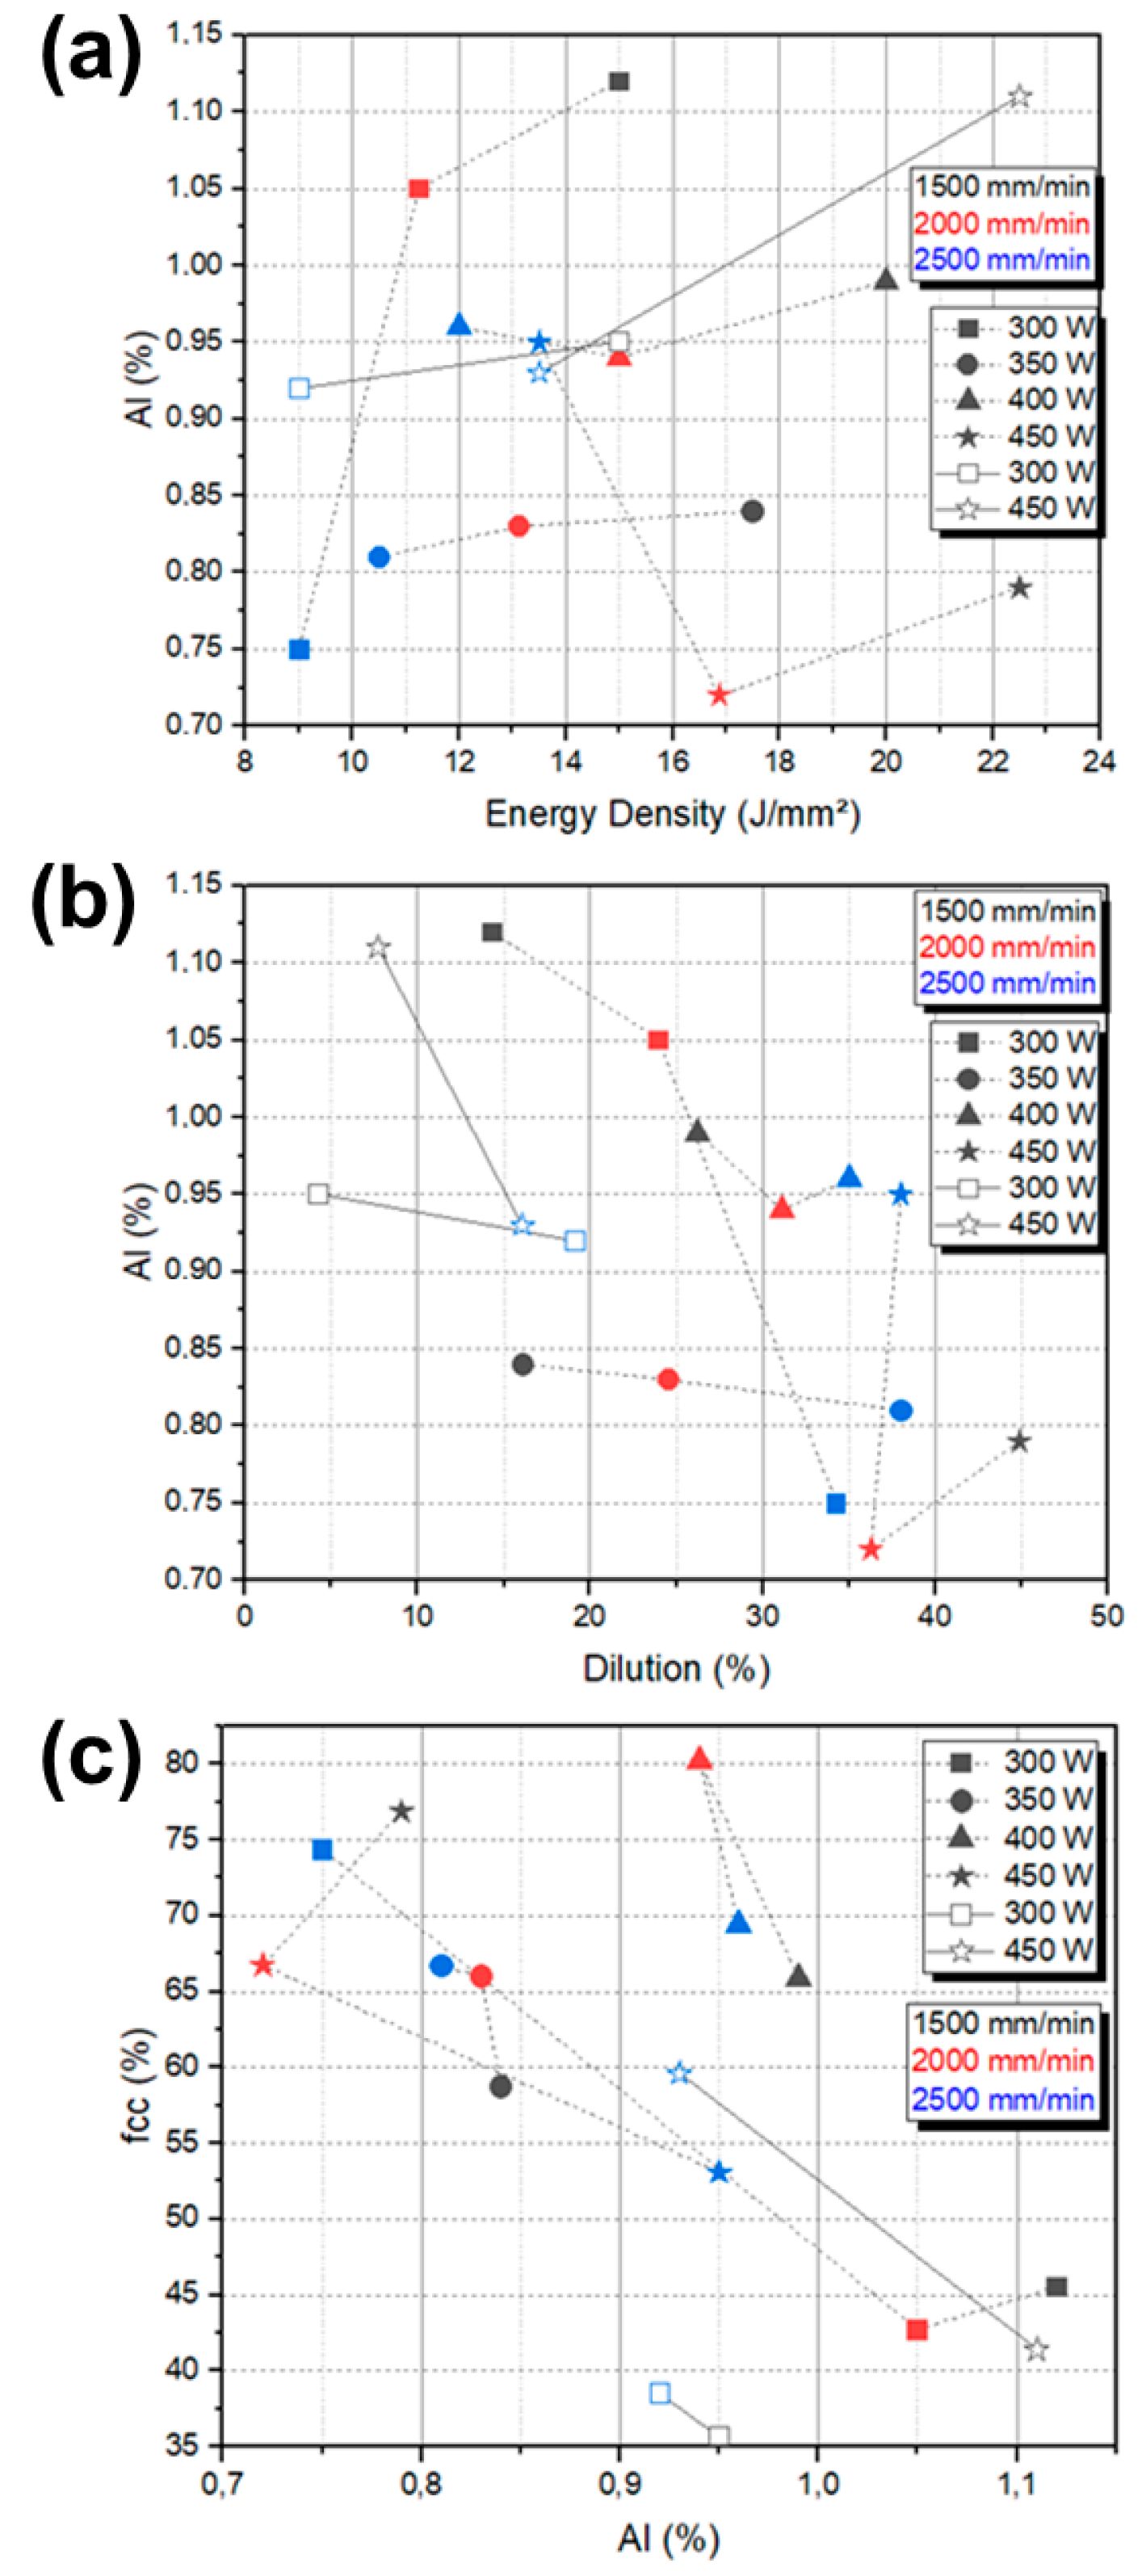
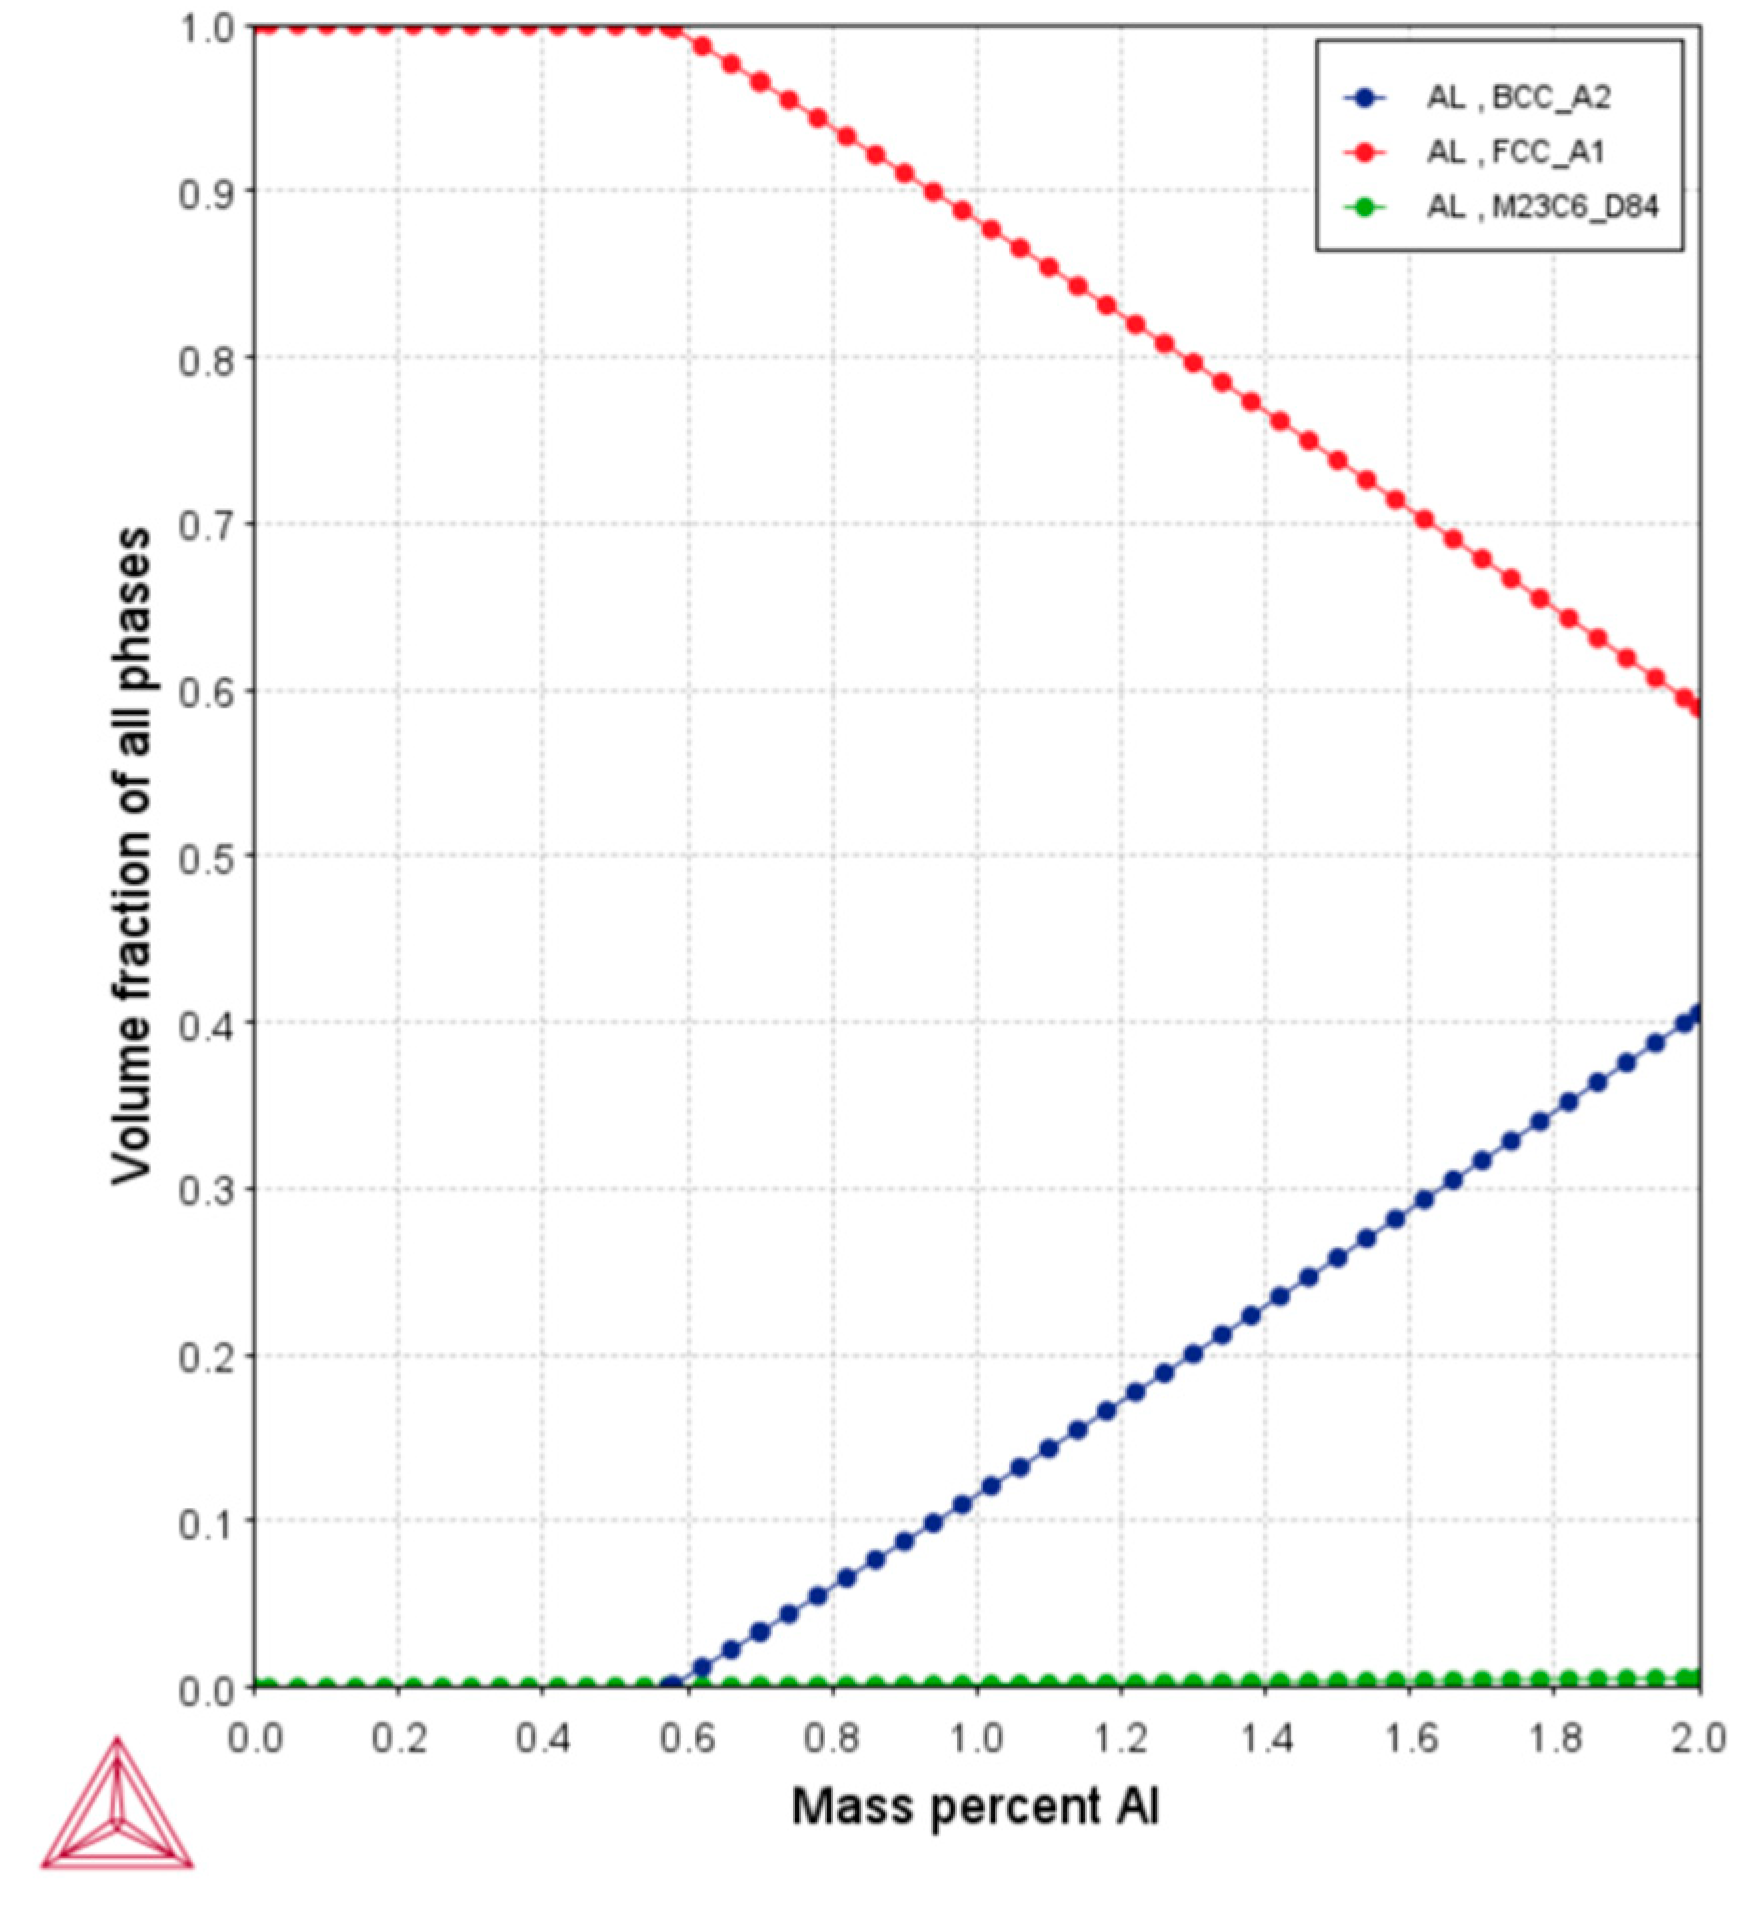
Figure 11 shows the Al content measured in the deposited material as a function of the energy density, the dilution, and the FCC phase fraction. Although there is no clear trend in Al content with energy density, a decreasing trend in Al content is observed with increasing dilution. Likewise, the percentage of the FCC phase decreases for higher contents of that element. Figure 12 shows the calculated volume fraction of the phases at 1020 °C as a function of the Al content. A linear decrease in the FCC fraction is predicted for aluminum contents above 0.6%. This is in agreement with studies on the solidification of steels containing Al, which report that high levels of that element result in a decrease in the austenite fraction [37,38]. Although metastable conditions typically favor higher austenite retention compared to equilibrium conditions, the experimental results show a lower austenite fraction than that predicted by thermodynamic calculations. This discrepancy is attributed to the rapid cooling rates inherent to the DED-LB process, which limit the formation and stabilization of the FCC phase, promoting instead the formation of BCC structures.
The parameters of a 400 W laser power and 2000 mm/min scanning speed were selected as being ideal, as they resulted in a dilution close to 30% and austenite fraction close to 80%, as shown in the EBSD mapping shown in Figure 13. This dilution level is sufficient to promote good metallurgical bonding to the substrate and the austenite fraction approaches the thermodynamic limit found in the thermodynamic calculations (Figure 8a), while maintaining a sufficient Al content to promote precipitation hardening. An austenitic microstructure is preferable for the as-built material as it facilitates post-processing and allows the formation of martensite via heat treatments. However, the ability of the bulk solidification microstructure to form martensite after the conditioning treatment and to form intermetallic precipitates after aging is a relevant point that still needs to be investigated before the use of semi-austenitic coatings, especially considering the loss of Al during the processing of such alloys.

4. Conclusions

After the analysis of the samples obtained by DED-LB using the 17-7PH alloy, the following conclusions may be drawn:
  • The comparative analysis of the topography images and the average roughness (Ra) values obtained for different powder feed rates in the DED-LB process demonstrated an inverse relationship between the feed rate and the surface roughness. The powder feed rate of 4.7 g/min resulted in lower Ra values than those observed with the rate of 9.2 g/min. This finding suggests that a lower powder feed rate, combined with the employed levels of the other parameters, can provide a more controlled and uniform deposition of the material, minimizing the formation of irregularities and surface defects, such as porosities and cracks.
  • The higher powder feed rate, combined with the used levels of laser power and scanning speed, also failed to achieve substrate dilutions above 20%, compromising the integrity of the metallurgical bond between the bead and the substrate. The lower feed rate resulted in dilutions between 15 and 45%, with some parameter combinations reaching values close to 30%.
  • EBSD mappings revealed a ferritic–austenitic solidification mode, which is in good agreement with thermodynamic calculations for equilibrium and non-equilibrium solidification. The FCC austenite fraction varied between 36 and 80%, and did not show a clear trend with the studied process parameters. On the other hand, an inverse correlation of the FCC phase fraction was found in relation to the Al content, which, in turn, is dependent on the substrate dilution.
  • The combination of a 400 W laser power and 2000 mm/min scanning speed was identified as the optimal set of parameters, resulting in a dilution close to 30%, enough to promote strong metallurgical bonding, and an austenite fraction approaching 80%. Further studies would be required to test the feasibility of converting this high-austenite fraction into highly wear-resistant martensite using low-temperature heat treatments.
  • Additionally, the optimization of process parameters, such as the powder feed rate, contributes to more sustainable manufacturing by reducing the consumption of raw materials and energy, minimizing waste generation. Optimization may also enable the DED-LB processing of semi-austenitic precipitation-hardening stainless steels with adjustable microstructures and mechanical properties.

Author Contributions

A.L.B.: investigation and formal analysis; F.E.M. formal analysis and writing—original draft; F.M.P.: investigation; O.M.C.: resources and writing—review and editing; R.T.C.: resources and writing—review and editing; P.G.: resources and writing—review and editing; K.Z.: project administration, supervision, formal analysis and writing—review and editing. All authors have read and agreed to the published version of the manuscript.

Funding

The APC was partially funded by the São Paulo Research Foundation (FAPESP) under Grant Number 2020/06984-6.

Data Availability Statement

The data presented in this study are freely available on request from the corresponding author.

Acknowledgments

The authors acknowledge the financial support of the São Paulo Research Foundation (FAPESP), Grant Numbers: 2016/11309-0, 2019/06679-1, 2019/26362-2, and 2020/06984-6.

Conflicts of Interest

All authors declare that there are no competing interests.

References

  1. Yazar, K.U.; Pawar, S.; Park, K.-S.; Choi, S.-H. Effect of process parameters on the clad morphology, microstructure, microtexture, and hardness of single layer 316 L stainless steel during direct energy deposition. Mater. Charact. 2022, 191, 112148. [Google Scholar] [CrossRef]
  2. Ma, Z.; Liu, W.; Li, W.; Liu, H.; Lv, Z.; Song, J.; Huang, Y.; Liu, B.; Liu, Y.; Zhang, Y. Optimization of density and surface morphology of SS 316L/IN718 functionally graded thin-walled structures using hybrid prediction-multi-objective optimization method. J. Manuf. Process. 2024, 120, 337–352. [Google Scholar] [CrossRef]
  3. Barragan, G.A.; Ferreira, R.; Mariani, F.E.; da Silva, E.J.; Coelho, R.T. Study of the surface roughness of a remanufactured bimetallic AISI 1045 and 316L SS part obtained by hybrid manufacturing (DED-HSM). Int. J. Adv. Manuf. Technol. 2022, 117, 1–13. [Google Scholar]
  4. Chen, Z.; Yang, C. Effect of molten-pool inertia in variable-width arc-based direct energy deposition by regulating parameters. J. Manuf. Process. 2024, 124, 720–732. [Google Scholar] [CrossRef]
  5. Soyama, H.; Okura, Y. The use of various peening methods to improve the fatigue strength of titanium alloy Ti6Al4V manufactured by electron beam melting. AIMS Mater. Sci. 2018, 5, 1000–1015. [Google Scholar] [CrossRef]
  6. Reddy, Y.P.; Narayana, K.L.; Mallik, M.K.; Paul, C.P.; Singh, C.P. Experimental evaluation of additively deposited functionally graded material samples—Microscopic and spectroscopic analysis of SS-316L/Co-Cr-Mo alloy. AIMS Mater. Sci. 2022, 9, 653–667. [Google Scholar] [CrossRef]
  7. Kechagias, J.D. Materials for Additive Manufacturing. AIMS Mater. Sci. 2022, 9, 785–790. [Google Scholar] [CrossRef]
  8. Bax, B.; Rajput, R.; Kellet, R.; Reisacher, M. Systematic evaluation of process parameter maps for laser cladding and directed energy deposition. Addit. Manuf. 2018, 21, 487–494. [Google Scholar] [CrossRef]
  9. Sreekanth, S.; Ghassemali, E.; Hurtig, K.; Joshi, S.; Andersson, J. Effect of Direct Energy Deposition Process Parameters on Single-Track Deposits of Alloy 718. Metals 2020, 10, 96. [Google Scholar] [CrossRef]
  10. Ballésio, S.; Hong, T.L.; Dhondt, M.; Doudard, C.; Szmytka, F. Manufacturing of 2507 super duplex stainless steel by laser powder-directed energy deposition: Process optimization and microstructure analyses. Int. J. Adv. Manuf. Technol. 2024, 132, 5663–5682. [Google Scholar] [CrossRef]
  11. Saboori, A.; Aversa, G.; Marchese, M.; Biamino, S.; Lombardi, M.; Fino, P. Microstructure and mechanical properties of AISI 316L produced by directed energy deposition-based additive manufacturing: A review. Appl. Sci. 2020, 10, 3310. [Google Scholar] [CrossRef]
  12. Barragan, G.; Perilla, D.A.R.; Nuñez, J.G.; Mariani, F.; Coelho, R. Characterization and Optimization of Process Parameters for Directed Energy Deposition Powder-Fed Laser System. J. Mater. Eng. Perform. 2021, 30, 5297–5306. [Google Scholar] [CrossRef]
  13. Nuñez III, L.; Downey, C.M.; van Rooyen, I.J.; Charit, I.; Maughan, M.R. Analysis of surface roughness in metal directed energy deposition. Int. J. Adv. Manuf. Technol. 2024, in press. [Google Scholar]
  14. Piscopo, G.; Salmi, A.; Atzeni, E. Influence of High-Productivity Process Parameters on the Surface Quality and Residual Stress State of AISI 316L Components Produced by Directed Energy Deposition. J. Mater. Eng. Perform. 2021, 30, 6691–6702. [Google Scholar] [CrossRef]
  15. Bajaj, P.; Hariharan, A.; Kini, A.; Kürnsteiner, P.; Raabe, D.; Jägle, E.A. Steels in additive manufacturing: A review of their microstructure and properties. J. Mater. Eng. A 2020, 772, 138633. [Google Scholar] [CrossRef]
  16. Craig, R.G.; Slesnick, H.J.; Peyton, F.A. Application of 17-7 Precipitation-hardenable Stainless Steel in Dentistry. J. Dent. Res. 1965, 44, 587–595. [Google Scholar] [CrossRef] [PubMed]
  17. Favor, R.J.; Deel, O.L.; Achbach, W.P. Design Information on 17-7 PH Stainless Steel for Aircraft and Missiles; Defense Metals Information Center, Battelle Memorial Institute: Columbus, OH, USA, 1960; Volume 137. [Google Scholar]
  18. Estupiñán López, F.H.; Gaona Tiburcio, C.; Zambrano-Robledo, P.; Cabral, J.A.; Almeraya Calderon, F. Electrochemical Study of 17-4 and 17-7 PH Stainless Steels Used in the Aeronautical Industry. In Proceedings of the Symposium of Aeronautical and Aerospace Processes, Materials and Industrial Applications: Presented at the XXV International Materials Research Congress–Cancun 2016 25; Springer International Publishing: Berlin/Heidelberg, Germany, 2017; pp. 63–71. [Google Scholar]
  19. Campbell, F.C. Manufacturing Technology for Aerospace Structural Materials, 1st ed.; Elsevier Science: New York, NY, USA, 2006. [Google Scholar]
  20. ASTM B213; Standard Test Methods for Flow Rate of Metal Powders Using the Hall Flowmeter Funnel. ASTM International: West Conshohocken, PA, USA, 2020.
  21. Mariani, F.E.; Ribeiro, K.S.B.; Lombardi, A.N.; Casteletti, L.C.; Coelho, R.T. Effect of Laser Polishing Post-Processing Technique on the Roughness and Wear Resistance of Inconel 625 Deposited by Laser Cladding on AISI 304L Stainless Steel. J. Mater. Eng. Perform. 2021, 30, 6713–6721. [Google Scholar] [CrossRef]
  22. Souza, A.M.; Ferreira, R.; Barragan, G.; Nuñez, J.G.; Mariani, F.E.; da Silva, E.J.; Coelho, R.T. Effects of Laser Polishing on Surface Characteristics and Wettability of Directed Energy-Deposited 316L Stainless Steel. J. Mater. Eng. Perform. 2021, 30, 6752–6765. [Google Scholar] [CrossRef]
  23. Gradl, P.R.; Cervone, A.; Gill, E. Surface texture characterization for thin-wall NASA HR-1 Fe–Ni–Cr alloy using laser powder directed energy deposition (DED-LB). Adv. Ind. Manuf. Eng. 2022, 4, 100084. [Google Scholar]
  24. Bhardwaj, T.; Shukla, M.; Paul, C.P.; Bindra, K.S. Direct Energy Deposition-Laser Additive Manufacturing of Titanium-Molybdenum Alloy: Parametric Studies, Microstructure and Mechanical Properties. J. Alloy. Compd. 2019, 787, 1238–1248. [Google Scholar] [CrossRef]
  25. Özakin, B. Experimental investigation of the effect of skin-pass rolling reduction ratio on corrosion behaviors of AISI 304 stainless steel sheet materials. Surf. Topogr. Metrol. Prop. 2023, 11, 025004. [Google Scholar] [CrossRef]
  26. Meric de Bellefon, G.; van Duysen, J.C.; Sridharan, K. Composition-dependence of stacking fault energy in austenitic stainless steels through linear regression with random intercepts. J. Nucl. Mater. 2017, 492, 227–230. [Google Scholar] [CrossRef]
  27. Souza Filho, I.R.; Zilnyk, K.D.; Sandim, M.J.R.; Bolmaro, R.; Sandim, H. Strain partitioning and texture evolution during cold rolling of AISI 201 austenitic stainless steel. Mater. Sci. Eng. A 2017, 702, 161–172. [Google Scholar] [CrossRef]
  28. Alsultan, S.; Quitzke, C.; Cheng, Z.; Krüger, L.; Volkova, O.; Wendler, M. Strain-Induced Martensite Formation and Mechanical Properties of Fe–19Cr–4Ni–3Mn–0.15N–0.15C Austenitic Stainless Steel at Cryogenic Temperature. Steel Res. Int. 2021, 92, 2000611. [Google Scholar] [CrossRef]
  29. Talonen, J.; Hänninen, H. Formation of shear bands and strain-induced martensite during plastic deformation of metastable austenitic stainless steels. Acta Mater. 2007, 55, 6108–6118. [Google Scholar] [CrossRef]
  30. Lee, T.H.; Shin, E.; Oh, C.S.; Ha, H.Y.; Kim, S.J. Correlation between stacking fault energy and deformation microstructure in high-interstitial-alloyed austenitic steels. Acta Mater. 2010, 58, 3173–3186. [Google Scholar] [CrossRef]
  31. Lee, C.Y.; Lee, Y.K. The Solidification Mode of Fe–Mn–Al–C Lightweight Steel. JOM 2014, 66, 1794–1799. [Google Scholar] [CrossRef]
  32. Yukawa, N.; Mizutani, M.; Saka, H. Effect of Aluminum upon Phase Changes and Age-Hardening Behaviors in 17-7 PH Stainless Steel. Trans. Iron Steel Inst. Jpn. 1969, 9, 245–253. [Google Scholar] [CrossRef]
  33. Wang, D.; Kahn, H.; Ernst, F.; Heuer, A.H. NiAl precipitation in delta ferrite grains of 17-7 precipitation-hardening stainless steel during low-temperature interstitial hardening. Scr. Mater. 2015, 108, 136–140. [Google Scholar] [CrossRef]
  34. Wang, J.; Zou, H.; Li, C.; Qiu, S.; Shen, B. The spinodal decomposition in 17-4PH stainless steel subjected to long-term aging at 350 °C. Mater. Charact. 2008, 59, 587–591. [Google Scholar] [CrossRef]
  35. Lach, T.G.; Frazier, W.E.; Wang, J.; Devaraj, A.; Byun, T.S. Precipitation-site competition in duplex stainless steels: Cu clusters vs spinodal decomposition interfaces as nucleation sites during thermal aging. Acta Mater. 2020, 196, 456–469. [Google Scholar] [CrossRef]
  36. Schaffnit, P.; Stallybrass, C.; Konrad, J.; Stein, F.; Weinberg, M. A Scheil–Gulliver model dedicated to the solidification of steel. Calphad 2015, 48, 184–188. [Google Scholar] [CrossRef]
  37. Zhang, X.; Fan, L.; Xu, Y.; Li, J.; Xiao, X.; Jiang, L. Effect of aluminum on microstructure, mechanical properties and pitting corrosion resistance of ultra-pure 429 ferritic stainless steels. Mater. Des. 2015, 65, 682–689. [Google Scholar] [CrossRef]
  38. Yu, Z.; Fu, H.; Jiang, Y.; Cen, Q.; Lei, Y.; Zhou, R.; Guo, H. Effect of aluminum content on solidification microstructure and properties of Fe–Cr–B–Al alloys. Mater. Werkst. 2012, 43, 1080–1085. [Google Scholar] [CrossRef]
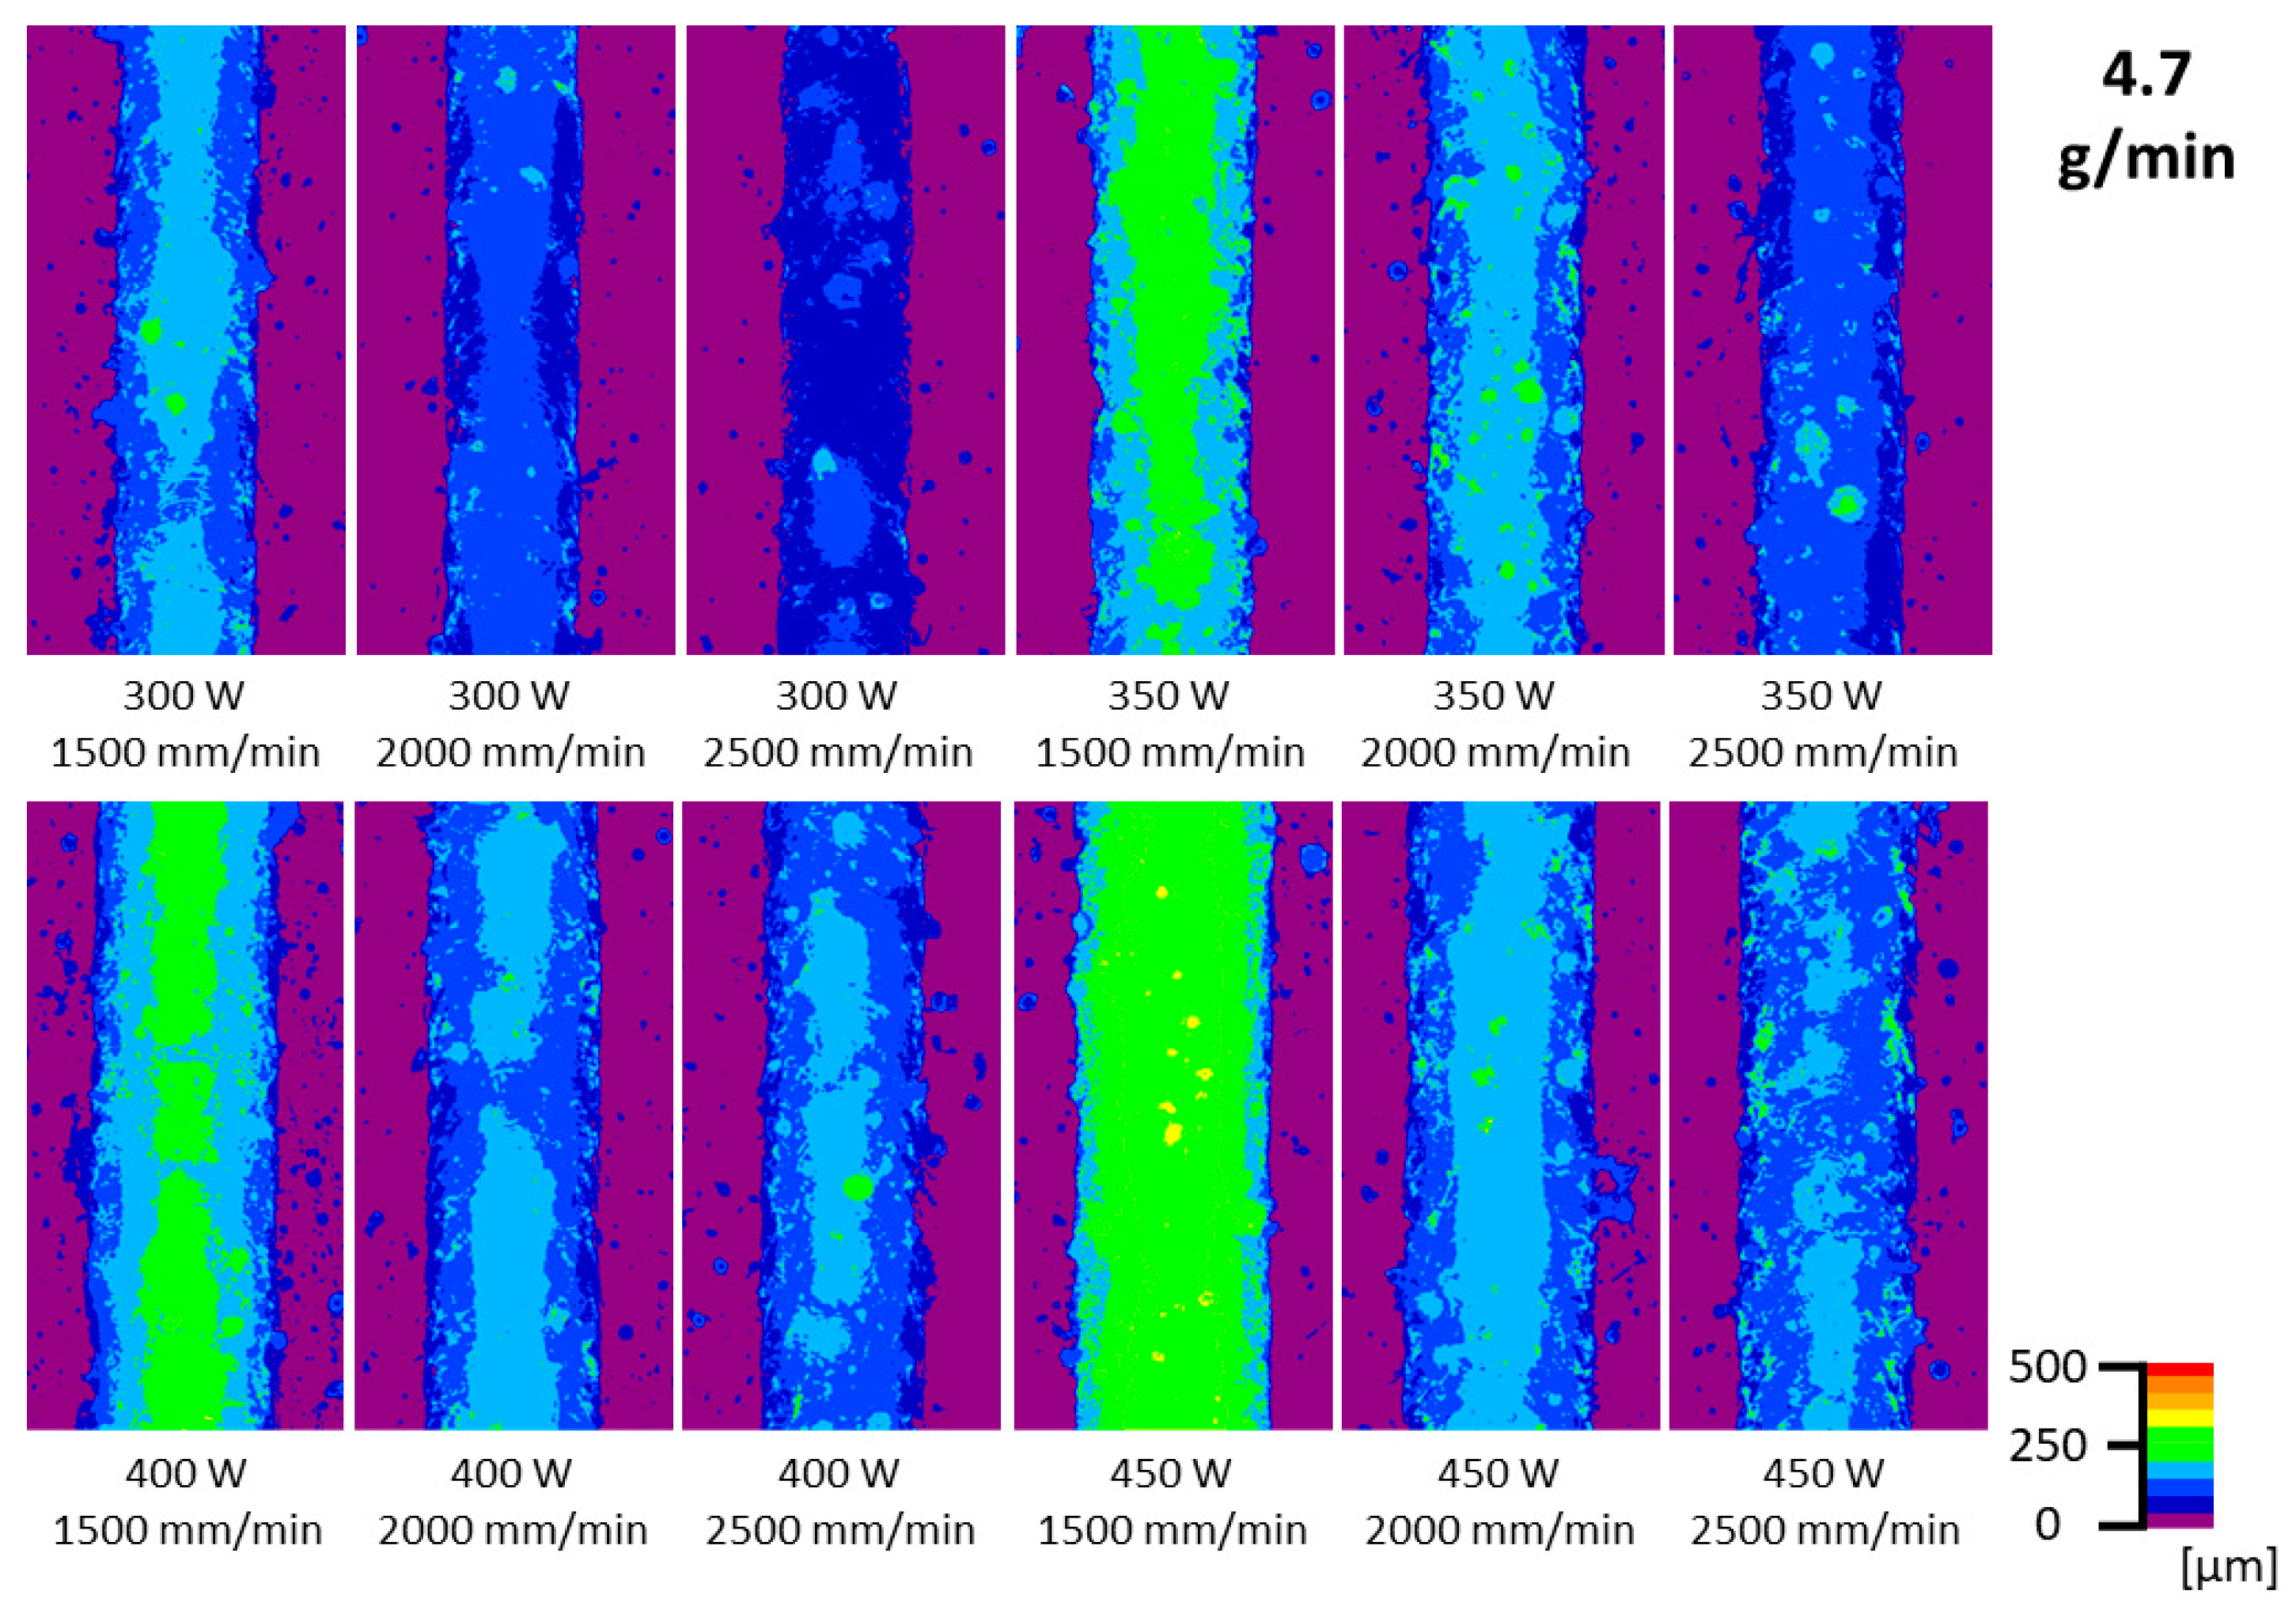
Figure 1. CF-LSM images of surface topography for 17-7 PH steel beads deposited, varying laser power and scanning speed, with a constant powder feed rate of 4.7 g/min.
Jmmp 09 00114 g001
Figure 2. CF-LSM images of surface topography for 17-7 PH steel beads deposited, varying laser power and scanning speed, with a constant powder feed rate of 9.2 g/min.
Jmmp 09 00114 g002
Figure 3. Partially melted powder particles on the surface of the bead (indicated by yellow arrows) and on the surface of the substrate (indicated by red arrows). Sample build with 9.2 g/min feed rate, 2500 mm/min scanning speed, and 400 W laser power.
Jmmp 09 00114 g003
Figure 4. EBSD phase maps for samples built with 4.7 g/min feed rate: (a) 1500 mm/min and 300 W, (b) 1500 mm/min and 450 W, (c) 2500 mm/min and 300 W, and (d) 2500 mm/min and 450 W. Green indicates a face-centered cubic (FCC) structure, while red indicates a body-centered cubic (BCC) structure.
Jmmp 09 00114 g004
Figure 5. EBSD phase maps for samples built with 9.2 g/min feed rate: (a) 1500 mm/min and 300 W, (b) 1500 mm/min and 450 W, (c) 2500 mm/min and 300 W, and (d) 2500 mm/min and 450 W. Green indicates a face-centered cubic (FCC) structure, while red indicates a body-centered cubic (BCC) structure.
Jmmp 09 00114 g005
Figure 6. Substrate dilution as a function of process parameters. Closed symbols refer to the 4.7 g/min feed rate, while open symbols refer to 9.2 g/min feed rate.
Jmmp 09 00114 g006
Figure 7. Isopleth in the 17-7 PH steel phase diagram with varying carbon content. The red dotted line shows the nominal composition of the alloy.
Jmmp 09 00114 g007
Figure 8. (a) Equilibrium phase fraction as a function of temperature and (b) the Scheil–Gulliver solidification diagram for 17-7 PH stainless steel.
Jmmp 09 00114 g008
Figure 9. Phase fractions calculated from the EBSD phase maps for the deposited beads. Closed symbols refer to the 4.7 g/min feed rate, while open symbols refer to 9.2 g/min feed rate.
Jmmp 09 00114 g009
Figure 10. Composition profile for three different samples: (a) 450 W, 1500 mm/s, and 4.7 g/min (highest dilution); (b) 450 W, 2000 mm/s, and 4.7 g/min (intermediate dilution); and (c) 300 W, 1500 mm/s, and 9.2 g/min (lowest dilution). The x-axis represents the distance measured from the deposited surface.
Jmmp 09 00114 g010
Figure 11. Aluminum content measured in the deposited material compared to (a) energy density, (b) dilution, and (c) FCC phase fraction. Closed symbols refer to the 4.7 g/min feed rate, while open symbols refer to 9.2 g/min feed rate.
Jmmp 09 00114 g011
Figure 12. Calculated volume fraction of phases at 1020 °C as a function of the aluminum content.
Jmmp 09 00114 g012
Figure 13. EBSD phase map for the sample build with 4.7 g/min feed rate, 2000 mm/min scanning speed and 400 W laser power. Green denotes an FCC structure while red denotes a BCC structure.
Jmmp 09 00114 g013
Table 1. DED-LB process parameters and calculated energy density (Ed—J/mm2).
Scanning Speed (mm/min)Laser Power (W)
300350400450
150015.0017.5020.0022.50
200011.2513.1215.0016.87
25009.0010.5012.0013.50
Table 2. Surface roughness Ra (µm) for a constant powder feed rate of 4.7 g/min.
Scanning Speed (mm/min)Laser Power (W)
300350400450
150014.3 ± 4.314.1 ± 4.814.8 ± 5.014.2 ± 4.4
200014.6 ± 4.114.5 ± 4.614.2 ± 4.514.1 ± 3.9
250014.1 ± 4.814.6 ± 4.914.6 ± 4.714.4 ± 4.4
Table 3. Surface roughness Ra (µm) for a constant powder feed rate of 9.2 g/min.
Scanning Speed (mm/min)Laser Power (W)
300350400450
150020.7 ± 5.720.7 ± 5.920.9 ± 5.220.4 ± 5.7
200017.1 ± 5.617.1 ± 5.316.6 ± 5.416.7 ± 5.3
250016.8 ± 5.416.6 ± 5.116.5 ± 5.516.4 ± 5.4
Disclaimer/Publisher’s Note: The statements, opinions and data contained in all publications are solely those of the individual author(s) and contributor(s) and not of MDPI and/or the editor(s). MDPI and/or the editor(s) disclaim responsibility for any injury to people or property resulting from any ideas, methods, instructions or products referred to in the content.