Article

Valorization of Biochar as a Reinforcement Agent in Polyethylene Terephthalate Glycol for Additive Manufacturing: A Comprehensive Content Optimization Course

by
Nikolaos Bolanakis
1,
Emmanuel Maravelakis
1,
Vassilis Papadakis
2,3,
Dimitrios Kalderis
1,
Nikolaos Michailidis
4,5,
Apostolos Argyros
4,5,
Nikolaos Mountakis
6,
Markos Petousis
6 and
Nectarios Vidakis
6,*
1
Department of Electronic Engineering, Hellenic Mediterranean University, 73133 Chania, Greece
2
Department of Industrial Design and Production Engineering, University of West Attica, 12243 Athens, Greece
3
Institute of Electronic Structure and Laser, Foundation for Research and Technology–Hellas, N. Plastira 100 m, 70013 Heraklion, Greece
4
Physical Metallurgy Laboratory, Mechanical Engineering Department, School of Engineering, Aristotle University of Thessaloniki, 54124 Thessaloniki, Greece
5
Centre for Research & Development of Advanced Materials (CERDAM), Center for Interdisciplinary Research and Innovation, Balkan Centre, Building B’, 10th km Thessaloniki-Thermi Road, 57001 Thessaloniki, Greece
6
Department of Mechanical Engineering, Hellenic Mediterranean University, 71410 Heraklion, Greece
*
Author to whom correspondence should be addressed.
J. Manuf. Mater. Process. 2025, 9(2), 68; https://doi.org/10.3390/jmmp9020068
Submission received: 14 January 2025 / Revised: 29 January 2025 / Accepted: 10 February 2025 / Published: 19 February 2025

Abstract

This study aimed to develop a biochar-modified polyethylene terephthalate glycol (PETG) composite for 3D printing. Biochar prepared from olive tree prunings was compounded with PETG at different loadings and then processed into filaments through a controlled extrusion process. The resultant filaments were used to print test specimens, which were characterized thoroughly by mechanical, thermal, morphological, and rheological methods. The tensile strength (17.8%), flexural strength (15.9%), impact resistance (20.9%), and thermal stability of the biochar-reinforced composites were substantially improved. Overall, the 6.0 wt.% biochar compound exhibited the highest improvement. Scanning electron microscopy and energy-dispersive X-ray spectroscopy confirmed the excellent dispersion of biochar in the PETG matrix. The results demonstrated that biochar is an effective, environmentally friendly material to use as a reinforcing agent for additive manufacturing. The PETG/biochar composites have a promising future for various industrial applications, offering sustainable alternatives with superior performance characteristics.

1. Introduction

Additive manufacturing (AM) is categorized into several types, including material jetting, binder jetting, sheet lamination, direct energy deposition, powder bed fusion, material extrusion, and vat photopolymerization [1]. AM has been utilized in the automotive industry [2,3,4,5], aerospace industry [6,7,8,9,10,11,12], defense [13,14], and electronics [15,16]. Some of AM’s benefits and reasons to utilize it are its cost-effectiveness [17], capacity for customization [18], innovation and manufacturing of complex parts [19], as well as its potential [17,20] for further promotion of a sustainable society [21,22,23].
Polyethylene terephthalate glycol (PETG) is a polymeric thermoplastic material, standing out for its transparency [24], ductility [25], printability [26], mechanical properties, and chemical resistance [27,28]. Primarily, PETG is a modified version of PET, with ‘G’ indicating the addition of a second glycol, usually cyclohexanedimethanol (CHDM), during polymerization, to enhance processability during material extrusion (MEX) 3D printing [29]. PET is semi-crystalline, while PETG is amorphous [30]; therefore, PET is more brittle than PETG [31] and more resistant to heat, making it more suitable for its respective applications [30]. PETG is easier to process, and therefore it is suitable for 3D printing, as mentioned earlier [29].
Possible applications of PETG include those in engineering [32] and medical fields [33]. In material extrusion (MEX) 3D printing (3DP,) its sustainability has been tested, and it was proven capable of withstanding six repetitive thermal courses without compromising its stability, integrity, or mechanical performance [26], thus confirming the hypothesis of being a sustainable polymer. Its mechanical response has been tested in various types of tests [29,34,35,36,37], with the findings showing a higher performance than the common polymers in 3DP, such as acrylonitrile butadiene styrene (ABS). Its printability has also been optimized by optimizing the 3D printing G-code [38]. Its behavior as a matrix material has also been proven mainly with ceramic additives, with the composites prepared for MEX 3DP by means of a thermomechanical process, similar to the one implemented in the current research [39,40]. Carbon additives have been evaluated as well [41,42,43]. Blends and composites are presented with the aim of furthering the sustainability of PETG thermoplastic [44,45].
Sustainability is a key aspect studied in 3D printing, as the method is replacing traditional manufacturing processes [46]. Sustainable, biocompatible, or biodegradable materials are critical in this regard and are highly sought after and investigated [47,48]. To improve the sustainability of the materials in 3DP, recycled additives produced by waste [49], or nature-sourced additives [50,51,52], are replacing the commonly used fillers. The performance of polymers after several reprocessing steps (recycling) has been assessed as well [53], along with their aging and degradation properties [54]. With such an overriding necessity for sustainable products, the scientific world has started to focus on conducting research to produce biomass-based materials that could yield a lower environmental impact compared to their fossil counterparts [55,56].
Biochar, as an organic material, has gained tremendous popularity due to its environmentally friendly profile. Sequestering carbon into biochar is not just a mitigation measure to reduce the emission of greenhouse gases but also one of the measures to enhance the soil carbon pool [57,58]. Various research studies have indicated that biochar can sequester carbon over centuries; hence, it is the most effective means of long-term storage [59]. Biochar applications include soil remediation and amendment [60,61,62,63], adsorption of water and air contaminants [64,65], as a component in fuel cells [66,67], and in supercapacitors [68,69]. It can be derived from various types of biomass, including agricultural byproducts, sewage sludge, wood [70,71], energy crops, forest remnants, and agricultural residues [72,73,74,75,76,77]. In 3D printing, composites using as matrix materials polylactic acid [78], ABS [79], high-density polyethylene (HDPE) [80], and polypropylene (PP) [81], among others, have been introduced. Biochar managed to improve the mechanical response of the polymers, while in some cases electrical properties were also induced. These works from our research group are the only ones available, to our knowledge, in which biochar is prepared from olive tree prunings. Biochar was prepared by our research team, with its production presented in a previous research paper [82].
Herein, PETG/biochar composites of five filler concentrations (2.0–10.0 wt.%, 2.0 wt.% step) were produced. Their initial form was in blends, to be extruded into filaments, which would supply a three-dimensional (3D) printing process for specimen fabrication. The produced specimens were submitted to thermal, rheological, structural, mechanical, and morphological analyses. The extruded filaments also underwent tensile testing-based mechanical behavior analysis. As the bibliographic search revealed, this is the first time biochar has been introduced into PETG in MEX 3D printing. The hypothesis was to evaluate the feasibility of producing such composites, their printability, and the efficacy of biochar as a filler to reinforce the PETG thermoplastic. The characterization methods implemented verified that the integrity of the PETG thermoplastic was not impacted by the introduction of the biochar particles. The specific olive tree prunings sourced for biochar were evaluated by the study. The literature instructs that each grade has a different response and, additionally, that its effect in each matrix should be studied individually as well. The hypothesis was verified, presenting composites with improved performance utilizing the sustainable biochar as reinforcement.

2. Materials and Methods

2.1. Materials

The PETG used in this study was procured as pellets from Felfil Srl, Torino, Italy (pellet size was 2–4 mm, as purchased from the manufacturer). They were used as purchased from the manufacturer. Samples of olive tree prunings were collected from the Greek island of Crete (Chania), and treated by flame-curtain pyrolysis at 500 °C. Comprehensive data about the pyrolysis kiln production conditions, dimensions, materials, and specifications are extensively documented in the literature [82]. Following the flame-curtain pyrolysis method, the biochar was ground using a Sepor-type rod mill, specifically focusing on the biochar fraction smaller than 100 μm. A comprehensive discussion of the biochar properties can be found in our earlier publication [78]. The particle size distribution of the biochar was determined to be within the range of 14.64 and 50.32 μm [78].

2.2. Methods

The entire process ranging from preparation of the biochar, fabrication of PETG/biochar composite filaments, to testing is shown in Figure 1 below. First, PETG and biochar raw materials were dried (A,B). These dried materials were then extruded into filaments using a 3devo filament extruder (C), and the extruded filaments were dried again to eliminate any residual moisture (D). The diameter of the filament was measured for uniformity (E), followed by a tensile test to determine the mechanical strength (F). After that, the filaments were printed out using MEX for 3D printing of a specimen (G), and subsequently the measurements were taken for a quality check (H). These specimens were then subjected to various mechanical tests, such as tensile and flexural testing (I,J). Also, other characteristics (K) concerning the flow properties of the composite were examined throughout the processing stages. In summary, the latter describes the morphological properties of the composite through the use of scanning electron microscopy (SEM) (L), where the biochar and PETG interaction and dispersion were observed.

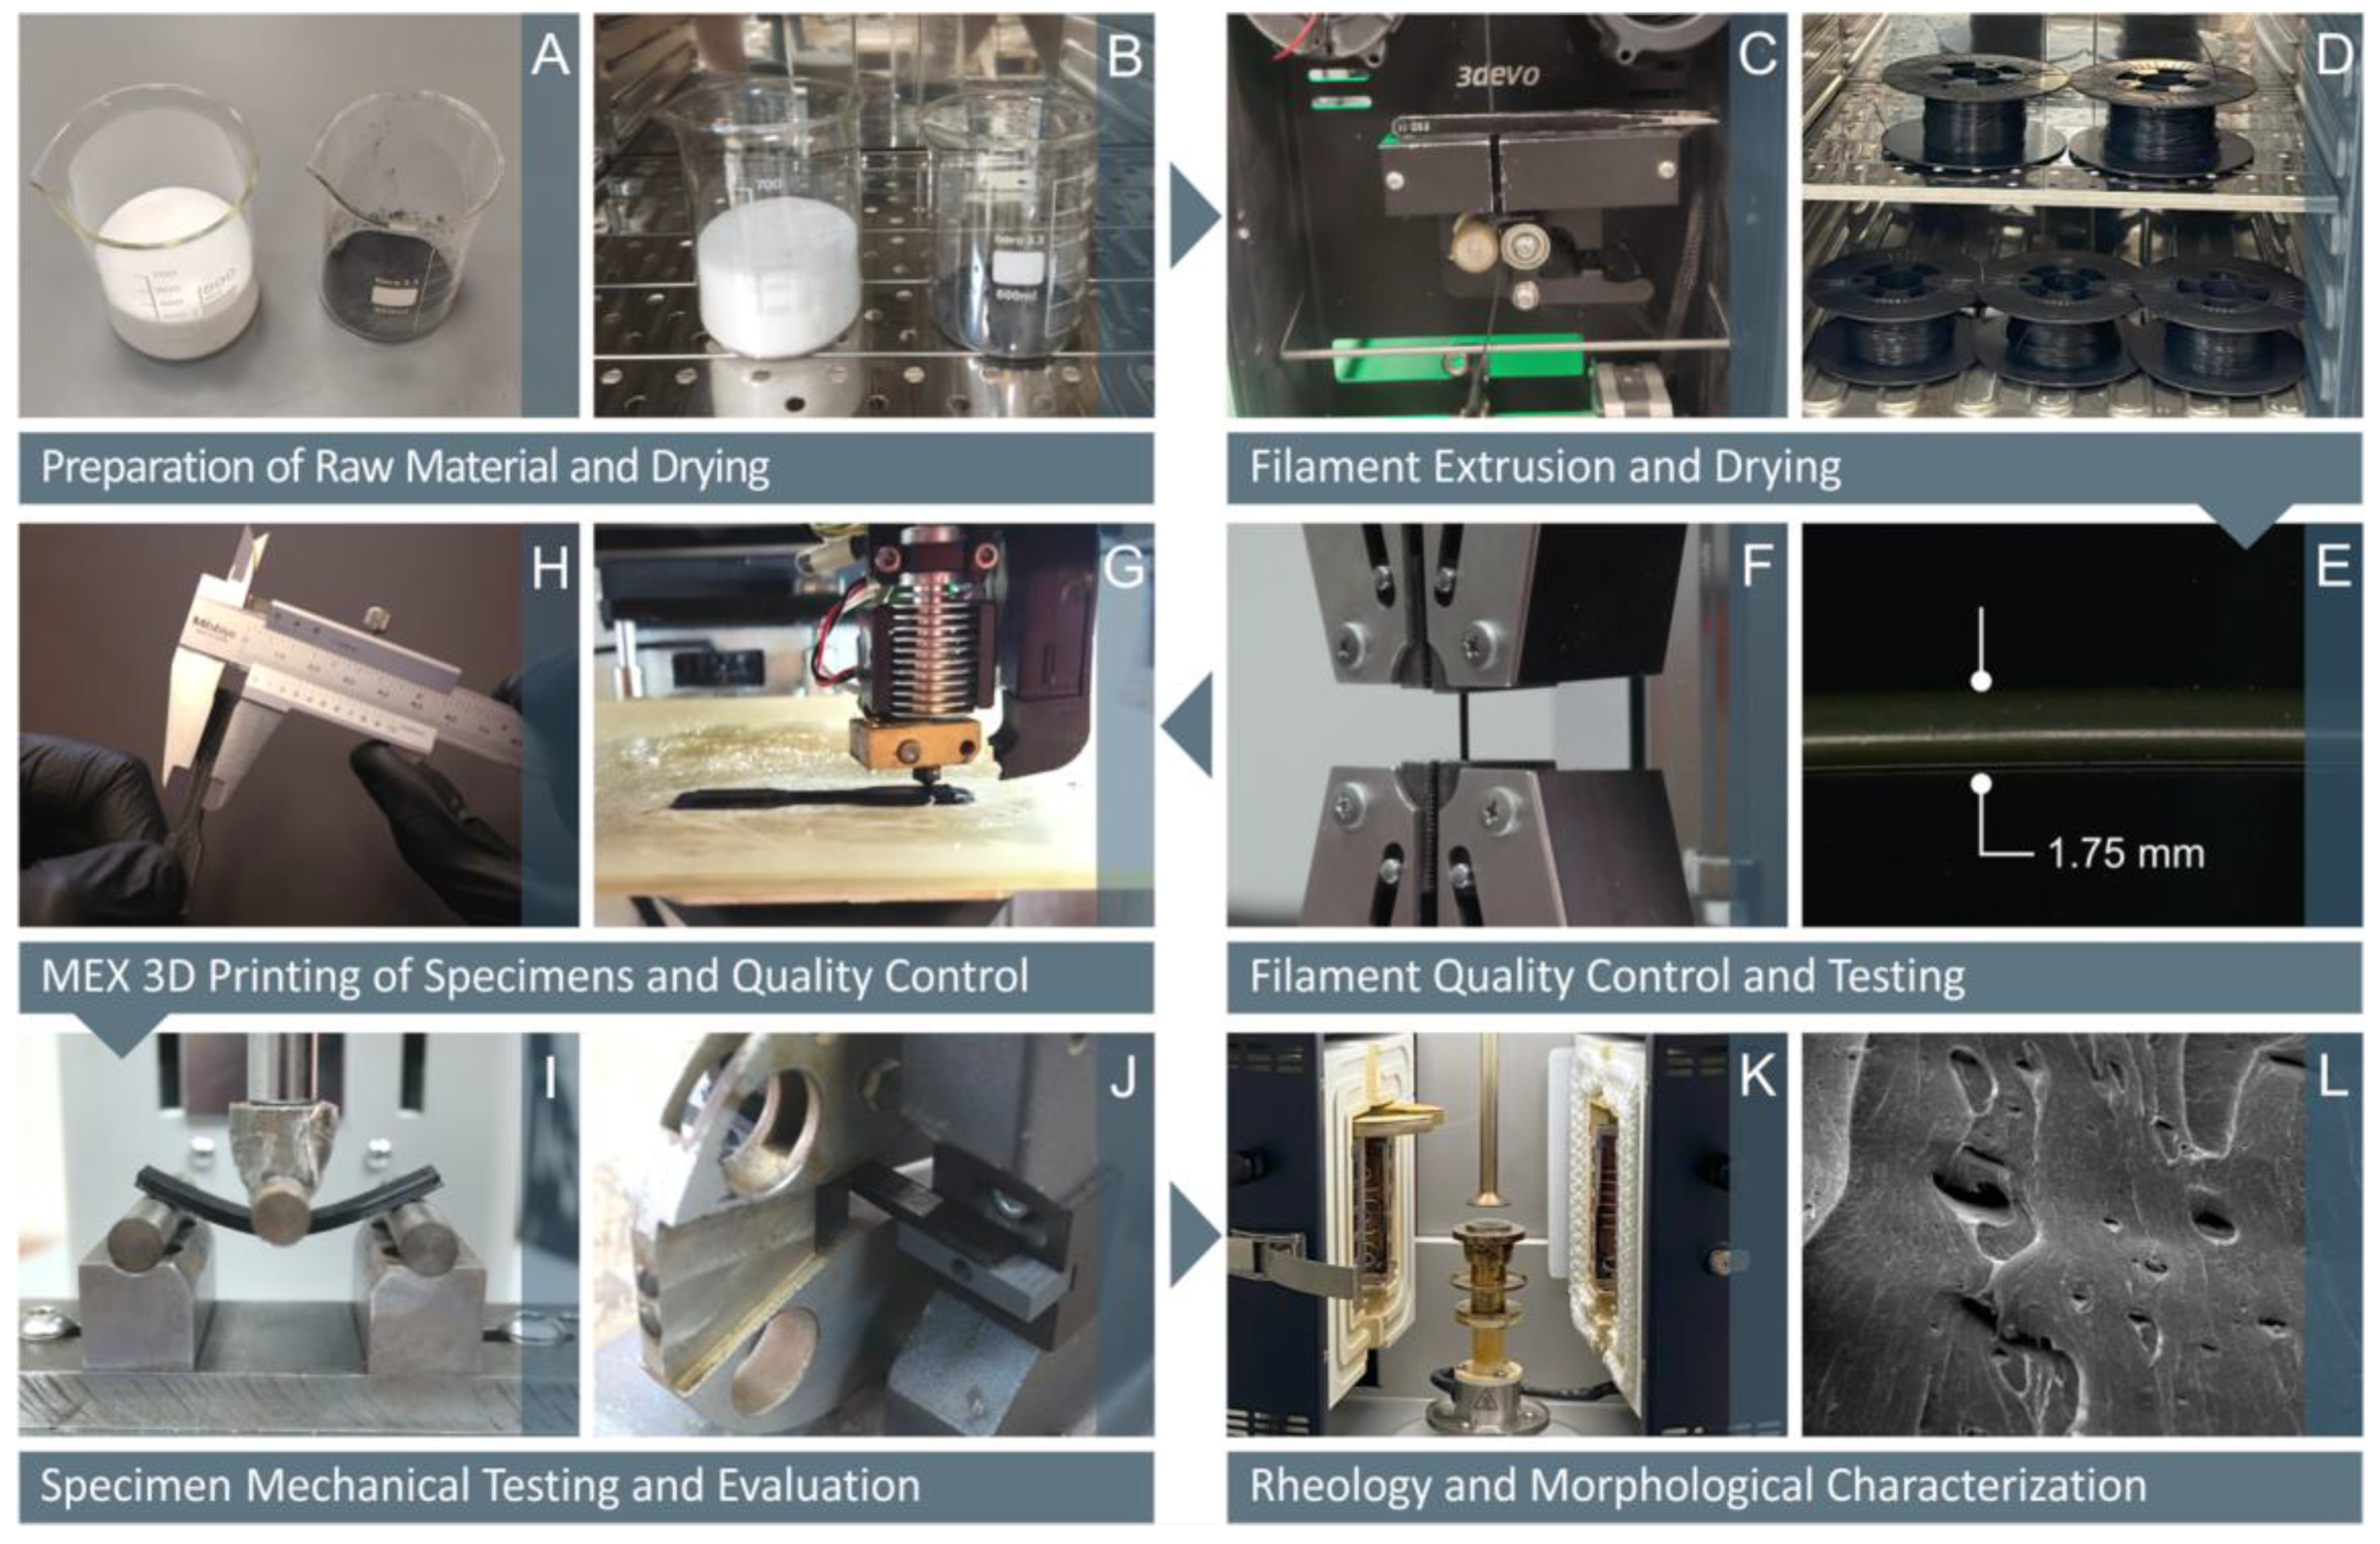
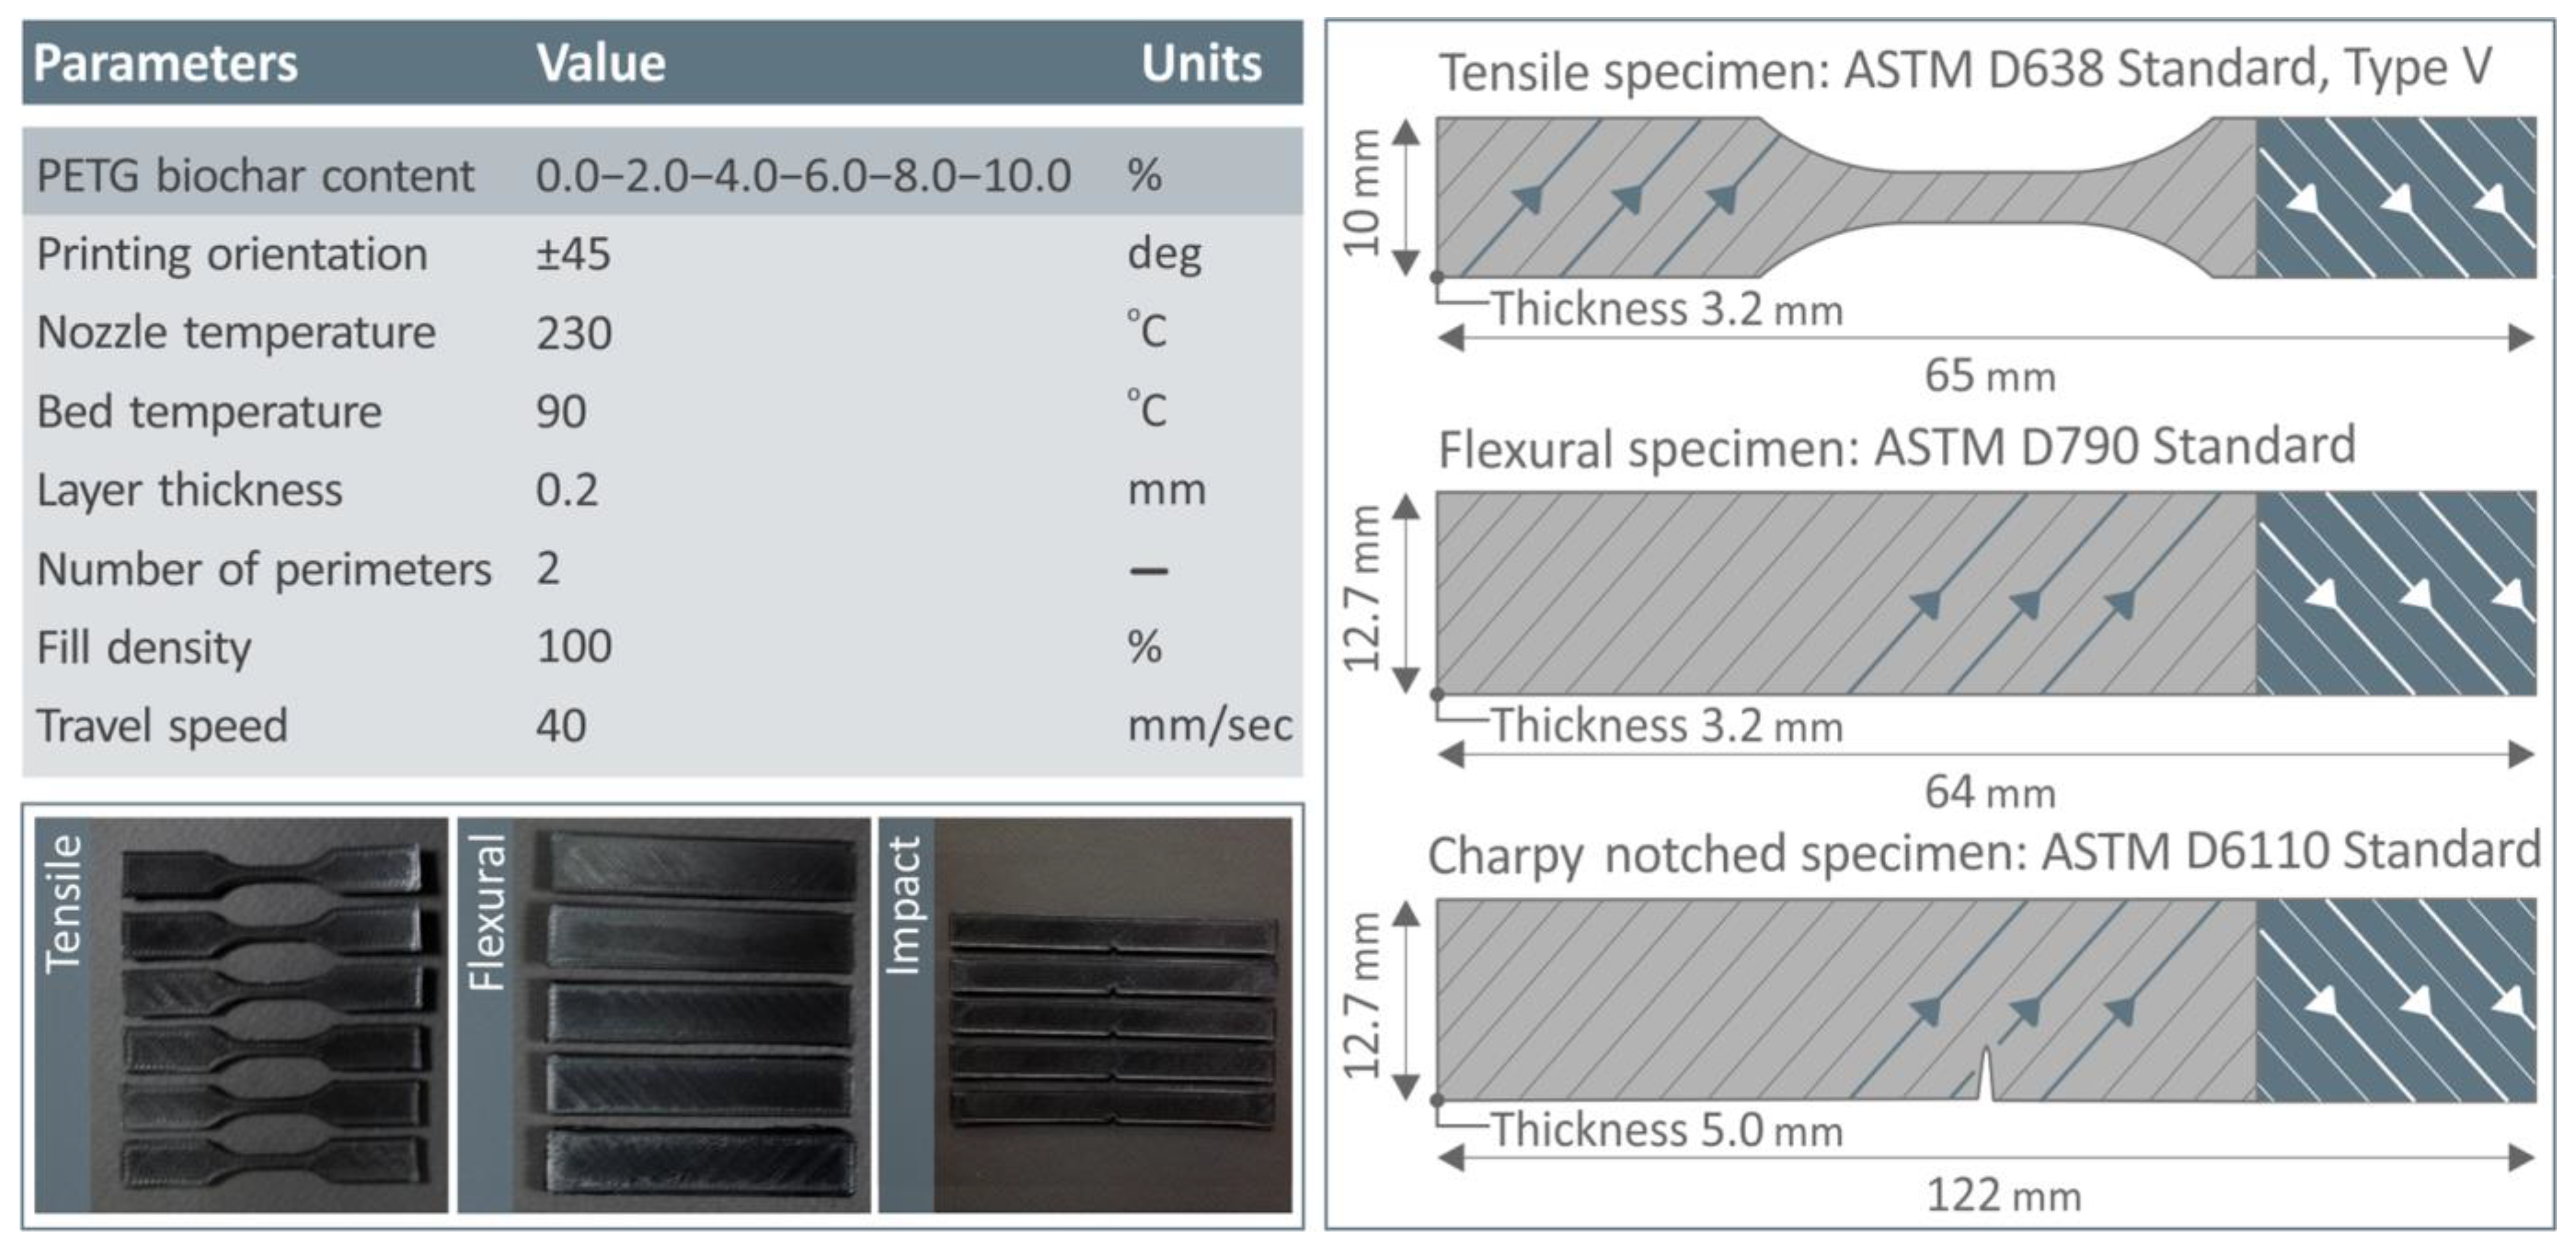
2.3. The Preparation Phase of Composites Using PETG and Biochar, as Well as the Production of Filaments and Additively Built Parts

Mixing of PETG and biochar powders occurred by means of a high-powered blender (Telemax DM-B Majestic, Power: 400 Watt, Thessaloniki, Greece) at a rate of 8000 revolutions per minute for 20 min and without the introduction of any other substance. After that, the individual raw material mixtures were put to dry (at 40 °C for about 8 h, which is slightly below the glass transition temperature Tg of PETG, to ensure the removal of any residual moisture while avoiding thermal degradation of the material) in an industrial ventilated oven in which they were processed for about 24 h. This was repeated in the produced filaments at 40 °C for about 8 h. The filaments were again dried, since the 3D printing process did not occur immediately after the extrusion process. It took place on a different day. The PETG/biochar combinations were prepared with additive percentages of 2.0–10.0 wt.%. To determine the optimum loading of biochar, and the range within which biochar should be used, the quantity of biochar was gradually raised (by 2.0 wt.% each time), and the respective compound was studied. Sample generation and sample evaluation for each mixture proceeded. Consequently, it was concluded that the loadings above 6.0 wt.% indicated a substantial compromise in their mechanical characteristics. This suggests that the biochar additive particles in the PETG matrix have reached the maximum absorption possible (saturation). Therefore, the decision was made to investigate biochar incorporation levels of up to 10.0 wt.%. These filaments were made by using a 3D Evo Composer 450, which is a machine made by the 3D Evo B.V. company, in Utrecht, the Netherlands. The following settings were applied: Zone 1 (nozzle): 200 °C; Zone 2: 210 °C; Zone 3: 210 °C; Zone 4 (hopper): 180 °C; filament cooling fan speed: 50%; rotational speed: 5 rpm; orifice diameter: 3 mm. Filaments having about a 1.75 mm diameter (±0.1 mm, which is an acceptable deviation for 3DP) were produced using the additive manufacturing technique.
Figure 2 (top left) presents the biochar loading wt.% and the 3D printing parameters investigated in this study. On the right, the dimensions and standards for the different mechanical test specimens are shown, based on the requirements of ASTM D638 [83], D790 [84], and D6110 [85]. Images of the actual printed specimens for flexural, tensile, and impact testing are displayed at the bottom left of Figure 2, illustrating the consistency and quality of the printed material. The 3D printer used for parts fabrication was an Intamsys Funmat HT (Shanghai, China), with a nozzle diameter of 0.4 mm. The 3D printing settings were determined in preliminary tests and by consulting the respective literature [26]. The same settings were applied in all compounds for comparison purposes. The lines and arrows in the samples show the infill pattern used (Figure 2). A 45-degree linear pattern was used, with the orientation changing by 90 degrees in the successive layers. This was selected to reduce anisotropy in the parts [86].

2.4. Viscosity and Melt Flow Measurements

The rheology experiments were conducted by implementing a rotational Discovery Hybrid Rheometer, HR 20, of TA Instruments (New Castle, DE, USA). The rheometer was equipped with a parallel plate geometry with a diameter of 25 mm and a gap of 1 mm. All measurements were carried out at 240 °C with the implementation of an environmental thermal chamber to precisely control the temperature. During the measurements an equilibration time of 20 s, a sampling period of 1 s, and 5% tolerance were set as acquisition parameters. Melt flow rate (MFR) was analyzed according to the international ASTM D1238-13 standard [87] which states that for PETG polymers a temperature of 250 °C and a weight of 2.16 kg should be used.

2.5. Morphological Analysis

The biochar particles were inspected with a scanning electron microscope (SEM), to evaluate their shape and size. The vertical and fractured cross-sections of tensile samples were also assessed utilizing the SEM. This endeavor aimed to investigate and assess the structural and morphological characteristics of the specimens, drawing conclusions applicable to additive manufacturing settings. These aspects are thoroughly discussed further on in the study, referring to the specific investigation. A field emission apparatus by Jeol (Tokyo, Japan) was utilized (model JSM-IT700HR). All samples were Au-coated, and images were taken in high-vacuum mode and at 20 kV.

2.6. Mechanical Tests

A motorized test stand, specifically the Imada MX2 from the Imada Inc. company, located in Northbrook, IL, USA, was utilized to perform tensile and flexural (52 mm clearance, three-point bending) experiments on the samples, adhering to ASTM D638-14 (3.2 in height, type V specimen) and ASTM D790-10 international standards, correspondingly. Experiments were carried out at a 10 mm/min speed of testing. The displacement data were recorded by the testing machine. Impact testing was carried out utilizing the Terco MT3016 Impact Tester (Stockholm, Sweden), in accordance with ASTM D6110. The maximum available pendulum impact tester energy was 15 J. Microhardness measurements in accordance with the Vickers method were acquired with an Innovatest 300 Vickers machine (the Innovatest company is located in the city of Maastricht, in The Netherlands), according to ASTM E384-17 [88]. All experiments were performed at 23 degrees Celsius and a humidity of 55%. In all the mechanical tests, five samples were tested per case, in accordance with the respective standards.

2.7. Raman Spectra

Raman spectroscopy was applied to study potential molecular interactions in the composites. Infrared spectra of neat PETG and PETG/biochar compounds with varying biochar content allowed the identification of active functional groups and vibrations ascertaining the effect of biochar. Please see the Supplementary File for analytical information on the methodology used to acquire the spectra.

2.8. Thermal Properties

The thermal behavior of the composites was determined using the PerkinElmer (Waltham, MA, USA) Diamond TGA/DTGA system, to determine the response to the temperature of the materials through thermogravimetric analysis (TGA). A temperature ramp of 10 °C per minute was chosen, covering a range from 40 °C up to 550 °C. The sample size (weight) was approximately 7 mg and the N2 purge gas flow rate was adjusted to 200 mL/min. Differential scanning calorimetry (DSC) was measured using the DSC 25 instrument from the TA Instruments company, located in New Castle, DE, USA, with the temperature range set from 30 °C to 300 °C, with a heating rate of 15 °C/min. The sample size (weight) was approximately 6 mg and the N2 purge gas flow rate was adjusted to 300 mL/min.
The approach we used for determining the Tg temperatures by DSC is by determining the midpoint of the line that connects the two points of the onset and endset temperatures. The onset temperature is the temperature at which we first observe a change in the slope of the heat flow signal and depicts the temperature at which the material starts to change from glassy to rubbery. The endset temperature is the temperature at which the second change in the slope of the heat flow signal is observed and depicts the temperature at which the material stops changing from glassy to rubbery. This method captures the midpoint of the glass transition zone, ensuring that the reported Tg value represents the central region of the thermal transition as observed in the DSC curve.

3. Results

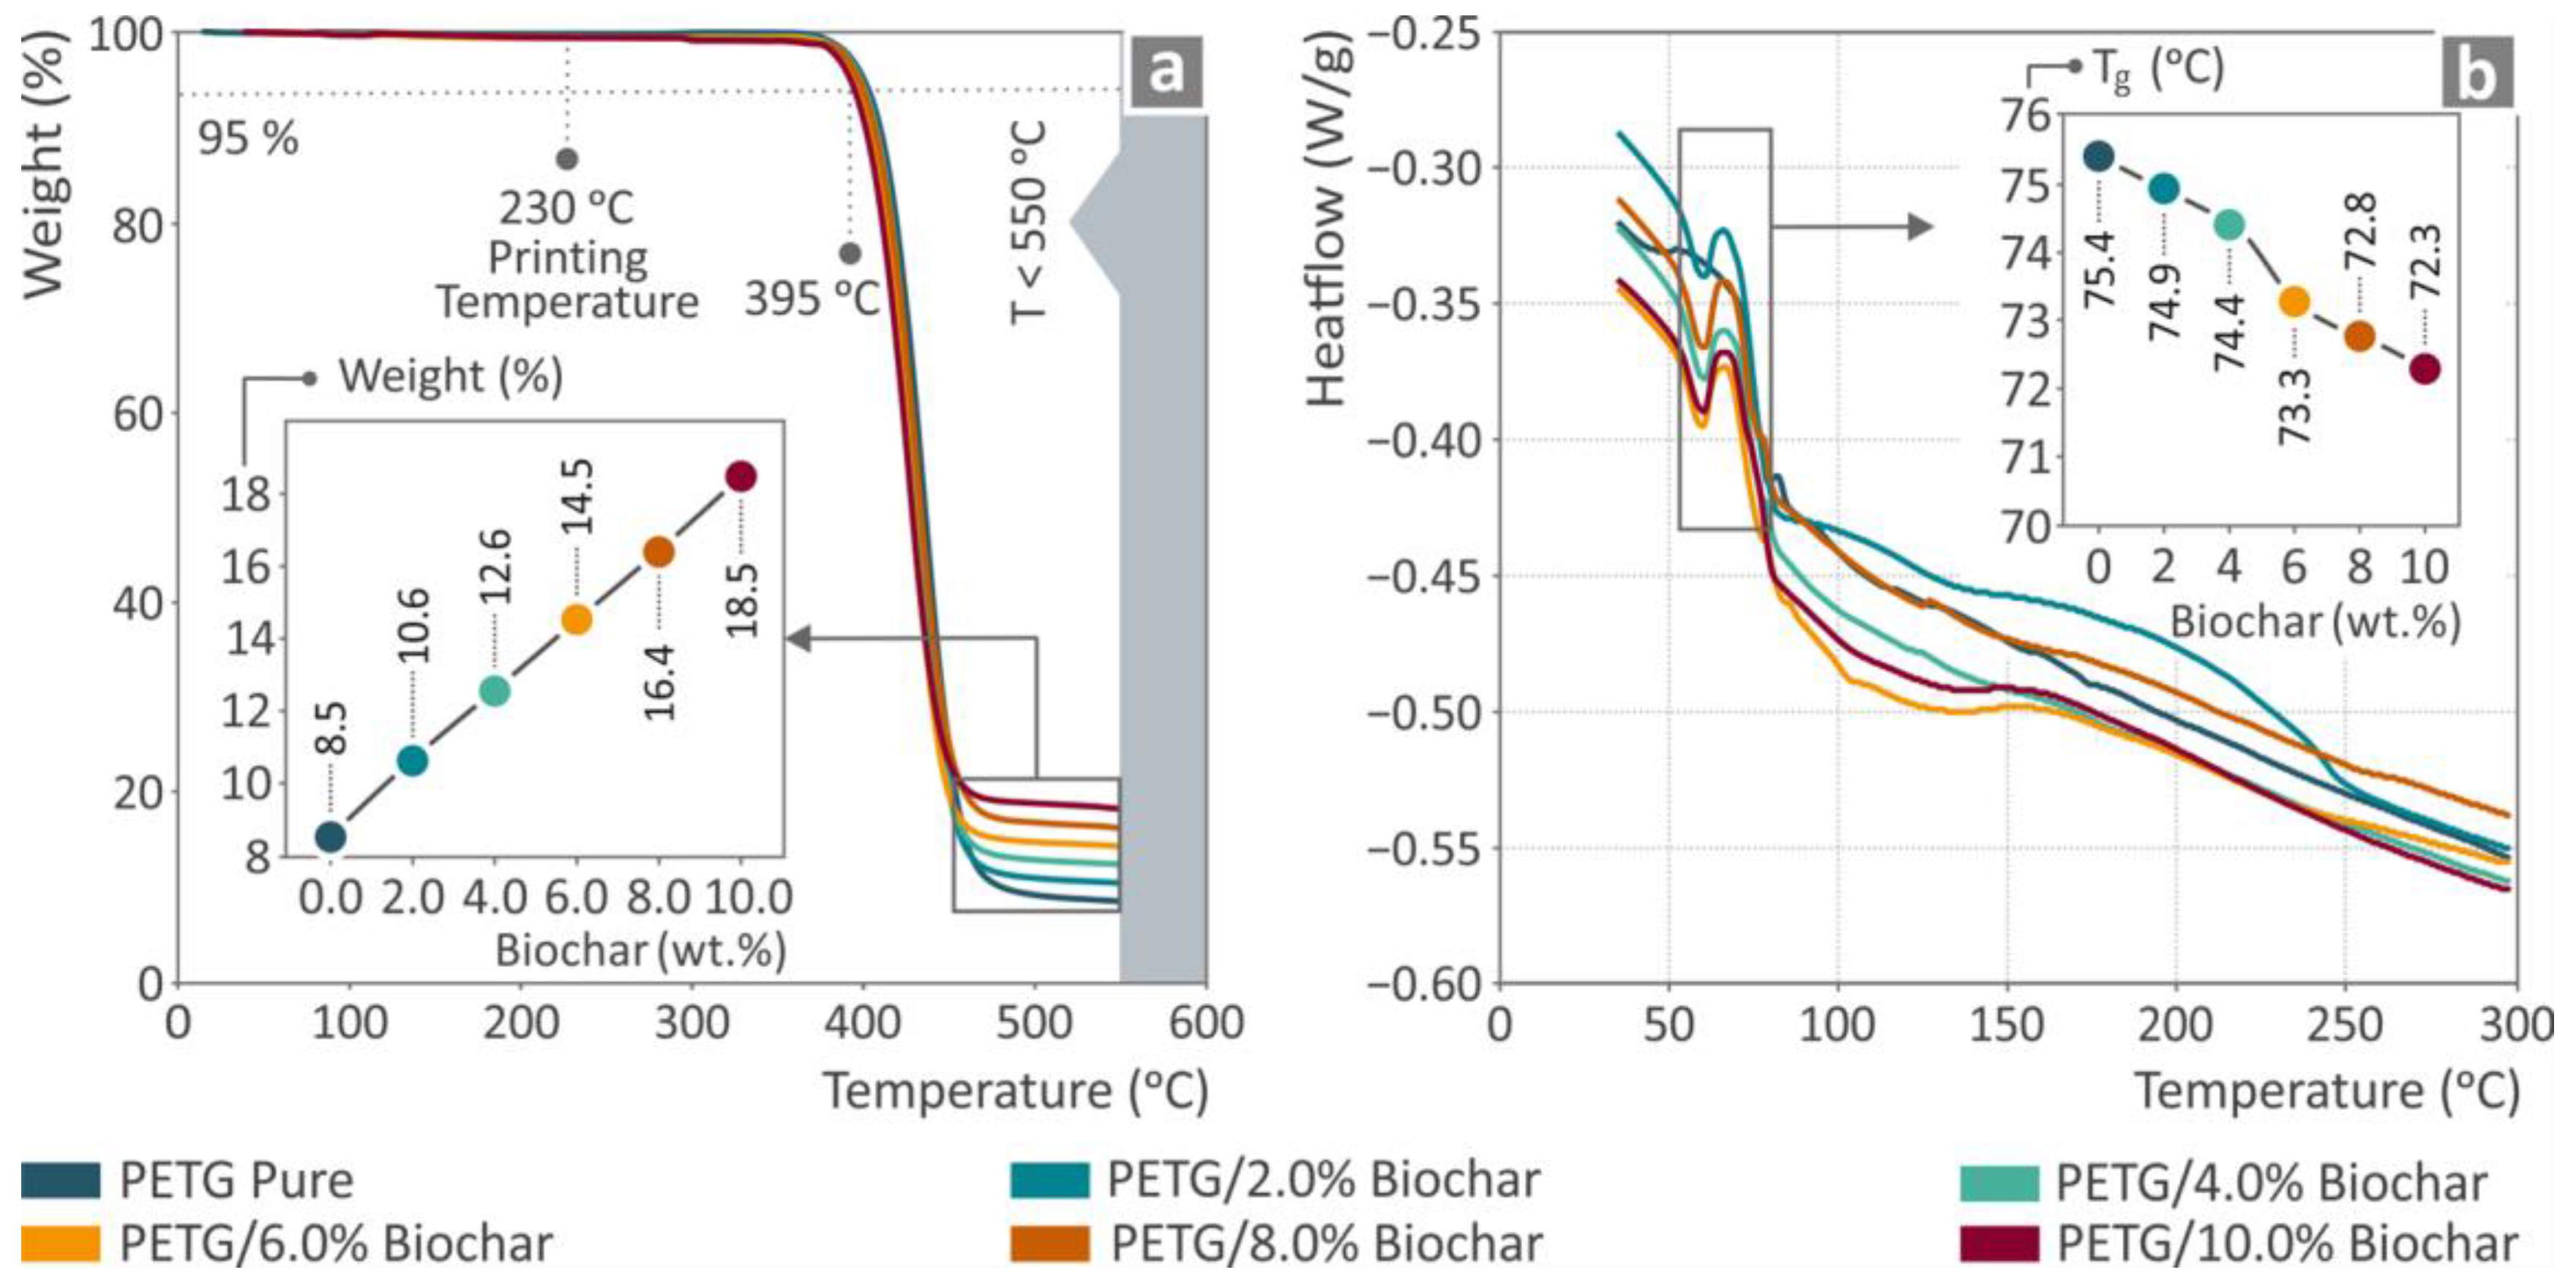
3.1. Thermogravimetric Analysis

The TGA and DSC data of PETG/biochar composites with different biochar concentrations are shown in Figure 3. Figure 3a represents the TGA curves corresponding to the weight loss of pure PETG and PETG/biochar composites. The TGA curves obtained show weight loss of approximately 5% starting from 395 °C, which is the temperature that indicates the degradation of the polymer matrix. The temperature steadily increases up to around 550 °C, when the majority of the material decomposes. The inset in panel (a) shows the residual weight percentage at 550 °C; as the content of biochar rises, the residual percentage becomes higher. The stability of the PETG was not affected by the biochar particles, and the residual mass agrees with the biochar content in the compounds.
Panel (b) depicts the DSC thermograms of the composites, illustrating the heat flow versus temperature. The DSC results provide the Tg values for each composite, a crucial parameter for assessing the thermal properties of the material. The Tg value gradually decreased as the biochar loading increased. This reduction indicates that the presence of biochar may affect the thermal behavior of the polymer matrix, possibly due to alterations in polymer chain mobility or interactions between the biochar particles and the polymer. Still, the decrease in the temperature is not significant. As PETG is an amorphous material it does not have a clear melting temperature, and thus the melting temperatures cannot be extracted. The observed differences in Tg across the composites were minimal and are attributed to the interaction between the biochar particles and the polymer matrix.

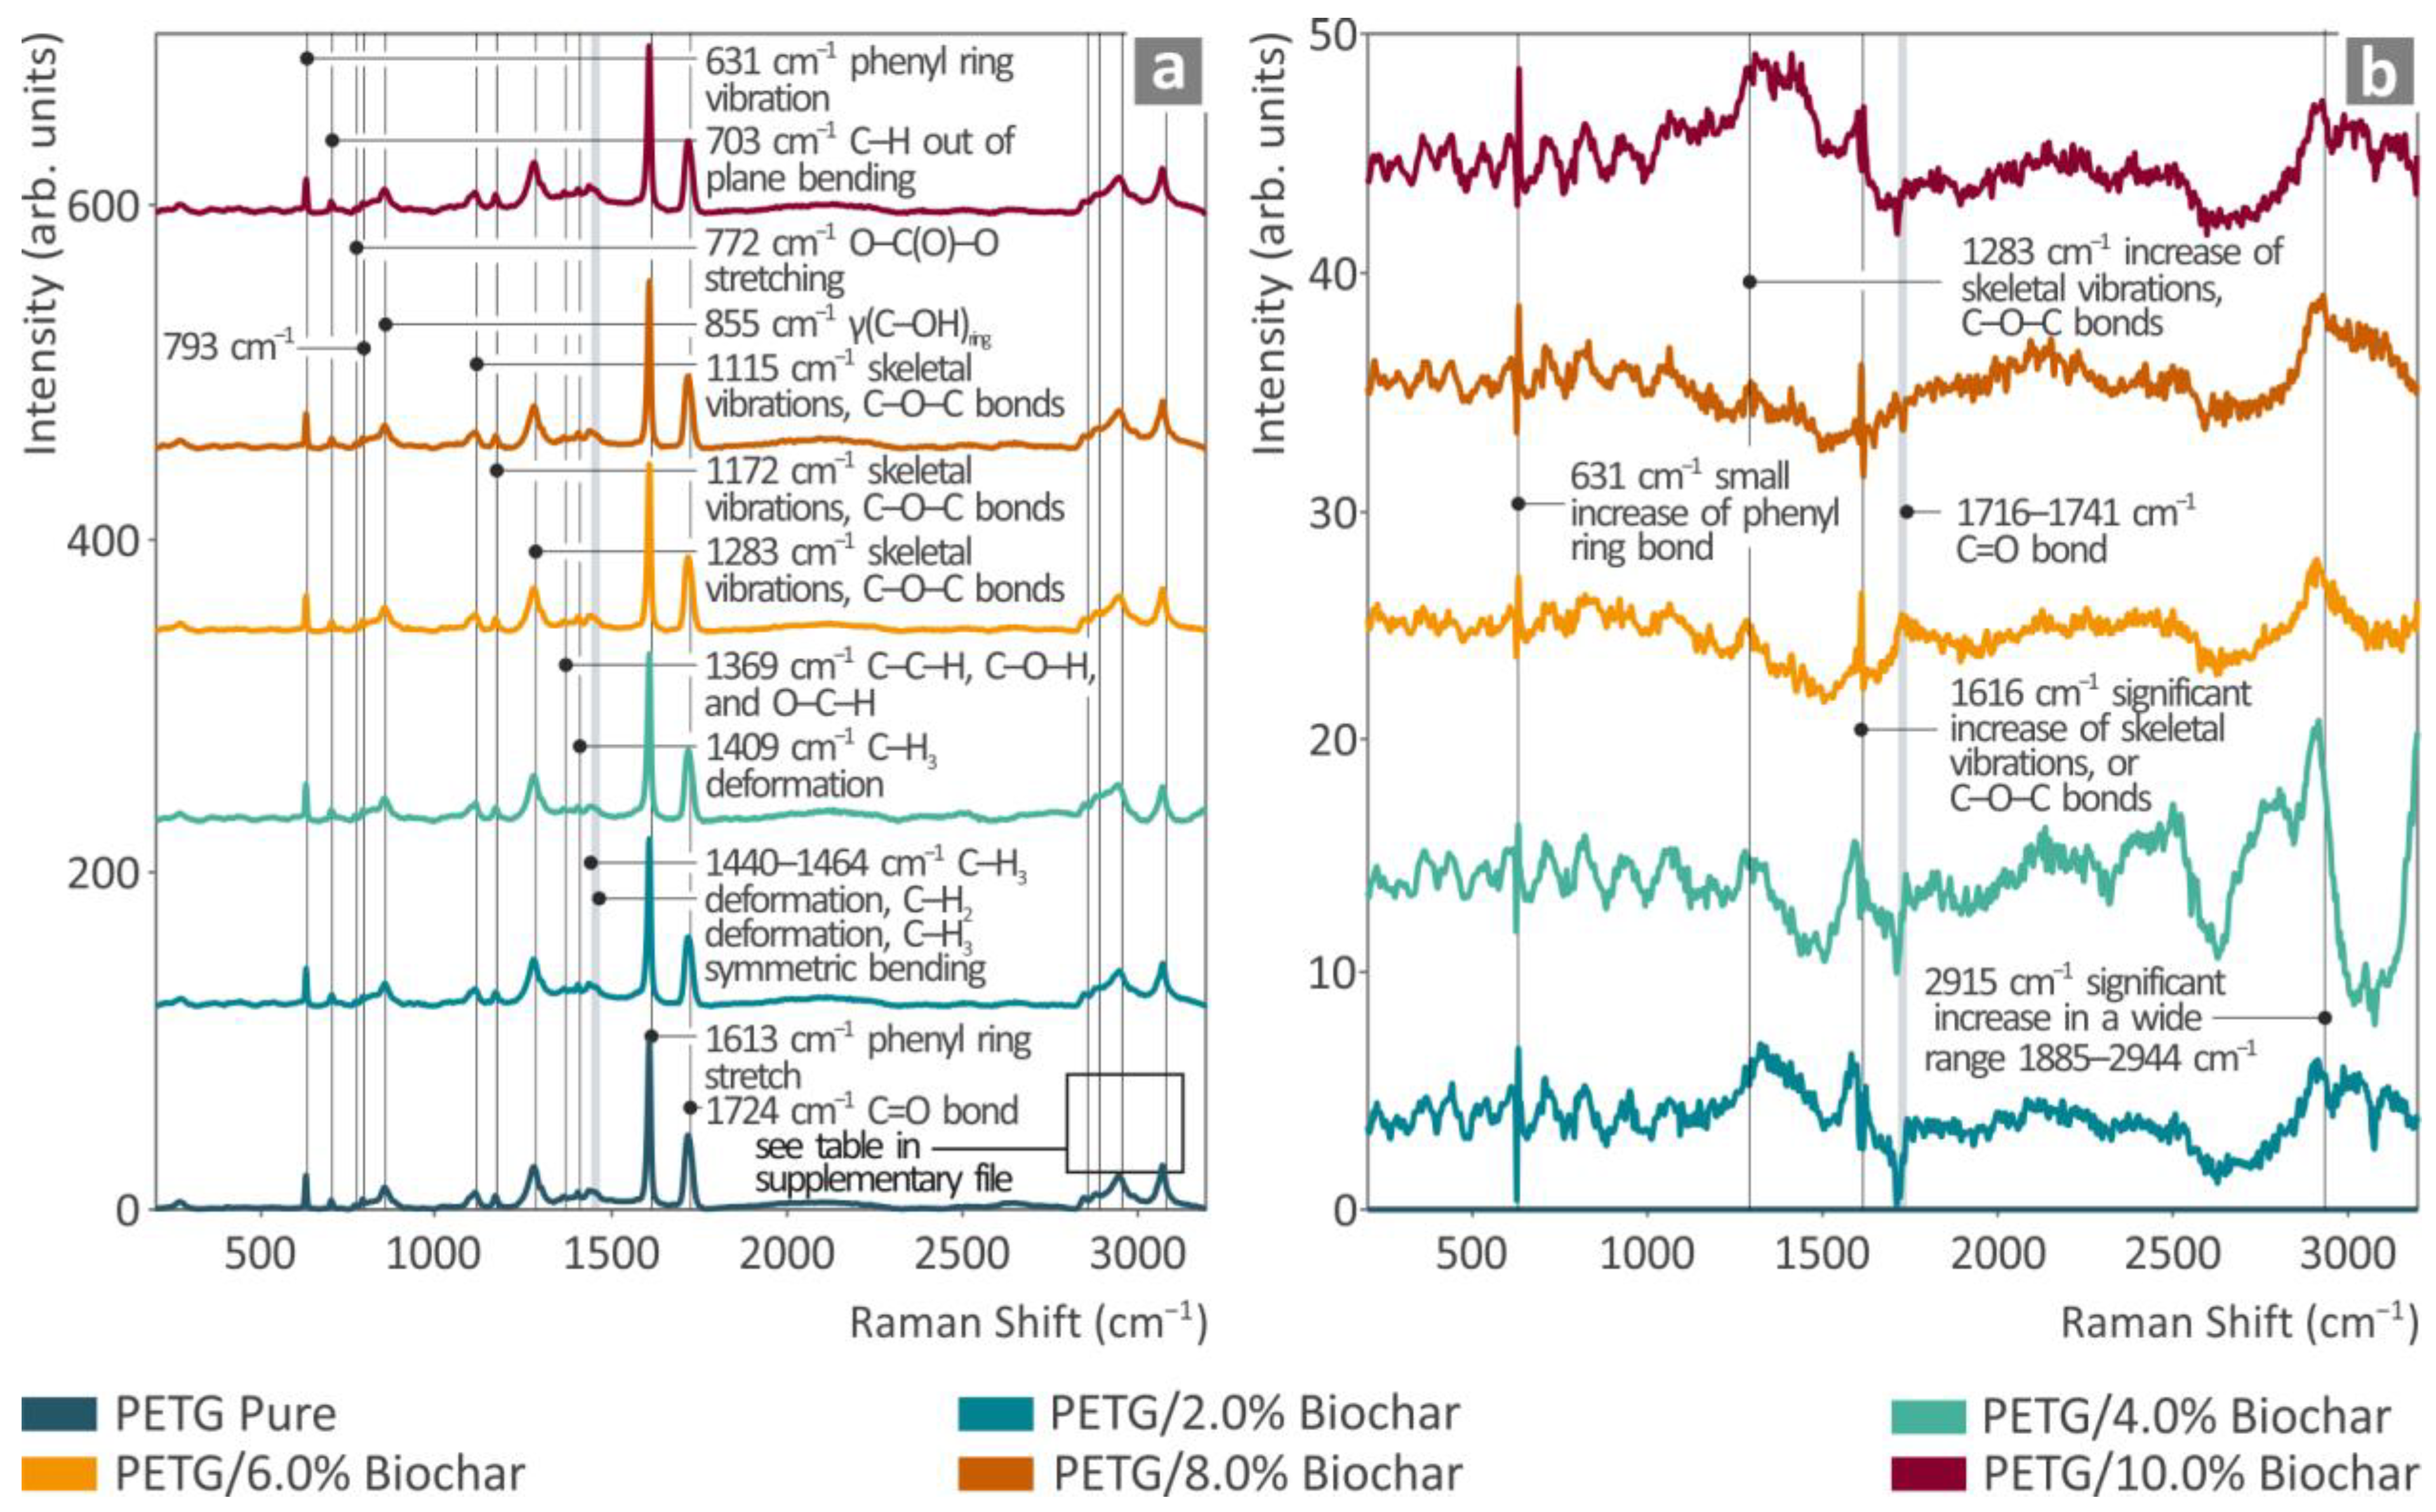
3.2. Raman Spectroscopy

Figure 4 presents Raman spectroscopy data comparing pure PETG with PETG/biochar composites containing different concentrations of biochar (2.0%, 4.0%, 6.0%, 8.0%, and 10.0% per weight). Panel (a) shows the full range Raman spectra, indicating the presence of various functional groups and molecular vibrations. The spectra reveal several characteristic peaks. At 631 cm−1, there is a phenyl ring vibration, while at 703 cm−1 a C-H out-of-plane bending can be observed. The peak at 772 cm−1 corresponds to O-C(O)-O stretching. At 855 cm−1, Y(C=O) skeletal vibrations and C=C bonds are visible. The region around 1115 cm−1 shows skeletal vibrations and C-O-C bonds, while at 1283 cm−1 there are additional skeletal vibrations and C-O-C bonds. The spectra also exhibit peaks at 1369 cm−1, corresponding to the deformations of C-H, C-O-H, and O-H bonds. Additionally, peaks are observed between 1440 and1464 cm−1, which are attributed to C-H deformation and CH2 symmetric bending. The phenyl ring stretch appears at 1613 cm−1, and the C=O bond at 1724 cm−1.
Panel (b) zooms into specific regions of interest, showing notable changes in peak intensities and positions. At 631 cm−1, there is a small increase in phenyl ring vibration. The peak observed at 1283 cm−1 suggests an enhancement in skeletal vibrations as well as C-O-C bond activity. A significant increase in skeletal vibrations and C-O-C bonds is observed at 1616 cm−1. The C=O bond is noted between 1716–1741 cm−1, and a significant increase is seen in the wide range from 1885 to 2944 cm−1, particularly at 2915 cm−1.
The incorporation of biochar in PETG results in discernible alterations in the Raman spectra of PETG Pure, as depicted in Figure 4b. Variations in the intensity of the Raman lines characterize these modifications. The incorporation of biochar into PETG resulted in an enhanced intensity of the phenyl ring bond at 631 cm−1, a steady increase in the C–O–C bonds at 1283 and 1616 cm−1, and a considerable broadening of the spectrum between 1885 and 2944 cm−1, with a prominent Raman peak at 2915 cm−1.
An erratic pattern was seen in the 1716–1741 cm−1 range, corresponding to C=O bonds. In contrast, the Raman spectra of PETG/biochar samples did not exhibit the presence of the two graphite bands, namely the D-band at 1350 cm−1 and the G-band at 1590 cm−1, which are often observed in biochar produced by high-temperature pyrolysis All the previously provided information is also compiled into table form and presented and documented with a bibliography in the Supplementary File of the study [89,90,91,92,93,94,95,96,97].

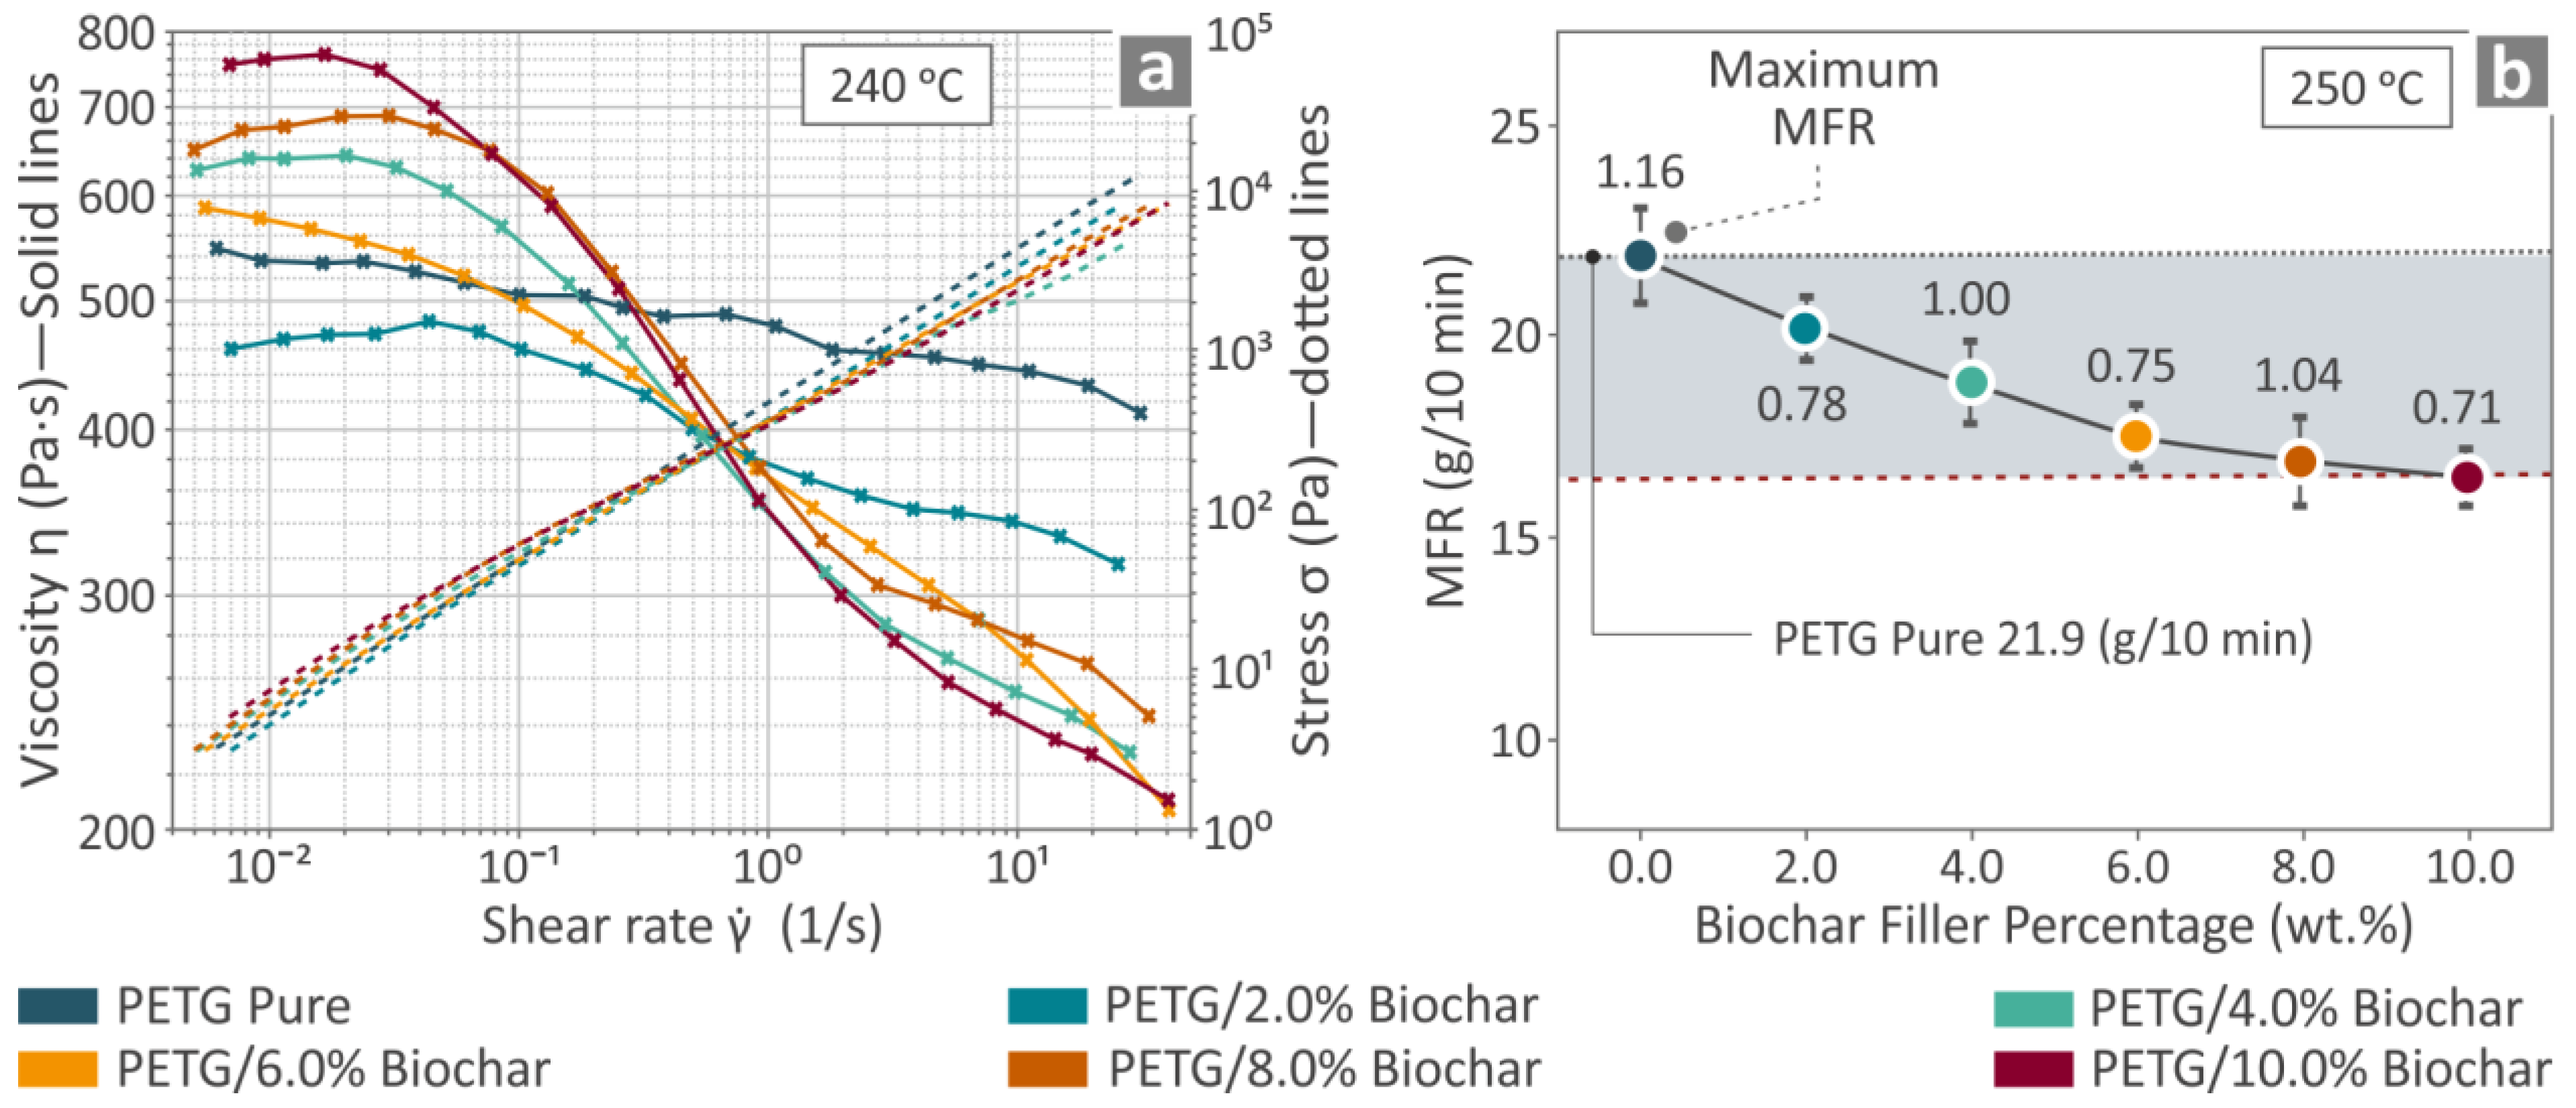
3.3. Viscosity and Melt Flow Rate Measurements

Part (a) of Figure 5 illustrates the viscosity and shear stress of PETG/biochar composites as functions of shear rate at 240 °C. Viscosity decreases with an increasing shear rate, demonstrating shear-thinning behavior. The incorporation of biochar modifies the viscosity and shear stress profiles, with higher biochar content typically resulting in increased viscosity at the lower shear rates, while at higher shear rates the higher the filler content the lower the viscosity. The previous observation can be explained by the fact that in the lower shear rates the polymer chains and the filler form an interconnected network because of physical interactions like van der Waals and filler polymer adhesion, resulting in higher overall viscosity. When the shear rates are increased those interconnected structures break down, resulting in dispersion of the filler, which introduces slippage phenomena between polymer chains and the hard filler, and thus in an overall lower viscosity. Part (b) illustrates the melt flow rate (MFR) of the composites at 250 °C. The MFR monotonically decreases as the biochar content rises. This trend suggests that biochar hinders the material flow.

3.4. Diameter Control and Physical Qualities of the PETG/Biochar Filament

During the manufacturing process, the diameters of all filaments were measured. Figure 6a shows the diameter measurements for both pure PETG and the PETG/biochar 4.0 wt.% composite, which consistently ranged between 1.65 and 1.85 mm. This is acceptable for MEX 3D printing in which the nominal diameter of the filament is 1.75 mm (±0.1 mm). Microscopy images (Figure 6a,c) revealed no defects on the filament surfaces (pure PETG and 4 wt.% compound). Figure 6b illustrates the tensile strength of pure PETG compared to all PETG/biochar filaments, while Figure 6d depicts their modulus of elasticity. Notably, the addition of 6.0 wt.% biochar to PETG resulted in a 13.3% increase in tensile strength. Furthermore, the tensile modulus of elasticity noted a 10.4% improvement.

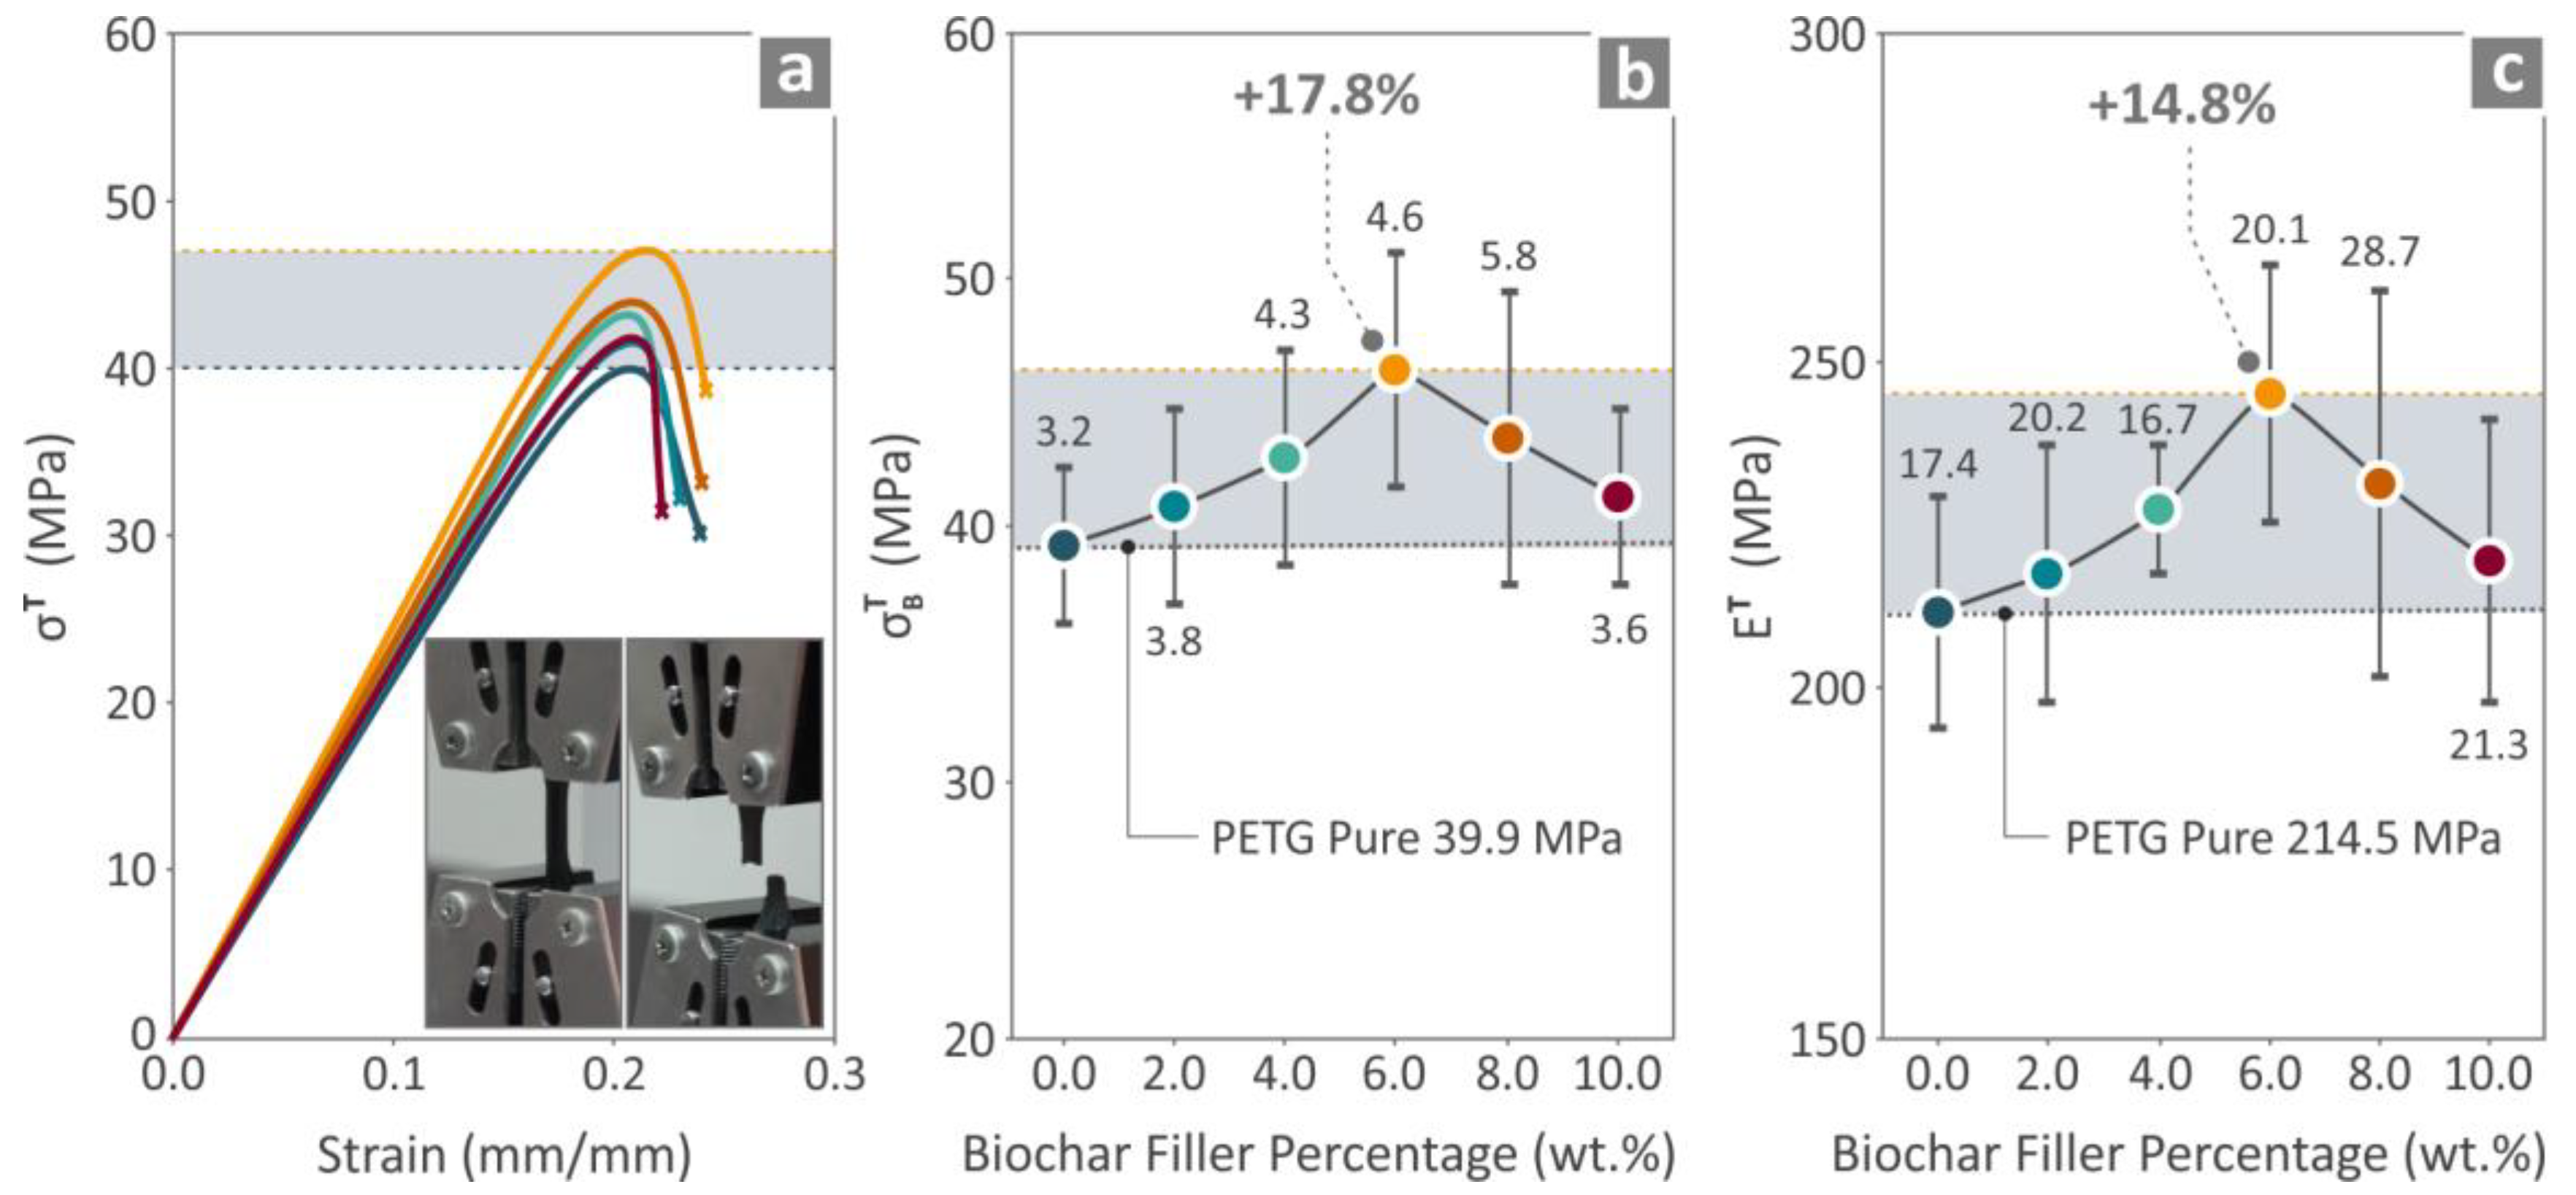
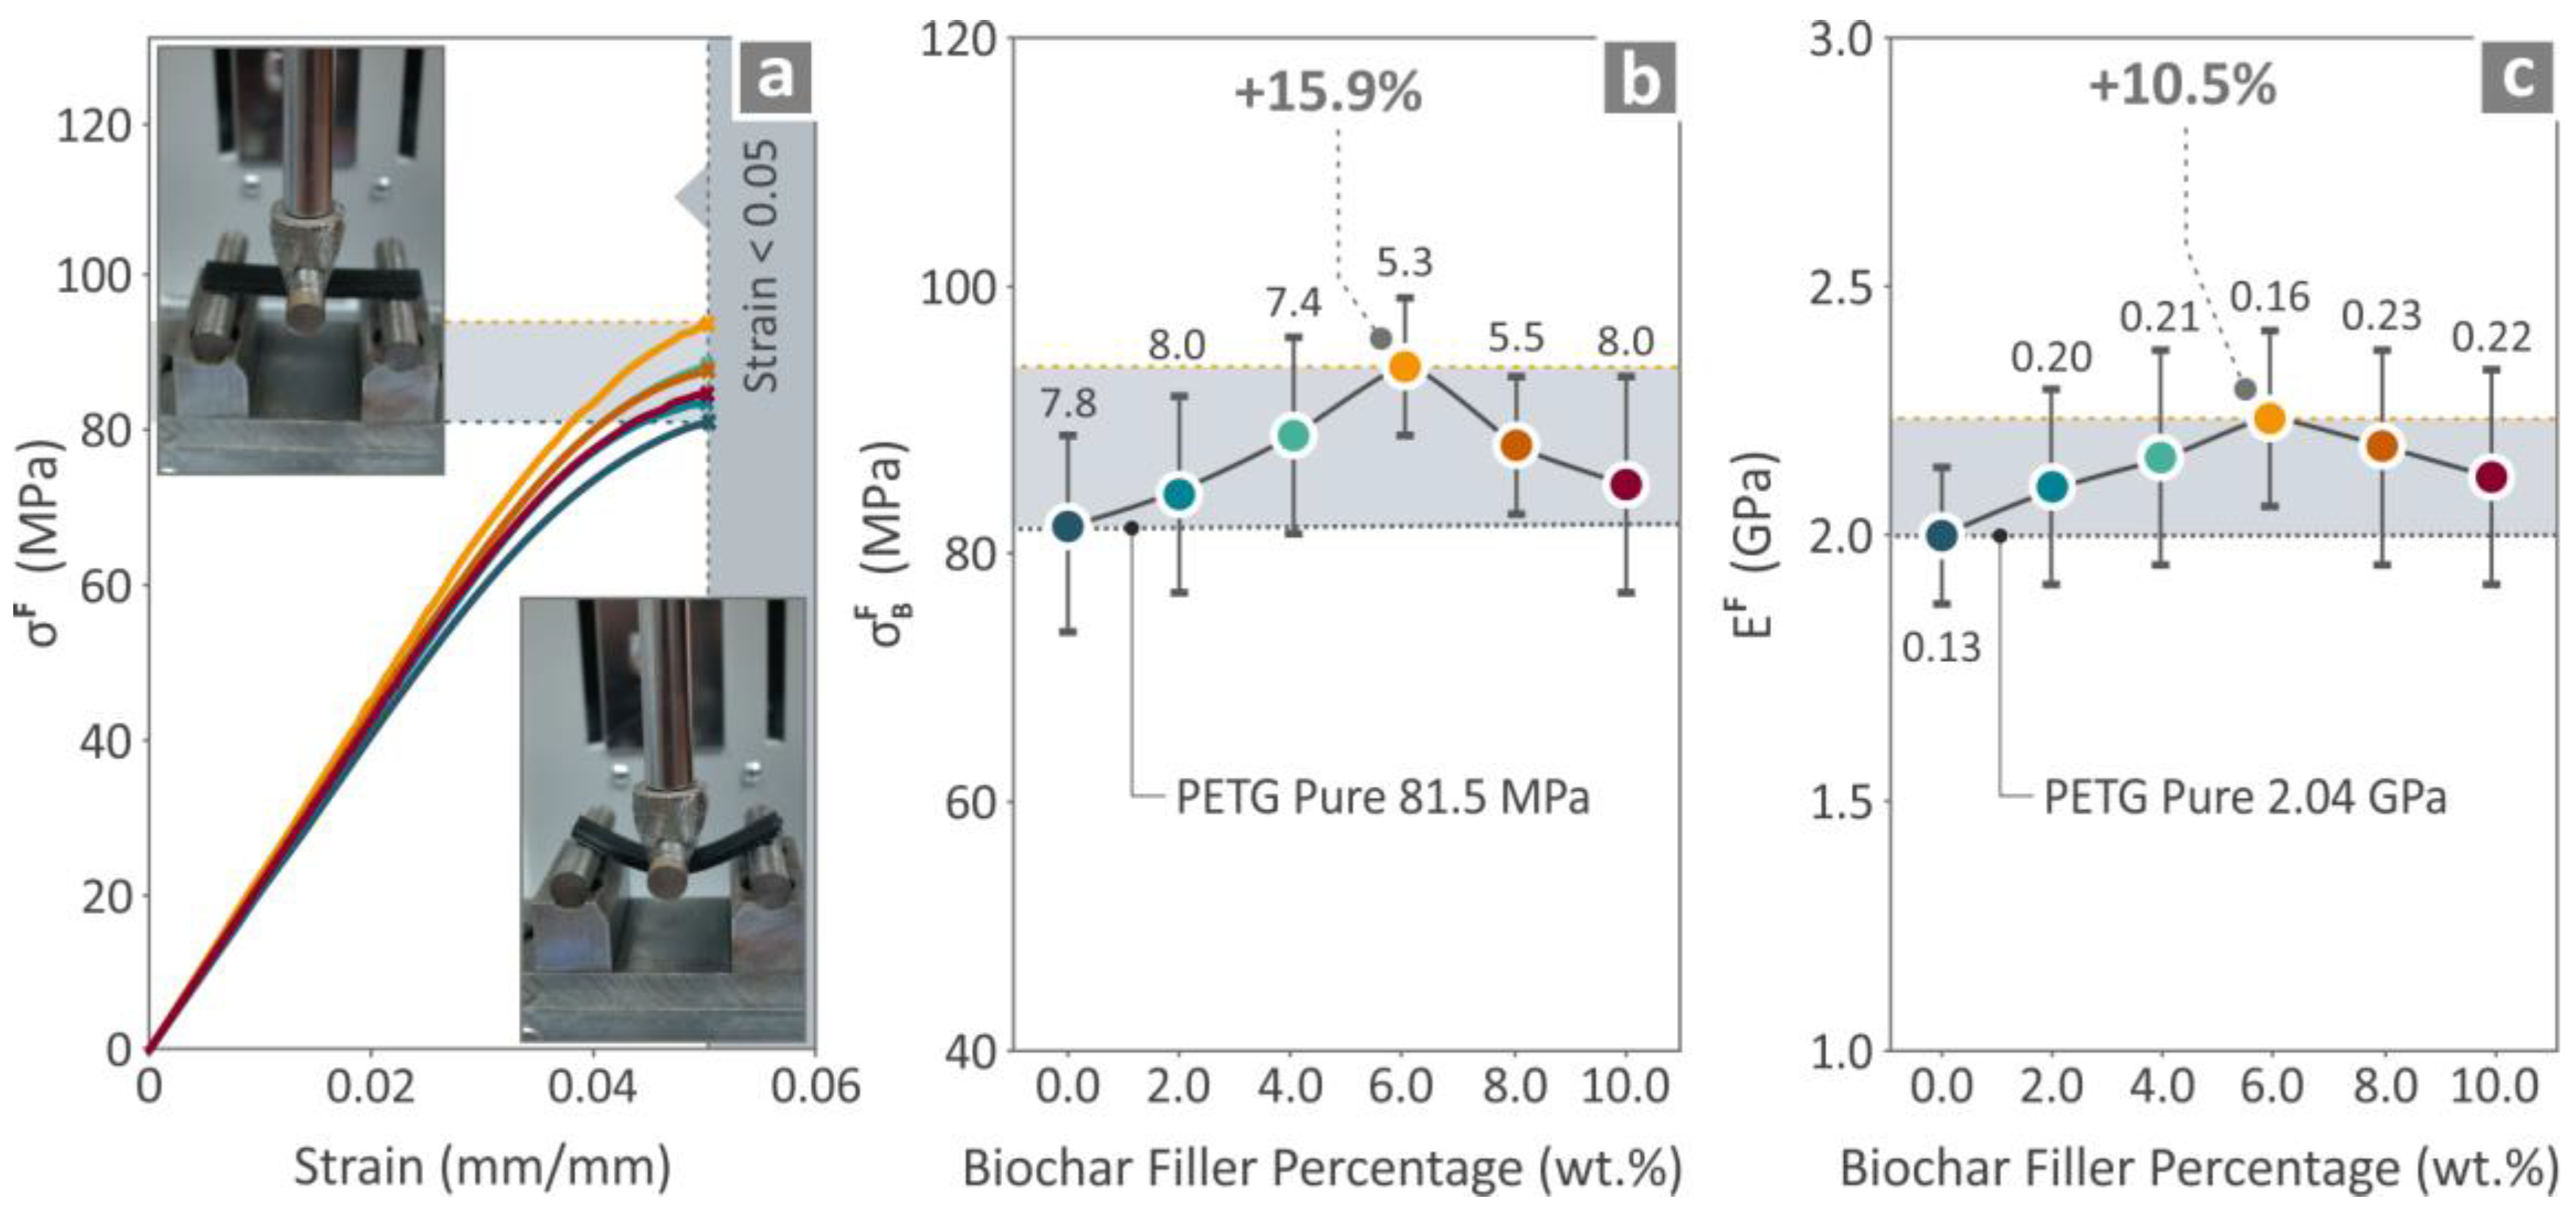
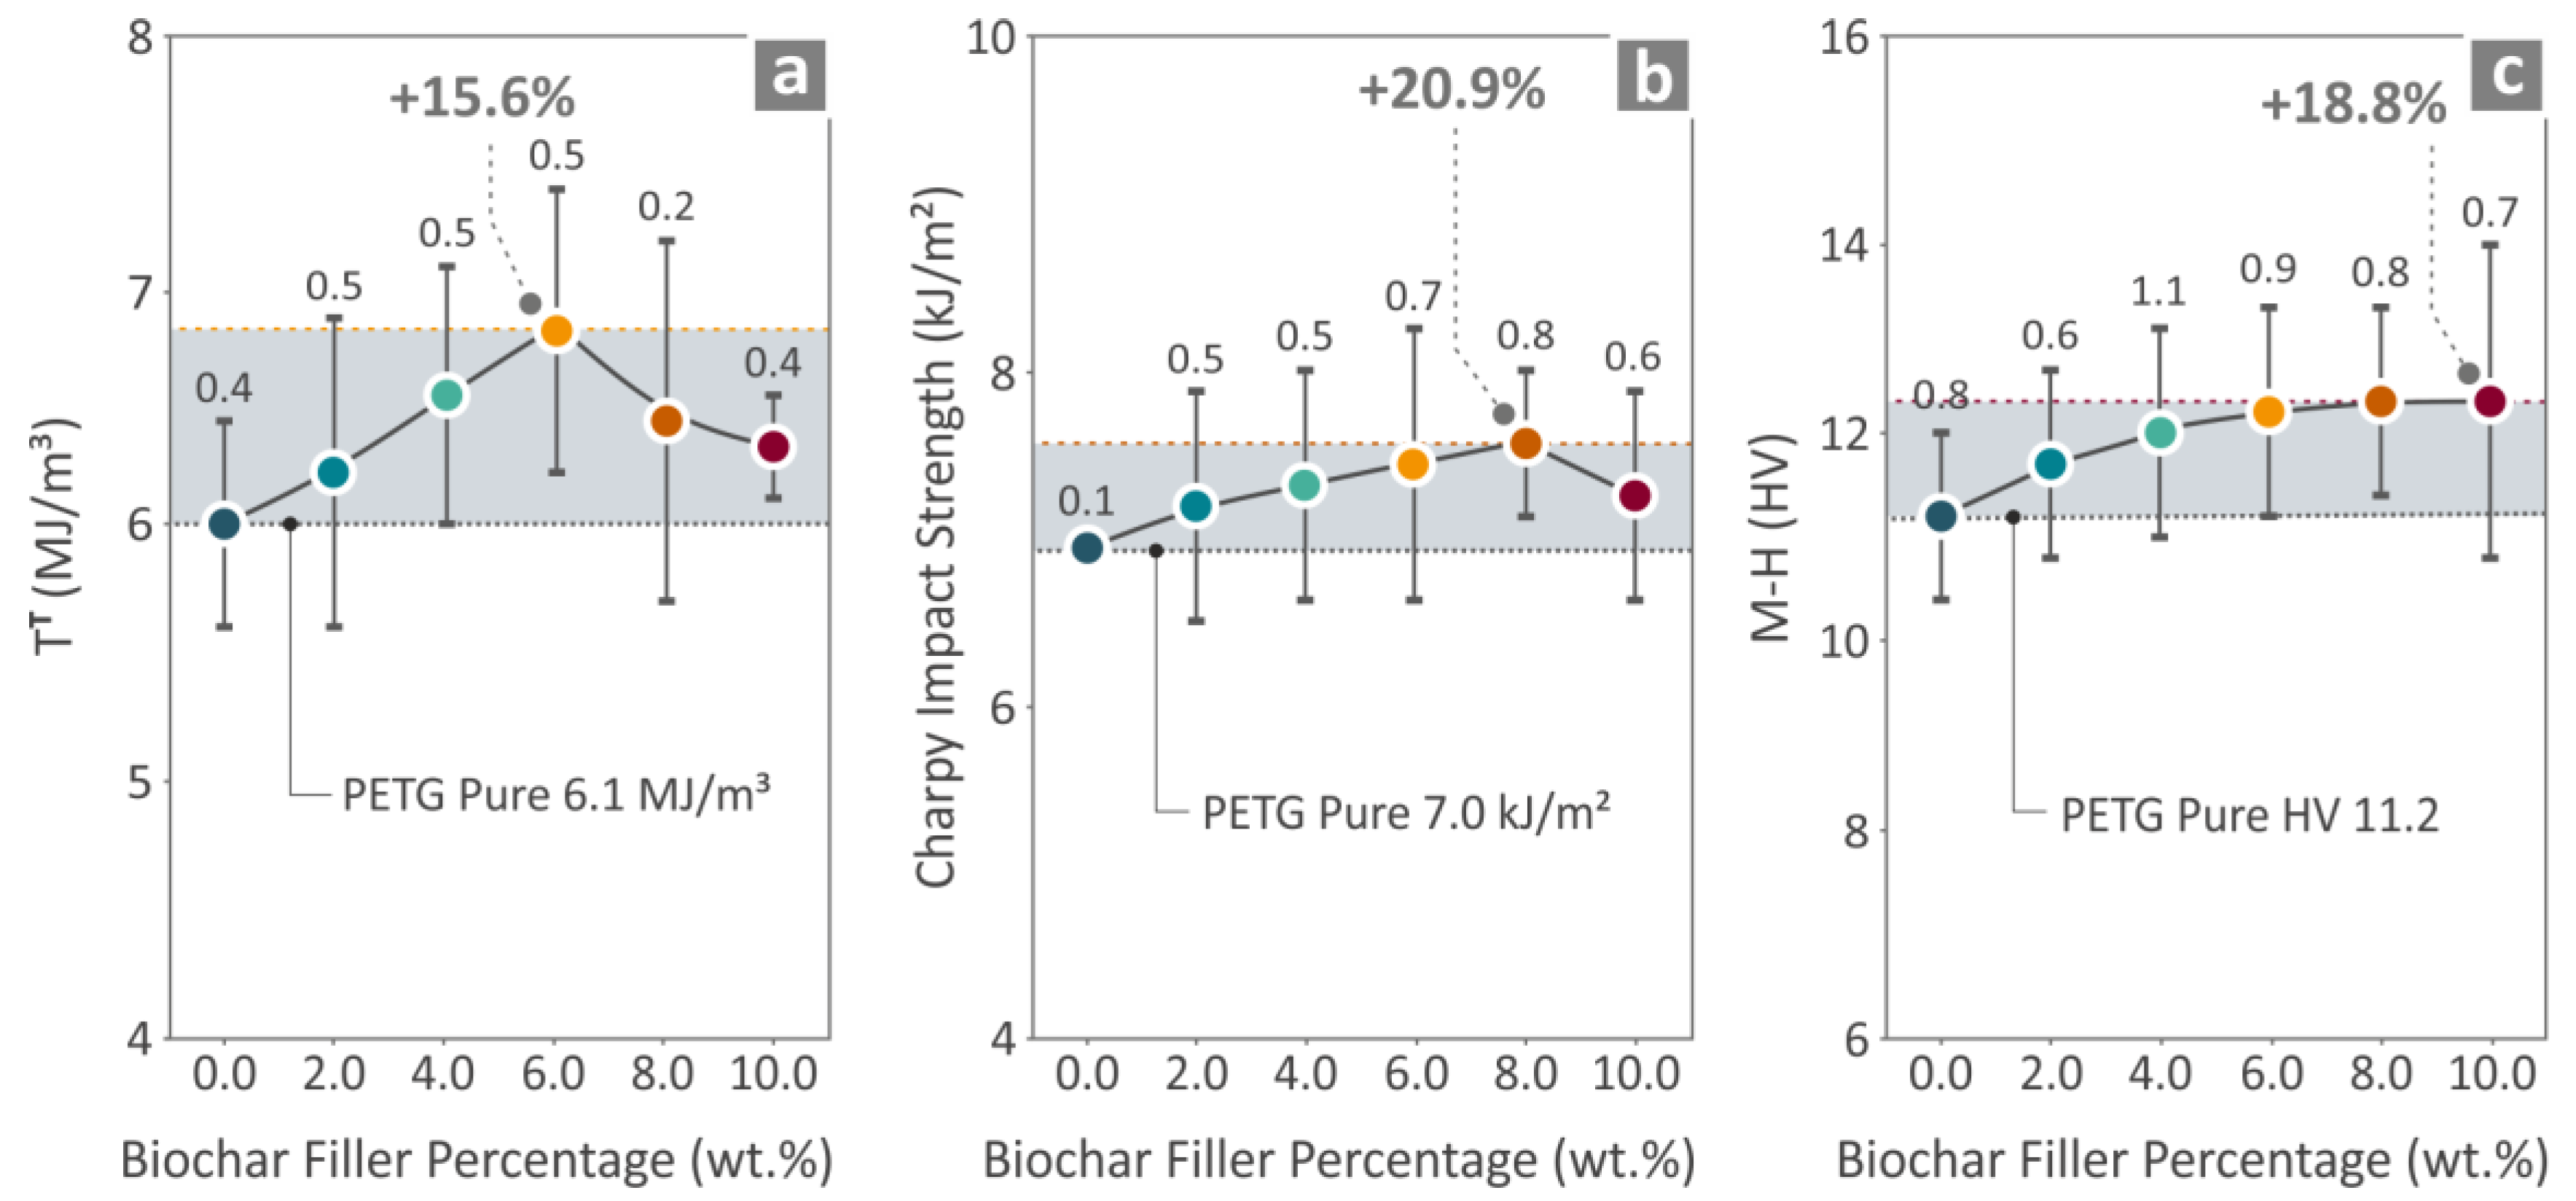
3.5. Mechanical Testing of Printed Specimens

Figure 7, Figure 8 and Figure 9 illustrate the impact of different biochar filler percentages on the mechanical characteristics of PETG/biochar composites. The stress–strain curves in Figure 7a illustrate that the strength of the composites in the tensile experiment improved as the biochar content increased, reaching the optimum value at a biochar loading of 6 wt.%. Figure 7b demonstrates that the tensile strength ( σ B T ) experienced a 17.8% increase when the biochar content reached 6.0 wt.%, compared to the baseline value of 39.9 MPa for pure PETG. Figure 7c shows that the tensile modulus (ET) improved, with a maximum increase of 14.8% at 6.0 wt.% biochar. This is compared to the baseline value of 214.5 MPa for pure PETG. The differences in tensile strength and elastic modulus can be smaller if the uncertainty of the measurement is taken into account; still, the mean values calculated show a clear reinforcement effect by the addition of the biochar particles in the PETG matrix.
Figure 8a illustrates the relationship between flexural stress and strain, demonstrating that the flexural strength improved as the biochar concentration increased. This effect is particularly significant at low levels of strain. Figure 8b provides a measurement of the flexural strength ( σ B F ), showing a notable 15.9% enhancement at a biochar concentration of 6.0 wt.% compared to the baseline of pure PETG, which has a flexural strength of 81.5 MPa. Figure 8c demonstrates the flexural modulus (EF), which, for PETG/6 wt.% biochar, reached a 10.5% enhancement.
Part (a) of Figure 9 presents the toughness of PETG/biochar composites in the tensile test, indicating a 15.6% improvement at 6.0 wt.% biochar content compared with neat PETG. Part (b) presents the Charpy impact strength, which increased by 20.9% at 8.0 wt.% biochar content, suggesting enhanced resistance to impact loading. Part (c) illustrates the microhardness of the composites, with an 18.8% increase observed at 10 wt.% biochar content, indicating greater surface hardness.

3.6. SEM Analysis

Figure 10 illustrates the SEM images and graphs and mapping images acquired by energy-dispersive X-ray spectroscopy (EDS) of the biochar particles. The SEM images correspond to the views of the particles at different magnifications. Additionally, elemental mapping (d) demonstrates the spatial distribution of carbon, oxygen, potassium, and calcium in the composite, indicating a homogeneous distribution. The EDS spectrum (e) again shows carbon and oxygen as the major components of the composite. The percentage elemental composition of the spectrum is reflected in a table adjoining, where the mass and atomic percentage are stated in detail. The carbon peak is the greatest, as supposed, due to the carbonaceous nature of biochar. The mass percentage of carbon in the hardwood biochar was comparable to values reported in the literature [98].
Figure 11 presents SEM illustrations of the lateral and fracture regions for PETG composites with 4.0%, 8.0% and 10% biochar content per weight at various magnifications. Parts (a, d and g) display the morphology of the 4.0% compound, while panels (b, e and h) and (c, f and i) show the morphologies of 8.0% and 10.0% biochar composites, respectively. At 150× magnification, the vertical surface views (a–c) reveal an excellent layer structure in the 4.0% compound, which does not notably worsen by the introduction of the biochar particles in the PETG thermoplastic matrix. The cross-sectional views at 27× magnification (d–f) illustrate the internal structure and fracture patterns, showing how the biochar particles influence the fracture behavior of the samples. As the content of biochar particles increases, the fracture cross-section becomes more brittle, with the deformation being reduced. Finally, the views at 3000× magnification (g–i) provide insights into the microstructural features of the samples.
Figure 12 presents high magnification SEM illustrations to study the cross-section/fracture surface and lateral structure of PETG/biochar 6 wt.% composites. This is the compound with the highest overall mechanical performance. The lateral surface shows good layer fusion; still, the layers do not have a uniform shape and there are some defects visible. The remaining pictures are from the fracture surface at various magnifications, to observe the microstructure, possible crack initiation sites, and the interface between biochar and the polymer matrix. The structures shown are assumed to be biochar particles. EDS cannot verify this due to the fact that the polymer and the additive both have carbon as the main element. The lower magnification image (Figure 12d, 27×) shows a rather ductile fracture mechanism. Higher magnification pictures show regions with smoother surfaces in the microstructure and others with rough surfaces, which can be attributed to the part’s failure in the tensile experiment.

4. Discussion

Biochar-filled PETG matrices hold the potential to enhance the mechanical, thermal, and rheological responses of 3D-printed items based on PETG, improving the performance of the applications for which the polymer is suitable. The entire process, depicted in Figure 1, shows that proper preparation of materials, precise extrusion, and thorough testing contribute to the production of high-quality PETG/biochar filaments. This approach guarantees that the composite filaments conform to several critical properties regarding mechanical performance and printability, which are vital for their use in different industrial sectors.
Figure 2 shows that there is a need to follow consistent printing parameters and dimensions of the specimen in order to obtain reproducible mechanical testing results. Having fixed printing conditions enables one to be assured that any property differences observed result from a difference in biochar content rather than other experimental parameters. The result obtained for PETG/biochar composite in this work can therefore be compared with other works that followed ASTM standards in their tests of the mechanical properties of the material. In this regard, a study [81] has been conducted in agreement with the current approach, since the authors identified that the mechanical properties of PP/biochar composites can only be improved through the use of constant parameters.
The SEM images in Figure 10 illustrate the biochar particle size and shape. EDS depicted the spreading of the carbon element in the region of observation. Biochar is a high carbon content material, and this was verified in these observations. On the other hand, owing to the carbon presence in biochar, it is not possible to employ EDS for the evaluation of the particle distribution in the composites since the polymeric matrices also contain carbon, so no safe results can be derived. The SEM outcomes corroborate a study [79] that showed that biochar strengthened the mechanical properties of ABS composites by increasing flexural and tensile strength due to proper dispersion.
The thermogravimetric analysis of the samples is depicted in Figure 3; it shows that the incorporation of biochar insignificantly affects the thermal stability of PETG composites. The TGA data present higher residual weight at 550 °C with a higher biochar loading due to the thermally stable nature of the biochar, which is the expected outcome, and the residual mass agrees with the content of the biochar particles in the compounds. From the DSC analysis, it can be seen that the Tg has slightly decreased with the increase in biochar content, which indicates changes in the polymer chain mobility. These findings are consistent with earlier work [80], which argued that biochar incorporation enhanced the thermal stability of HDPE composites, which demonstrated its potential for use as a thermoplastic matrix reinforcement.
Figure 7 and Figure 8 showed the mechanical properties of the PETG compounds where the incorporation of the biochar improved the flexural and tensile strength. The highest outcome was obtained at 6.0% per weight biochar incorporation; hence, this is the content that can be recommended in this case. Work carried out in 2023 [99], showed an enhancement in tensile and flexural properties, and this is due to the correct filler percentage that enhances the mechanical characteristics of 3DP items.
The impact resistance and Vickers microhardness, depicted in Figure 9, also support findings on the positive modification of biochar in the composite. Strengthening in toughness, impact strength, and microhardness proves that biochar improves the overall strength and sturdiness of PETG composites. These improvements are critical for applications where there is a need for high mechanical strength, such as in lightweight structures [100] and in medical applications. This observation is in accordance with Sunder and Sahithi (2023) [101], who showed that biochar enhances the mechanical characteristics of PETG and carbon fiber/PETG composites.
Figure 11 and Figure 12 present SEM illustrations of the fracture regions and microstructure of PETG/biochar composites. These images demonstrate that biochar influences the fracture surface topography, enhancing the fracture energy and the material’s ability to delay crack propagation. These findings align with Egan (2023) [102], who emphasized that uniform filler distribution is essential for improved mechanical properties in polymer composites.
As a pictorial summary, the radar charts in Figure 13 illustrate the enhancements in mechanical properties resulting from biochar addition. The mechanical properties and processability of biochar are consistent with Wang (2021) [103], who reported similar improvements in the mechanical characteristics of epoxy/3D printing resin hybrid composites.
Incorporating biochar into PETG matrices significantly enhanced the mechanical properties of the resulting materials, making them suitable for various applications in additive manufacturing. The thermal properties were not notably affected, while the rheological properties were altered, with changes in both the viscosity and the MFR, which were lowered by the rise of biochar particle content in the compounds. The decrease in 3D printing structure quality depicted on the SEM images of the lateral surfaces of the samples can be attributed to this MFR decrease. To overcome such changes in the flow behavior of the composites, the 3D printing parameters should be optimized for each loading. This was not applied herein, to have comparable results between the various loadings. Still, this is expected to further improve the reinforcement efficiency of the biochar particles in the compounds.
Thus, this study and other research highlight the potential of biochar as an eco-friendly reinforcing material. Future research should focus on optimizing biochar content and processing conditions to further enhance the properties and potential applications of these composites. As mentioned above, biochar has been incorporated in different polymeric matrices. Table 1 presents a comparison of the improvement in the mechanical properties achieved by biochar in different polymeric matrices in MEX 3DP. As shown, the improvement in the PETG is slightly lower than in the other polymeric matrices; still, the differences are not that high. Also, the biochar content that achieves the best results overall is similar between the various polymeric materials.

4.1. Limitations

Despite the promising results, there are some limitations to the present study, which could be targeted for investigation in further research. First, the biochar concentrations studied were limited within a range of 2.0 to 10.0%, which, while sufficient to gain important information on the optimal biochar content in improving properties for PETG-based composites, might not include the whole range of potential biochar performance effects. For example, saturation of the biochar in the matrices might not lead to improvement in the mechanical performance, but, due to the high carbon content, electric properties can be induced in the matrix, leading to multi-functional compounds.
Additionally, only one biochar material was tested in the research. Thus, the effects related to other biochar sources and properties remain unknown. Knowing how different kinds of biochar, produced from different feedstocks and under various pyrolysis conditions, interact with PETG could provide comprehensive data on the capabilities of this material. Herein, a laborious effort with fourteen different tests was carried out to document and characterize the specific composites developed in the research. More than 120 samples were prepared and tested, while the number of tests is significantly higher as, for some tests, such as the rheology tests, no additional samples were manufactured. As biochar can be sourced from various sources in nature, each one is expected to have a different response when added to a compound to form a composite material. Therefore, studying other types of biochar produced from various feedstocks and under different pyrolysis conditions, although it would be very interesting, exceeds the volume of one research work. This can be the subject of future work, in which different biochar can be tested along with different polymeric matrices. Each matrix/biochar combination would require an extensive number of tests, to evaluate its properties and performance and to fully characterize the respective composites.
To determine the biochar loading in the composites, the content was gradually increased, samples were made and tested, and the increase in the loading stopped when the mechanical properties started to decline. This was an indication that the biochar saturates in the composites [104,105]. Furthermore, higher loadings were more difficult to process with the specific thermomechanical method followed for the preparation of the composites. Printability issues occurred and the quality of the filament and the samples was not good.
Furthermore, the mechanical and thermal tests are conducted under controlled laboratory conditions that do not entirely reproduce the natural environment, where a change in temperature and humidity, among other factors, may cause performance variations in the composites. Still, when characterizing a new composite, the conditions of the experiments are in accordance with the instructions of the respective standards (which were followed in the current research). The effect of weather conditions is an interesting subject and can be the subject of future work. Usually, such investigations follow already characterized and documented composites in the phase of their commercialization process. Also, there were no long-term performance tests to evaluate their environmental stability; it is unknown how these composites will perform in the long run under varying conditions. Long-term durability data are lacking, and consequently the possibility of predicting the lifetime and reliability of the PETG/biochar composites under practical conditions is difficult. Field-testing such materials is necessary to prove their efficiency and robustness under various working conditions.
The study was restricted to one form of extrusion and 3D printing process, which may not have been representative of the full scope of potential additive manufacturing methods. Other processing techniques, like injection molding or different additive manufacturing technologies, can lead to different material properties and performance. The extrusion conditions, such as temperature and speed, have been predefined for this specific setup but could, in principle, vary for the other techniques. Investigating the effects of different manufacturing processes on the composites is essential in understanding how biochar-enhanced PETG could be best applied to various industrial applications. Still, each manufacturing method requires a different type of approach for the preparation of the composites, and the results cannot be directly correlated. Again, a full set of experiments would be required. For example, in the stereolithography method, the addition of biochar in the liquid resin makes the compound black, and it makes the photopolymerization process very difficult or impossible to achieve, at least for high biochar loadings, in which the building of the parts is not possible [78].
Finally, the feasibility of large-scale production was not considered, which is crucial for the commercial potential of PETG/biochar composites. Though the study successfully showed the enhancements achievable with biochar incorporation, scaling the process to the industrial level poses extra challenges. Some of these factors that require consideration include cost effectiveness, consistency of material properties, and compatibility within existing manufacturing infrastructure. Tackling such challenges may provide a more straightforward path toward realizing the benefits of PETG/biochar composites in real-life applications so that the benefits already studied at the laboratory level can be duplicated and sustained in commercial operations. Certainly, focused future research must be developed in these areas to ascertain a thorough understanding of the benefits and challenges associated with biochar-infused materials.

4.2. Suggestions for Future Research

Future work needs to extend the scope of the biochar concentrations studied to realize the full potential of biochar as a reinforcing agent in PETG composites. While this research was limited to concentrations of 2.0% to 10.0% per weight, revealing higher concentrations could show supplementary improvement. Further studies could be conducted with lower dosages to determine the minimum effective dosage for significant improvements and optimize the composite material’s cost-effectiveness. Furthermore, in future work, the importance of the composites’ preparation parameters can be evaluated by testing them as control parameters with different levels and conducting respective optimizations and analysis.
Second, the effects of using various biochar types originating from different organic feedstocks and through other pyrolysis conditions need to be explored. Each kind of biochar will have unique properties that may influence the performance of the PETG composites differently. By comparing biochar from different sources, researchers will be able to identify biochar types that provide the best balance of mechanical and thermal enhancements. This knowledge would be crucial in tailoring composite materials to specific applications and industries based on desired properties.
The long-term performance and environmental stability of PETG/biochar composites should also be a focus of future research. These materials must be studied for their properties under prolonged exposure to environmental conditions such as temperature variation, humidity, UV light, and mechanical stresses. This information would provide insights into the durability and reliability of such composites in practical use and whether they can satisfactorily perform with the desired service life. Additionally, the studies will establish the sustainability credentials regarding the biodegradability and environmental impact of the composites. Understanding how these composites perform over extended periods and in real-world environments is critical for their practical application, especially in outdoor or high-stress settings.
Another critical area of future research will be finding different ways of manufacturing and processing other than the single extrusion and 3D printing processes adopted in this study. A detailed survey of how various additive manufacturing technologies—such as selective laser sintering or stereolithography—affect the properties of PETG/biochar composites could provide essential information for optimizing the manufacturing process. Further investigation of traditional manufacturing methods, such as injection molding, can help understand additional benefits and constraints in scaling up production for industrial use.
The large-scale production feasibility of PETG/biochar composite for commercial application in any sector must be addressed in future research. This will include studying the economic aspects of raw materials and production processes, cost studies, and market demand for biochar-enhanced materials. Strategies for integrating these composites into existing manufacturing systems, ensuring consistency in quality and performance at scale, will be crucial for their success. Collaborating with industrial partners could help transition laboratory research into real-world applications, directly contributing to the broader adoption of sustainable materials in various industries.

5. Conclusions

Adding biochar in the PETG matrix improved the mechanical, thermal, and rheological response of the 3DP composites. This work reported that the optimum content of biochar for maximum flexural, tensile, and impact strength, and thermal stability was determined at 6.0% per weight. SEM confirmed the uniform distribution of the biochar within the PETG matrix. This finding agrees with other related works, which pointed out the potential of biochar as an excellent eco-friendly reinforcing agent in AM. The enhancement achieved in this study indicated the value of biochar for material performance improvement in various uses. All the above-mentioned improved properties of PETG/biochar composites have potential applications to be used in many different industrial fields, such as automotive, aerospace, and environmental remediation. The improved mechanical strength and thermal stability render these composites fit for applications that require materials to stand under elevated stress and temperature variations. Moreover, the eco-friendly nature of biochar results from its being produced from organic waste materials through pyrolysis. The PETG/biochar composites recycle waste materials and sequester carbon in alignment with global efforts toward green manufacturing and reducing reliance on fossil fuels.
The study indicates a way to follow more sustainable paths in industrial practices by developing biochar-enhanced materials. The methodology of introducing biochar into PETG is relatively simple and can be scaled up to the industrial level. Extrusion of biochar-containing filaments is applicable to obtain high-performance composite material that may further be used in 3D printing. This makes the material properties much better while using waste products, thereby adding to the overall sustainability of the approach. Scaling up this approach can, therefore, be envisioned for its large-scale adoption in diverse sectors, each one contributing to a green alternative for plastics and composites. The findings of this study may just be the tip of the iceberg toward further practical applications and benefits from biochar in additive manufacturing.
Despite the promising results, some of the limitations are the loading of biochar, only up to 10% per weight, the fact that the long-term performance of composites and their environmental stability was not evaluated, and that a change of biochar type or other processing techniques will be used for further improvement of the properties and applications of such composites. Future studies should also focus on the feasibility of large-scale production to fully realize the potential of PETG/biochar composites in industrial applications. Overcoming these limitations will give a more complete understanding of the benefits and challenges presented by biochar-infused materials. In the future, a broader concentration and type of biochar should be used to establish the full potential of biochar as a reinforcing agent. However, it would be the study of these composites for their long-term durability and environmental impacts under diversified conditions that will have relevance for practical applications. More research into different processing methodologies and printing techniques could pave the way for newly optimized performances of PETG/biochar composites. The possibility of large-scale production should also be explored for these materials to be produced efficiently and cost-effectively. In conclusion, R&D activities on biochar-enhanced composites continue to bear fruit in the development of sustainable materials.

Supplementary Materials

The following supporting information can be downloaded at https://www.mdpi.com/article/10.3390/jmmp9020068/s1: Table S1. Significant Raman peaks in the pure PETG spectrum and their related assignments; Table S2. Significant Raman peak differences between the spectra of pure PETG and PETG/biochar.

Author Contributions

N.B.: formal analysis, writing—original draft preparation; E.M.: supervision, methodology; V.P.: visualization, validation, and data curation; D.K.: writing—original draft preparation, investigation, and methodology; N.M. (Nikolaos Michailidis): supervision, methodology, and validation; A.A.: data curation, formal analysis, and visualization; N.M. (Nikolaos Mountakis): formal analysis, data curation, and visualization; M.P.: Investigation, validation, and writing—review and editing; N.V.: conceptualization, methodology, resources, supervision, and project administration. The manuscript was written using the contributions of all authors. All authors have read and agreed to the published version of the manuscript.

Funding

This research received no external funding.

Institutional Review Board Statement

Not applicable.

Informed Consent Statement

Not applicable.

Data Availability Statement

The raw/processed data required to reproduce these findings cannot be shared because of technical or time limitations.

Acknowledgments

The authors would like to thank the Institute of Electronic Structure and Laser of the Foundation for Research and Technology—Hellas (IESL-FORTH) and, in particular, Aleka Manousaki for taking the SEM images presented in this work and the Photonic-, Phononic-, and Meta-Materials Laboratory for sharing the Raman instrumentation.

Conflicts of Interest

The authors declare no conflicts of interest.

References

  1. Petrovic, V.; Vicente Haro Gonzalez, J.; Jordá Ferrando, O.; Delgado Gordillo, J.; Ramón Blasco Puchades, J.; Portolés Griñan, L. Additive Layered Manufacturing: Sectors of Industrial Application Shown through Case Studies. Int. J. Prod. Res. 2010, 49, 1061–1079. [Google Scholar] [CrossRef]
  2. Song, Y.; Yan, Y.; Zhang, R.; Xu, D.; Wang, F. Manufacture of the Die of an Automobile Deck Part Based on Rapid Prototyping and Rapid Tooling Technology. J. Mater. Process Technol. 2002, 120, 237–242. [Google Scholar] [CrossRef]
  3. Bacciaglia, A.; Ceruti, A.; Liverani, A. Towards Large Parts Manufacturing in Additive Technologies for Aerospace and Automotive Applications. Procedia Comput. Sci. 2022, 200, 1113–1124. [Google Scholar] [CrossRef]
  4. Mohanavel, V.; Ashraff Ali, K.S.; Ranganathan, K.; Allen Jeffrey, J.; Ravikumar, M.M.; Rajkumar, S. The Roles and Applications of Additive Manufacturing in the Aerospace and Automobile Sector. Mater. Today Proc. 2021, 47, 405–409. [Google Scholar] [CrossRef]
  5. Vasco, J.C. Additive Manufacturing for the Automotive Industry. In Additive Manufacturing; Elsevier: Amsterdam, The Netherlands, 2021; pp. 505–530. [Google Scholar]
  6. Froes, F.; Boyer, R. Additive Manufacturing for the Aerospace Industry; Elsevier: Amsterdam, The Netherlands, 2019. [Google Scholar]
  7. Schiller, G.J. Additive Manufacturing for Aerospace. In Proceedings of the 2015 IEEE Aerospace Conference, Big Sky, MT, USA, 7–14 March 2015; pp. 1–8. [Google Scholar]
  8. Kumar, L.J.; Nair, C.G.K. Current Trends of Additive Manufacturing in the Aerospace Industry. In Advances in 3D Printing and Additive Manufacturing Technologies; Springer Nature: Berlin/Heidelberg, Germany, 2016. [Google Scholar]
  9. Thomas, C.L.; Gaffney, T.M.; Kaza, S.; Lee, C.H. Rapid Prototyping of Large Scale Aerospace Structures. In Proceedings of the IEEE Aerospace Applications Conference Proceedings, Aspen, CO, USA, 3–9 February 1996; Volume 4. [Google Scholar]
  10. Najmon, J.C.; Raeisi, S.; Tovar, A. Review of Additive Manufacturing Technologies and Applications in the Aerospace Industry. In Additive Manufacturing for the Aerospace Industry; Elsevier: Amsterdam, The Netherlands, 2019. [Google Scholar]
  11. Tepylo, N.; Huang, X.; Patnaik, P.C. Laser-Based Additive Manufacturing Technologies for Aerospace Applications. Adv. Eng. Mater. 2019, 21, 1900617. [Google Scholar] [CrossRef]
  12. De Leon, A.C.; Chen, Q.; Palaganas, N.B.; Palaganas, J.O.; Manapat, J.; Advincula, R.C. High Performance Polymer Nanocomposites for Additive Manufacturing Applications. React. Funct. Polym. 2016, 103, 141–155. [Google Scholar] [CrossRef]
  13. Colorado, H.A.; Cardenas, C.A.; Gutierrez-Velazquez, E.I.; Escobedo, J.P.; Monteiro, S.N. Additive Manufacturing in Armor and Military Applications: Research, Materials, Processing Technologies, Perspectives, and Challenges. J. Mater. Res. Technol. 2023, 27, 3900–3913. [Google Scholar] [CrossRef]
  14. Busachi, A.; Erkoyuncu, J.; Colegrove, P.; Martina, F.; Watts, C.; Drake, R. A Review of Additive Manufacturing Technology and Cost Estimation Techniques for the Defence Sector. CIRP J. Manuf. Sci. Technol. 2017, 19, 117–128. [Google Scholar] [CrossRef]
  15. Goh, G.L.; Zhang, H.; Chong, T.H.; Yeong, W.Y. 3D Printing of Multilayered and Multimaterial Electronics: A Review. Adv. Electron. Mater. 2021, 7, 2100445. [Google Scholar] [CrossRef]
  16. Zhang, Z.; Yuan, X. Applications and Future of Automated and Additive Manufacturing for Power Electronics Components and Converters. IEEE J. Emerg. Sel. Top. Power Electron. 2022, 10, 4509–4525. [Google Scholar] [CrossRef]
  17. Chen, D.; Heyer, S.; Ibbotson, S.; Salonitis, K.; Steingrímsson, J.G.; Thiede, S. Direct Digital Manufacturing: Definition, Evolution, and Sustainability Implications. J. Clean. Prod. 2015, 107, 615–625. [Google Scholar] [CrossRef]
  18. Bogers, M.; Hadar, R.; Bilberg, A. Additive Manufacturing for Consumer-Centric Business Models: Implications for Supply Chains in Consumer Goods Manufacturing. Technol. Forecast. Soc. Change 2016, 102, 225–239. [Google Scholar] [CrossRef]
  19. Despeisse, M.; Ford, S. The Role of Additive Manufacturing in Improving Resource Efficiency and Sustainability. In Advances in Information and Communication Technology; Springer: Berlin/Heidelberg, Germany, 2015; Volume 460. [Google Scholar]
  20. Ford, S.; Despeisse, M. Additive Manufacturing and Sustainability: An Exploratory Study of the Advantages and Challenges. J. Clean. Prod. 2016, 137, 1573–1587. [Google Scholar] [CrossRef]
  21. Ma, J.; Harstvedt, J.D.; Dunaway, D.; Bian, L.; Jaradat, R. An Exploratory Investigation of Additively Manufactured Product Life Cycle Sustainability Assessment. J. Clean. Prod. 2018, 192, 55–70. [Google Scholar] [CrossRef]
  22. Huang, S.H.; Liu, P.; Mokasdar, A.; Hou, L. Additive Manufacturing and Its Societal Impact: A Literature Review. Int. J. Adv. Manuf. Technol. 2012, 67, 1191–1203. [Google Scholar] [CrossRef]
  23. Niaki, M.K.; Torabi, S.A.; Nonino, F. Why Manufacturers Adopt Additive Manufacturing Technologies: The Role of Sustainability. J. Clean. Prod. 2019, 222, 381–392. [Google Scholar] [CrossRef]
  24. Petrov, P.; Agzamova, D.; Pustovalov, V.; Zhikhareva, E.; Saprykin, B.; Chmutin, I.; Shmakova, N. Research into the Effect of the 3D-Printing Mode on Changing the Properties of PETG Transparent Plastic. ESAFORM 2021, 2021. [Google Scholar] [CrossRef]
  25. Bichu, Y.M.; Alwafi, A.; Liu, X.; Andrews, J.; Ludwig, B.; Bichu, A.Y.; Zou, B. Advances in Orthodontic Clear Aligner Materials. Bioact. Mater. 2022, 22, 384–403. [Google Scholar] [CrossRef]
  26. Vidakis, N.; Petousis, M.; Tzounis, L.; Grammatikos, S.A.; Porfyrakis, E.; Maniadi, A.; Mountakis, N. Sustainable Additive Manufacturing: Mechanical Response of Polyethylene Terephthalate Glycol over Multiple Recycling Processes. Materials 2021, 14, 1162. [Google Scholar] [CrossRef] [PubMed]
  27. Badia, J.D.; Strömberg, E.; Karlsson, S.; Ribes-Greus, A. The Role of Crystalline, Mobile Amorphous and Rigid Amorphous Fractions in the Performance of Recycled Poly (Ethylene Terephthalate) (PET). Polym. Degrad. Stab. 2012, 97, 98–107. [Google Scholar] [CrossRef]
  28. Li, B.; Zhang, X.; Zhang, Q.; Chen, F.; Fu, Q. Synergistic Enhancement in Tensile Strength and Ductility of ABS by Using Recycled PETG Plastic. J. Appl. Polym. Sci. 2009, 113, 1207–1215. [Google Scholar] [CrossRef]
  29. Valvez, S.; Silva, A.P.; Reis, P.N.B. Optimization of Printing Parameters to Maximize the Mechanical Properties of 3D-Printed PETG-Based Parts. Polymers 2022, 14, 2564. [Google Scholar] [CrossRef] [PubMed]
  30. Andrzejewski, J.; Marciniak-Podsadna, L. Development of Thermal Resistant FDM Printed Blends. The Preparation of GPET/PC Blends and Evaluation of Material Performance. Materials 2020, 13, 2057. [Google Scholar] [CrossRef]
  31. Nguyen, P.Q.K.; Panta, J.; Famakinwa, T.; Yang, R.; Ahmed, A.; Stapleton, M.; Sassaman, D.; Snabes, S.; Craff, C. Influences of Printing Parameters on Mechanical Properties of Recycled PET and PETG Using Fused Granular Fabrication Technique. Polym. Test. 2024, 132, 108390. [Google Scholar] [CrossRef]
  32. Szykiedans, K.; Credo, W.; Osiński, D. Selected Mechanical Properties of PETG 3-D Prints. Procedia Eng. 2017, 177, 455–461. [Google Scholar] [CrossRef]
  33. Yan, C.; Kleiner, C.; Tabigue, A.; Shah, V.; Sacks, G.; Shah, D.; DeStefano, V. PETG: Applications in Modern Medicine. Eng. Regen. 2024, 5, 45–55. [Google Scholar] [CrossRef]
  34. Petousis, M.; Ntintakis, I.; David, C.; Sagris, D.; Nasikas, N.K.; Korlos, A.; Moutsopoulou, A.; Vidakis, N. A Coherent Assessment of the Compressive Strain Rate Response of PC, PETG, PMMA, and TPU Thermoplastics in MEX Additive Manufacturing. Polymers 2023, 15, 3926. [Google Scholar] [CrossRef] [PubMed]
  35. Vidakis, N.; Petousis, M.; Velidakis, E.; Liebscher, M.; Mechtcherine, V.; Tzounis, L. On the Strain Rate Sensitivity of Fused Filament Fabrication (Fff) Processed Pla, Abs, Petg, Pa6, and Pp Thermoplastic Polymers. Polymers 2020, 12, 2924. [Google Scholar] [CrossRef] [PubMed]
  36. Hsueh, M.-H.; Lai, C.-J.; Wang, S.-H.; Zeng, Y.-S.; Hsieh, C.-H.; Pan, C.-Y.; Huang, W.-C. Effect of Printing Parameters on the Thermal and Mechanical Properties of 3D-Printed PLA and PETG, Using Fused Deposition Modeling. Polymers 2021, 13, 1758. [Google Scholar] [CrossRef] [PubMed]
  37. Duan, S.; Mo, F.; Yang, X.; Tao, Y.; Wu, D.; Peng, Y. Experimental and Numerical Investigations of Strain Rate Effects on Mechanical Properties of LGFRP Composite. Compos. B Eng. 2016, 88, 101–107. [Google Scholar] [CrossRef]
  38. Holcomb, G.; Caldona, E.B.; Cheng, X.; Advincula, R.C. On the Optimized 3D Printing and Post-Processing of PETG Materials. MRS Commun. 2022, 12, 381–387. [Google Scholar] [CrossRef]
  39. Petousis, M.; Michailidis, N.; Saltas, V.; Papadakis, V.; Spiridaki, M.; Mountakis, N.; Argyros, A.; Valsamos, J.; Nasikas, N.K.; Vidakis, N. Mechanical and Electrical Properties of Polyethylene Terephthalate Glycol/Antimony Tin Oxide Nanocomposites in Material Extrusion 3D Printing. Nanomaterials 2024, 14, 761. [Google Scholar] [CrossRef]
  40. Michailidis, N.; Petousis, M.; Saltas, V.; Papadakis, V.; Spiridaki, M.; Mountakis, N.; Argyros, A.; Valsamos, J.; Nasikas, N.K.; Vidakis, N. Investigation of the Effectiveness of Silicon Nitride as a Reinforcement Agent for Polyethylene Terephthalate Glycol in Material Extrusion 3D Printing. Polymers 2024, 16, 1043. [Google Scholar] [CrossRef] [PubMed]
  41. Alarifi, I.M. PETG/Carbon Fiber Composites with Different Structures Produced by 3D Printing. Polym. Test. 2023, 120, 107949. [Google Scholar] [CrossRef]
  42. Kasmi, S.; Ginoux, G.; Allaoui, S.; Alix, S. Investigation of 3D Printing Strategy on the Mechanical Performance of Coextruded Continuous Carbon Fiber Reinforced PETG. J. Appl. Polym. Sci. 2021, 138, 50955. [Google Scholar] [CrossRef]
  43. Lei, M.; Wei, Q.; Li, M.; Zhang, J.; Yang, R.; Wang, Y. Numerical Simulation and Experimental Study the Effects of Process Parameters on Filament Morphology and Mechanical Properties of FDM 3D Printed PLA/GNPs Nanocomposite. Polymers 2022, 14, 3081. [Google Scholar] [CrossRef] [PubMed]
  44. Valvez, S.; Silva, A.P.; Reis, P.N.B. Compressive Behaviour of 3D-Printed PETG Composites. Aerospace 2022, 9, 124. [Google Scholar] [CrossRef]
  45. Kováčová, M.; Kozakovičová, J.; Procházka, M.; Janigová, I.; Vysopal, M.; Černičková, I.; Krajčovič, J.; Špitalský, Z. Novel Hybrid PETG Composites for 3D Printing. Appl. Sci. 2020, 10, 3062. [Google Scholar] [CrossRef]
  46. Rouf, S.; Raina, A.; Irfan Ul Haq, M.; Naveed, N.; Jeganmohan, S.; Farzana Kichloo, A. 3D Printed Parts and Mechanical Properties: Influencing Parameters, Sustainability Aspects, Global Market Scenario, Challenges and Applications. Adv. Ind. Eng. Polym. Res. 2022, 5, 143–158. [Google Scholar] [CrossRef]
  47. Rett, J.P.; Traore, Y.L.; Ho, E.A. Sustainable Materials for Fused Deposition Modeling 3D Printing Applications. Adv. Eng. Mater. 2021, 23, 2001472. [Google Scholar] [CrossRef]
  48. Dananjaya, S.A.V.; Chevali, V.S.; Dear, J.P.; Potluri, P.; Abeykoon, C. 3D Printing of Biodegradable Polymers and Their Composites—Current State-of-the-Art, Properties, Applications, and Machine Learning for Potential Future Applications. Prog. Mater. Sci. 2024, 146, 101336. [Google Scholar] [CrossRef]
  49. Vidakis, N.; Kalderis, D.; Michailidis, N.; Papadakis, V.; Mountakis, N.; Argyros, A.; Spiridaki, M.; Moutspoulou, A.; Petousis, M. Environmentally Friendly Polylactic Acid/Ferronickel Slag Composite Filaments for Material Extrusion 3D Printing: A Comprehensive Optimization of the Filler Content. Mater. Today Sustain. 2024, 27, 100881. [Google Scholar] [CrossRef]
  50. Vidakis, N.; Petousis, M.; Michailidis, N.; Kechagias, J.D.; Mountakis, N.; Argyros, A.; Boura, O.; Grammatikos, S. High-Performance Medical-Grade Resin Radically Reinforced with Cellulose Nanofibers for 3D Printing. J. Mech. Behav. Biomed. Mater. 2022, 134, 105408. [Google Scholar] [CrossRef] [PubMed]
  51. Vidakis, N.; Petousis, M.; Mountakis, N.; Papadakis, V.; Moutsopoulou, A. Mechanical Strength Predictability of Full Factorial, Taguchi, and Box Behnken Designs: Optimization of Thermal Settings and Cellulose Nanofibers Content in PA12 for MEX AM. J. Mech. Behav. Biomed. Mater. 2023, 142, 105846. [Google Scholar] [CrossRef] [PubMed]
  52. Vidakis, N.; Petousis, M.; David, C.N.; Sagris, D.; Mountakis, N. Biomedical Resin Reinforced with Cellulose Nanofibers (CNF) in VAT Photopolymerization (VPP) Additive Manufacturing (AM): The Effect of Filler Loading and Process Control Parameters on Critical Quality Indicators (CQIs). J. Manuf. Process 2023, 101, 755–769. [Google Scholar] [CrossRef]
  53. Vidakis, N.; Petousis, M.; Tzounis, L.; Maniadi, A.; Velidakis, E.; Mountakis, N.; Papageorgiou, D.; Liebscher, M.; Mechtcherine, V. Sustainable Additive Manufacturing: Mechanical Response of Polypropylene over Multiple Recycling Processes. Sustainability 2021, 13, 159. [Google Scholar] [CrossRef]
  54. Xian, G.; Bai, Y.; Qi, X.; Wang, J.; Tian, J.; Xiao, H. Hygrothermal Aging on the Mechanical Property and Degradation Mechanism of Carbon Fiber Reinforced Epoxy Composites Modified by Nylon 6. J. Mater. Res. Technol. 2024, 33, 6297–6306. [Google Scholar] [CrossRef]
  55. Zhang, W.; Zhang, P.; Wang, H.; Li, J.; Dai, S.Y. Design of Biomass-Based Renewable Materials for Environmental Remediation. Trends Biotechnol. 2022, 40, 1519–1534. [Google Scholar] [CrossRef]
  56. Huang, L.; Luo, Z.; Huang, X.; Wang, Y.; Yan, J.; Liu, W.; Guo, Y.; Babu Arulmani, S.R.; Shao, M.; Zhang, H. Applications of Biomass-Based Materials to Remove Fluoride from Wastewater: A Review. Chemosphere 2022, 301, 134679. [Google Scholar] [CrossRef] [PubMed]
  57. Jeyasubramanian, K.; Thangagiri, B.; Sakthivel, A.; Dhaveethu Raja, J.; Seenivasan, S.; Vallinayagam, P.; Madhavan, D.; Malathi Devi, S.; Rathika, B. A Complete Review on Biochar: Production, Property, Multifaceted Applications, Interaction Mechanism and Computational Approach. Fuel 2021, 292, 120243. [Google Scholar] [CrossRef]
  58. Mishra, R.K.; Mohanty, K. A Review of the Next-Generation Biochar Production from Waste Biomass for Material Applications. Sci. Total Environ. 2023, 904, 167171. [Google Scholar] [CrossRef] [PubMed]
  59. Lehmann, J. Bio-Energy in the Black. Front. Ecol. Env. 2007, 5, 381–387. [Google Scholar] [CrossRef]
  60. Tang, J.; Zhu, W.; Kookana, R.; Katayama, A. Characteristics of Biochar and Its Application in Remediation of Contaminated Soil. J. Biosci. Bioeng. 2013, 116, 653–659. [Google Scholar] [CrossRef]
  61. Zama, E.F.; Reid, B.J.; Arp, H.P.H.; Sun, G.-X.; Yuan, H.-Y.; Zhu, Y.-G. Advances in Research on the Use of Biochar in Soil for Remediation: A Review. J. Soils Sediments 2018, 18, 2433–2450. [Google Scholar] [CrossRef]
  62. Yang, X.; Zhang, S.; Ju, M.; Liu, L. Preparation and Modification of Biochar Materials and Their Application in Soil Remediation. Appl. Sci. 2019, 9, 1365. [Google Scholar] [CrossRef]
  63. Sizmur, T.; Quilliam, R.; Puga, A.P.; Moreno-Jiménez, E.; Beesley, L.; Gomez-Eyles, J.L. Application of Biochar for Soil Remediation. In Agricultural and Environmental Applications of Biochar: Advances and Barriers; Wiley: Hoboken, NJ, USA, 2015. [Google Scholar]
  64. Ahmad, M.; Rajapaksha, A.U.; Lim, J.E.; Zhang, M.; Bolan, N.; Mohan, D.; Vithanage, M.; Lee, S.S.; Ok, Y.S. Biochar as a Sorbent for Contaminant Management in Soil and Water: A Review. Chemosphere 2014, 99, 19–33. [Google Scholar] [CrossRef] [PubMed]
  65. Mohan, D.; Sarswat, A.; Ok, Y.S.; Pittman, C.U. Organic and Inorganic Contaminants Removal from Water with Biochar, a Renewable, Low Cost and Sustainable Adsorbent—A Critical Review. Bioresour. Technol. 2014, 160, 191–202. [Google Scholar] [CrossRef] [PubMed]
  66. Yu, J.; Zhao, Y.; Li, Y. Utilization of Corn Cob Biochar in a Direct Carbon Fuel Cell. J. Power Sources 2014, 270, 312–317. [Google Scholar] [CrossRef]
  67. Elleuch, A.; Boussetta, A.; Yu, J.; Halouani, K.; Li, Y. Experimental Investigation of Direct Carbon Fuel Cell Fueled by Almond Shell Biochar: Part I. Physico-Chemical Characterization of the Biochar Fuel and Cell Performance Examination. Int. J. Hydrog. Energy 2013, 38, 16590–16604. [Google Scholar] [CrossRef]
  68. Gupta, R.K.; Dubey, M.; Kharel, P.; Gu, Z.; Fan, Q.H. Biochar Activated by Oxygen Plasma for Supercapacitors. J. Power Sources 2015, 274, 1300–1305. [Google Scholar] [CrossRef]
  69. Jiang, J.; Zhang, L.; Wang, X.; Holm, N.; Rajagopalan, K.; Chen, F.; Ma, S. Highly Ordered Macroporous Woody Biochar with Ultra-High Carbon Content as Supercapacitor Electrodes. Electrochim. Acta 2013, 113, 481–489. [Google Scholar] [CrossRef]
  70. Amin, F.R.; Huang, Y.; He, Y.; Zhang, R.; Liu, G.; Chen, C. Biochar Applications and Modern Techniques for Characterization. Clean. Technol. Env. Policy 2016, 18, 1457–1473. [Google Scholar] [CrossRef]
  71. Wang, J.; Wang, S. Preparation, Modification and Environmental Application of Biochar: A Review. J. Clean. Prod. 2019, 227, 1002–1022. [Google Scholar] [CrossRef]
  72. Xu, X.; Cao, X.; Zhao, L. Comparison of Rice Husk- and Dairy Manure-Derived Biochars for Simultaneously Removing Heavy Metals from Aqueous Solutions: Role of Mineral Components in Biochars. Chemosphere 2013, 92, 955–961. [Google Scholar] [CrossRef]
  73. Qian, L.; Chen, B. Dual Role of Biochars as Adsorbents for Aluminum: The Effects of Oxygen-Containing Organic Components and the Scattering of Silicate Particles. Environ. Sci. Technol. 2013, 47, 8759–8768. [Google Scholar] [CrossRef] [PubMed]
  74. Yao, Y.; Gao, B.; Chen, H.; Jiang, L.; Inyang, M.; Zimmerman, A.R.; Cao, X.; Yang, L.; Xue, Y.; Li, H. Adsorption of Sulfamethoxazole on Biochar and Its Impact on Reclaimed Water Irrigation. J. Hazard. Mater. 2012, 209–210, 408–413. [Google Scholar] [CrossRef]
  75. Shen, Y.-S.; Wang, S.-L.; Tzou, Y.-M.; Yan, Y.-Y.; Kuan, W.-H. Removal of Hexavalent Cr by Coconut Coir and Derived Chars—The Effect of Surface Functionality. Bioresour. Technol. 2012, 104, 165–172. [Google Scholar] [CrossRef] [PubMed]
  76. Sánchez, M.E.; Lindao, E.; Margaleff, D.; Martínez, O.; Morán, A. Pyrolysis of Agricultural Residues from Rape and Sunflowers: Production and Characterization of Bio-Fuels and Biochar Soil Management. J. Anal. Appl. Pyrolysis 2009, 85, 142–144. [Google Scholar] [CrossRef]
  77. Kwapinski, W.; Byrne, C.M.P.; Kryachko, E.; Wolfram, P.; Adley, C.; Leahy, J.J.; Novotny, E.H.; Hayes, M.H.B. Biochar from Biomass and Waste. Waste Biomass Valorization 2010, 1, 177–189. [Google Scholar] [CrossRef]
  78. Vidakis, N.; Kalderis, D.; Petousis, M.; Maravelakis, E.; Mountakis, N.; Bolanakis, N.; Papadakis, V. Biochar Filler in MEX and VPP Additive Manufacturing: Characterization and Reinforcement Effects in Polylactic Acid and Standard Grade Resin Matrices. Biochar 2023, 5, 39. [Google Scholar] [CrossRef]
  79. Vidakis, N.; Petousis, A.M.; Kalderis, D.; Michailidis, N.P.; Maravelakis, E.G.; Saltas, V.; Bolanakis, N.; Papadakis, V.M.; Argyros, A.; Mountakis, N.; et al. A Coherent Engineering Assessment of ABS/Biochar Biocomposites in MEX 3D Additive Manufacturing. Heliyon 2024, 10, e32094. [Google Scholar] [CrossRef] [PubMed]
  80. Vidakis, N.; Petousis, A.M.; Kalderis, D.; Michailidis, N.P.; Maravelakis, E.G.; Saltas, V.; Bolanakis, N.; Papadakis, V.M.; Spiridaki, M.; Argyros, A. Reinforced HDPE with Optimized Biochar Content for Material Extrusion Additive Manufacturing: Morphological, Rheological, Electrical, and Thermomechanical Insights. Biochar 2024, 6, 37. [Google Scholar] [CrossRef]
  81. Petousis, A.M.; Maravelakis, E.G.; Kalderis, D.; Saltas, V.; Mountakis, N.; Spiridaki, M.; Bolanakis, N.; Argyros, A.; Papadakis, V.M.; Michailidis, N.P.; et al. Biochar for Sustainable Additive Manufacturing: Thermal, Mechanical, Electrical, and Rheological Responses of Polypropylene-Biochar Composites. Biomass Bioenergy 2024, 186, 107272. [Google Scholar] [CrossRef]
  82. Tsubota, T.; Tsuchiya, S.; Kusumoto, T.; Kalderis, D. Assessment of Biochar Produced by Flame-Curtain Pyrolysis as a Precursor for the Development of an Efficient Electric Double-Layer Capacitor. Energies 2021, 14, 7671. [Google Scholar] [CrossRef]
  83. ASTM D638-02a; Standard Test Method for Tensile Properties of Plastics. American Society for Testing and Materials: West Conshohocken, PA, USA, 2002.
  84. ASTM D790-14; Standard Test Methods for Flexural Properties of Unreinforced and Reinforced Plastics and Electrical Insulating Materials. American Society for Testing and Materials: West Conshohocken, PA, USA, 2010.
  85. ASTM D6110-04; Standard Test Method for Determining the Charpy Impact Resistance of Notched Specimens of Plastics. American Society for Testing and Materials: West Conshohocken, PA, USA, 2004.
  86. Qayyum, H.; Hussain, G.; Sulaiman, M.; Hassan, M.; Ali, A.; Muhammad, R.; Wei, H.; Shehbaz, T.; Aamir, M.; Altaf, K. Effect of Raster Angle and Infill Pattern on the In-Plane and Edgewise Flexural Properties of Fused Filament Fabricated Acrylonitrile–Butadiene–Styrene. Appl. Sci. 2022, 12, 12690. [Google Scholar] [CrossRef]
  87. ASTM D1238-13; Standard Test Method for Melt Flow Rates of Thermoplastics by Extrusion Plastometer. American Society for Testing and Materials: West Conshohocken, PA, USA, 2020.
  88. ASTM E384-11; Standard Test Method for Knoop and Vickers Hardness of Materials1. American Society for Testing and Materials: West Conshohocken, PA, USA, 2012.
  89. Zimmerer, C.; Matulaitiene, I.; Niaura, G.; Reuter, U.; Janke, A.; Boldt, R.; Sablinskas, V.; Steiner, G. Nondestructive Characterization of the Polycarbonate—Octadecylamine Interface by Surface Enhanced Raman Spectroscopy. Polym. Test. 2019, 73, 152–158. [Google Scholar] [CrossRef]
  90. Resta, V.; Quarta, G.; Lomascolo, M.; Maruccio, L.; Calcagnile, L. Raman and Photoluminescence Spectroscopy of Polycarbonate Matrices Irradiated with Different Energy 28Si+ Ions. Vacuum 2015, 116, 82–89. [Google Scholar] [CrossRef]
  91. Bichara, L.C.; Alvarez, P.E.; Fiori Bimbi, M.V.; Vaca, H.; Gervasi, C.; Brandán, S.A. Structural and Spectroscopic Study of a Pectin Isolated from Citrus Peel by Using FTIR and FT-Raman Spectra and DFT Calculations. Infrared Phys. Technol. 2016, 76, 315–327. [Google Scholar] [CrossRef]
  92. Synytsya, A.; Čopíková, J.; Matějka, P.; Machovič, V. Fourier Transform Raman and Infrared Spectroscopy of Pectins. Carbohydr. Polym. 2003, 54, 97–106. [Google Scholar] [CrossRef]
  93. Makarem, M.; Lee, C.M.; Kafle, K.; Huang, S.; Chae, I.; Yang, H.; Kubicki, J.D.; Kim, S.H. Probing Cellulose Structures with Vibrational Spectroscopy. Cellulose 2019, 26, 35–79. [Google Scholar] [CrossRef]
  94. Stuart, B.H. Temperature Studies of Polycarbonate Using Fourier Transform Raman Spectroscopy. Polym. Bull. 1996, 36, 341–346. [Google Scholar] [CrossRef]
  95. Lin, Z.; Guo, X.; He, Z.; Liang, X.; Wang, M.; Jin, G. Thermal Degradation Kinetics Study of Molten Polylactide Based on Raman Spectroscopy. Polym. Eng. Sci. 2020, 61, 201–210. [Google Scholar] [CrossRef]
  96. Badr, Y.A.; El-Kader, K.M.A.; Khafagy, R.M. Raman Spectroscopic Study of CdS, PVA Composite Films. J. Appl. Polym. Sci. 2004, 92, 1984–1992. [Google Scholar] [CrossRef]
  97. Liu, X.; Zou, Y.; Li, W.; Cao, G.; Chen, W. Kinetics of Thermo-Oxidative and Thermal Degradation of Poly(d,l-Lactide) (PDLLA) at Processing Temperature. Polym. Degrad. Stab. 2006, 91, 3259–3265. [Google Scholar] [CrossRef]
  98. Richard, S.; Rajadurai, J.S.; Manikandan, V. Influence of Particle Size and Particle Loading on Mechanical and Dielectric Properties of Biochar Particulate-Reinforced Polymer Nanocomposites. Int. J. Polym. Anal. Charact. 2016, 21, 462–477. [Google Scholar] [CrossRef]
  99. Loskot, J.; Jezbera, D.; Loskot, R.; Bušovský, D.; Barylski, A.; Glowka, K.; Duda, P.; Aniołek, K.; Voglová, K.; Zubko, M. Influence of Print Speed on the Microstructure, Morphology, and Mechanical Properties of 3D-Printed PETG Products. Polym. Test. 2023, 123, 108055. [Google Scholar] [CrossRef]
  100. Kumar, J.; Negi, S. Development of 3D Printable Cenosphere-Reinforced Polyethylene Terephthalate Glycol (PETG) Filaments for Lightweight Structural Applications. Polym. Compos. 2023, 44, 7030–7039. [Google Scholar] [CrossRef]
  101. Sunder, S.S.; Sahithi, V.V.D. Process Parameter Optimization of FDM 3D Printer Using PETG and Carbon Fiber PETG. In Materials Science Forum; Trans Tech Publications Ltd.: Bäch, Switzerland, 2023; Volume 1081. [Google Scholar]
  102. Egan, P.F. Special Issue Editorial: Applications of 3D Printing for Polymers. Polymers 2023, 15, 1638. [Google Scholar] [CrossRef] [PubMed]
  103. Wang, H.; Huang, Z.; Li, J.; Li, L. DLP 3D Printing of High-Performance Epoxy Resin Via Dual Curing. In Proceedings of the 2021 3rd International Academic Exchange Conference on Science and Technology Innovation IAECST, Guangzhou, China, 10–12 December 2021. [Google Scholar]
  104. Song, Y.; Zheng, Q. Concepts and Conflicts in Nanoparticles Reinforcement to Polymers beyond Hydrodynamics. Prog. Mater. Sci. 2016, 84, 1–58. [Google Scholar] [CrossRef]
  105. Zare, Y.; Rhee, K.Y.; Hui, D. Influences of Nanoparticles Aggregation/Agglomeration on the Interfacial/Interphase and Tensile Properties of Nanocomposites. Compos. B Eng. 2017, 122, 41–46. [Google Scholar] [CrossRef]
Figure 1. A photographic summary of the preparation and testing procedures of PETG/biochar composites: (A) raw materials, (B) Drying process, (C) Filament extrusion, (D) Filament drying, (E) Filament quality control, (F) Filament tensile testing, (G) 3D printing, (H) Quality control of the samples, (I) Mechanical testing–flexural test, (J) Mechanical testing–impact test, (Κ) Rheological properties measurement, (L) Morphological characterization with SEM.
Jmmp 09 00068 g001
Figure 2. Printing parameters and dimensions of the specimens used for mechanical testing of PETG/biochar composites. The table on the left lists the various parameters used during the 3D printing process, including biochar content, printing orientation, nozzle temperature, bed temperature, layer thickness, number of perimeters, fill density, and travel speed. The right side shows the dimensions and standards of the flexural, tensile, and Charpy notched specimens used for testing, with representative images of the printed specimens at the bottom. The lines and arrows within the geometry indicate the infill pattern used to build the geometry [83,84,85].
Jmmp 09 00068 g002
Figure 3. TGA and DSC of PETG/biochar composites with varying biochar content. (a) TGA curves showing the weight loss of pure PETG and PETG composites in different concentrations with biochar content as a function of temperature. The inset displays the residual weight percentage at 550 °C for different biochar concentrations. (b) DSC curves indicating the heat flow of the composites. The inset displays the glass transition temperature (Tg) in relation to the biochar content.
Jmmp 09 00068 g003
Figure 4. (a) Raman spectra from pure PETG, PETG/biochar (2, 4, 6, 8, and 10 wt.%). (b) Raman spectral differences of PETG/biochar (2, 4, 6, 8, and 10 wt.%) from pure PETG.
Jmmp 09 00068 g004
Figure 5. Rheological behavior of PETG/biochar composites at 240 °C and 250 °C. (a) Viscosity (solid lines) and shear stress (dotted lines) as functions of shear rate for pure PETG and PETG composites with 2.0%, 4.0%, 6.0%, 8.0%, and 10.0% biochar content (per weight) at 240 °C. (b) Melt flow rate (MFR) of the composites as a function of biochar content at 250 °C, showing the maximum MFR and its decline with increasing biochar percentage.
Jmmp 09 00068 g005
Figure 6. (a,c) display the visual comparison of the filament surface for pure PETG and PETG with 4.0 wt.% biochar, respectively, with consistent diameters indicating stable extrusion over time. (b,d) present the mechanical properties of the PETG/biochar composites.
Jmmp 09 00068 g006
Figure 7. Comparison of mechanical properties for PETG pure and PETG/biochar composites. (a) Stress vs. strain graphs. (b) Average tensile strength and deviation, and (c) average Young’s modulus and deviation.
Jmmp 09 00068 g007
Figure 8. Flexural performance of PETG/biochar composites. (a) Stress–strain curves for pure PETG and PETG composites with varying biochar content. (b) Flexural strength (average values and deviation) (σ) of PETG composites with different biochar percentages, showing a maximum increase of 15.9% at 6.0% biochar content. (c) Flexural modulus (average values and deviation) (E) of the composites, with a maximum increase of 10.5% observed at 6.0% biochar content.
Jmmp 09 00068 g008
Figure 9. Evaluation of tensile toughness, impact resistance and hardness of PETG/biochar composites (average values and deviation). (a) Toughness (T) of PETG composites with varying biochar content. (b) Impact strength of the composites in the Charpy test. (c) Vickers microhardness (M-H) of the composites.
Jmmp 09 00068 g009
Figure 10. SEM and EDS analysis of biochar particles. SEM image at magnification (a) 1000× and (b) 5000×; (c) high-magnification SEM image at 30,000×, highlighting fine details of the particles. (d) Elemental mapping of the biochar indicating the distribution of key elements (carbon). (e) EDS spectrum and corresponding table showing the elemental composition of the biochar, with a focus on oxygen (O), carbon (C), calcium (Ca), and potassium (K).
Jmmp 09 00068 g010
Figure 11. SEM images of PETG/biochar composites at different magnifications. (a,d,g) 4.0 wt.%, (b,e,h) 8.0%, and (c,f,i) 10.0%. (ac) show vertical surface views at 150× magnification; (df) show cross-sectional views at 27× magnification; and (gi) show detailed views of the fracture surfaces at 3000× magnification.
Jmmp 09 00068 g011
Figure 12. SEM images of the PETG/biochar 6 wt.% composites at different magnifications (a) lateral surface at 27× magnification, and fracture surface at magnifications of (b) 300×, (c) 1000×, (d) 27×, (e) 3000× and (f) 20,000×.
Jmmp 09 00068 g012
Figure 13. Radar charts summarizing the mechanical performance of PETG/biochar composites. (a) Tensile strength ( σ Β Τ ) in MPa; (b) Tensile modulus (ET) in MPa; (c) Flexural strength ( σ Β F ) in MPa; and (d) Flexural modulus (EF) in GPa for pure PETG and composites with 2.0%, 4.0%, 6.0%, 8.0%, and 10.0% biochar content.
Jmmp 09 00068 g013
Table 1. Comparison of biochar capability to improve the mechanical performance of different polymeric materials in MEX 3DP.
Increase (%)CurrentABS [79]PLA [78]HDPE [80]PP [81]
Tensile strength17.824.920.937.828.4
Flexural strength15.921.014.135.919.7
Impact strength 20.9-140.628.523.8
Microhardness18.894.80.89.120.3
Optimum content (wt.%)6.04.04.04.06.0
Disclaimer/Publisher’s Note: The statements, opinions and data contained in all publications are solely those of the individual author(s) and contributor(s) and not of MDPI and/or the editor(s). MDPI and/or the editor(s) disclaim responsibility for any injury to people or property resulting from any ideas, methods, instructions or products referred to in the content.

