Abstract
Stainless steels have many practical applications requiring various mechanical or chemical demands in the working environment. By optimizing a device used in mechanical experiments for torsional loading, several cylindrical samples were tested (both ends twisted with the same torque value in opposite directions) of 316L stainless steel (SS) to evaluate changes in the structural, chemical, and mechanical characteristics. Initially, the experimental samples were pre-loaded by tension in the elastic range (6%) and then subjected to torsion (772°) at different rates: 5, 10, and 20 mm/min. The experimental sequence consisted of a combined loading protocol with an initial tensile test followed by a subsequent torsional test. Two reference tests were performed by fracturing the samples in both torsion and tension to determine the mechanical strength parameters. The macro- and microstructural evolution of the samples as a function of the torsional degree was followed by scanning electron microscopy. The microhardness modification of the material was observed because of the strain (the microhardness variation from the center of the disk sample to the edge was also monitored). Structurally, all samples showed grain size changes because of torsional/compressive deformation zones and an increase in the degree of grain boundary misorientation. From the tensile and torsional behaviors of 316L SS and the structural results obtained, it was concluded that these materials are suitable for complex stress states in the elasto-plastic range through tensile and torsion. A reduction in Young’s modulus of up to four times the initial value at medium and high stress rates was observed when complex stresses were applied.
1. Introduction
316L SS is widely used in the petroleum industry, shipbuilding, and mining because of its good corrosion resistance in acidic environments, good machinability by grinding, good flowability, formability, and weldability [1]. Steels have refractory properties and are formable and ductile. Due to their resistance to pressure, they are often used in the manufacture of containers for chemical agents and pumps for nuclear power plants [2]. 316L SS is considered a mild stainless steel with relatively low resistance to direct contact stresses, poor wear resistance, and good dynamic and impact resistance [3]. The remedy would be solution quenching followed by aging, which leads to structural hardening due to the dissolution of hard carbides mainly distributed at the grain edges, followed by their reappearance in intragranular dispersion during aging [4].
The microhardness of 316L SS typically ranges from approximately 150 to 300 HV (Vickers hardness), depending on specific conditions such as heat treatment and cold working [5]. Factors that can affect the 316L SS microhardness include cold working, which increases the microhardness due to work hardening; various heat treatment processes, which can change the microstructure and consequently the hardness; and aging processes, which can lead to precipitation hardening, which can also affect the microhardness [6,7,8]. Generally, the microhardness of 316L SS contributes to its good mechanical properties and suitability for various applications, particularly in extreme environments. The Rockwell hardness of 316L austenitic SS is typically between 70 and 90 HRB (Rockwell B scale) or between 30 and 40 HRC (Rockwell C scale), depending on its specific condition, such as whether it has been cold-worked or annealed [9].
Understanding the material behavior under simultaneous and successive combined loading conditions, similar to those encountered during the service life of different parts or structures, is of particular importance in both the design process and failure mode analysis. The processing of metallic materials, in particular, steels, using highly structured production technology is increasingly being used to obtain new properties and target materials for various applications [10,11].
Torsion tests are simple for both metallic and non-metallic materials, and they evaluate the behavior under either static or dynamic conditions. The known state-of-the-art application of stand-alone mechanical testing equipment shows that this technology is well-established and widely applied, particularly in material testing laboratories and mechanical engineering [12].
Zhang et al. [13] applied a machining process using torsion as a preliminary stage and tensile as the main deformation stage of 316 stainless steel and reported the great influence of the torsional deformation stage on the material structure. As the shear stress increases, the number of grain boundaries also increases, with larger angles increasing the toughness of the material [13]. The references to the torsional loads applied to stainless steel identified by the authors mention the application of torsion from one end only, with the other end held fixed rather than from both ends, as was performed in this study [13,14].
The 316L SS studied is suitable for the medical industry as medical devices and parts due to its properties, such as corrosion resistance [15]. Brackets, a well-known device for straightening teeth, oral instruments, and many surgical instruments, such as scalpels and tweezers, are made from this material. It is important to mention that for this medical purpose, a material with high durability, precision, and no adverse reactions (such as allergies) can be used. 316L SS with an ultra-fine microstructure offers many advantages for biological implants as load-bearing elements [16].
In the present work, the authors propose a combined process of mechanical processing of 316L SS by pre-loading and torsion using an innovative double-end torsion machine and analyze the effects of this mechanical processing on the microstructure and several mechanical properties. The aim of the paper is to establish the effects of the combined loadings on 316L SS, the maximum limits reached by torsion in these cases, and the evolution of the microstructure and mechanical properties (microhardness and indentation modulus).
2. Experimental Set-Up, Materials and Methods
316L SS samples (UXS 55200072 with the following chemical composition in wt %: C:0.03; Si:1; Mn:2; P:0.045; S:0.03; Cr: 18.5; Ni: 13; Mo:2.5; Cu:1; N:0.11; Co:0.19) purchased from a local supplier, Ital Inox, were used for the experiments [17].
The torsion test was performed on an electromechanically driven universal testing machine WDW 50 (1), as shown in Figure 1a. The maximum load capacity of the machine was 50 KN. The movable traverse was controlled in the motion mode in these tests. The test settings were made using the WINWDW software interface (3). An attachable device (2), shown schematically in Figure 1b, which was specially designed for the torsional loading of cylindrical samples, was installed in the grips of the testing machine. The device converts the linear motion of the testing machine into a rotational motion at both ends of the sample, as shown in Figure 1c. It is rotated with equal and opposite torsional moments. The cylindrical sample used in this study had the shape and dimensions shown in Figure 1d. The main dimensions were Lt (total length): 130 mm; Lc (reduced cross section): 70 mm; L0 (gauge length): 60 mm; and D (diameter): 10 mm.

Figure 1.
Experimental set-up used for the torsion test in (a); 3D model of the torsion device in (b); schematic presentation of the combined stress in (c); main dimensions of the specimen in (d).
The purpose of the device is to convert the translational motion of universal testing machines into a rotational motion that is transferred to the sample ends of variable shapes and sizes to subject them to torsional loads. It is based on a simple but highly efficient mechanism consisting of a gear (called a pinion) and a toothed bar (called a rack). This combination makes it possible to convert translation into rotation. The translational motion of the universal testing machine in motion control mode is provided by the stroke of the movable crosshead. The testing machine can be controlled by the buttons on the pillar or by the software application developed by the manufacturer.
The independent attachable device used for the torsion test was fixed in the grips of the universal testing machine (they were positioned one by the fixed traverse, located at the top, and the other at the bottom, connected to the mobile traverse). The device was secured with specially designed parts.
The mechanism consists of a series of components that generate twist angles at the ends of the sample. The twist angles of the sample are generated by constant, equal, and opposite torsional moments applied to the ends. The racks transmit the translational motion to the gear wheel. They are connected to each other in pairs of two through traverses fixed in the fixture with adapters. The translational motion generated by the machine’s movable traverse is converted into rotational motion by the rack and pinion gear mechanism within the attachable test fixture. A shaft is connected to the gear, which, through the quills, causes rotation of the fixture trays in which the sample ends are secured.
The applied torsional moments were determined by multiplying the forces F/2 (F-load size, indicated on the testing machine) by the gear wheel pitch diameter. For the toothed parts, the engagement and transmission of their forces occur on the pitch diameter Dd, i.e., the size that represents the arm of the torques in the fixture. Therefore, the Mt effort when loading the sample is given by [18]
The dividing diameter can be determined as the product of the m modulus of the gear and the z number of teeth. The maximum stresses occur at points on each section’s circumference and have the following values:
Performing preliminary mechanical tests (tensile and torsional tests to failure) to evaluate the mechanical properties of the material determined the further loading process: first, tensile tests on circular section samples, in the linear elastic range, by controlling the machine in displacement mode (the maximum displacement adopted was 3 mm); second, tensile tests on pre-deformed samples by torsional tests, in the elasto-plastic range, with different deformation degrees; and finally, cutting cylindrical samples from the samples subjected successively to tensile and torsional test, for further investigations (micro-hardening, structural analysis, etc.) in changes at both macro and micro levels.
To assess surface hardness, microindentation tests were performed on a CETR UMT-2 tribometer (Campbell, St. Clara, CA, USA) using a Rockwell diamond tip with a 200 μm radius and 120° angle. The microindentation procedure consists of several stages: first, a pre-load stage at 10% of the maximum load for 15 s, followed by a linear increase in load from 10% to the maximum for 30 s. Next, the maximum load is maintained for 15 s, followed by a 30 s unloading phase where the load is reduced to 10%. Finally, the load was held at 10% for another 15 s. Each sample was subjected to three microindentation tests at a 10 N vertical load. Micro-scratch tests were performed on a CETR UMT-2 tribometer to assess surface scratch resistance. A sharp stylus was used to produce a controlled and continuous microscratch. Furthermore, AE signals were recorded to provide an insight into the load-displacement behavior of the material during the test, helping to identify any damage initiation and failure mechanisms. Scratch tests were performed by applying a 10 N constant load, moving the sample at a 0.167 mm/s rate for a 10 mm distance in 60 s. These tests were performed using an Nvidia 9.10.0513 blade with a 0.4 mm tip radius.
The microstructure was evaluated using scanning electron microscopy (VegaTescan LMH II, SE detector, 30 kV gun power; Vega software 3.5.0.0 for 2D and 3D).
3. Results and Discussion
The test samples with the shape and dimensions described above were subjected to tensile and torsion failure, and the curves of their displacement versus the applied force are shown in Figure 2. It was observed that under torsional loading, the sample exhibited a displacement approximately 10 times greater than under tensile loading when the sample broke after approximately 20 mm of elongation. These results demonstrate the ability of this material to resist torsion much better than the tensile test, a result that also confirms the superior fatigue resistance of 316L SS when part of the tensile load applied to a sample is converted to torsional load [13].
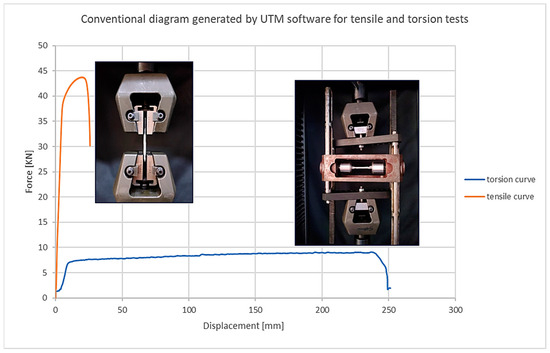
Figure 2.
Tensile/torsion to failure curves of austenitic 316L steel.
Literature analysis showed a good correlation between structure and mechanical properties, particularly fracture topography and maximum flow resistance. The number of valid pits in both fracture cases indicates that the fracture was primarily ductile [19]. The formation of micro- or macro-dimensional cracks was not observed in either case. For the torsional sample, two different fracture areas were observed: a ductile one, similar to a tensile filling, in the central part of the sample, and a more brittle cleavage-type fracture in the outer part, with a smaller number of holes and grains elongated in the torsional direction and partially overlapping [20].
Numerous fine micro-cavities were observed on the fractured surface. Straight pits of finite sizes and depths caused the tensile sample to fracture. Numerous equiaxial pits were also observed in the fracture, presumably as a result of the normal stress acting on the material during tensile deformation.
Due to the high number of pits observed over the whole surface of the material, it can be considered that the tensile fracture was ductile.
In the SEM images, representative 2D and 3D fractograms of the specimen subjected to torsional fracture using the above-mentioned apparatus are shown at the macroscopic scale, Figure 3a and Figure 4a, respectively. A flatter surface can be observed for the torsional fracture than for the tensile fracture. The torsional material hardens gradually from the outside to the inside of the specimen as the shear strain increases.
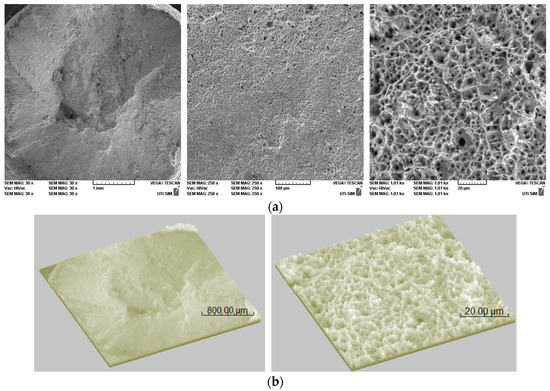
Figure 3.
SEM micrographs of the tensile fracture (a) 2D: 100×, 250× and 1000× and (b) 3D.
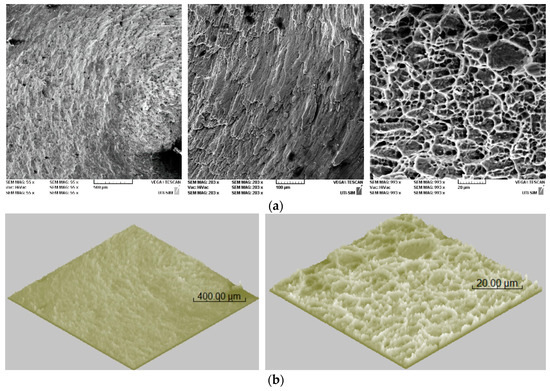
Figure 4.
SEM micrographs of the torsion fracture (a) 2D: 100×, 250×, and 1000× and (b) 3D.
The grain orientation in the torsional direction can be observed in Figure 4b and is also caused by the sudden sliding of the material due to the dislocation motion. Material fracture is based on the accumulation of high shear stresses resulting from torsional or tensile deformation. The sample subjected to torsion, at least in the central region, exhibited strong plastic deformation during the process, which also favored sliding by dislocation displacement.
The hole dimensions in the central area of the torsion sample (Figure 4) are similar to those of the tensile sample (Figure 3), with larger and deeper holes in the tensile sample.
In those areas of the material where the shear deformation increases more during the test as the sample approaches failure, the normal strains increase the number of micro-holes that occur, and at the edge, they coalesce due to excessive torque. Thus, toward the edge (Figure 4b), the micro-holes overlap. For both fracture cases, sliding marks were observed on the sample edges because of the high shear forces accumulated on the outside.
The samples were first subjected to a tensile test in the elastic range, varying the test rate. Stress–strain diagrams are shown in Figure 5. It can be noted that the strain values are almost identical (ε = 5.5%), but the stress values differ, with the maximum value (330 MPa) obtained for the sample tested at a loading rate of 20 mm/min. After the tensile test, the samples were unloaded and subjected to torsion at the same degree of plastic deformation. Figure 5 shows torque–twist angle diagrams recorded for the samples subjected to the subsequent torsion tests. The curves showed a similar variation, consisting of two regions: the first region represented a linear variation with a small deformation (Φ = 50°) and continued with a region in which the material showed large deformations (Φ = 750°).

Figure 5.
Combined mechanical test stages applied to experimental materials (a) tensile and (b) torsion.
From the torsional behavior graph analysis (Figure 5b), some characteristic regions of the investigated materials can be observed:
- (a)
- Initial phase (elastic region): all curves exhibit a linear variation, which increases at the beginning (up to approximately 50°). This corresponds to the elastic behavior of the samples, where the torque increases linearly with the torsional angle. The slopes in this region are slightly different, indicating stiffness variations in the samples. The sample twisted at 5 mm/min (red) has the steepest initial slope, suggesting it is the stiffest material or has the highest modulus of elasticity, while the sample twisted at 10 mm/min (brown) has the flattest initial slope, suggesting it is the least stiff or more compliant;
- (b)
- Transition phase (elastic to plastic): around 50–100°, all curves start to deviate from linear behavior. The torque increase becomes less pronounced, indicating the transition from elastic to plastic deformation. The transition occurs at higher torque levels for the sample twisted at the lowest rate, reflecting a higher yield strength. The sample twisted at the highest rate reaches this stage earlier and at lower torque values, indicating that it has the lowest yield strength;
- (c)
- Stabilization phase (plastic region): beyond 200–300°, the curves begin to stabilize, with torque increasing more gradually or leveling. The first twisted sample (5 mm/min) stabilizes at the highest torque (~85 Nm), the second (10 mm/min) at around 75 Nm, and the third (20 mm/min) at around 70 Nm. The plateau levels represent the resistance of each sample to further torsional deformation in the plastic region. The first sample was the strongest, followed by the twisted one at 10 mm/min and finally the last one (20 mm/min);
- (d)
- Post-stabilization behavior: small oscillations in the torque values were visible during the stabilization phase, which was probably caused by microstructural adjustments such as work hardening or localized yielding. The first twisted sample (5 mm/min) shows the largest torque fluctuations, indicating greater energy absorption and resistance to torsional failure, while the sample tested at the highest rate (20 mm/min) remains the smoothest, indicating a more uniform plastic deformation. As illustrated in Figure 5b, the three samples can be characterized in terms of mechanical performance as follows: First (5 mm/min): highest stiffness, yield strength, and torque capacity; second (10 mm/min): moderate performance, balance between stiffness and strength; and third (20 mm/min): lowest stiffness, yield strength, and torque capacity.
Based on the mechanical properties obtained after complex mechanical processing through tensile and torsion, the first sample (5 mm/min) is suitable for applications requiring high torsional strength and stiffness, such as drive shafts or load bearing components, whereas the third processed sample (20 mm/min) may be more suitable for applications where flexibility is preferred over strength, such as certain couplings or dampers. None of the samples exhibited a sharp drop in torque, which would indicate torsional failure. This suggests good ductility and energy absorption before failure.
Figure 6 shows the microstructures of 316L SS for the center samples in (a) and the edge samples in (b) for the initial condition and for those mechanically processed by tensile and torsion at different rates (5, 10, and 20 mm/min, respectively) from left to right.
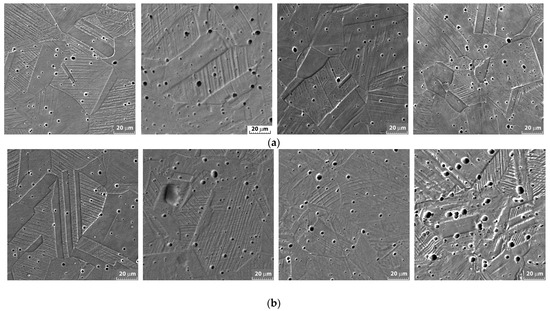
Figure 6.
SEM microstructures (a) middle area and (b) edge for the initial and twisted samples with 5, 10, and 20 mm/min from left to right.
The initial microstructure is typical austenitic stainless steel with a granular texture and grain boundaries characteristic of an undistorted state, representing the base material without the application of mechanical forces. The material in its initial state shows no signs of mechanical or plastic damage, suggesting a balance between ductility and strength. As the sample is deformed, the structure begins to change: strain and deformation of the grain lines/boundaries are observed, suggesting initial plastic deformation (Figure 6a). The material texture remains relatively homogenous. An increase in grain and boundary deformation can be observed. The lines become more irregular and fragmented.
Grain refinement increased with increasing torsional strain rate. In addition, the grains in the center region were subjected to less pressure than the grains at the edge but with little change. As the torsional strain rate increased, the difference in intensity of the grain refinement process in the radial direction decreased.
At a torsional rate of 20 mm/min, a pronounced change in the material structure with more material slip twins is observed, particularly at the edge of the sample (Figure 6b). The preferential orientation of the structure along the torsion direction can also be observed at the microscopic level through the directionality of the material twins and grain boundaries (Figure 6b).
A large number of deformation twins appeared within the deformed grains and even more within the grains located at the edge of the material compared with the center of the sample. This shows that the sample deformation was more intense at the edge than at the center, mainly because of the torsional test rather than the pre-tensional test. In addition, the number of twins increased with increasing strain as the torsion rate increased, and dislocations accumulated at the boundary between twins. The dislocation movement was inhibited with increasing torsion rate, resulting in activated strain twins that contributed to the acceleration of plastic deformation [21].
For the central part of the sample, the least affected by the torsion, Figure 6a, a slight decrease in grain size can be observed from 30–70 μm to 20–50 μm due to the stretching stage in the first part of the deformation and less to the torsion of the material by breaking the boundaries due to the compression of the grains between them. The dislocation density is similar, and the number of twins is close to the initial state, confirming that the central area does not deform very much under the influence of the torsion process.
For the part subjected to more intense torsion, i.e., the outer part of the specimens, a reduction in grain size to 10–30 μm was observed over an area of about 65 × 65 μm (−15,300 μm2) due to their crushing under torsional forces. An increase in dislocation density from an initial 25–30% to 60–75% can be seen in Figure 6b, and an agglomeration of twins was observed due to a reduction in their width from 1 μm to 0.65 μm.
The structural image of the sample twisted at 20 mm/min from the edge reveals the high impact of the high torsional rate on the 316L SS microstructure, confirming the accumulation of plastically deformed material and the concentration of mechanical tensions (Figure 6b).
After torsion, structural fragmentation is more pronounced in samples with higher torsional rates. A larger/more pronounced relief and a more uneven distribution of plates are observed. The grain boundaries almost disappear in some areas, indicating that the material is at the limit of structural failure. As the shear deformation increased, the accumulated dislocations led to material displacement blocking areas at the low-angle grain boundaries. The energy of the packing defect and deformation leads to the formation of mechanically induced twins [22], and the accumulated material deformation favors grain refinement during the deformation process [23,24]. 316L SS is characterized by a face-centered cubic (FCC) system, low packing energy, and a dislocation cell structure that can be easily formed [13]. With increasing shear, numerous dislocations are formed in the grains. These dislocations accumulate and form dislocation blockages in the structure, and the sliding of the material grains becomes increasingly difficult. In addition to the dislocations, several twins were observed inside the grains, which contributed to the continued deformation process. In conclusion, this combination of mechanical treatments can be considered a good process for refining the structure of austenitic stainless steel.
The very good ductility properties of 316L SS are due to the plasticity phenomenon, which induces the formation of twins [25].
The deformation of the material by torsion is accompanied by the formation of twins by mechanical loading. Since the deformation due to the formation of twins depends on the orientation of the grains, this phenomenon is more common in the areas at the edge of the material, Figure 6a,b, compared to the central area of the material [26].
The effects of mechanical twinning on material hardening are complex and can be diametrically opposed. In the first case, there is a refinement in the structure and an increase in the microhardness of the material. In the second case, the concentrations of internal stresses are released, leading to a decrease in the hardness of the material occurs through relaxation of the structure, which is observed in the central area of the deformed material. Depending on which of these two phenomena prevails, the material will suffer an increase or decrease in the modulus of elasticity or hardness, respectively.
316L austenitic SS undergoes plastic deformation upon indentation. The material tends to deform significantly before fracture, allowing it to absorb energy and resist cracking. 316L SS hardens significantly when deformed. This means that as the material is deformed, its hardness can increase because of the dislocation movement in the crystal lattice. This hardening can improve the material resistance to subsequent indentation [27].
The indentation depth can vary depending on the applied load and the specific microstructure of the steel. Higher loads will normally result in deeper indentations, but the ability of the material to plastically deform can result in relatively shallow permanent deformation compared to harder materials. The surface condition of 316L SS can affect its indentation behavior. A polished surface may exhibit different indentation characteristics than a roughened surface because of differences in stress distribution and the potential for microstructural defects. At high temperatures, the 316 stainless steel may exhibit different indentation behaviors due to thermal softening. This can lead to lower hardness and greater plastic deformation under load. Compared with harder materials, 316L SS exhibits plastic deformation rather than brittle fracture during indentation. This makes it suitable for applications in which certain deformation levels are acceptable or desirable. Generally, the indentation behavior of 316L SS reflects its balance between strength, ductility, and toughness, making it a versatile material in a variety of engineering applications.
Torsion does not influence all parts of the material equally, and many studies have reported visible differences between the center and edges of torsional deformed materials. The differences are also observed structurally, both in the sample that has been twisted to failure and in the other partially twisted samples (Figure 4b and Figure 6). To analyze the effect of torsional deformation on the microhardness of the material, indentation tests were performed [9], considering the material as elastoplastic. The contact stiffness decreased in all but one of the cases in which the samples were mechanically processed by torsion. By reducing the contact stiffness, the material can be more easily machined [28].
From the indentation tests, hardness and Young’s modulus were estimated using the Oliver and Pharr method [9]. The 316L stainless steel exhibits indentation creep, as shown in Figure 7a. The dwell time values differed among the samples, and the value variation is shown in the graph in Figure 7b. The creep values seemed to increase as the sample was twisted (Figure 7b).
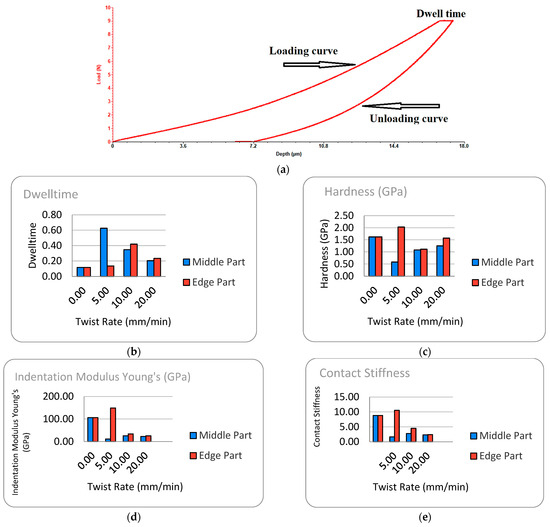
Figure 7.
Mechanical properties of the experimental samples (a) Load vs. depth variation, (b) dwell time vs. twist rate variation, (c) hardness vs. twist rate variation, (d) Indentation modulus vs. twist rate variation and (e) contact stiffness vs. twist rate variation.
The value of Young’s modulus of the initial material determined from different areas of the tensile failure curve (Figure 2) was found to be approximately 190~200 GPa, a value close to those reported in the literature. Indentation of the initial sample produced a Young’s modulus (indentation) of 104 GPa (Figure 7d). By torsion of the experimental samples, except for the sample twisted at 5 mm/min from the edge of the sample, which had a higher modulus value than the initial one (about 40%), which presents a large reduction in the indentation modulus (about 5 times lower), and in the case of the samples twisted at rates of 10 and 20 mm/min, such a large difference identified between the center and the edge of the one twisted at 5 mm/min is no longer observed. Young’s modulus reduction in the case of torsion at 10 and 20 mm/min rates increases the possibility of using these materials in medical applications for implants with a modulus close to that of biological bone (6~7 GPa) [29,30,31,32].
The microhardness in the center of the samples decreased compared to the initial value and to the edge of the sample (Figure 7c). The initial tensile stress supplemented by a lower degree of twisting of the experimental sample leads to a relaxation of the material network in the central area and a decrease in the microhardness of the material by accommodating the existing dislocations and the twins present in a smaller number in the structure at the beginning. Except for the hardened edge of the sample twisted at 5 mm/min, which had a higher contact stiffness than the initial sample, all other samples showed a decrease (Figure 7e).
Hengsberger et al. analyzed several samples of bovine bone by nanoindentation using the Oliver–Pharr modulus and reported values between 20 and 30 GPa—values also obtained for 316L SS samples after torsion at 10 and 20 mm/min rates [33]. The sample twisted at 10 mm/min had an indentation modulus of 25.3 +/− 4 GPa in the center of the sample and 34 +/− 6 GPa at the edge. For the sample twisted at a higher rate of 20 mm/min, the average values obtained were 23 +/− 3 at the center and 25.6 +/− 7 GPa at the edge. By increasing the torsional rate, a homogenization of the mechanical properties between the center and edge was obtained.
The samples were scratched on the polished surface, and the variation in the friction coefficient (COF) is shown in Figure 8 for the center (a) and for the edge in (b). All samples showed similar variations in COF with distance; a range of 1–8 mm was considered to avoid edge effects or the influence of the resin in which the sample was encapsulated. For the initial sample, the COF remained relatively unchanged over the entire distance, slightly fluctuating around a small value (about 0.2). These results suggest the high stability of the initial sample, indicating a material with uniform properties [34]. For the sample twisted at a 10 mm/min rate, the COF decreased and oscillated around an average value (approximately 0.5–0.6), indicating partial stability.
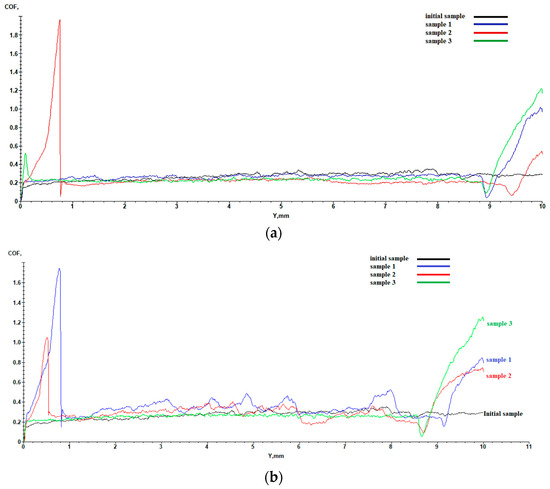
Figure 8.
The friction coefficient variation with distance (a) center against the initial and (b) edge against the initial.
The mean COF values ranged from 0.25 at the edge of the sample twisted at 10 mm/min—slightly lower than the initial sample values of 0.27–0.33 at the center of the sample twisted at 10 mm/min—to 0.39 at the center of the sample twisted at 5 mm/min, and 0.3 at the edge of the same sample. The sample twisted at 20 mm/min showed higher COF values than the initial sample, confirming the tendency of the material to harden more at the edge than at the center, with a COF value of 0.32 at the center compared to 0.29 at the edge of the sample. COF variations can be observed on the same section of the sample (Figure 8b) on the samples twisted at 5 and 10 mm/min, respectively, while the sample twisted at a higher rate showed a similar variation to the initial one, confirming a generalized change in the structure of the whole sample and not, as in previous cases, where differences were observed both structurally and in terms of mechanical properties between the central and edge areas (Figure 6).
For all cases, adhesive wear was observed (Figure 9), and more material was collected in the initial case (a), which was slightly comparable to the sample twisted at 20 mm/min in (d). In these experiments, all samples were pre-polished and adjusted to the same surface conditions. Since the wear mechanism is directly related to the surface properties of the material, flat surfaces are never truly flat (as they contain very small irregularities). When the stainless-steel surface slides under the indenter, the micro asperities in the contact area are plastically deformed under the test load [35,36]. The contact area between the two materials depends on the surface profile, deformation properties of the asperities, and normal and tangential forces that cause the connection to grow.
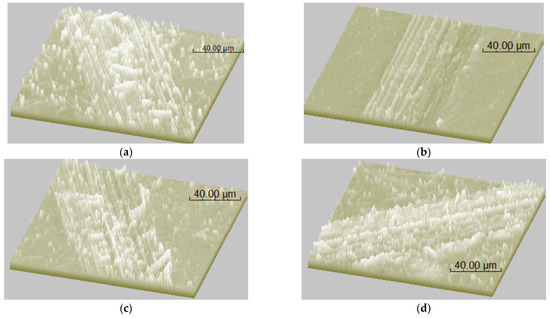
Figure 9.
3D images of the scratch (a) initial, (b) tensile + torsion rate of 5mm/min, (c) tensile + torsion rate of 10 mm/min, and (d) tensile + torsion rate of 20 mm/min.
As the sliding movement continues, new boundaries are formed, and new pieces of material break off. If the adhesive strength is greater than the cohesive strength of either material, the material breaks at the weaker asperity, in this case, the stainless-steel substrate. Because of frictional contact, material is transferred from one surface to another. Some material detaches from the substrate surface over time, forming loose wear particles. At the same time, deep pits will form on the surface [37,38]. The morphology analysis shows that the surface of the initial sample was more worn than the twisted sample. An explanation for this behavior is that due to the (mechanical) torsion, they present different degrees of deformation; for example, a higher hardness was obtained on the edge sample at a torsion of 5 mm/min (Figure 7c), in which significant work hardening was induced in the extreme surface layer by plastic deformation due to the indenter. Consequently, this sample is more resistant to plastic deformation due to contact movements during dry sliding. In the other cases, for example, when the sample was twisted at 20 mm/min (Figure 7c), a hardness close to the initial hardness was obtained, and the response of the surface to scratching was similar (Figure 9d).
4. Conclusions
The main conclusions drawn from the experimental results are the following:
- -
- Grain refinement occurs during complex mechanical loading, and large torsion angles can be applied to 316L SS.
- -
- As the torsion rate increases, the grains undergo plastic deformation, and the twins become smaller, affecting the integrity of the material. The grain size decreases by 25–30%; the dislocation density increases with the torsion angle, and, at the same time, the number of twins increases and the width decreases from 1 to 0.65 μm.
- -
- All three torsion curves exhibited a rapid initial increase followed by stabilization (close to the horizontal region). This indicates an initial elastic phase followed by a plastic phase or more stabilized behavior.
- -
- As the torsion rate increases, the grains undergo plastic deformation, and the twins become smaller, affecting the integrity of the material.
- -
- The effects of mechanical twinning on the material hardening are complex and can be diametrically opposed, affecting the hardness and elasticity values of the specimens.
Author Contributions
Conceptualization, M.G.H., L.A., and N.C.; methodology, G.B. and M.B., software, M.-A.B.; validation, L.A., N.C., D.C.A., and Ș.-C.L.; formal analysis, M.G.H.; investigation, L.A.; resources, M.B.; data curation, G.B.; writing—original draft preparation, L.A. and N.C.; writing—review and editing, G.B.; visualization, M.G.H.; supervision, Ș.-C.L.; project administration, L.A. All authors have read and agreed to the published version of the manuscript.
Funding
This research received no external funding.
Data Availability Statement
The original contributions presented in this study. Further inquiries can be directed to the corresponding authors.
Conflicts of Interest
The authors declare no conflicts of interest.
References
- Barrionuevo, G.M.; Ramos-Grez, J.A.; Sánchez-Sánchez, X.; Zapata-Hidalgo, D.; Mullo, J.L.; Santiago, D.; Puma-Araujo, S.D. Influence of the Processing Parameters on the Microstructure and Mechanical Properties of 316L Stainless Steel Fabricated by Laser Powder Bed Fusion. J. Manuf. Mater. Process. 2024, 8, 35. [Google Scholar] [CrossRef]
- Desua, R.K.; Krishnamurthya, H.N.; Aditya Balua, A.; Guptaa, A.K.; Singh, S.K. Mechanical properties of Austenitic Stainless Steel 304L and 316L at elevated temperatures. J. Mater. Res. Technol. 2016, 5, 13–20. [Google Scholar] [CrossRef]
- Dolzhenko, P.; Tikhonova, M.; Odnobokova, M.; Kaibyshev, R.; Belyakov, A. On Grain Boundary Engineering for a 316L Austenitic Stainless Steel. Metals 2022, 12, 2185. [Google Scholar] [CrossRef]
- Sajjadnejad, M.; Behnamian, Y. Investigating the Fracture Properties of 316 Stainless Steel. Adv. J. Chem. A 2024, 7, 190–208. [Google Scholar] [CrossRef]
- Balijepalli, S.K.; Donnini, R.; Kaciulis, S.; Montanari, R.; Varone, A. Young’s Modulus Profile in Kolsterized AISI 316L Steel. Mater. Sci. Forum. 2013, 762, 183–188. [Google Scholar] [CrossRef]
- Byun, T.S.; Gussev, M.N.; Lach, T.G.; McAlister, M.R.; Simpson, J.J.; Garrison, B.E.; Yamamoto, Y.; Joslin, C.B.; Carver, J.K.; List, F.A.; et al. Mechanical properties and Deformation Behavior of Additively Manufactured 316L Stainless Steel (FY2020); Oak Ridge National Lab. (ORNL): Oak Ridge, TN, USA; Argonne National Lab. (ANL): Argonne, IL, USA, 2020. [Google Scholar] [CrossRef]
- Puichaud, A.H.; Flament, C.; Chniouel, A.; Lomello, F.; Rouesne, E.; Giroux, P.F.; Maskrot, H.; Schuster, F.; Béchad, J.L. Microstructure and mechanical properties relationship of additively manufactured 316L stainless steel by selective laser melting. EPJ Nucl. Sci. Technol. 2019, 5, 23. [Google Scholar] [CrossRef]
- Hwang, I.S.; So, T.Y.; Lee, D.H.; Shin, C.S. Characterization of Mechanical Properties and Grain Size of Stainless Steel 316L via Metal Powder Injection Molding. Materials 2023, 16, 2144. [Google Scholar] [CrossRef]
- Oliver, W.C.; Pharr, G.M. Measurement of hardness and elastic modulus by instrumented indentation: Advances in understanding and refinements to methodology. J. Mater. Res. 2004, 19, 3–20. [Google Scholar] [CrossRef]
- Cojocaru, E.M.; Raducanu, D.; Vintila, A.N.; Alturaihi, S.S.; Serban, N.; Berbecaru, A.C.; Cojocaru, V.D. Influence of ageing treatment on microstructural and mechanical properties of a solution treated UNS S32750/EN 1.4410/F53 Super Duplex Stainless Steel (SDSS) alloy. J. Mater. Res. Technol. 2020, 9, 8592–8605. [Google Scholar] [CrossRef]
- Nocivin, A.; Raducanu, D.; Vasile, B.; Trisca-Rusu, C.; Cojocaru, E.M.; Dan, A.; Irimescu, R.; Cojocaru, V.D. Tailoring a Low Young Modulus for a Beta Titanium Alloy by Combining Severe Plastic Deformation with Solution Treatment. Materials 2021, 14, 3467. [Google Scholar] [CrossRef] [PubMed]
- Li, B.; Zheng, Y.; Liu, C.; Li, Q.; Zhang, Z.; Chen, X. Torsional thermomechanical fatigue behavior of 316LN stainless steel. Mater. Sci. Eng. A 2020, 789, 139676. [Google Scholar] [CrossRef]
- Zhang, J.; Huang, Z.; Rui, W.; Li, J.; Tian, Y.; Li, J. Combined Torsion and Tension on the Microstructure and Fracture Behavior of 316L Austenitic Stainless Steel. J. Mater. Eng. Perform. 2019, 28, 5691. [Google Scholar] [CrossRef]
- Zhang, P.; Han, W.; Huang, Z.; Li, G.; Zhang, M.; Li, J. Microstructure evolution and corrosion behavior of 316L stainless steel subjected to torsion. Mater. Res. Express 2021, 8, 086519. [Google Scholar] [CrossRef]
- Esmaeili, A.; Ghaffari, S.A.; Nikkhah, M.; Ghaini, F.M.; Farzan, F.; Mohammadi, S. Biocompatibility assessments of 316L stainless steel substrates coated by Fe-based bulk metallic glass through electro-spark deposition method. Colloids Surf. B Biointerfaces 2021, 198, 111469. [Google Scholar] [CrossRef]
- Muley, S.V.; Amey, N.; Vidvans, A.N.; Chaudhari, G.P.; Udainiya, S. An assessment of ultra fine grained 316L stainless steel for implant applications. Acta Biomater. 2016, 30, 408–419. [Google Scholar]
- Available online: https://www.italinox.ro/ (accessed on 10 September 2023).
- Andrusca, L.; Goanta, V.; Barsanescu, B.D.; Savin, A. Experimental characterization of materials subjected to combined loading conditions. IOP Conf. Ser. Mat. Sci. Eng. 2016, 147, 012092. [Google Scholar] [CrossRef]
- Hussaini, S.M.; Singh, S.K.; Gupta, A.K. Formability and fracture studies of austenitic stainless steel 316 at different temperatures. J. King Saud Univ. Eng. Sci. 2014, 26, 184–190. [Google Scholar] [CrossRef]
- Bocher, L.; Delobelle, P.; Robinet, P.; Feaugas, X. Mechanical and microstructural investigations of an austenitic stainless steel under non-proportional loadings in tension–torsion-internal and external pressure. Int. J. Plast. 2001, 17, 1491–1530. [Google Scholar] [CrossRef]
- Wu, X.L.; Ma, E. Dislocations and Twins in Nanocrystalline Ni After Severe Plastic Deformation: The Effects of Grain Size. Mater. Sci. Eng. A 2008, 483–484, 84–86. [Google Scholar] [CrossRef][Green Version]
- Xu, D.-S.; Chang, J.-P.; Li, J.; Yang, R.; Li, D.; Yip, S. Dislocation Slip or Deformation Twinning: Confining Pressure Makes a Difference. Mater. Sci. Eng. A 2004, 387–389, 840–844. [Google Scholar] [CrossRef]
- Nagaraj, M.; Ravisankar, B. Effect of Severe Plastic Deformation on Microstructural and Mechanical Properties of Structural Steel IS2062. Trans. Indian Inst. Met. 2018, 71, 2315–2323. [Google Scholar] [CrossRef]
- Zheng, Z.J.; Gao, Y.; Gui, Y.; Zhu, M. Corrosion Behaviour of Nanocrystalline 304 Stainless Steel Prepared by Equal Channel Angular Pressing. Corros. Sci. 2012, 54, 60–67. [Google Scholar] [CrossRef]
- Lewandowski, J.J.; Seifi, M. Metal additive manufacturing: A review of mechanical properties. Annu. Rev. Mater. Res. 2016, 46, 151–186. [Google Scholar] [CrossRef]
- Zhai, W.; Liu, F.; Wang, Q.; Nai, S.M.L.; Zhou, W. Cryogenic and high temperature tensile properties of 316L steel additively manufactured by laser powder bed fusion. Mater. Sci. Eng. A 2024, 900, 146461. [Google Scholar] [CrossRef]
- Attabi, S.; Himour, A.; Lakhdar Laouar, L.; Motallebzadeh, A. Effect of Ball Burnishing on Surface Roughness and Wear of AISI 316L SS. J. Bio- Tribo-Corros. 2021, 7, 7. [Google Scholar] [CrossRef]
- Zhai, C.; Hanaor, D.; Gan, Y. Contact stiffness of multiscale surfaces by truncation analysis. Int. J. Mech. Sci. 2017, 131–132, 305–316. [Google Scholar] [CrossRef]
- Thiagarajan, G.; Begonia, M.T.; Dallas, M.; Lara-Castillo, N.; Scott, J.A.M.; Johnson, M.L. Determination of Elastic Modulus in Mouse Bones Using a Nondestructive Micro-Indentation Technique Using Reference Point Indentation. J. Biomech. Eng. 2018, 140, 071011. [Google Scholar] [CrossRef] [PubMed]
- McKee, C.T.; Last, J.A.; Russell, P.; Murphy, C.J. Indentation Versus Tensile Measurements of Young’s Modulus for Soft Biological Tissues. Tissue Eng. Part B Rev. 2011, 17, 155–164. [Google Scholar] [CrossRef]
- Rodriguez-Floreza, N.; Oyenb, M.L.; Shefelbinea, S.J. Insight into differences in nano indentation properties of bone. J. Mech. Behav. Biomed. Mater. 2013, 18, 90–99. [Google Scholar] [CrossRef]
- Mohammed, M.T.; Khan, Z.A.; Siddiquee, A.N. Beta titanium alloys: The lowest elastic modulus for biomedical applications: A review. Int. J. Chem. Mol. Nucl. Mater. Metall. Eng. 2014, 8, 726–731. Available online: https://www.researchgate.net/profile/Mohsin-Mohammed/publication/265396160_Beta_Titanium_Alloys_The_Lowest_Elastic_Modulus_for_Biomedical_Applications_A_Review/links/570b5a4b08ae2eb94220239b/Beta-Titanium-Alloys-The-Lowest-Elastic-Modulus-for-Biomedical-Applications-A-Review.pdf (accessed on 5 April 2024).
- Hengsberger, S.; Enstroem, J.; Peyrin, F.; Zysset, P. How is the indentation modulus of bone tissue related to its macroscopic elastic response? A validation study. J. Biomech. 2003, 36, 1503–1509. [Google Scholar] [CrossRef] [PubMed]
- Lu, P.; Xu, Z.; Tian, Y.; Yang, R.; Hu, K.; Li, H.; Yin, Y.; Chen, X. Effect of Initial Surface Scratches on the Cavitation Erosion Behavior of 316L Stainless Steel Substrates and 316L Stainless Steel Coatings. Materials 2023, 16, 1392. [Google Scholar] [CrossRef]
- Dai, F.; Cheng, W.; Zheng, Y.; Chen, X. The effect of rolling contact fatigue properties on 316 stainless steel under laser shock peening. Opt. Laser Technol. 2021, 141, 107159. [Google Scholar] [CrossRef]
- Peng, G.; Liu, Y.; Xu, F.; Jiang, H.; Jiang, W.; Zhang, T. On determination of elastic modulus and indentation hardness by instrumented spherical indentation: Influence of surface roughness and correction method. Mater. Res. Express 2023, 10, 086503. [Google Scholar] [CrossRef]
- Upadhyay, R.K.; Kumar, A. Scratch and wear resistance of additive manufactured 316L stainless steel sample fabricated by laser powder bed fusion technique. Wear 2020, 458-459, 203437. [Google Scholar] [CrossRef]
- Kopec, M.; Dubey, V.P.; Pawlik, M.; Woodb, P.; Kowalewski, Z.L. Experimental identification of yield surface for additively manufactured stainless steel 316L under tension–compression-torsion conditions considering its printing orientation. Manuf. Lett. 2024, 41, 28–32. [Google Scholar] [CrossRef]
Disclaimer/Publisher’s Note: The statements, opinions and data contained in all publications are solely those of the individual author(s) and contributor(s) and not of MDPI and/or the editor(s). MDPI and/or the editor(s) disclaim responsibility for any injury to people or property resulting from any ideas, methods, instructions or products referred to in the content. |
© 2025 by the authors. Licensee MDPI, Basel, Switzerland. This article is an open access article distributed under the terms and conditions of the Creative Commons Attribution (CC BY) license (https://creativecommons.org/licenses/by/4.0/).