Article

Build Orientation-Driven Anisotropic Fracture Behaviour in Polymer Parts Fabricated by Powder Bed Fusion

by
Karthik Ram Ramakrishnan
and
Jagan Selvaraj
*
Bristol Composites Institute, University of Bristol, Bristol BS8 1TR, UK
*
Author to whom correspondence should be addressed.
J. Manuf. Mater. Process. 2024, 8(6), 263; https://doi.org/10.3390/jmmp8060263
Submission received: 30 October 2024 / Revised: 15 November 2024 / Accepted: 18 November 2024 / Published: 20 November 2024

Abstract

:
Additive manufacturing (AM) enables fabricating intricate objects with complex geometries previously unattainable through conventional methods. This process encompasses various techniques, including powder bed fusion (PBF), such as selective laser sintering (SLS) and multi-jet fusion (MJF). These techniques involve selectively melting powdered polymer material, predominantly utilizing engineering thermoplastics layer by layer to create solid components. Although their mechanical properties have been extensively characterised, very few works have addressed the influence of additive manufacturing on fracture behaviour. In this context, we present our work demonstrating the presence of anisotropy in fracture behaviour due to the build orientation as well as the PBF methods. To evaluate this anisotropy, the fracture behaviour of polyamide 12 polymer manufactured by SLS and MJF were investigated with experiments and numerical modelling of Mode I compact tension (CT) specimens. Experiments were monitored by digital image correlation (DIC) and infra-red thermography (IRT). Additionally, the fractured surfaces are analysed using scanning electron microscopy. Comparative analyses between SLS and MJF technologies unveiled dissimilar trends in mechanical strength, build-orientation effects, and fracture properties.

1. Introduction

Additive manufacturing (AM) of polymers, also known as 3D printing, uses layer-by-layer material deposition to build complex geometries that are difficult or impossible to produce using traditional manufacturing methods. One of the categories of AM is the power bed fusion (PBF), which includes techniques such as selective laser sintering (SLS) and multi-jet fusion (MJF) [1,2]. In PBF techniques, the powdered material is spread evenly over a build platform, and a laser or other heat source selectively melts and fuses the material together layer by layer, until the final part is formed. The SLS technique uses a high-powered laser to selectively melt and fuse layers of powdered polymer material together, typically nylon, to create a solid part. In MJF, a thin layer of powdered polymer material is spread over the build platform. Then, an inkjet array is used to selectively apply a fusing agent onto the powder bed [3]. The fusing agent is designed to absorb energy from an IR heat lamp, which then selectively melts and fuses the powder in the areas where the fusing agent was applied. After the first layer is completed, another layer of powder is spread on top, and the process is repeated until the part is fully built layer by layer. MJF holds significant promise for a wide array of industrial applications, as it can produce parts in a fraction of the time compared to other manufacturing techniques. It is clear that powder bed techniques present numerous merits, including expedited design-to-production cycles, high resolution, intricate geometry fabrication without additional support, and economical small-scale part production and excellent mechanical properties.
A comparative study of SLS and MJF is essential because although both technologies are compatible with thermoplastics such as polyamides, their preparation and performance of the materials differ. By investigating these methods, informed decisions tailored to the specific application requirements can be obtained. As the fields of prototyping and end-use part production expand, understanding the strengths and limitations of SLS and MJF in areas like mechanical properties, thermal stability, and isotropy is critical. This comparison can highlight which process better suits innovative applications in industries such as aerospace, healthcare, and automotive.
Among the thermoplastics used in engineering, polyamides (PA), polyimides (PI), polyetherimides (PEI), and polycarbonates (PC) are the most commonly used materials [4,5]. Of these materials, polyamide-12 (PA12) is the primary choice, constituting over 90% of polymeric PBF components due to its ease of processing, cost effectiveness, low density, and impact resistance [6]. The improved AM techniques and process optimisation have seen the role of AM shift from mere prototyping to encompass end-use applications in a wide range of industries, from aerospace to medical device manufacturing. It is crucial to study the mechanical properties of components fabricated using AM if they are to be used in demanding applications where high mechanical strength and durability are required. In these applications, any deficiencies in mechanical properties could have serious consequences, such as product failure or even injury. Mechanical testing allows us to evaluate the quality and integrity of the printed part, which is essential in ensuring that it meets the intended application requirements.
The stiffness and strength of additively manufactured polymers are influenced by factors such as the type of polymer material, the build direction, the printing parameters, and the post-processing methods. Several researchers have conducted extensive mechanical characterization of PBF specimens, including standard tests like tension, compression, flexural, and shear loading [7,8]. These investigations also encompass the influence of varied processing conditions and build orientations on the mechanical properties [9,10,11,12,13]. The build direction can have a significant effect, as AM involves building up the part layer by layer, which can cause variations in the material structure and orientation depending on the direction in which the layers are printed.
The focus of the current work is fracture properties since most of the published literature focusses on the quasi-static compressive and tensile properties of PA12-based PBF samples, and there is limited literature on the fracture properties. Therefore, it is essential to study the fracture properties of additively manufactured polymers to identify weaknesses, assess the impact of printing parameters, and develop designs that can withstand mechanical stresses to ensure product reliability and safety. The fracture toughness in additively manufactured samples is different from studies of homogenous materials because of the layer-by-layer manufacturing and the difference between the interface of powder in each layer and the particles between adjacent layers, which give AM parts anisotropic properties on multiple size scales [14]. A comparison of the fracture behaviour of SLS and injection moulding PA12 parts showed different trends in the energy at crack growth initiation for varying thickness of the specimen [15]. Researchers used compact tension (CT) and single edge-notch bending (SENB) tests to measure the fracture toughness of AM specimen [16,17,18,19,20,21]. Cano et al. [17] conducted fracture tests using CT specimen of laser-sintered PA12 and PA12 reinforced with glass beads at different temperatures and with load applied perpendicular and parallel to the layered structure, and they found that the fracture behaviour was controlled by microstructural defects such as adhesion faults between layers and a poor adhesion between the glass beads and the matrix. Mode I and mode II fracture tests performed on SENB specimens obtained through the SLS process of polyamide PA2200 material showed that process energy and build orientation had a huge influence on the fracture toughness, with almost an order of magnitude difference caused by varying laser power and scanning velocity [19]. Brugo et al. [18] assessed key issues in crack propagation of SLS-printed PA12 samples, focusing on build directions and the method of pre-cracking, and reported that the CT specimen built with layers parallel to the crack plane exhibited low fracture toughness, as there was a preferential pathway for the crack to propagate. Lingua et al. [20] implemented a micro-stereoscopic digital image correlation (DIC) of a CT specimen manufactured using fused filament fabrication in order to obtain full-field displacement and strain measurements in the vicinity of the propagating crack and used this data to identify the meso-structure-related local phenomena. Stoia et al. [22] presented both theoretical and experimental findings concerning the mixed mode I/II fracture characteristics in SLS-printed polyamide using semi-circular bending (SCB) specimens with crack orientations set at different angles. It was reported that the trajectory of cracks predominantly followed the path along the weaker plane, exhibiting an interlayer-to-intralayer fracture transition, which resulted in a zig-zag pattern of crack propagation.
In terms of manufacturing processes and their effect on mechanical properties, there is some literature comparing the properties of PA12 polymers manufactured using SLS and MJF technologies [23]. Cai et al. [6] reported that even though the polymer powder feedstock used in both SLS and MJF exhibited near identical thermal features, phase constitutions, functional groups, and chemical states, there was an appreciable difference in the trend of mechanical strength and build orientation. They observed a clear drop in strength when changing the printing direction from the XY plane to the Z axis for the SLS parts, whereas a similar effect was not evident for the MJF parts. It was hypothesised that this variation was due to the different sintering approach of the two technologies, with MJF resulting in a better sinter quality between the layers. It was also possible that the volume distributions of the pores and their morphology could be a factor in the anisotropy. Calignano et al. [24] studied the tensile properties of specimen in different orientations and reported that the modulus and strength of PA12 manufactured by SLS appeared to be higher than that obtained from MJF. Xu et al. [11] also reported that SLS parts have better mechanical performance and a higher degree of crystallinity compared to parts manufactured using MJF, which may be attributed to the instant heating capability of the laser source. It was also reported that although semicrystalline polyamide manufactured using SLS and MJF had similar surface roughness and glass transition values, there was a marked difference in fracture properties found from puncture tests, and the inhomogeneities from the manufacturing process resulted in MJF samples having a lower deformation energy absorption [25].
In this paper, the fracture properties of additively manufactured polyamide from two powder bed fusion techniques, namely SLS and MJF, are assessed using a combination of experimental characterisation using compact tension tests and numerical simulation using the finite-element model with cohesive zone elements.

2. Materials and Methods

The fracture toughness measurement method is defined by the ASTM E1820 Standard using a compact tension (CT) specimen, which is a single edge-notched plate loaded in tension. The geometry and the dimensions of the samples are shown in Figure 1 and were adapted from CT specimen of composites proposed by Pinho et al. [26]. The purpose of this test method is to load a pre-cracked specimen to obtain stable crack propagation, which results in a continuous value of relationship between fracture toughness and crack extension. This allows to determine the fracture resistance of materials and can be used for material comparison, selection, and quality assurance. A 0.4 mm wide pre-crack (highlighted in red) was machined using a diamond wafering blade, and a sharp notch was cut at the end of this slit using a 0.1 mm thick Japanese micro saw. The samples for the SLS were manufactured using the EOS Formiga P110. Commercial polyamide powder PA2200 (PA12, melting temperature 176 °C) with D50 particle diameter of 58 μm was supplied by EOS, and the built-in factory processing parameters were used for the manufacturing. The laser is a 30 W laser, but the laser power in the chamber is approximately 21 W during sinter, as it is not run at full power. The layer thickness is 100 μm, and the powder bed temperature is 170 °C. The default settings for scanning speed (2500 mm/s) and hatching distance (0.25 mm) were used, resulting in a surface energy density of 3.36 J/cm2.
The samples for MJF were manufactured using an HP Jet Fusion 5210 machine, which has an effective build volume of 350 mm (X) × 255 mm (Y) × 350 mm (Z) and a building speed up to 5058 cm3/h. The powders have particle size of 60 μm and layer thickness of 80 μm. The specimens were printed using the ‘Advanced’ print mode and a mixture of the virgin/used HP PA12 powders with a ratio of 30:70, as recommended by the manufacturer. The IR lamps have PWM (pulse width modulation) power control, which modulates the power according to the head position. For this study, two build orientations of specimens for each materials were manufactured, namely XY and Z types. It can be seen from Figure 1b that the difference between these two specimens resides in the orientation of the additive manufacturing printer. As the build direction is along the z-axis, the layers of the XY specimens are contained in the plane of the thickness (4.5 mm), whereas for the Z specimens, the layers are contained in the plane of the width (60 mm).

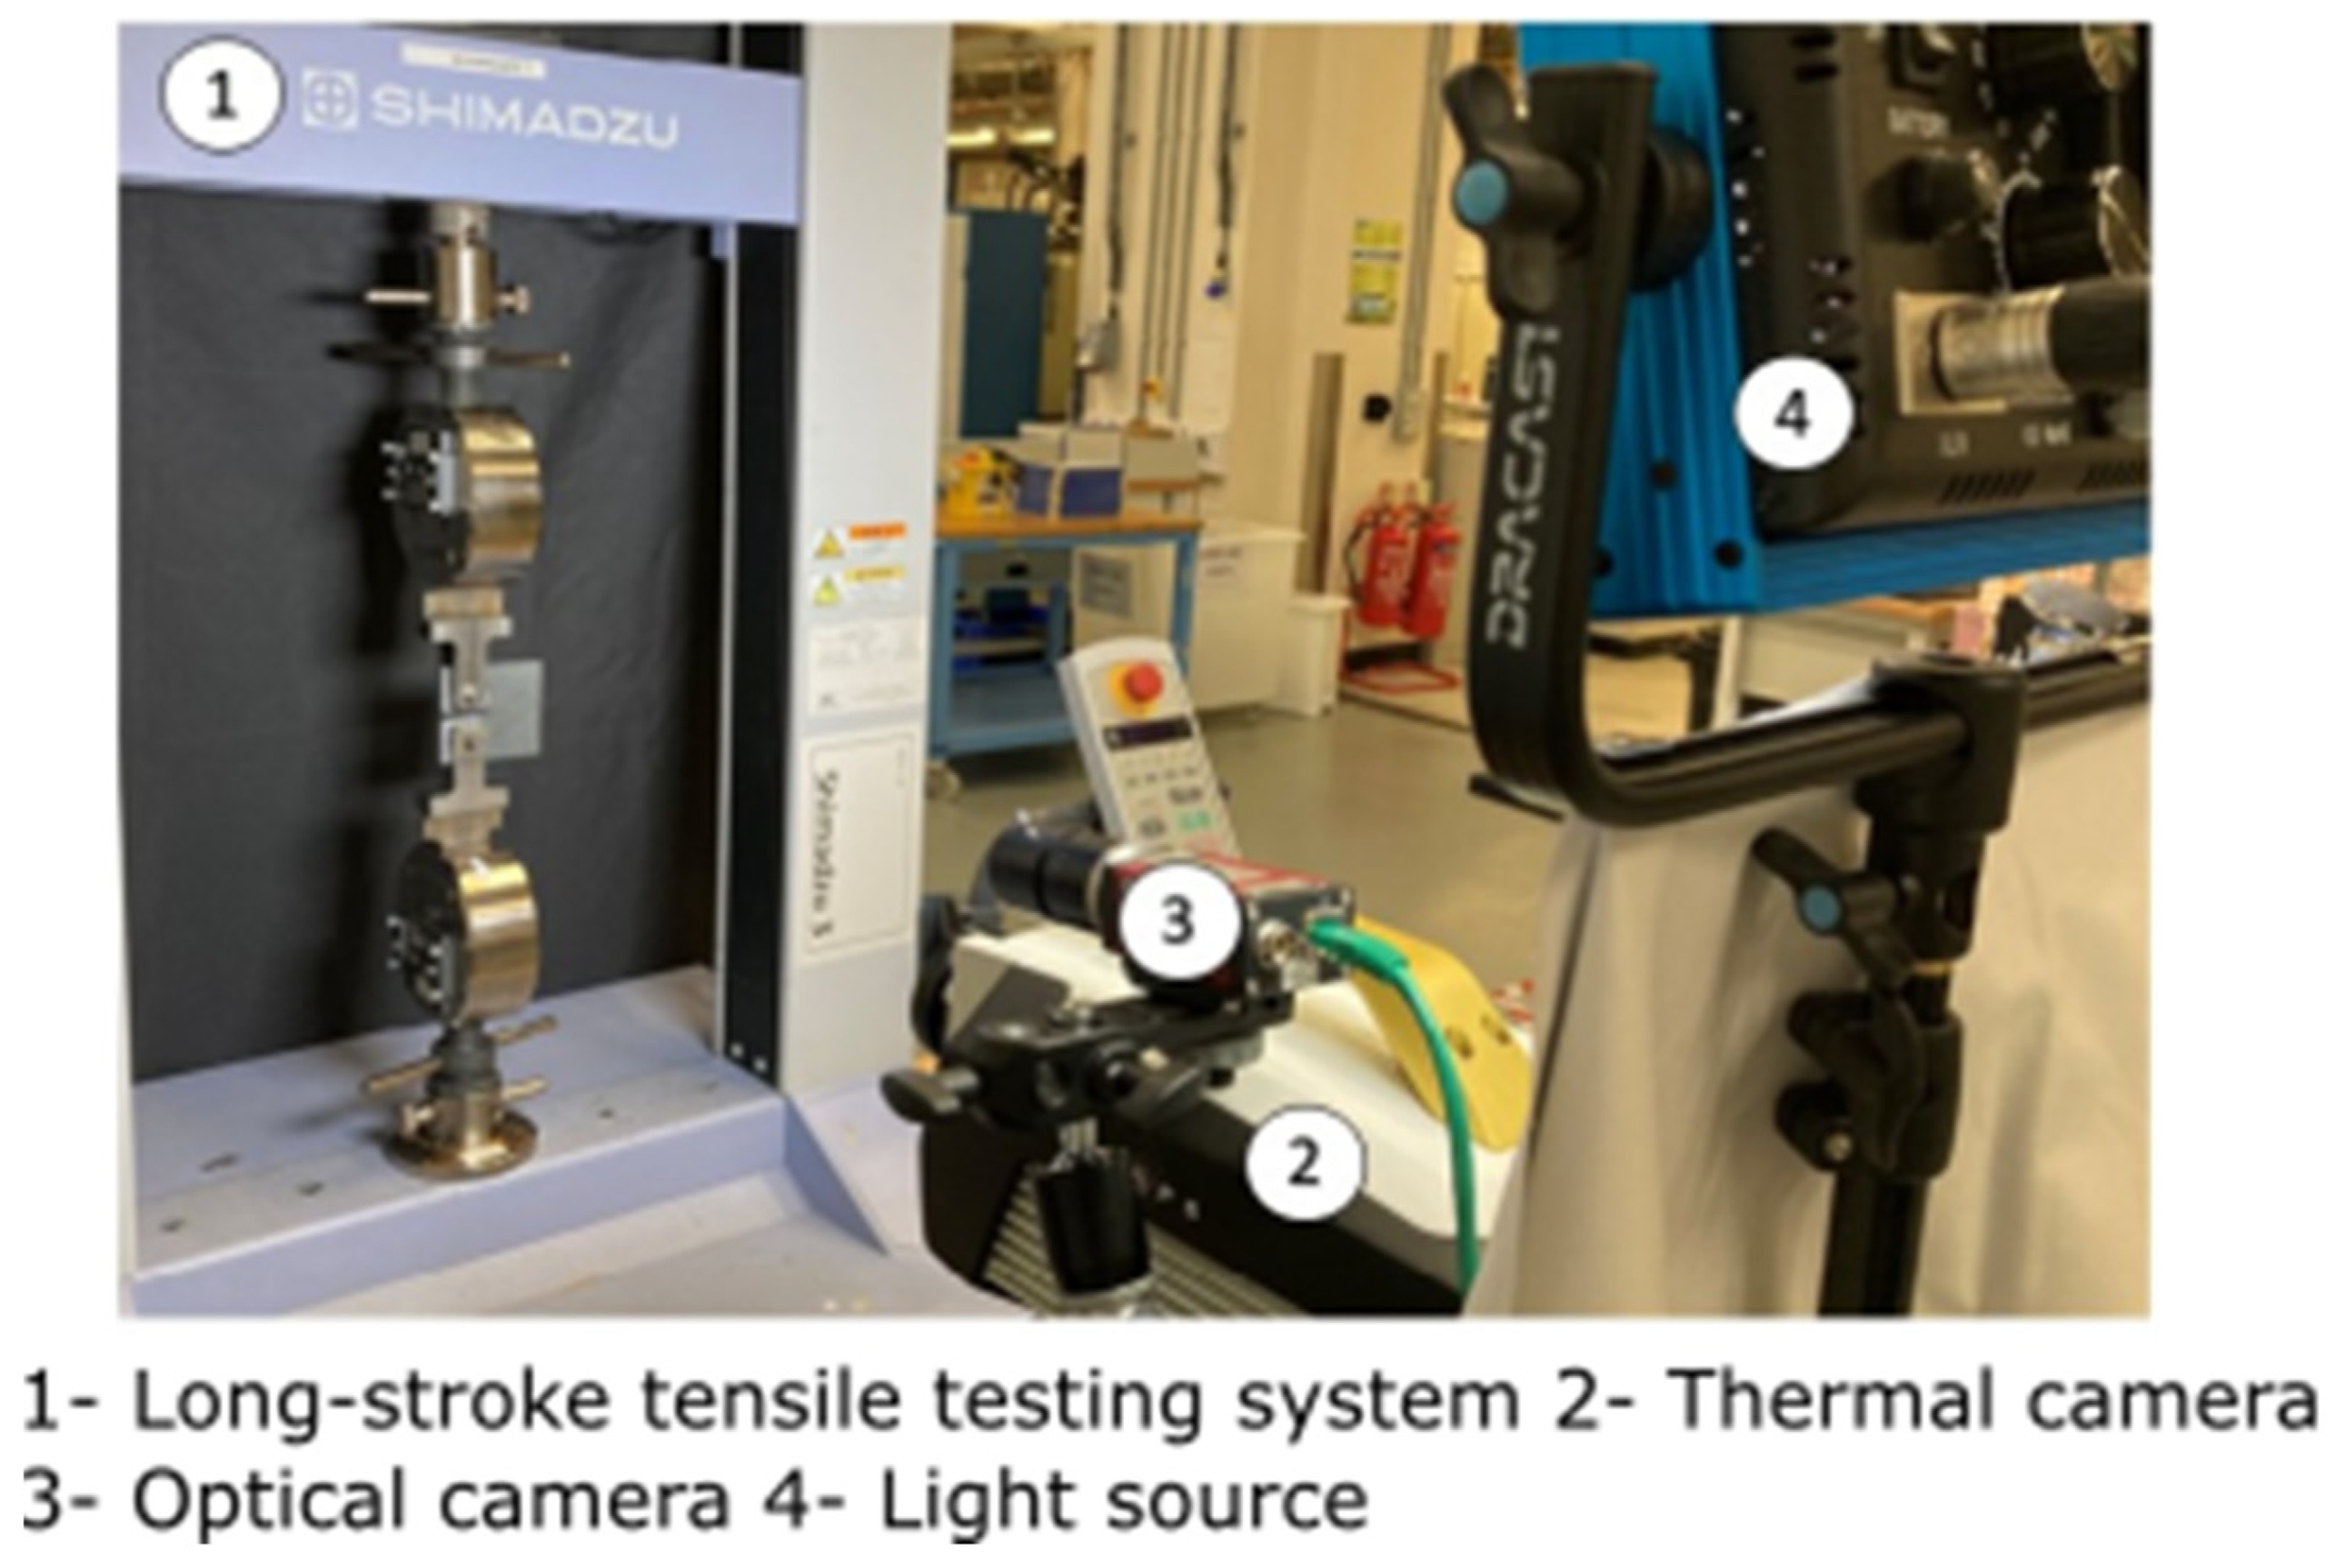
2.1. Experimental Setup

The experimental setup of the compact tension test is shown in Figure 2. The test machine used was a Shimadzu AGS-10kNXD. Two cameras, namely a high-resolution optical camera (iMetrum Flexi IM-CAM-036) and thermal camera (Telops Fast Mk3), were placed approximately 50 cm in front of the sample to measure the opening displacement (OD) and the crack growth. The crosshead displacement rate was set to 0.5 mm/min to conduct the test in quasi-static conditions, and the test was stopped before complete breakage (when the load variations started to become very low). As the tests were conducted in quasi-static conditions, the frequencies of acquisition of both cameras could be quite low. Indeed, for the optical camera, the frequency of acquisition is 1 frame per second (fps) and for the thermal camera is 10 fps. The higher acquisition rate was used for the thermal camera because the peaks of heat released during crack propagation were very short.
Typical images from the optical and thermal camera are shown in Figure 3. The crack location and opening displacement can be measured from the digital image correlation (DIC) analysis of the optical camera images. The DIC technique determines displacement and strain fields by comparing images taken before and during tests. Pixel subsets are matched between images to find undeformed points’ locations in the deformed image, revealing their displacement. Specimen surfaces were painted with a speckle pattern using a spray cannister to create random pattern. To precisely locate the crack tip, it is important to have an accurate measurement of the strain field and high spatial resolution at the same time. To achieve this, a facet size of 25 pixels, grid spacing of 11 pixels, and contour smoothing of 9 facets was set. Moreover, to measure the opening displacement (OD), which is defined as the distance between the centres of the two holes in the sample, with the thermal camera, two circular reflectors with a diameter of 4 mm were put in place on both sides of the notch, and the centres of the fixing parts were marked with a white point. The thermal camera image shows the surface temperature measured from the specimen, assuming an emissivity of 1. The crack tip location is visible as a ‘hotspot’ at the point of crack propagation.

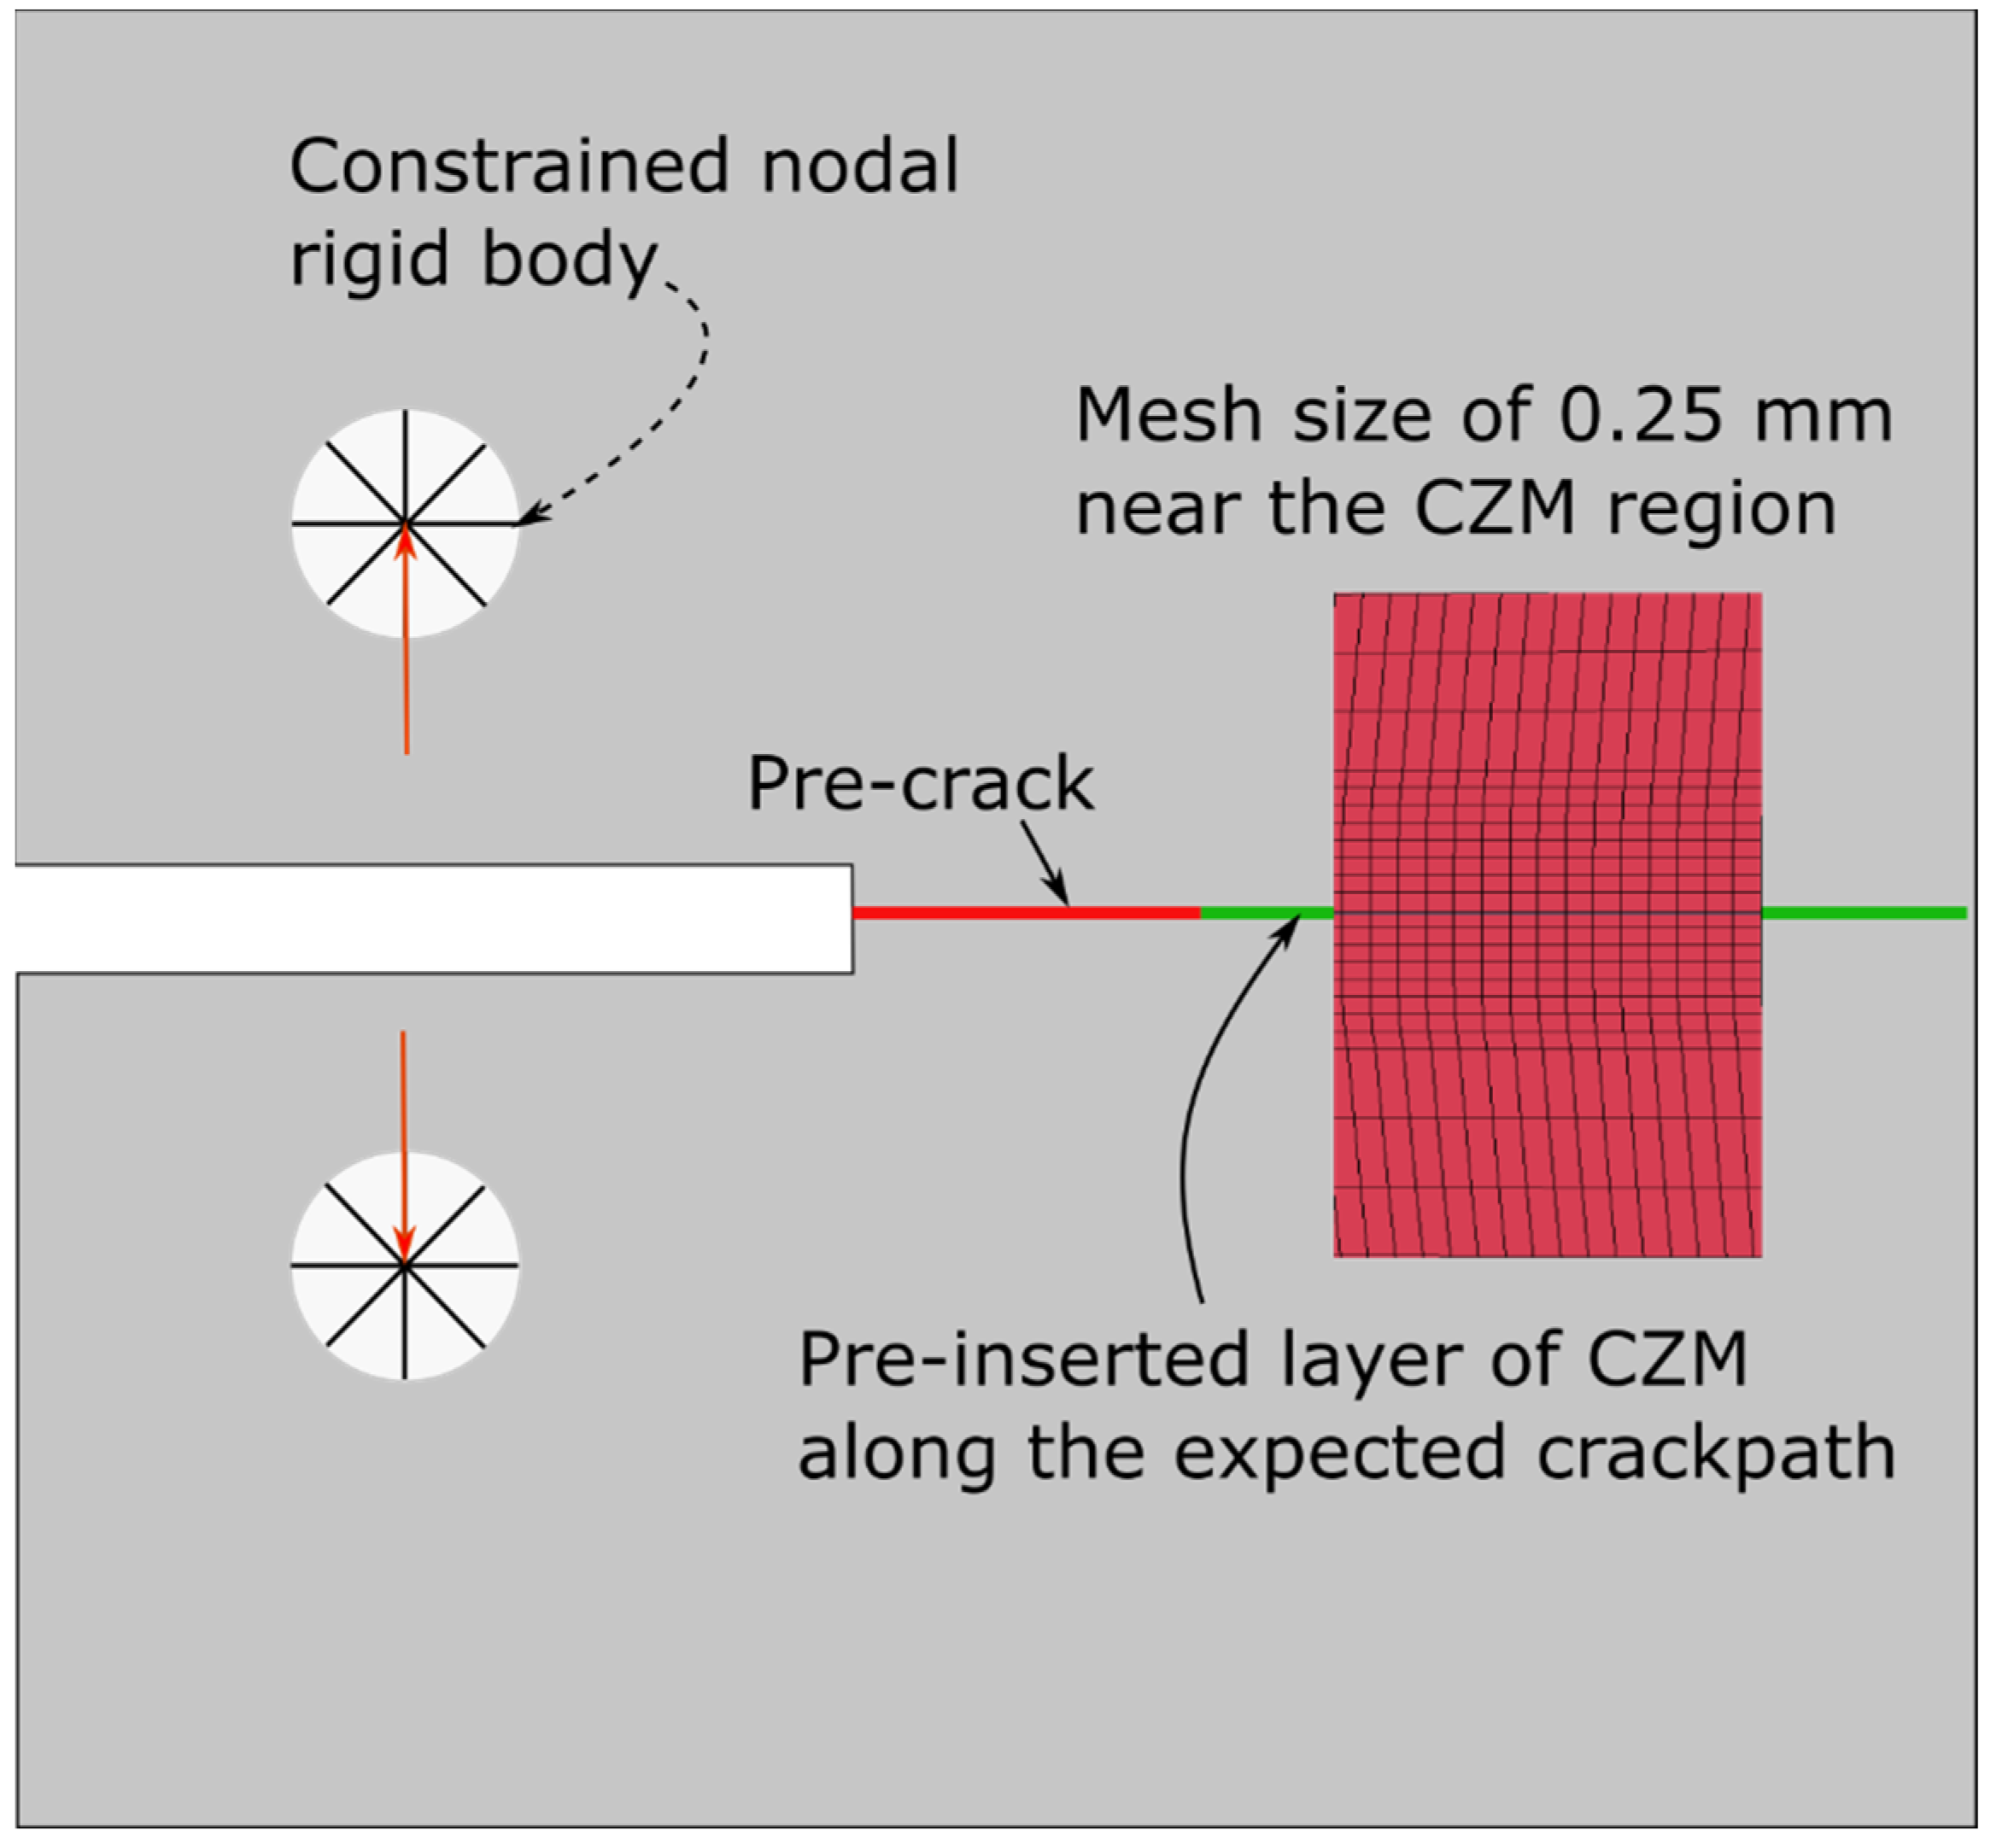
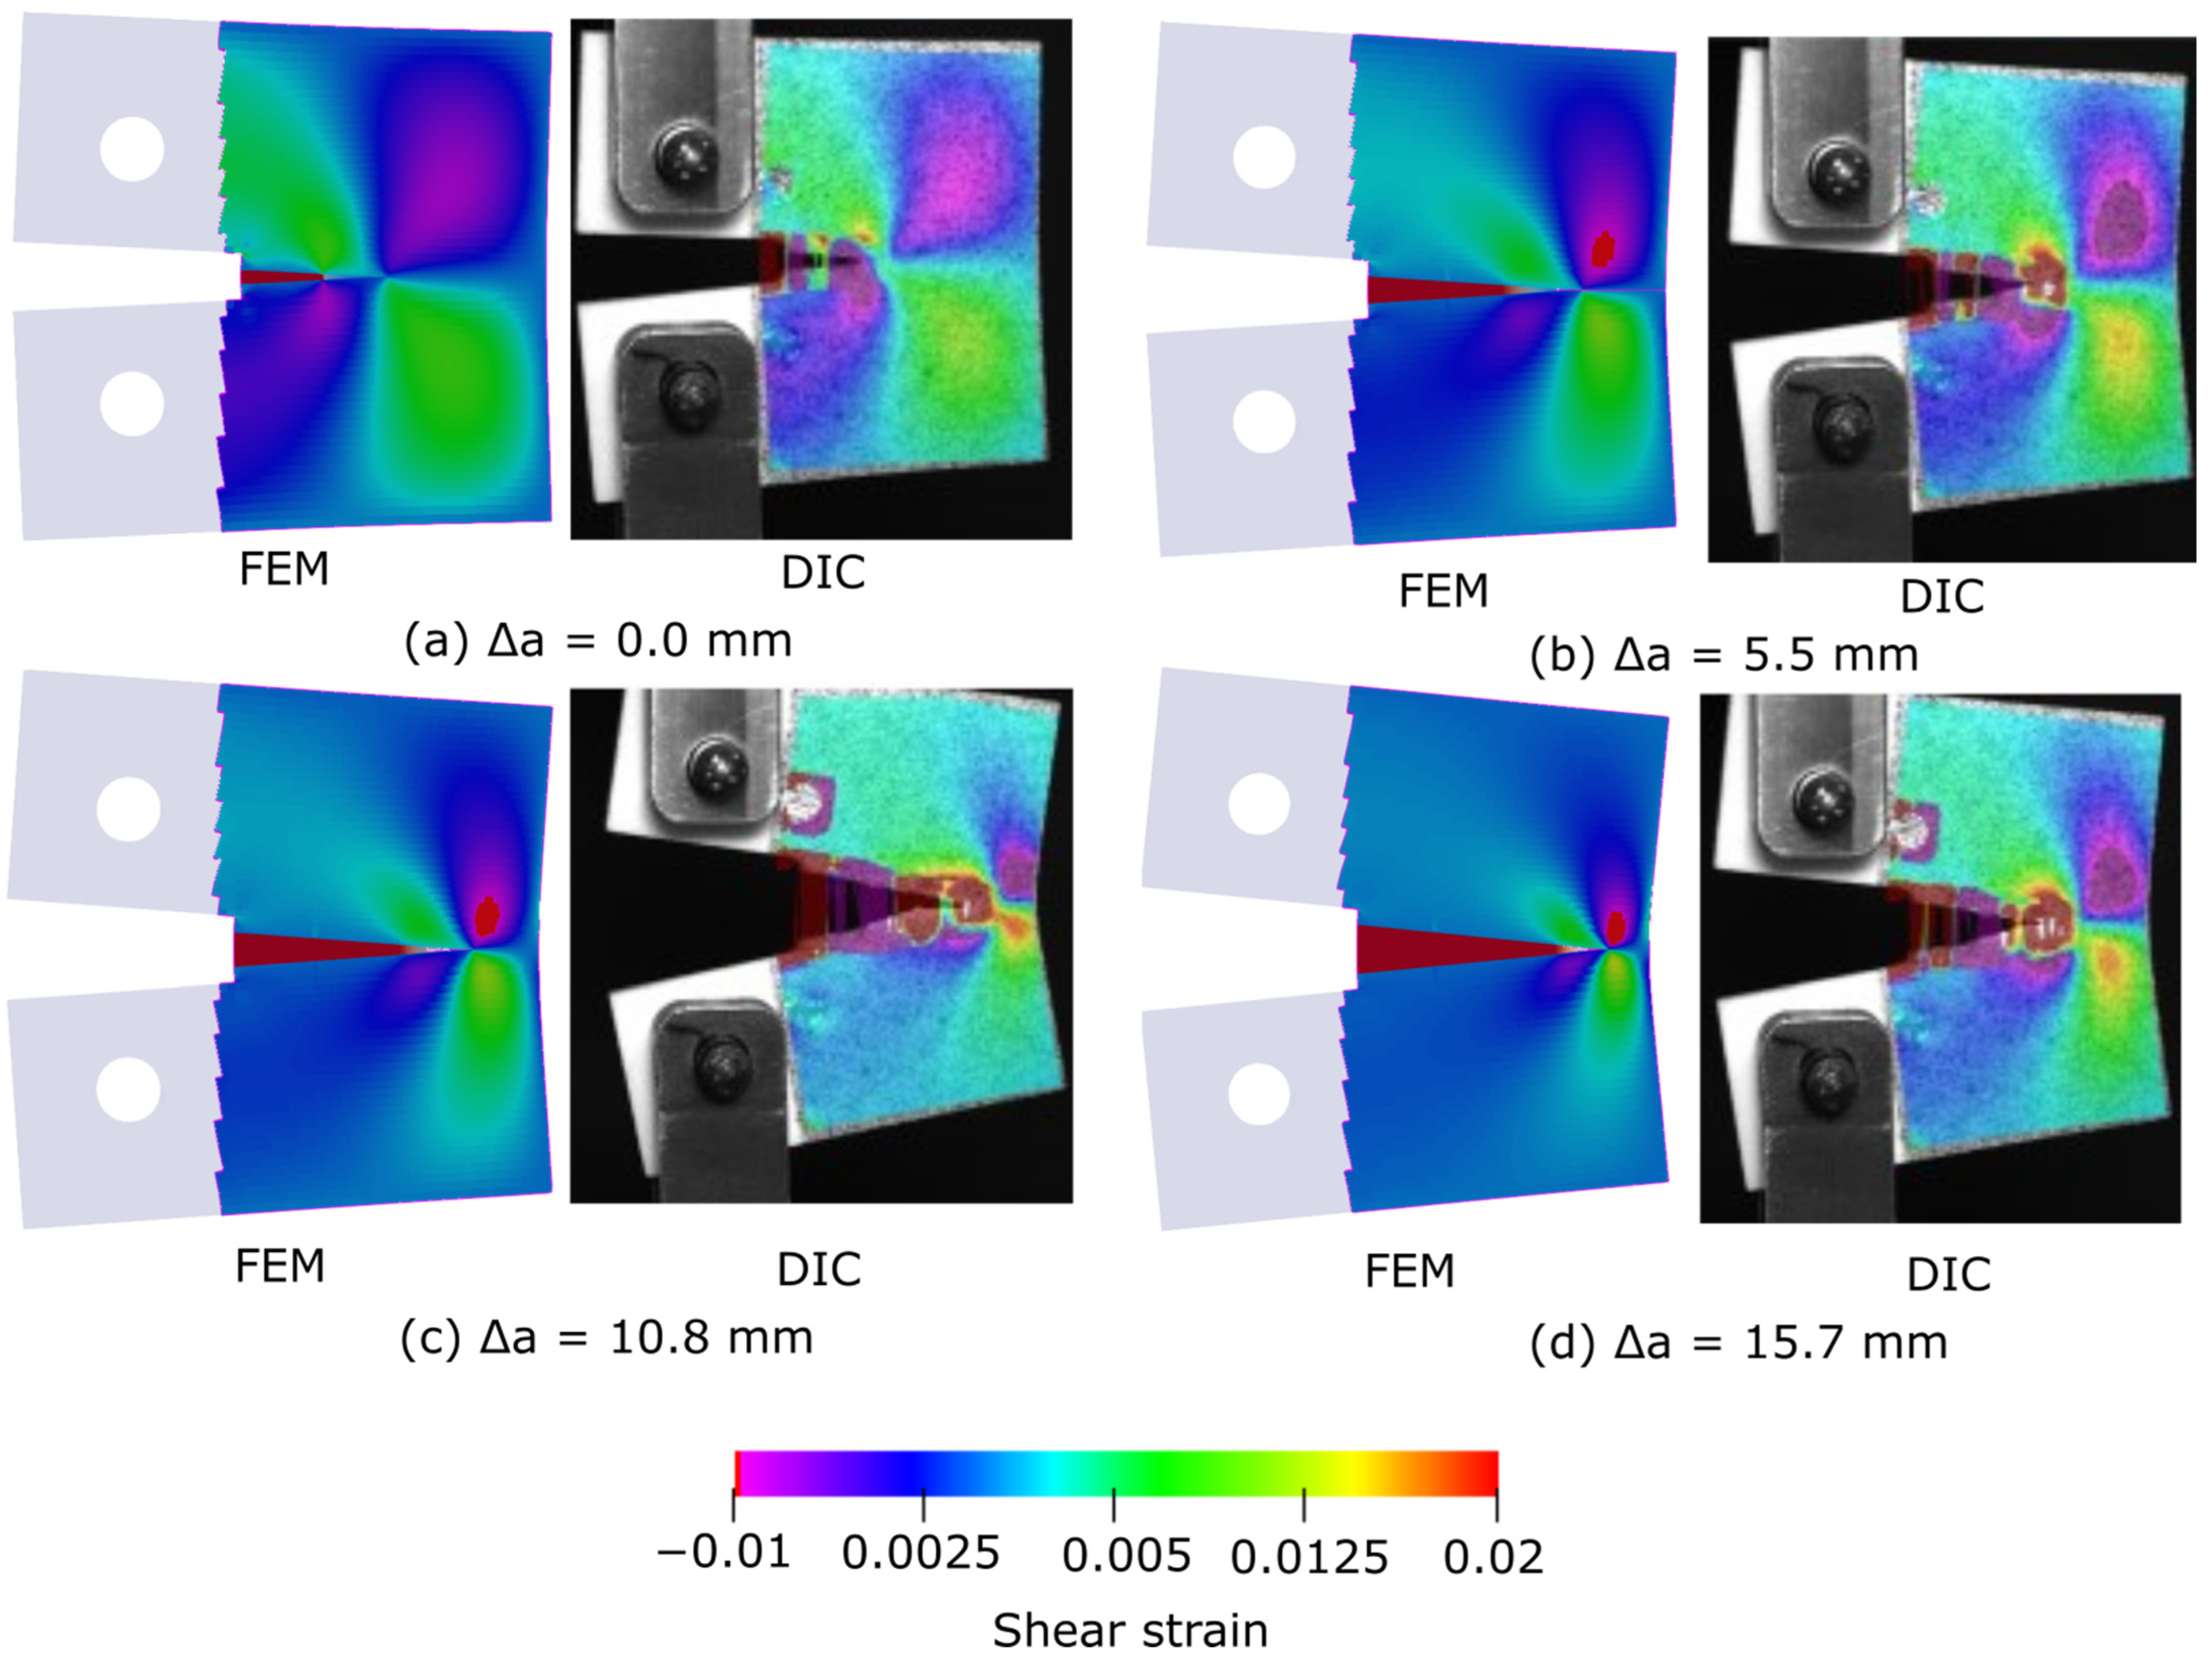
2.2. Numerical Model
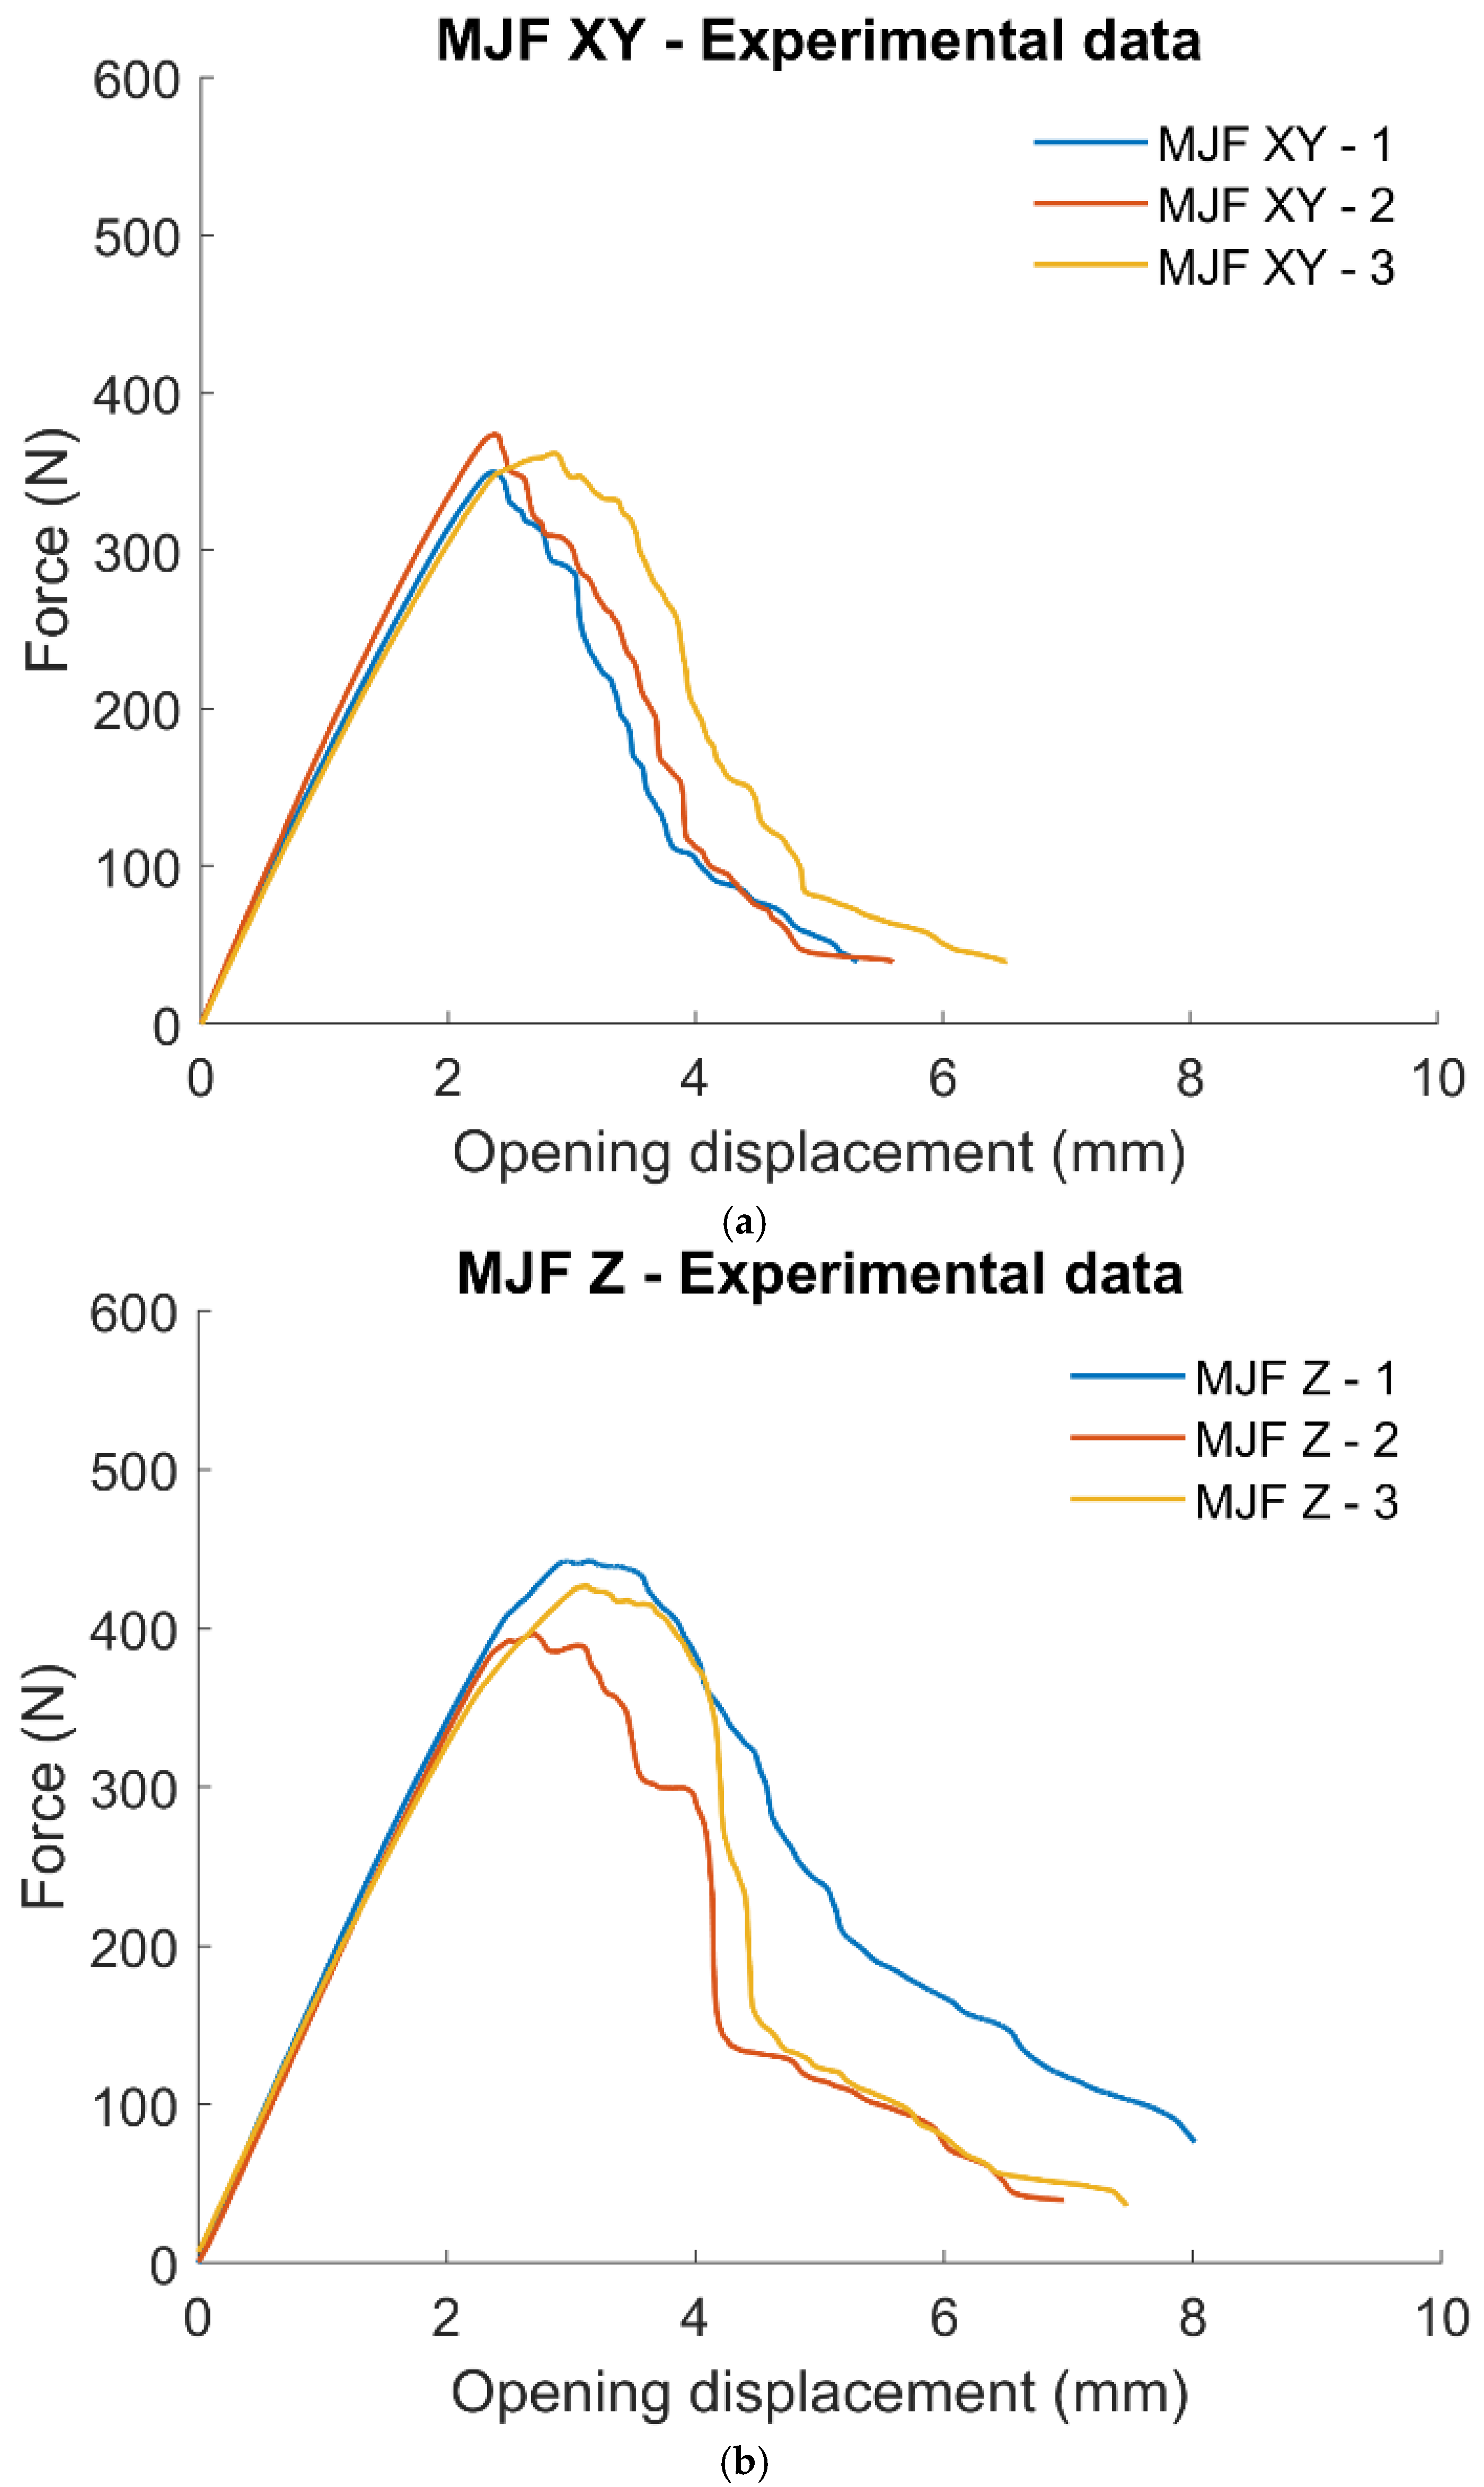
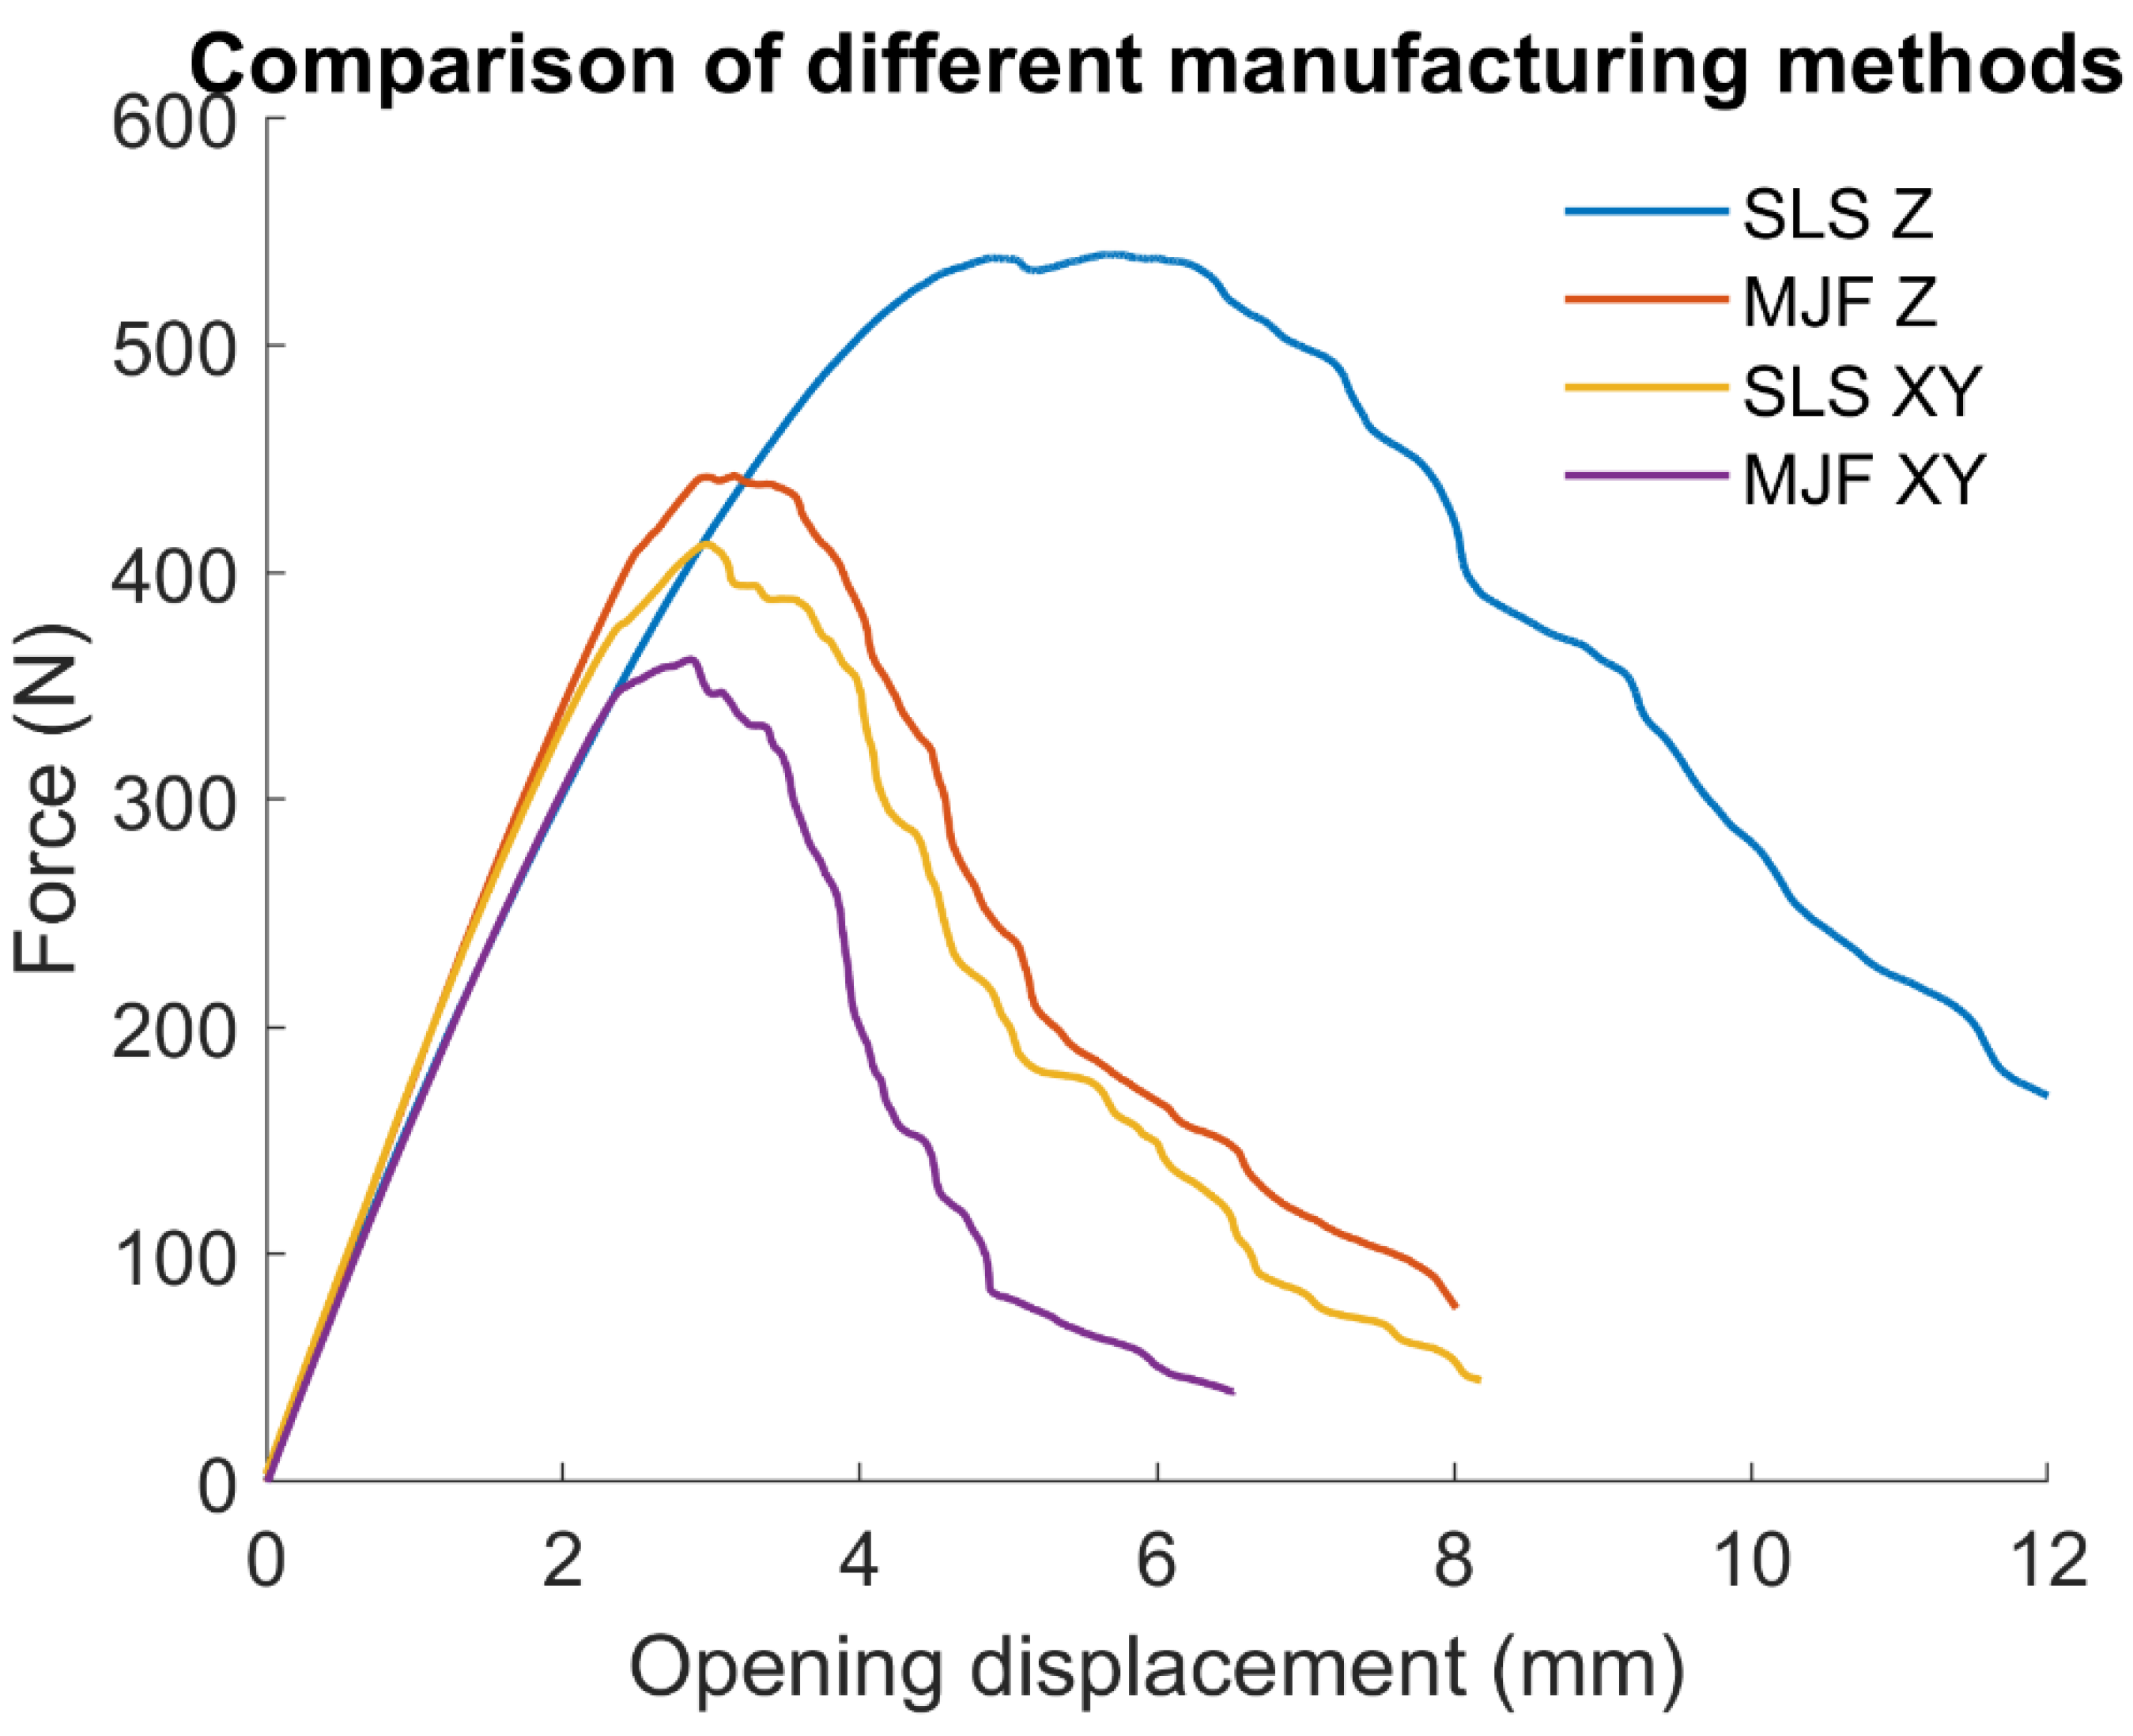
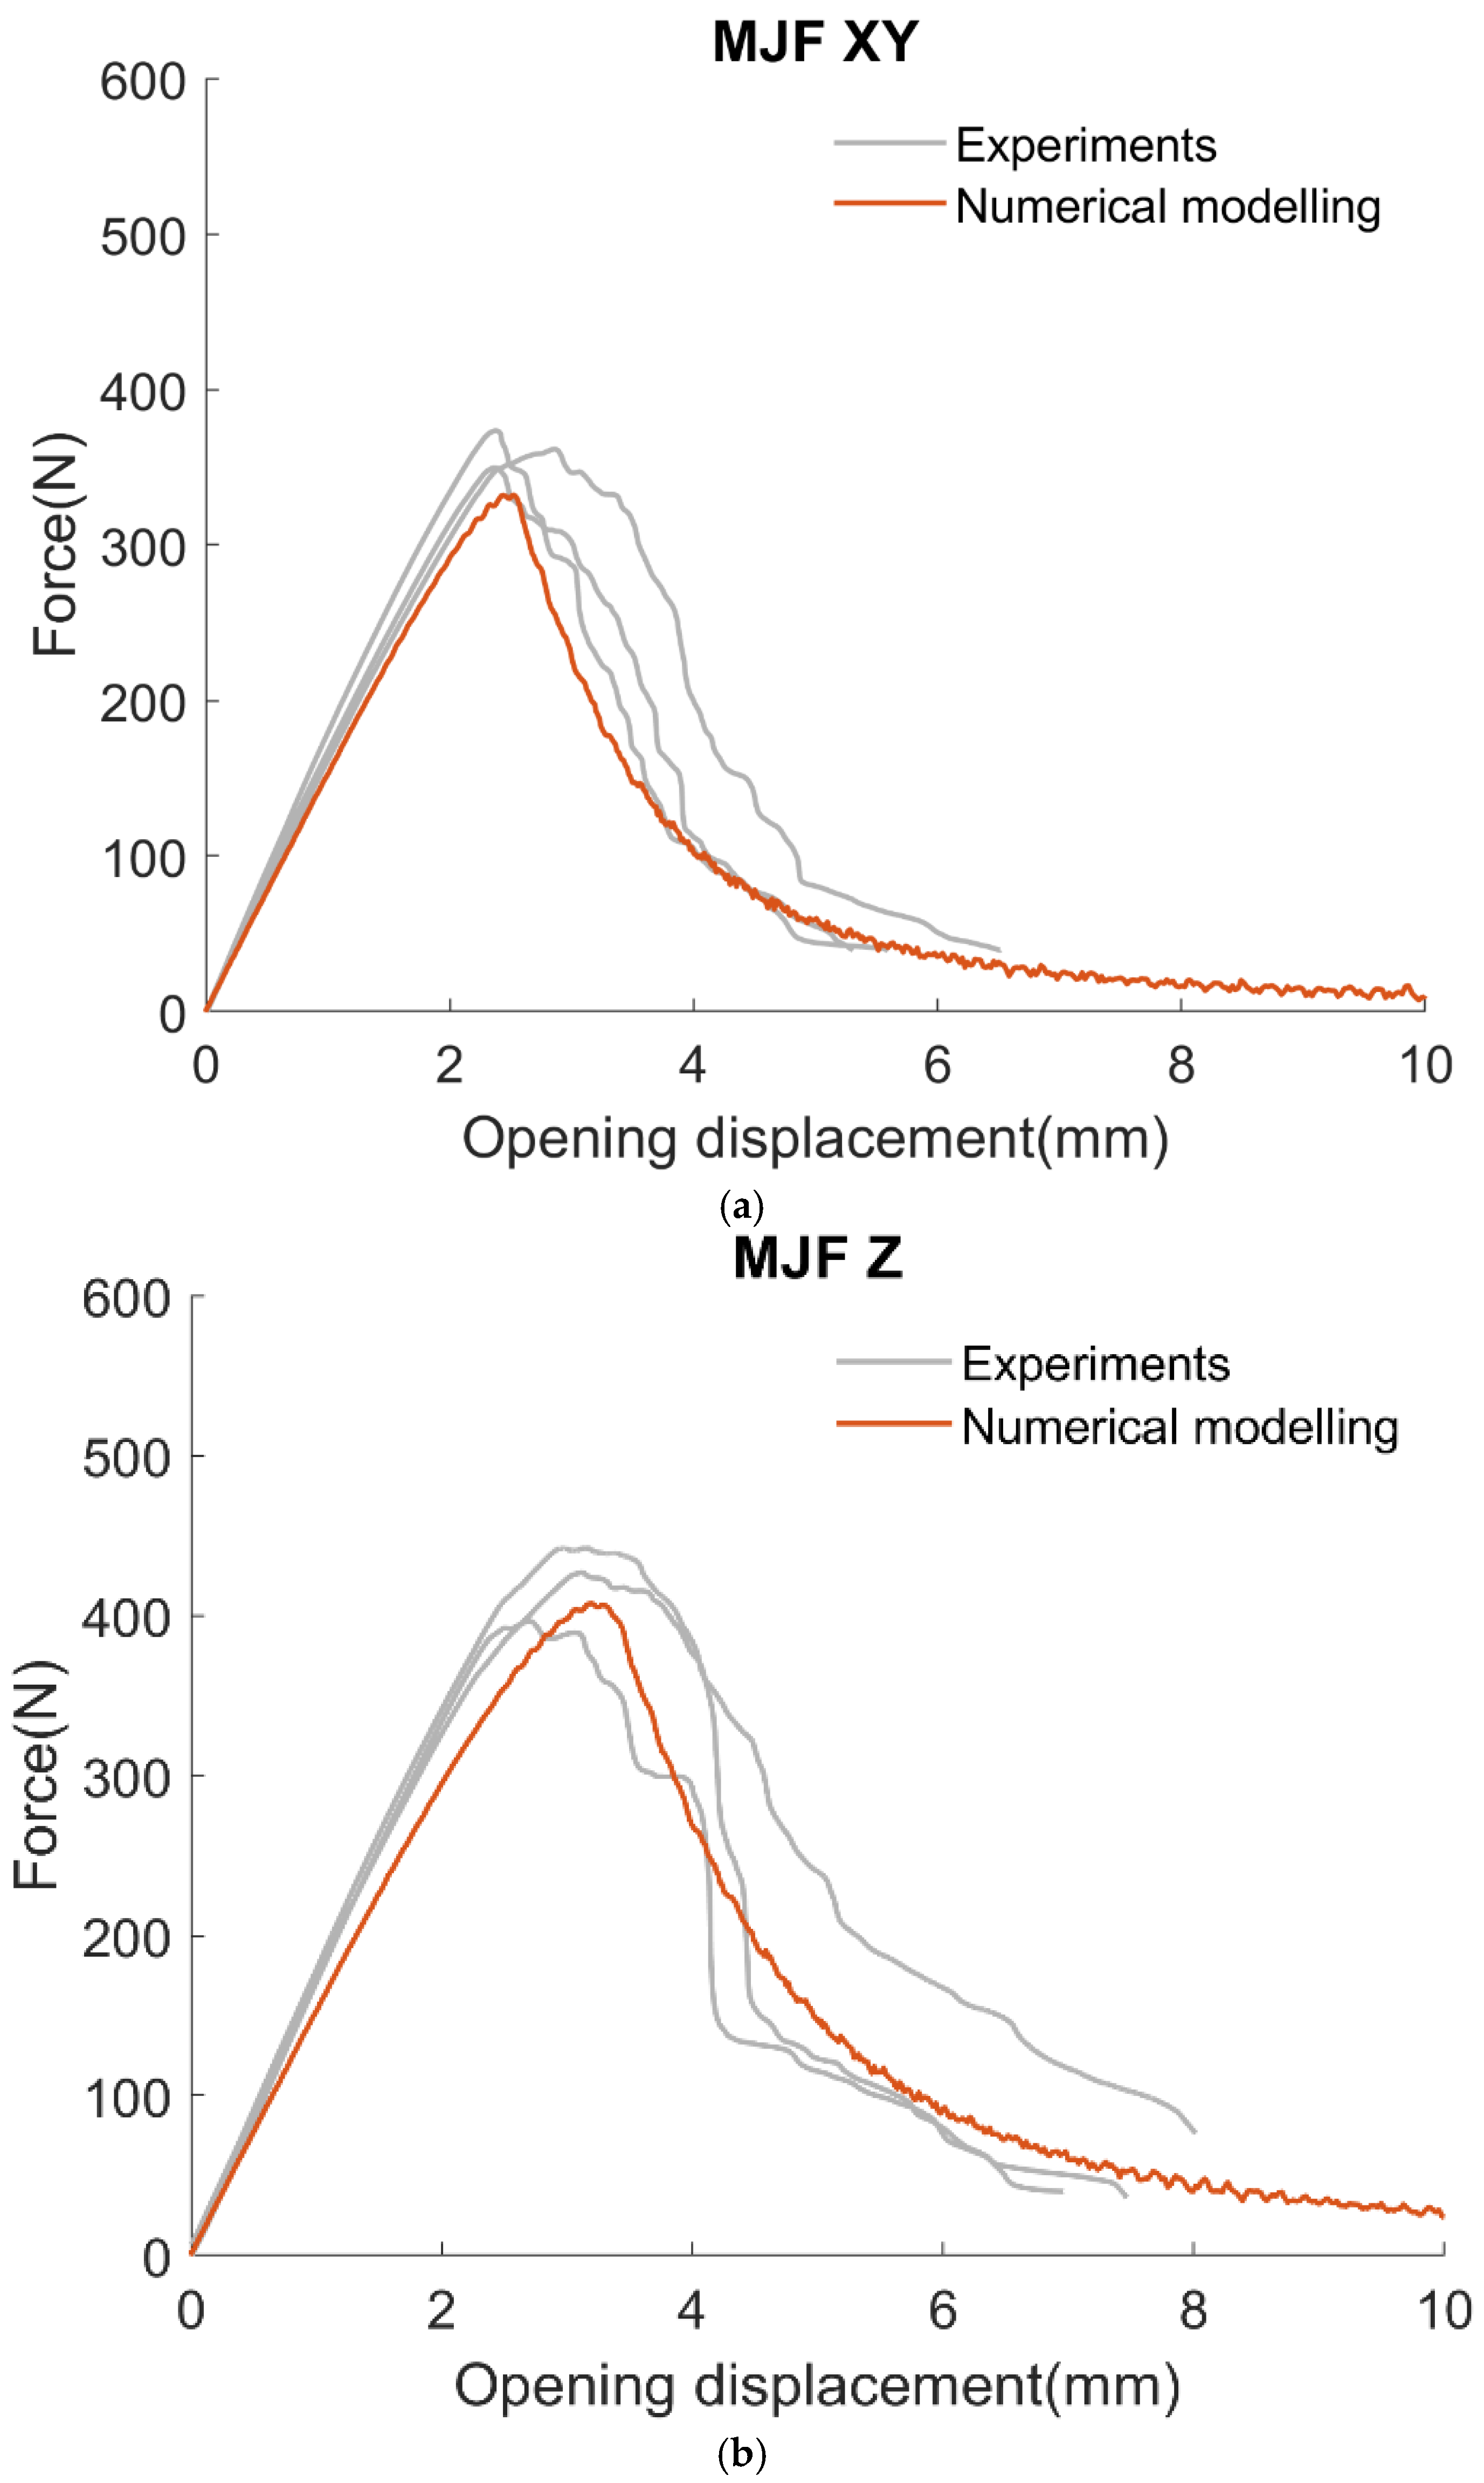
To quantify the differences in the manufacturing methods, i.e., SLS and MJF, and their printing direction on the failure initiation (peak load) and propagation (absorbed energy), a simplified numerical modelling method is introduced in this section. The key interest is to be able to model at the continuum length scale with sufficient accuracy to predict the peak load and the associated failure propagation. This is because modelling with particle-based methods, although accurate, is computationally expensive, especially when extended to large models.
The numerical model used in the current work is shown in Figure 4, and the dimensions are same as in Figure 1. This modelling was performed in the commercial finite-element solver LS-Dyna using explicit time integration. The analysis was performed with quasi-static loading conditions such that the inertial effects were minimal. The continuum was discretised with linear elastic solid elements. In the region in front of the pre-crack, a layer of linear cohesive elements was pre-inserted. Cohesive zone modelling (CZM), implemented through these cohesive elements, models the non-linear traction-separation behaviour in an energy-regularised manner such that displacement discontinuities are modelled explicitly in the mesh during crack propagation. Due to the nature of loading and the specimen design, crack branching was not expected, and thus, an adaptive crack modelling method was not required.
To simulate the loading applied at the notch in the experiments, displacement boundary conditions were applied at the centroid of the notch, and the equivalent values were transmitted to the nodes at the periphery of the notch using constraint equations. This was performed using the *CONSTRAINED_NODAL_RIGID_BODY keyword in LS-Dyna, and only the translational degrees of freedom were constrained. In experiments, the contact area of the loading pin may not be equal to the circumferential area of the notch. To understand this effect, the contact area was varied using the constraint equations, and its effect on failure load was studied. However, the effect was negligible, and therefore, a full contact area, as shown in Figure 4, was assumed.
The continuum was modelled with elastic–plastic behaviour using piecewise-linear plasticity. The material properties for the PA12 were mentioned in Xu et al. [11] (see Table 1). The behaviour of the fracture process zone ahead of the crack-tip was modelled with the fracture properties shown in Table 2. The cohesive zone modelling (CZM) was performed using a bi-linear cohesive law [27,28]. Among the fracture properties, mode I fracture toughness is the critical parameter since the failure initiation and propagation happens with only the opening of crack and without sliding and is derived from the experimental results presented in this manuscript. It is worth mentioning that the mean values from the experiments were used in the numerical modelling.

3. Results

Figure 5 shows the force vs. displacement curves of three samples from each material configuration: SLS XY and Z. The curves for both the SLS XY and Z specimens follow a linear loading phase till peak load. The crack length stays the same during this loading phase. This is followed by the first load drop due to crack extension. The force vs. opening displacement curves for XY specimens and Z specimens show that there is a significant effect of the build orientation. The peak force for the Z specimens reaches nearly 550 N instead of about 350–400 N for the XY specimens. Moreover, these curves show that the opening displacement at this peak where the crack began to grow is reached at 3.5 mm for the XY specimens and around 6 mm for the Z specimens. Therefore, it appears that the SLS XY additive manufacturing process presents values of force and displacement about 50% lower than the Z orientation. It can be hypothesised that this difference is due to the three different fusion stages involved in the SLS process, namely single-track fusion, fusion between tracks, and fusion between layers. During the first stage in the sintering, the laser scans a single track on the powder bed, causing the fusion of powder particles and the formation of sintering necks between them. In this stage, the sintering necks between neighbouring particles are dense and compact due to the simultaneous melting and coalescence of the powder particles. In the second stage, a parallel track is fused, similar to the previous one, but with a reduction in the area of sintering necks between the two tracks. This reduction is attributed to the cooling of the previous track during the fusion of the new track. The weak bonding strength between tracks could be the reason for the lower strength in the XY build direction of the SLS specimens.
A similar analysis was performed for the MJF XY and Z specimens and is shown in Figure 6. It appears that the difference between the build orientations is less significant even if the Z specimen is marginally stronger than XY. Indeed, the maximum of loading is reached around 350 N for the XY specimens and around 400 N for the Z specimen. Moreover, the displacement values corresponding to the peak force are also quite comparable. This similarity can be explained by the MJF process, where there are only two fusion stages, namely fusion between areas and fusion between layers. This contrasts with the point fusion mode of SLS, and therefore, the duration necessary for fusing an area or layer in MJF is notably diminished.
It can be hypothesised that this faster sintering results in a significant decrease in temperature disparities between adjacent areas or layers and enhanced sinter quality. Indeed, it is around 2.5 mm of opening displacement for the XY specimens and around 3 mm for the Z specimens.
There is still a significant build-orientation effect, and it appears that the MJF Z additive manufacturing process presents values of force and displacement about 20% higher than the XY orientation. This is supported by the porosity analysis of μ-CT images presented by Lee et al. [29], where it was reported that the Z orientation had much lower porosity compared to the XY build orientation. A similar trend of porosity was reported for SLS process [30], and it is expected that the increased performance of the SLS Z orientation may be attributed to the pore volume and distribution, as in the MJF AM samples.
A comparison of all four configurations in Figure 7 shows the difference of the manufacturing process and the build direction for the additively manufactured CT specimen. Each curve in Figure 7 was obtained by averaging the samples corresponding to the manufacturing process and orientation shown in Figure 5 and Figure 6.
While the initial stiffness of the linear region is similar for the different processes, the peak force for crack initiation and the crack propagation response is different for each configuration. The SLS process appears to have a higher peak force for both XY and Z build directions in comparison to the MJF process. The improved interlayer adhesion of SLS achieves higher strength, while the anisotropy of the MJF process is much reduced. This is perhaps due to its high-energy laser selectively fusing powdered material, creating a denser and more homogeneous structure, while the uniform heating of the IR lamps of the MJF process reduces the anisotropy effects. However, it should be highlighted that in SLS, most of the thermal energy absorbed by PA12 comes from IR, as the bed temperature is maintained just below melting. The laser only brings the enthalpy needed to melt the polymer. It should also be noted that even though both SLS and MJF techniques use polyamide, the polymer grades are potentially different in terms of average molecular weight and polydispersity. This can itself result in different bulk mechanical properties, and care should be taken while interpreting the comparison of different manufacturing techniques.

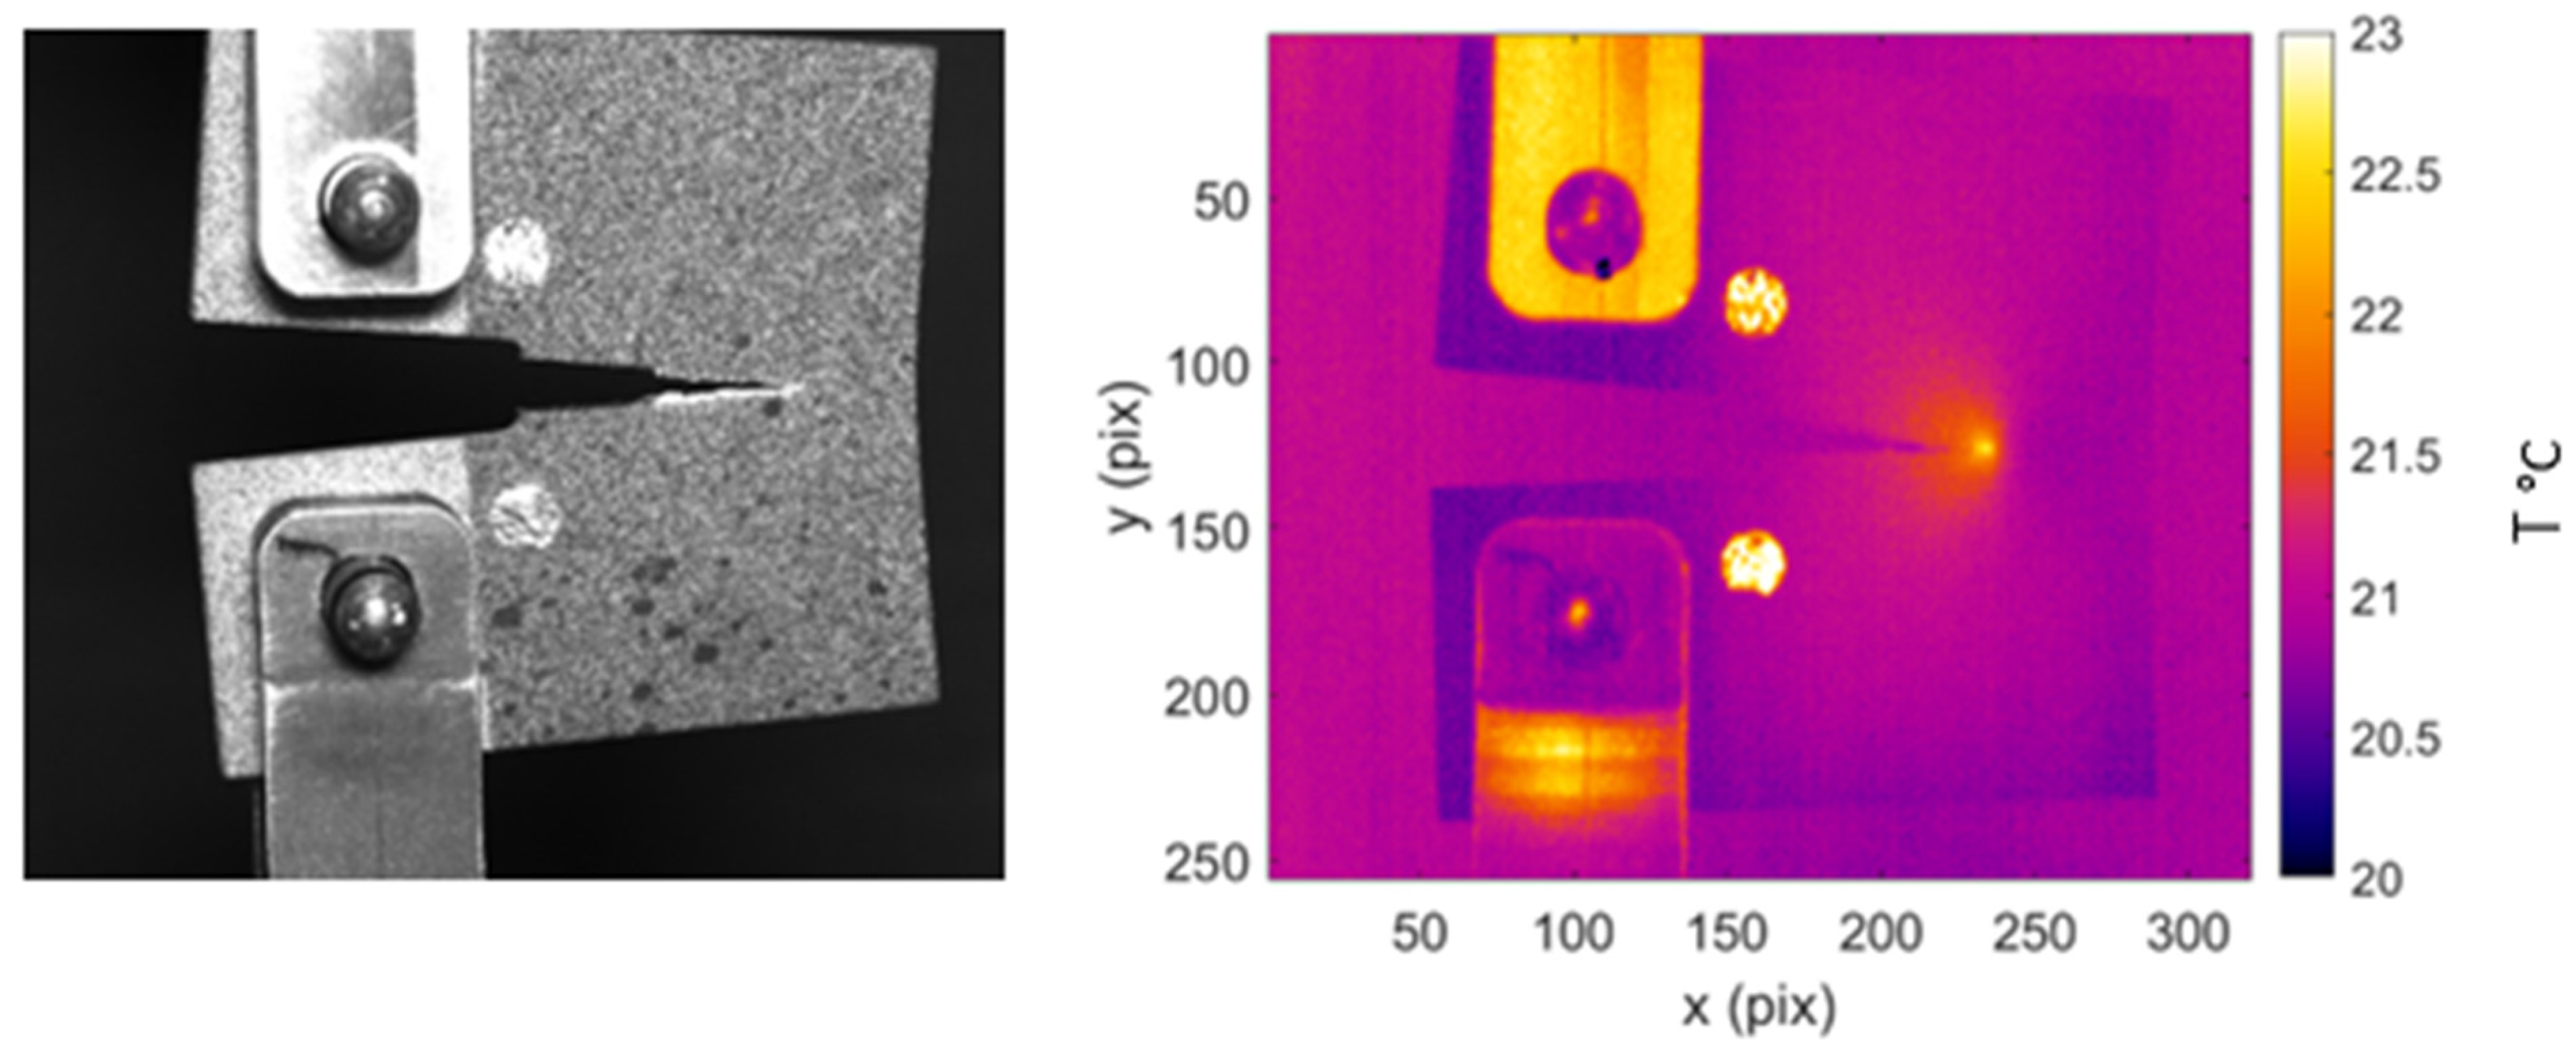
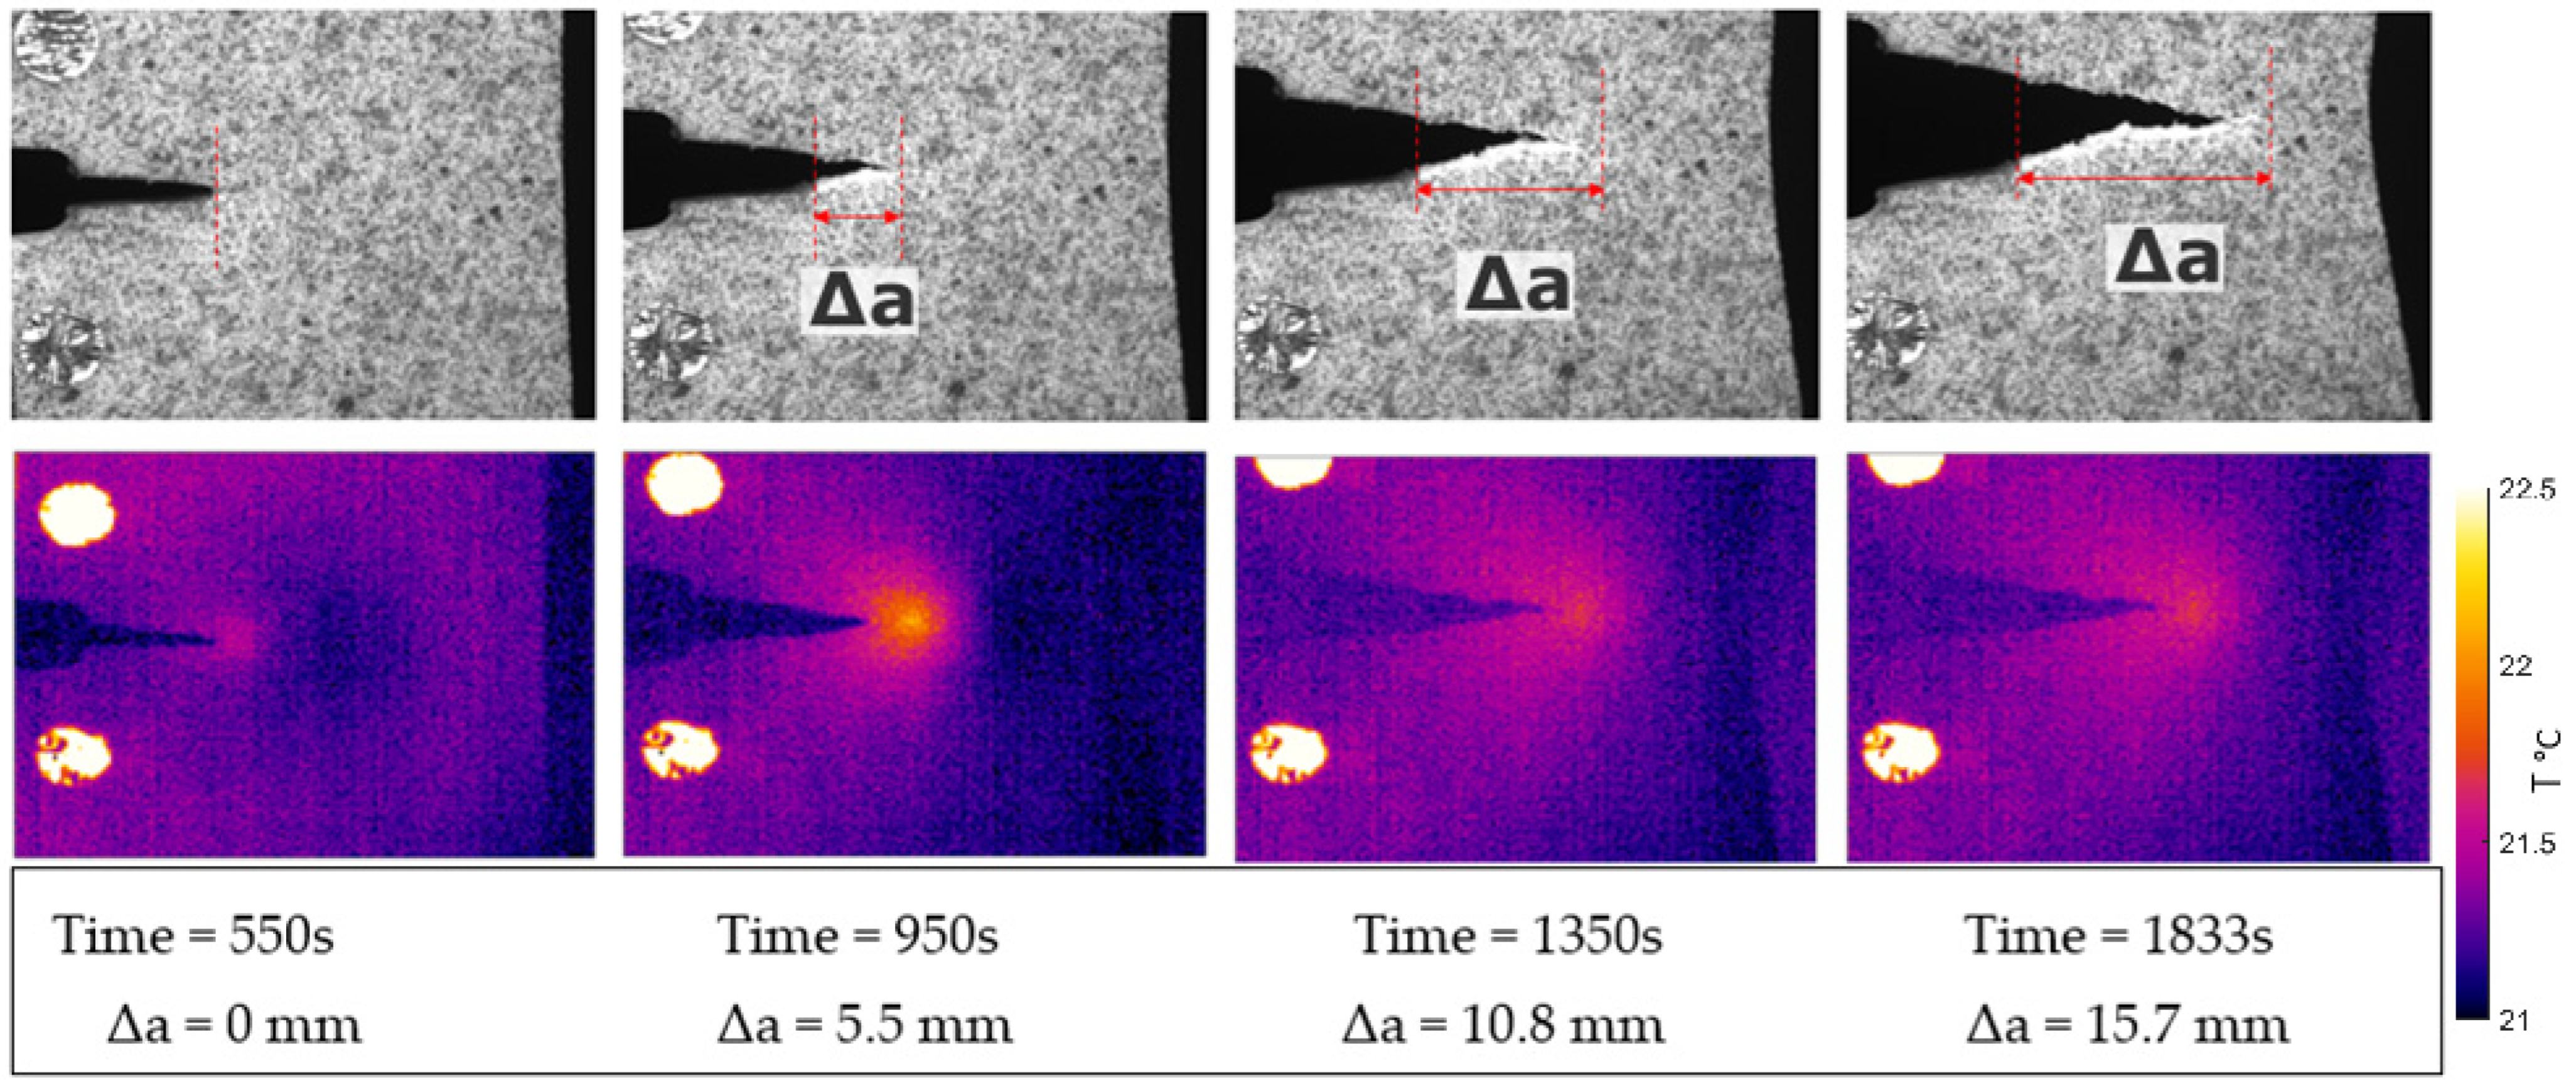
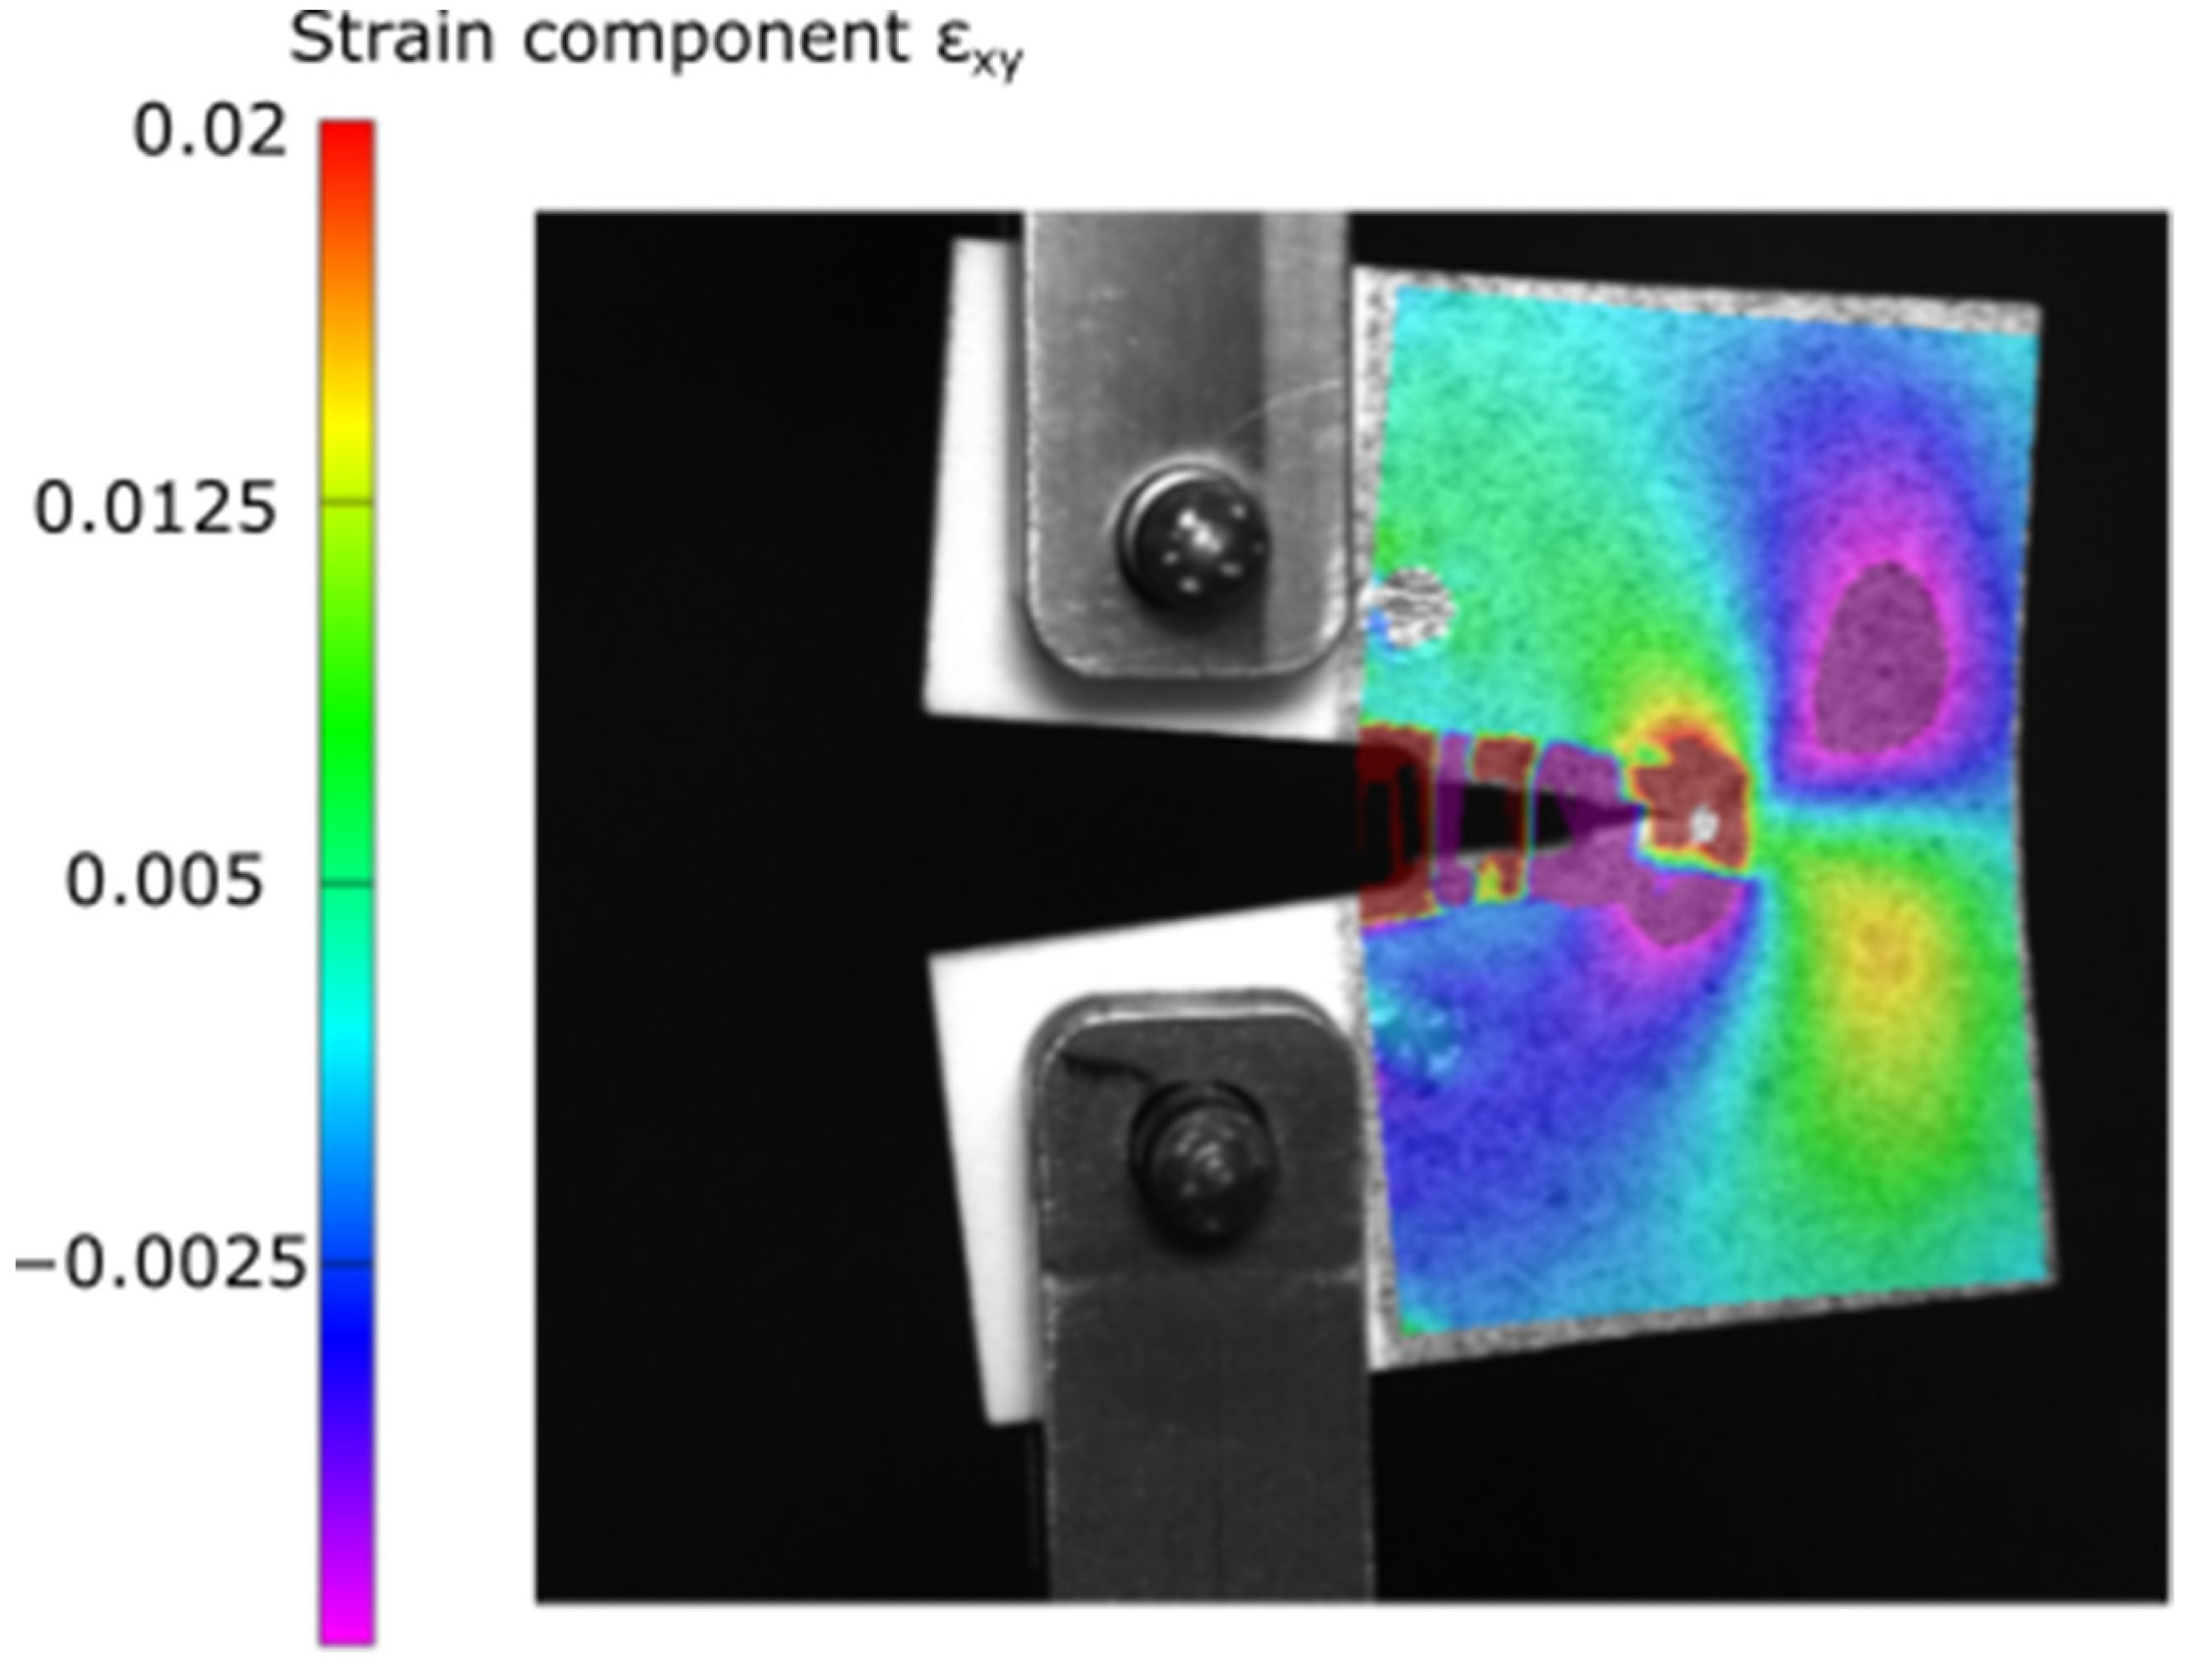
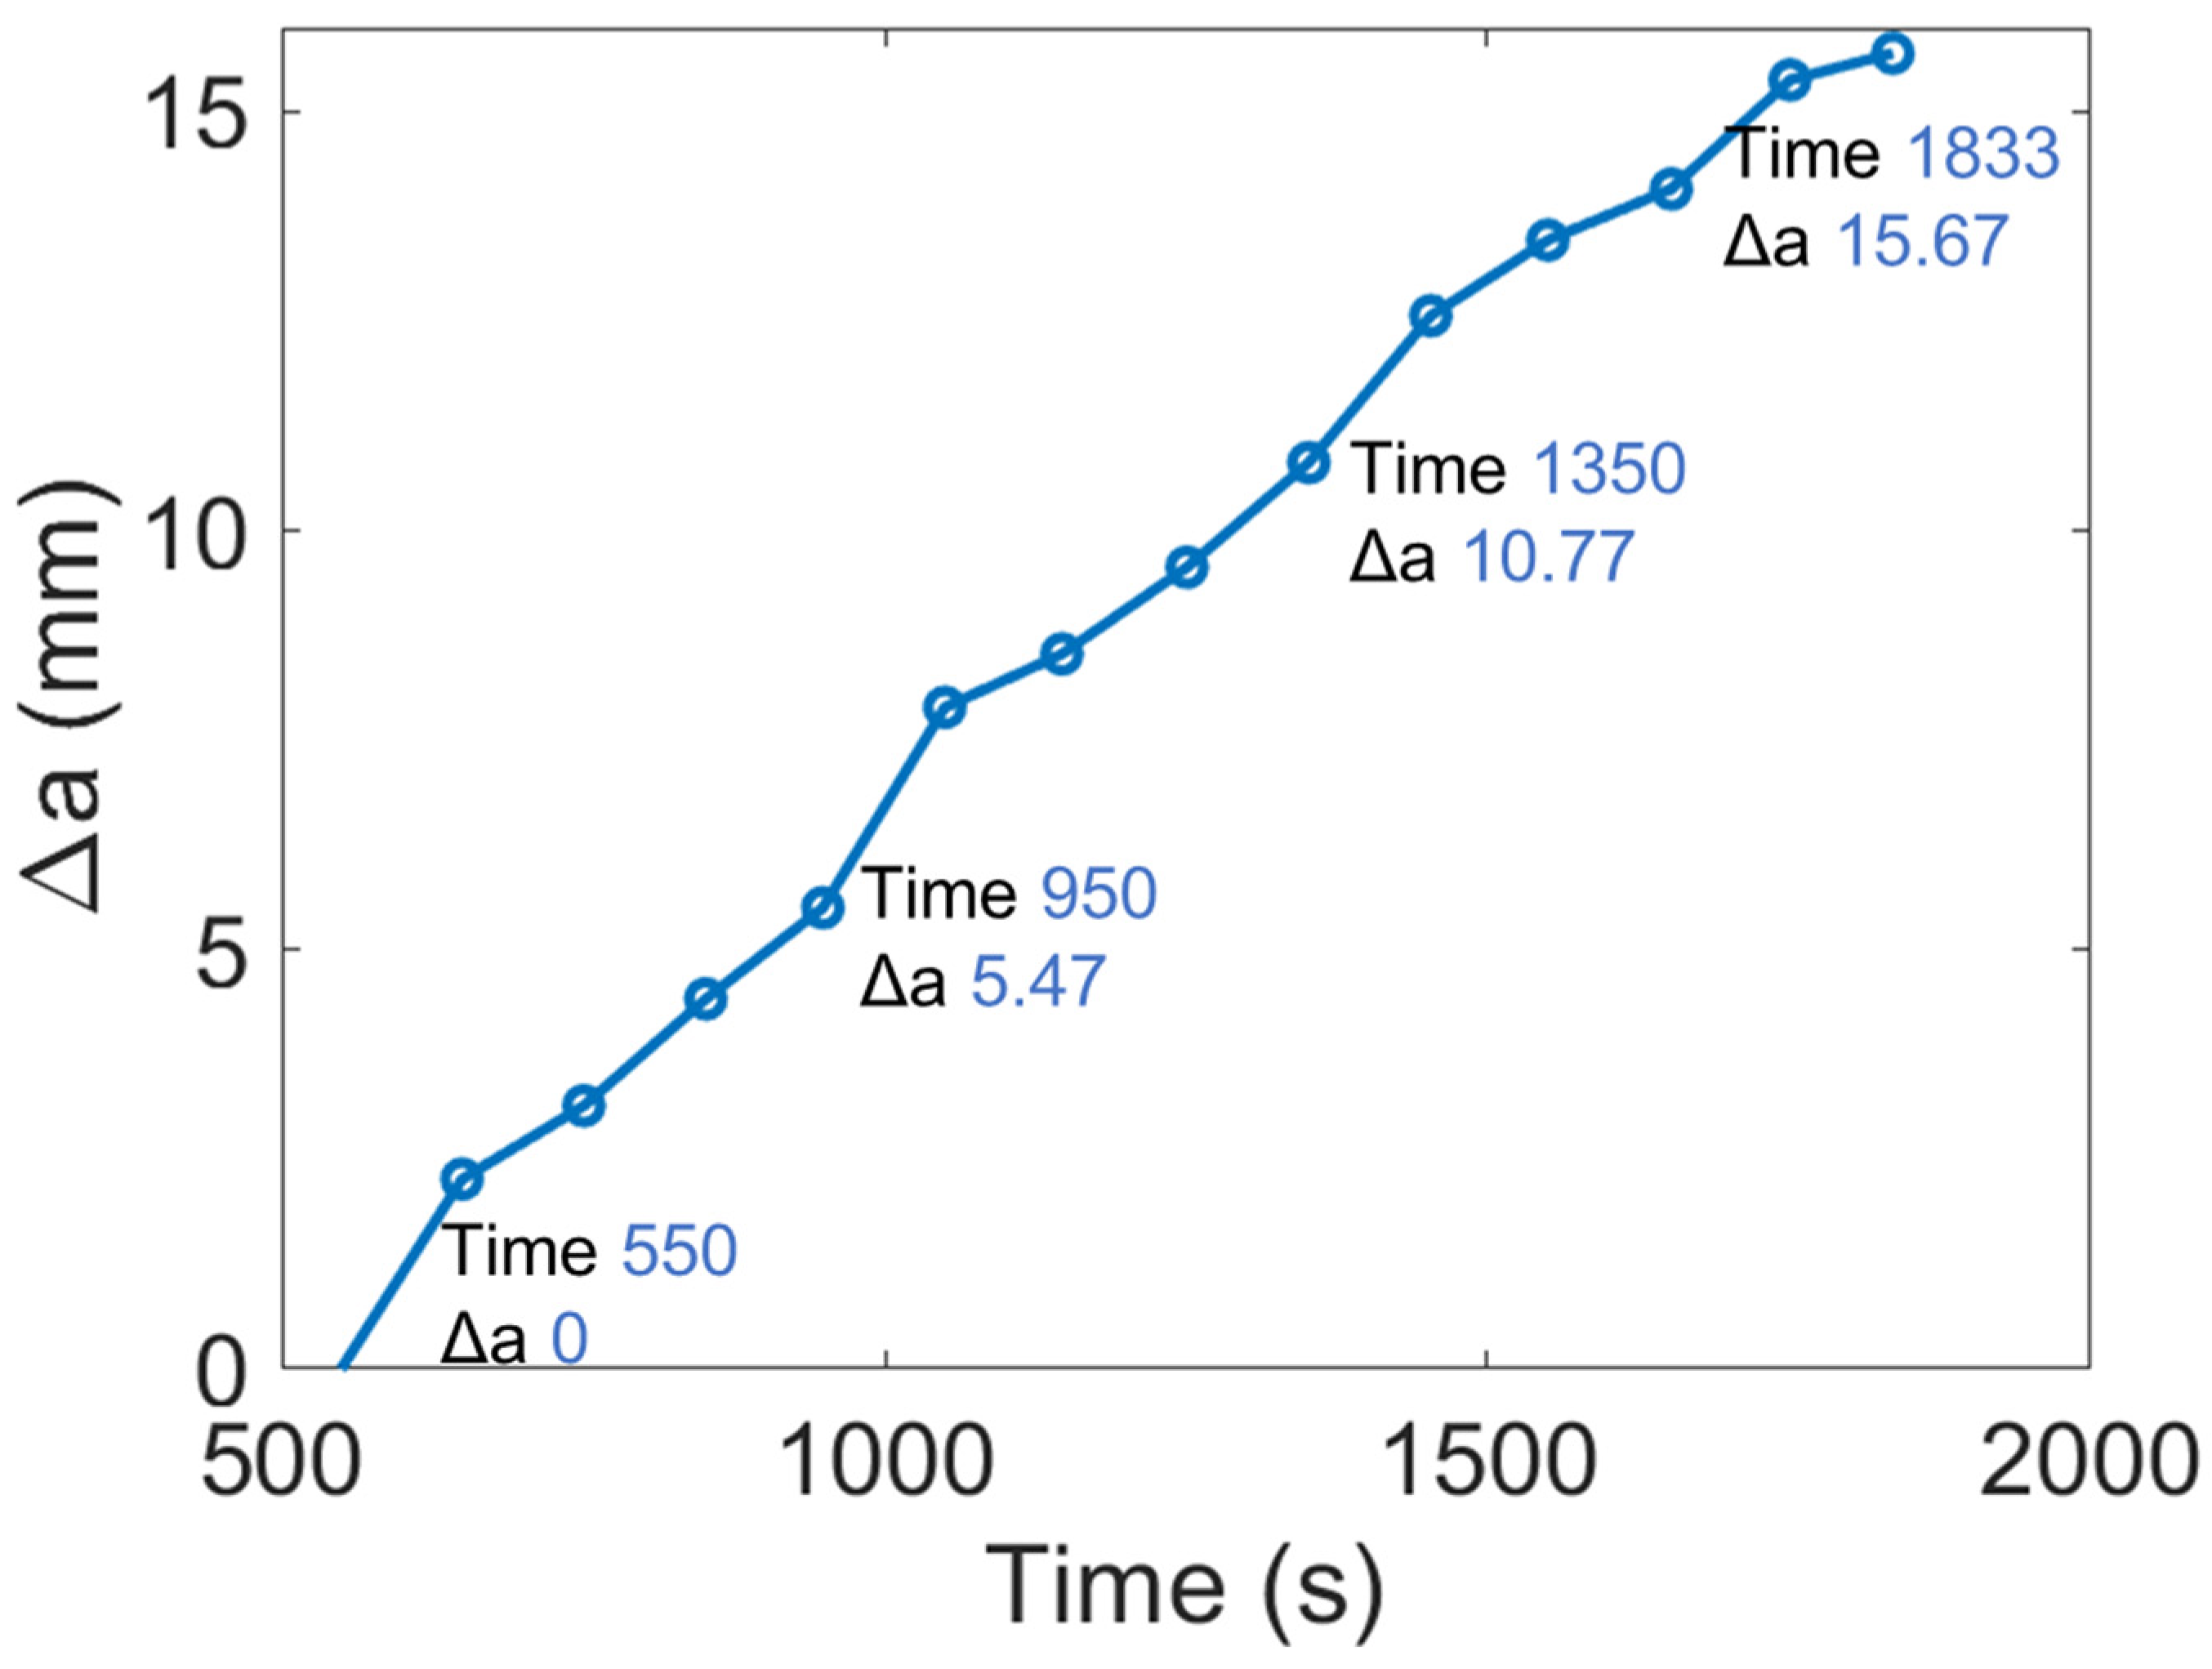
3.1. Crack Length Measurement
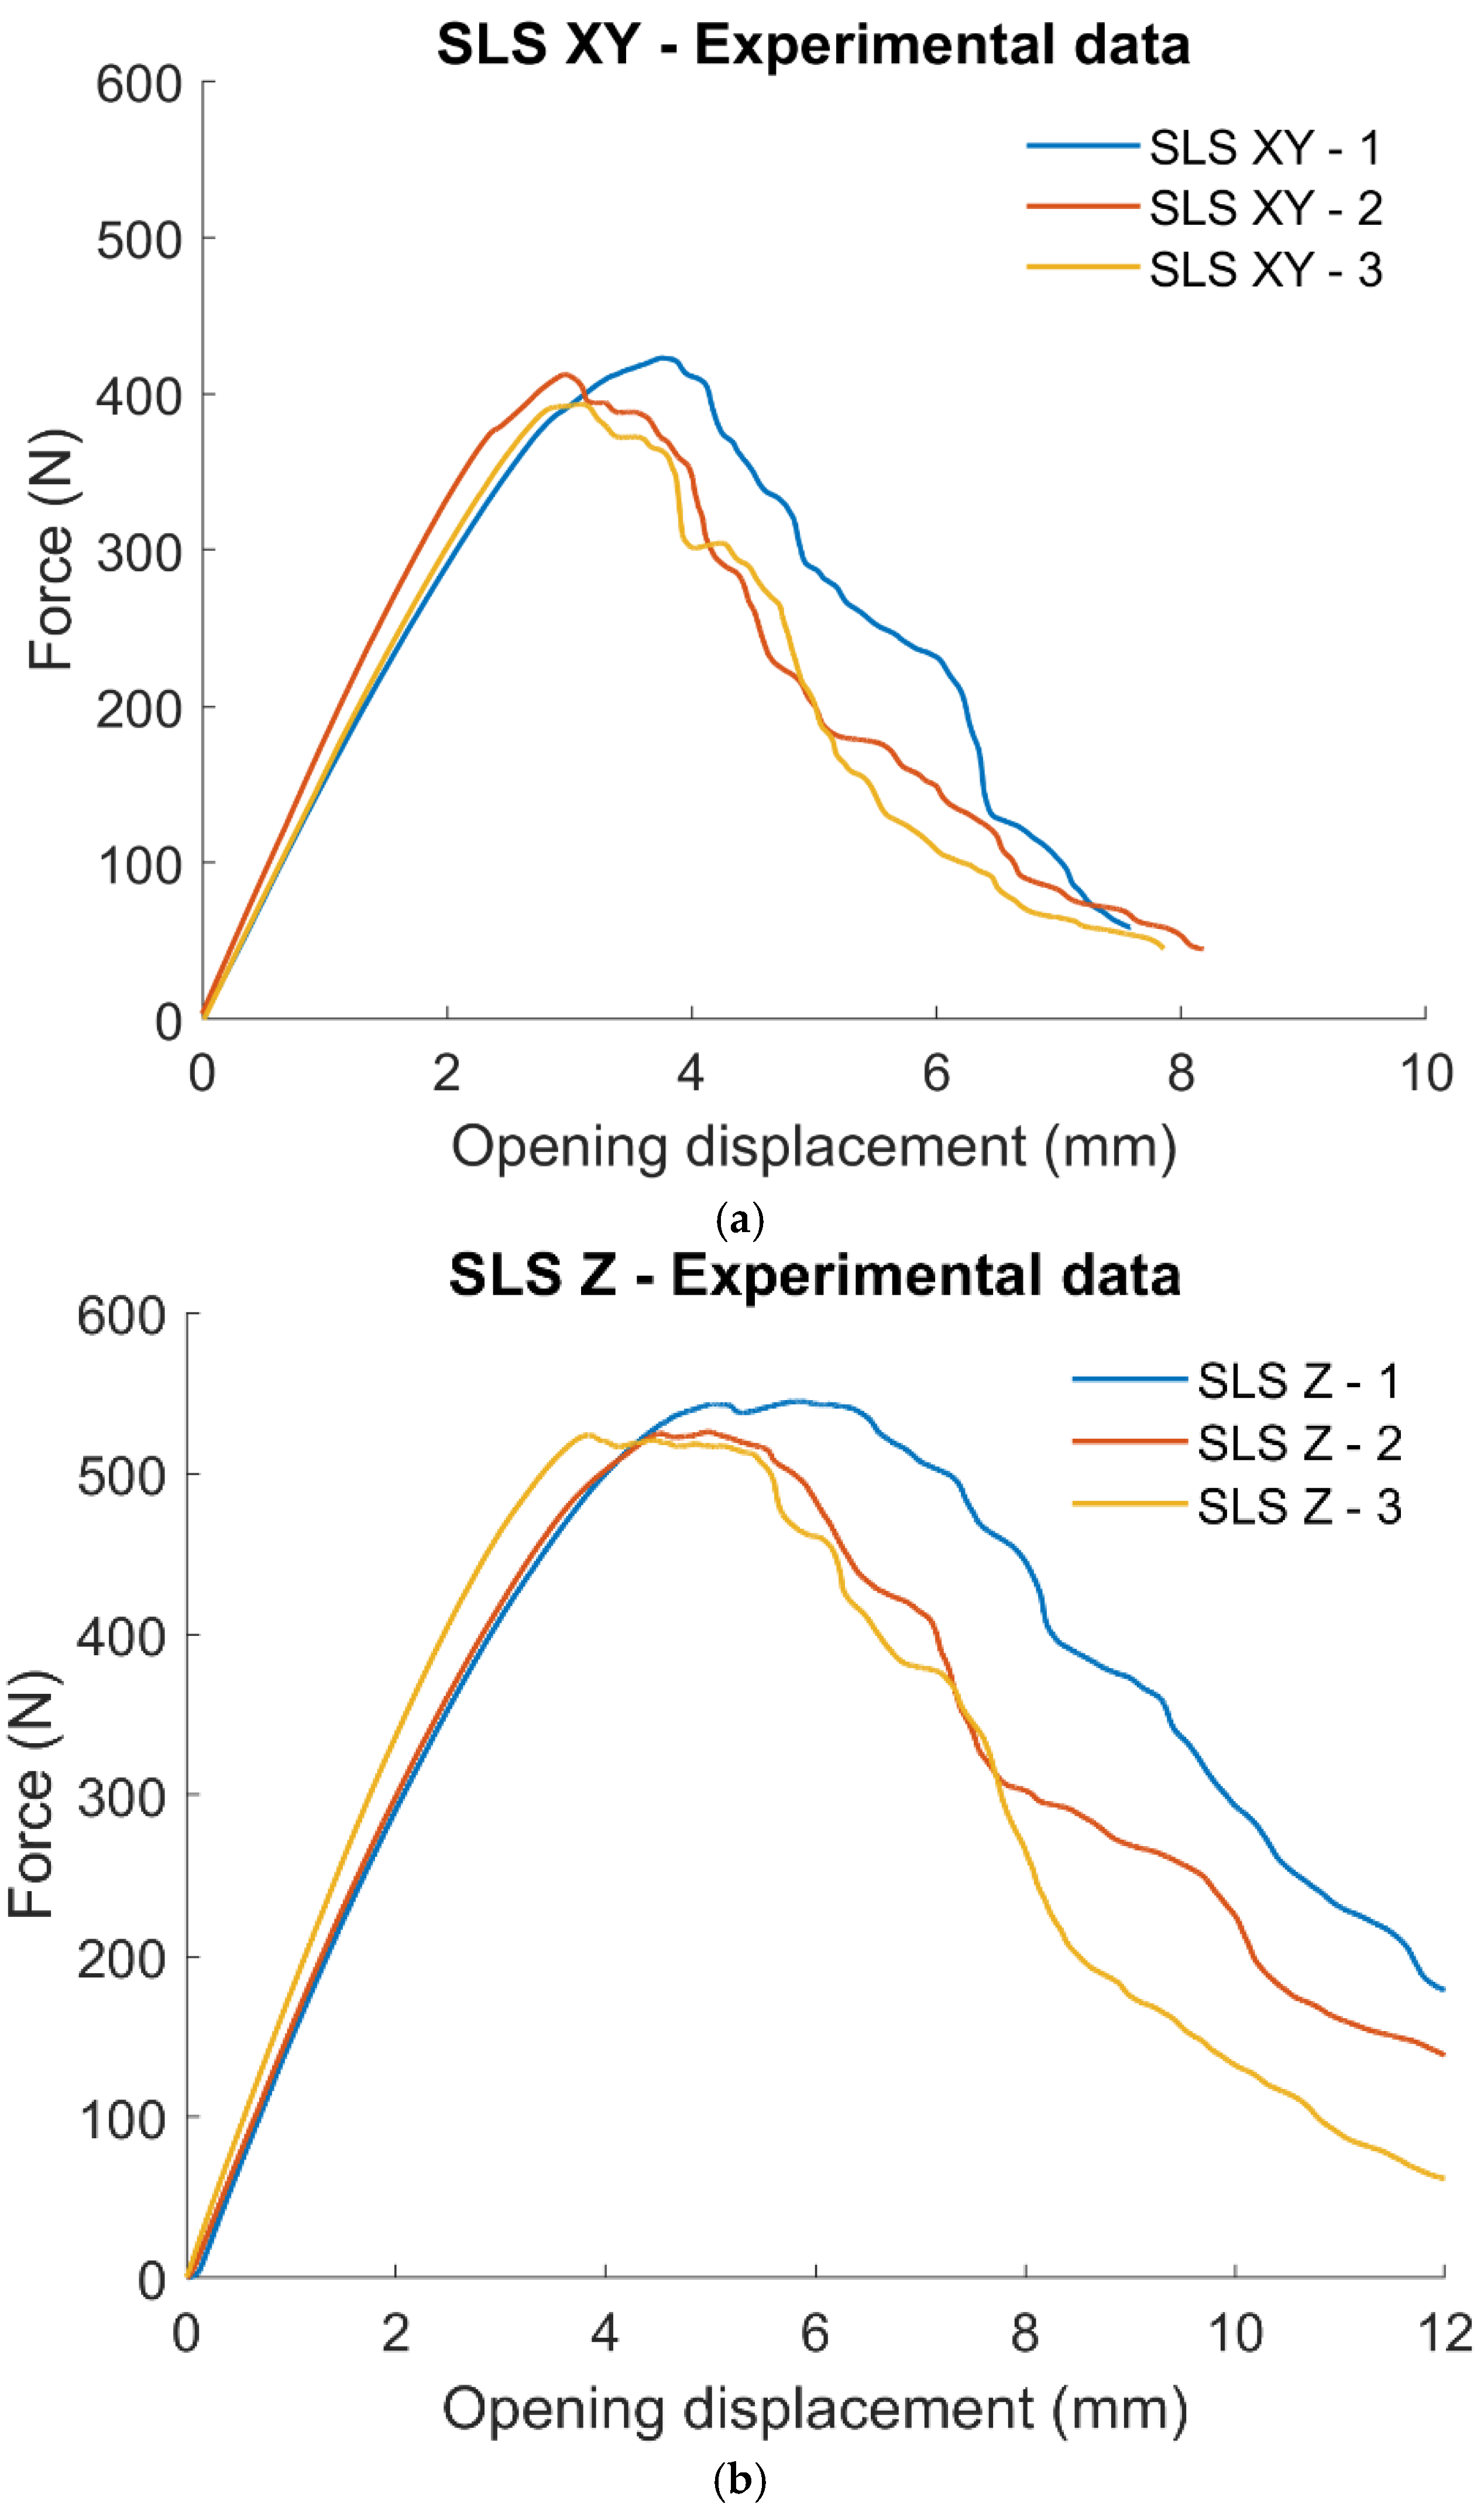
One of the challenges faced by researchers in fracture mechanics is the accurate estimation of the crack tip location in polymer materials, where large plastic deformation and severe necking at crack tip makes crack growth measurement difficult. However, the high resolution of the optical camera (2464 × 2065 pixels) allows to locate the crack tip position from the optical image. Figure 8 shows the crack extension measurement using optical and thermal images. The way to measure the crack length is to take the x coordinate of the notch tip on the first optical image and to estimate the x coordinate of the crack tip during crack propagation. These measurements were realised with the ImageJ software v1.54D. The crack tip position can also be followed from the thermal images obtained during the test. The thermal images obtained from the Telops FAST M3K photon detector camera show hotspots at the location of the crack tip depicting crack propagation. The crack extension can then be measured from the identified location of the hotspot.
One of the other techniques used to measure the crack tip location is the digital image correlation (DIC) technique. The DIC technique is based on the comparison of a reference image (undeformed) and a deformed image. The surface of the object is covered in random speckle patterns and is divided into small, overlapping subsets or regions. Each subset contains a number of pixels, and the displacement of these pixels is tracked throughout the deformation process. A correlation algorithm measures the similarity between the reference subset and the subset in the deformed image. Common correlation algorithms include cross-correlation and normalized cross-correlation. These algorithms evaluate how well the pixel patterns in the two subsets match. To obtain continuous and smooth displacement and strain fields, interpolation techniques are often applied to the discrete subset data.
For this test, just one camera is sufficient because all the deformation is on the plane of the sample. The measured coordinate fields can be used to calculate quantities of interest, such as displacements, strains, strain rates, and velocities. As an example, Figure 9 shows the shear strain component (γxy) on the surface of an SLS Z specimen obtained using commercial DIC software MatchID v2021.1.
The interesting thing about this DIC analysis is that the crack tip can be easily localised by looking the strain component (γxy). Near the crack tip, as one moves around the crack in a circular path, the shear strain undergoes a sign change. This sign inversion is associated with the presence of a stress singularity and is a characteristic feature of linear elastic fracture mechanics. It is important to note that these singular behaviours are characteristic of idealized linear elastic materials and assumptions. In real-world situations, especially for materials exhibiting plastic deformation or other complex behaviours, the actual stress and strain fields may deviate from these idealized patterns. In fact, it is remarkable that the line of the crack tip propagation is an axis of anti-symmetry for the strain because values of strain are opposed on both sides of this line. Moreover, the line passing through the crack tip and perpendicular to the load axis appears also as an axis of anti-symmetry for the strain. This is a good way to follow the crack evolution and a good way to study the repetitions of the stress on the surface of the materials because, by the Hooke’s law, the strain and the stress have the same sign. Therefore, the sign of the stress is changing on both sides of the crack tip.
Figure 10 shows a typical crack length vs. time graph from the compact tension tests of a polymer. The growth of the crack over time under applied loading can be observed from this curve. Initially, the crack length remains relatively stable as the test specimen undergoes initial loading. There is no noticeable crack propagation until reaching the time 550 s, when we can see the crack initiate and the lengths increase. As the test progresses, the crack length starts to increase gradually due to the applied stress. The slope of the crack length vs. time curve reflects the crack growth rate, which might vary based on factors like material properties, loading conditions, and environmental effects.

3.2. Data Reduction

The fracture parameters can be determined using either a linear elastic fracture mechanics (LEFM) approach or non-linear fracture mechanics (NLFM), depending on the mechanical response of the materials. LEFM is suitable when the material exhibits linear elastic behaviour, and the cracks are relatively small compared to the specimen’s dimensions. NLFM is chosen for non-linear materials or when large plastic deformations occur near the crack tip. The strain energy release rate is a measure of the energy required to propagate a crack in a material and is a critical parameter for understanding the fracture behaviour of materials. The area method is often employed for mode I (opening mode) fractures and is based on relating the dissipated mechanical energy ΔU to the newly generated free surface area due to crack tip advancement Δa. It is evident that the PA 12 is a ductile material, and therefore, the first idea was to modify the manner of measuring the area under the force displacement curve typically used in brittle materials to characterise a ductile fracture, given as follows:
G I c = 1 2 B N 0 N x 0 x i y x d x 1 2 x i F i a i a 0 .
One of the critical requirements of fracture toughness measurements based on LEFM is that plane strain conditions are satisfied. The fracture toughness KIC, which represents the material’s resistance to crack propagation under small-scale yielding, can then be calculated. In this case, the specimen thickness must be large enough to ensure that plastic deformation near the crack tip is confined, providing a conservative estimate of toughness. This condition ensures the toughness value is independent of thickness. We adopted the J-integral, which is an energy-based, path-independent contour integral used in elastic–plastic fracture mechanics (EPFM) to characterize the crack driving force in materials that exhibit non-linear (plastic) behaviour at the crack tip. The J-integral method is a widely used technique in fracture mechanics to calculate the strain energy release rate and is often employed to characterize fracture properties of materials, including polymers. The J-integral provides a path-independent measure of the energy release rate around the tip of a crack and is particularly useful in situations where the stress and displacement fields are complex. For polymers, which may exhibit ductile or tough behaviour, the J-integral method can be applied to determine critical values like the critical strain energy release rate (Gc) or the critical stress intensity factor (KIc). It assesses fracture resistance and material toughness by accounting for both elastic and plastic deformation near a crack tip. The J-integral is applicable in cases where significant plastic deformation occurs, extending fracture analysis beyond the limitations of LEFM. The J-integral can describe crack growth in both thin and thick specimens, making it useful when plane strain conditions are difficult to achieve, such as in ductile materials or thin specimens. This agrees with other researchers who have used J-integral as characterisation parameter to study fracture properties. Because of this, the normalisation method was applied to determine the J-R curves and the J integral value.
The J-integral can be divided into elastic and plastic components, and understanding their contributions is essential for characterising the fracture energy of polymers. The total J-integral is the sum of the elastic and plastic contributions:
J i = J e l i + J p l i   .
The elastic part of the J-integral represents the energy associated with the elastic deformation of the material around the crack tip. In polymers, which can exhibit significant elastic behaviour, this component accounts for the energy stored in the material due to reversible elastic deformation during crack propagation. The elastic contribution is related to the linear elastic region of the stress–strain curve, where the material undergoes reversible deformation:
J e l i = K i 2 1 ν 2 E .
Firstly, the stress intensity factor K is evaluated using the following equation:
K i = P i B W f a i W ,  
where
f x = 2 + x 0.886 + 4.64 x 13.32 x 2 + 14.72 x 3 5.6 x 4 4 1 x 3 2   .
The plastic part of the J-integral represents the energy associated with irreversible, plastic deformation around the crack tip. In polymers, which often display viscoelastic and time-dependent behaviour, plastic deformation can involve not only yielding but also aspects of viscoplasticity. The plastic component is crucial for characterizing the fracture resistance of polymers, especially in cases where significant plasticity occurs during crack propagation. Polymers may exhibit strain hardening or softening behaviour, affecting the magnitude of the plastic contribution to the J-integral. The plastic part of the J-integral, is evaluated in the function of the plastic displacement vpl and the plastic area:
A p l i = A p l i 1 + P i + P i 1 v p l i v p l i 1 2 ,   where
v p l i = v i P i C L L i ,  
C L L i = 1 E B   ( 2.16 + 12.22 a i W 20.07 a i W 2 0.99 a i W 3 + 20.61 a i W 4 9.93 a i W 5   and
J p l i = J p l i 1 + η p l i 1 b i 1 A p l i A p l i 1 B 1 γ p l i 1 a i a i 1 b i 1 .  
In having the data and value of the crack length and evolution, the following step is to evaluate the strain energy release defined by the equation seen previously. It should be noted that the toughness values calculated using the J-integral will not necessarily correspond to KIC when plane strain is not present. However, this method acts as a means to compare the fracture toughness of the different processing methods and build orientations.
Figure 11 shows the J-R curve, which is the value of J-integral in the function of the crack length Δa of the (a) SLS specimens and (b) the MJF specimens. A comparison of the Jmax of the four configurations is also shown. Comparing the two manufacturing processes, it appears that the SLS process has higher fracture values than the MJF process. Indeed, by looking at the average value of J-integral for the six samples of SLS process and for the six of the MJF one, it appears that the SLS presents values of the J-integral higher than 30% compared to that of MJF. A comparison of the build orientation for the SLS-printed samples shows that Z specimens have a Jmax of about 27 kJ/m2, which is more than double the Jmax of the XY specimen (about 11 kJ/m2). A similar comparison of the MJF-printed specimen shows that the specimen built in XY orientation has a Jmax of 60% the value of the Z specimen (4.6 kJ/m2 vs. 7.3 kJ/m2). However, the orientation effect is less pronounced in the MJF samples compared to the SLS samples.
A more precise comparison of the value of the J-integral between the additive manufacturing processes shows that for the XY build orientation, the SLS process produces samples with a value of the J-integral higher than 60% compared to the MJF process (see Figure 12). A similar comparison for Z models also shows that the SLS process has higher fracture properties than the MJF process. Indeed, the value of the J-integral for the SLS samples is about four times superior to the value of the MJF process.
It is possible to conclude based on the J-integral that the SLS additive manufacturing process presents higher fracture toughness than the MJF, and the Z build direction presents better results than the XY for both PBF processes. The better performance of the SLS manufacturing process may be attributed to the higher percentage of crystallinity observed in the SLS-printed samples, and it is well established that there is strong anisotropy in the stiffness and strength of additively manufactured polymers due to the layer-by-layer fabrication of AM methods [6]. This significantly influences structural design, as the weakest direction might govern the overall strength, necessitating orientation strategies during printing to optimize performance and to ensure reliability and safety. A higher ultimate tensile strength often correlates with better fracture toughness in AM polymers, as strong inter-layer adhesion can enhance both tensile strength and resistance to crack initiation and growth. However, the relationship is not strictly linear; factors such as the presence of defects and pores, the degree of bonding between layers, and the inherent material properties also play crucial roles.
It was hypothesised that the post-condensation reaction in SLS resulted in higher molecular weight, which influenced the strength and fracture properties [31]. The higher fracture energy of SLS Z samples is an interesting outcome. Since the laser diameter stays the same regardless of the process parameters, it may result in various outcomes when changing the layer thickness and the hatching distance. Indeed, if the layers are thin, heat penetrates further into the powder bed.
In addition, if the hatching distance is large, it may result in a lower inter-track boundary temperature. Another explanation might be related to the contours (outlines) that are generally made with different processing parameters to the infill. By default, the laser power is reduced to 16 W, and the scanning speed is slower (1500 mm/s) for the lower and upper skins. Because their number is always fixed regardless of the height or width of the sample, this results in a higher infill/shell ratio in the direction of the higher dimension. The difference in the properties of the MJF specimens built in Z orientation is perhaps due to better densification at the interlayer boundary thanks to the action of the fusing agent [31]. Another potential explanation for the higher fracture properties in the Z direction could be the porosity and the pore network anisotropy. However, further research is required to evaluate the different hypotheses.
Numerical modelling was performed for the SLS and MJF cases in XY- and Z-direction printing and compared against the experiments in Figure 13 and Figure 14.
The elastic stiffness, peak load, and the failure propagation were predicted in good agreement with the experiments. Following the failure propagation and crack extension, the continuum was split into two halves, resulting in a drop in the load. The post-failure region was modelled with minimal numerical oscillations due to a combination of fine mesh discretisation and the absence of dynamic effects. Based on the results, it can be inferred that the SLS manufacturing with Z-direction printing gives the maximum peak load and energy absorption. Though unexpected, the printing direction introduces significant influence on the failure. This may be partly due to the planar specimen design.
In the Z-direction specimens, the crack propagation was normal to the build direction, and therefore, it can be inferred that breaking the sintering bonds requires the maximum load. In the XY-direction specimen, such a crack alignment was not obtained, and therefore, the failure occurred earlier.
This observation from the numerical modelling is similar to the experiments, and therefore, by understanding the failure direction for different loading conditions, this method can be used to obtain the optimal manufacturing method. The orientation of layers can create planes of weakness where cracks can initiate and grow more readily. Parts built with layers oriented perpendicular to the expected crack path tend to have higher fracture toughness, as the crack must traverse multiple layers, each acting as a barrier to crack propagation. Conversely, parts built with layers parallel to the crack path may have lower fracture toughness due to easier crack propagation along the layer interfaces.
A comparison of the shear strain contours obtained from the numerical model and experimental data is shown in Figure 15. The cohesive zone model demonstrates good correspondence with experimental data obtained through digital image correlation (DIC), showcasing its efficacy in predicting crack growth in additively manufactured materials. The model accurately replicates crack initiation, propagation, and coalescence, aligning closely with DIC-derived measurements. This robust agreement highlights the model’s reliability in capturing the intricate mechanics of crack evolution. The synergy between cohesive zone predictions and DIC observations substantiates the model’s capability for precise crack growth simulations, offering a valuable tool for researchers and engineers in optimizing material design and structural integrity. This alignment underscores the model’s applicability and fidelity in real-world scenarios.

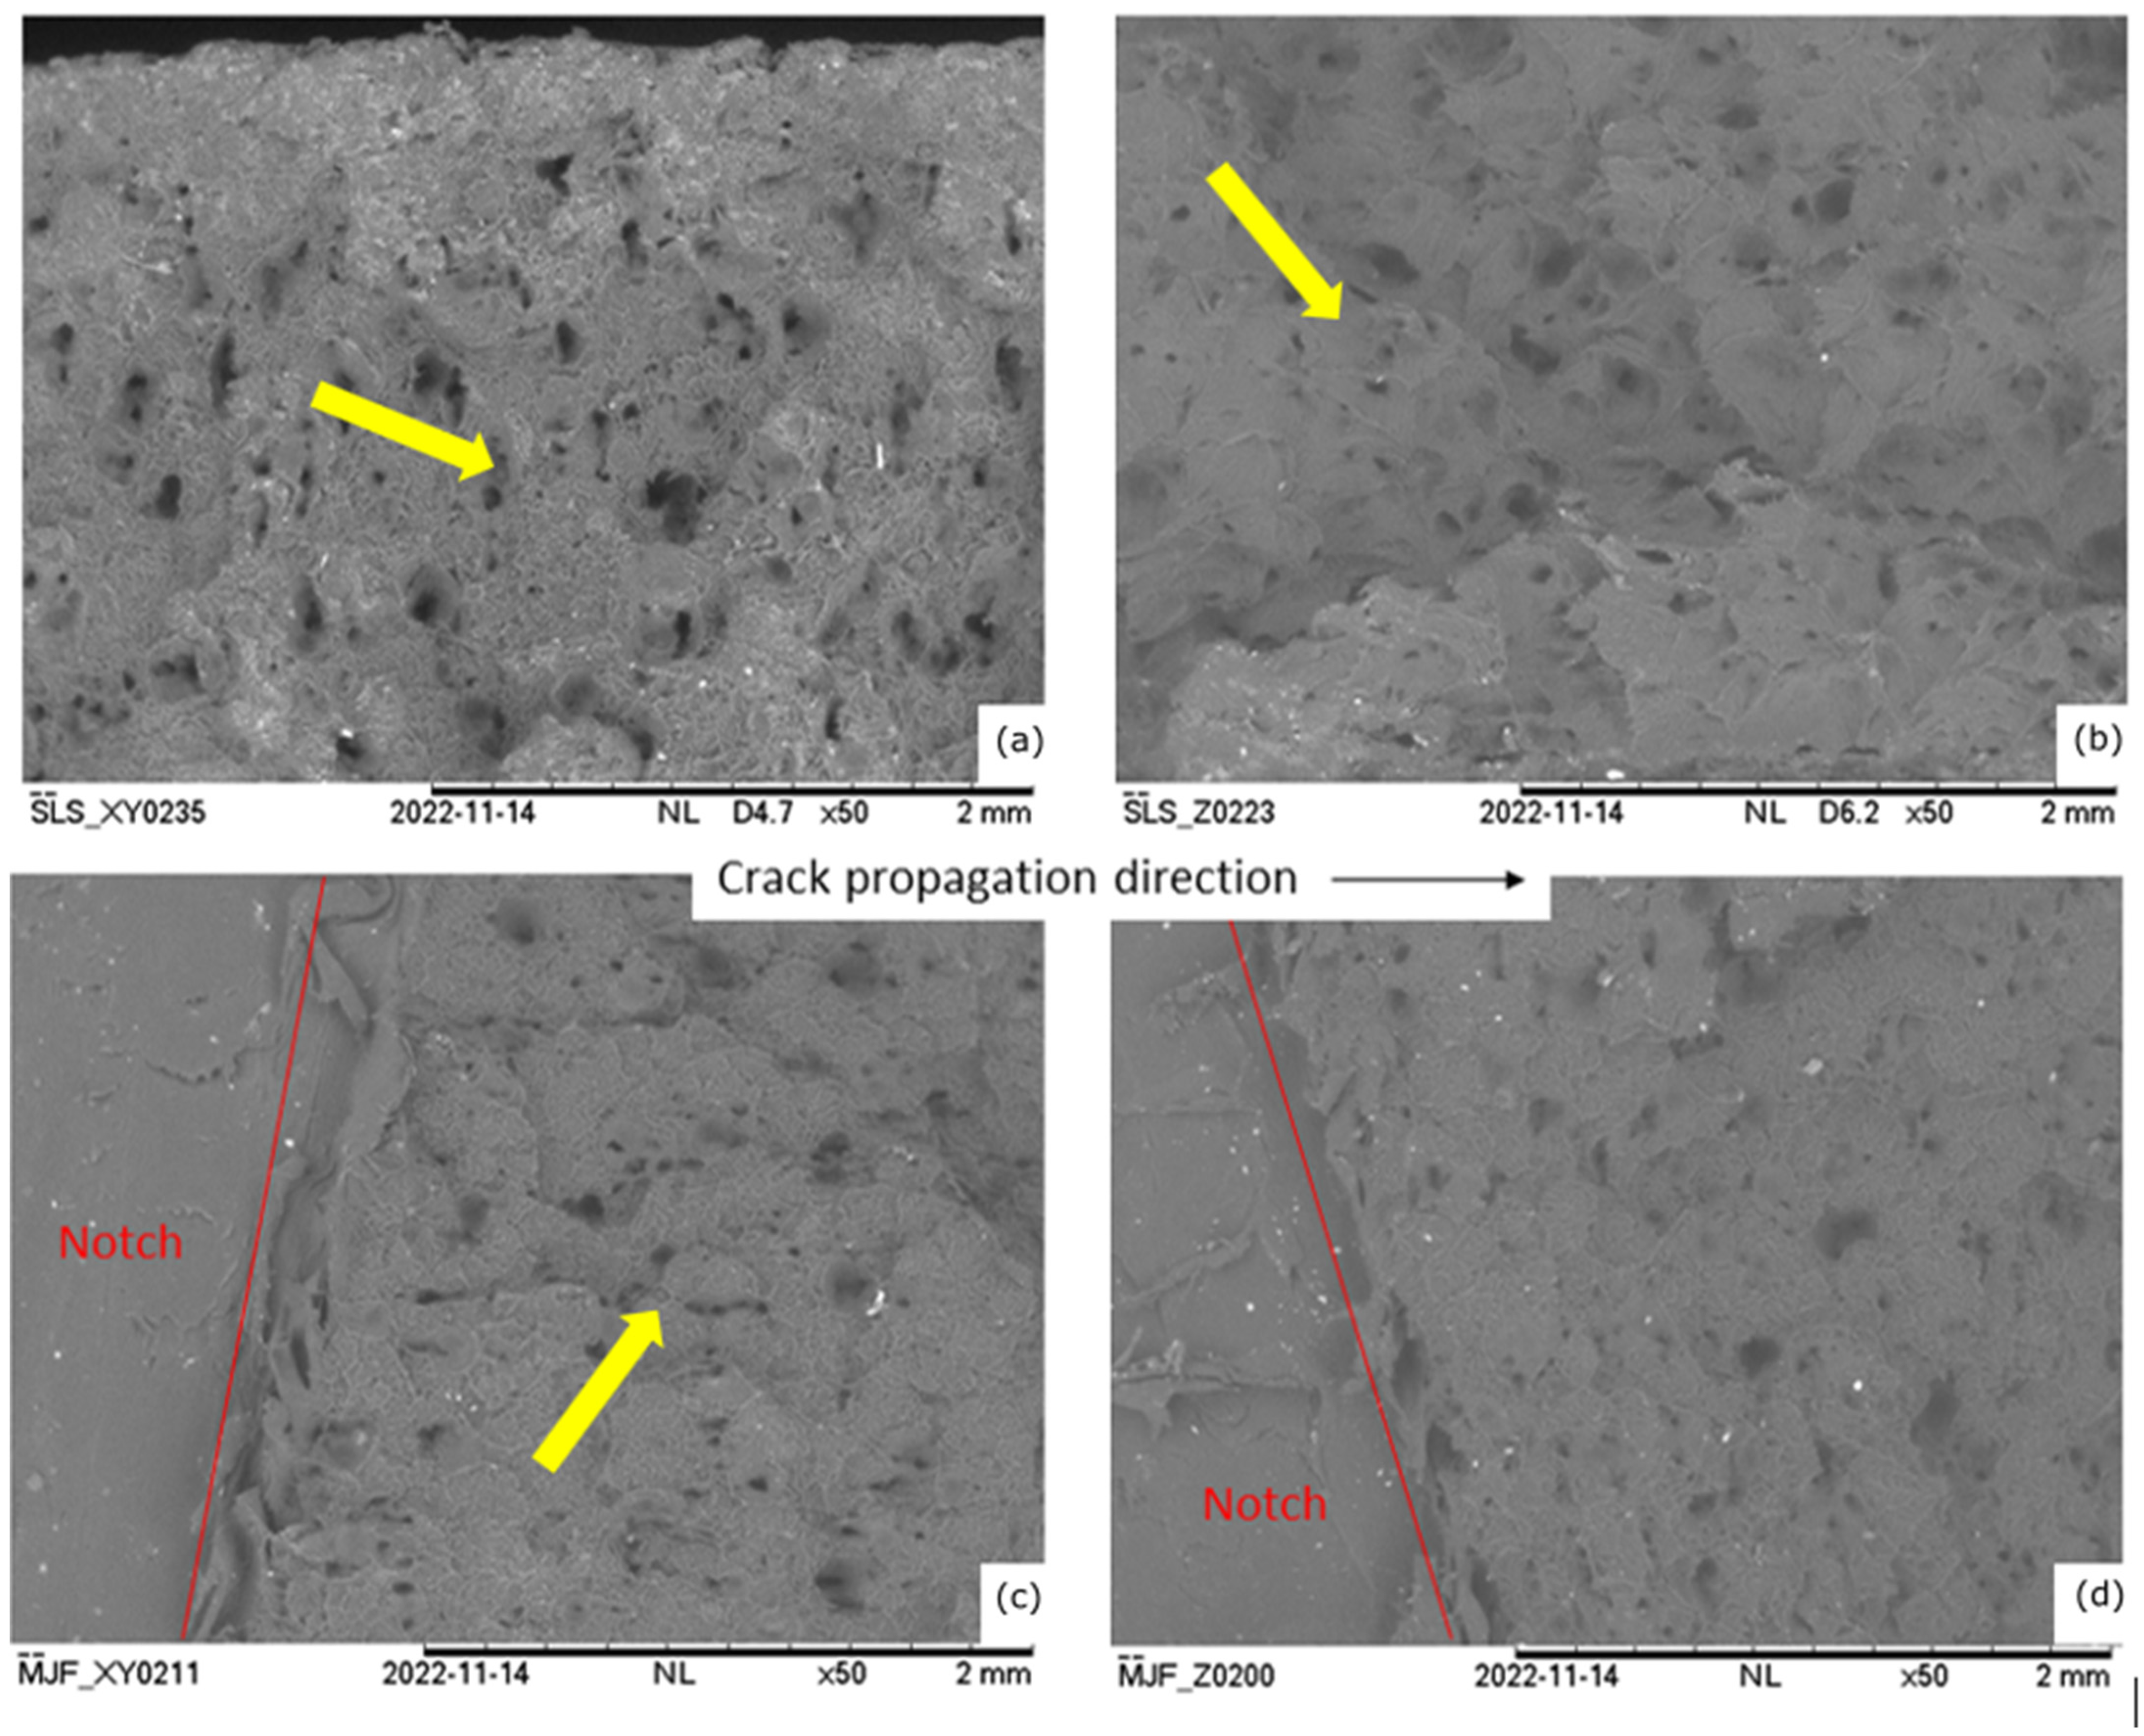
3.3. Fracture Morphology

Scanning electron microscopy (SEM) analysis was conducted to study and compare the fracture surface on the different specimens. Figure 16 and Figure 17 show the failure surface of one sample of each AM process with a magnification of ×50. The overall appearance of the fracture surface can provide information about the fracture mode. Common fracture modes include brittle, ductile, and mixed-mode fractures. A smooth and flat fracture surface indicates a brittle failure. Brittle fractures often exhibit minimal plastic deformation before failure. In contrast, a ductile fracture shows a rough and irregular fracture surface. The surface roughness is a result of the plastic deformation and the formation of various microstructural features, such as necking, shear bands, and voids. The SEM images of the compact tension samples show a multitude of irregularities, bumps, and depressions on the fracture surface. This is indicative of ductile fractures involving significant plastic deformation before final rupture. The formation and coalescence of microvoids on the fracture surface are also a clear indication of ductile fracture [32]. SEM images reveal the presence and distribution of these voids, providing insights into the ductile behaviour of the polymer.
Higher magnification images at 500× magnification show evidence of the formation of microvoids and fibrils, associated with crazing in the fracture surface. SEM images show the presence of crazes, which are thin, thread-like structures indicating localized plastic deformation, and the SLS-printed samples show more pronounced fibrils than the MJF samples. For additively manufactured parts, the effectiveness of bonding between layers is critical for the mechanical performance. However, there is no clear evidence in the fracture surfaces of features related to interlayer bonding quality. For instance, poor bonding may lead to delamination or separation between layers, but there is no sign of delamination-type failure in the SEM images, suggesting good interlayer bonding in both SLS and MJF processes.

4. Conclusions

This research focused on the examination of the fracture behaviour of polyamide 12 polymer obtained through selective laser sintering (SLS) and multi-jet fusion (MJF). Samples were manufactured and tested in mode I compact tension (CT), with digital image correlation (DIC) and infra-red thermography (IRT) monitoring the experiments. Furthermore, scanning electron microscopy was employed to analyse the fractured surfaces. A numerical model was developed in the commercial finite-element solver LS-Dyna using explicit time integration. The analysis was performed with quasi-static loading conditions such that the inertial effects were minimal. The continuum was discretised with linear elastic solid elements, while a layer of linear cohesive elements was used to model the crack path. The cohesive zone method simulates crack growth in AM polymers by modelling the fracture process through cohesive laws that define the non-linear softening behaviour at crack tips, and the continuum elements model the corresponding plasticity phenomena.
The following are the key outcomes of the project:
  • The layer-based manufacturing process leads to significant differences in fracture toughness among additively manufactured samples, resulting in anisotropic properties across various size scales;
  • Comparative analyses of SLS and MJF technologies revealed distinct trends in mechanical strength, build-orientation effects, and fracture properties. In the present work, SLS with build orientation in the Z direction was observed to give maximal load-carrying capability and fracture energy dissipation;
  • The finite-element approach with cohesive elements enabled the analysis of crack initiation, propagation, and coalescence, providing valuable insights into fracture mechanics and aiding in the design of more resilient polymer structures. The elastic stiffness, peak load, and the failure propagation were predicted in good agreement to the experiments.
This method of combined experimental and numerical analysis for understanding the failure direction for different loading conditions can be used to obtain the optimal manufacturing parameters. The understanding of build-orientation effects on the fracture toughness properties presented in this paper allows for the strategic alignment of layers to enhance resistance to crack growth, tailoring material properties to specific structural requirements, and improving the overall integrity and lifespan of AM polymer structures.

Author Contributions

Conceptualization, K.R.R. and J.S.; methodology, K.R.R. and J.S.; software, K.R.R. and J.S.; validation, K.R.R. and J.S.; formal analysis, K.R.R. and J.S.; investigation, K.R.R.; resources, K.R.R.; data curation, K.R.R.; writing—original draft preparation, K.R.R. and J.S.; writing—review and editing, K.R.R. and J.S.; visualization, K.R.R. and J.S.; supervision, K.R.R.; project administration, K.R.R.; funding acquisition, K.R.R. All authors have read and agreed to the published version of the manuscript.

Funding

This research received no external funding.

Data Availability Statement

The data required to reproduce the findings are included within this manuscript.

Acknowledgments

The authors would like to thank Laurent Maheo and his student Lucas for their contribution to this project. Additionally, the authors would like to thank Arnaud Regazzi from IMT Mines Alès for his invaluable advice about additive manufacturing. The support of 3DPrintUK for manufacturing of the specimens used in the study is also acknowledged.

Conflicts of Interest

The authors declare no conflict of interest.

References

  1. Chyr, G.; DeSimone, J.M. Review of high-performance sustainable polymers in additive manufacturing. Green Chem. 2022, 25, 453–466. [Google Scholar] [CrossRef]
  2. Shanthar, R.; Chen, K.; Abeykoon, C. Powder-based additive manufacturing: A critical review of materials, methods, opportunities and challenges. Adv. Eng. Mater. 2023, 25, 2300375. [Google Scholar] [CrossRef]
  3. O’Connor, H.J.; Dickson, A.N.; Dowling, D.P. Evaluation of the mechanical performance of polymer parts fabricated using a production scale multi jet fusion printing process. Addit. Manuf. 2018, 22, 381–387. [Google Scholar] [CrossRef]
  4. Brighenti, R.; Cosma, M.P.; Marsavina, L.; Spagnoli, A.; Terzano, M. Laser-based additively manufactured polymers: A review on processes and mechanical models. J. Mater. Sci. 2021, 56, 961–998. [Google Scholar] [CrossRef]
  5. Picard, M.; Mohanty, A.K.; Misra, M. Recent Advances in Additive Manufacturing of Engineering Thermoplastics: Challenges and Opportunities; Royal Society of Chemistry: London, UK, 2020; Volume 10. [Google Scholar] [CrossRef]
  6. Cai, C.; Tey, W.S.; Chen, J.; Zhu, W.; Liu, X.; Liu, T.; Zhao, L.; Zhou, K. Comparative study on 3D printing of polyamide 12 by selective laser sintering and multi jet fusion. J. Mater. Process. Technol. 2021, 288, 116882. [Google Scholar] [CrossRef]
  7. Dizon, J.R.C.; Espera, A.H.; Chen, Q.; Advincula, R.C. Mechanical characterization of 3D-printed polymers. Addit. Manuf. 2018, 20, 44–67. [Google Scholar] [CrossRef]
  8. Hui, Z.; Chen, K.; Du, H.; Zeng, J.; Zhou, K. Long-term ageing effect on mechanical properties of polyamide 12 printed by Multi-Jet-Fusion. Int. J. Mech. Sci. 2023, 256, 108513. [Google Scholar] [CrossRef]
  9. Zarringhalam, H.; Hopkinson, N.; Kamperman, N.F.; de Vlieger, J.J. Effects of processing on microstructure and properties of SLS Nylon 12. Mater. Sci. Eng. A 2006, 435–436, 172–180. [Google Scholar] [CrossRef]
  10. Stoia, D.I.; Marsavina, L.; Linul, E. Correlations between process parameters and outcome properties of laser-sintered polyamide. Polymers 2019, 11, 1850. [Google Scholar] [CrossRef]
  11. Xu, Z.; Wang, Y.; Wu, D.; Ananth, K.P.; Bai, J. The process and performance comparison of polyamide 12 manufactured by multi jet fusion and selective laser sintering. J. Manuf. Process. 2019, 47, 419–426. [Google Scholar] [CrossRef]
  12. Xu, Y.; Quino, G.; Ramakrishnan, K.R.; Pellegrino, A. Effects of build orientation and strain rate on the tensile-shear behaviour of polyamide-12 manufactured via laser powder bed fusion. Mater. Des. 2023, 232, 112162. [Google Scholar] [CrossRef]
  13. Yao, B.; Li, Z.; Zhu, F. Effect of powder recycling on anisotropic tensile properties of selective laser sintered PA2200 polyamide. Eur. Polym. J. 2020, 141, 110093. [Google Scholar] [CrossRef]
  14. Sharafi, S.; Santare, M.H.; Gerdes, J.; Advani, S.G. A review of factors that influence the fracture toughness of extrusion-based additively manufactured polymer and polymer composites. Addit. Manuf. 2021, 38, 101830. [Google Scholar] [CrossRef]
  15. Hitt, D.J.; Haworth, B.; Hopkinson, N. Fracture mechanics approach to compare laser sintered parts and injection mouldings of nylon-12. Proc. Inst. Mech. Eng. Part B J. Eng. Manuf. 2011, 225, 1663–1672. [Google Scholar] [CrossRef]
  16. Martínez, M.; Cano, A.J.; Salazar, A.; Rodríguez, J. On the failure assessment diagram methodology in polyamide 12. Eng. Fract. Mech. 2022, 269, 108558. [Google Scholar] [CrossRef]
  17. Cano, A.J.; Salazar, A.; Rodríguez, J. Effect of temperature on the fracture behavior of polyamide 12 and glass-filled polyamide 12 processed by selective laser sintering. Eng. Fract. Mech. 2018, 203, 66–80. [Google Scholar] [CrossRef]
  18. Brugo, T.; Palazzetti, R.; Ciric-Kostic, S.; Yan, X.T.; Minak, G.; Zucchelli, A. Fracture mechanics of laser sintered cracked polyamide for a new method to induce cracks by additive manufacturing. Polym. Test. 2016, 50, 301–308. [Google Scholar] [CrossRef]
  19. Linul, E.; Marsavina, L.; Stoia, D.I. Mode I and II fracture toughness investigation of Laser-Sintered Polyamide. Theor. Appl. Fract. Mech. 2020, 106, 102497. [Google Scholar] [CrossRef]
  20. Lingua, A.; Piccirelli, N.; Therriault, D.; Lévesque, M. In-situ full-field measurements for 3D printed polymers during mode I interface failure. Eng. Fract. Mech. 2022, 269, 108483. [Google Scholar] [CrossRef]
  21. Zhang, G.; Ghorbani, J.; Zheng, X.; Heathman, N.; Pan, D.; Wang, Q.; Zhao, K.; Tehrani, M.; Xu, L.R. Anisotropic and elastoplastic mode-I fracture toughnesses of three additively manufactured polymers fabricated via material extrusion and powder bed fusion. Fatigue Fract. Eng. Mater. Struct. 2023, 46, 4776–4782. [Google Scholar] [CrossRef]
  22. Stoia, D.I.; Linul, E.; Marsavina, L. Mixed-mode I/II fracture properties of selectively laser sintered polyamide. Theor. Appl. Fract. Mech. 2022, 121, 103527. [Google Scholar] [CrossRef]
  23. Rosso, S.; Meneghello, R.; Biasetto, L.; Grigolato, L.; Concheri, G.; Savio, G. In-depth comparison of polyamide 12 parts manufactured by Multi Jet Fusion and Selective Laser Sintering. Addit. Manuf. 2020, 36, 101713. [Google Scholar] [CrossRef]
  24. Calignano, F.; Giuffrida, F.; Galati, M. Effect of the build orientation on the mechanical performance of polymeric parts produced by multi jet fusion and selective laser sintering. J. Manuf. Process. 2021, 65, 271–282. [Google Scholar] [CrossRef]
  25. Tasch, D.; Schagerl, M.; Wazel, B.; Wallner, G. Impact behavior and fractography of additively manufactured polymers: Laser sintering, multijet fusion, and hot lithography. Addit. Manuf. 2019, 29, 100816. [Google Scholar] [CrossRef]
  26. Pinho, S.T.; Robinson, P.; Iannucci, L. Fracture toughness of the tensile and compressive fibre failure modes in laminated composites. Compos. Sci. Technol. 2006, 66, 2069–2079. [Google Scholar] [CrossRef]
  27. Jiang, W.; Hallett, S.R.; Green, B.G.; Wisnom, M.R. A concise interface constitutive law for analysis of delamination and splitting in composite materials and its application to scaled notched tensile specimens. Int. J. Numer. Methods Eng. 2007, 69, 1982–1995. [Google Scholar] [CrossRef]
  28. Selvaraj, J.; Kawashita, L.F.; Hallett, S.R. Mesh independent modelling of tensile failure in laminates using mixed-time integration in explicit analysis. Eng. Fract. Mech. 2022, 259, 108113. [Google Scholar] [CrossRef]
  29. Peng, K.; Lee, M.; Pandelidi, C.; Kajtaz, M. Build orientation effects on mechanical properties and porosity of polyamide-11 fabricated via multi jet fusion. Addit. Manuf. 2020, 36, 101533. [Google Scholar] [CrossRef]
  30. Flodberg, G.; Pettersson, H.; Yang, L. Pore analysis and mechanical performance of selective laser sintered objects. Addit. Manuf. 2018, 24, 307–315. [Google Scholar] [CrossRef]
  31. Sillani, F.; Kleijnen, R.G.; Vetterli, M.; Schmid, M.; Wegener, K. Selective laser sintering and multi jet fusion: Process-induced modification of the raw materials and analyses of parts performance. Addit. Manuf. 2019, 27, 32–41. [Google Scholar] [CrossRef]
  32. Araújo, L.C.; Gabriel, H.G.; Eduardo, B.; Avila, J.A.; Jardini, L.; Seno, R.; Lopes, S.N. Effects of build orientation and heat treatments on the tensile and fracture toughness properties of additively manufactured AlSi10Mg. Int. J. Mech. Sci. 2022, 213, 106868. [Google Scholar] [CrossRef]
Figure 1. (a) Geometry of compact tension sample and (b) different build directions for additive manufacturing.
Jmmp 08 00263 g001
Figure 2. Experimental setup for compact tension testing.
Jmmp 08 00263 g002
Figure 3. Typical images from optical camera and thermal camera during compact tension tests.
Jmmp 08 00263 g003
Figure 4. Numerical modelling of compact tension test using cohesive zone modelling.
Jmmp 08 00263 g004
Figure 5. Force vs. opening displacement curves for SLS (a) XY and (b) Z.
Jmmp 08 00263 g005
Figure 6. Force vs. opening displacement curves for MJF (a) XY and (b) Z.
Jmmp 08 00263 g006
Figure 7. Comparison of force vs. displacement for different orientation and manufacturing process.
Jmmp 08 00263 g007
Figure 8. Crack extension measurement from optical images and thermal images for SLS Z sample (Dashed lines indicate crack location).
Jmmp 08 00263 g008
Figure 9. Typical shear strain contour from DIC analysis.
Jmmp 08 00263 g009
Figure 10. Crack length vs. time for typical SLS Z sample.
Jmmp 08 00263 g010
Figure 11. J-R curves for (a) SLS and (b) MJF.
Jmmp 08 00263 g011
Figure 12. Mean value of Jmax from calculation of the J-integral for samples printed in different build orientations.
Jmmp 08 00263 g012
Figure 13. Predictions obtained from the numerical modelling for SLS XY (a) and Z (b) configurations and comparison against experiments.
Jmmp 08 00263 g013
Figure 14. Predictions obtained from the numerical modelling for MJF XY (a) and Z (b) configurations and comparison against experiments.
Jmmp 08 00263 g014
Figure 15. Comparison of shear strain contours from numerical model and experimental data.
Jmmp 08 00263 g015
Figure 16. SEM images of the crack surface of SLS (a) XY and (b) Z and MJF (c) XY and (d) Z samples (Yellow arrows indicate irregularities post fracture).
Jmmp 08 00263 g016
Figure 17. Fracture surface of (a,b) SLS XY and (c,d) MJF Z specimens.
Jmmp 08 00263 g017
Table 1. Continuum material properties of SLS and MJF.
Printing TypeDensity (kg/m3)Elastic Modulus (MPa)Poisson’s Ratio
SLS99017600.35
MJF93014200.33
Table 2. Cohesive zone material properties calculated from Jmax.
Printing TypePenalty Stiffness (N/mm3)Stress at Softening Initiation (MPa)Fracture Toughness (KJ/m2)
SLS XY10543.6111.01
SLS Z10543.6127.59
MJF XY10540.104.59
MJF Z10540.107.34
Disclaimer/Publisher’s Note: The statements, opinions and data contained in all publications are solely those of the individual author(s) and contributor(s) and not of MDPI and/or the editor(s). MDPI and/or the editor(s) disclaim responsibility for any injury to people or property resulting from any ideas, methods, instructions or products referred to in the content.

