Article

Experimental Methodology to Identify Optimal Friction Stir Welding Parameters Based on Temperature Measurement

1
Department of Mechatronics, University of Rennes, ENS Rennes, CNRS, IPR, UMR 6251, 35000 Rennes, France
2
STIRWELD, 35000 Rennes, France
3
Central School of Nantes, Research Institute in Civil and Mechanical Engineering, 44321 Nantes, France
*
Author to whom correspondence should be addressed.
J. Manuf. Mater. Process. 2024, 8(4), 137; https://doi.org/10.3390/jmmp8040137
Submission received: 19 April 2024 / Revised: 3 June 2024 / Accepted: 26 June 2024 / Published: 27 June 2024
(This article belongs to the Topic Development of Friction Stir Welding and Processing)

Abstract

:
Friction stir welding (FSW) is a widely employed welding process, in which advancing and rotational speeds consitute critical parameters shaping the welding outcome and affecting the temperature evolution. This work develops an experimental methodology to identify optimal FSW parameters based on real-time temperature measurement via a thermocouple integrated within the tool. Different rotational and welding speeds were tested on AA5083-H111 and AA6082-T6. Our results underscore the importance of attaining a minimum temperature threshold, specifically 0.65 times the solidus temperature, to ensure high-quality welds are reached. The latter are defined by combining temperature measurements with joint quality information obtained from cross-sectional views. Our research contributes to advancing the efficiency and effectiveness of friction stir welding in industrial settings. Furthermore, our findings suggest broad implications for the manufacturing industry, offering practical insights for enhancing weld quality and process optimization.

1. Introduction

Friction stir welding (FSW) is a solid-state welding method invented by The Welding Institute (TWI) in 1991, allowing for the assembly of two workpieces, using a rotational rigid tool (Figure 1) [1]. It has emerged as a pivotal technique employed in mass production, a significant milestone within the industrial sector. Its welding speed and exceptional versatility, especially with lightweight materials, have propelled it to the forefront of industrial applications. This technique enables one to control melting defects [2] and obtain high mechanical properties of the weld [3,4]. Another remarkable advantage of the process is its ability to operate below the melting point of the workpiece material, making it possible to weld aluminum alloys that cannot normally be joined by conventional fusion welding techniques [2,5]. Therefore, understanding heat generation phenomena is crucial towards achieving successful welds and optimizing the welding process, given that industrials are interested in reaching the highest welding speeds [6]. This phenomenon is the result of (i) the plastic deformation of the material around the tool, depending on advancing and rotational speeds; and (ii) the friction between the tool and the material, governed by the shape of the rotating tool [6,7,8].
However, weld quality control is a challenging task due to temperature variation throughout the weld [8]. In other words, temperature has an important influence on the porosity rate [9], which could dramatically decrease the mechanical properties of the welded part [10,11]. Moreover, for aluminum alloy strengthened by second phases, the welding temperature will affect the dissolution, coarsening, or precipitation of second phases. That could result in a significant decline in the alloy’s mechanical properties as reported in the literature [12]. Accordingly, ISO-252395 [13] specifies the requirements for determining the capability of a manufacturer in order to use the friction stir welding (FSW) process to reach the specified quality in the final product. One of its primary criteria for assessing the quality of a weld revolves around the presence of porosity defects, which are categorized into two main types: (i) “hot weld” and (ii) “cold weld” (Figure 2). Hot welds exhibit porosities that form along the top of the weld, creating a groove structure. In contrast, cold welds display porosities located at the bottom of the weld, typically attributed to insufficient penetration forming a tunnel-shape [14].
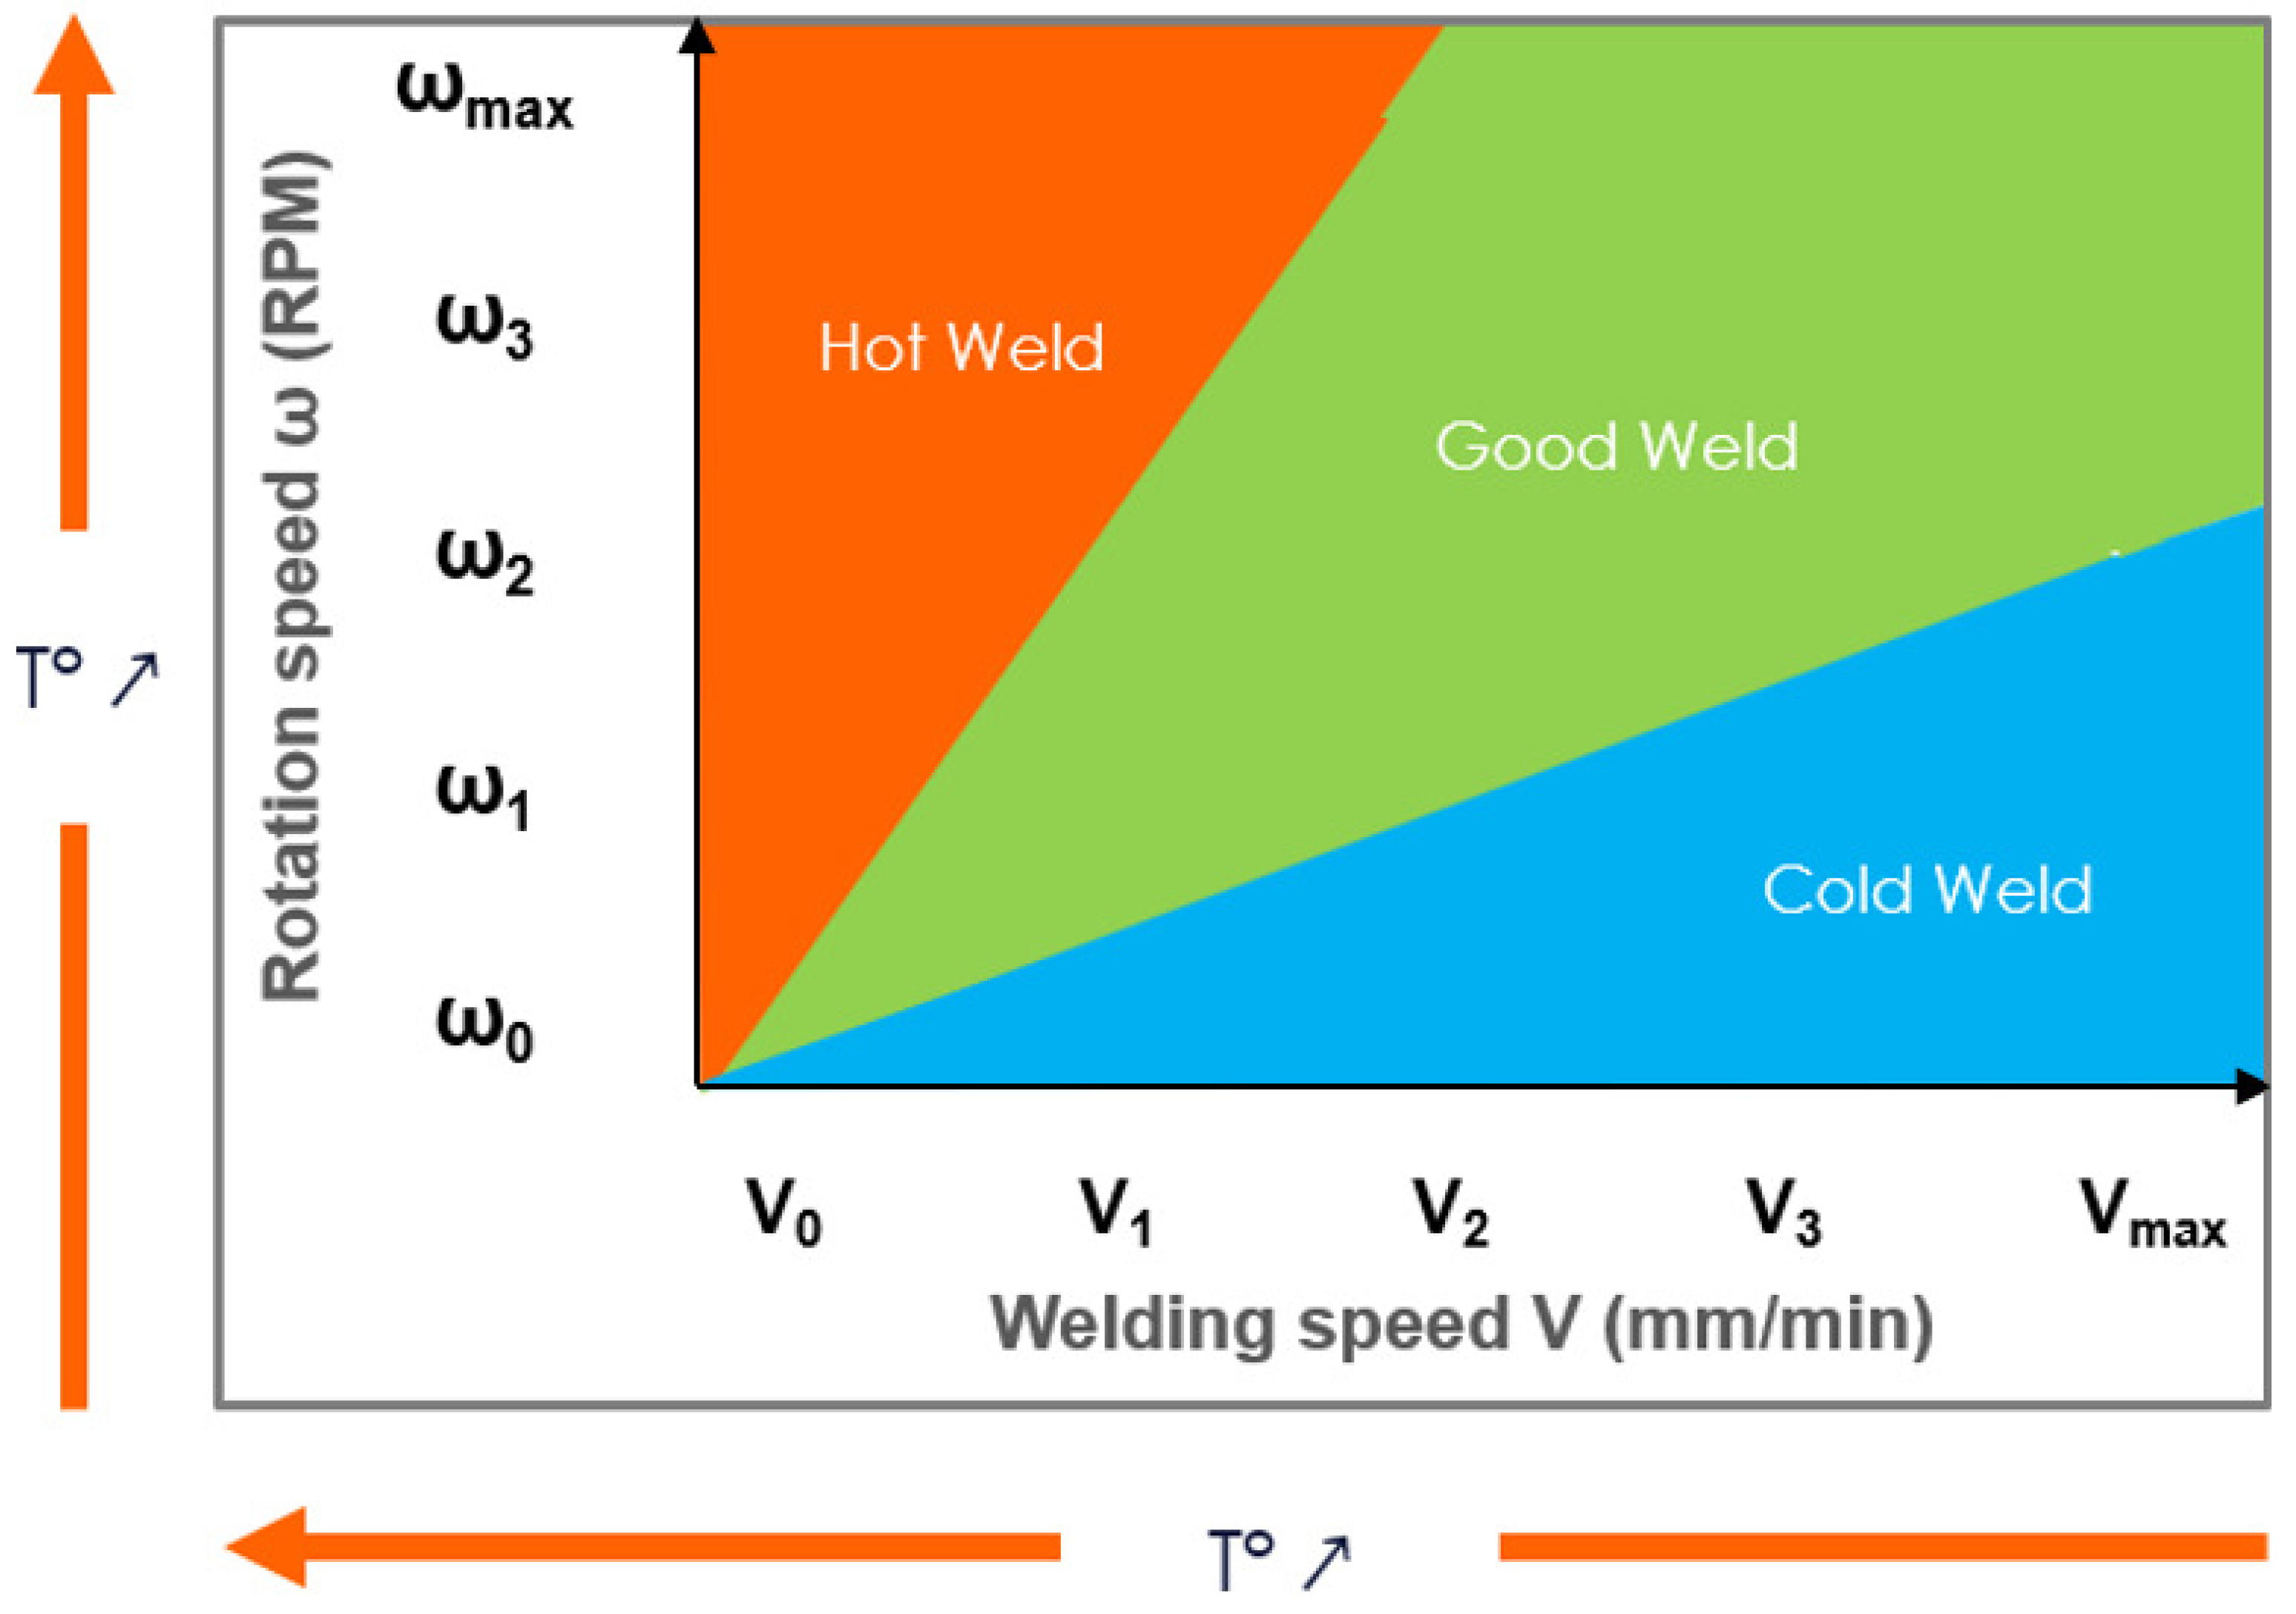
Pushing welding speeds to their upper limits can lead to outcomes such as porosity defects when not meticulously managed. These defects lead to a welding window consisting of three distinct zones (Figure 3; this welding window serves as a representative scheme for an aluminum alloy, and its values depend on the the material’s characteristics). These areas are classified as follows: a high-quality weld, often referred to as a “good weld”; a “hot weld”, characterized by porosities occurring due to excessive heat produced at high rotational speeds; and a “cold weld”, featuring porosities resulting from inadequate penetration (the result of high advancing speeds) [14,15,16]. The temperature increases along with the increase in rotational speed and the decrease in advancing speed [17].
To establish the welding operating window, conventional methods typically rely on destructive testing, according to ISO-25239 [13] guidelines. Consequently, extensive testing is required by industrials to derive a set of process parameters. However, our aim is to develop a non-destructive method for defining this window. Given the important role of temperature in Friction Stir Welding (FSW), we propose measuring the temperature to determine the welding operating window. This approach presents a non-destructive advantage, especially considering the intimate connection between temperature and the process parameters. Despite the limited availability of data regarding welding operating windows based on temperature and process parameters, our research focuses on this novel avenue for obtaining high-quality welds. To this end, our work involves an extensive experimental campaign involving two widely used aluminum alloys, specifically AA-5083-H111 and AA-6082-T6, to provide valuable insights into optimizing the welding process.
In our study, we begin with a literature review of experimental temperature measurements (Section 2). This is followed by the introduction of a tool-mounted temperature measurement approach and the execution of experiments involving parameter variations while monitoring the temperature (Section 3). Subsequently, the paper discusses the results obtained through porosity analysis and temperature data, along with the establishment of operational windows (Section 4). Finally, the paper concludes with a discussion and offers insights into future directions and conclusions (Section 5).

2. State of the Art

FSW is a complex process influenced by various parameters. The importance of each parameter can vary based on the specific application and material being welded. In this context, two crucial parameters significantly influence the process: the rotational speed ω and the welding speed V.
Rotational speed holds significant importance as a process parameter. It affects several critical aspects such as the amount of heat generated, the plastic deformation of the material, and the forces applied on the tool, which impact the defect generation and the size of the stirred zone. A low rotational speed can lead to imperfect joints due to insufficient heat input [18] and tends to yield joints with higher hardness [19]. Conversely, a high rotational speed helps stir the material but presents challenges. One challenge is increasing tool wear resulting from intense friction, particularly when dealing with high-strength aluminum, as it will reduce tool life [20]. However, finding the right balance in the choice of rotational speed is crucial, even more so when excessively high rotational speeds may lead to undesirable consequences. Elevated values may lead to an over-aggressive stirring action, potentially inducing flashes and/or porosities within the joint [21]. Simultaneously, if rotational speeds are too low, there may not be sufficient mixing of the mechanical bonding between the welding plates [22]. Therefore, the temperature increases when the rotational speed increases.
The significance of the welding speed in achieving high-quality is equivalent to that of the rotational speed in the FSW process. Extremely high welding speeds can lead to joints with incompletely welded interfaces due to inadequate heat input [23]. This deficiency is particularly notable in cases where the welding speed is excessively high, reducing the thermal cycle duration [24]. Conversely, low welding speeds contribute to increasing the material stirring during the welding process [22]. So, reducing the advancing speed leads to an increase in temperature during FSW.
The interplay between rotational speed and welding speed is extensively documented as a key determinant of weld quality. The optimal combination of these parameters is critical as it dictates the thermal conditions during the welding process regarding whether it leans towards the cold weld (the blue area, Figure 3) or the hot weld (the red area, Figure 3).
To that end, researchers and engineers are interested in determining the optimal parameters, specifically rotational and advancing speeds, for achieving defect-free welded pieces. Numerous experimental temperature measurement methods are employed to define the welding process window. Table 1 outlines the experimental methods employed by researchers over the past 25 years on different aluminum alloys and the temperature limits of a good weld.
These methods (Figure 4) include thermal cameras (IR Camera), the thermoelectric method (TWT), and thermocouples embedded in the workpiece (TC-Workpiece) or the FSW tool (TC-Tool). However, obtaining accurate weld temperature measurements through experimental validation poses challenges.
In the case of IR cameras [25], issues are related to aluminum emissivity and the measurement of the zones outside the weld, as well as problems with measurement quality if the camera is not well fixed. To validate the accuracy of this method, Ambrosio et al. [8] integrated thermocouples into the back of the workpiece for comparative analysis.
The thermoelectric TWT method [26] is based on the thermoelectric effect where the electric potential generated between the FSW tool material and the aluminum workpiece is associated with the weld temperature. Each tool–workpiece material combination requires a calibration of the voltage temperature relation. Therefore, it involves an extensive study leading to excessive experimental work.
As for the TC-Workpiece [27,28], the significant plastic deformation at the workpiece-tool interface poses a primary obstacle. However, interpreting thermocouple measurements becomes intricate due to their extreme sensitivity to location, and caution is warranted in data interpretation. There is a risk of thermocouple destruction by the rotating pin and the intense plastic deformation in the stir zone.
Thermocouples embedded in the FSW tool may experience a time delay if not positioned correctly, as reported by [29].
To conclude, standard temperature measurement methods often lack the repeatability, accuracy, or speed required to obtain a window in an industrial way. Therefore, we recognized the need for further research centered around a straightforward temperature measurement method suitable for industrial use, enabling the determination of the welding window.
Despite their limitations, thermocouples embedded either in the workpiece or in the tool have proven to be the most successful. Therefore, in this study, we utilized a thermocouple embedded in the tool and positioned in the plane of the shoulder as well as in the middle of the tool that measures the temperature of the weld in real time. This choice was driven by the necessity to explore alternative methods for determining optimal parameters that ensure the production of high-quality welds.
Table 1. Experimental temperature measurement methods review. Tm, measured temperature; Tmelt, melting temperature of the material; Ts, solidus temperature; Tmin, minimum temperature of a good weld; Tmax, maximum temperature of a good weld; TC-Tool, thermocouple embedded in the tool; TC-Workpiece, thermocouple embedded in the workpiece; IR, infrared camera; and TWT, tool–workpiece thermocouple.
AuthorYearMethodMaterialTmin < Tm < Tmax References
D. Ambrosio2022TC-ToolAA-6082-T6477 < Tm (°C) < Ts[8]
AA-5083-H111
AA-7075-T6
A. Wright2021TC-ToolAA-6111Tm = 450 °C[30]
D. Ambrosio2020TC-WorkpieceAA-7075-T6Tmin = 350 °C[21]
IR Camera
S. Verma2020TC-WorkpieceAA-7039283 < Tm (°C) < 390[26]
T. Wu2019TC-Tool2A14-T6 [31]
TC-Workpiece
G. Sorger2018TC-WorkpieceHSS650 < Tm (°C) < 900[32]
A. C. F. Silva2016TC-WorkpieceAA-6082-T6Tmax = 500 °C[27]
TWT
TC-Tool
A. Fehrenbacher2013TC-Tool-ShoulderAA-6061515 < Tm (°C) < Ts[33]
AA-5083 H111518 < Tm (°C) < Ts
TC-Tool-PinAA-6061460 < Tm (°C) < Ts
AA-5083 H111479 < Tm (°C) < Ts
J. De Backer2013TWTAA-6082-T6Tmax = 432 °C[34,35]
C. Hamilton2010IR CameraSSA038-T6Tmax = 400 °C[36]
P. Upadhyay2010TC-ToolAA-7050Tmax = 350 °C[37]
T7451
P. L. Threadgill2009TC-WorkpieceAA-6061 T6Tmax = 500 °C[38]
F. Gratecap2008TC-WorkpieceAA-2017 T40.7 Tmelt < Tm (K) < 0.8 Tmelt[39]
Yuh J. Chao2003TC-WorkpieceAA-21950.8 Tmelt < Tm (°C) < 0.9 Tmelt[40]
L.E. Murr1998 AA-6061Tmax = 425 °C[41]
M.W. Mahoney1998TC-WorkpieceAA-7075 T651Tmax < Tmelt[42]
W. Tang1998TC-ToolAA-6061 T6Tmax = 450 °C[43]
C.G. Rhodes1997TC-WorkpieceAA-7075 T651400 < Tm (°C) < 480[44]

3. Experimental Approach

A HAAS-VF3 CNC machine with a Stirweld FSW head (maximum rotational speed of 3500 rpm and a critical force of 25 KN) was used to conduct 250 mm welding lines of the aluminum alloy. The selection of 250 mm for friction stir welding lines is based on compliance with ISO-25239 [13]. The specific choice of this length is determined by the standard’s guidelines and requirements for achieving optimal welding results and ensuring the integrity of the welded structures.
Tools were machined from the steel-based alloy X37CrMoV5-1 H11. The tool dimensions used in this study are 8.5 mm shoulder diameter with a conical pin of 4 mm diameter at the base, 3 mm at the top, and 3 mm length (as shown in the Figure 5 cross section view).
This tool is specifically drilled for the insertion of a type J thermocouple and a diameter of 2 mm. The optimal distance between the thermocouple and the weld is achieved through the precise positioning of the thermocouple within the tool, as shown in Figure 5. The temperature measurement system accurately provides the temperature of the point that’s nearest to the stir zone by situating the thermocouple at a minimal distance from the tool shoulder. The thermocouple is connected to a contactless card system fixed on the FSW head, so that real-time temperature data can be easily transmitted via a cable, facilitating seamless communication between the rotational and fixed parts of the system.
The temperature measurement system underwent calibration tests to achieve an optimal balance of spatial and temporal resolutions. These calibration tests were based on measuring the evolution of the temperature of two different fluids (water and oil) under constant heating. The results were compared to those of another calibrated thermometer, revealing that the difference between the two measurements was insignificant.
The base metals used are AA-6082 T6 and AA-5083 H111. AA-6082 T6 is a structural alloy with an average strength of 260 MPa but excellent corrosion resistance. Having a solidus temperature of 555 °C, it is commonly used for machining. AA-5083 H111 is an alloy with a higher strength of 317 MPa. Having a solidus temperature of 580 °C, it has high resistance to seawater and industrial chemical environments. The aluminum alloys are in the form of rectangular sheets with dimensions 595 × 120 × 4 mm. They were selected for their significant utility in friction stir-welded structures across diverse industrial sectors [8].
The welding parameters are detailed in Table 2, and each configuration underwent a single test.
The axial force was deliberately selected in a way to avoid producing defective joints while also minimizing the said force. This approach ensures optimal contact between the tool and the workpiece during the welding process.
Based on the literature, the limits of the maximum temperature generated during welding is in general about 0.7–0.9 of the melting temperature of the material [45]. Gratecap [46] demonstrated that it is possible to optimize the welding speed while maintaining a constant welding temperature by correspondingly increasing the rotation speed. Okamura [47] defined a weldable zone approximately located between the isotherms at 500 °C and 550 °C for AA-6061 T6.
Considering these statements and to determine the limit of cold welds, the initial combination of welding and rotational speed ( ω 0; V0) is selected to be the point nearest to the intersection between the cold and hot limits (Figure 6). Subsequent combinations are chosen in a way to maintain a quality weld. Therefore, the rotational speed ω 0 is held constant and the advancing speed is increased to V1 (1). If a cold defect is observed, the advancing speed V1 is stabilized, and the rotational speed is then increased to ω 1 (2). Then, the advancing speed is gradually increased until a cold defect is observed (3). This cycle is repeated until the maximum speed Vmax is reached and/or porosities are seen in the cross-section (4). The axial force is continuously adjusted in each combination to ensure optimal contact between the tool and the work-piece (if the maximum force is reached for an advancing speed, we consider that this is the maximum advancing speed).
The same strategy is applied to determine the limit of hot welds by increasing the rotational speed to ω 1 while maintaining the advancing speed of the initial setup (5). If a hot defect is detected, the advancing speed is increased to achieve a quality weld (6). This cycle is repeated until the maximum speed ω max is reached or porosities appear in the cross-section (7).
The maximum rotational speed and axial force are limited by the head.
To ensure the weld’s integrity without defects and to establish a correlation between the parameters and the solidus temperature, a cross-section polishing at 50 mm of the end of the weld is necessary, as per the ISO-25239 [13] guidelines. Initially, the piece is sliced using an electrical saw. Then, the specimens are coated with thermosetting resin for easier handling and to preserve intricate edges and surface defects during metallographic preparation. The specimens underwent polishing with various grit sizes of emery papers, with the final step involving the use of diamond compound (3 µm particle size). To enhance macrostructure visibility, the sections were treated with sodium hydroxide to reveal the tool’s trace. Macrostructural analysis was conducted using a USB digital microscope (RS PRO) equipped with image analysis software (Micro-Capture Plus v31).
In summary, our approach involves four main steps: selecting a set of parameters (V; ω ), conducting welding, cutting, and observation. If porosity is observed at the top, indicating excessive heat, we recommend reducing the rotational speed ( ω ). Conversely, if porosity is detected at the bottom, suggesting insufficient heat, the rotational speed is increased. The absence of porosity signifies a well-executed weld, prompting an increase in the advancing speed (V). Furthermore, after conducting numerous test campaigns, specific thresholds of + / 250 RPM for rotational speed ω and + / 250 mm/min for advancing speed V can be established. This is aimed at creating a systematic and lucid framework for understanding and implementing the steps in the process of optimizing the welding procedure.

4. Results

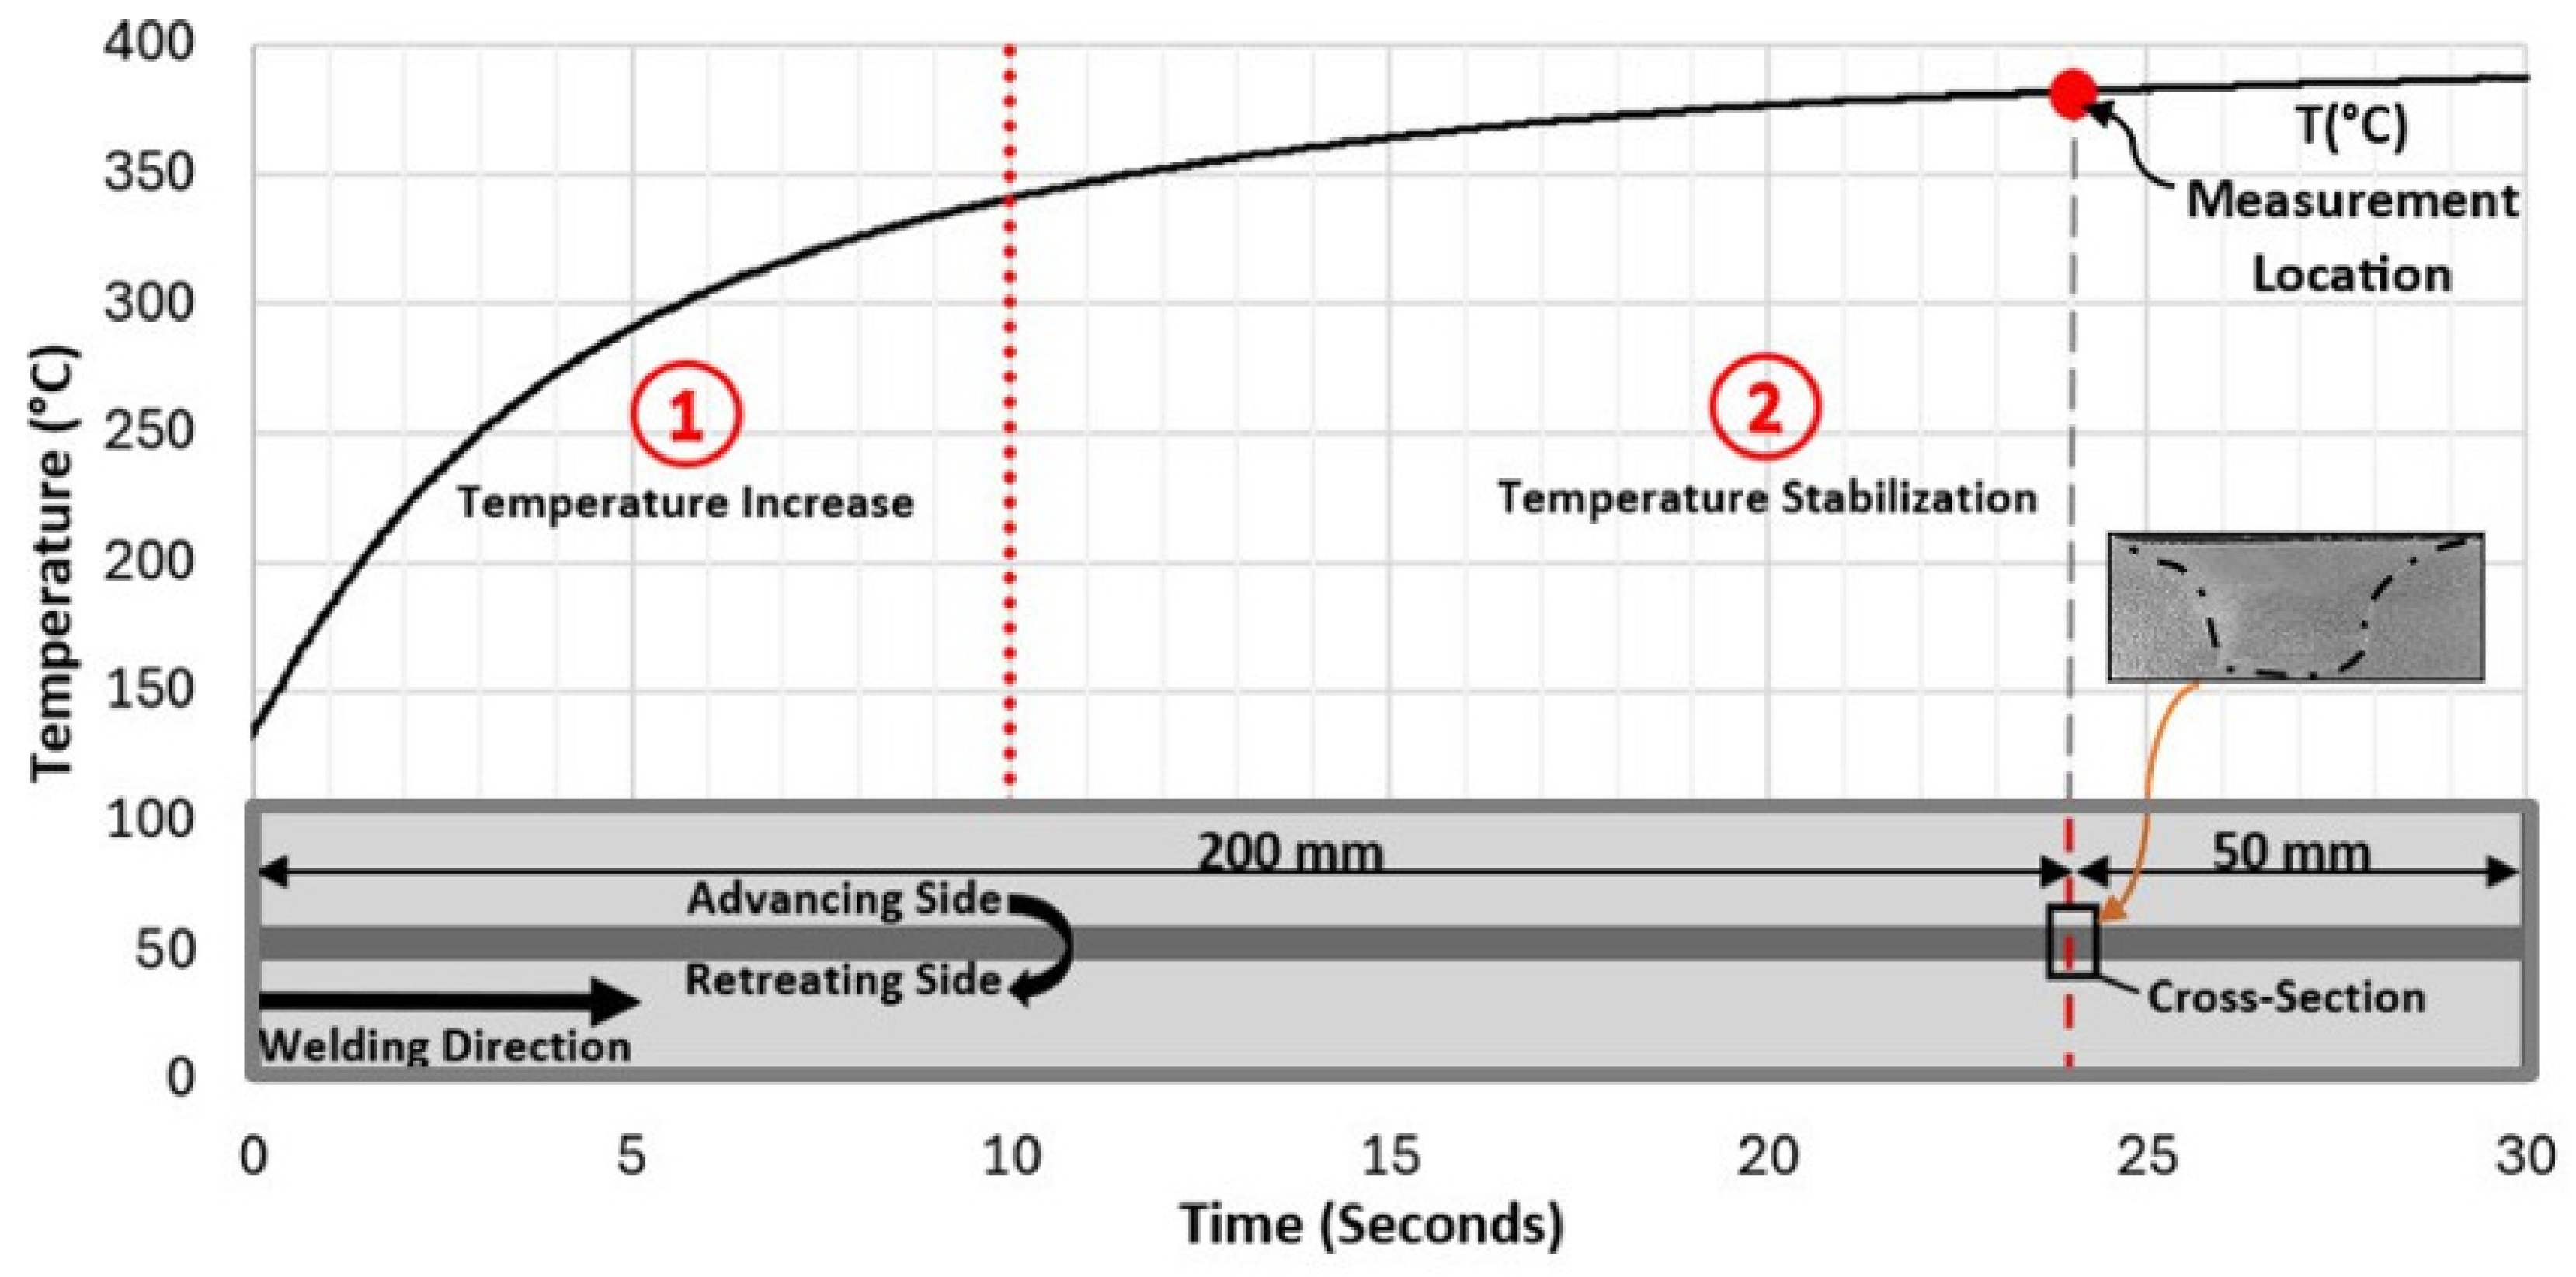
The temperature variation is continually monitored through the embedded thermocouple in the tool, as illustrated in Figure 7 for the AA-6082-T6 material under a specific set of parameters (V = 500 mm/min; ω = 2000 RPM). The temperature exhibits an initial increase at the start of the weld, followed by stabilization until the finalization of the welding process. The temperature considered corresponds to the location of the cross-section shown in Figure 7. The weld quality is subsequently assessed through the macrographic view of the cross-section.
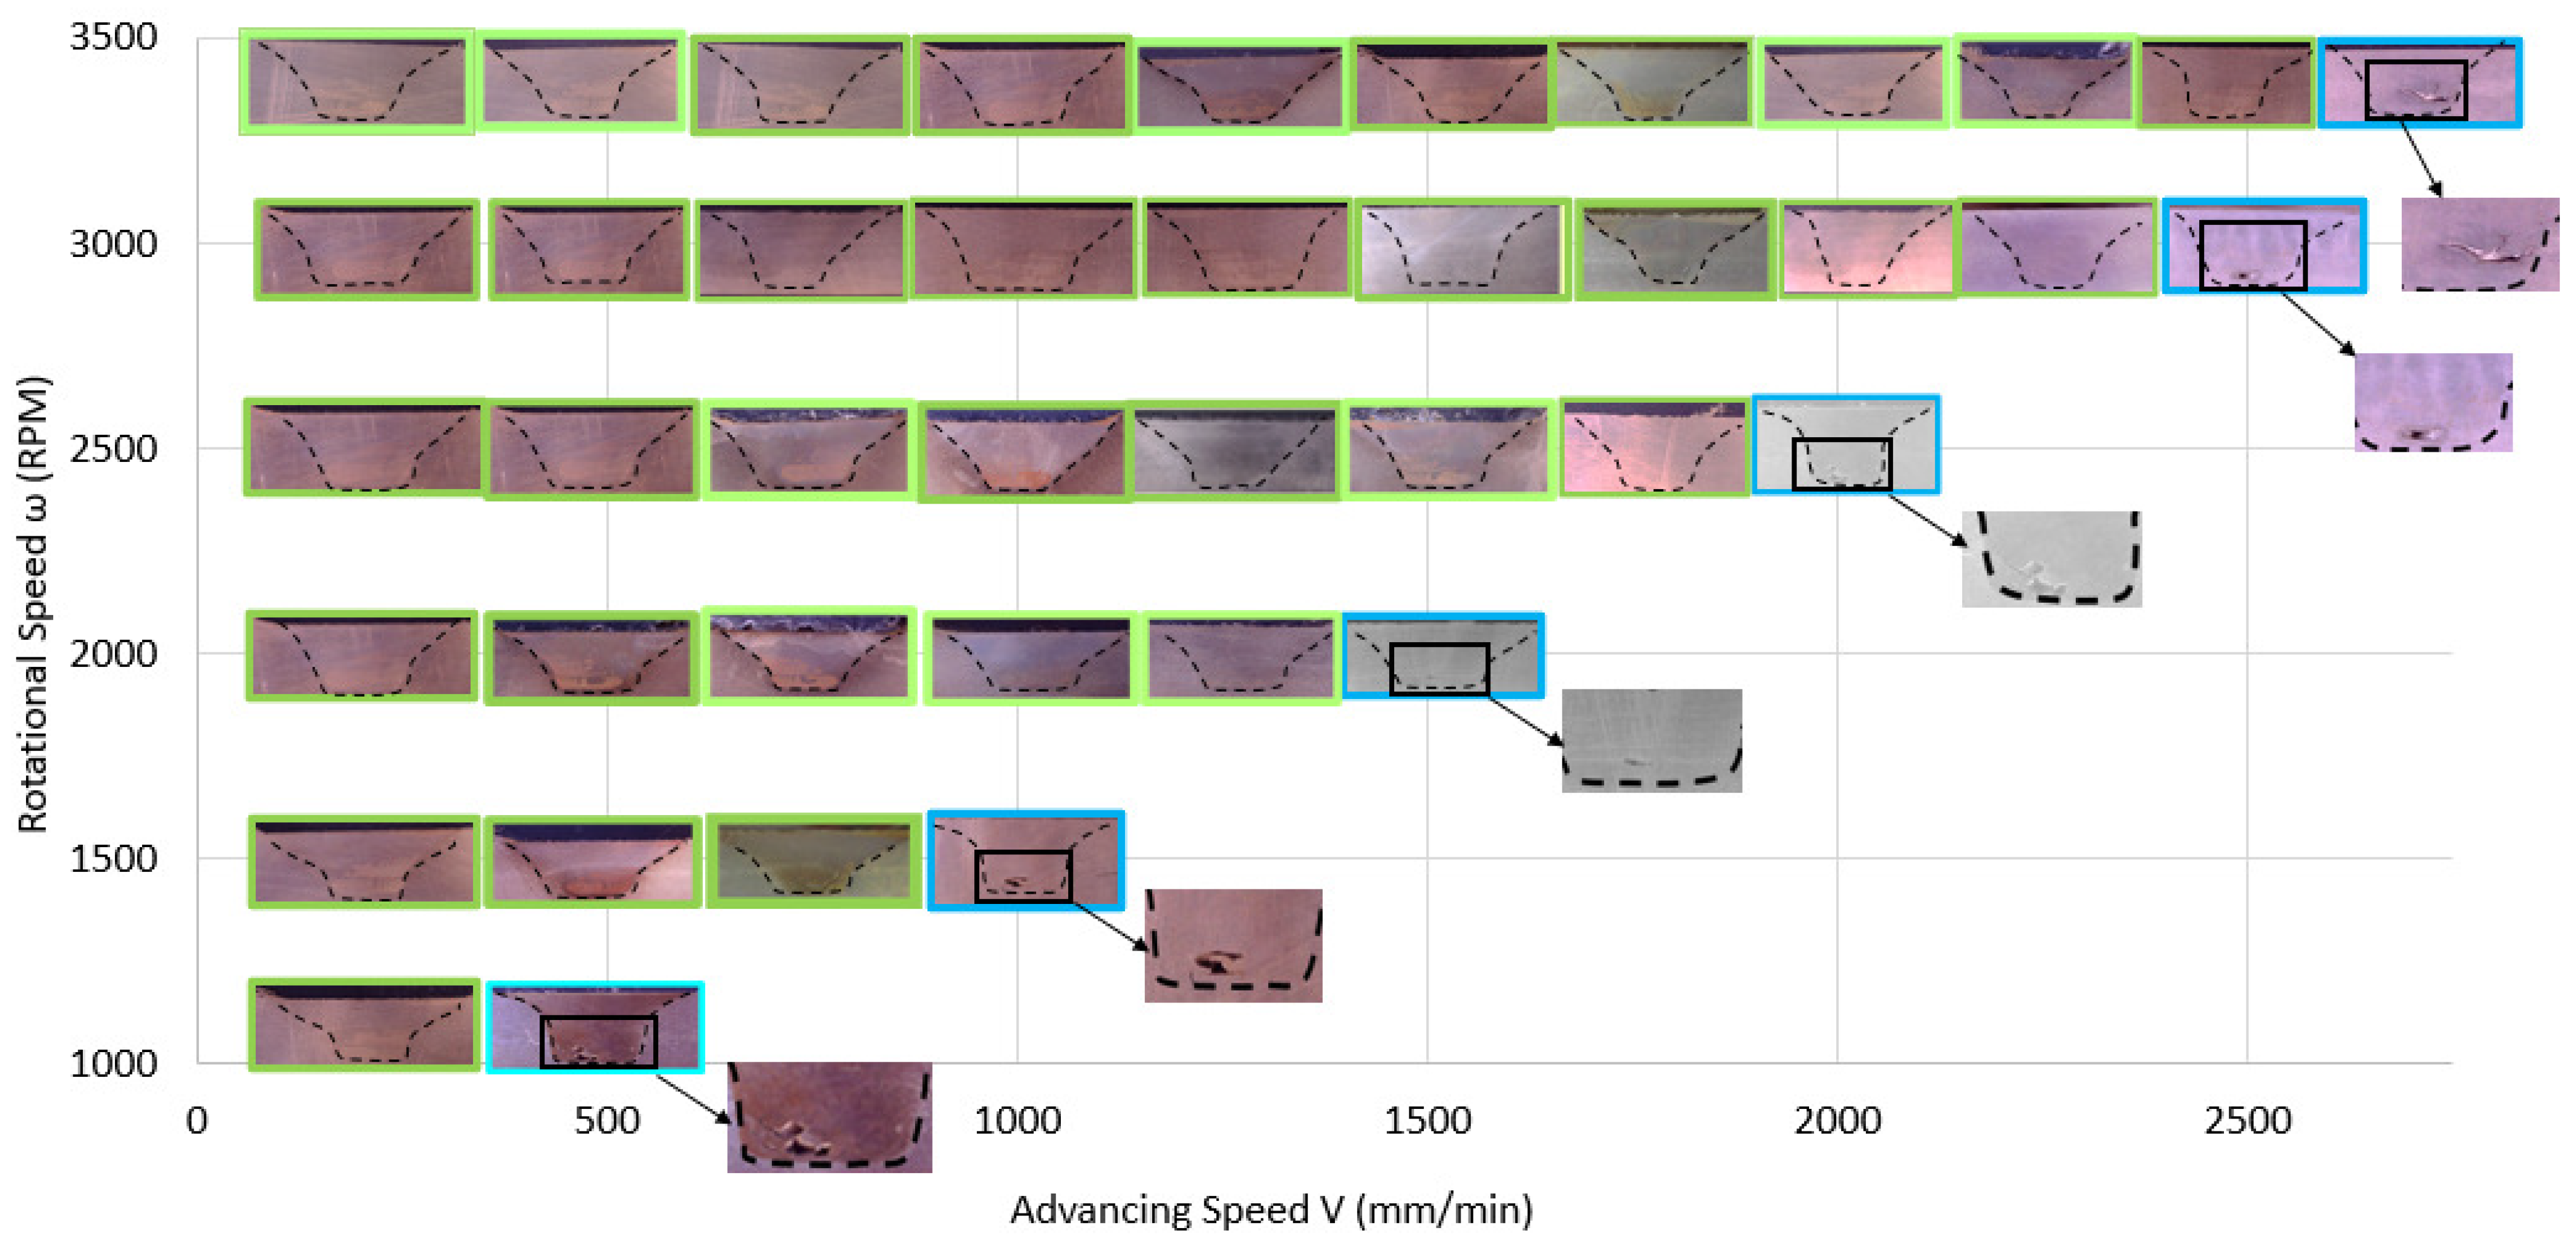
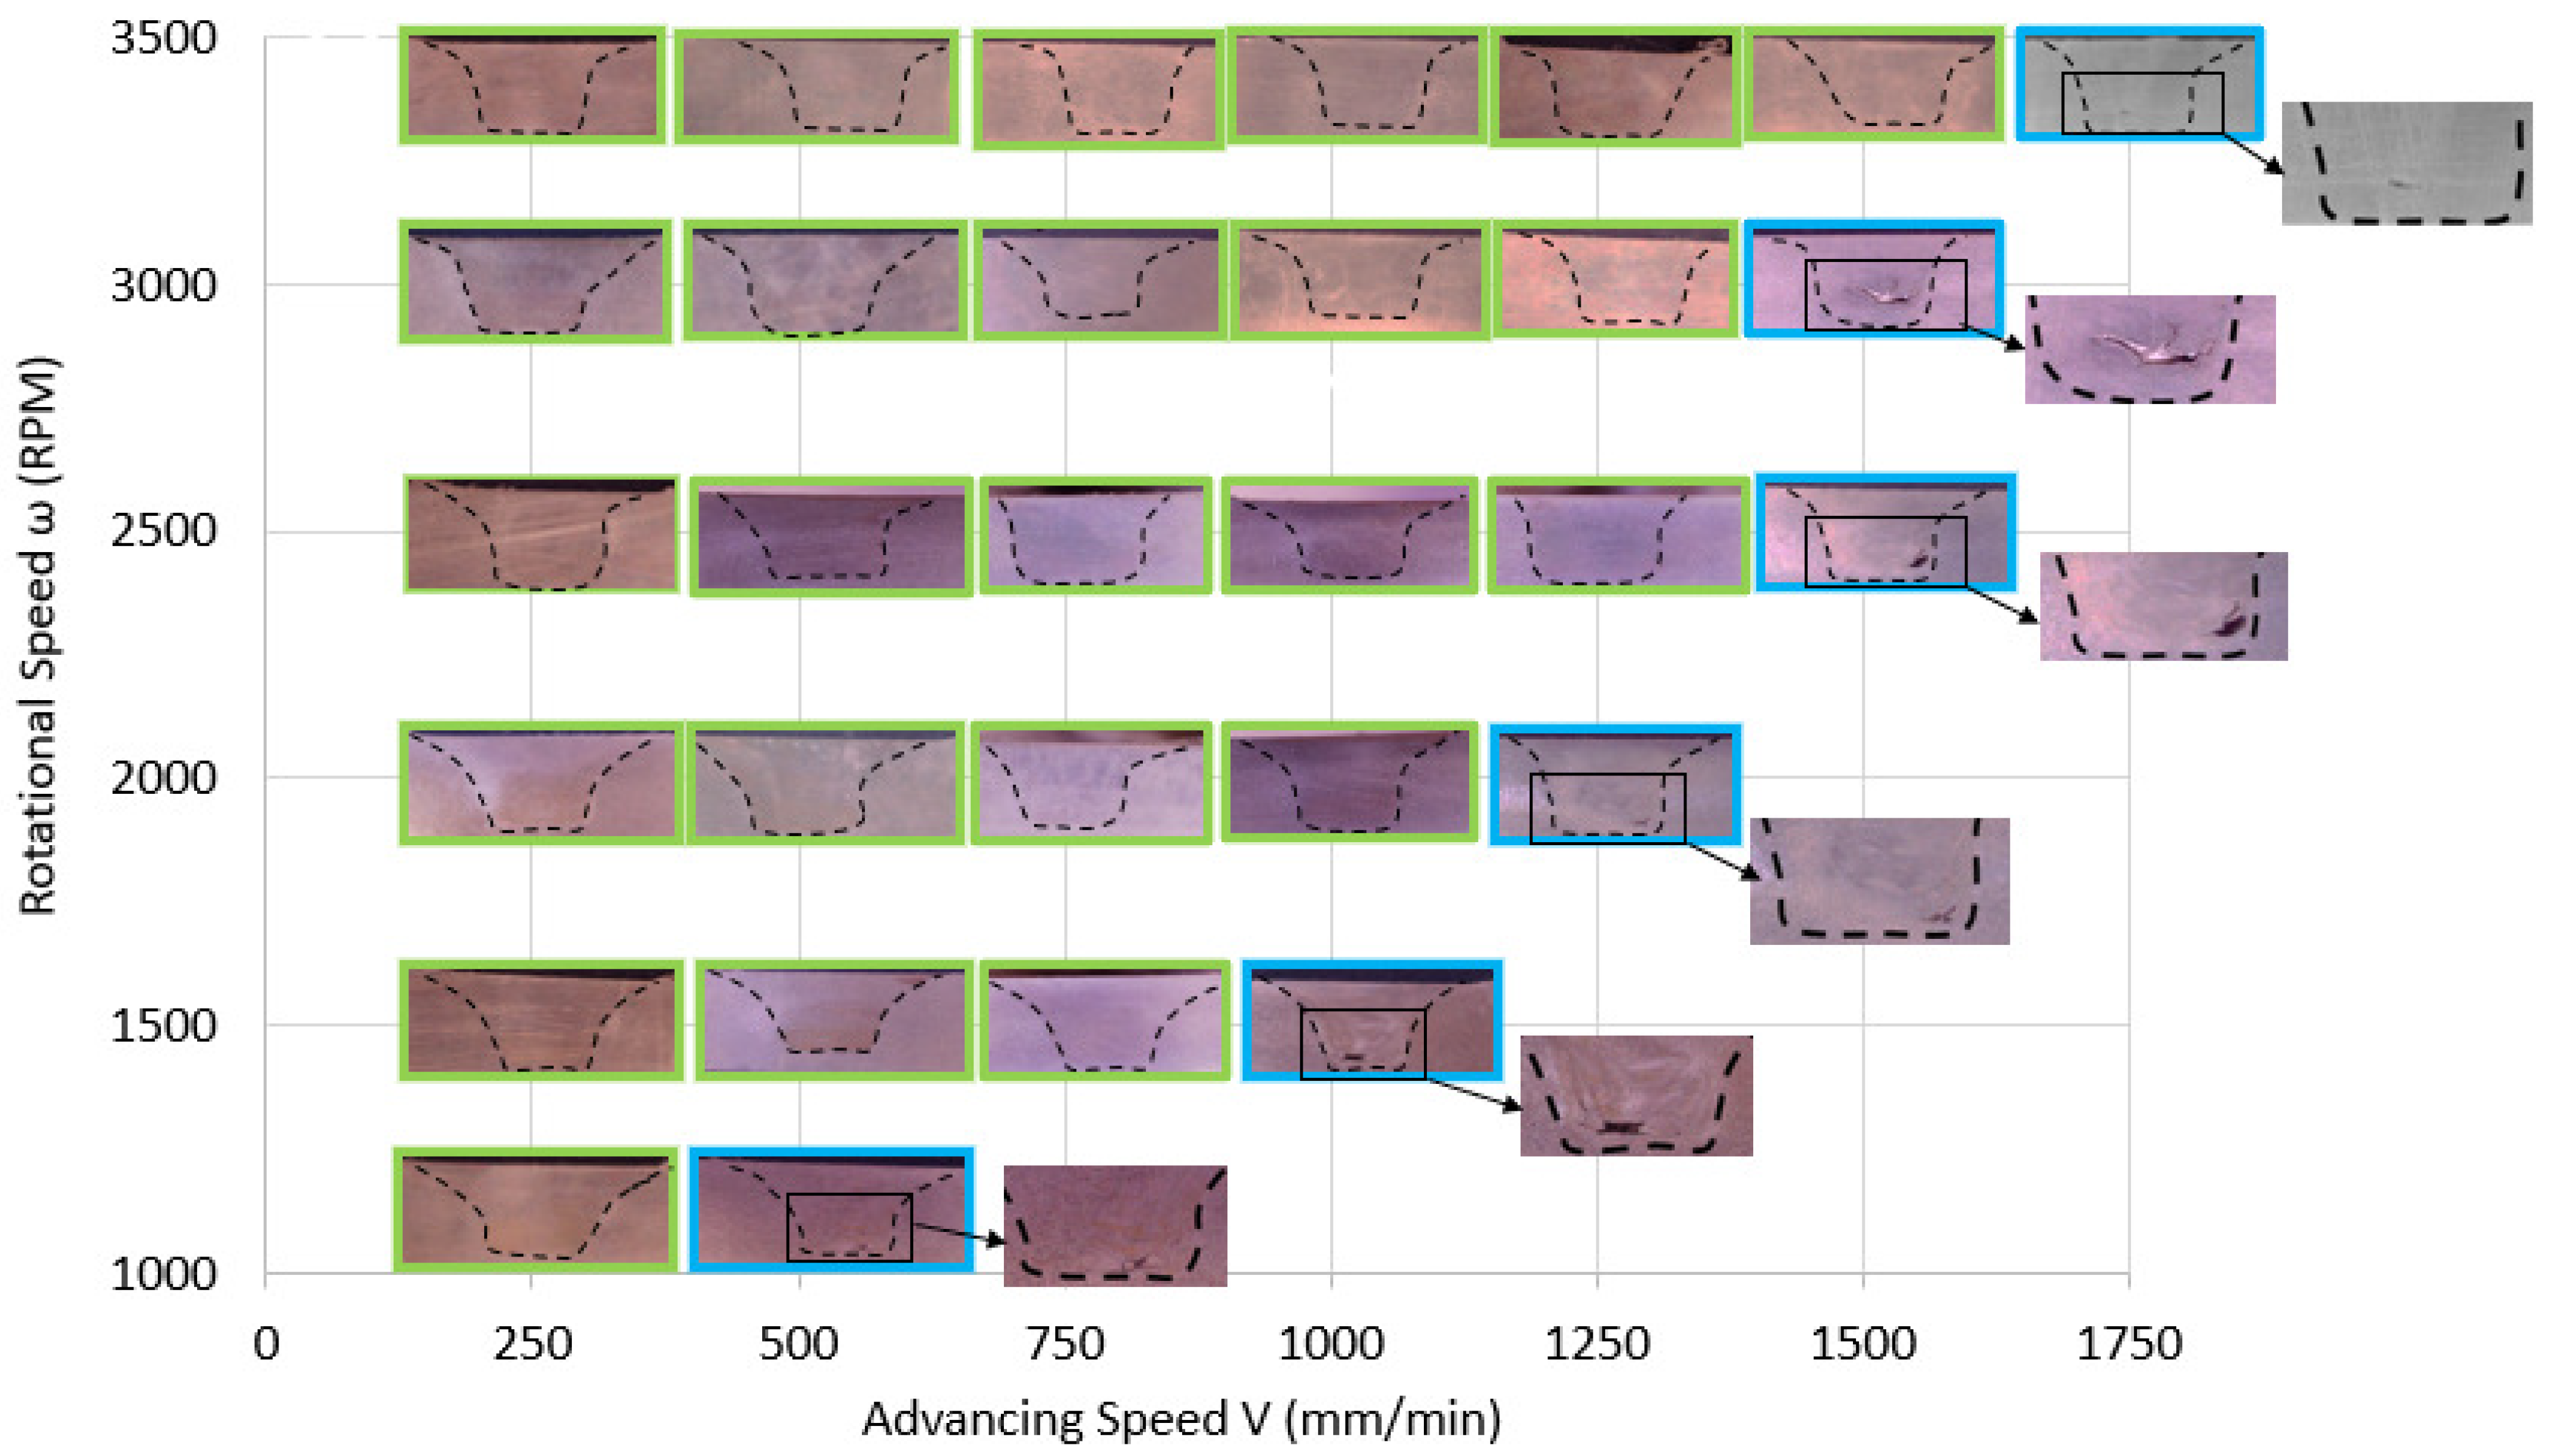
For each set of parameters (V; ω ), a temperature curve is obtained, and a cross-section is evaluated at 50 mm from the end of the weld. Figure 8 and Figure 9 show the cross-sectional views of AA-6082 T6 and AA-5083 H111, respectively. The boundary between the good weld (the green contouring of the macrostructure) and the cold weld (the blue contouring of the macrostructure) is determined by the porosities at the bottom of the cross-section, indicating a ’cold weld,’ as shown in the zoomed-in views.
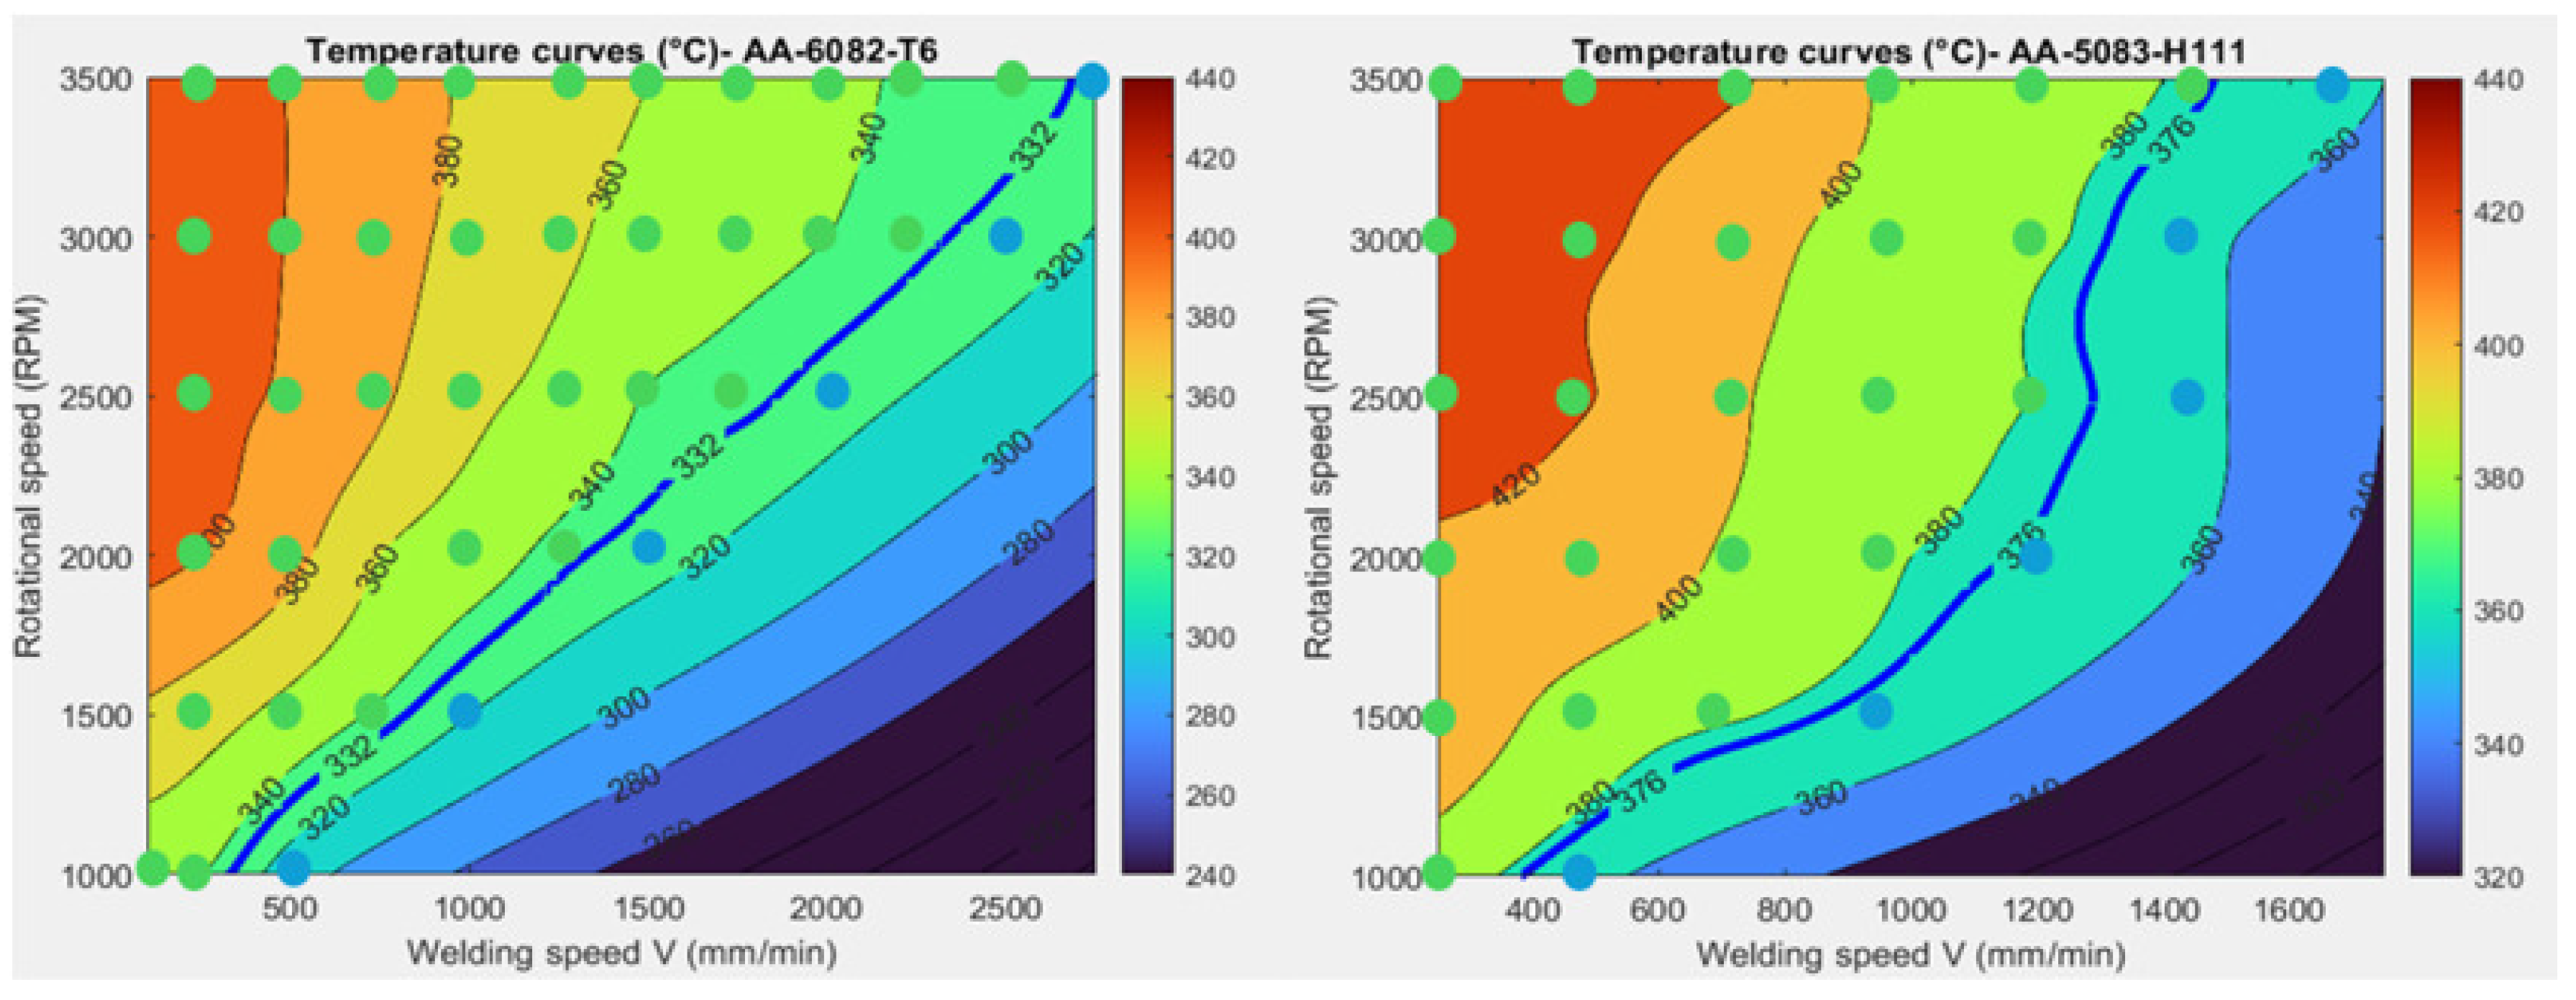
We gathered temperatures that were recorded at the cross-sectional cut sites, as well as the views of said sites, and computed them using MATLAB R2023-b. This resulted in isothermal curves within an advance (V) and rotation ( ω ) speed plane, as shown in Figure 10.
These curves illustrate that the maximum temperature never reaches the solidus temperature of the material. A boundary (represented by the blue curve, which was found based on the cross-sectional views) separates the region of “cold” welds (identified by the blue experimental dots, which are the cross-sections with blue contouring) from the region of “sound” welds (identified by the green experimental dots, which are the cross-sections with green contouring). Furthermore, these graphs display isothermal curves where the temperature remains constant along each curve. This enables the prediction of temperatures at different rotation and feed speeds for tests that have not been conducted.

5. Discussion

Based on temperature measurements and macrostructural analysis, our objective is to develop a methodology employing temperature data to optimize the welding process of an aluminum alloy. This involves correlating macrostructural features and temperatures with key process parameters (rotational and advancing speed, ω and V), resulting in the identification of a favorable weld zone distinguished by curves delimiting hot and cold weld areas. By establishing the constancy of temperature evolution along the limit curve, we may then associate this temperature with the solidus temperature. This methodology is then applied to another aluminum alloy to validate the obtained results.
The conditions of the experiences were the same (tool geometry, material dimensions, and welding parameters increments). The difference relied on material properties such as the strength between the two materials impacting the operating window’s width. For AA-5083 H111, with its higher strength levels at 317 MPa, more heat is required for welding. Consequently, increasing the advancing speed while stabilizing the rotational speed risks tool breakage due to insufficient heat generation, or the appearance of porosities at the bottom of the weld due to a lack of penetration of the tool, as shown in the cross-sectional views in Figure 8 and Figure 9. Hence, the maximum advancing speed is lower than that of AA-6082 T6, which has a lower strength of 260 MPa.
Based on the temperature, the isothermal curve that seperates the “good weld” and the “cold weld” areas for the AA-6082 T6 is 332 °C, which is 0.6Tsolidus, and for the AA-5083 H111, it is 376 °C, which is 0.64Tsolidus.
Our findings demonstrate the generalizability of this approach by comparing experimental tests with the existing literature. Notably, our identified welding zone maintains a minimum temperature of 0.65Tsolidus, aligning with established practices outlined in the experimental approach.
Implementing a method to optimize the welding process and ensure high-quality outcomes is imperative for the efficient production of components with varying geometric complexities. Furthermore, this approach offers additional benefits, including a 20% reduction in costs compared to conventional methods. This cost reduction may be attributed to several factors, including the drilling of the tool for inserting the TC, as well as the reduced operations required for temperature measurement (such as preparing the workpieces or implementing a specific support for the temperature measuring system), resulting in improved energy efficiency and a decrease in processing time. Notably, relying on temperature measurements streamlines the process, making it faster and more efficient compared to traditional macrostructural assessments for weld qualification.

6. Conclusions

In this study, we presented an experimental methodology to identify optimal FSW parameters for AA-6082 T6 and AA-5083 H111 based on temperature measurement. Two analyses were carried out: the first tackled the quality of the weld, and the second examined the temperature obtained by the integrated system.
We demonstrated that the “good weld” zone is separated from the “cold weld” zone by an isothermal cold boundary curve equivalent to 0.65Tsolidus. This cold boundary is defined when the ideal temperature, and consequently the appropriate heat input for the process, is not achieved.
The results offer hope for optimizing Friction Stir Welding (FSW) through temperature management. This involves adjusting the rotational and advancing speed to match the desired temperature target. Furthermore, it suggests a straightforward method for identifying effective combinations of operating parameters to prevent faulty joints.
Future research should prioritize the validation of the quantitative temperature findings with qualitative experimental observations while taking the material flow behavior into consideration.

Author Contributions

Conceptualization, M.A., G.R., O.K. and L.D.; methodology, L.D.; validation, G.R., O.K. and L.D.; formal analysis, M.A., G.R., O.K. and L.D.; investigation, M.A.; resources, L.D.; data curation, M.A.; writing—original draft preparation, M.A.; writing—review and editing, M.A. and O.K.; visualization, G.R., O.K. and L.D.; supervision, G.R., O.K. and L.D.; project administration, G.R., O.K. and L.D.; and funding acquisition, L.D. All authors have read and agreed to the published version of the manuscript.

Funding

This research was funded by STIRWELD.

Data Availability Statement

Dataset available on request from the authors.

Conflicts of Interest

The authors declare no conflicts of interest.

References

  1. Thomas, W.M.; Nicholas, E.D.; Needham, J.C.; Murch, M.G.; Temple-Smith, P.; Dawes, C.J. Friction Welding. US5460317A, 24 October 1995. [Google Scholar]
  2. Mishra, R.S. Friction Stir Welding of High Strength 7XXX Aluminum Alloys; Butterworth-Heinemann: Oxford, UK, 2016. [Google Scholar]
  3. Ericsson, M.; Sandström, R. Influence of welding speed on the fatigue of friction stir welds, and comparison with MIG and TIG. Int. J. Fatigue 2003, 25, 1379–1387. [Google Scholar] [CrossRef]
  4. Yan, Z.; Liu, X.; Fang, H. Mechanical properties of friction stir welding and metal inert gas welding of Al-Zn aluminum alloy joints. Int. J. Adv. Manuf. Technol. 2017, 91, 3025–3031. [Google Scholar] [CrossRef]
  5. Paik, J.K. Mechanical properties of friction stir welded aluminum alloys 5083 and 5383. Int. J. Nav. Archit. Ocean Eng. 2009, 1, 39–49. [Google Scholar] [CrossRef]
  6. Leitão, C.; Louro, R.; Rodrigues, D.M. Analysis of high temperature plastic behaviour and its relation with weldability in friction stir welding for aluminium alloys AA5083-H111 and AA6082-T6. Mater. Des. 2012, 37, 402–409. [Google Scholar] [CrossRef]
  7. Song, M.; Kovacevic, R. Thermal modeling of friction stir welding in a moving coordinate system and its validation. Int. J. Mach. Tools Manuf. 2003, 43, 605–615. [Google Scholar] [CrossRef]
  8. Ambrosio, D. A semi-empirical model for peak temperature estimation in friction stir welding of aluminium alloys. Sci. Technol. Weld. Join. 2022, 527, 491–500. [Google Scholar] [CrossRef]
  9. Sadeghi, B.; Sadeghian, B.; Taherizadeh, A.; Laska, A.; Cavaliere, P.; Gopinathan, A. Effect of Porosity on the Thermo-Mechanical Behavior of Friction-Stir-Welded Spark-Plasma-Sintered Aluminum Matrix Composites with Bimodal Micro- and Nano-Sized Reinforcing Al2O3 Particles. Metals 2022, 12, 1660. [Google Scholar] [CrossRef]
  10. El-Moayed, M.H.; Shash, A.Y.; Rabou, M.A.; El-Sherbiny, M.G. Thermal-induced Residual Stresses and Distortions in Friction Stir Welds—A Literature Review. J. Weld. Join. 2021, 39, 409–418. [Google Scholar] [CrossRef]
  11. Boldsaikhan, E.; Corwin, E.; Logar, A.; McGough, J.; Arbegast, W. Detecting Wormholes in Friction Stir Welds from Welding Feedback Data. 42nd Midwest Instr. Comput. Symp. 2009. Available online: https://api.semanticscholar.org/CorpusID:201826216 (accessed on 1 April 2024).
  12. Wang, W.; Meng, X.; Dong, W.; Xie, Y.; Ma, X.; Mao, D.; Zhang, Z.; Huang, Y. In-Situ rolling friction stir welding of aluminum alloys towards corrosion resistance. Corros. Sci. 2024, 230, 111920. [Google Scholar] [CrossRef]
  13. ISO 25239; Friction stir welding — Aluminium. International Organization for Standardization: 2020.
  14. Albannai, A.I. Review The Common Defects In Friction Stir Welding. Int. J. Sci. Technol. Res. 2020, 19, 318–329. [Google Scholar]
  15. Pratap, V.; Kumar, S.; Ranjan, A.; Kuriachen, B. Recent research progress in solid state friction-stir welding of aluminium—Magnesium alloys: A critical review. Integr. Med. Res. 2020, 9, 6217–6256. [Google Scholar]
  16. Mehta, K.P.; Badheka, V.J. A Review on Dissimilar Friction Stir Welding of Copper to Aluminum: Process, Properties, and Variants A Review on Dissimilar Friction Stir Welding of Copper to Aluminum: Process, Properties, and Variants. LMMP 2016, 31, 233–254. [Google Scholar] [CrossRef]
  17. Adriana, M.; Obregon, T. Effect of Process Parameters on Temperature Distribution, Microstructure, and Mechanical Properties of Self-Reacting Friction Stir Welded Aluminum Alloy 6061-T651; ETD Collection for University of Texas, El Paso, AAI1498322; University of Texas at El Paso: El Paso, TX, USA, 2011. [Google Scholar]
  18. Xue, P.; Ni, D.R.; Wang, D.; Xiao, B.L.; Ma, Z.Y. Effect of friction stir welding parameters on the microstructure and mechanical properties of the dissimilar Al–Cu joints. Int. J. Mater. Sci. Eng. 2011, 528, 4683–4689. [Google Scholar] [CrossRef]
  19. Golezani, A.S.; Barenji, R.; Heidarzadeh, A.; Pouraliakbar, H. Elucidating of tool rotational speed in friction stir welding of 7020-T6 aluminum alloy. Int. J. Adv. Manuf. Technol. 2015, 81, 1155–1164. [Google Scholar] [CrossRef]
  20. Shojaeefard, M.; Khalkhali, A.; Akbari, M.; Tahani, M. Application of Taguchi optimization technique in determining aluminum to brass friction stir welding parameters. Mater. Des. 2013, 52, 587–592. [Google Scholar] [CrossRef]
  21. Ambrosio, D. Influence of welding parameters on the microstructure, thermal fields and defect formation in AA7075-T6 friction stir welds. Weld. World 2020, 64, 773–784. [Google Scholar] [CrossRef]
  22. Tabasi, M.; Farahani, M.; Givi, M.K.B.; Farzami, M.; Moharami, A. Dissimilar friction stir welding of 7075 aluminum alloy to AZ31 magnesium alloy using SiC nanoparticles. Int. J. Adv. Manuf. Technol. 2016, 86, 705–715. [Google Scholar] [CrossRef]
  23. Akinlabi, E.T.; Els-botes, A.; Mcgrath, P.J. Effect of Travel speed on Joint properties of Dissimilar Metal Friction Stir Welds. In Proceedings of the Second International Conference on Advances in Engineering and Technology, Phuket, Thailand, 4–5 June 2016. [Google Scholar]
  24. Sato, Y.; Urata, M.; Kokawa, H. Parameters Controlling Microstructure and Hardness during Friction-Stir Welding of Precipitation-Hardenable Aluminum Alloy 6063. Metall. Mater. Trans. A 2002, 33, 625–635. [Google Scholar] [CrossRef]
  25. Lambiase, F.; Paoletti, A.; Ilio, A.D. Forces and temperature variation during friction stir welding of aluminum alloy AA6082-T6. Int. J. Adv. Manuf. Technol. 2018, 99, 337–346. [Google Scholar] [CrossRef]
  26. Verma, S. Effect of process parameters on temperature and force distribution during friction stir welding of armor- marine grade aluminum alloy. J. Eng. Manuf. 2021, 235, 144–154. [Google Scholar] [CrossRef]
  27. Silva, A.C.F.; Backer, J.D.; Bolmsjö, G. Temperature measurements during friction stir welding. Int. J. Adv. Manuf. Technol. 2017, 88, 2899–2908. [Google Scholar] [CrossRef]
  28. Silva-magalhães, A.; Backer, J.D.; Martin, J.; Bolmsjö, G. In-situ temperature measurement in friction stir welding of thick section aluminium alloys. J. Manuf. Process. 2019, 39, 12–17. [Google Scholar] [CrossRef]
  29. Cederqvist, L. Friction Stir Welding of Copper Canisters Using Power and Temperature Control. Ph.D. Thesis, LUND University, Lund, Sweden, 2011. [Google Scholar]
  30. Wright, A.; Munro, T.R.; Hovanski, Y. Evaluating Temperature Control in Friction Stir Welding for Industrial Applications. J. Manuf. Mater. Process. 2021, 5, 124. [Google Scholar] [CrossRef]
  31. Wu, T.; Zhao, F.; Luo, H.; Wang, H.; Li, Y. Temperature Monitoring and Material Flow Characteristics of Friction Stir Welded 2A14-t6 Aerospace Aluminum Alloy. Materials 2019, 12, 3387. [Google Scholar] [CrossRef] [PubMed]
  32. Sorger, G.; Sarikka, T.; Vilaça, P. Effect of processing temperatures on the properties of a high-strength steel welded by FSW. Weld. World 2018, 62, 1173–1185. [Google Scholar] [CrossRef]
  33. Fehrenbacher, A.; Duffie, N.A.; Ferrier, N.J.; Pfefferkorn, F.E.; Zinn, M.R. Effects of tool workpiece interface temperature on weld quality and quality improvements through temperature control in friction stir welding. Int. J. Adv. Manuf. Technol. 2014, 71, 165–179. [Google Scholar] [CrossRef]
  34. de Backer, J.; Bolmsjo, G. Thermoelectric method for temperature measurement in friction stir welding. Sci. Technol. Weld. Join. 2013, 18, 558–565. [Google Scholar] [CrossRef]
  35. Backer, J.D.; Bolmsjö, G.; Christiansson, A.K. Temperature control of robotic friction stir welding using the thermoelectric effect. Int. J. Adv. Manuf. Technol. 2014, 70, 605–615. [Google Scholar] [CrossRef]
  36. Hamilton, C.; Sommers, A.; Dymek, S. A thermal model of friction stir welding applied to Sc-modified Al-Zn-Mg-Cu alloy extrusions. Int. J. Mach. Tools Manuf. 2009, 49, 230–238. [Google Scholar] [CrossRef]
  37. Upadhyay, P.; Reynolds, A.P. Effects of thermal boundary conditions in friction stir welded AA7050-T7 sheets. Mater. Sci. Eng. A 2010, 527, 1537–1543. [Google Scholar] [CrossRef]
  38. Threadgill, P.L.; Leonard, A.J.; Shercliff, H.R.; Withers, P.J. Friction stir welding of aluminium alloys. Int. Mater. Rev. 2009, 54, 49–93. [Google Scholar] [CrossRef]
  39. Gratecap, F.; Racineux, G.; Marya, S. A simple methodology to define conical tool geometry and welding parameters in friction stir welding. Int. J. Mater. Form. 2008, 1, 143–158. [Google Scholar] [CrossRef]
  40. Chao, W.T.Y.J.; Qi, X. Heat Transfer in Friction Stir Welding—Experimental and Numerical Studies. Int. J. Manuf. Sci. Eng. 2003, 125, 138–145. [Google Scholar] [CrossRef]
  41. Murr, L.E.; Liu, G.; McClure, J.C. A TEM study of precipitation and related microstructures in friction-stir-welded 6061 aluminium. Int. J. Mat. Sci. 1998, 3, 1243–1251. [Google Scholar] [CrossRef]
  42. Mahoney, M.W.; Rhodes, C.G.; Flintoff, J.G.; Spurling, R.A.; Bingel, W.H. Properties of Friction-Stir-Welded 7075 T651 Aluminum. Metall. Mater. Trans. A 1998, 29, 1955–1964. [Google Scholar] [CrossRef]
  43. Tang, W. Heat Input and Temperature Distribution in Friction Stir Welding. J. Manuf. Mater. Process. 1998, 7, 163–172. [Google Scholar] [CrossRef]
  44. Rhodes, C.G.; Mahoney, M.W.; Bingel, W.H.; Spurling, R.A.; Bampton, C. Effects of Friction Stir Welding on Microstructure of 7075 Aluminum. Scr. Mater. 1997, 36, 69–75. [Google Scholar] [CrossRef]
  45. Mishra, R.S.; Ma, Z.Y. Friction stir welding and processing. Mater. Sci. Eng. R Rep. 2005, 50, 1–78. [Google Scholar] [CrossRef]
  46. Gratecap, F.; Racineux, G.; Poitou, A. Choix et optimisation de l’outil et des paramètres de soudage en FSW. In Proceedings of the CFM 2007—18ème Congrès Français de Mécanique, Grenoble, France, 27–31 August 2007. [Google Scholar]
  47. Okamura, H. Visualization of material flow in an autogenous friction stir weld. J. Jpn. Weld. Soc. 2000, 69, 565–571. [Google Scholar] [CrossRef]
Figure 1. Schematic of the FSW proccess, with ω as rotational speed and V as welding speed.
Jmmp 08 00137 g001
Figure 2. Porosity defects: (i) hot welds; (ii) cold welds, WP1 workpiece 1, and WP2 workpiece 2.
Jmmp 08 00137 g002
Figure 3. Representative scheme of FSW operating window zones, and temperature evolution according to ω and V.
Jmmp 08 00137 g003
Figure 4. Experimental temperature measurement methods during FSW: (i) infrared camera, (ii) TWT, (iii) thermocouples embedded in the workpiece, and (iv) thermocouples embedded in the tool.
Jmmp 08 00137 g004
Figure 5. Cross-section view of the tool and thermocouple assembly.
Jmmp 08 00137 g005
Figure 6. Representative scheme of the experimental approach to choose FSW process parameters.
Jmmp 08 00137 g006
Figure 7. FSW workpiece scheme showing the welding line, the cross-section location, and macrographic view of AA-6082-T6 for V = 500 mm/min; ω = 2000 RPM with the temperature curve obtained over time by the temperature measurement system.
Jmmp 08 00137 g007
Figure 8. Macro-graphic views of AA-6082 T6 cross-sections.
Jmmp 08 00137 g008
Figure 9. Macro-graphic views of AA-5083 H111 cross-sections.
Jmmp 08 00137 g009
Figure 10. Isothermal curves of AA-6082 T6 and AA-5083 H111. The green and blue dots correspond to the temperature at 200 mm of the weld line shown in Figure 7.
Jmmp 08 00137 g010
Table 2. FSW parameters. The notation of the speed interval stands for lowest speed: increment: highest speed.
Material AAAdvancing Speed (mm/min)Rotational Speed (RPM)
6082-T6100:250:27501000:500:3500
5083-H111250:250:17501000:500:3500
Disclaimer/Publisher’s Note: The statements, opinions and data contained in all publications are solely those of the individual author(s) and contributor(s) and not of MDPI and/or the editor(s). MDPI and/or the editor(s) disclaim responsibility for any injury to people or property resulting from any ideas, methods, instructions or products referred to in the content.