

Fabrication of Bimetallic High-Strength Low-Alloy Steel/Si-Bronze Functionally Graded Materials Using Wire Arc Additive Manufacturing

 , ,
, ,
Abstract
1. Introduction
2. Materials and Methods
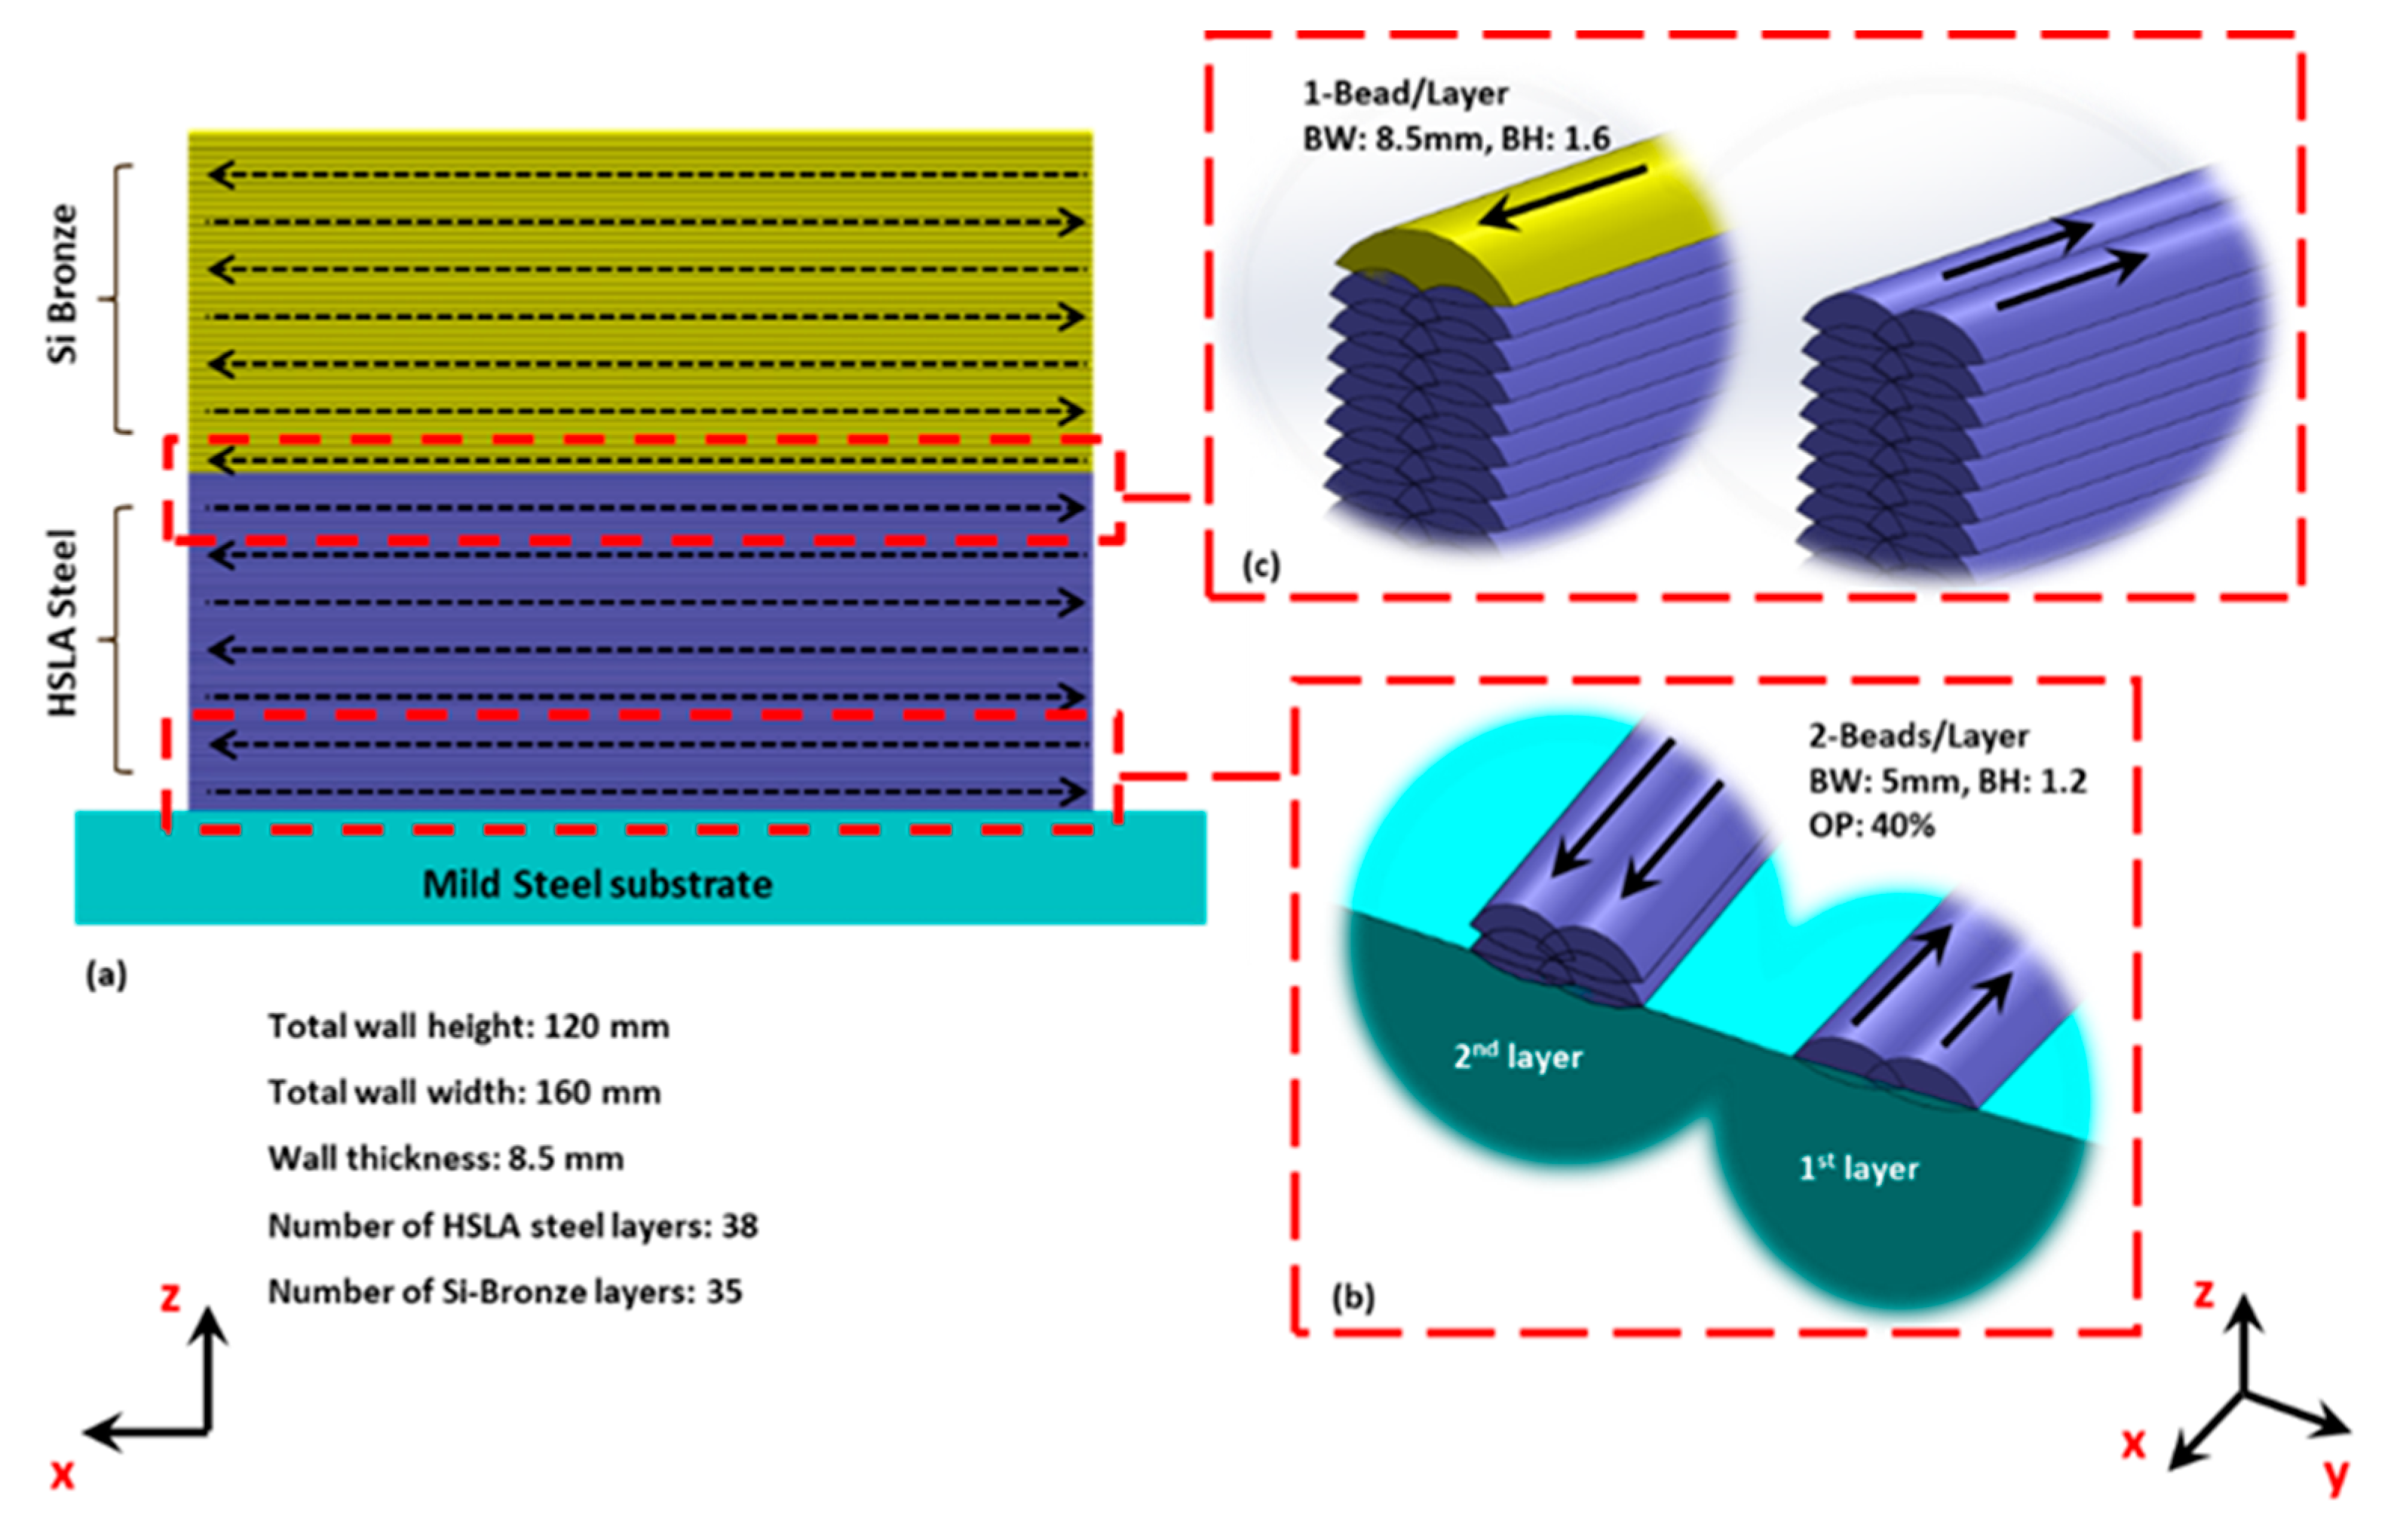
Material Used and Building Strategy
3. Characterization and Testing Techniques
3.1. Microstructural Evolution
3.2. Mechanical Properties Characterization
4. Results and Discussion
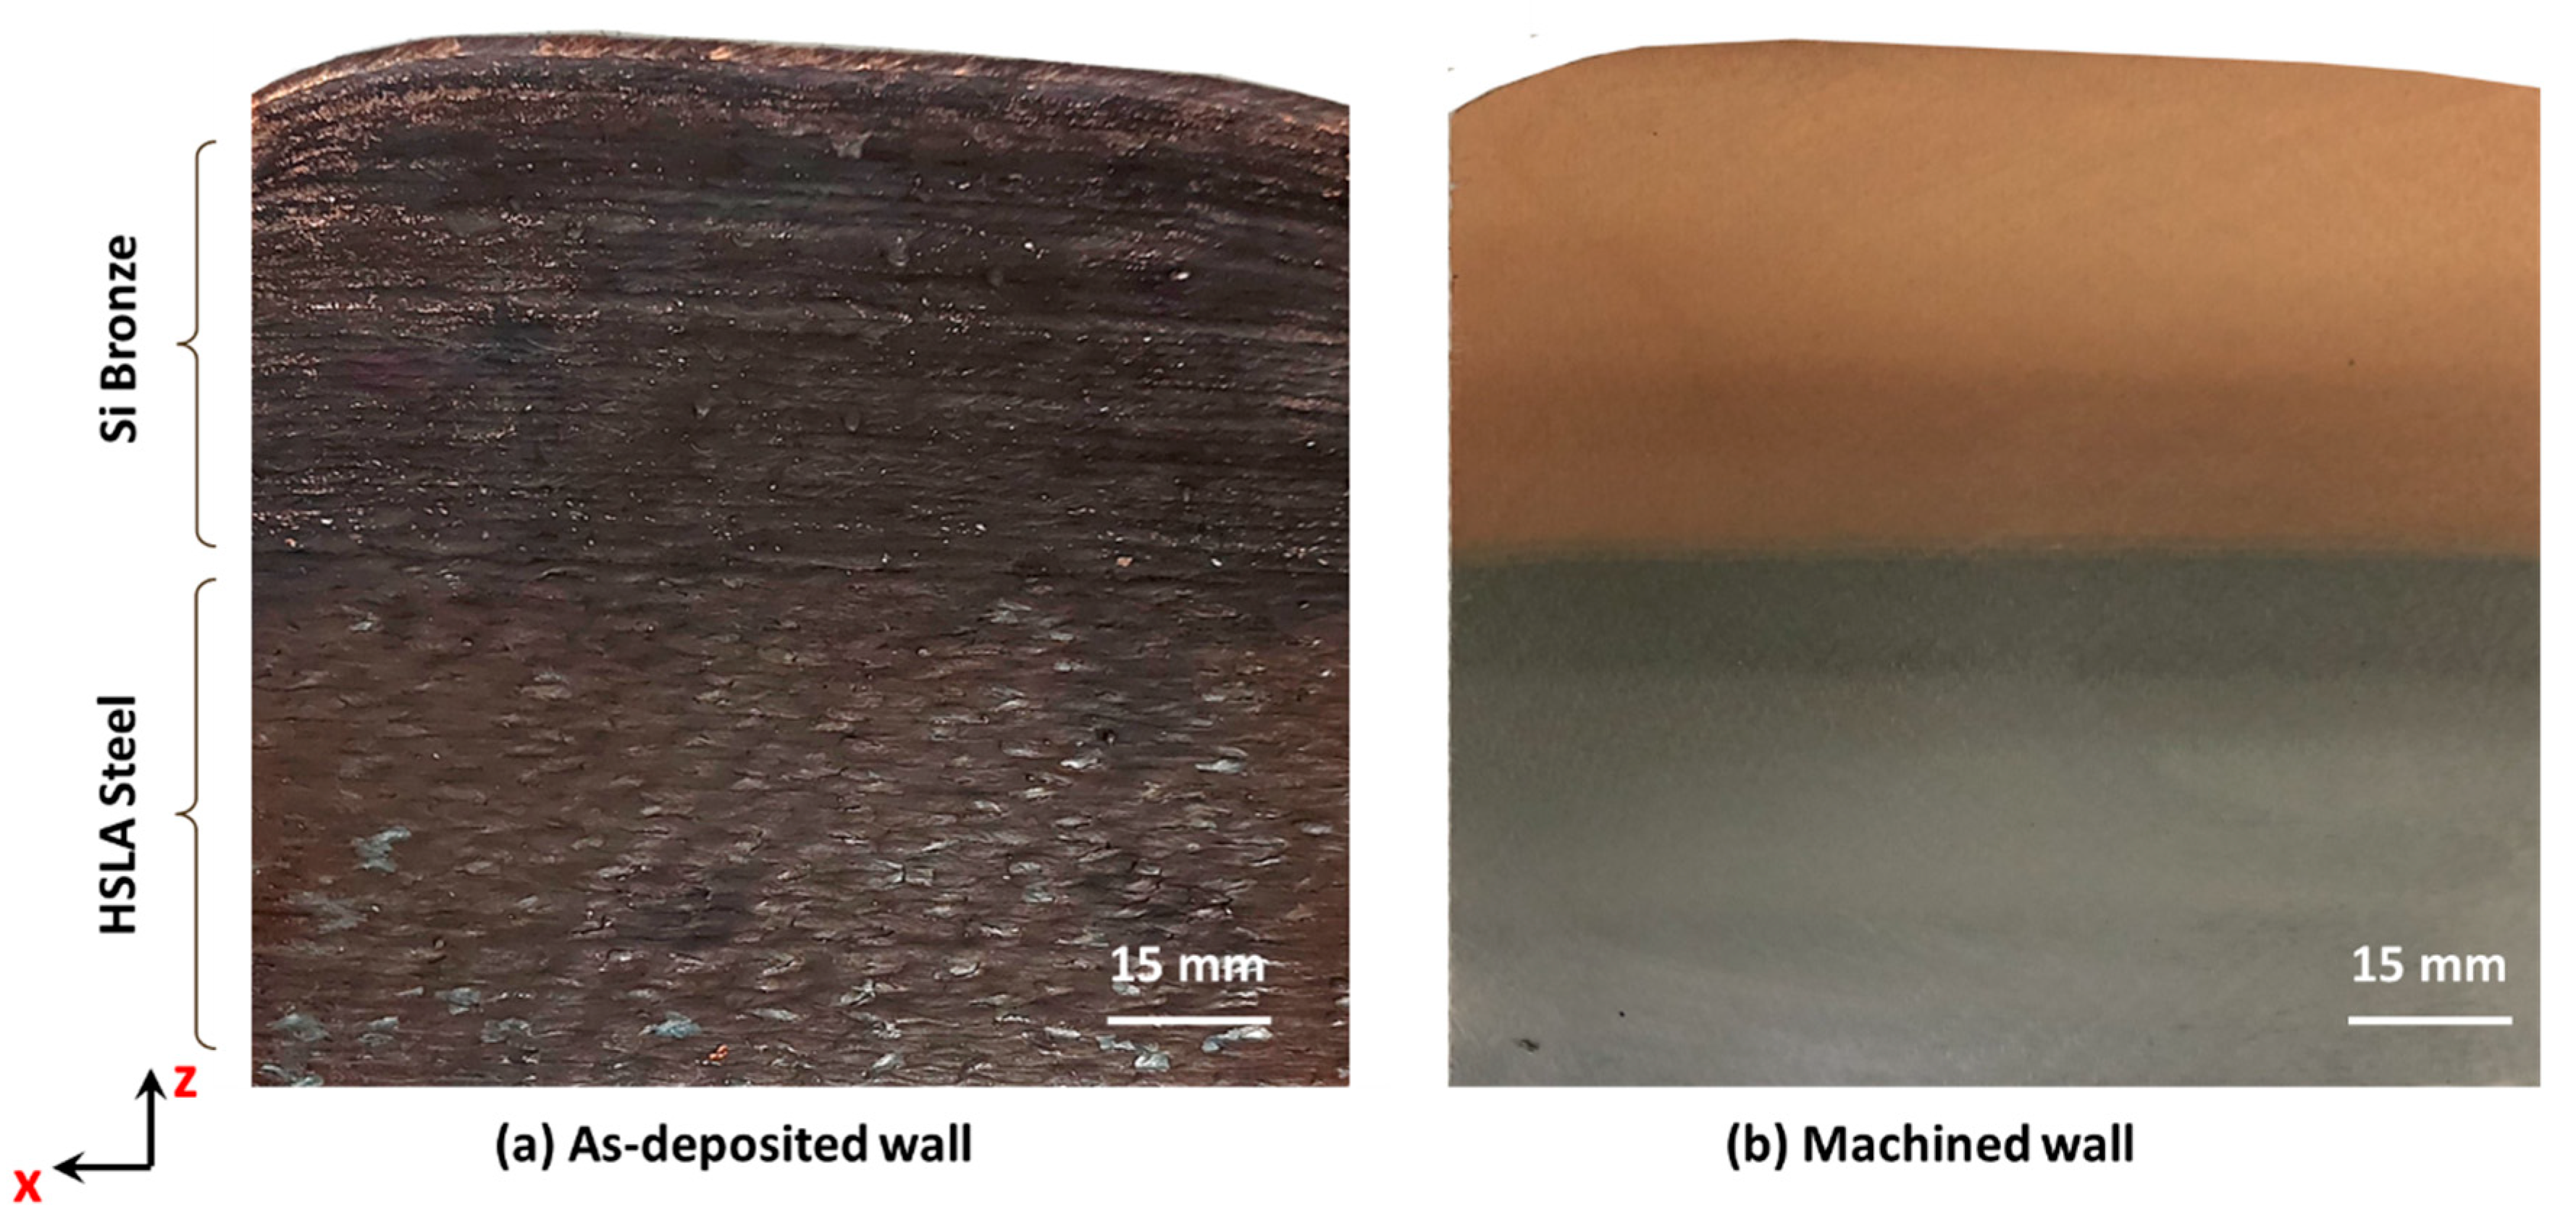
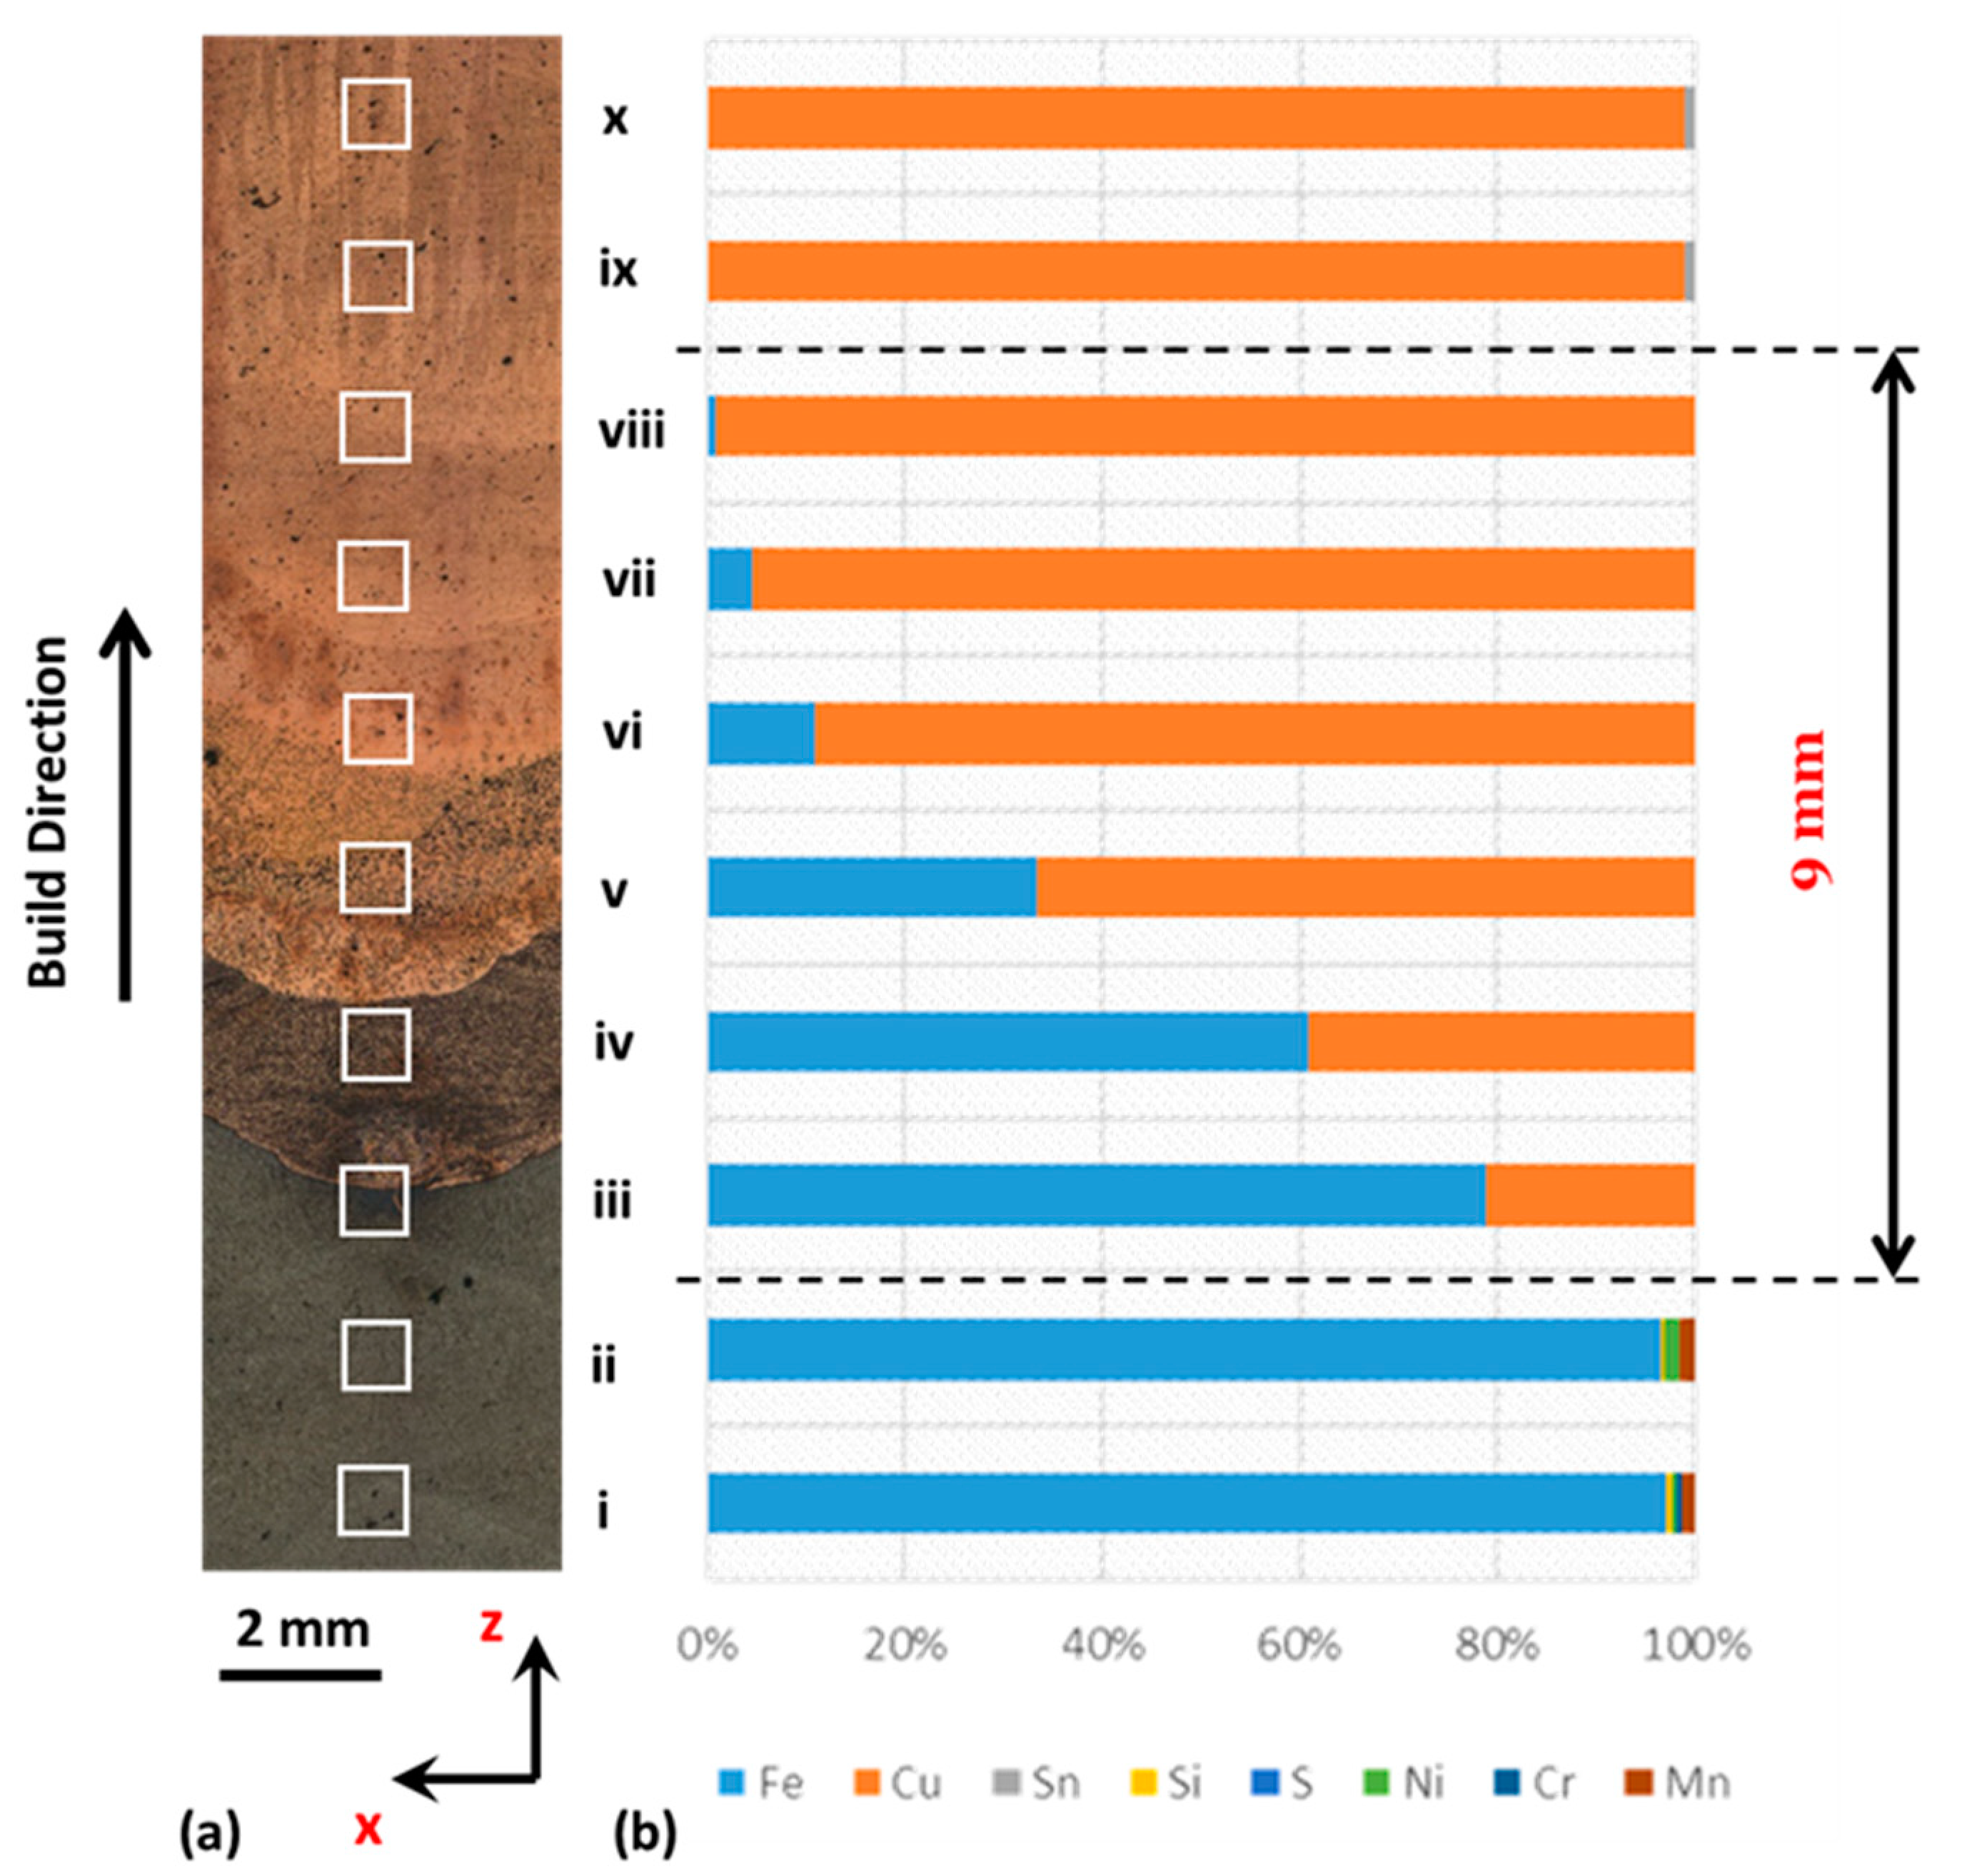
4.1. Macroscopic Characterization
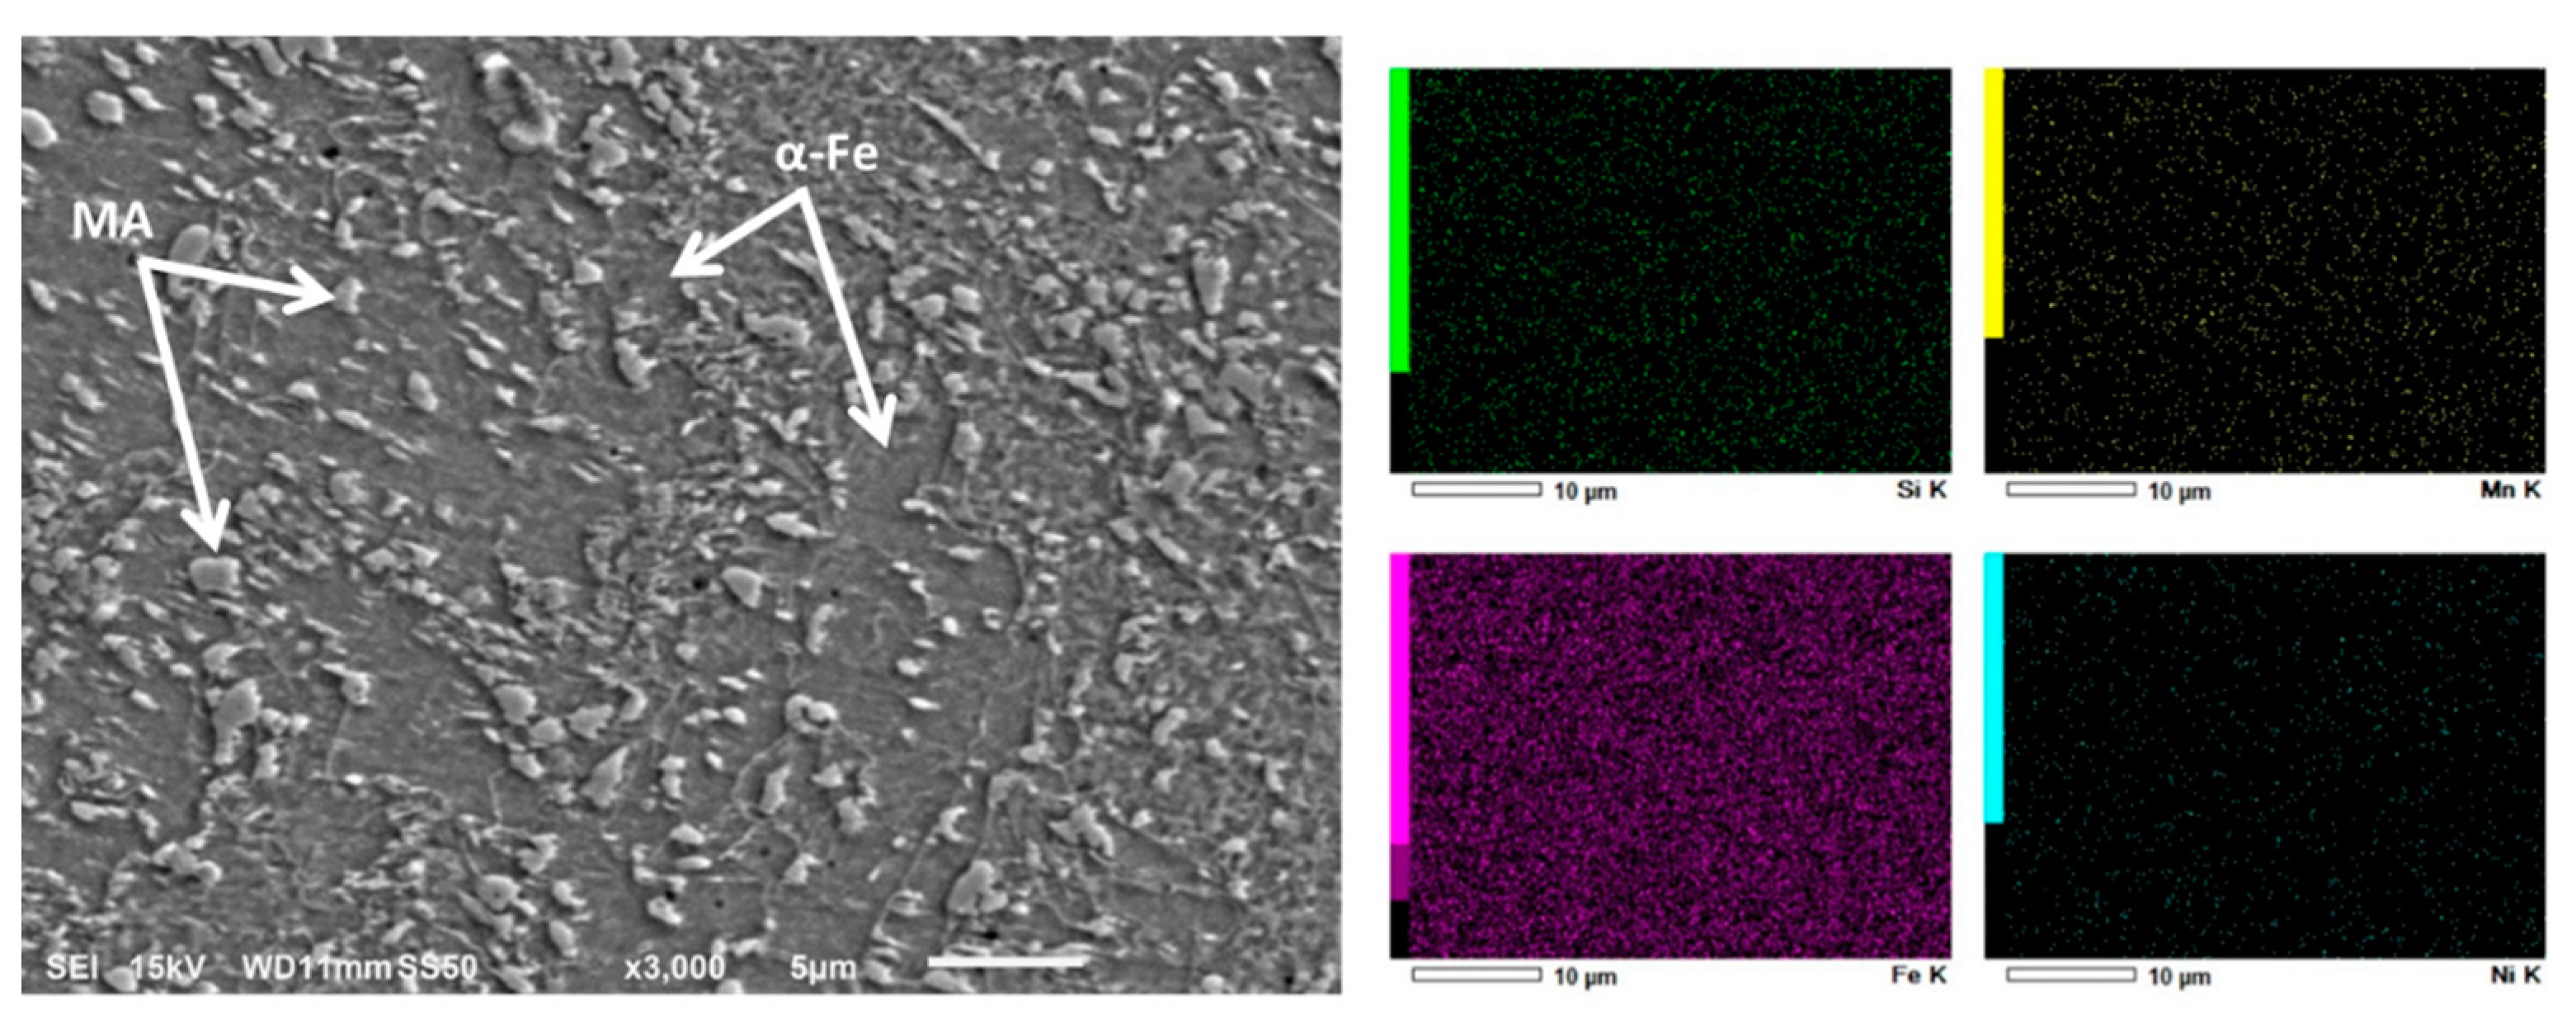
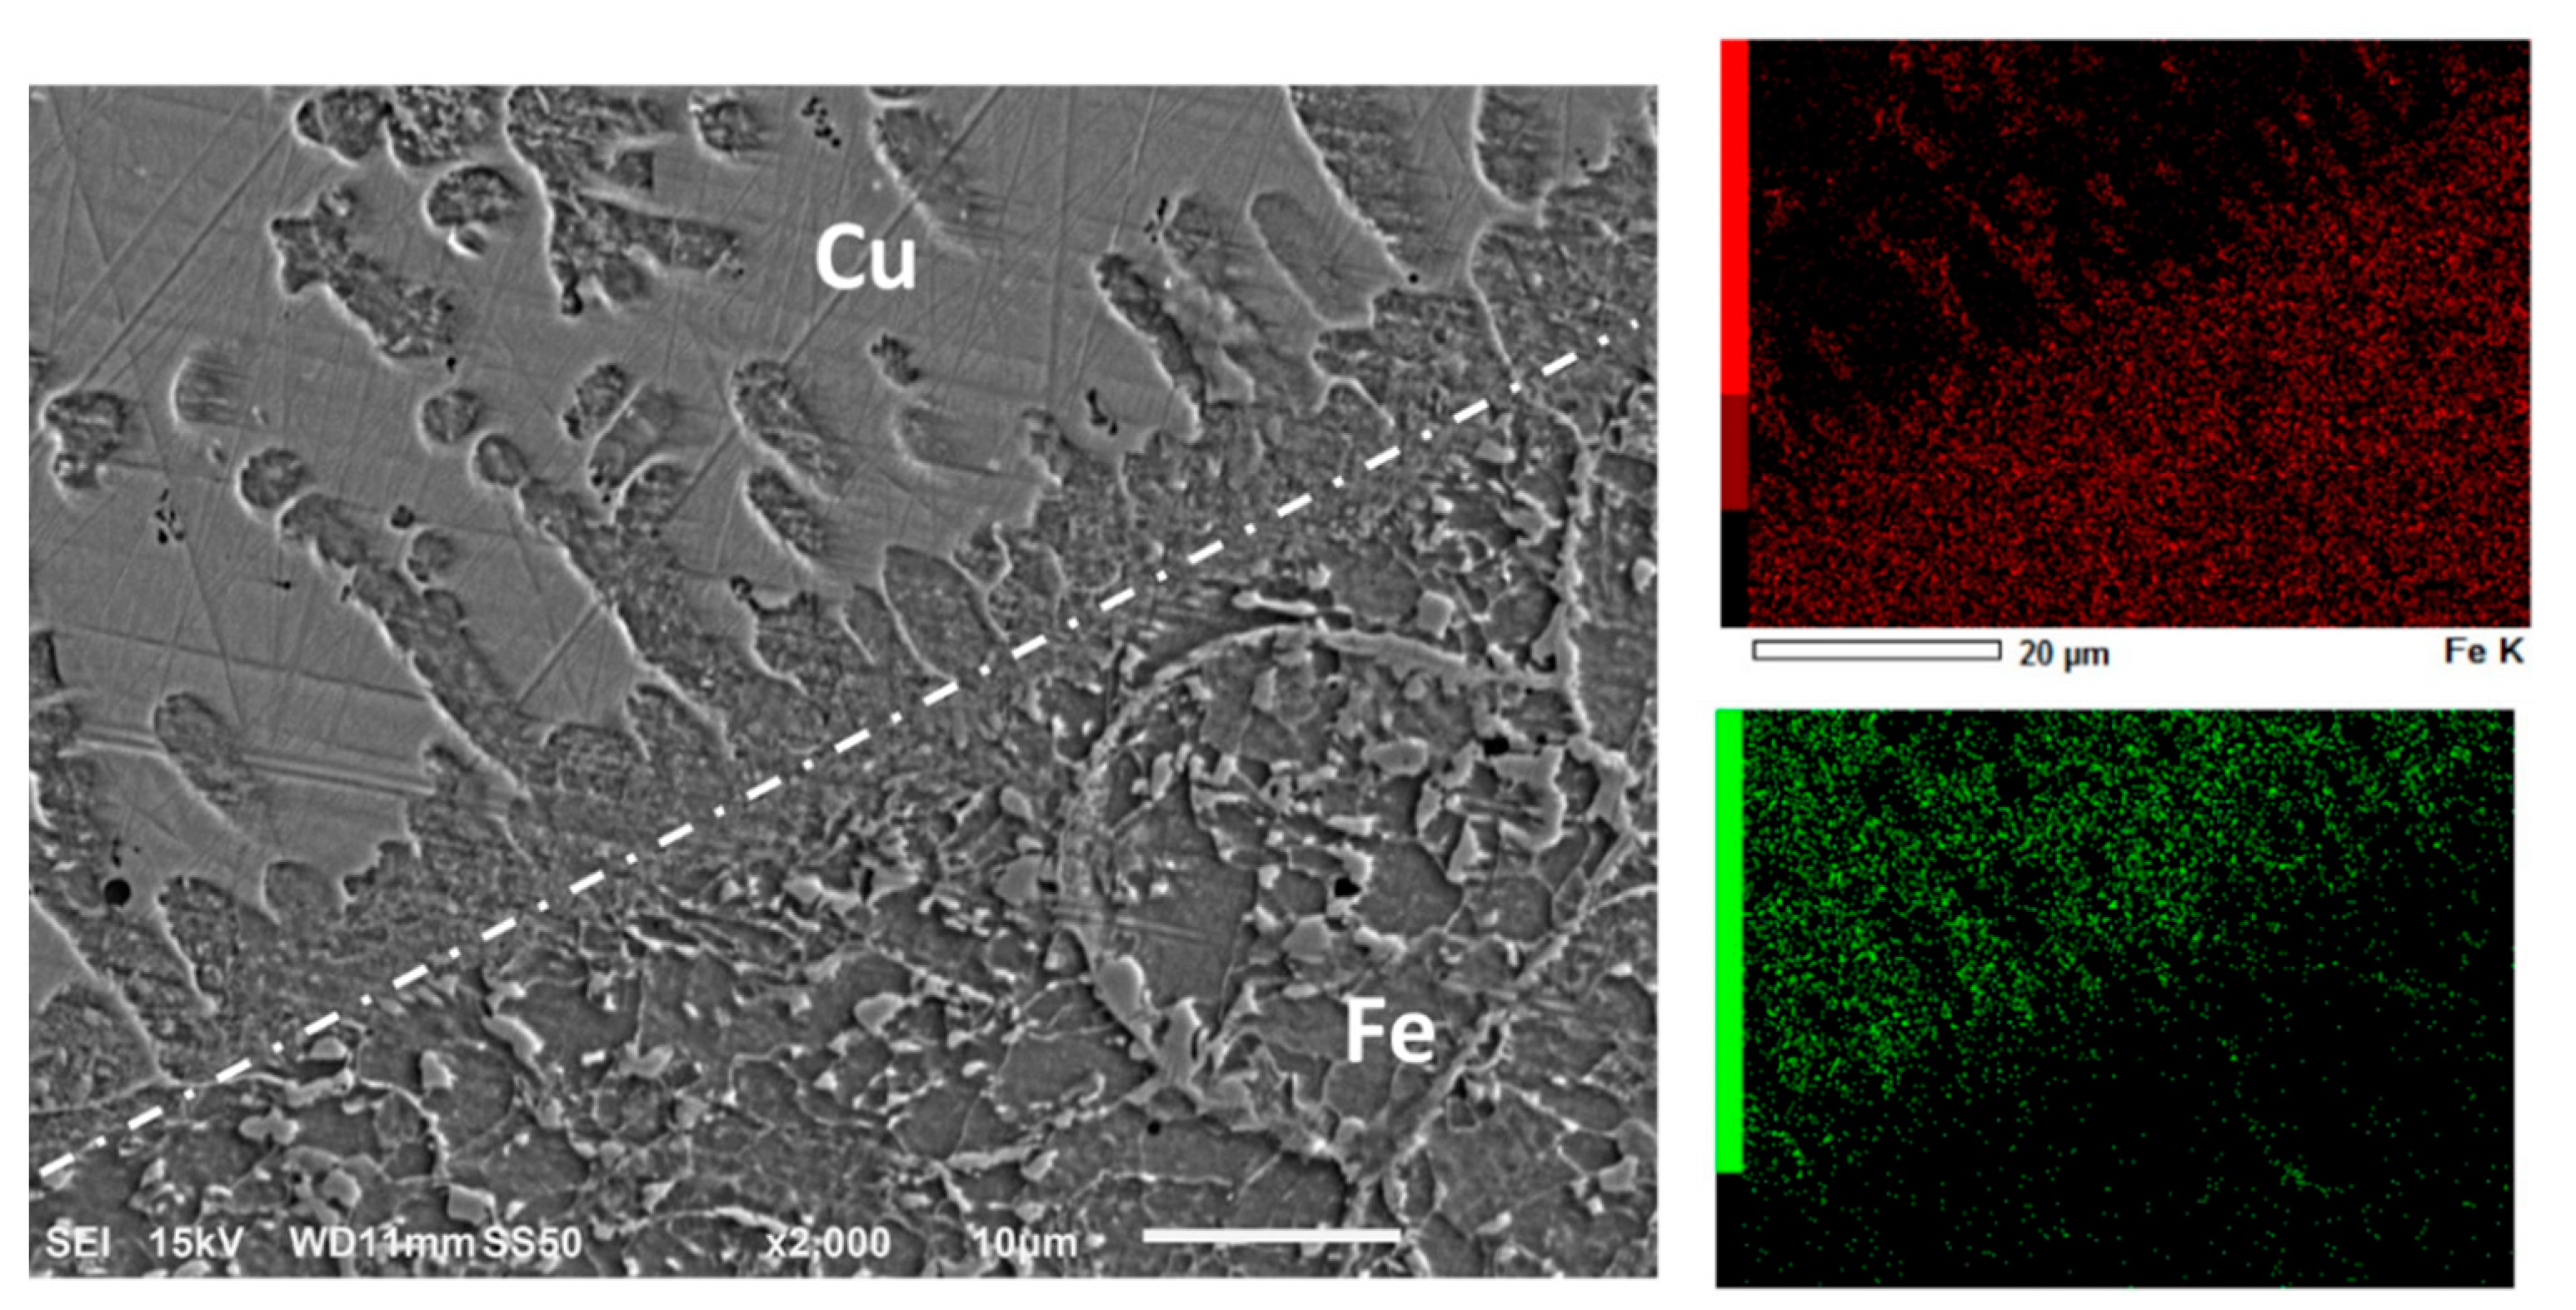
4.2. Microstructure Evolution
4.3. XRD
4.4. Hardness Measurements
4.5. Uniaxial Tensile Test
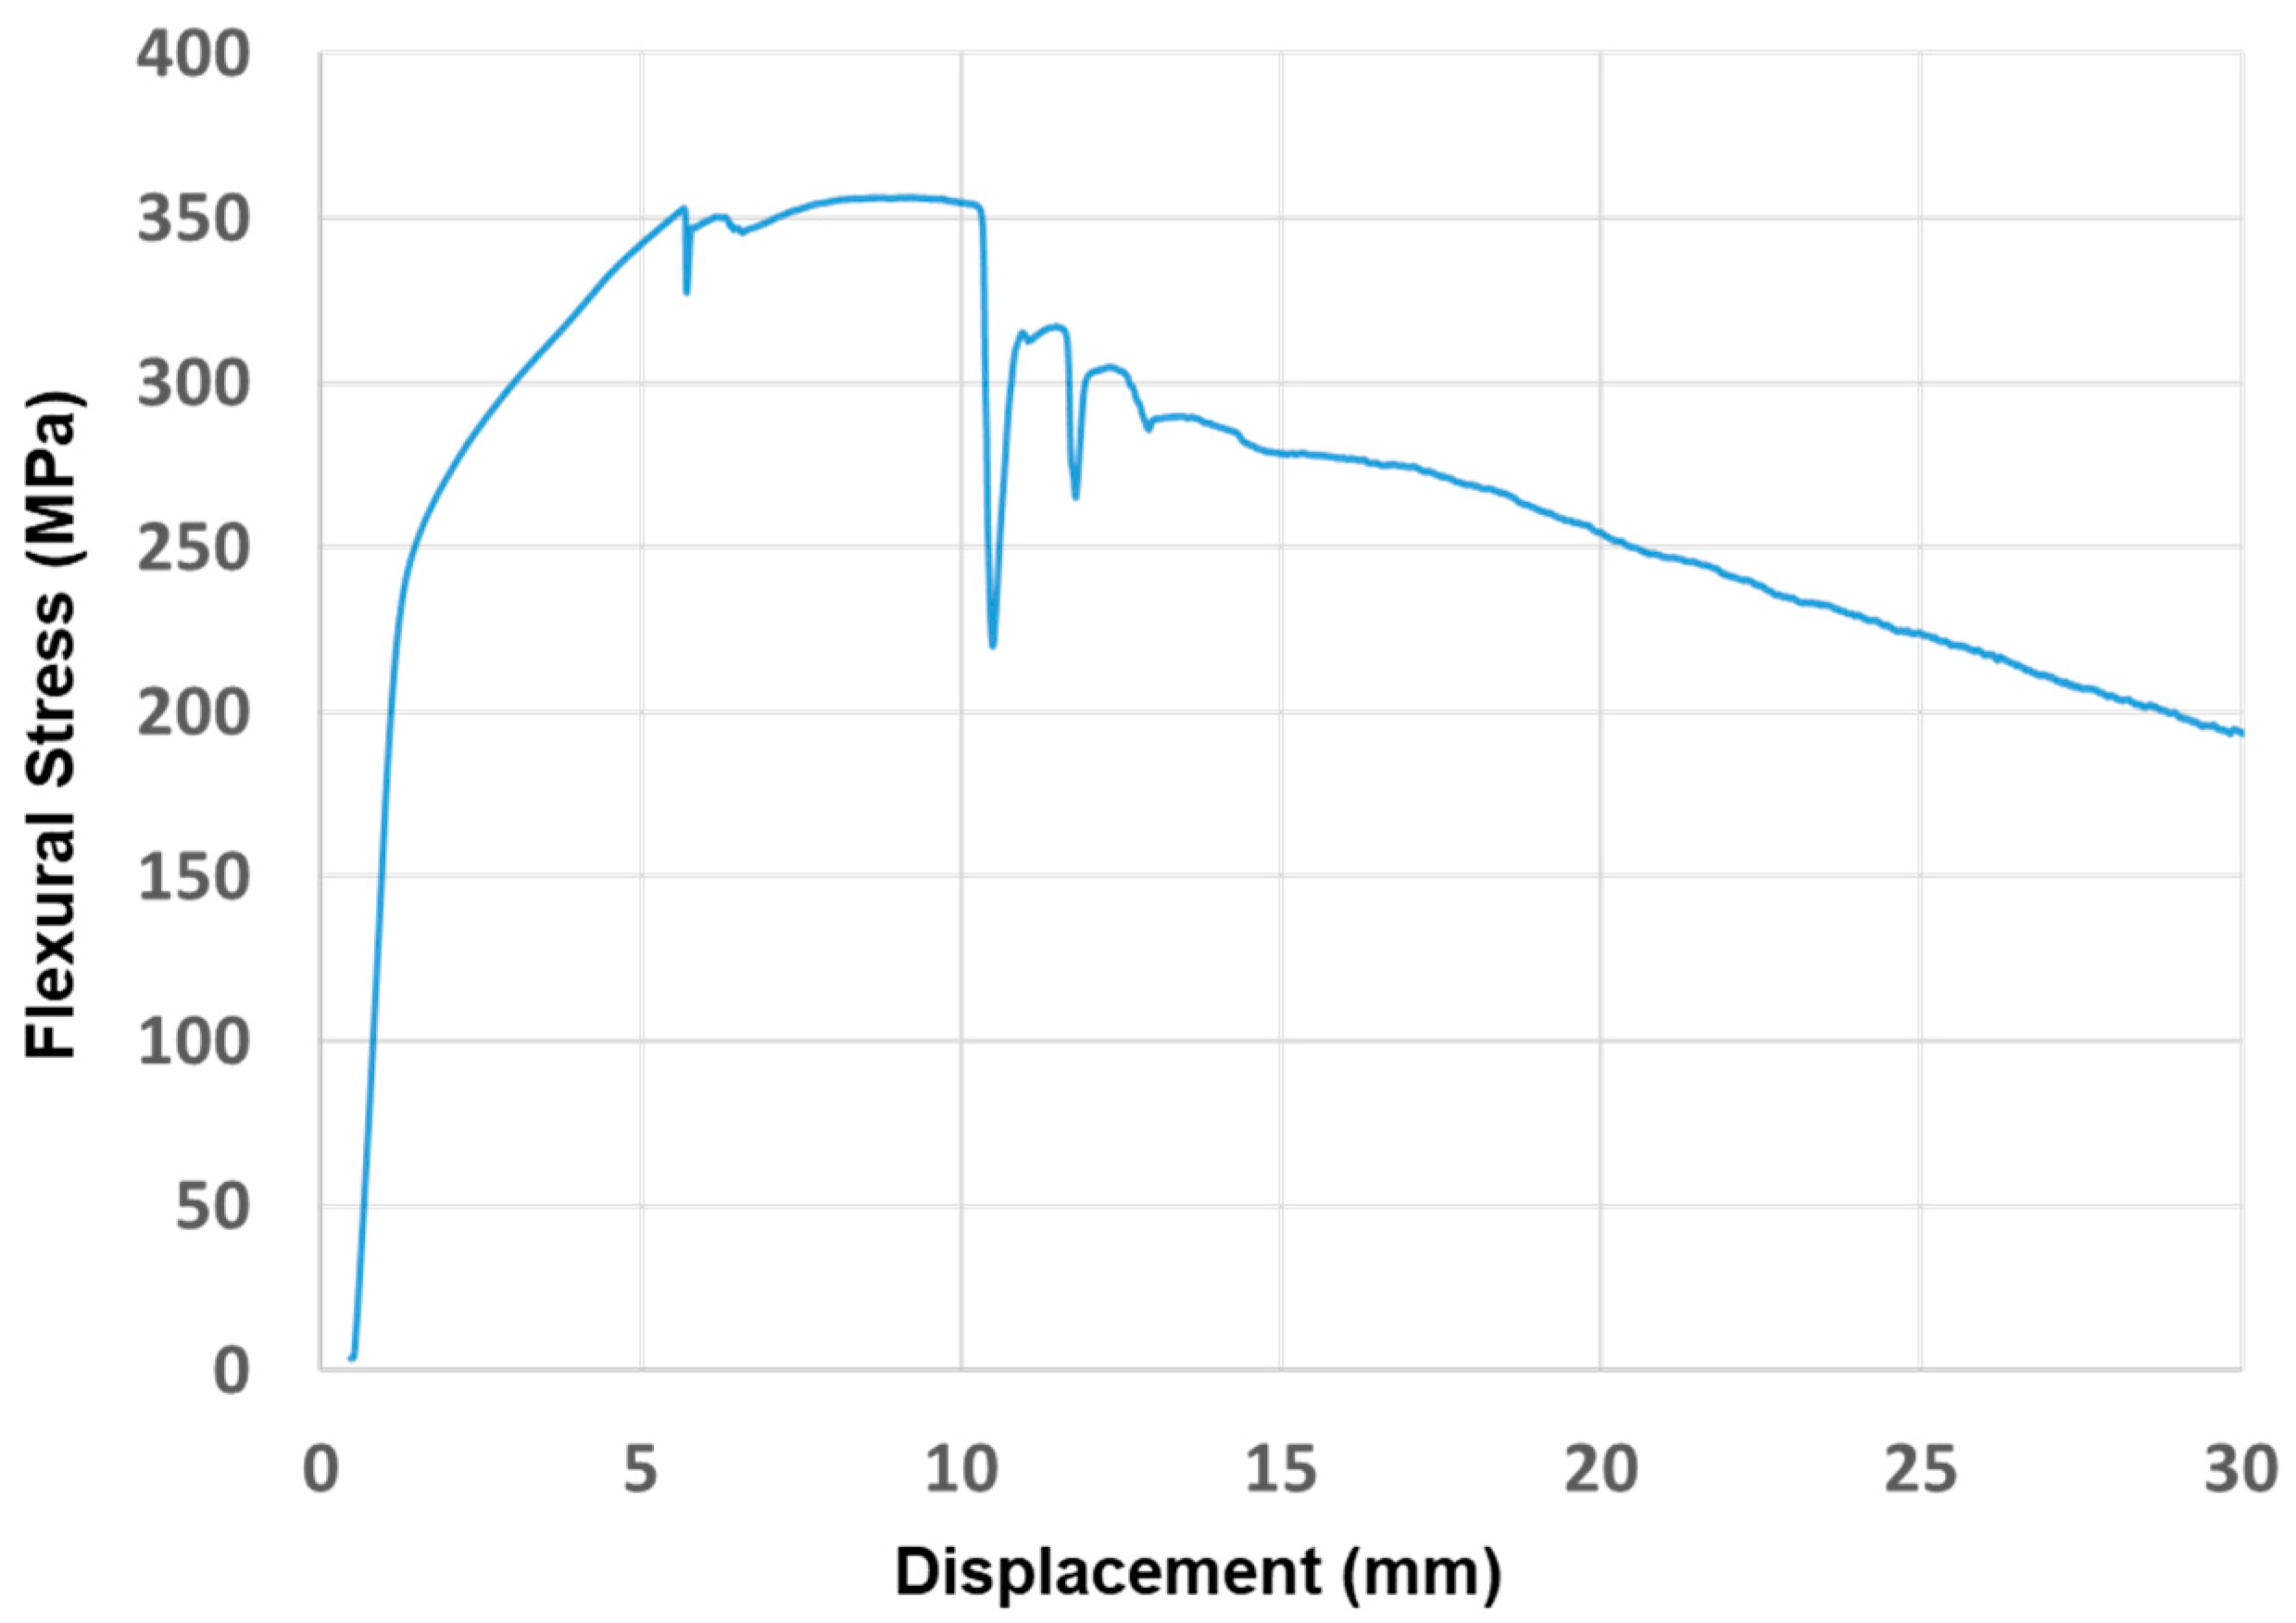
4.6. Three-Point Bending Test
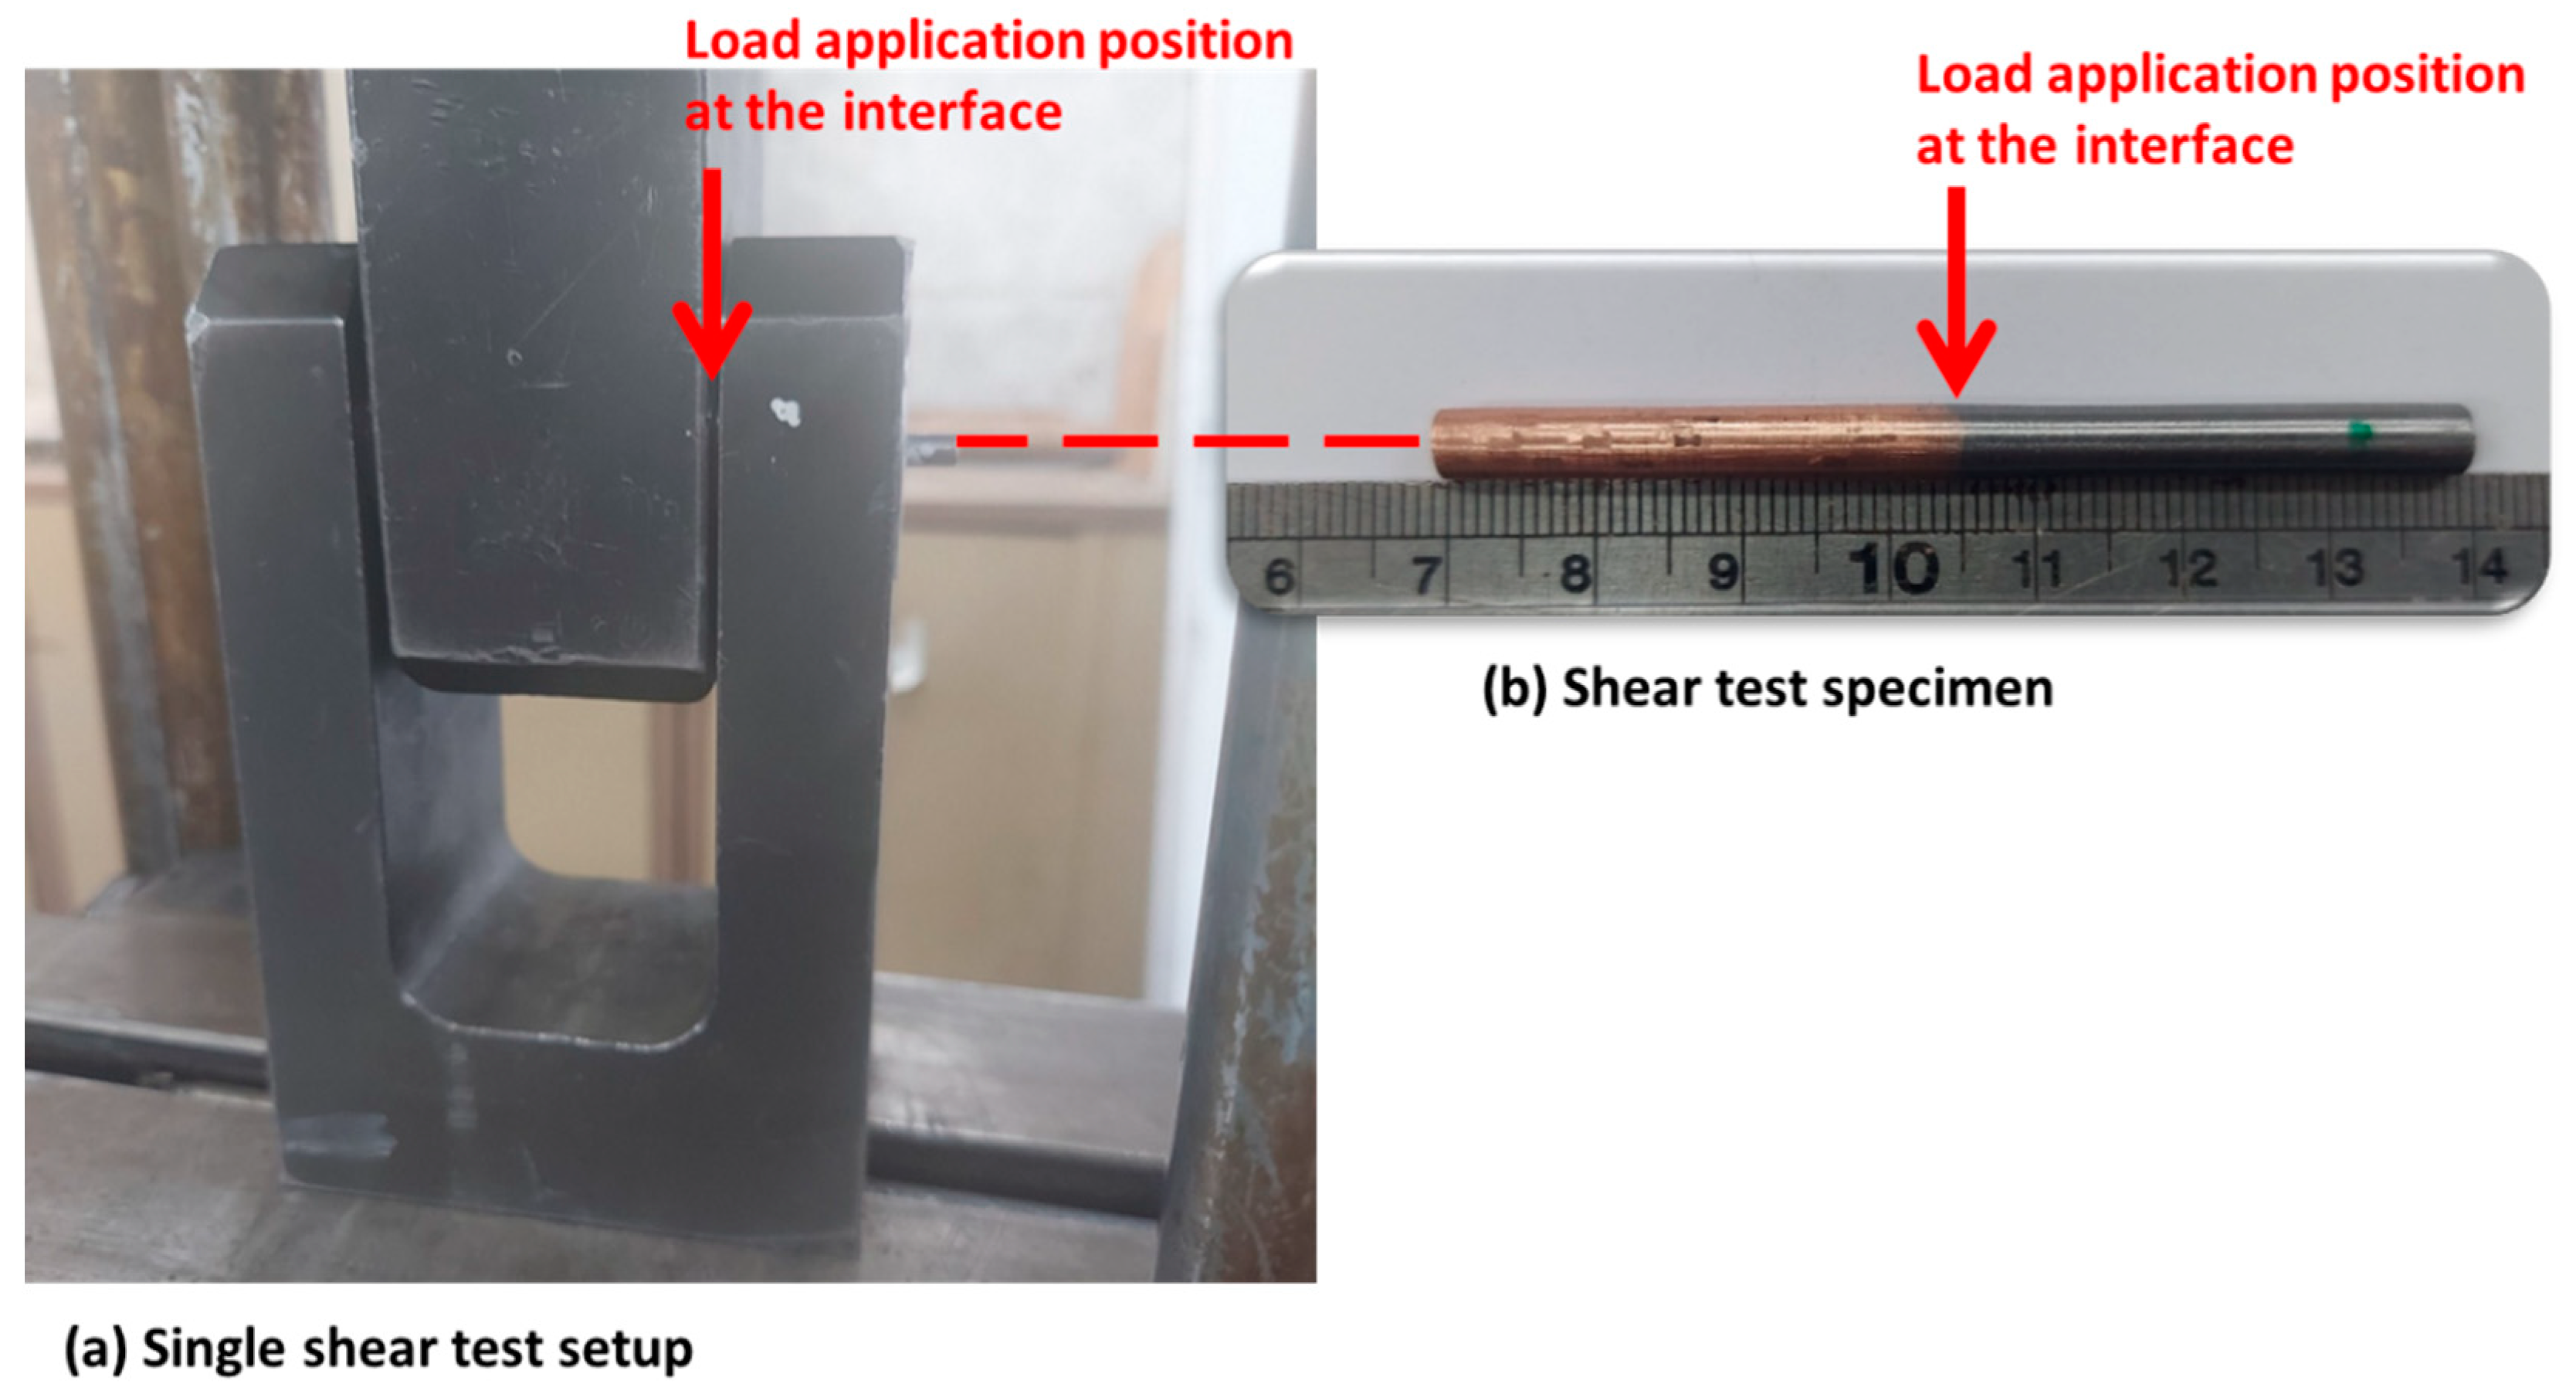
4.7. Direct Shear Test
5. Conclusions
- The possibility of fabricating copper–steel FGMs using pulsed-GMAW-based WAAM has been proven.
- No evidence for porosities throughout the entire samples (at the interface or in plain unmixed regions) was found.
- Hot cracks appeared at the interface. Although they self-healed through filling with molten copper, they can be completely avoided by preheating the HSLA steel before subsequent copper deposition.
- No intermetallic phases were identified within the interface zone between the two dissimilar alloys.
- The hardness distribution suggests a gradual transition in mechanical properties.
- Tensile failures occurred in the copper region, highlighting the integrity of the interface.
- Tensile and bending behavior is dominated by Si-Bronze, while shear performance is controlled by HSLA steel.
- Repeated heat cycles allowed the formation of a considerable interface length of 9 mm due to the diffusion of iron into the Si-Bronze region. EDS elemental analysis, microscopy, and mechanical characterizations validated the interfacial integrity.
Author Contributions
Funding
Data Availability Statement
Acknowledgments
Conflicts of Interest
References
- Basinger, K.L.; Keough, C.B.; Webster, C.E.; Wysk, R.A.; Martin, T.M.; Harrysson, O.L. Development of a modular computer-aided process planning (CAPP) system for additive-subtractive hybrid manufacturing of pockets, holes, and flat surfaces. Int. J. Adv. Manuf. Technol. 2018, 96, 2407–2420. [Google Scholar] [CrossRef]
- Da Silva, E.R.; Shinohara, A.C.; Nielsen, C.P.; de Lima, E.P.; Angelis, J. Operating Digital Manufacturing in Industry 4.0: The role of advanced manufacturing technologies. Procedia CIRP 2020, 93, 174–179. [Google Scholar] [CrossRef]
- Mehrpouya, M.; Dehghanghadikolaei, A.; Fotovvati, B.; Vosooghnia, A.; Emamian, S.S.; Gisario, A. The potential of additive manufacturing in the smart factory industrial 4.0: A review. Appl. Sci. 2019, 9, 3865. [Google Scholar] [CrossRef]
- Lockett, H.; Ding, J.; Williams, S.; Martina, F. Design for Wire+ Arc Additive Manufacture: Design rules and build orientation selection. J. Eng. Des. 2017, 28, 568–598. [Google Scholar] [CrossRef]
- Popov, V.V.; Fleisher, A. Hybrid additive manufacturing of steels and alloys. Manuf. Rev. 2020, 7, 6. [Google Scholar] [CrossRef]
- Xia, C.; Pan, Z.; Polden, J.; Li, H.; Xu, Y.; Chen, S.; Zhang, Y. A review on wire arc additive manufacturing: Monitoring, control and a framework of automated system. J. Manuf. Syst. 2020, 57, 31–45. [Google Scholar] [CrossRef]
- Šcetinec, A.; Klobcar, D.; Bracun, D. In-process path replanning and online layer height control through deposition arc current for gas metal arc based additive manufacturing. J. Manuf. Process. 2021, 64, 1169–1179. [Google Scholar] [CrossRef]
- Izham, E.D.I.A.; Alkahari, M.R.; Hussein, N.I.S.; Maidin, S.; Ramli, F.R.; Herawan, S.G. Online monitoring of wire arc additive manufacturing process: A review. Adv. Mater. Process. Technol. 2023, 1–16. [Google Scholar] [CrossRef]
- Pattanayak, S.; Sahoo, S.K. Gas metal arc welding based additive manufacturing—A review. CIRP J. Manuf. Sci. Technol. 2021, 33, 398–442. [Google Scholar] [CrossRef]
- Dias, M.; Pragana, J.P.; Ferreira, B.; Ribeiro, I.; Silva, C.M. Economic and environmental potential of wire-arc additive manufacturing. Sustainability 2022, 14, 5197. [Google Scholar] [CrossRef]
- Bandyopadhyay, A.; Zhang, Y.; Onuike, B. Additive manufacturing of bimetallic structures. Virtual Phys. Prototyp. 2022, 17, 256–294. [Google Scholar] [CrossRef]
- Ayan, N.K.Y. Fabrication and characterization of functionally graded material (FGM) structure containing two dissimilar steels (ER70S-6 and 308LSi) by wire arc additive manufacturing (WAAM). Mater. Today Commun. 2022, 33, 104457. [Google Scholar] [CrossRef]
- Bandyopadhyay, A.; Heer, B. Additive manufacturing of multi-material structures. Mater. Sci. Eng. R Rep. 2018, 129, 1–16. [Google Scholar] [CrossRef]
- Dharmendra, C.; Shakerin, S.; Ram, G.J.; Mohammadi, M. Wire-arc additive manufacturing of nickel aluminum bronze/stainless steel hybrid parts–Interfacial characterization, prospects, and problems. Materialia 2020, 13, 100834. [Google Scholar] [CrossRef]
- Rodrigues, T.A.; Bairrão, N.; Farias, F.W.C.; Shamsolhodaei, A.; Shen, J.; Zhou, N.; Maawad, E.; Schell, N.; Santos, T.G.; Oliveira, J.P. Steel-copper functionally graded material produced by twin-wire and arc additive manufacturing (T-WAAM). Mater. Des. 2022, 213, 110270. [Google Scholar] [CrossRef]
- Liu, L.; Zhuang, Z.; Liu, F.; Zhu, M. Additive manufacturing of steel–bronze bimetal by shaped metal deposition: Interface characteristics and tensile properties. Int. J. Adv. Manuf. Technol. 2013, 69, 2131–2137. [Google Scholar] [CrossRef]
- Velu, M.; Bhat, S. Metallurgical and mechanical examinations of steel–copper joints arc welded using bronze and nickel-base superalloy filler materials. Mater. Des. 2013, 47, 793–809. [Google Scholar] [CrossRef]
- Zhang, M.; Zhang, Y.; Du, M.; Zhang, S.; Lei, L. Experimental characterization and microstructural evaluation of silicon bronze-alloy steel bimetallic structures by additive manufacturing. Metall. Mater. Trans. A 2021, 52, 4664–4674. [Google Scholar] [CrossRef]
- Tomar, B.; Shiva, S. Microstructure evolution in steel/copper graded deposition prepared using wire arc additive manufacturing. Mater. Lett. 2022, 328, 133217. [Google Scholar] [CrossRef]
- Elsokaty, A.; Oraby, O.; Sadek, S.; Salem, H.G. Influence of Wire Arc Additive Manufacturing Beads’ Geometry and Building Strategy: Mechanical and Structural Behavior of ER70S-6 Prismatic Blocks. J. Manuf. Mater. Process. 2023, 7, 3. [Google Scholar] [CrossRef]
- Queguineur, A.; Rückert, G.; Cortial, F.; Hascoët, J. Evaluation of wire arc additive manufacturing for large-sized components in naval applications. Weld. World 2018, 62, 259–266. [Google Scholar] [CrossRef]
- Yildiz, A.S.; Davut, K.; Koc, B.; Yilmaz, O. Wire arc additive manufacturing of high-strength low alloy steels: Study of process parameters and their influence on the bead geometry and mechanical characteristics. Int. J. Adv. Manuf. Technol. 2020, 108, 3391–3404. [Google Scholar] [CrossRef]
- Duarte, V.R.; Rodrigues, T.A.; Schell, N.; Santos, T.G.; Oliveira, J.P.; Miranda, R.M. Wire and arc additive manufacturing of high-strength low-alloy steel: Microstructure and mechanical properties. Adv. Eng. Mater. 2021, 23, 2001036. [Google Scholar] [CrossRef]
- Sun, X.; Hao, W.; Geng, G.; Ma, T.; Li, Y. Solidification microstructure evolution of undercooled Cu-15 wt.% Fe alloy melt. Adv. Mater. Sci. Eng. 2018, 2018, 6304518. [Google Scholar] [CrossRef]
- Martin, M.L.; Fenske, J.A.; Liu, G.S.; Sofronis, P.; Robertson, I.M. On the formation and nature of quasi-cleavage fracture surfaces in hydrogen embrittled steels. Acta Mater. 2011, 59, 1601–1606. [Google Scholar] [CrossRef]
- Rao, N.V.; Sarma, D.; Nagarjuna, S.; Reddy, G.M. Influence of hot rolling and heat treatment on structure and properties of HSLA steel explosively clad with austenitic stainless steel. Mater. Sci. Technol. 2009, 25, 1387–1396. [Google Scholar] [CrossRef]
- Kannan, A.R.; Kumar, S.M.; Kumar, N.P.; Shanmugam, N.S.; Vishnu, A.; Palguna, Y. Process-microstructural features for tailoring fatigue strength of wire arc additive manufactured functionally graded material of SS904L and Hastelloy C-276. Mater. Lett. 2020, 274, 127968. [Google Scholar] [CrossRef]
- Shen, X.; Song, W.; Sevsek, S.; Ma, Y.; Hüter, C.; Spatschek, R.; Bleck, W. Influence of microstructural morphology on hydrogen embrittlement in a medium-Mn steel Fe-12Mn-3Al-0.05 C. Metals 2019, 9, 929. [Google Scholar] [CrossRef]


| ER110S-G, Diameter: 1.2 mm | Fe | C | Cr | Si | Cu | V | Mo | Mn | P | S | Ni |
| Bal. | 0.068 | 0.3 | 0.54 | 0.21 | 0.086 | 0.2 | 1.55 | 0.009 | 0.014 | 1.48 | |
| ERCuSi-A Diameter: 1.2 mm | Cu | Zn | Sn | Si | Fe | Al | Mo | Mn | Pb | S | Other |
| Bal. | 1 | 1 | 2.8–4.0 | 0.5 | 0.01 | - | 1.5 | 0.02 | - | 0.5 |
| HSLA Steel | Si-Bronze | |
|---|---|---|
| Wire feed rate (m/min) | 2.5 | 6.7 |
| Current (A) | 80 | 193 |
| Voltage (V) | 18.9 | 23.1 |
| Welding mode | Pulsed—GMAW | |
| Travel speed (mm/s) | 6 | 12 |
| Shielding gas | 82%Ar + 18%CO2 @15 L/min | 99.9% Ar @15 L/min |
| Interpass temperature (°C) | 120 | 100 |
| Heat input (J/mm) | 200 | 300 |
| DMV (mm3/mm) | 7.85 | 10.52 |
| DR (kg/h) | 1.32 | 3.98 |
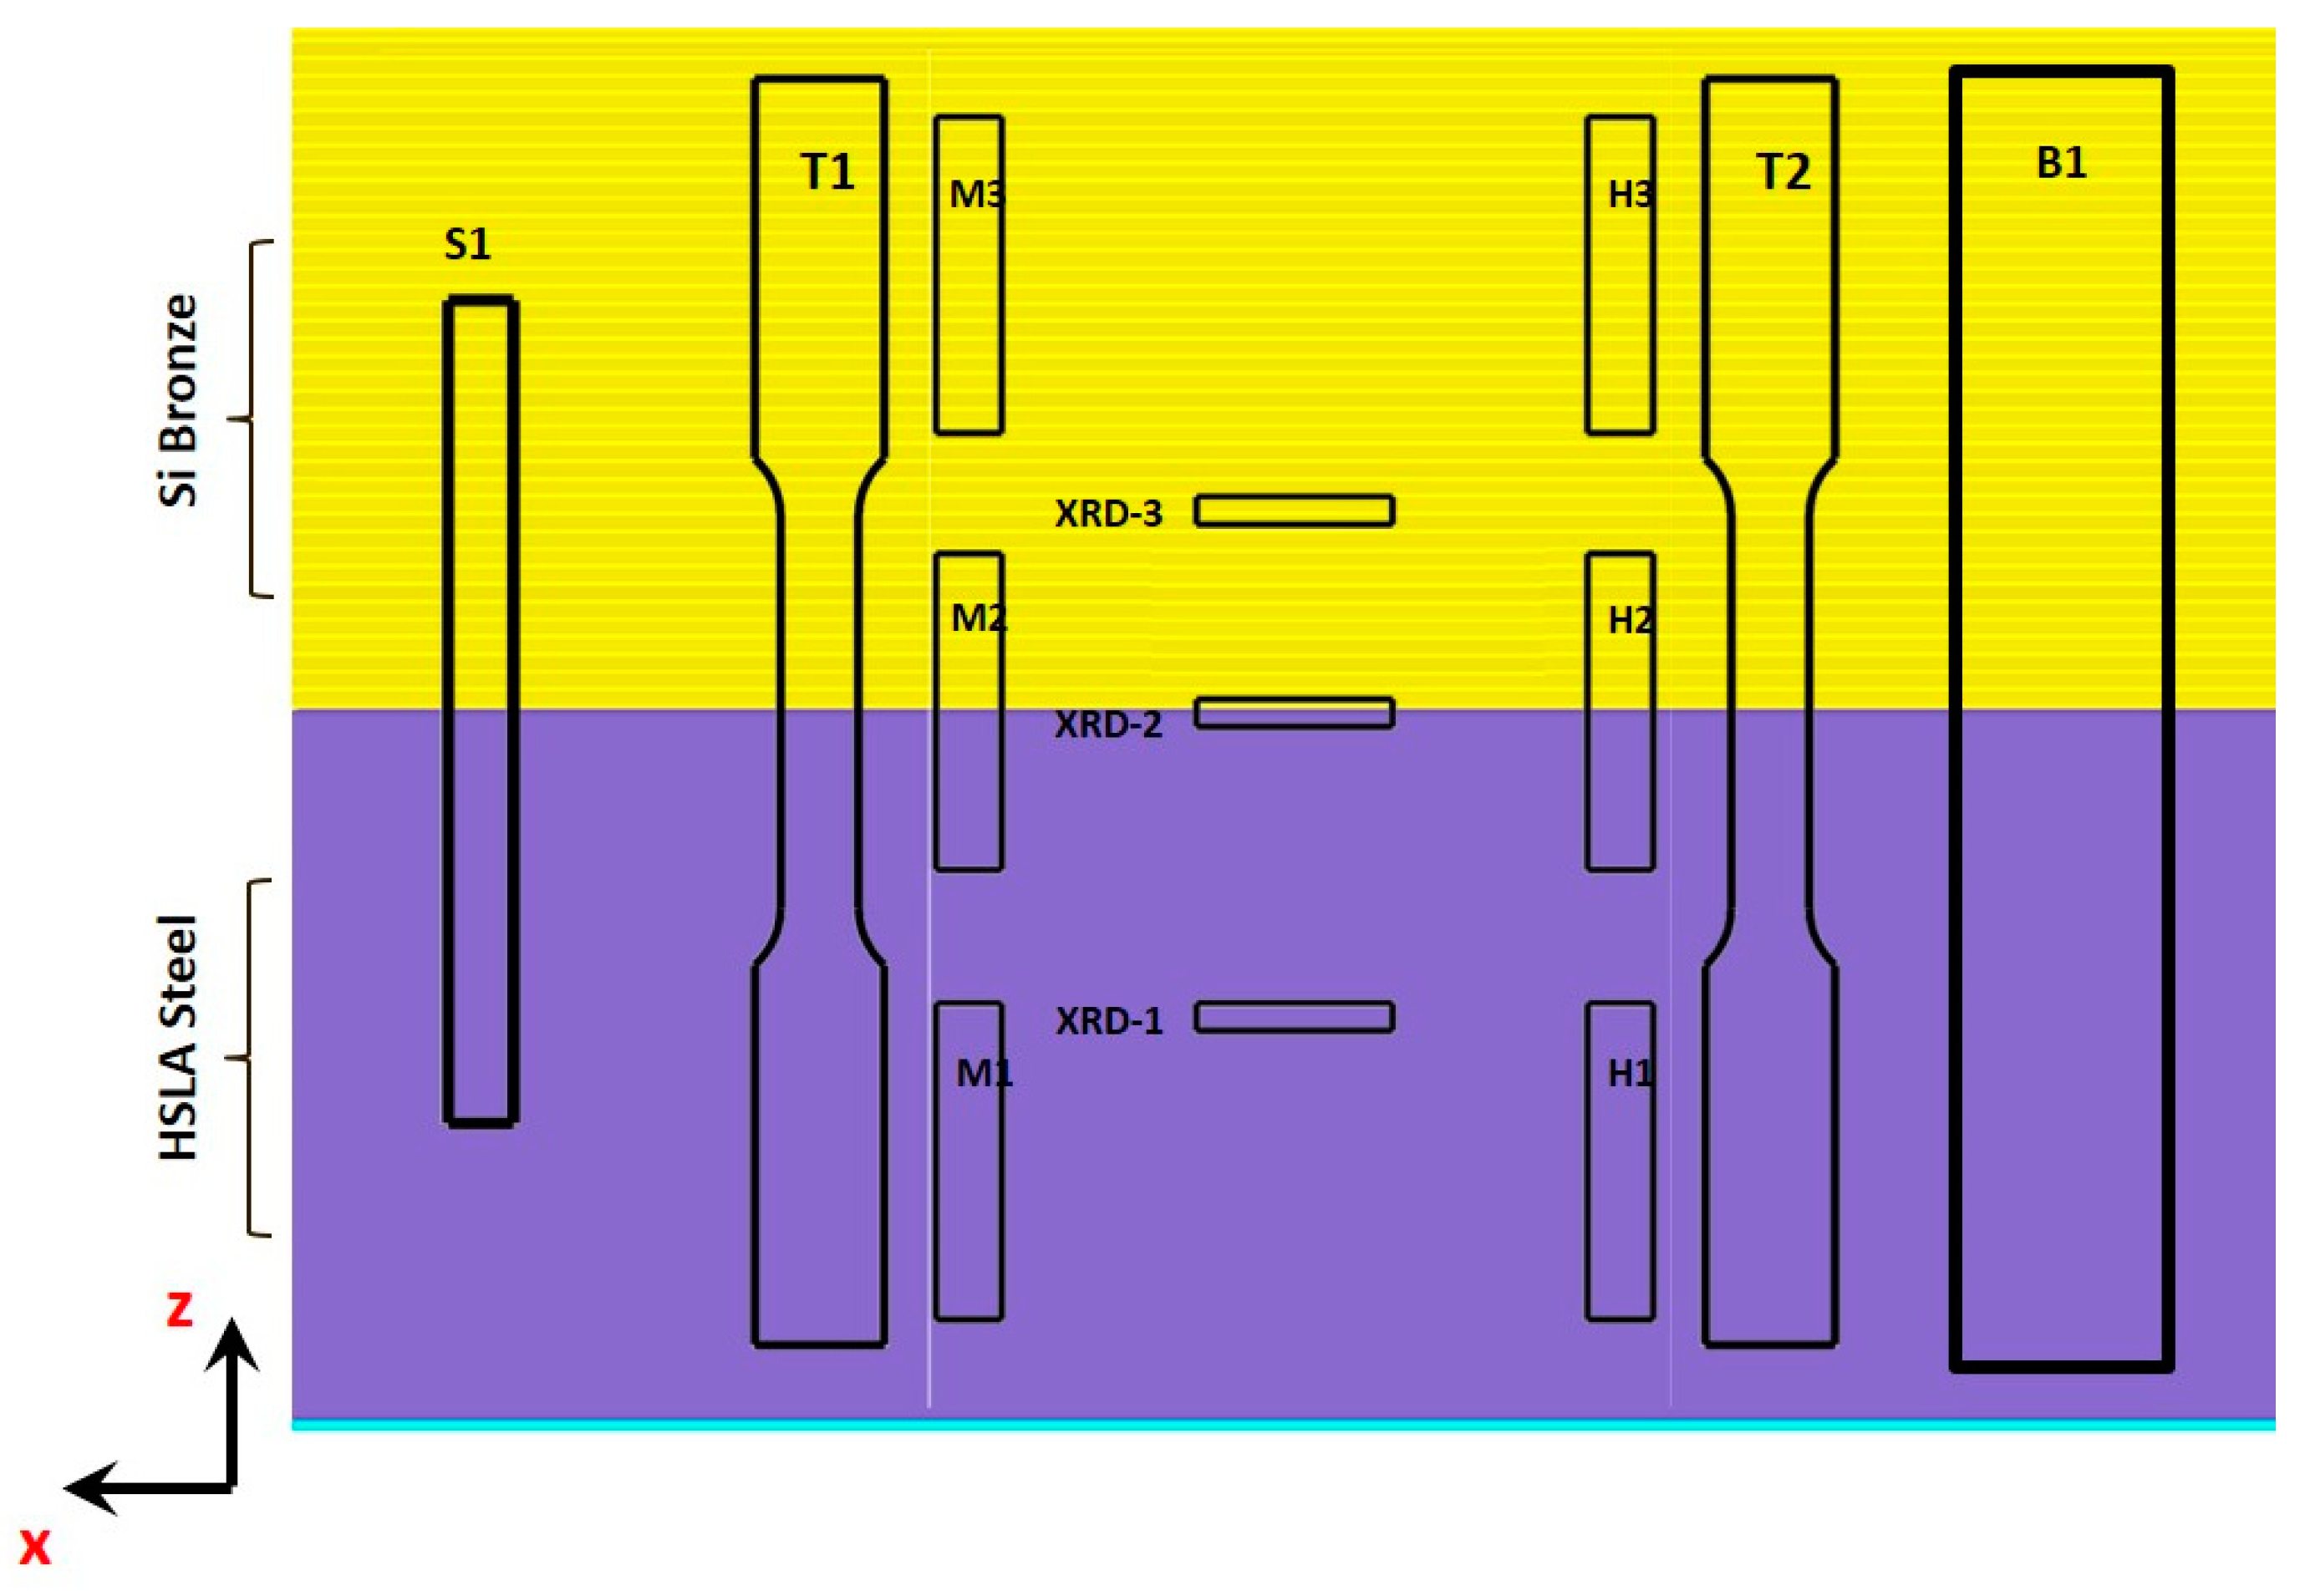
| Tag | Description |
|---|---|
| T1, T2 | Tensile samples (ASTM E8/E8M, gauge length: 25 mm, thickness 5 mm) |
| S1 | Shear sample (diameter: 5 mm, height: 60 mm) |
| B1 | 3-point bending sample (length: 110 mm, width: 40 mm, thickness: 5 mm) |
| H1–H3 | Micro-hardness samples (length: 25 mm, width: 5 mm, depth: 10 mm) |
| M1–M3 | Microstructure, SEM/EDS samples (length: 25 mm, width: 5 mm, depth: 10 mm) |
| XRD-1 to XRD-3 | X-ray diffraction samples (length: 10 mm, width: 5 mm, thickness: 2 mm) |
| Flexural Strength (MPa) | Shear Strength (MPa) | Tensile Results | ||
|---|---|---|---|---|
| YS (MPa) | UTS (MPa) | Elongation (%) | ||
| 330 ± 15 | 510 ± 24 | 76 ± 9 | 164 ± 26 | 30 + 2 |
Disclaimer/Publisher’s Note: The statements, opinions and data contained in all publications are solely those of the individual author(s) and contributor(s) and not of MDPI and/or the editor(s). MDPI and/or the editor(s) disclaim responsibility for any injury to people or property resulting from any ideas, methods, instructions or products referred to in the content. |
© 2023 by the authors. Licensee MDPI, Basel, Switzerland. This article is an open access article distributed under the terms and conditions of the Creative Commons Attribution (CC BY) license (https://creativecommons.org/licenses/by/4.0/).
Share and Cite
El-Husseiny, M.M.; Baraka, A.A.; Oraby, O.; El-Danaf, E.A.; Salem, H.G. Fabrication of Bimetallic High-Strength Low-Alloy Steel/Si-Bronze Functionally Graded Materials Using Wire Arc Additive Manufacturing. J. Manuf. Mater. Process. 2023, 7, 138. https://doi.org/10.3390/jmmp7040138
El-Husseiny MM, Baraka AA, Oraby O, El-Danaf EA, Salem HG. Fabrication of Bimetallic High-Strength Low-Alloy Steel/Si-Bronze Functionally Graded Materials Using Wire Arc Additive Manufacturing. Journal of Manufacturing and Materials Processing. 2023; 7(4):138. https://doi.org/10.3390/jmmp7040138
Chicago/Turabian StyleEl-Husseiny, Marwan M., Abdelrahman A. Baraka, Omar Oraby, Ehab A. El-Danaf, and Hanadi G. Salem. 2023. "Fabrication of Bimetallic High-Strength Low-Alloy Steel/Si-Bronze Functionally Graded Materials Using Wire Arc Additive Manufacturing" Journal of Manufacturing and Materials Processing 7, no. 4: 138. https://doi.org/10.3390/jmmp7040138
APA StyleEl-Husseiny, M. M., Baraka, A. A., Oraby, O., El-Danaf, E. A., & Salem, H. G. (2023). Fabrication of Bimetallic High-Strength Low-Alloy Steel/Si-Bronze Functionally Graded Materials Using Wire Arc Additive Manufacturing. Journal of Manufacturing and Materials Processing, 7(4), 138. https://doi.org/10.3390/jmmp7040138