Article

Irregular Shape Effect of Brass and Copper Filler on the Properties of Metal Epoxy Composite (MEC) for Rapid Tooling Application

by
Radhwan Hussin
1,2,3,*,
Safian Sharif
1,
Shayfull Zamree Abd Rahim
2,3,
Allan Rennie
4,*,
Mohd Azlan Suhaimi
1,
Abdellah El-hadj Abdellah
5,
Norshah Afizi Shuaib
2,3,
Mohd Tanwyn Mohd Khushairi
6 and
Aurel Mihail Titu
7
1
Faculty of Mechanical Engineering, Universiti Teknologi Malaysia, Skudai 81310, Malaysia
2
Center of Excellence Geopolymer and Green Technology (CEGeoGTech), Universiti Malaysia Perlis, Perlis 01000, Malaysia
3
Faculty of Mechanical Engineering Technology, Universiti Malaysia Perlis, Perlis 01000, Malaysia
4
Lancaster Product Development Unit, School of Engineering, Lancaster University, Lancaster LA1 4YW, UK
5
Laboratory of Mechanics, Physics and Mathematical Modelling (LMP2M), University of Medea, Medea 26000, Algeria
6
IMU Centre for Life-Long Learning (ICL), International Medical University, Kuala Lumpur 57000, Malaysia
7
Industrial Engineering and Management Department, Faculty of Engineering, “Lucian Blaga” University of Sibiu, 10 Victoriei Street, 550024 Sibiu, Romania
*
Authors to whom correspondence should be addressed.
J. Manuf. Mater. Process. 2022, 6(6), 134; https://doi.org/10.3390/jmmp6060134
Submission received: 12 September 2022 / Revised: 28 October 2022 / Accepted: 30 October 2022 / Published: 2 November 2022

Abstract

:
Due to their low shrinkage and easy moldability, metal epoxy composites (MEC) are recognized as an alternative material that can be applied as hybrid mold inserts manufactured with rapid tooling (RT) technologies. Although many studies have been conducted on MEC or reinforced composite, research on the material properties, especially on thermal conductivity and compressive strength, that contribute to the overall mold insert performance and molded part quality are still lacking. The purpose of this research is to investigate the effect of the cooling efficiency using MEC materials. Thus, this research aims to appraise a new formulation of MEC materials as mold inserts by further improving the mold insert performance. The effects of the thermal, physical, and mechanical properties of MEC mold inserts were examined using particles of brass (EB), copper (EC), and a combination of brass + copper (EBC) in irregular shapes. These particles were weighed at percentages ranging from 10% to 60% when mixed with epoxy resin to produce specimens according to related ASTM standards. A microstructure analysis was made using a scanning electron microscope (SEM) to investigate brass and copper particle distribution. When filler composition was increased from 10% to 60%, the values of density (g/cm3), hardness (Hv), and thermal conductivity (W/mK) showed a linear upward trend, with the highest value occurring at the highest filler composition percentage. The addition of filler composition increased the compressive strength, with the highest average compressive strength value occurring between 20% and 30% filler composition. Compressive strength indicated a nonlinear uptrend and decreased with increasing composition by more than 30%. The maximum value of compressive strength for EB, EC, and EBC was within the range of 90–104 MPa, with EB having the highest value (104 MPa). The ANSYS simulation software was used to conduct a transient thermal analysis in order to evaluate the cooling performance of the mold inserts. EC outperformed the EB and EBC in terms of cooling efficiency based on the results of thermal transient analysis at high compressive strength and high thermal conductivity conditions.

1. Introduction

Nowadays, rapid tooling (RT) and additive manufacturing (AM) are widely seen as complementary technologies for the rapid manufacture of tooling for prototype applications within the tooling sector [1,2]. Current techniques in developing mold inserts (core and cavity) involve many manufacturing steps in producing the final product, where dimensional accuracy and good surface, as well as the preparation of cooling channels, are the most important factors [3,4]. Commonly, mold components are fabricated from conventional, CNC, and electro-discharge machining that are expensive and time-consuming [1,4,5,6,7,8]. As stated by Elangovan et al. [9], tooling inserts with complex geometries can be produced at low cost and in less time using the RT technique than conventional steel molds, which can take up to a month. To improve the competitiveness, the use of metal epoxy composite (MEC) as a hybrid mold insert (Figure 1) could reduce the tooling manufacturing cost and lead time by up to 25% and 50%, respectively [4,5,6,10,11].
MEC mold inserts are frequently made using the vacuum casting process [12,13], which involves mixing an epoxy-based material with metal fillers before pouring the mixture into a specially prepared pouring container. These mold inserts, which have low processing cost, are very competitive when applied in the manufacture of plastic parts in low volumes [4,6,14,15].
There are several other factors that will affect the thermal, physical, and mechanical properties of the mold inserts produced based on the manufacturer’s guidelines and previous research [15,16,17], such as curing time, curing temperature, metal filler composition based on weight ratio, mixing time, degassing time, etc., [18]. There is a potential for problems to arise in the specimens and mold inserts being made if there is non-uniform mixing of the MEC material and the curing agent, and the presence of entrapped gases in the mixture [19,20,21,22]. Metal fillers will not work better in epoxy matrices if the dispersion is not even and will sink to the bottom [15].
In general, the mold insert material and the mold cooling system influence the cooling time of injection molded products [4,22,23,24]. Nevertheless, MEC materials have disadvantages such as high wear rate, low compressive strength, and low thermal conductivity [4,11,15,25,26]. Epoxies filled with aluminum, brass, copper, etc., in spherical shapes have been used for a long time in indirect rapid tooling, and have especially been applied as mold insert materials [4,15,17,22]. The type and amount of filler composition on the MEC material are critical in ensuring good performance, which can be assessed by conducting various types of tests such as physical, thermal, and mechanical tests to examine the properties of the material [4,15,16,22,27,28,29]. Most manufacturers of epoxy resin for tooling use mixtures in the range of 20–30% because, at this condition, it has the highest compressive strength, saves money on filler, and is easy to pour into more complex pouring blocks [22,30,31,32,33,34,35].
Due to the fact that epoxy tools frequently begin to crack and break when repeatedly heated to high temperatures and cooled to room temperature, the current challenges and issues in MEC material are to improve the performance of the mold inserts [4,6]. According to Ma et al. [15], MEC material’s properties as a mold insert in the injection molding process are determined by its structure, compressive strength, hardness, and thermal conductivity. This is an important aspect that must be considered when developing effective MEC mold inserts that determine the MEC mold life. The relatively low thermal conductivity is the primary obstacle that needs to be overcome during the development of the molding process using RT. The slow heat transfer from the molten plastic to the coolant through the mold inserts is caused by epoxy mixed with fillers having low thermal conductivity (0.6 W/mK to 1.8 W/mK) [3,4,33,36]. Rapid heating and cooling can worsen the MEC mold insert during the injection molding process, which affects the quality and dimensional accuracy of the part [4,37].
Rahmati and Dickens [38] highlighted that filler thermal conductivity, resin temperature (Tg), and fabrication process are significant factors when considering how the molding process with RT-fabricated mold inserts affects the molded component. Making plastic components with hybrid molds still presents some challenges because the thermal properties, mechanical information, and behavior of the materials are either inaccessible or poorly understood [39]. From previous research [4,5,6,21], the data on the properties of MEC are limited, with every researcher obtaining different values, and there is no comprehensive data presented [33,40]. Most studies concentrated on part shrinkage when filled epoxy was utilized as mold inserts [41,42,43].
Several researchers [27,44,45,46] have investigated the thermal conductivity and mechanical strength of MEC material consisting of brass and copper fillers in a spherical shape. The physical, mechanical, and thermal properties of aluminum epoxy were investigated in a series of experiments initiated by Khushairi et al. [22]. Aluminum-filled epoxy was mixed separately with brass and copper fillers of varying compositions (10%, 20%, and 30%). In the thermal conductivity test, it was found that the copper filler provided better thermal diffusivity. However, regarding density and compressive strength, brass fillers are proven to be more effective than copper fillers. There is also research on the use of irregularly shaped filler particles and fibers, in addition to spherical shapes, but they have not been comprehensively reported for use as mold insert material [29,47].
Therefore, with regard to the contribution to knowledge in MEC mold inserts, this study was initiated to investigate the cooling performance of the MEC mold by investigating the effect of the mold material in the mixture using brass and copper filler particles of irregular shapes. The investigation includes the determination of its physical, mechanical, and thermal properties. Cooling time of the MEC material is to be simulated using ANSYS software to provide significant information and benefits, especially to the mold and die, engineering parts, and plastics industries.

2. Methodology

The process flow of this research is illustrated in Figure 2. It starts with the assessment and selection of the type, shape, size, and wt% composition of filler particles in the form of powder. Irregular shaped filler particles of brass and copper are used to enhance the ability of the MEC mold insert in terms of cooling time reduction, while the use of spherical aluminum filler is intended as a measurement guide because the use of different resins yields different results. Table 1 shows the filler information provided by Chengdu Huarui Industrial Co., Ltd., Chendu, China, which was used in this research. The information of particle size and shape are given in Figure 3. The process is then continued with physical, mechanical, and thermal tests to obtain the properties of the new MEC material before evaluating the type and percentage of filler composition suitable for use as mold inserts. Mold inserts with cooling channels were designed, and thermal transient analysis was conducted using ANSYS Fluent 180, ANSYS, Inc., Canonsburg, PA, USA, by considering the best properties of the materials selected.

2.1. Specimen Preparation

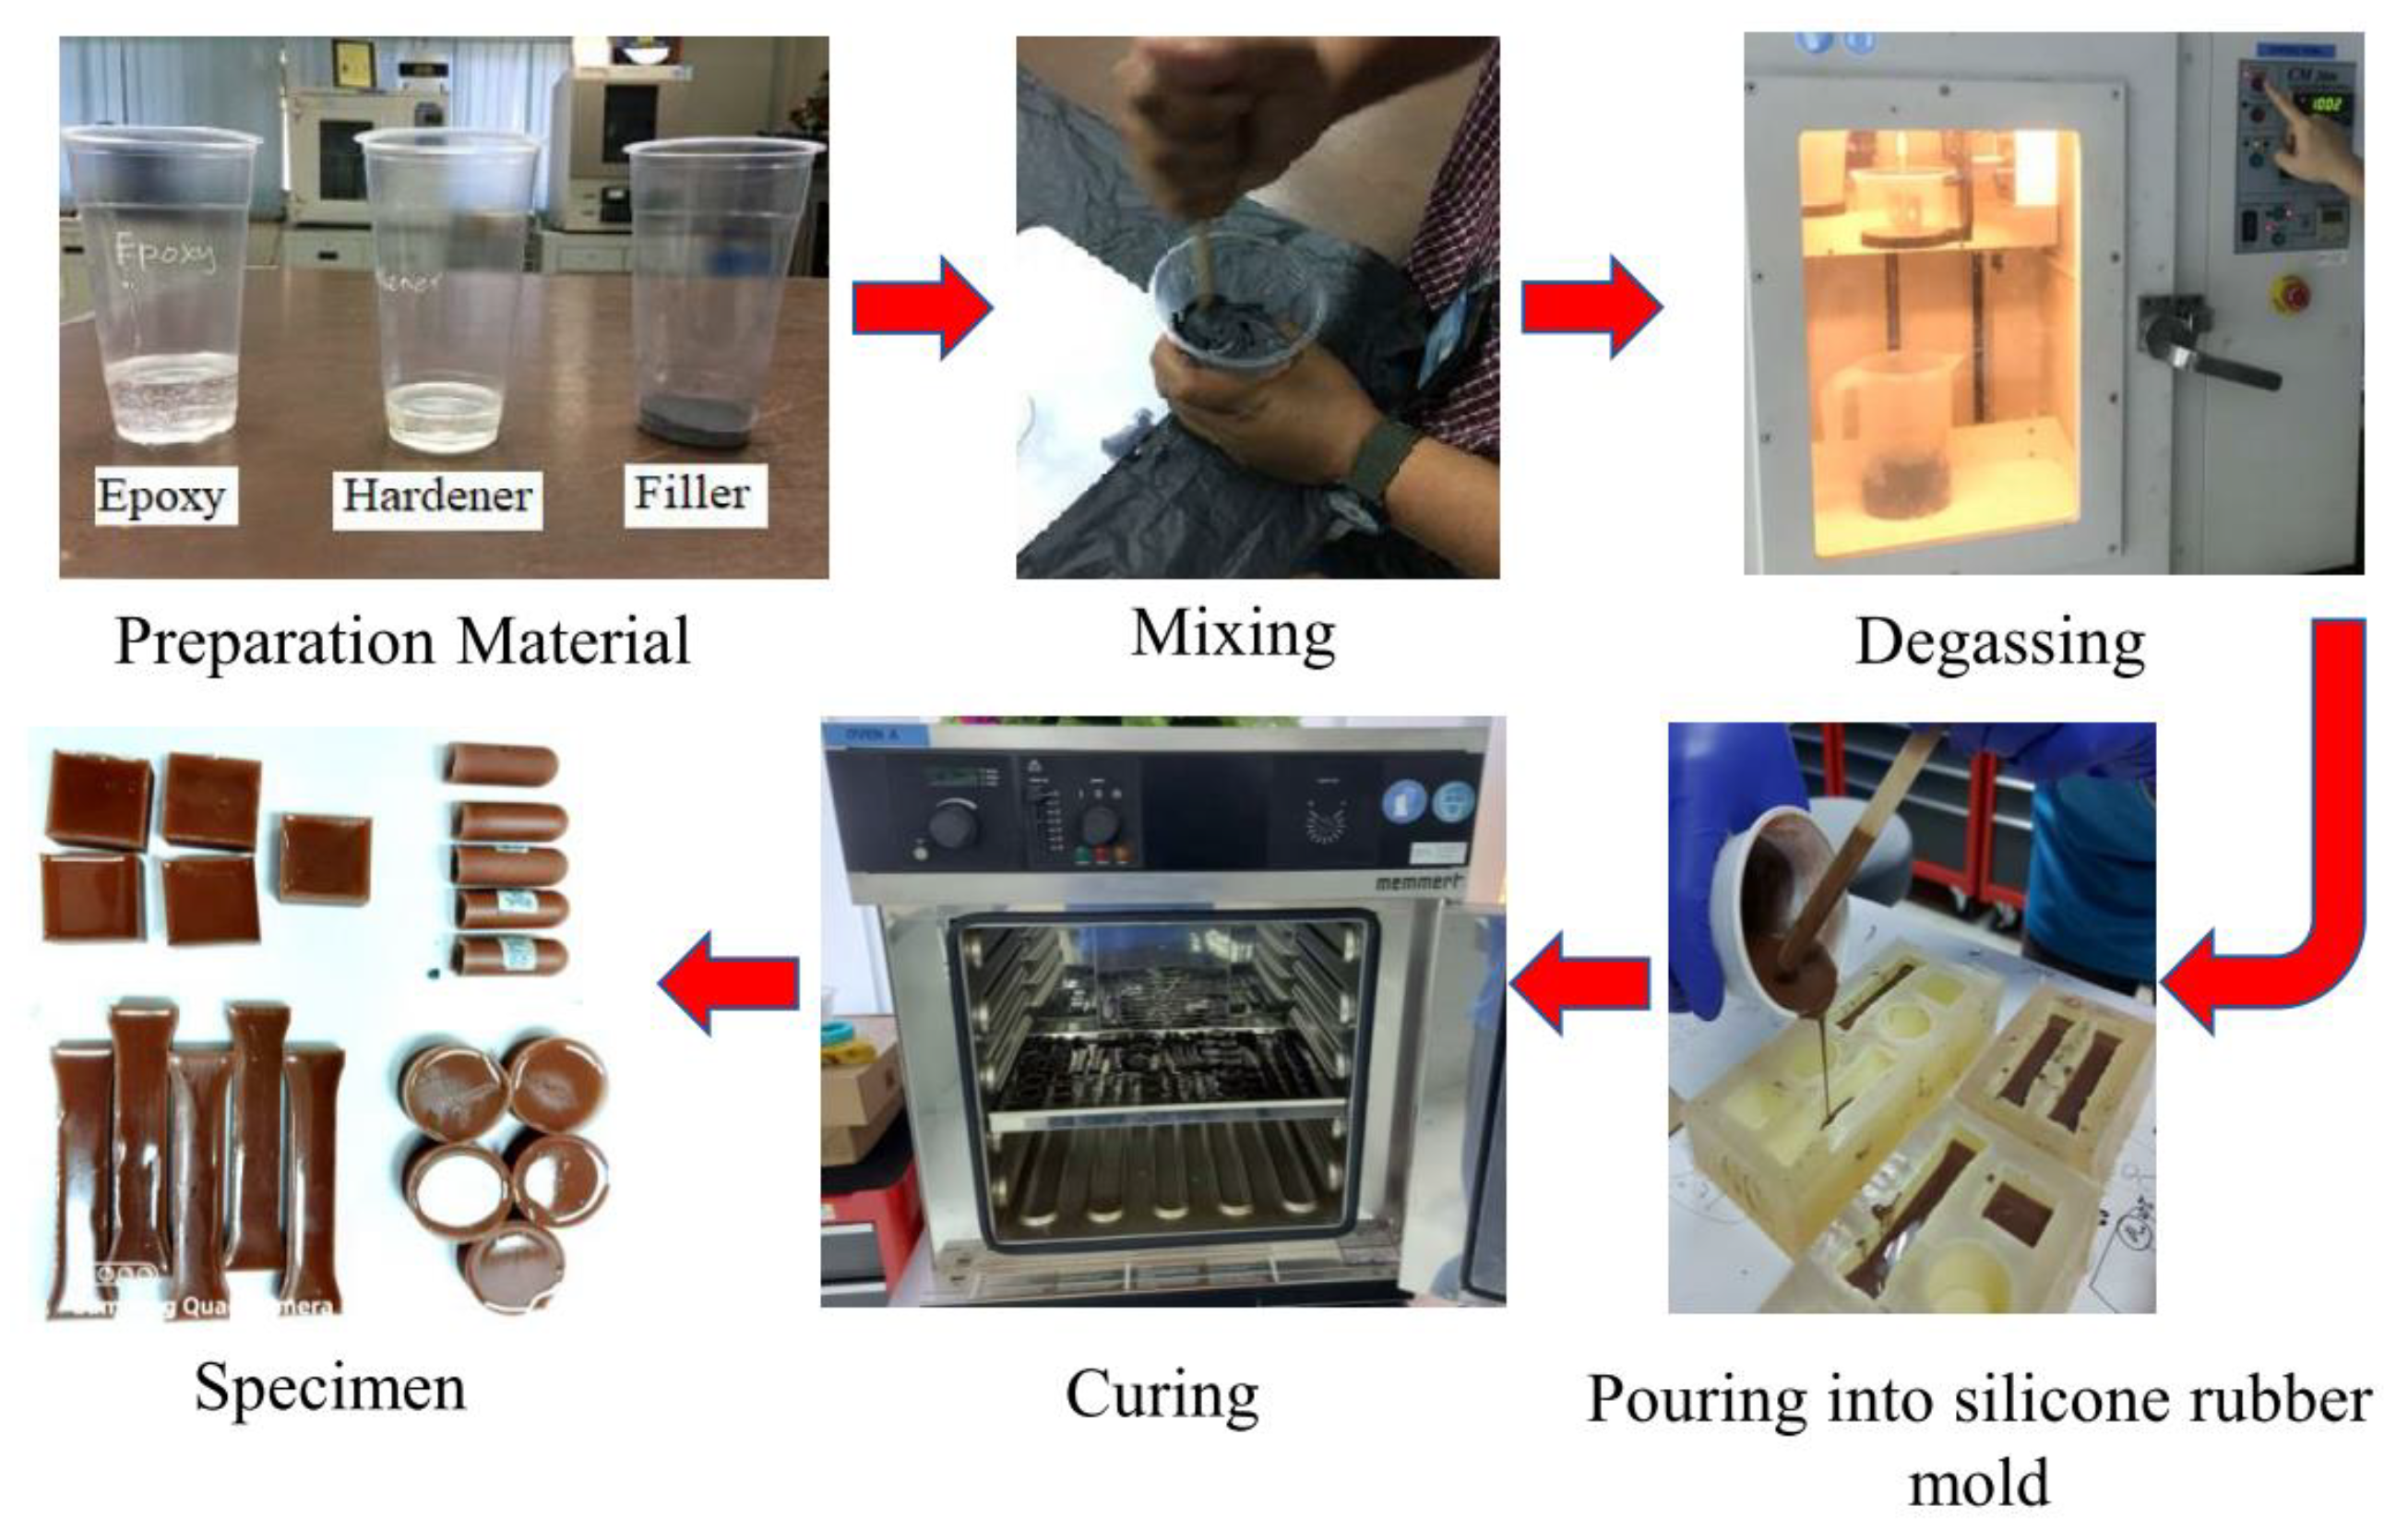
The epoxy used in this research was MIRACAST 1516 A/B [48], provided by Miracon (M) Sdn. Bhd, Selangor, Malaysia. Miracast 1516A with Miracast 1516B is a low viscosity epoxy system suitable for the production of molds, tools, and fixtures that are subjected to heat. Most manufacturers of epoxy resin for tooling use aluminum filler at a composition of 20–30% to ensure that the material properties are at an optimal level [29,33,34,35]. From the literature study [49], it can be seen that the aluminum filler in a spherical shape and size is in the range of 20–65 microns. Therefore, in this research, EA filler is used to set a benchmark for testing the physical, thermal, and mechanical properties of MEC material. Epoxy resins were mixed separately with aluminum (EA), brass (EB), and copper (EC) fillers in the range of 10% to 60% by weight composition ratio. At compositions of 10% to 40%, the high compression strength is broken down into 5% intervals to achieve a more precise picture of where it occurs. The compositions of the metal filler, epoxy resin, and hardener used to produce one set of specimens are listed in Table 2. For the combination of the brass + copper (EBC) filler, the compositions of the epoxy resin and hardener remain according to each % composition, as in Table 2. The only change in the total composition of the metal filler is to combine two brass and copper fillers with a 1:1 ratio. Specimen preparation was started by mixing epoxy resin and hardener, while filler particles were added separately in different percentage compositions. After the mixture was stirred (within 5 to 10 min), it was degassed in a vacuum casting chamber (CM2000, Cybron Technology (M) Sdn. Bhd, Peneng, Malaysia) for 10–15 min to remove any trapped air bubbles. The mixture was then poured into a well-prepared rubber mold to form a specimen, and after it hardened at room temperature for 24 h, it was heated in the oven (Memmert UM200, Memmert GmbH + Co. KG, Schwabach, Germany) at 180 °C for 8 h to obtain the maximum hardness of the material [15,16,17,22,50,51,52,53]. The procedures are clearly illustrated in Figure 4.

2.2. Experimental Set-Up

The primary objective of test selection is to obtain material properties that meet the material requirements for use as a mold insert while also adhering to ASTM standards. The tests were chosen based on previous research conducted on MEC’s mechanical and thermal properties and their use in the injection molding process. A combination of RT techniques is used to determine physical, mechanical, and thermal properties [15,16,17,22,50,51,52,53,54]. In order to ensure that the materials are suitable for their intended applications, four tests were carried out in this current study, which were the density test, hardness test, compression strength test, and thermal conductivity test.
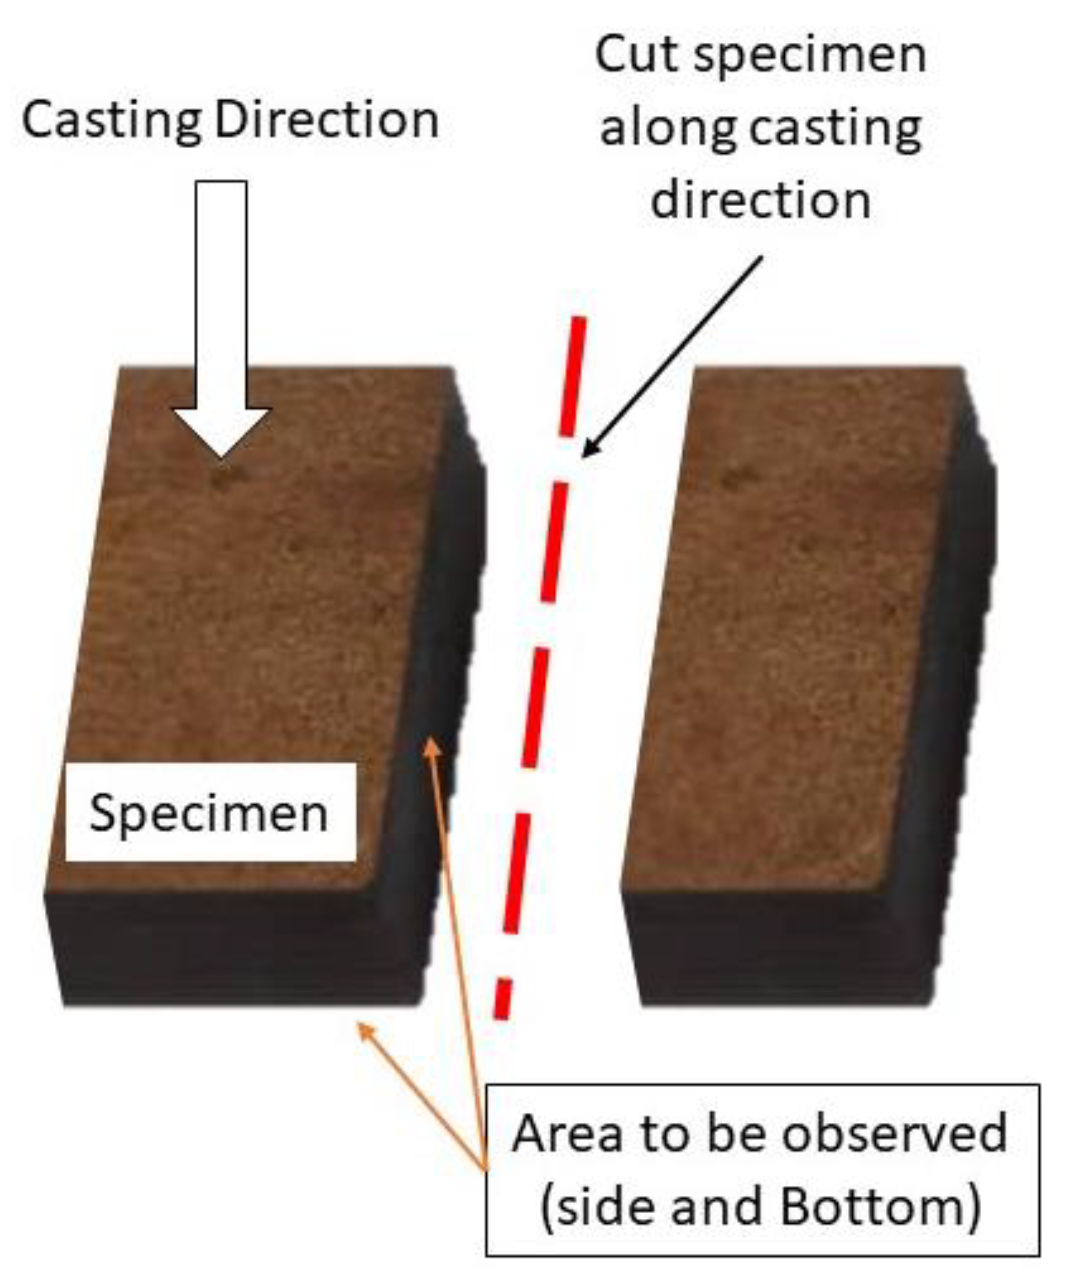
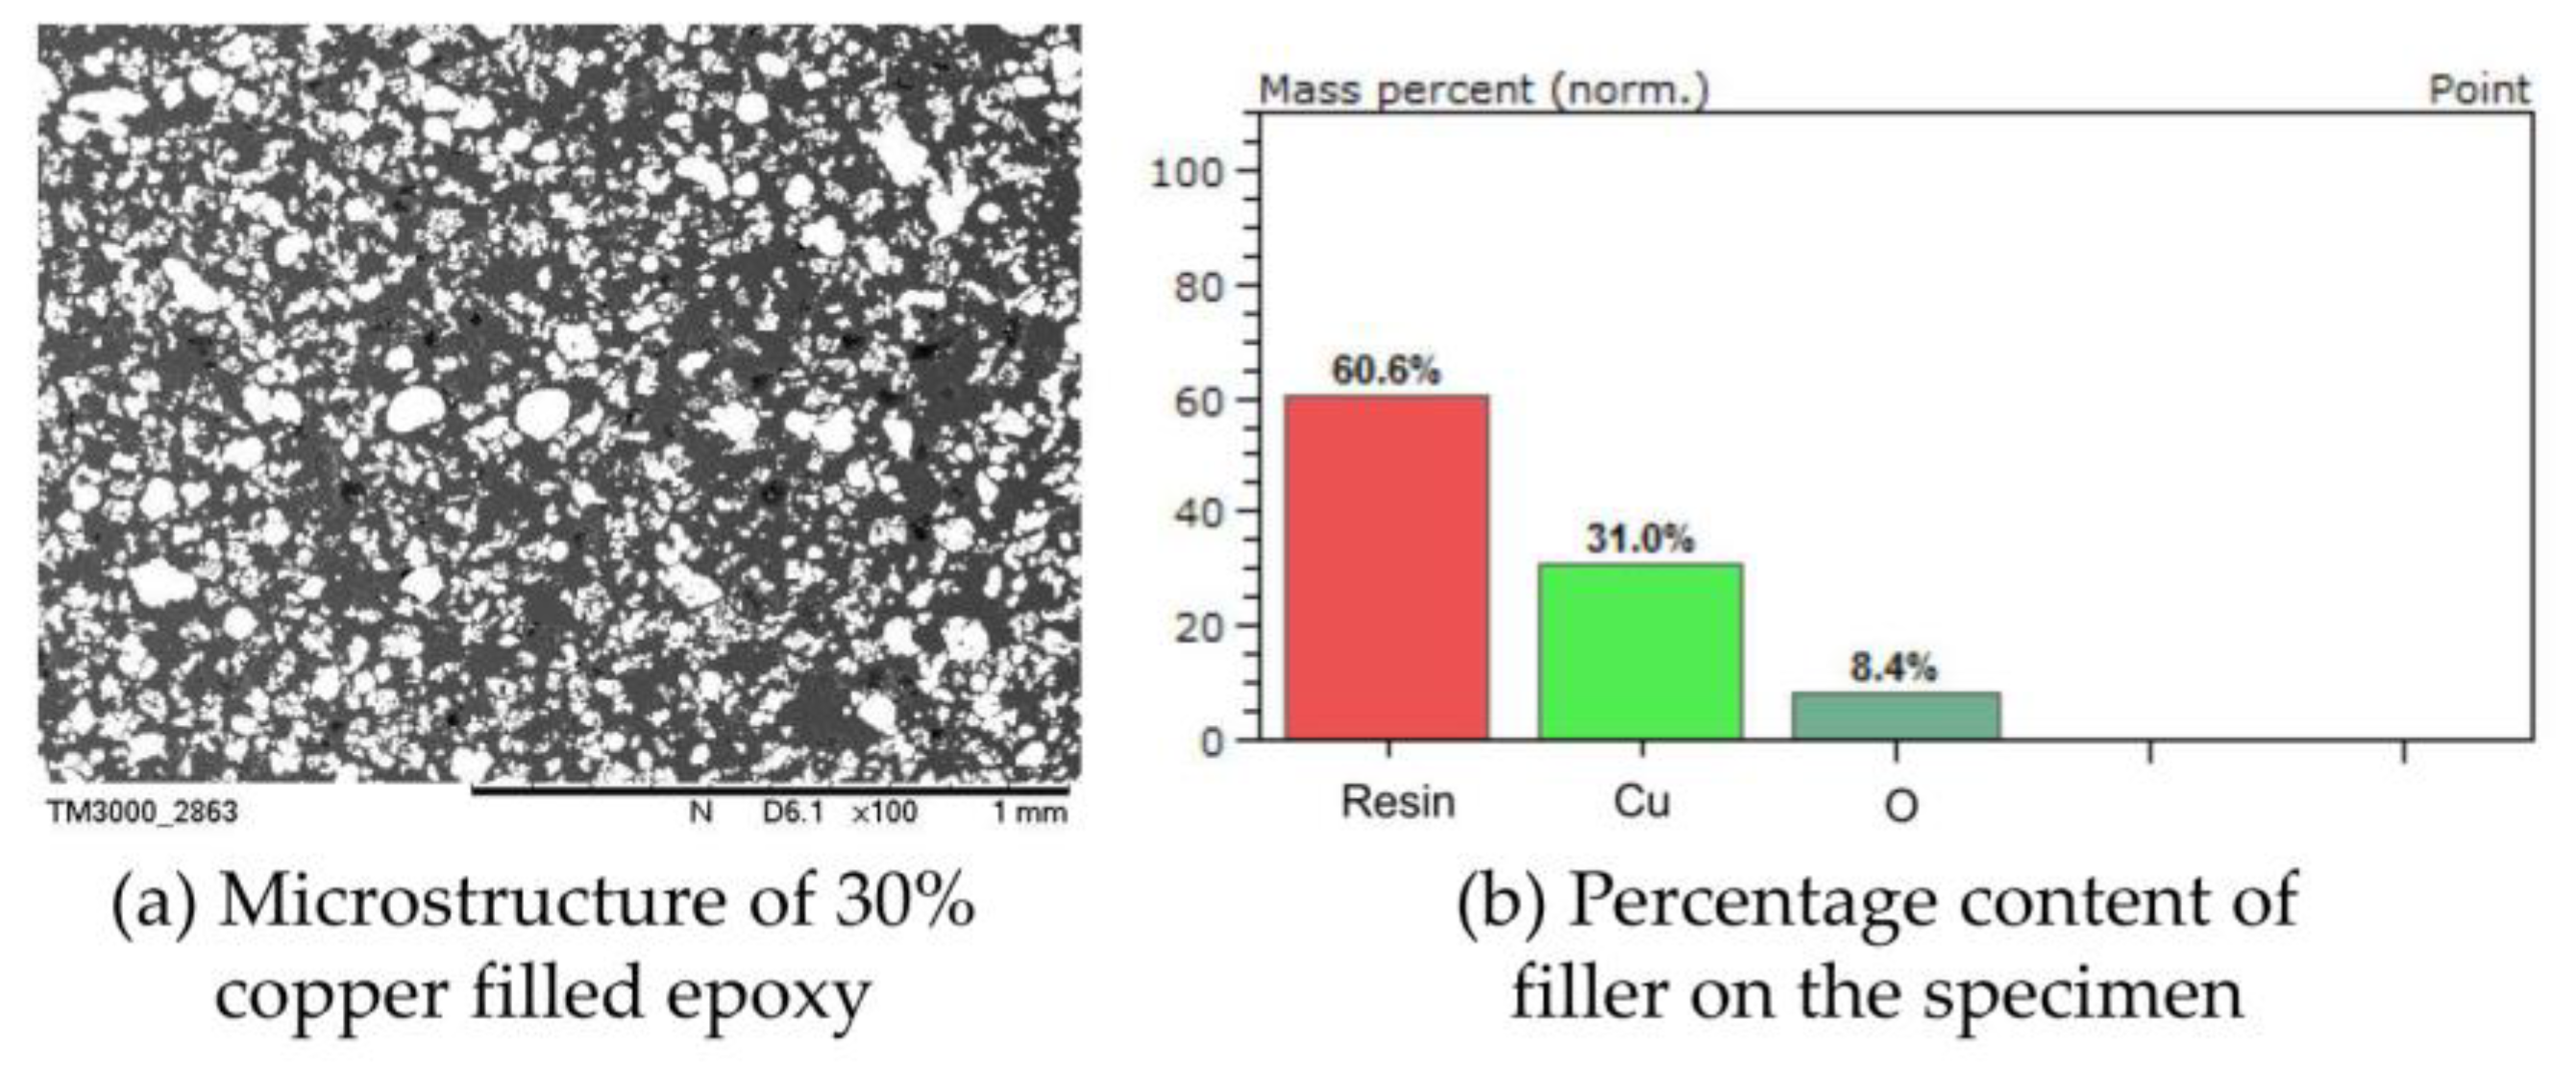
Prior to the actual tests, several specimens were prepared and selected randomly according to percentage composition and analyzed using the microstructure analysis method. It was intended to ensure that the percentage of the filler particles and the size is accurate, as well as to ensure that the mixture is evenly distributed over the entire surface area. The specimens were cut along the casting direction, and then the areas to be observed (bottom and side) were polished, as shown in Figure 5. The microstructures reflect particle dispersion in the entire epoxy matrix composite. All micrographs at these two areas were taken and analyzed for each type of powder filled epoxy composite in different ratios of fillers. Figure 6 shows the example of optical micrographs of the 30% copper filled epoxy and the percentage content of filler on the specimen. Numerical values of the percentage composition were obtained for each specimen preparation, with a confidence interval of ±1.5%.

2.2.1. Density Test

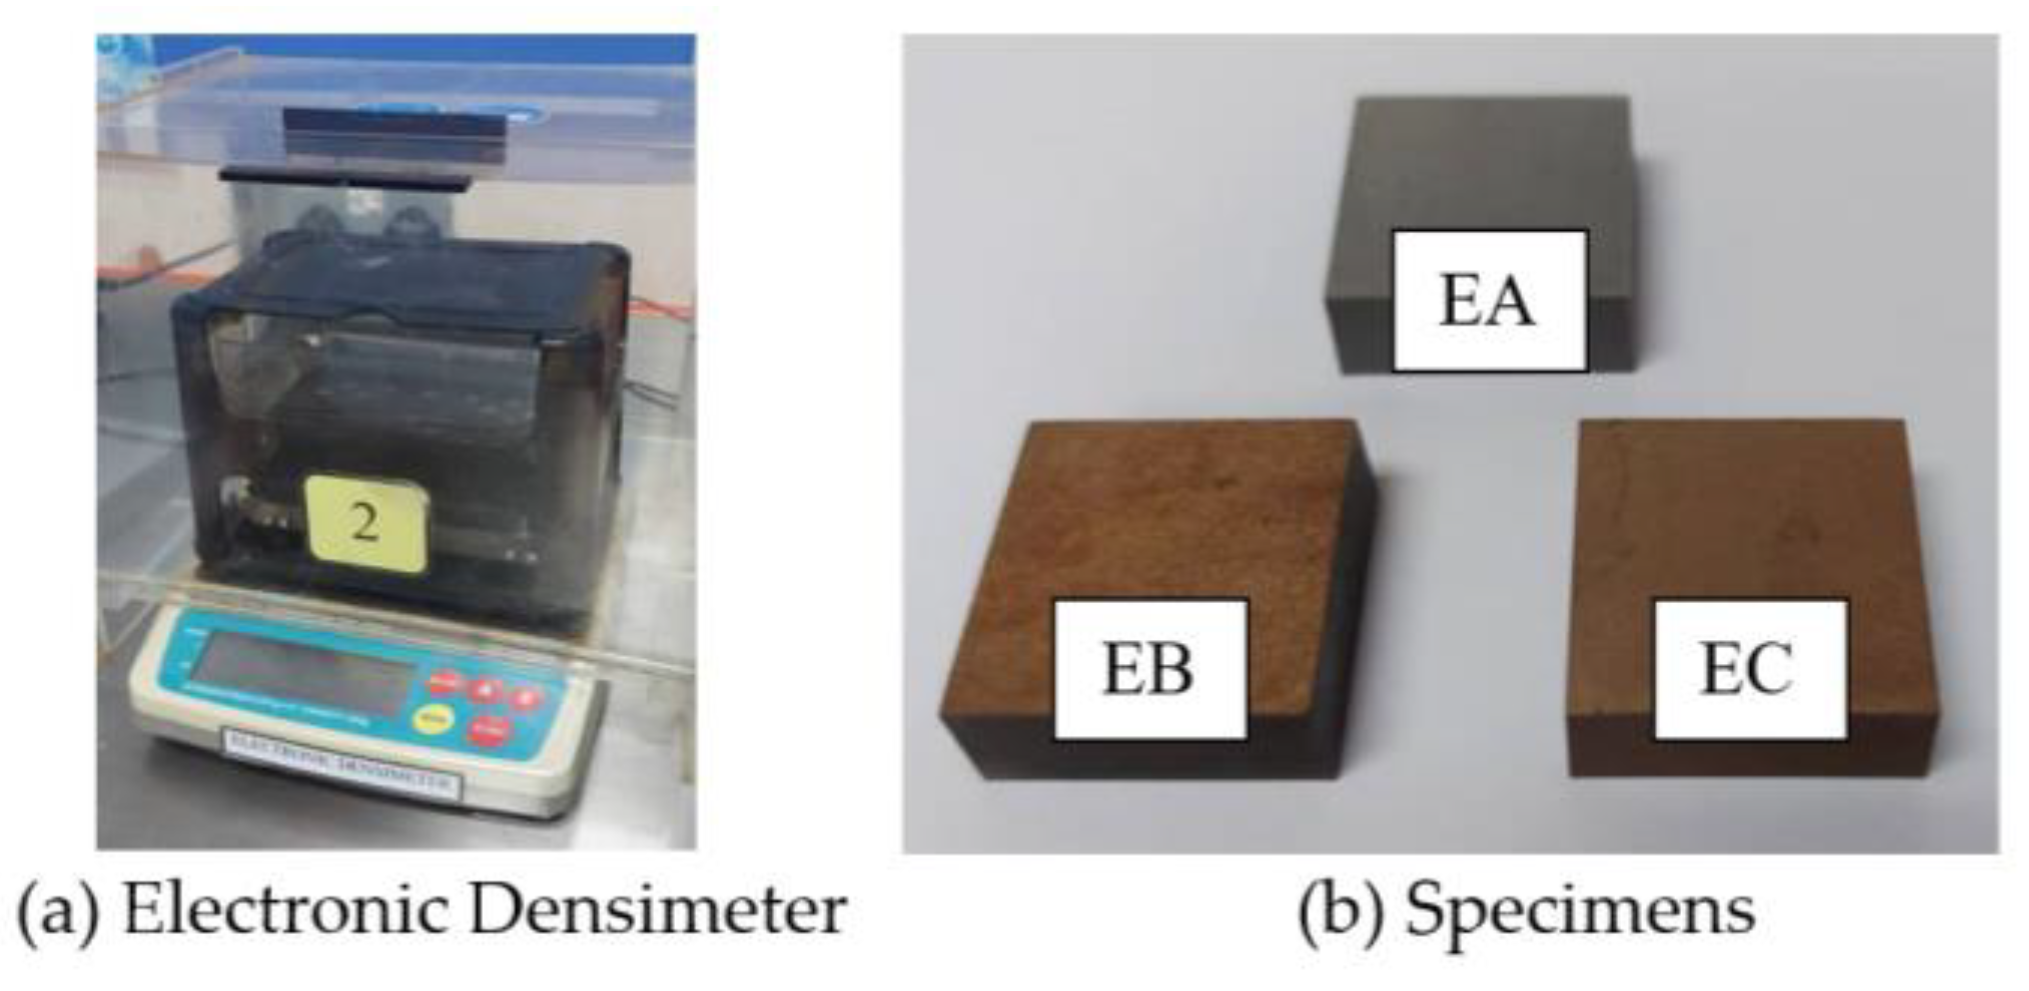
The density test was performed to identify the mass of the MEC specimen. The MEC specimen was weighed in air before it was immersed in a liquid to determine its relative density using an Electronic Densimeter (EW-300SG, EKTRON TEK Co., Ltd., City of Industry, CA, USA), as shown in Figure 7. This method is in accordance with ASTM D-792-20 [55]. The relative density, D (at 23 °C), was determined using the following Equation:
D = ab / ( a b + c d )
where D is the density, a is the mass of the specimen and wire in air, b is the mass of the wire in air, c is the mass of the wire with end immersed in water, and d is the mass of the wire and specimen immersed in water. Density data were collected from five specimens for each composition.

2.2.2. Hardness Test

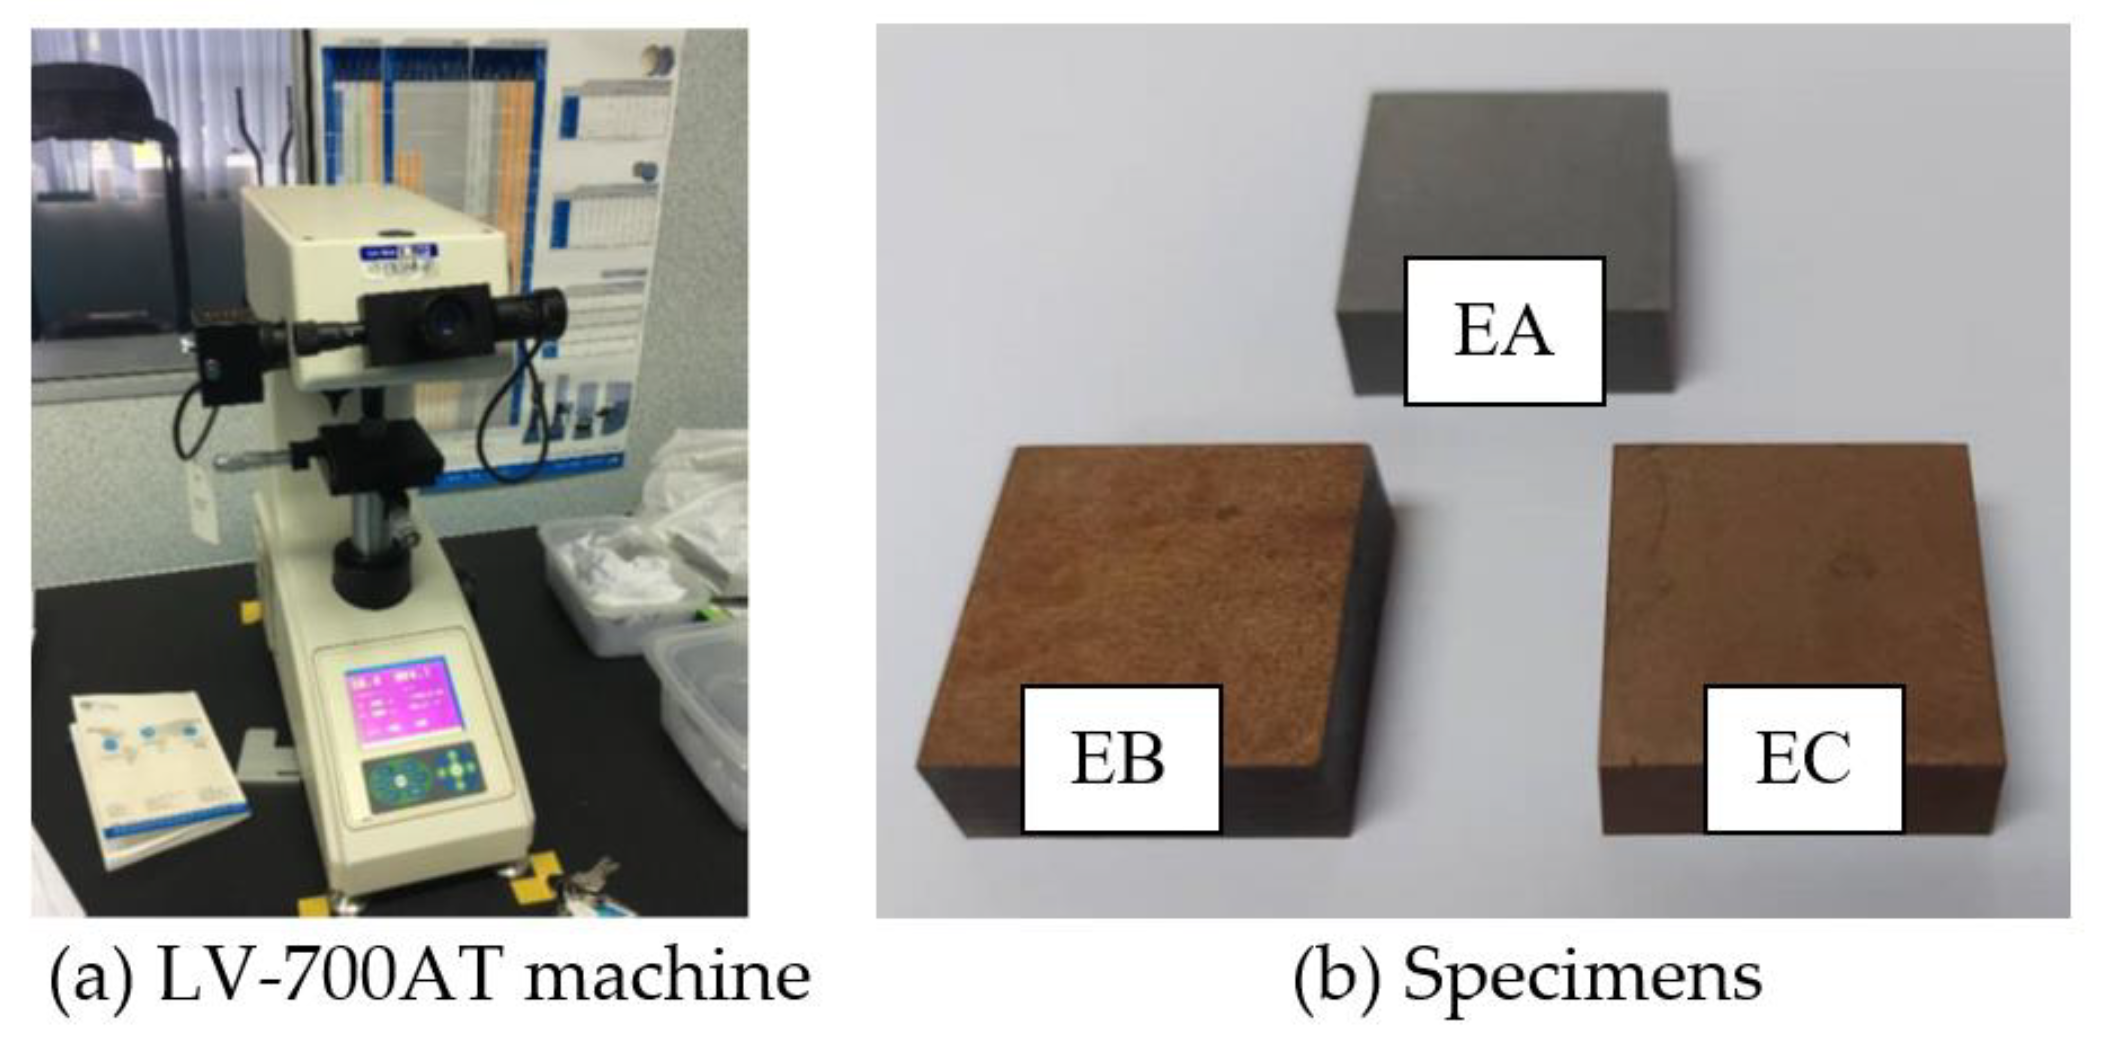
The measurement of a material’s strength and resistance to scratches and wear can be investigated by conducting a hardness test [31]. The durability and life of a mold are highly dependent on its hardness properties. Several tests that had been conducted by previous researchers [15,16,17,51] agreed that the addition of filler ratio could increase the hardness of composites significantly. In this study, the Vickers hardness (Hv) test method was carried out, referring to the standard ASTM D2240-97 [56]. Hv is measured with an LV-700AT machine, where the specimens for the hardness test are similar to disk samples or Brazilian test specimens, as shown in Figure 8. The diamond indenter produces an indentation that is measured based on an average of two diagonals by specifying a light load range and converting it to a hardness value using Equation (2), where Hv is Vickers hardness, F is the load (kgf), and d is the arithmetic mean of two diagonals, d1 and d2 (mm).
Hv = 1.854 F/d2

2.2.3. Compressive Strength Test

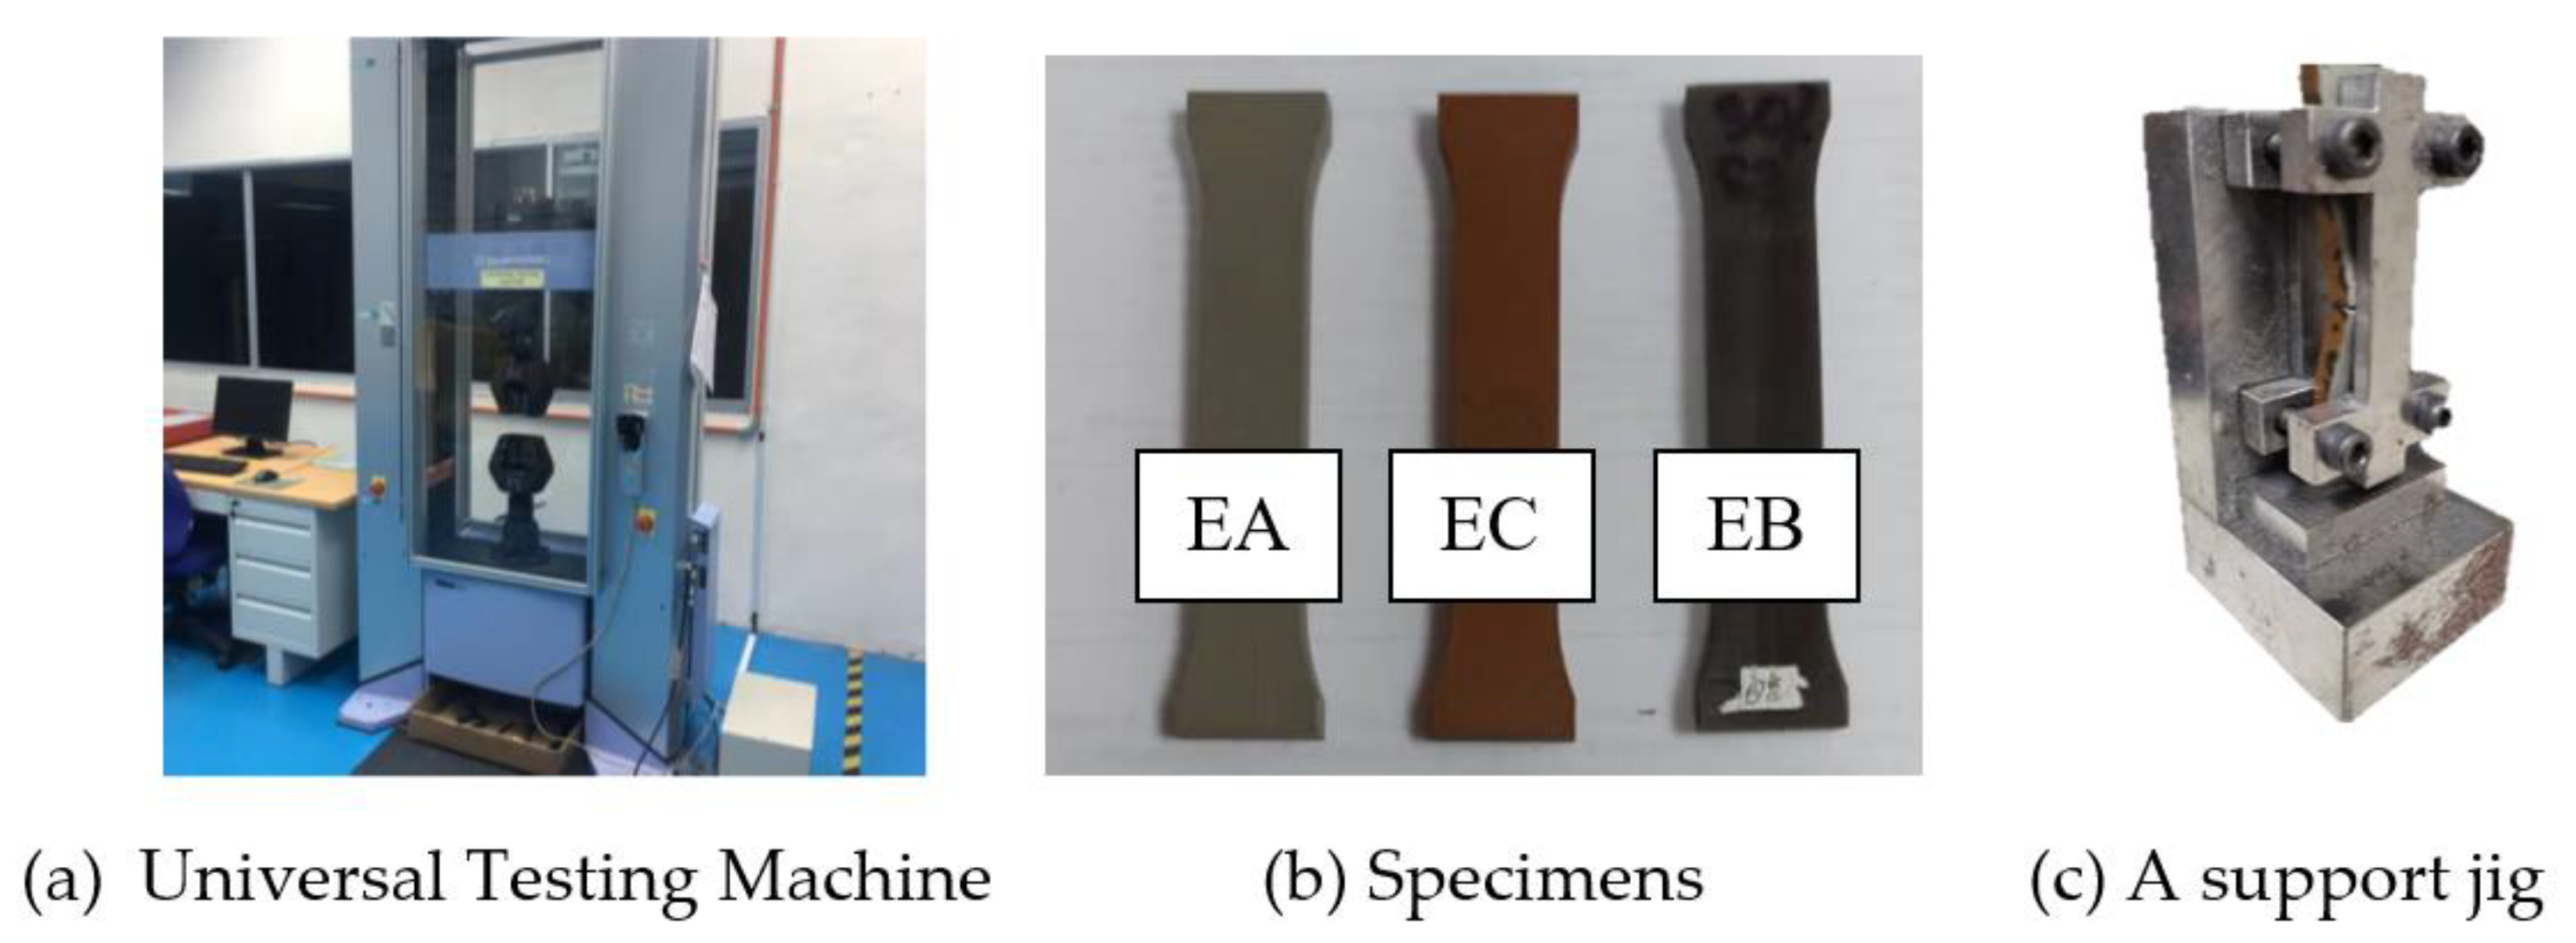
In the injection molding application, the compressive strength is needed to identify the suitable clamping force and packing pressure in the mold cavity [57]. Compression testing was performed using an Instron Universal Testing Machine (Instron 5900 Series 50 kN, Instron Corporation, Norwood, MA, USA), as shown in Figure 9a, which is usually used for tensile and compressive strengths. ASTM D 695 standard [58] was employed, considering that the MEC material is a rigid thermoset class of material and the specimens shown in Figure 9b were prepared with dimensions of 79.4 mm in length × 19 mm in width, while the neck measured 12.7 mm wide and 5 mm thick. A support jig for the compression test was equipped to handle the specimen right alongside the top and bottom plates, as indicated in Figure 9c. The top compression plate is set to move at 1.3 mm/min, and the load was gradually applied at 10 points per second. The load and displacement were recorded using Trapezium X software when the crosshead was moved downwards and facing the specimen.

2.2.4. Thermal Conductivity Test

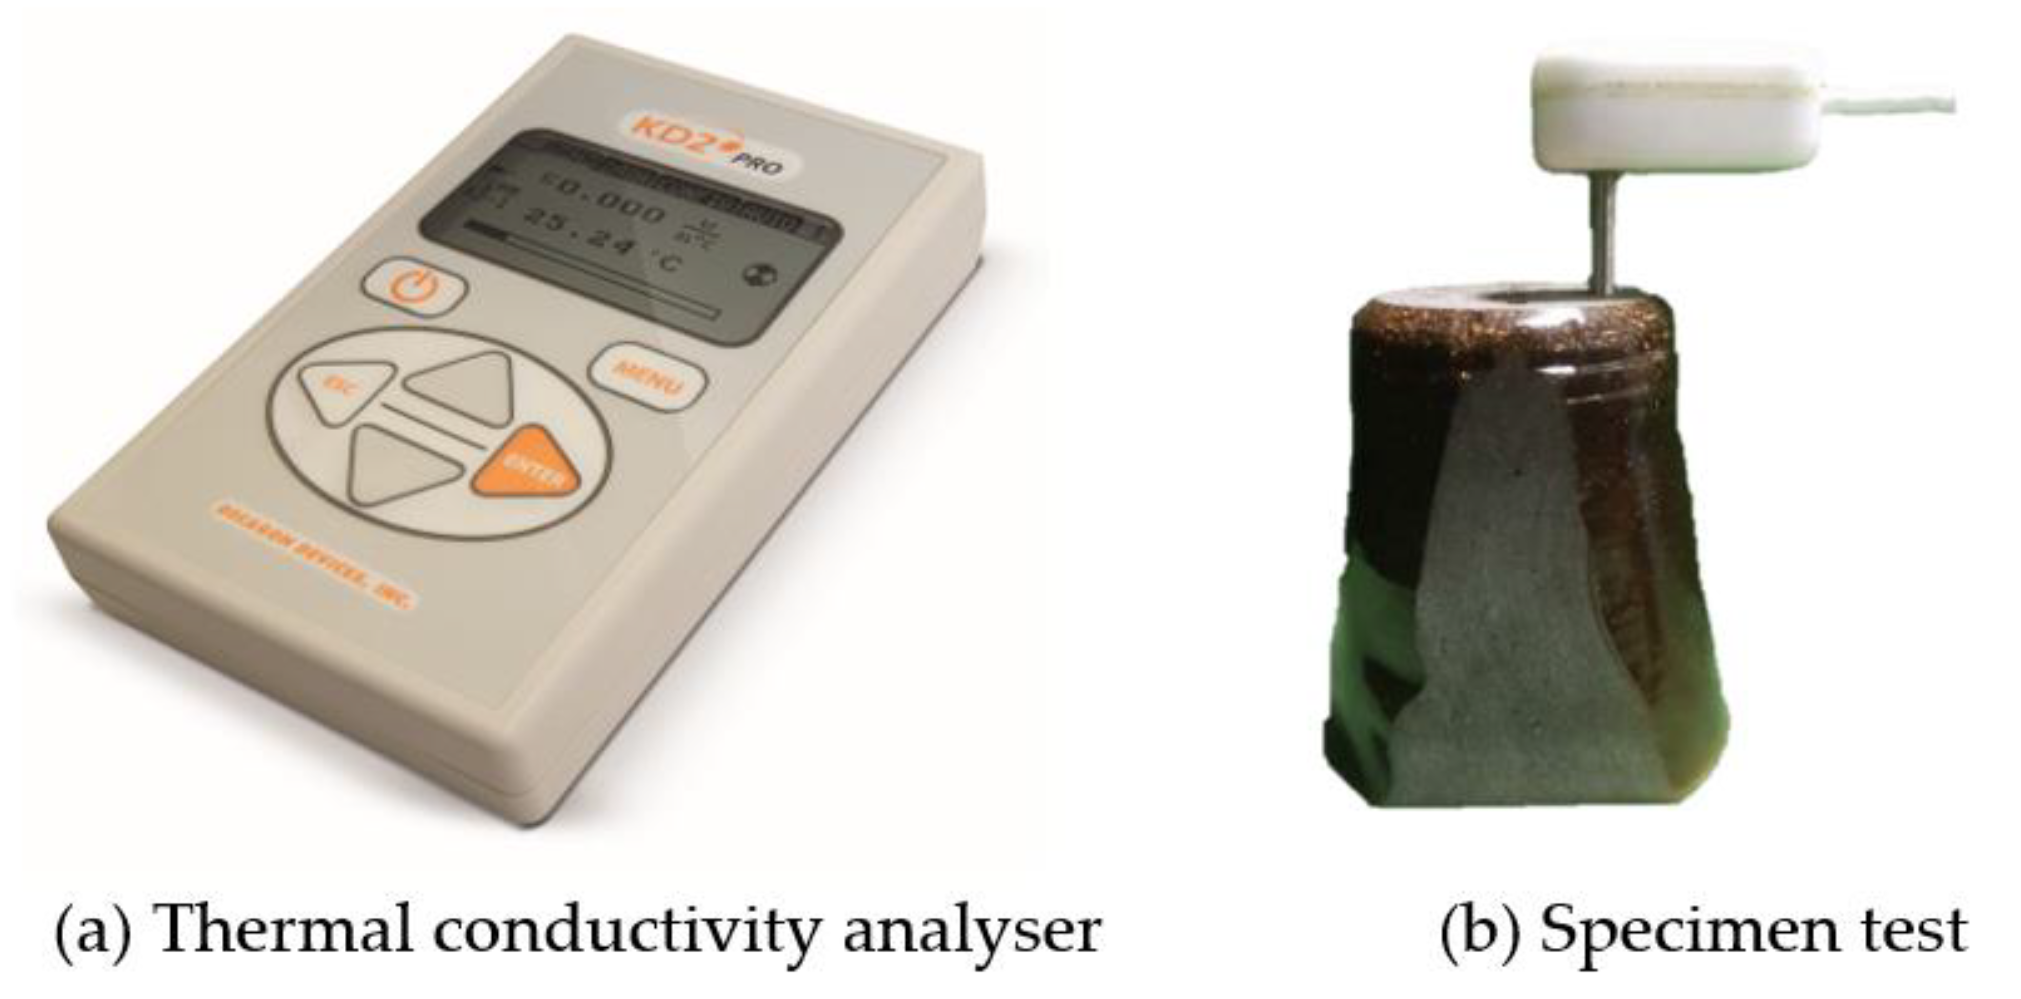
The mold insert was exposed to a thermal cycle during each cycle of the injection molding process, which includes the heating and cooling phases [17,22]. Hopkinson and Dickens [11] reported that filler material improved the thermal properties as well as contributed to a shorter cycle time in the injection molding process. Previous researchers found that the proportion of higher wt% filler particles will increase the thermal conductivity [4]. A Thermal Properties Analyzer (Decagon KD2 Pro, Decagon Devices Inc., Pullman, WA, USA) was used for this purpose (Figure 10). Five pieces of specimen were prepared, with each composition of filler having a dimension of 5 mm thickness × Ø 30 mm. The test was conducted using a thermal conductivity device, where there are sensors that are inserted into a hole drilled through the specimen.

2.2.5. Set-Up for Thermal Transient Analysis of Cooling Time

The cooling time of MEC mold inserts with various types of filler particles was determined using ANSYS software simulation. The properties of the MEC material can be improved by choosing a wt% of filler particles that is mixed according to how well the mixture performs. The materials that were chosen as mold inserts were (1) epoxy + brass (EB), (2) epoxy + copper (EC), and (3) epoxy + copper +brass (EBC). As previously mentioned, EA fillers are intended as benchmarks for the current study and only EB, EC, and EBC fillers are used for later studies, i.e., thermal transient analysis for cooling time on new formulations of MECs. The properties of the EB, EC, and EBC materials obtained from the physical and mechanical specimen tests were analyzed under conditions of high compression and high thermal conductivity, as shown in Table 3 and Table 4.
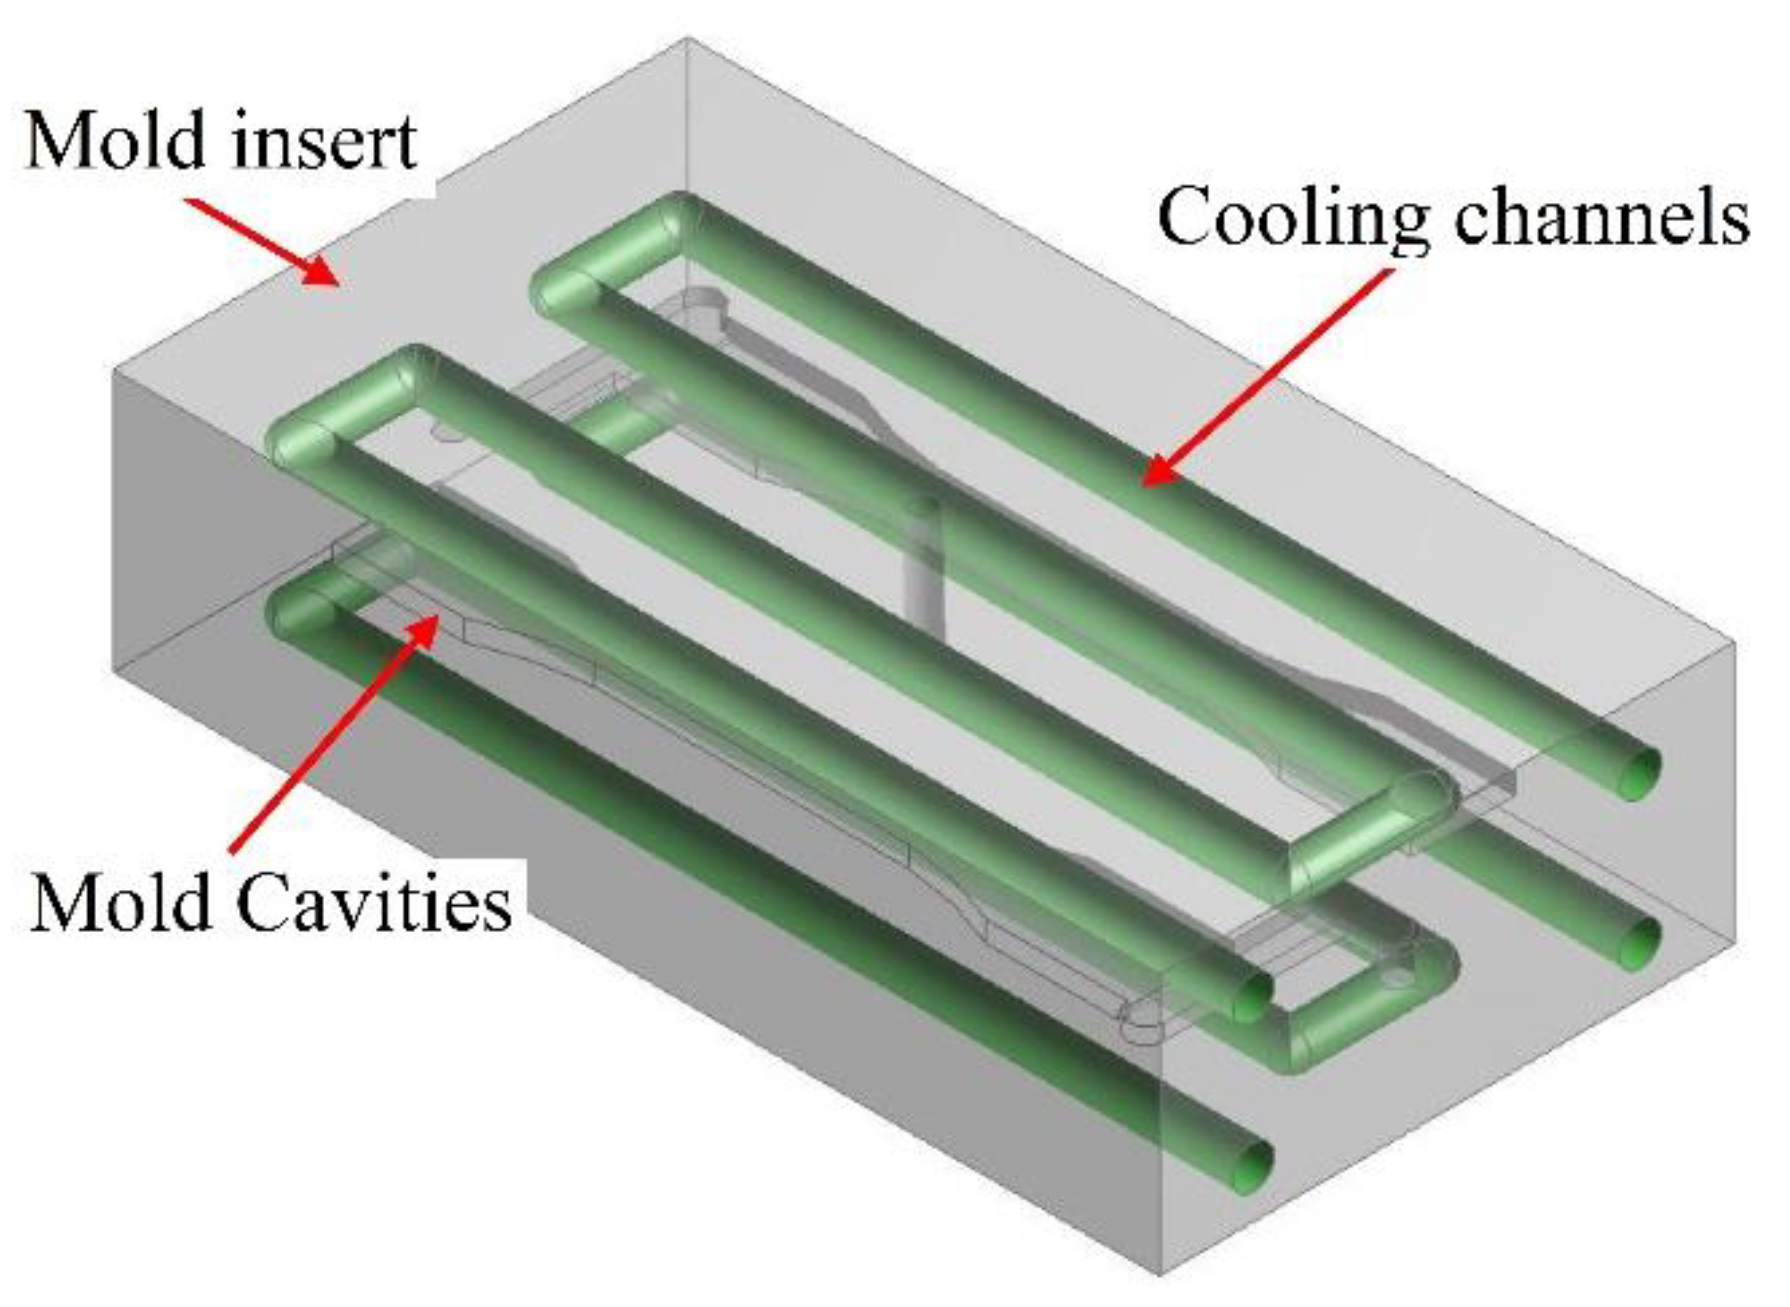
The 3D model for cavity inserts, as in Figure 11, was designed using Computer-Aided Design (Solidworks 2014, Dassault Systèmes, S. A., Suresnes, France), based on the international standard ISO 3167: 2014 (E) [59] with regard to the mold insert design. The parameterization of this simulation is divided into two stages: a heating phase for melting the material and a cooling phase for shaping the part and reaching the ejection temperature, as shown in Table 5.

3. Result of Material Properties Testing of EA, EB, and EC

The filler compositions of aluminum, copper, and brass were tested to understand their response to physical, mechanical, and thermal tests. Furthermore, the findings of these tests are used to determine the composition suitable for the fabrication of mold inserts. The tests consist of density, hardness, compressive strength, and thermal conductivity. ANSYS simulation results show an increase in the cooling time performance of the mold insert to be produced.

3.1. Density Test Result

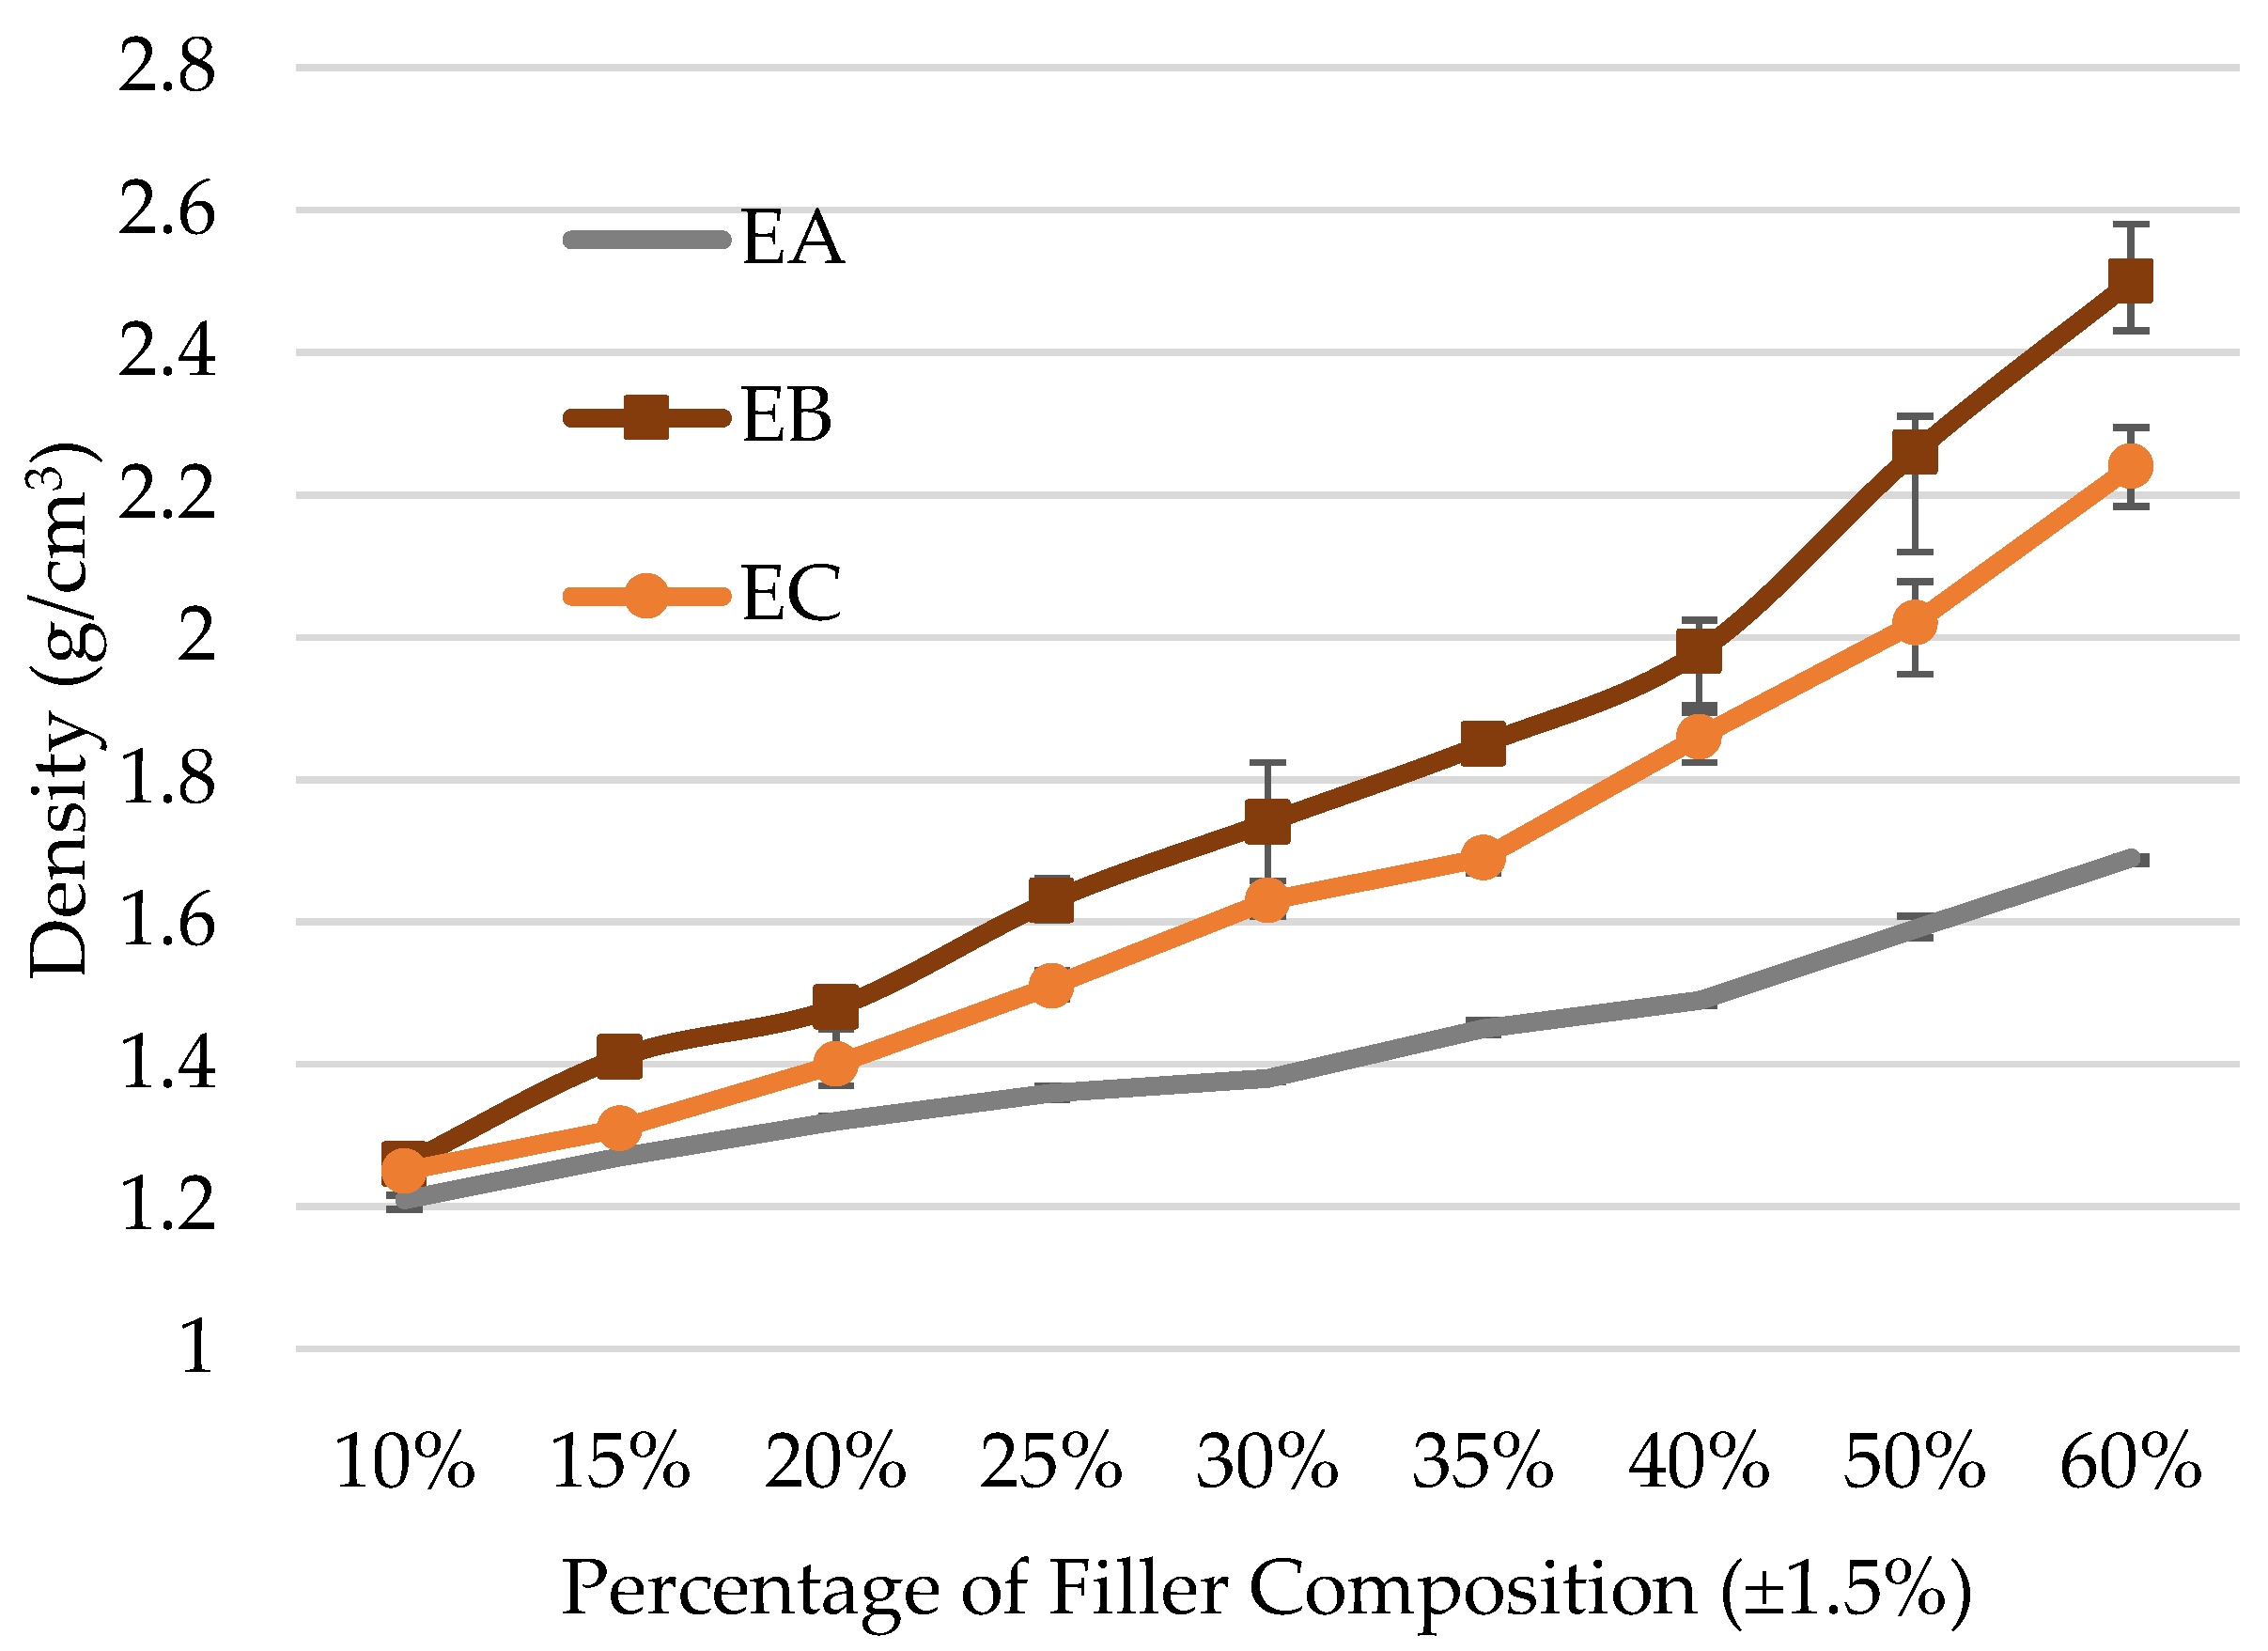
Based on the density tests performed, the addition of metal fillers in the epoxy increases the density of the material. Table 6 shows a summary of the density values of EA, EB, and EC. From the test results, the average densities for EA, EB, and EC epoxy reported were in the range of 1.21 g/cm3 to 2.50 g/cm3. Figure 12 shows a graph of density against percentage of filler composition for EA, EB, and EC filler mixtures. An increasing linear trend was observed when the fillers were added to the epoxy from a composition of 10 wt% to 60 wt.%. For the density value at 60% wt, EB is the highest at 2.50 g/cm3, followed by EC at 2.24 g/cm3 and EA at 1.69 g/cm3. This phenomenon indicates that the density values of brass and copper fillers are higher than those of aluminum fillers. Therefore, the volume of brass, copper, and aluminum fillers in epoxy increases when the mass of the compositions of EA, EB, and EC are increased, directly increasing the density value. Similar trends were recorded where the density increases with the addition of the percentage of metals and non-metals in the epoxy mixture, as reported in previous studies [15,16,22,60].

3.2. Hardness Test Results

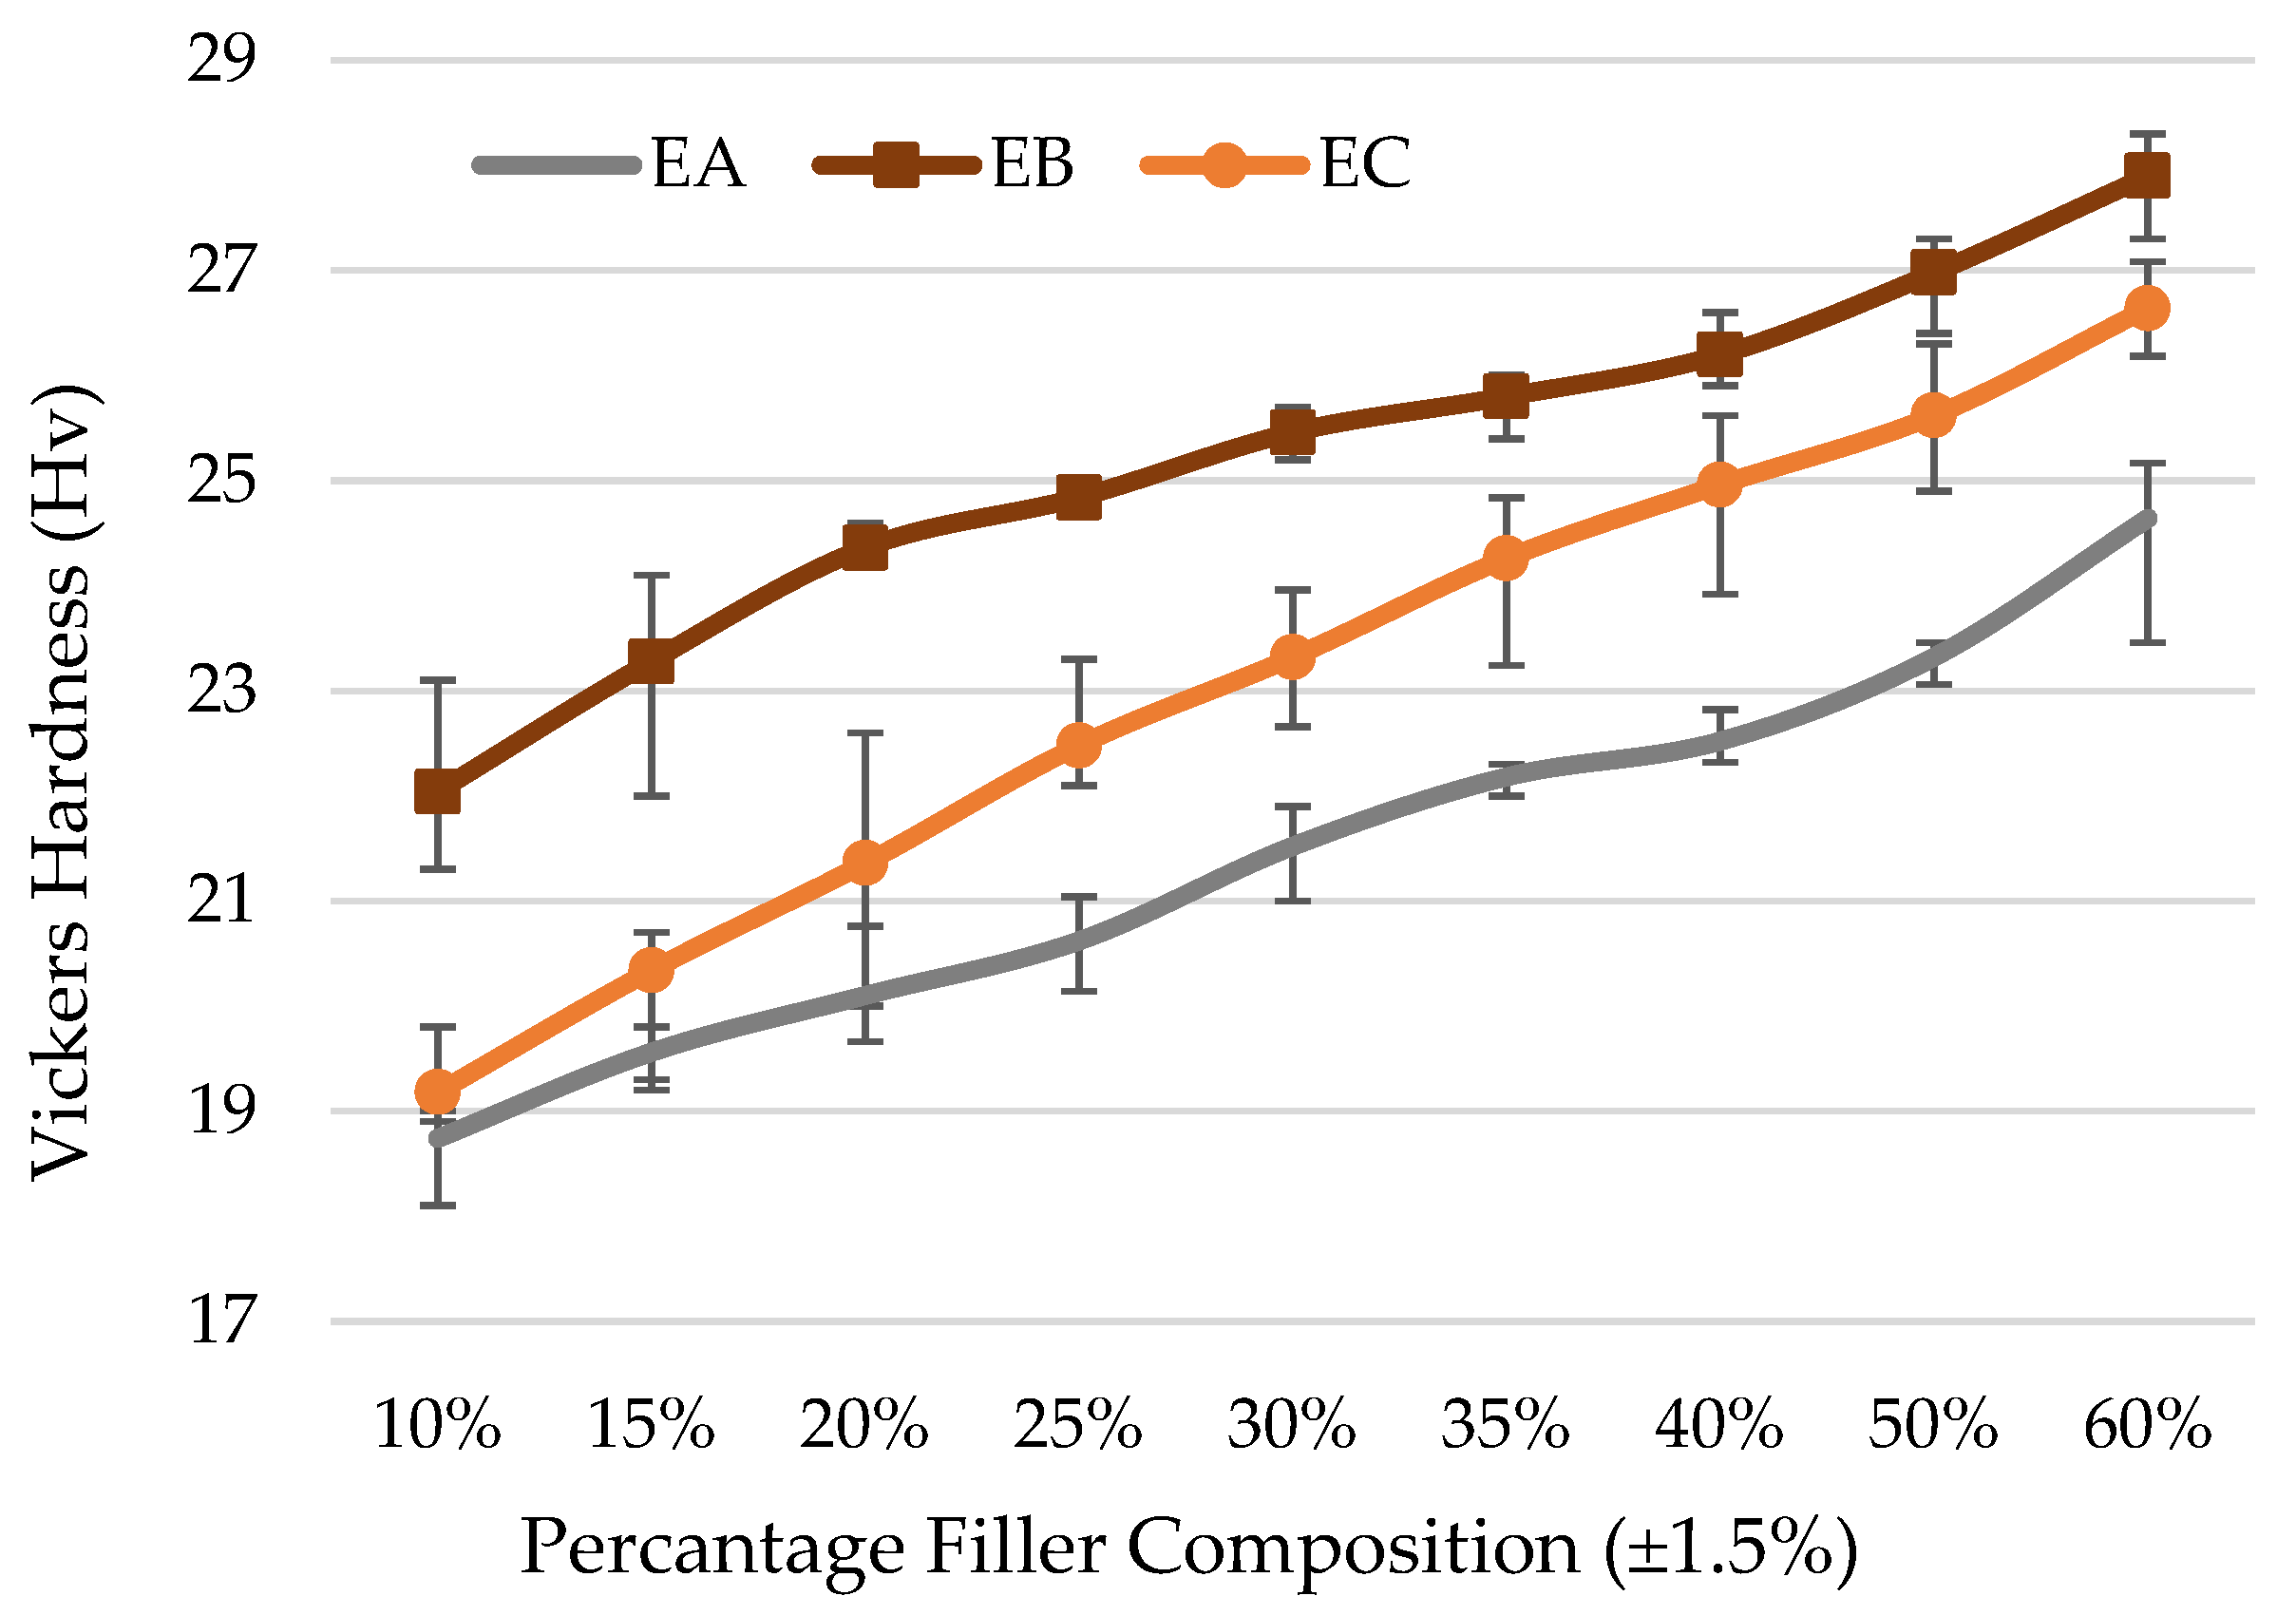
Hardness value average data for EA, EB, and EC are tabulated in Table 7. Figure 13 shows the distribution of Hv value with different percentage filler compositions. The trend for all three filler materials, EA, AB, and EC, showed a linear uptrend when the filler composition increased. Brass fillers showed superior hardness properties compared with copper and aluminum fillers. The hardness curve showed an upward trend, with a positive slope for all fillers. This result is in line with the findings from previous researchers [15,16,17,33], who concluded that material hardness increased gradually as the percentage filler material increased.

3.3. Compressive Strength Test Results

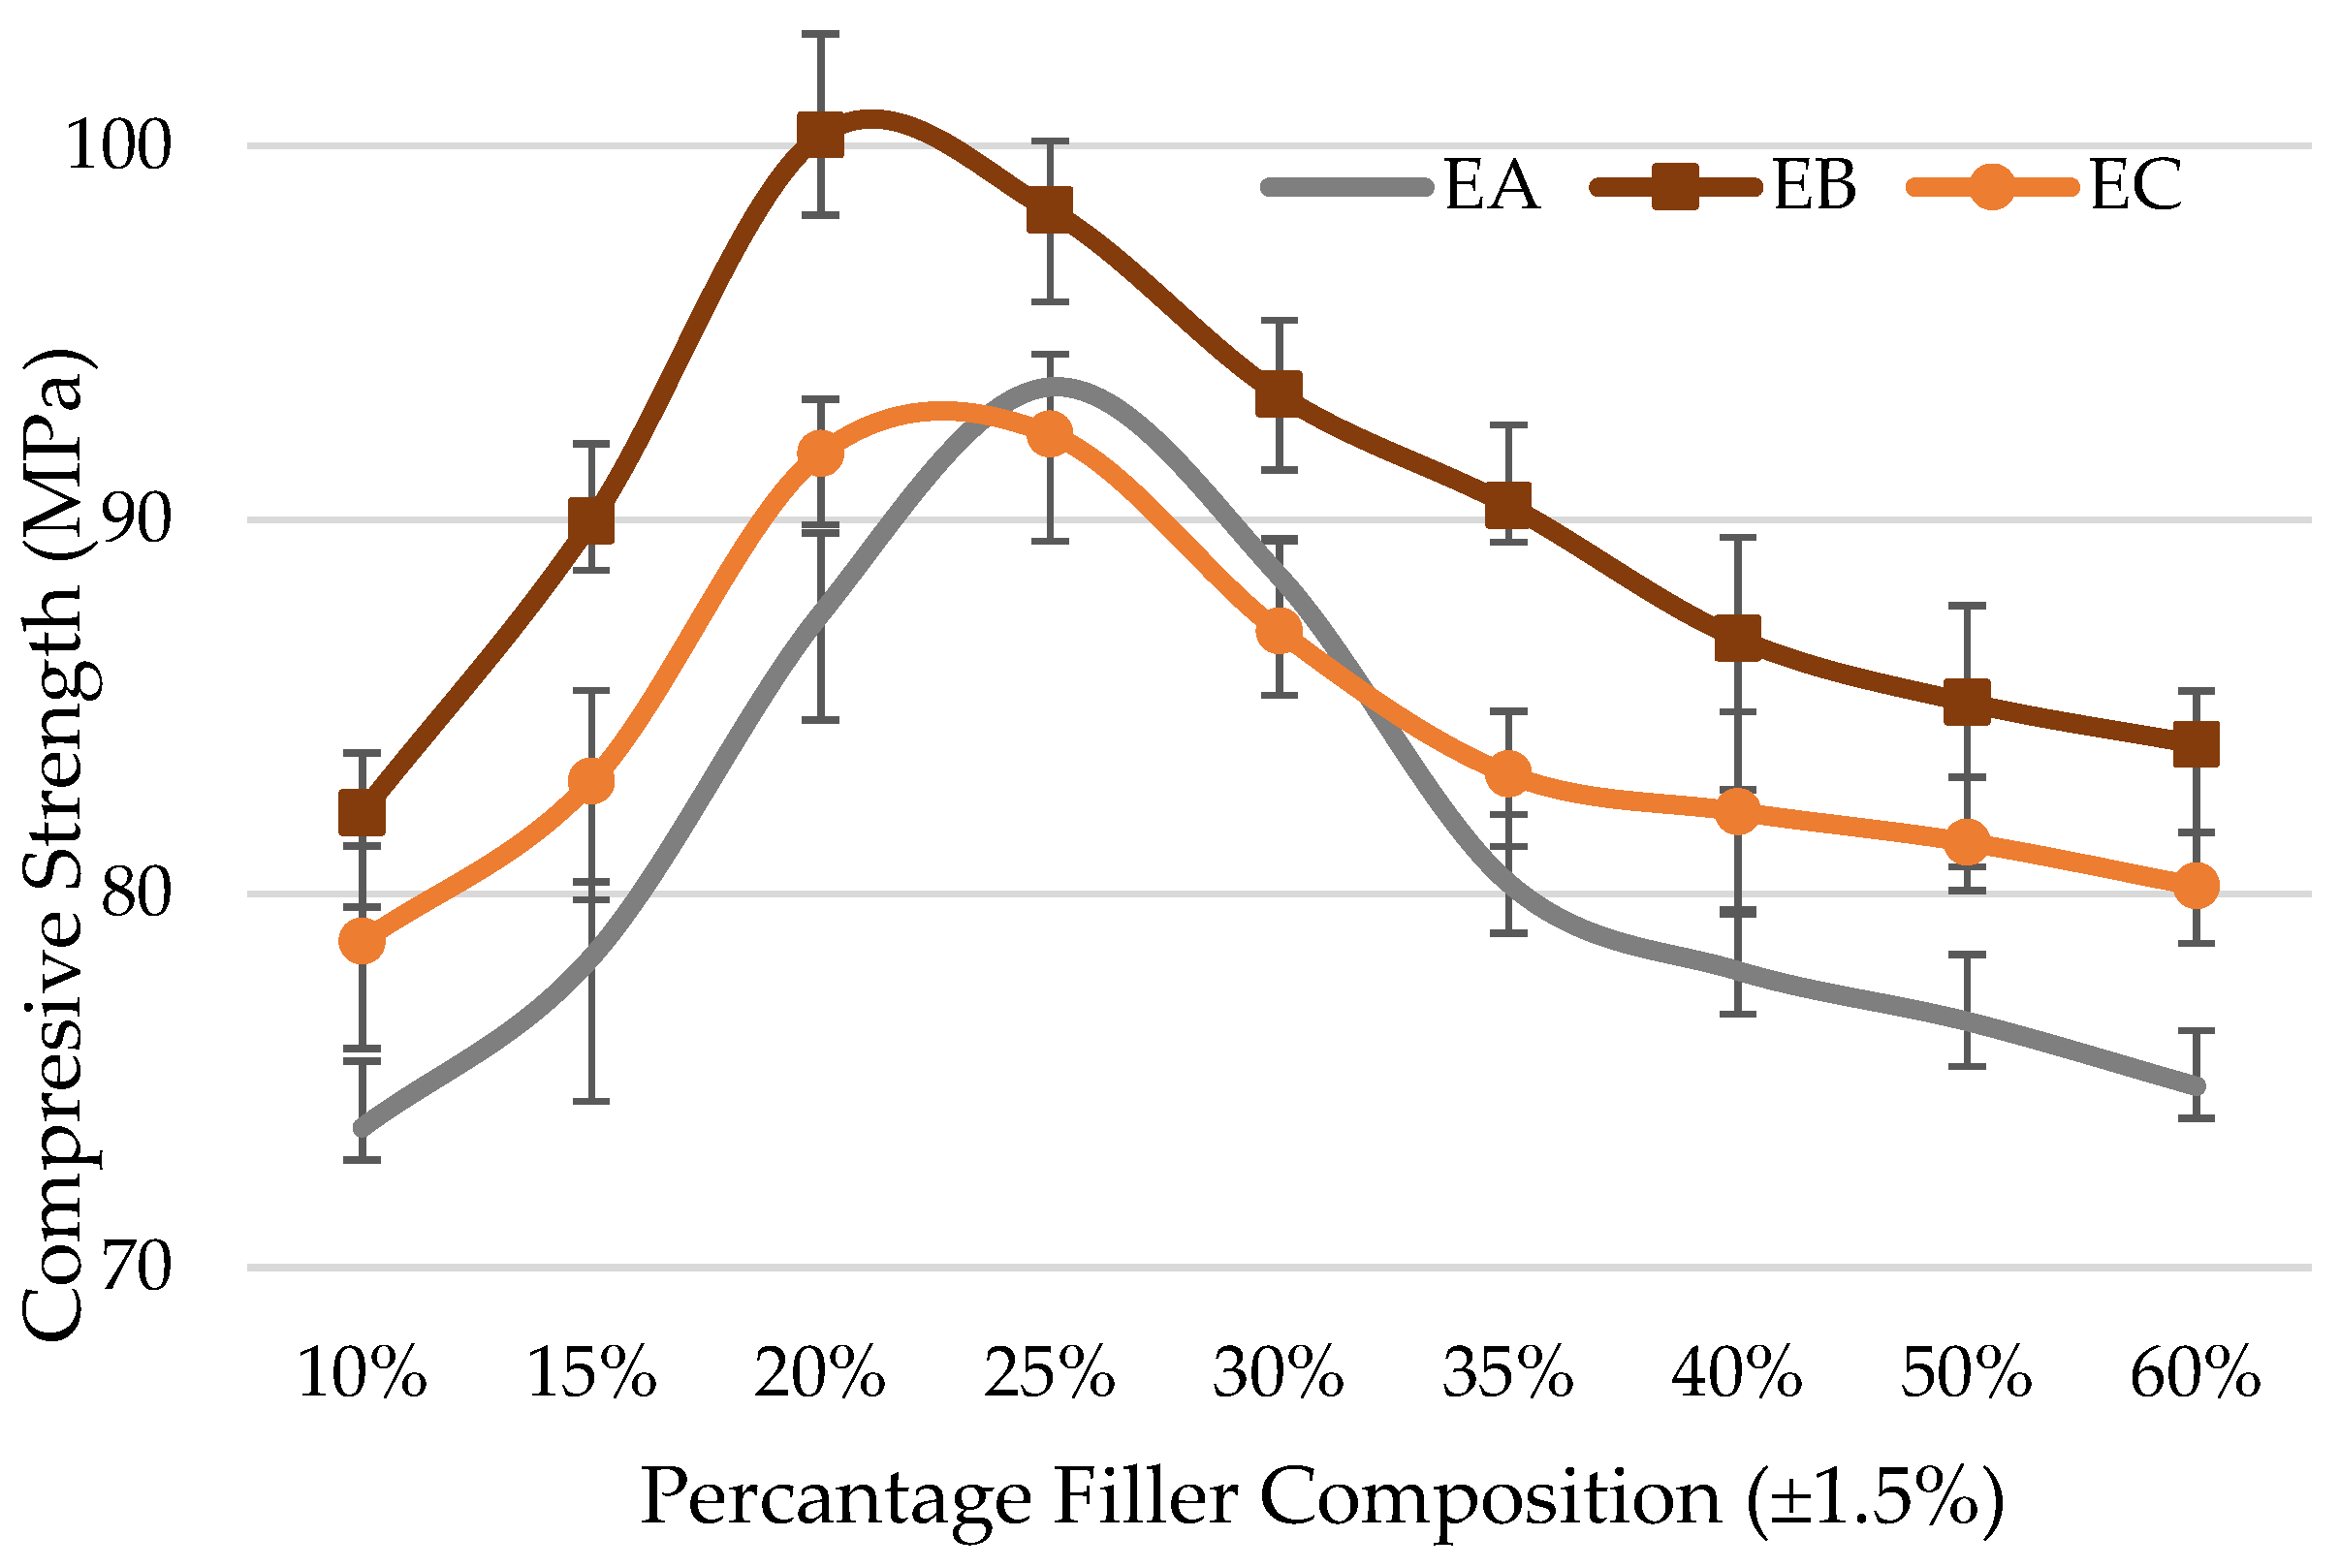
After the compression test, it was observed that the majority of specimens showed permanent fracture or deflection at the center area once the maximum load was reached. Table 8 shows a summary of the compression test values of EA, EB, and EC. EA, EB, and EC fillers at 20%–25 wt.% compositions had the highest average compressive strength of 93.56 MPa, 100.29 MPa, and 92.30 MPa, respectively, as shown in Figure 14. Referring to Table 8 and Figure 12, EB indicated higher values, followed by EA and EC. All fillers experienced a decrease in compressive strength after 25%–30 wt.% composition. This phenomenon was similar to previous studies [15,16,22,61], which also found that a decrease in compressive strength between the filler wt% and the compressive strength was obtained with higher values at 20%–30 wt.% composition. This is because adding fillers in excess amounts—more than 30 wt.%—could cause the epoxy matrix to become viscous and hold less compressive strength. In this instance, the fillers are agglomerated and the porosity increases, resulting in reduced material stiffness.

3.4. Thermal Conductivity Test Results

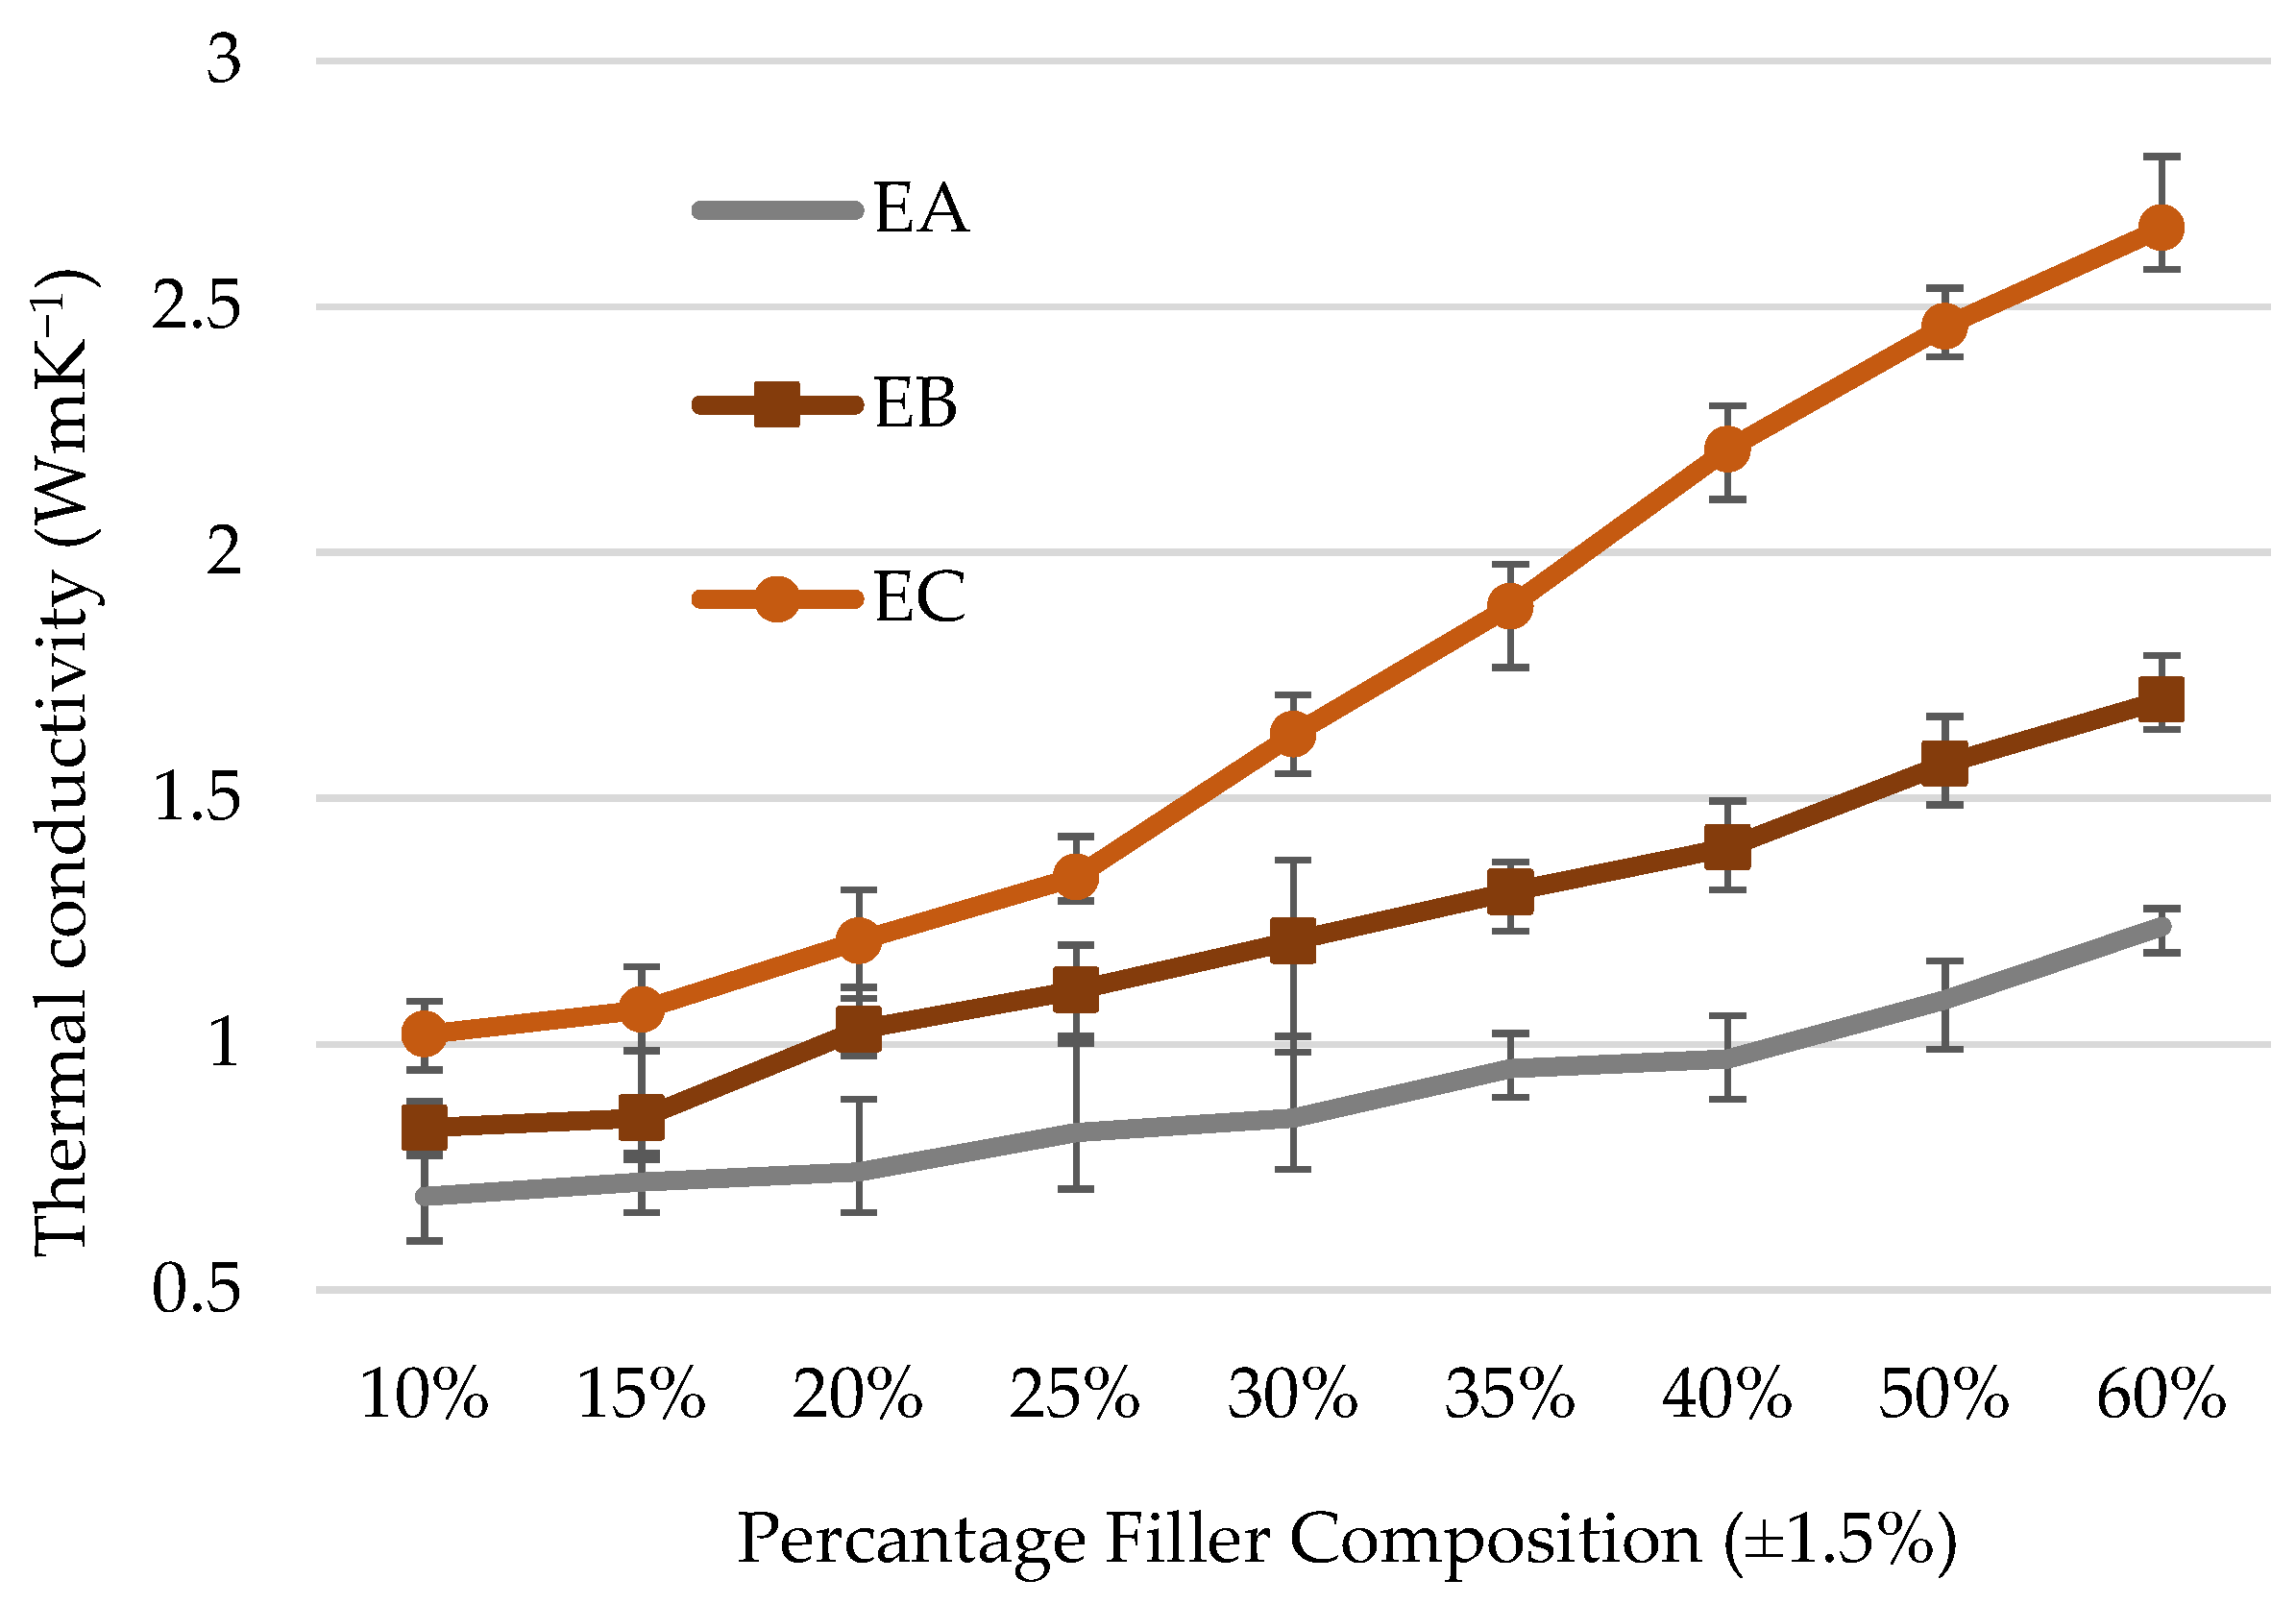
Thermal conductivity for EA, EB, and EC of the filler composition are shown in Table 9. In the case of irregular shaped filler (EB and EC), copper filler has a higher thermal conductivity than brass filler, as presented in Figure 15. The trend on thermal conductivity for copper fillers showed a rapid increase when their weight composition exceeded 15%. Meanwhile, the brass filler in EB presented a gradual increase and only appeared obvious after 30–35%. In addition, thermal conductivity value at low compositions, i.e. less than 10% wt was insignificant due to the diffusion effect in the bulk matrix, which happened without interaction. Overall, the addition of filler particles promotes the increase in thermal conductivity of the composites, as previously found in [4,7,17,22,29,62,63].
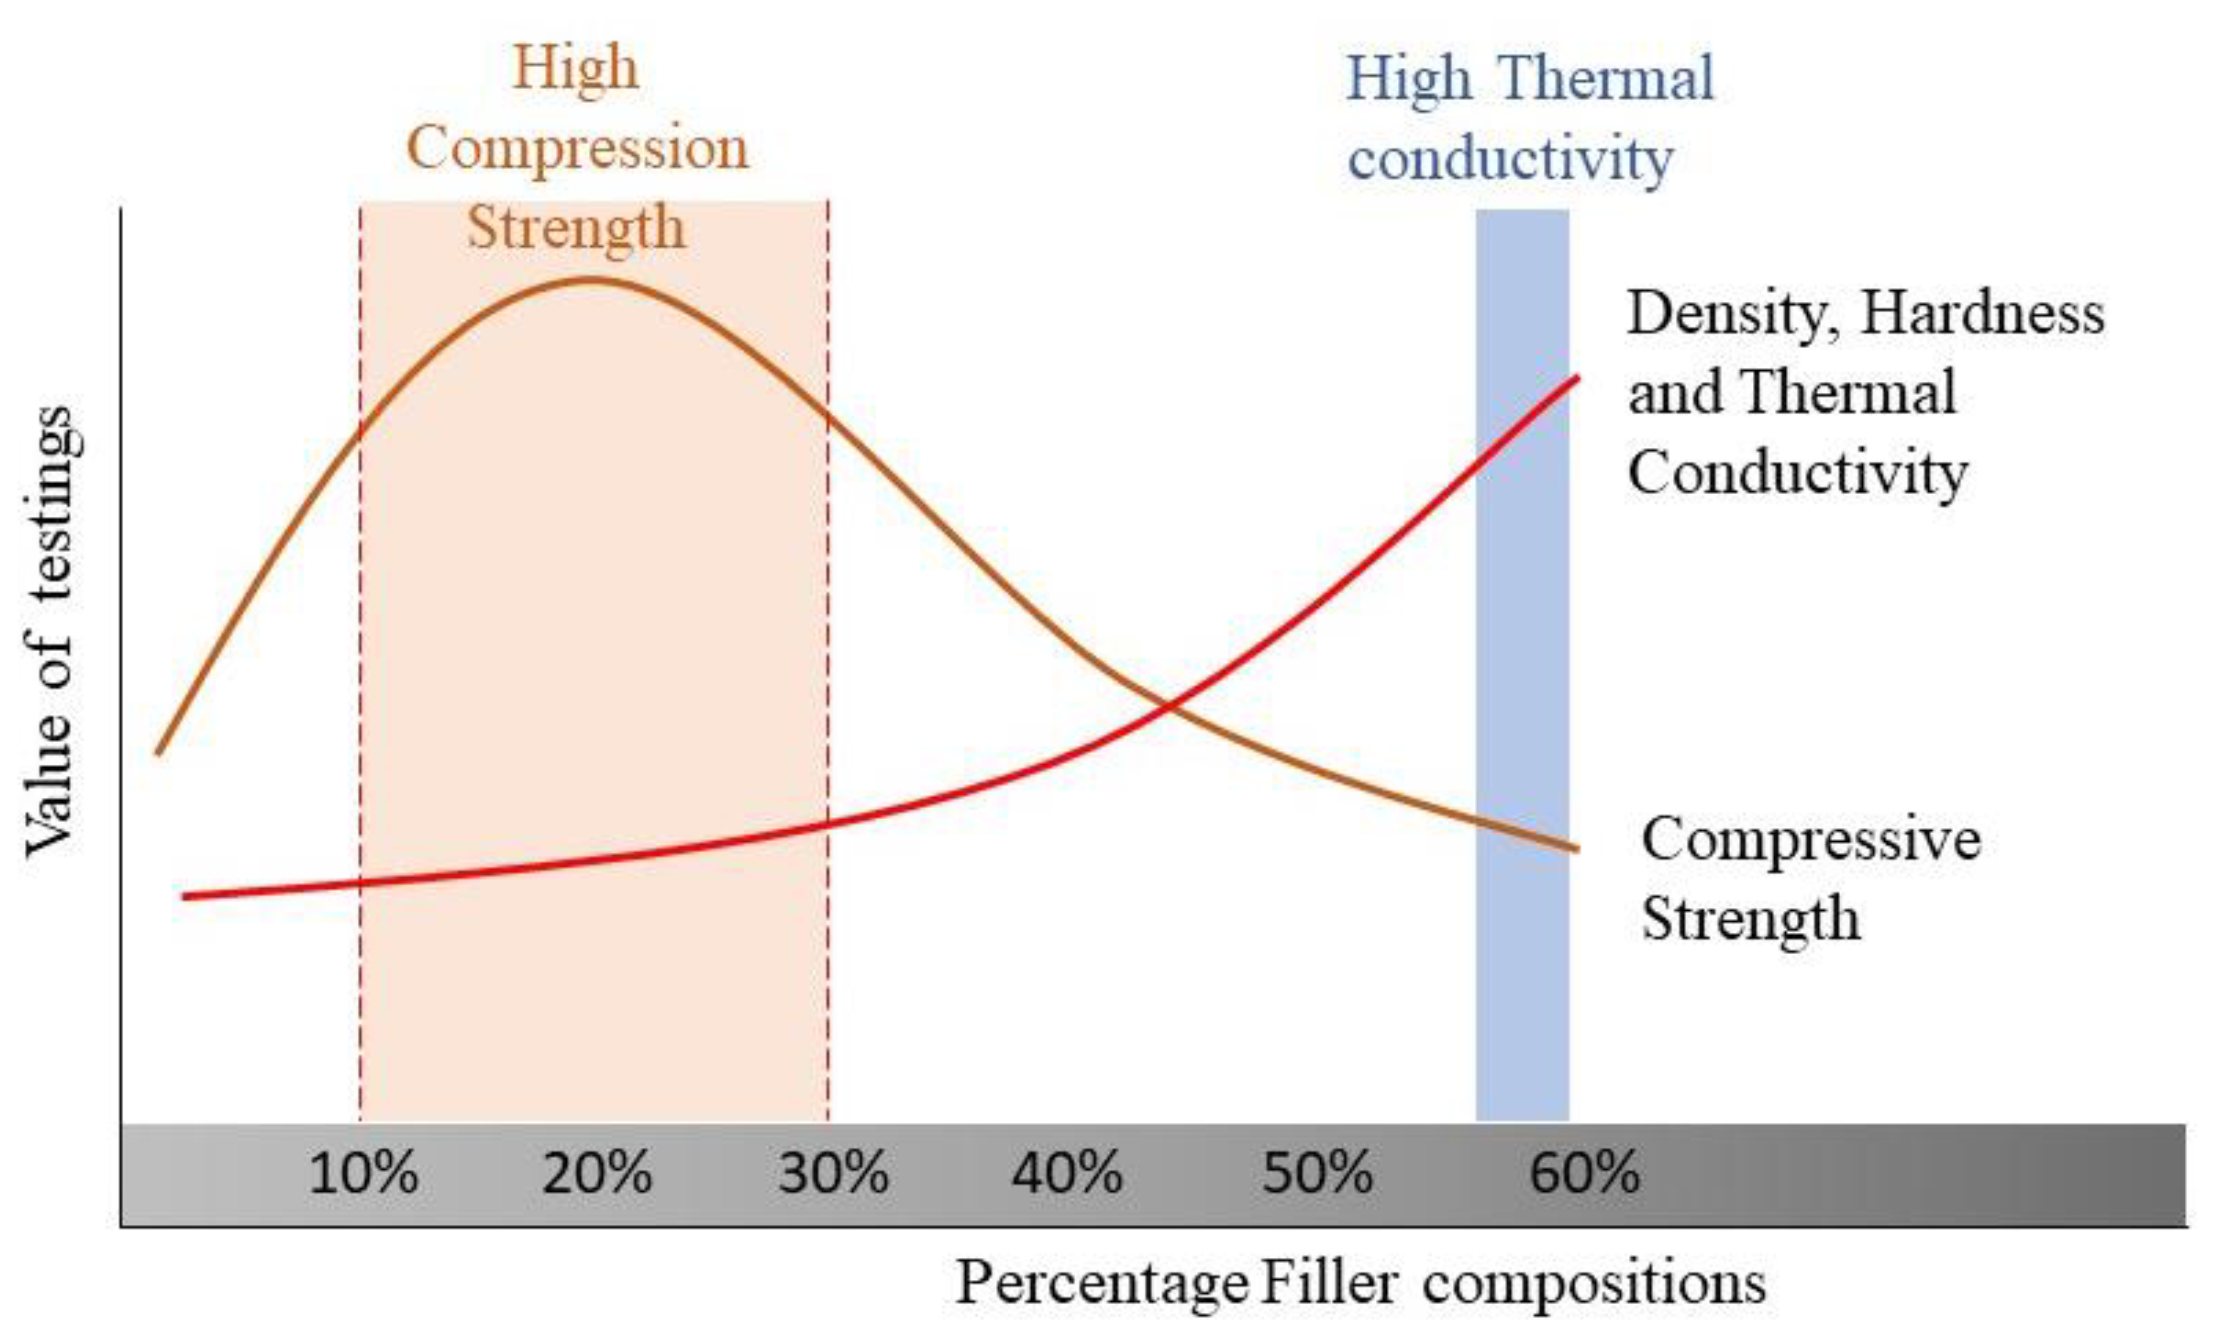
Based on tests conducted on MEC composite materials, the effect of filler trend is required to facilitate the selection of filler type and appropriate percentage composition in improving material properties prior to making mold inserts. The values of density, hardness, and thermal conductivity of the filled EA, EB, and EC indicate a linear upward flow with an increase in composition from 10% to 60%, with the highest values at the highest percentage of filler composition. The density of EA increased from 1.21 g/cm3 to 1.69 g/cm3, for EB from 1.26 g/cm3 to 2.50 g/cm3, and for EC from 1.25 g/cm3 to 2.24 g/cm3 at 10 % to 60% of filler to epoxy weight ratio. The density of EB showed the highest value compared to EC and EA. The hardness of EA increased from 18.74 Hv to 24.48 Hv, for EB from 22.04 Hv to 27.90 Hv, and for EC from 19.18 Hv to 25.36 Hv at 10% to 60% of filler to epoxy weight ratio. The hardness of EB showed the highest value compared to EC and EA. At 10% to 60% of the filler to epoxy weight ratio, the thermal conductivity of EA increased from 0.69 W/mK to 1.24 W/mK, that of EB from 0.83 W/m·K to 1.70 W/m·K, and that of EC from 1.02 W/mK to 2.66 W/mK. The thermal conductivity of EC showed the highest value compared to EB and EA. Compression strength for EA, EB, and EC indicated a nonlinear trend with decreasing effect when increasing composition was more than 25%. Adding filler composition increases compression strength, with the highest average value compression occurring between 20% and 25% of the total filler composition. The compressive strength of EA and EC only increased by 25% from the average value of 93.53 MPa for EA and 92.30 MPa for EC. The values were reduced at 30 wt.%, as depicted in the results. EB exhibited a higher compressive strength of 100.29 MPa at 20 wt.% as compared to EA and EC, and adding brass filler contents beyond 20 wt.% composition reduced the strength value. MEC material testing against applications has also been investigated. Theoretically, the trend of the test results is as depicted in Figure 16.
Based on Figure 14, there are two important factors that need to be considered, i.e., choosing the percentage composition for high compressive strength or at high thermal conductivity. From the graph, it can be seen that most researchers as well as manufacturers of resins for tooling used filler particle compositions to yield high compressive strengths at compositions ranging between 10% to 30% [15,16,17,22,29,50,51,52,53]. The more filler particles mixed into the resin, the more viscous the mixture becomes, making it impossible to perform a perfect casting process for complex shapes, causing porosity and making the material more brittle.

3.5. EBC Filler Testing for Compressive Strength and Thermal Conductivity

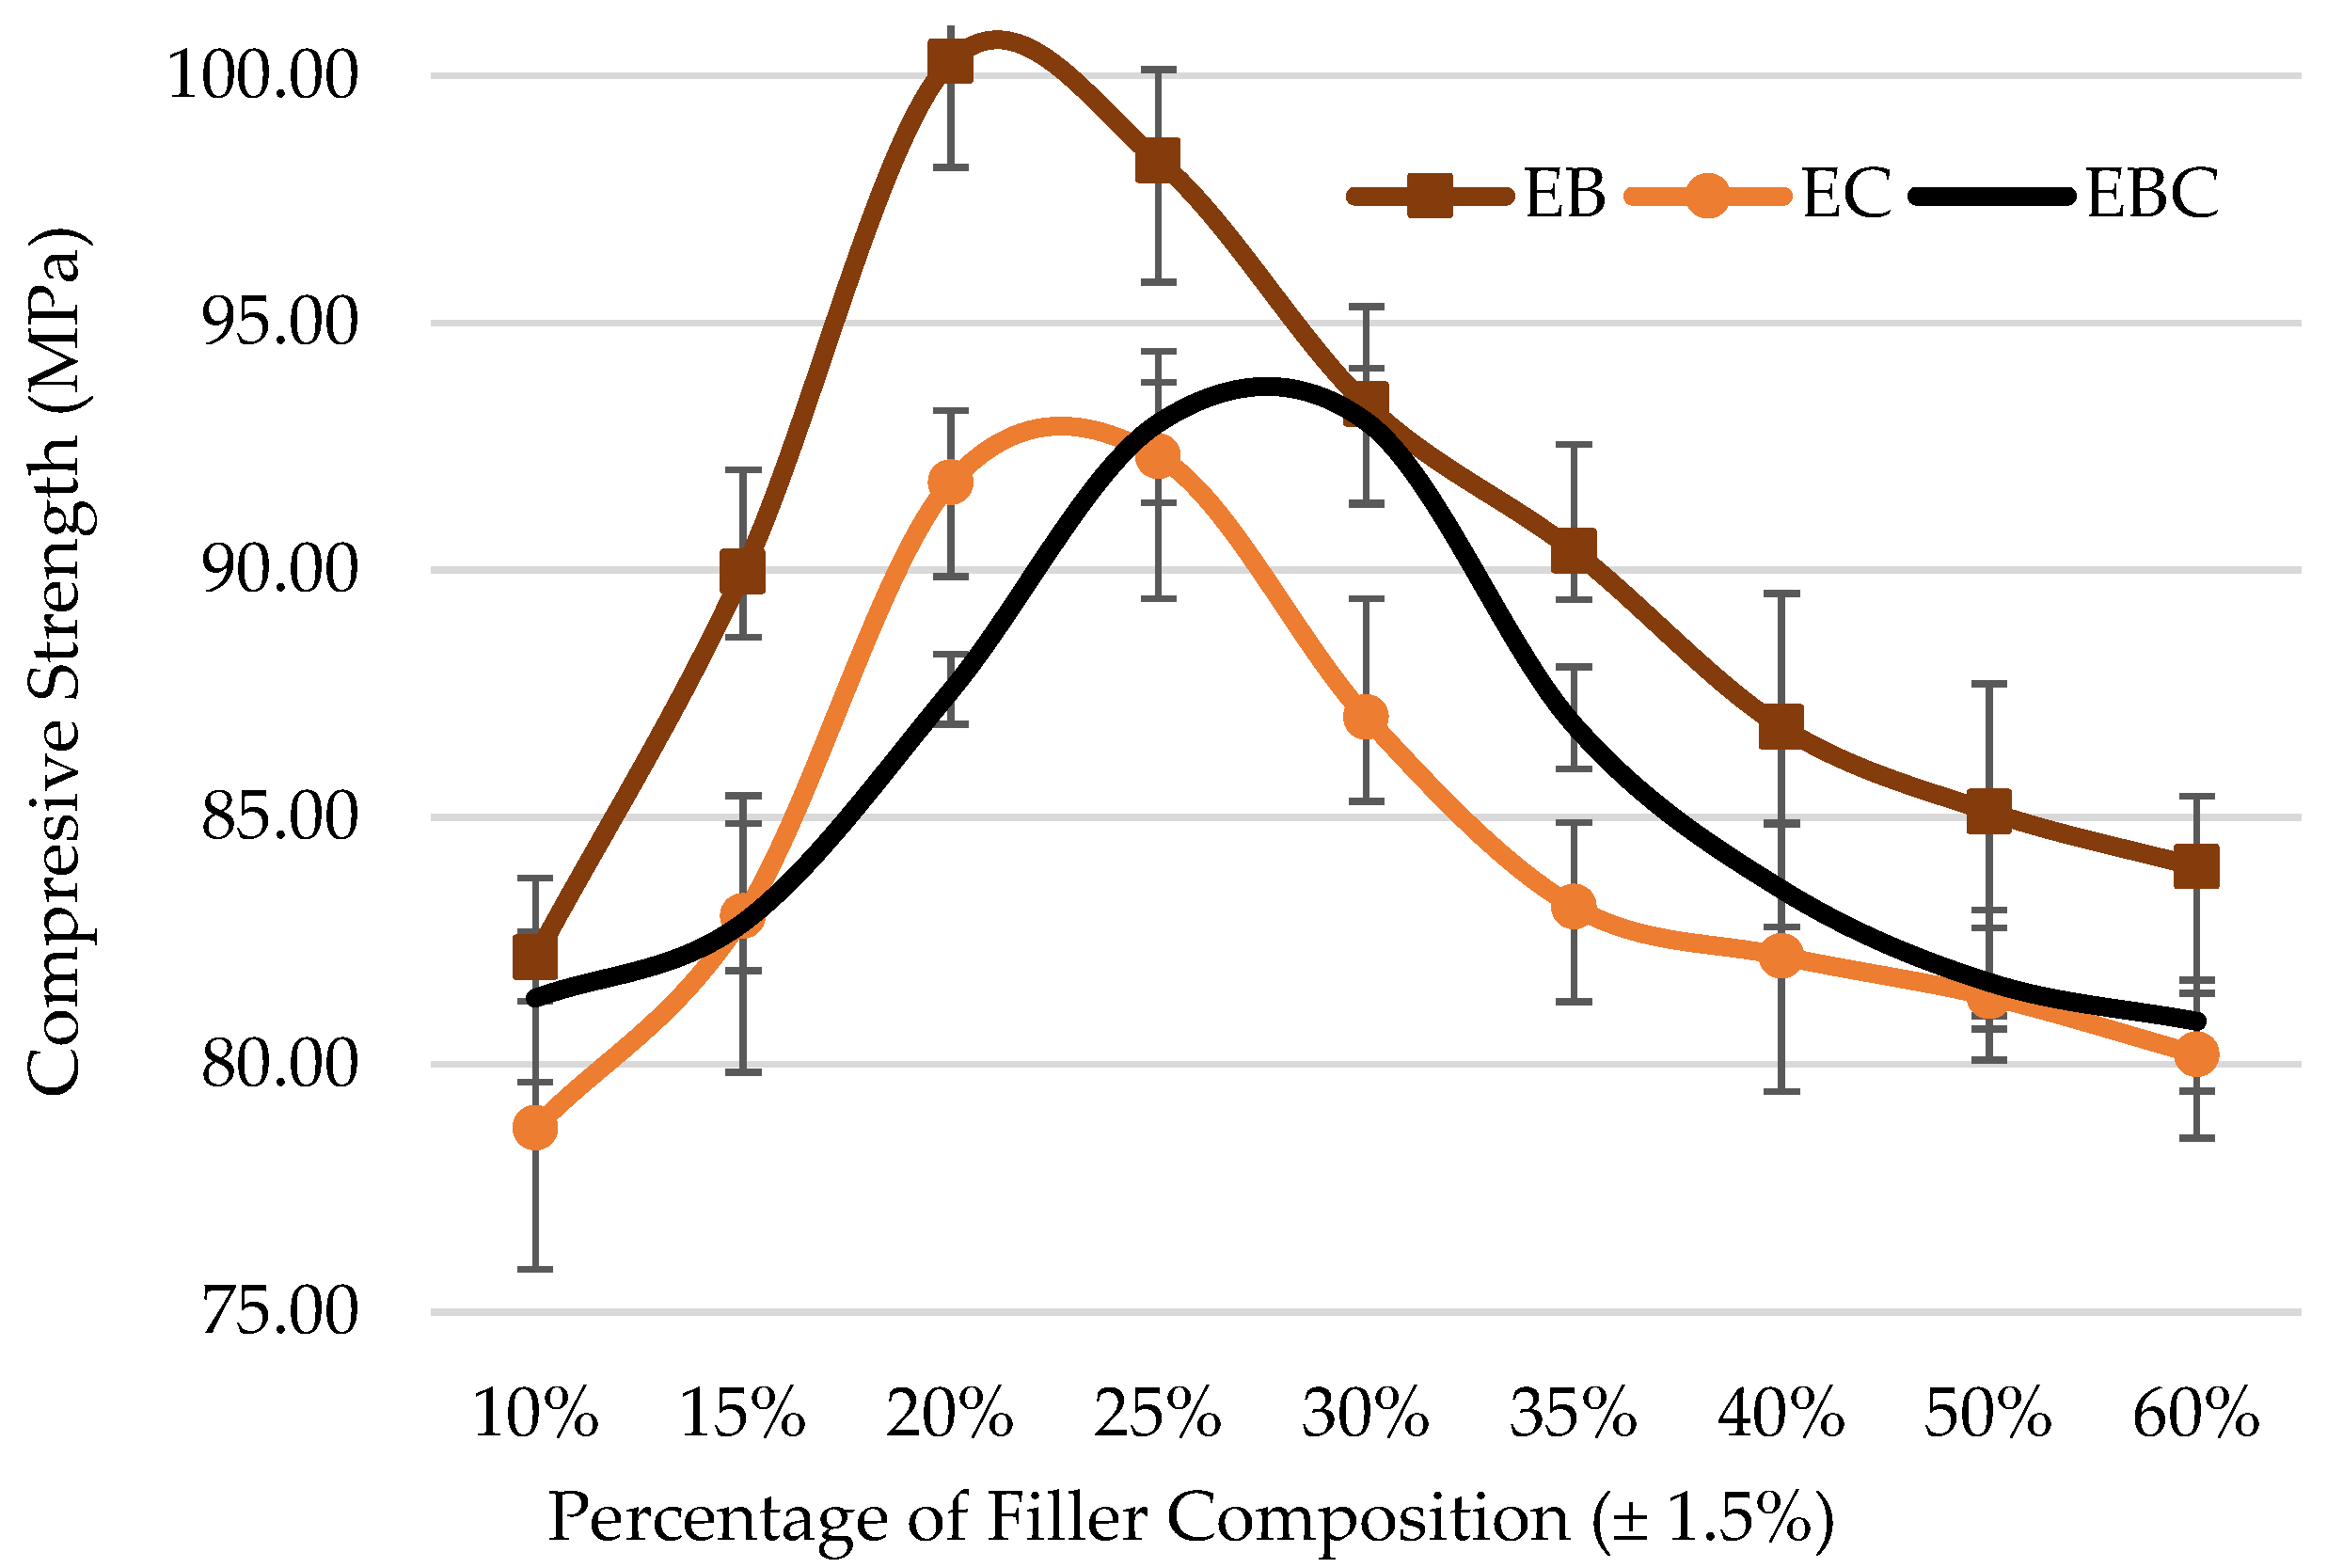
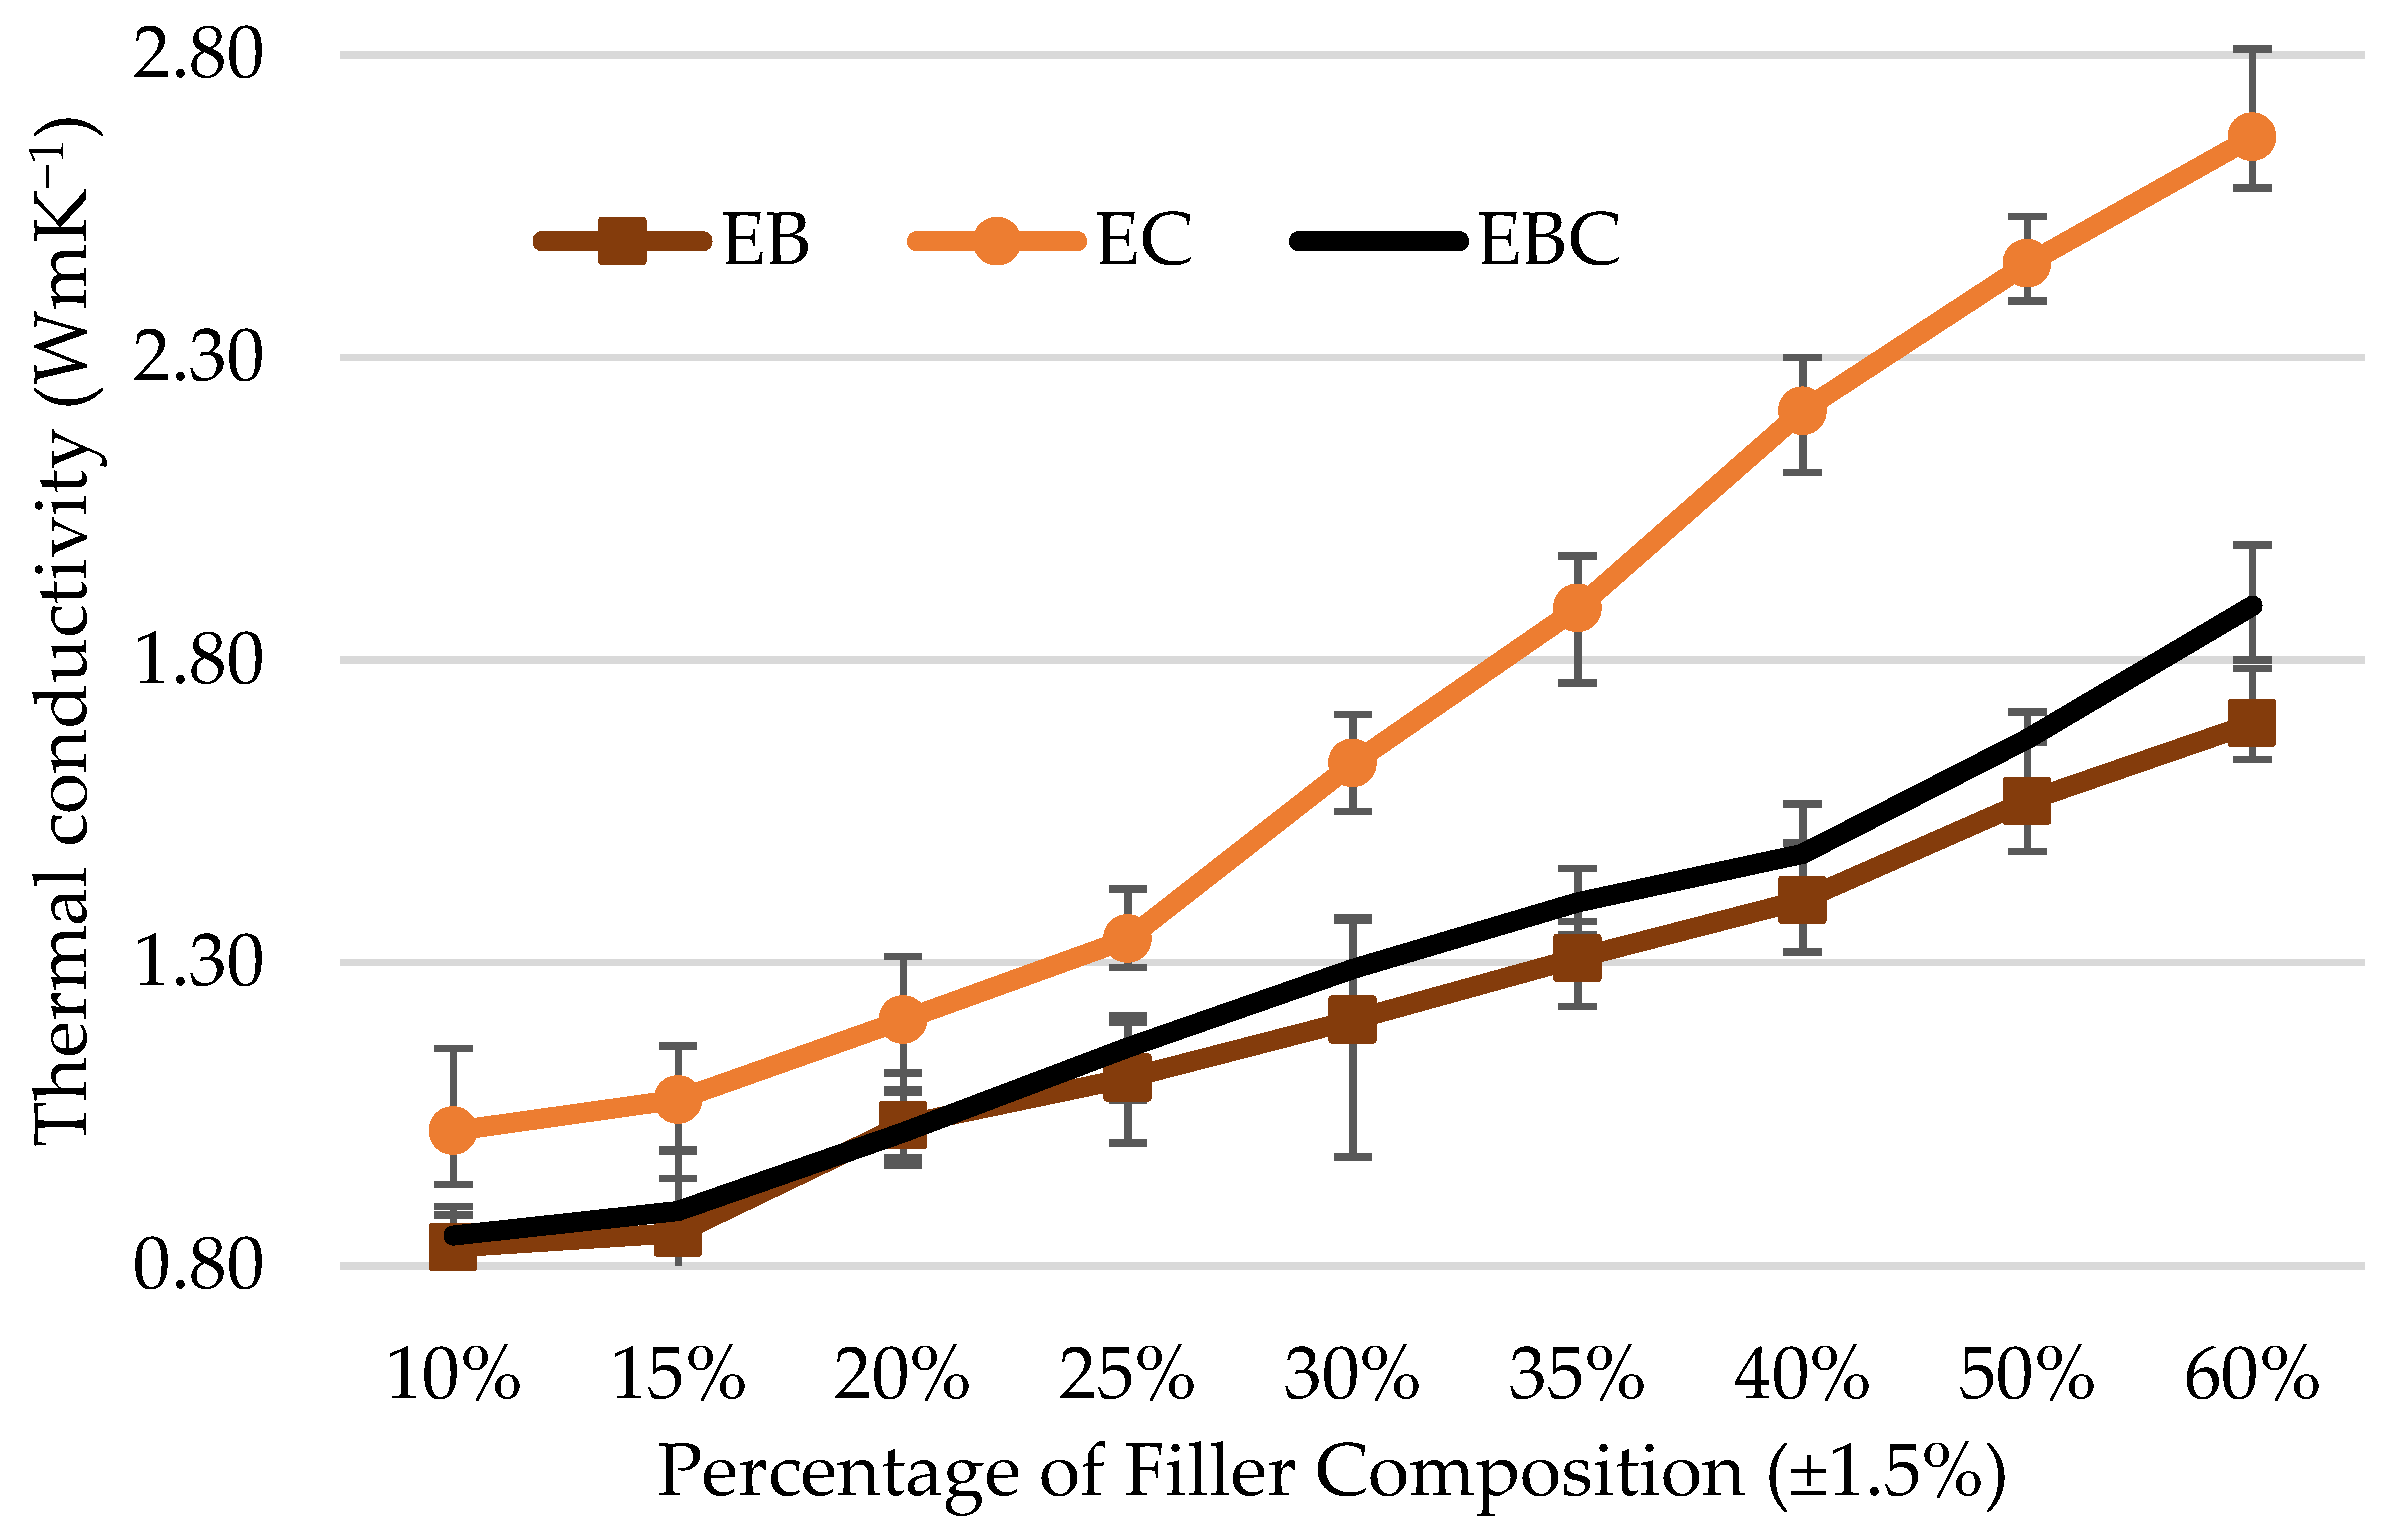
Based on the three materials that have been tested, brass and copper fillers demonstrated their respective abilities in terms of this important factor. The brass filler material showed an advantage in terms of a compressive strength of 100.29 MPa at 20 wt.%, while the copper filler showed an advantage in terms of a thermal conductivity of 2.66 W/m·K at 60%. Thus, the continuation of the results of EB and EC is expected to further improve the properties of MEC materials with a combination of brass and copper fillers. Compressive strength and thermal conductivity tests were run for a combination of brass and copper fillers (EBC), and the test results are shown in Figure 17 and Figure 18, respectively. Table 10 and Table 11 show a summary of the compressive strength and thermal conductivity test values for EBC, EB, and EC.
For EBC, the highest compressive strength is 93.10 MPa, and it occurs at 30% filler composition. Under this condition, an increase in thermal conductivity of 1.29 W/m·K for EBC is attained when compared to EC of 92.30 MPa in strength, with a thermal conductivity of 1.34 W/m·K at 25% filler composition and EB of 100.3 MPa with thermal conductivity of 1.03 W/mK at 20% filler composition. Based on the results, it is noted that the increase in % filler composition is proportional to the increase in thermal conductivity. Therefore, it is necessary to study the effect of increasing other material properties in thermal transient analysis. After simulations on thermal transient analysis for cooling time using ANSYS software, the best filler and percentage of composition to be used in the manufacture of MEC mold inserts will be chosen.

4. Thermal Transient Analysis Results for Cooling Time for EB, EC and EBC

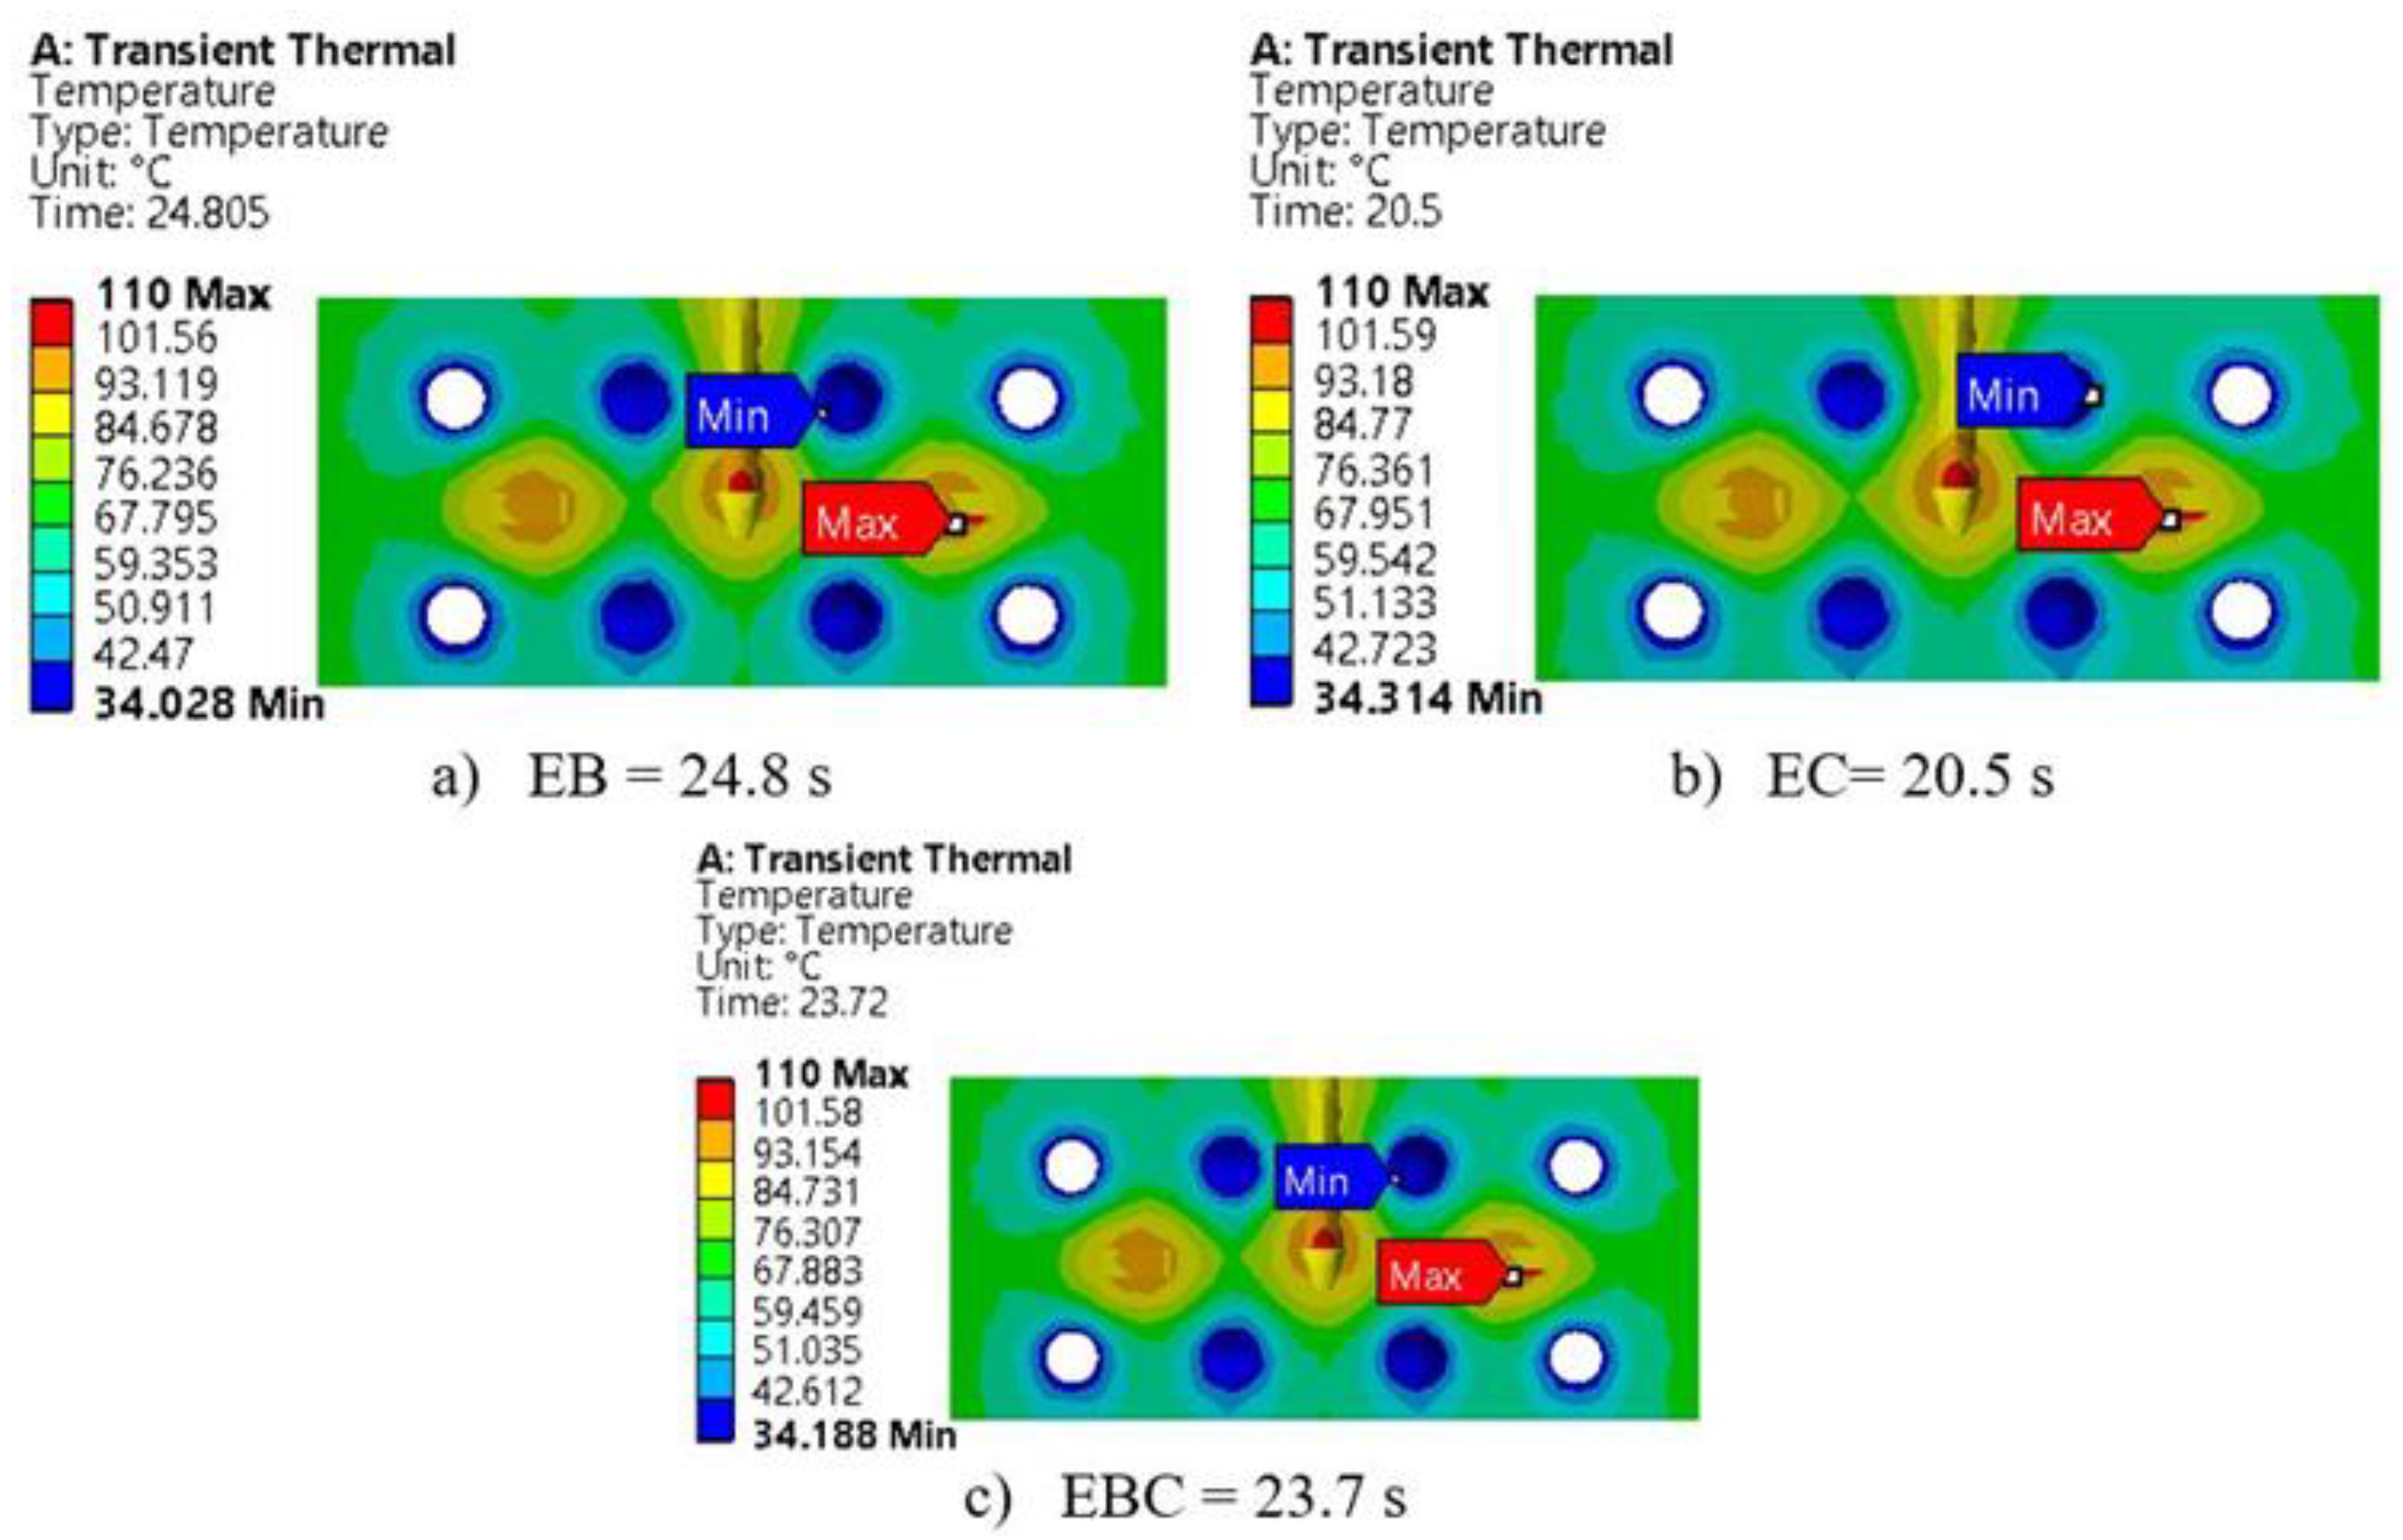
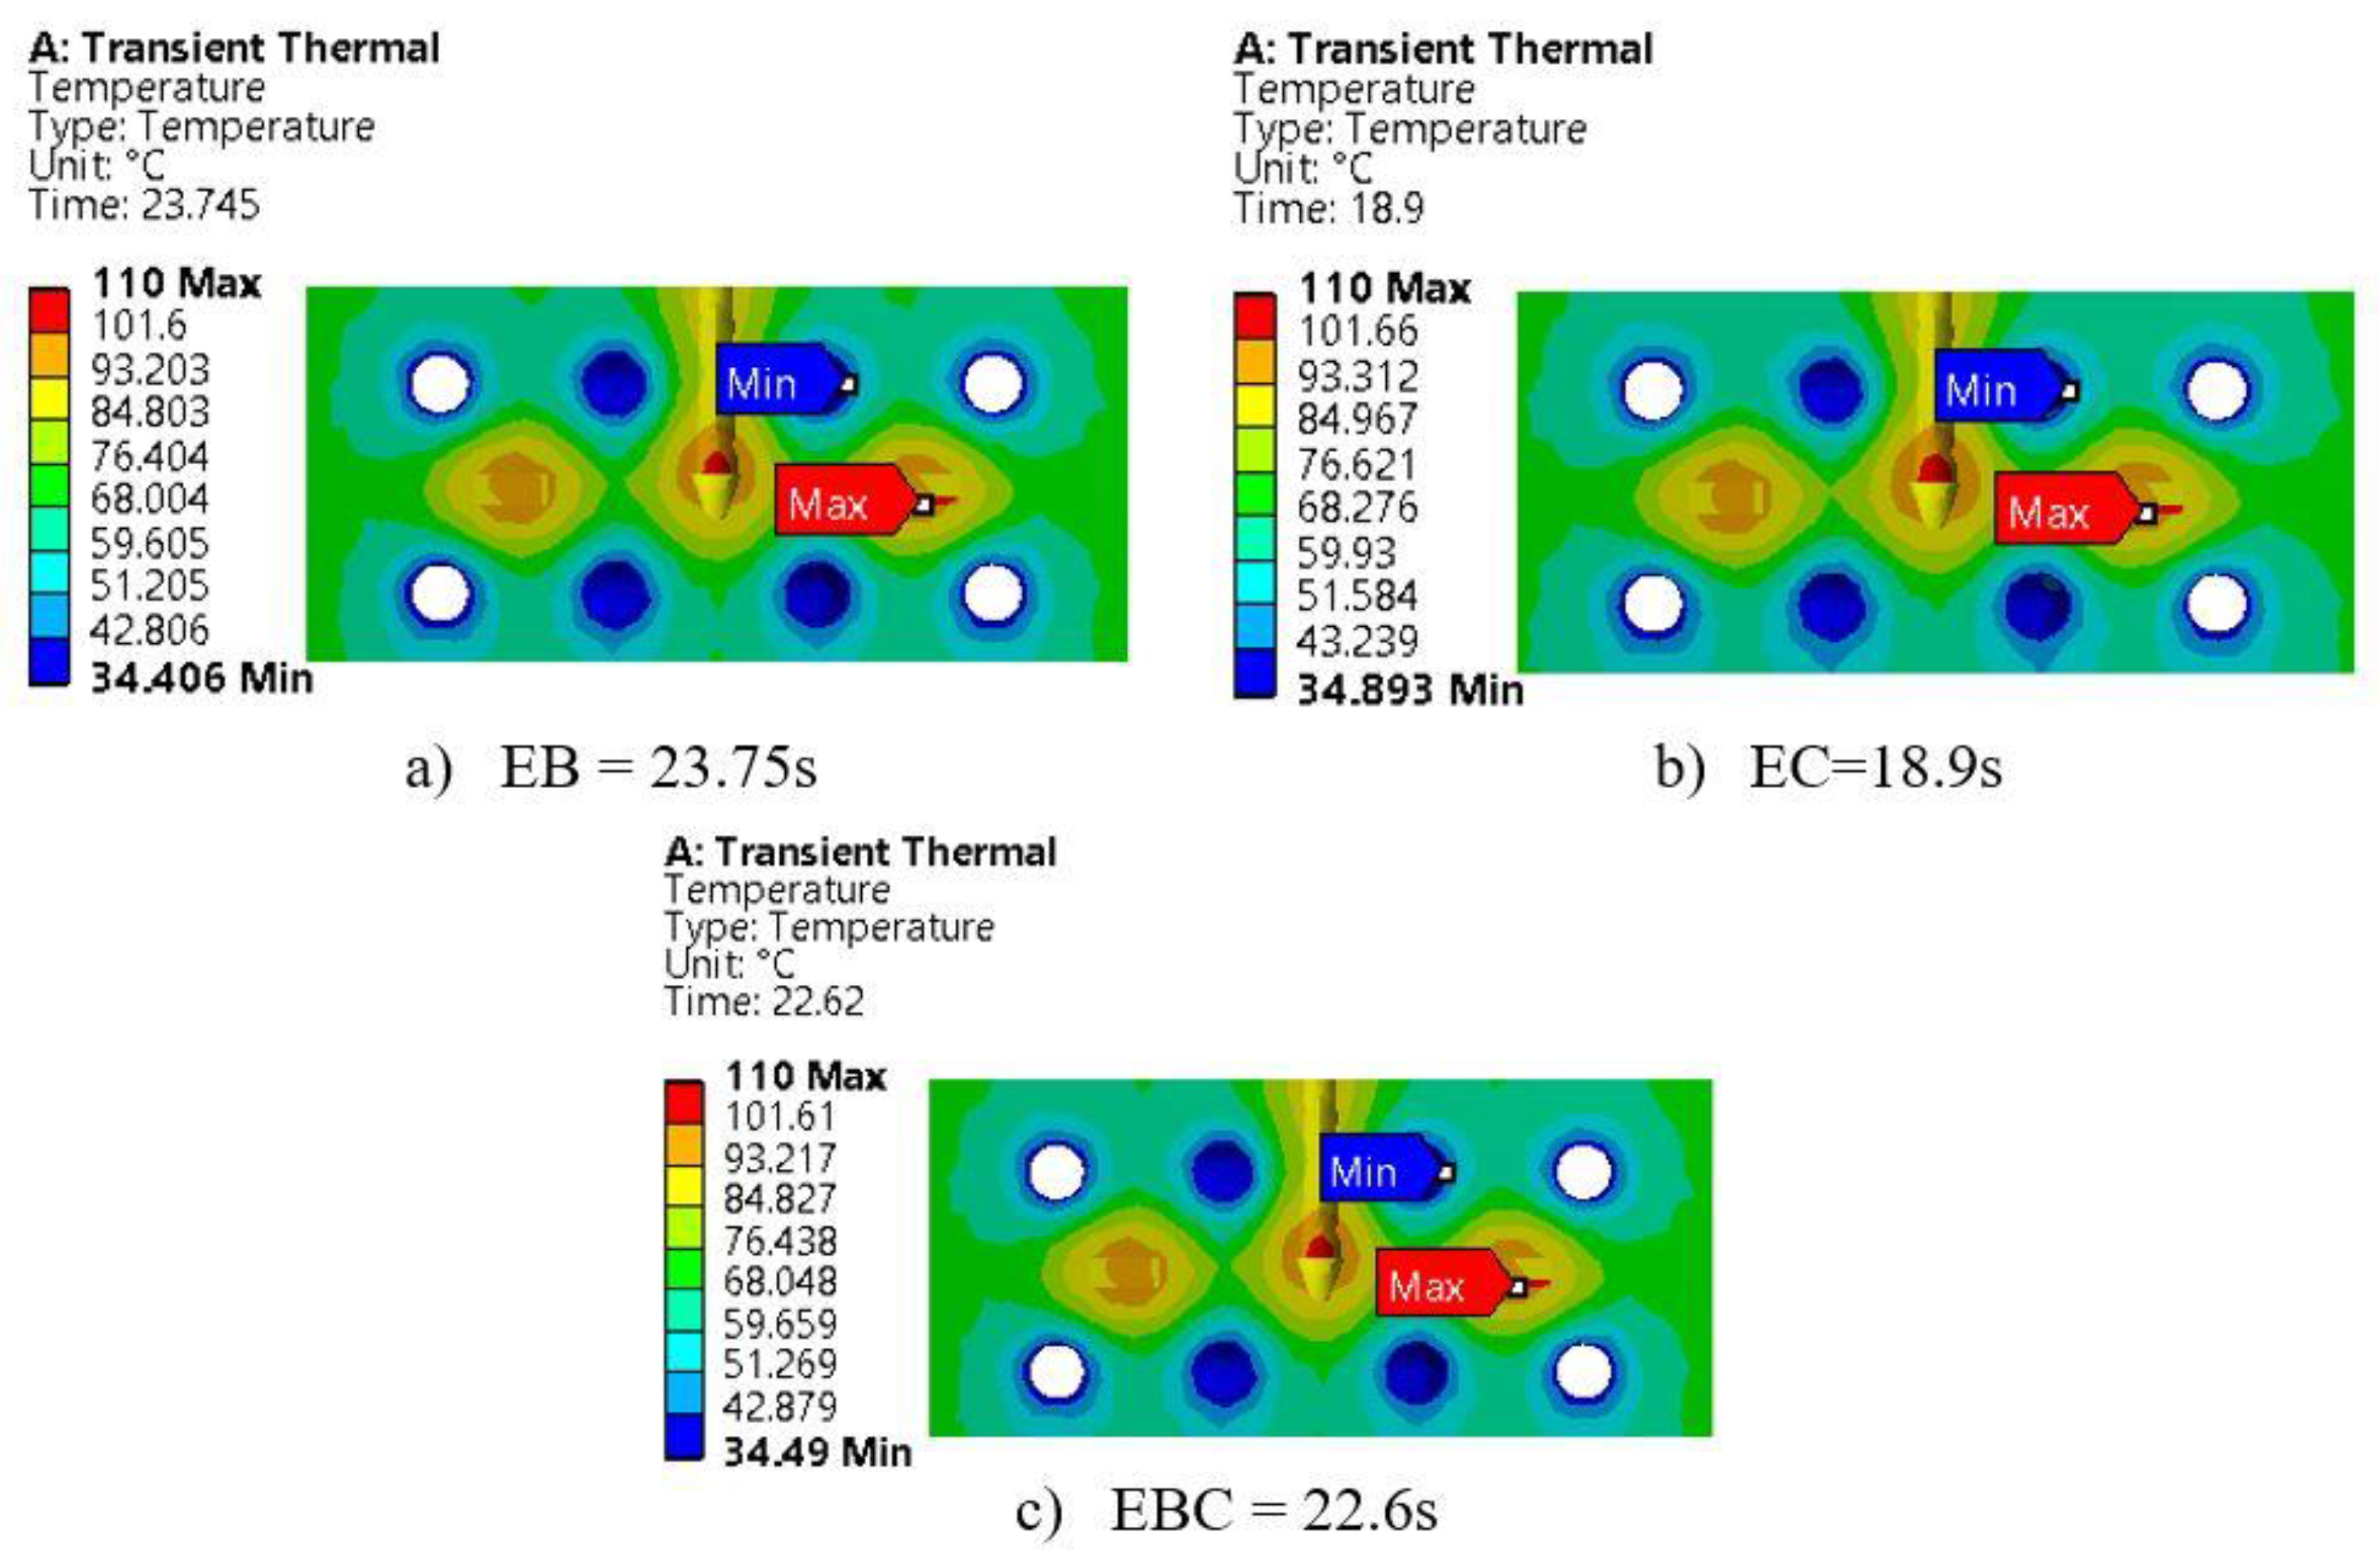
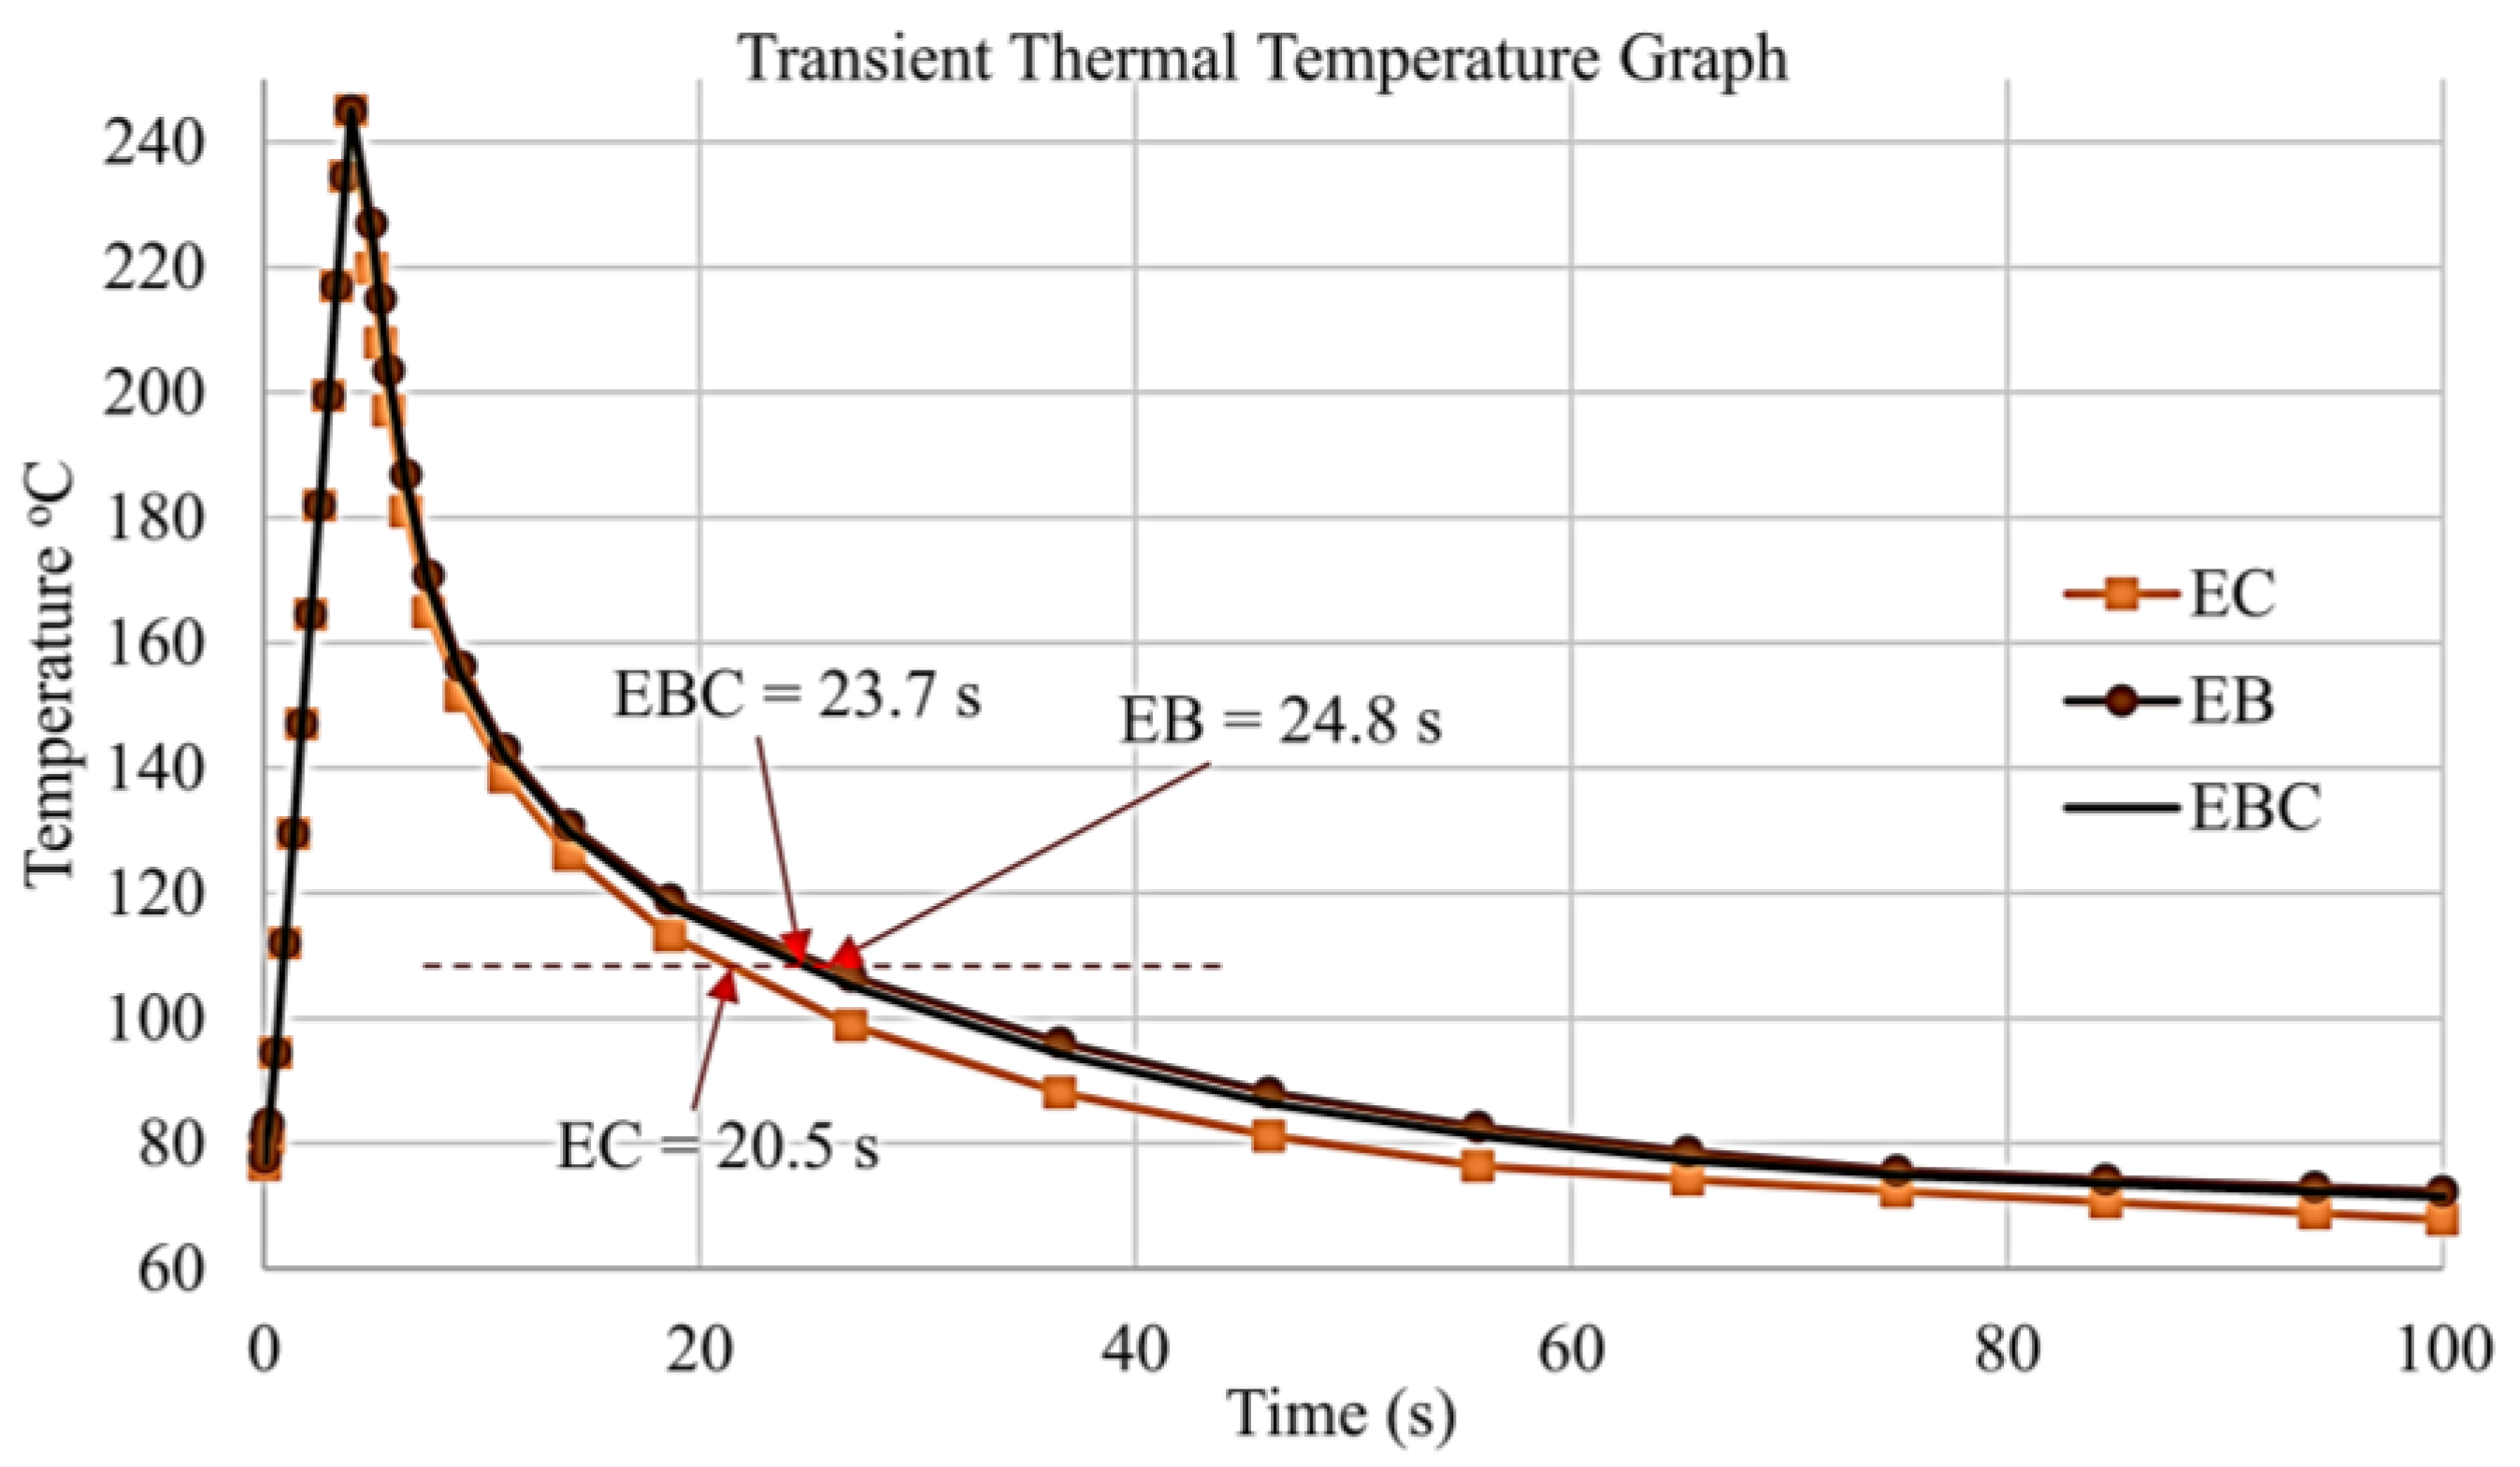
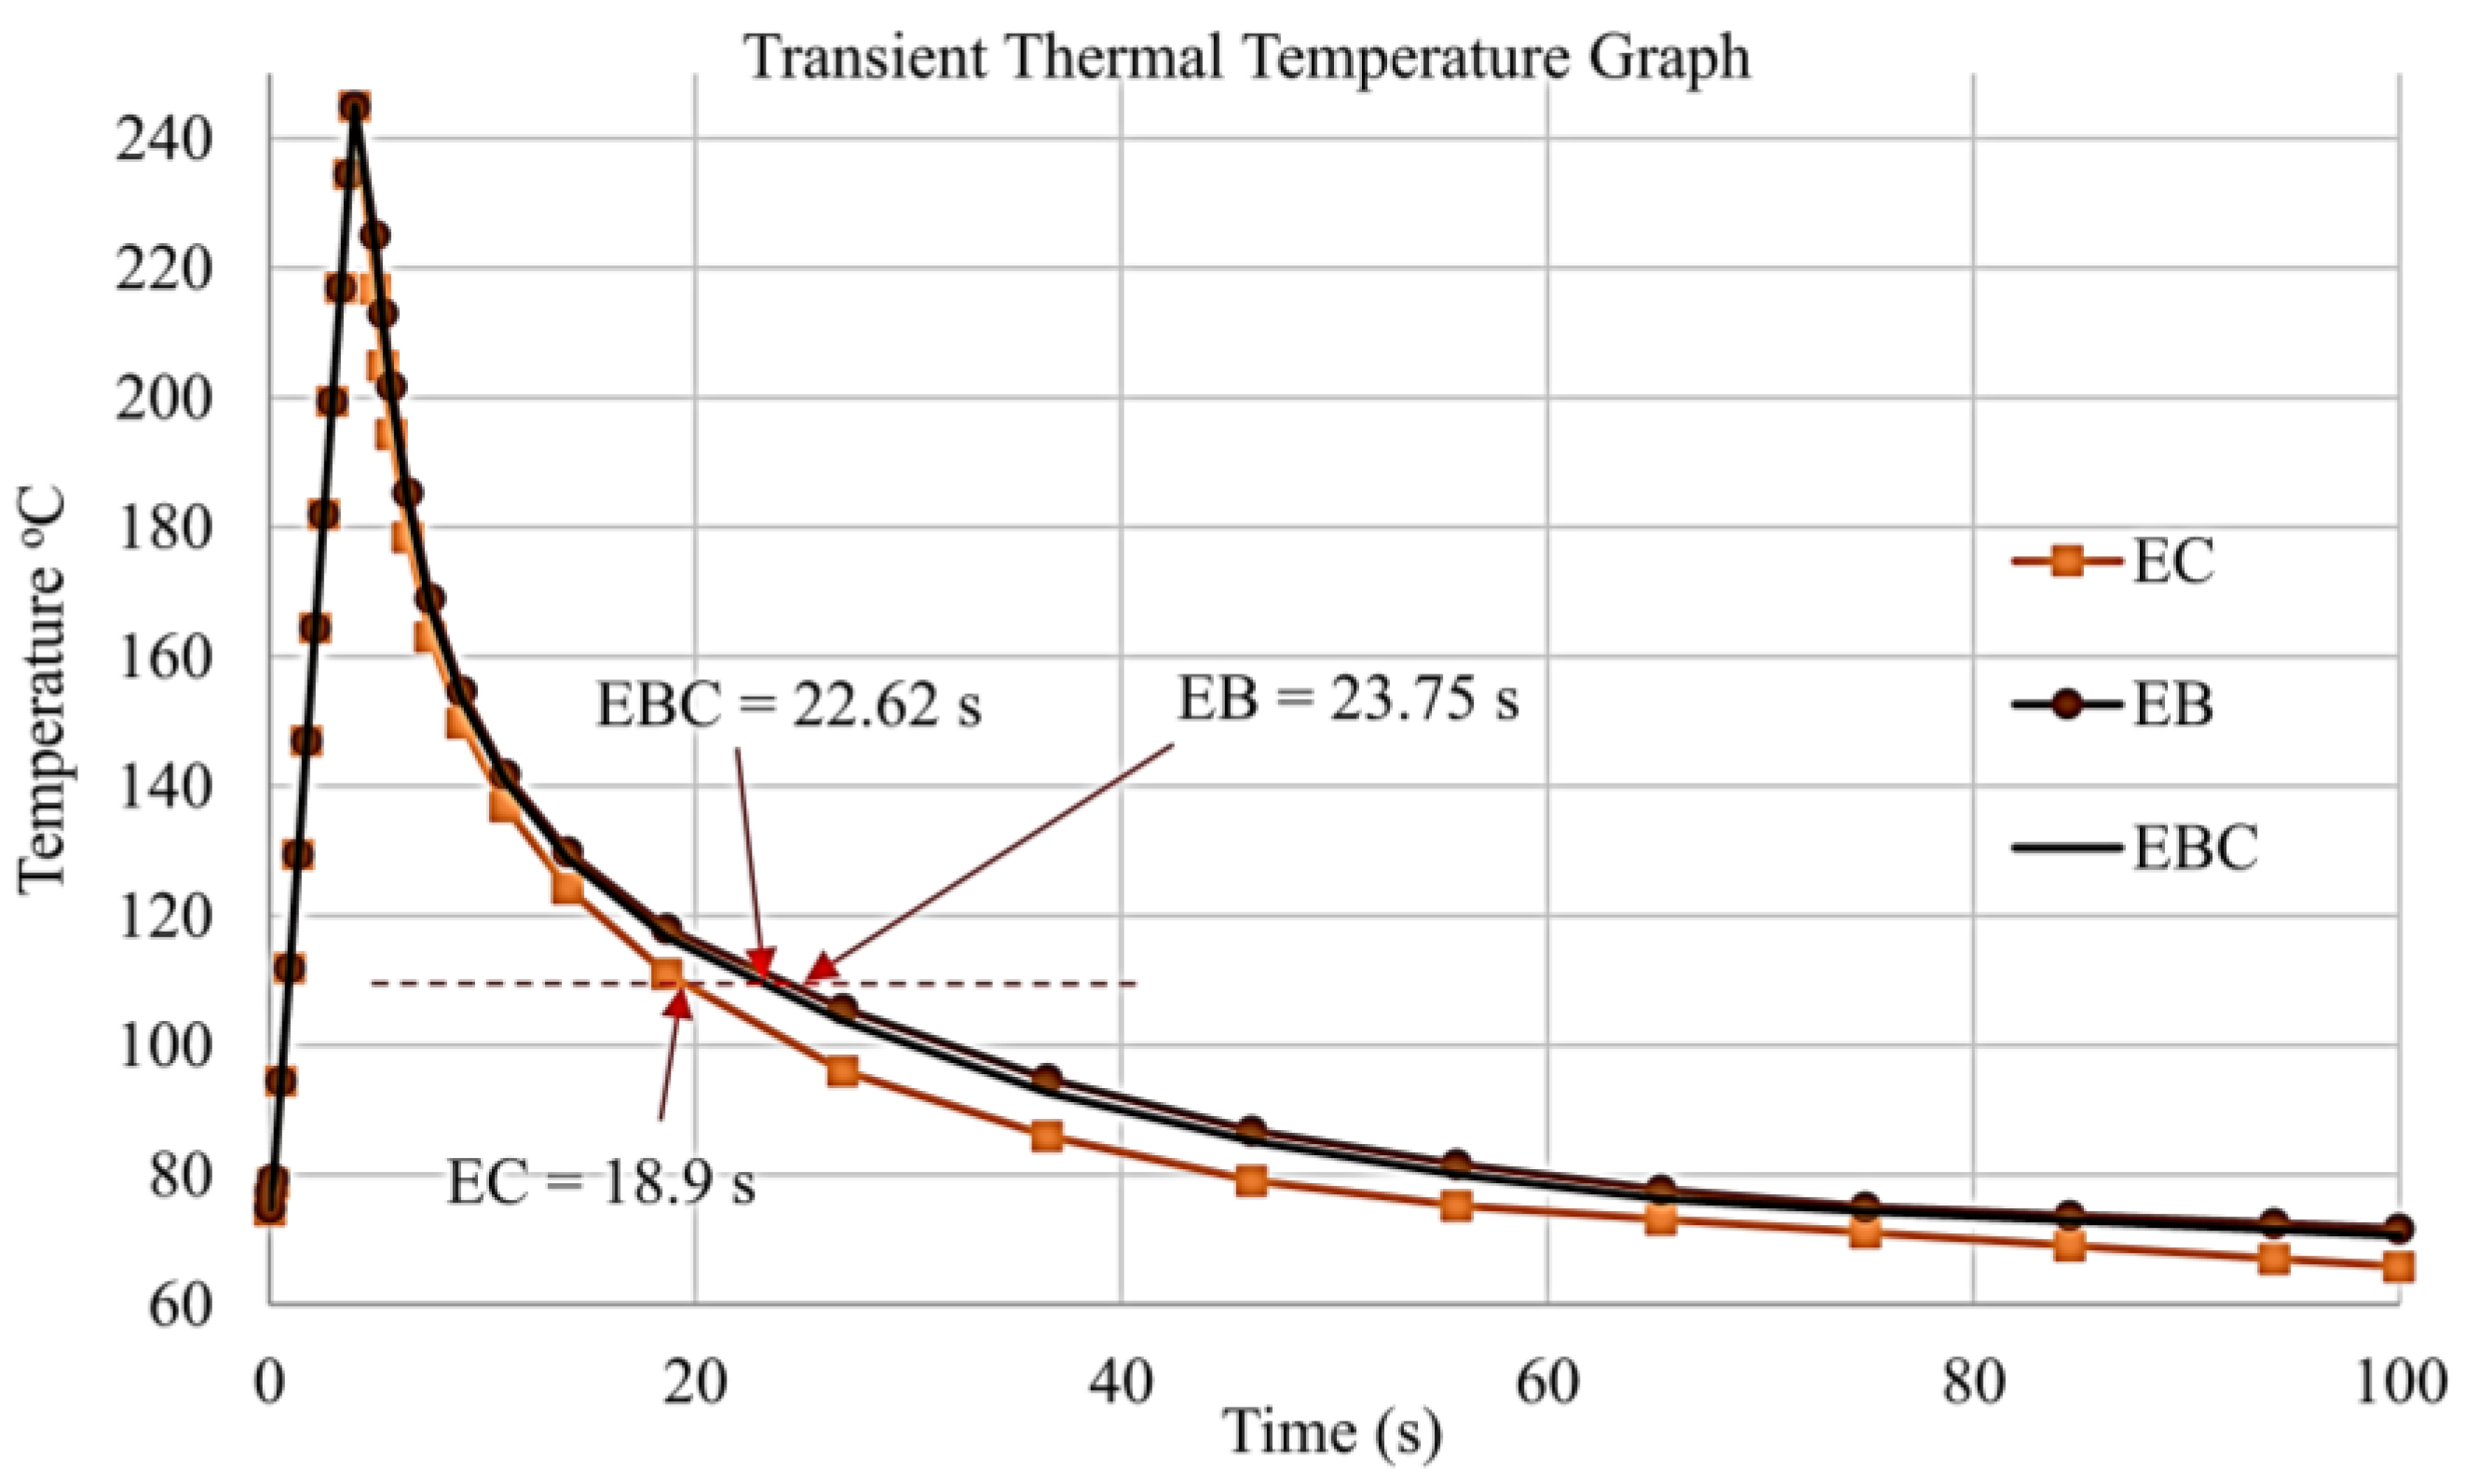
The cooling time results for EB, EC, and EBC materials were analyzed at high compression and high thermal conductivity conditions, as shown in Figure 19 and Figure 20, respectively. Based on the data generated from ANSYS simulation software, EC showed the lowest cooling time in both conditions, with a time of 20.5 s at high compressive condition and 18.9 s at high thermal conductivity, followed by EBC filler, with a cooling time of 23.7 s at high compressive condition and 22.6 s at high thermal conductivity. For EB filler, the cooling time is 24.8 s at high compressive condition and 23.7 s at high thermal conductivity. As shown in Table 12, the EC increased the cooling efficiency by up to 17.4% compared to the EB and 13.5% compared to the EBC at high compressive conditions. Meanwhile, in the case of high thermal conductivity, EC attained an increase in the cooling efficiency by up to 20.3% and 16.5% when compared to EB and EBC, respectively. From the results, it is observed that the best cooling time between MEC materials to be used as mold inserts is selected from EC mixture because copper particles enhance thermal conductivity, k s t , as was indicated by low cooling time. Figure 21 and Figure 22 illustrate thermal transient analysis using EC, EB, and EBC; from these figures, it is noted that EC has indicated the most significant difference in cooling time as compared to EB and EBC.

5. MEC Material Selection as Mold Insert

The material properties influencing important factors in the injection mold process have been discussed based on the related material testing results in terms of compressive strength and thermal conductivity. The addition of brass and copper fillers in the epoxy resin improves the material properties of MEC, such as compressive strength and thermal conductivity. From this research, it is found that:
  • The presence of EC and EB fillers affect the properties of epoxy, resulting in the improvement of MEC material properties. The thermal conductivity test, which measures how well a mold insert performs against cooling time, particularly favors EC fillers, while EB fillers tend to improve the compressive strength of the material.
  • EBC provides a minimal increase in cooling efficiency when compared to EB. This combination also increases the percentage of filler composition higher than EC and EB at the highest compressive strength, which promotes the increase in thermal conductivity of MEC material.
  • Based on data generated from ANSYS simulation software, EC showed the best cooling time value in both conditions at high compressive strength and at high thermal conductivity. EC outperformed the EB and the EBC by up to 17.4% and 13.5%, respectively, in terms of cooling efficiency. Meanwhile, in the case of high thermal conductivity, EC increased the cooling efficiency by up to 20.3% compared with EB and 16.5% compared with EBC. The results show that the EC filler has the best cooling time among the MEC materials for mold inserts because the copper filler increases thermal conductivity,   k s t   , as indicated by the short cooling time. EC gives the best cooling time under high compressive strength and at high thermal conductivity.
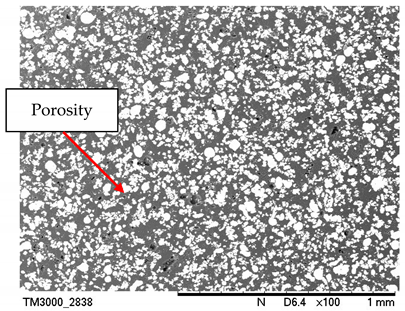
Choosing the best percentage composition for MEC material is based on the results obtained during both experiments and simulations. These findings are consistent with those reported in the literature, which show that copper fillers have better conductivity [22,51,64]. EC shows a better value compared to EB and EBC in improving the performance of the cooling time of the mold insert as well as meeting the sufficient compressive strength. The addition of filler will increase the thermal conductivity, which in turn will increase the cooling time performance. Therefore, the MEC mold insert was produced by using EC filler at a composition of 60% (high thermal conductivity condition), as shown in Figure 23 and the list of material properties in Table 13. Based on Table 11, it can be seen that the dispersion of the filler mixture across the surface area is well distributed. Although the distribution is even, at a higher percentage of the filler mixture composition, which is 60%, there will be parts that appear slightly agglomerated and porous.

6. Conclusions

This research aimed to investigate the physical, mechanical, and thermal properties of brass (EB), copper (EC), and the combination of brass and copper (EBC) fillers of irregularly shaped particles. The findings from this research with the discovery of a new formulation of MEC material prove that MEC materials can be used as a mold insert material for the injection molding application. The performance of the MEC material is improved by the addition of brass and copper fillers to the epoxy in terms of compressive strength and ability to withstand the injection pressure of molten plastic material into the mold cavity. Additionally, it enhances cooling time performance by increasing the value of thermal conductivity with the aid of a straight cooling channel system integrated into the mold insert.
As a conclusion, the EC is finally set at 60 wt.% composition using copper fillers so that it can operate at the best cooling time and therefore have the optimum performance of the mold insert. In contrast to previous researchers, who produced mold inserts using a filler composition at a range of the highest compressive strength value, this research chose a filler composition at the range of the highest thermal conductivity value. The selection of the best percentage composition of MEC material is based on the results obtained during experiment and simulation. EC showed better value compared to EB and EBC in improving the cooling time of the MEC mold insert as well as meeting the sufficient compressive strength.
Future research will continue, and experimental evaluations of mold performance, including cooling time, the accuracy of the produced molded part, and the applicability of the MEC mold insert, will be made using an injection molding machine.

Author Contributions

Conceptualization, S.S., S.Z.A.R., A.R. and M.T.M.K.; data curation, R.H., A.E.-h.A. and N.A.S.; formal analysis, R.H., A.E.-h.A., N.A.S. and M.A.S.; investigation, R.H., A.R. and M.T.M.K.; methodology, S.S., S.Z.A.R., A.E.-h.A. and A.M.T.; project administration, R.H., A.M.T. and M.T.M.K.; software, S.S., N.A.S. and M.A.S.; validation, R.H., S.Z.A.R., M.A.S. and A.M.T.; writing of review and editing, M.A.S., S.S., S.Z.A.R. and A.R. All authors have read and agreed to the published version of the manuscript.

Funding

The authors wish to thank the Universiti Malaysia Perlis, Malaysia, and Lancaster University, United Kingdom, for the cooperation and assistance in conducting this research. Special appreciation goes to the Ministry of Higher Education (Malaysia) for the financial support through the Fundamental Research Grant Scheme (FRGS) FRGS/1/2020/TK0/UNIMAP/03/19. The authors would also like to extend their great gratitude to UTM Research Management for providing financial support through the UTM GUP Grant 08G37.

Conflicts of Interest

The authors declare no conflict of interest.

References

  1. Rajaguru, J.C.; Duke, M.B.; Au, C. Development of rapid tooling by rapid prototyping technology and electroless nickel plating for low-volume production of plastic parts. Int. J. Adv. Manuf. Technol. 2015, 78, 31–40. [Google Scholar] [CrossRef]
  2. Equbal, A.; Sood, A.K.; Shamim, M. Rapid tooling: A major shift in tooling practice. Manuf. Ind. Eng. 2015, 14, 1–9. [Google Scholar] [CrossRef] [Green Version]
  3. Pontes, A.J.; Queirós, M.P.; Martinho, P.G.; Bártolo, P.J.; Pouzada, A.S. Experimental assessment of hybrid mould performance. Int. J. Adv. Manuf. Technol. 2010, 50, 441–448. [Google Scholar] [CrossRef]
  4. Altaf, K.; Rani, A.M.A.; Ahmad, F.; Baharom, M.; Raghavan, V.R. Determining the effects of thermal conductivity on epoxy molds using profiled cooling channels with metal inserts. J. Mech. Sci. Technol. 2016, 30, 4901–4907. [Google Scholar] [CrossRef]
  5. Mendible, G.A.; Rulander, J.A.; Johnston, S.P. Comparative study of rapid and conventional tooling for plastics injection molding. Rapid Prototyp. J. 2017, 23, 344–352. [Google Scholar] [CrossRef]
  6. Khushairi, M.T.M.; Sharif, S.; Jamaludin, K.R.; Razak, Z.; Shah, Z.N.; Suhaimi, M.A.; Shayfull, Z. Development of Metal Filled Epoxy Inserts for Injection Moulding Process. In Proceedings of the Green Design and Manufacture: Advanced and Emerging Applications, Ho Chi Minh, Vietnam, 29–30 April 2018; Volume 020084. [Google Scholar]
  7. Kuo, C.-C.; Chen, W.-H.; Liu, X.-Z.; Liao, Y.-L.; Chen, W.-J.; Huang, B.-Y.; Tsai, R.-L. Development of a low-cost wax injection mold with high cooling efficiency. Int. J. Adv. Manuf. Technol. 2017, 93, 2081–2088. [Google Scholar] [CrossRef]
  8. Kazmer, D.O. Injection Mold Design Engineering, 2nd ed.; Hamilton, C., Ed.; Carl Hanser Verlag GmbH & Co. KG: Munich, Germany, 2016; ISBN 978-1-56990-570-8. [Google Scholar]
  9. Elangovan, K.; Kumar, K.K.I.; Kothandaraman, B. Effect of glass microspheres and aluminium filler in the properties of epoxy and modified epoxy matrix composite for rapid tooling applications. Int. J. Plast. Technol. 2009, 13, 38–46. [Google Scholar] [CrossRef]
  10. Cheah, C.; Chua, C.; Lee, C.; Lim, S.; Eu, K.; Lin, L. Rapid Sheet Metal Manufacturing. Part 2: Direct Rapid Tooling. Int. J. Adv. Manuf. Technol. 2002, 19, 510–515. [Google Scholar] [CrossRef]
  11. Hopkinson, N.; Dickens, P. A comparison between stereolithography and aluminium injection moulding tooling. Rapid Prototyp. J. 2000, 6, 253–258. [Google Scholar] [CrossRef] [Green Version]
  12. Freitas, A.; Soares, R.; Martinho, P.G.; Pouzada, A.S. Rapid Prototyping and Tooling in the Manufacture of Mould Elements for Large Parts. In High Value Manufacturing: Advanced Research in Virtual and Rapid Prototyping: Proceedings of the 6th International Conference on Advanced Research in Virtual and Rapid Prototyping, Leiria, Portugal, 1–5 October 2013; CRC Press: Boca Raton, FL, USA, 2013; pp. 327–332. [Google Scholar]
  13. Shinde, M.S.; Ashtankar, K.M.; Kuthe, A.M.; Dahake, S.W.; Mawale, M.B. Direct rapid manufacturing of molds with conformal cooling channels. Rapid Prototyp. J. 2018, 24, 1347–1364. [Google Scholar] [CrossRef]
  14. Vasconcelos, P.V.; Lino, F.J.; Baptista, A.M.; Neto, R.J. Tribological behaviour of epoxy based composites for rapid tooling. Wear 2006, 260, 30–39. [Google Scholar] [CrossRef]
  15. Ma, S.; Gibson, I.; Balaji, G.; Hu, Q. Development of epoxy matrix composites for rapid tooling applications. J. Mater. Process. Technol. 2007, 192–193, 75–82. [Google Scholar] [CrossRef]
  16. Srivastava, V.K.; Verma, A. Mechanical Behaviour of Copper and Aluminium Particles Reinforced Epoxy Resin Composites. Am. J. Mater. Sci. 2015, 5, 84–89. [Google Scholar] [CrossRef]
  17. Senthilkumar, N.; Kalaichelvan, K.; Elangovan, K. Mechanical behaviour of aluminum particulate epoxy composite—Experimental study and numerical simulation. Int. J. Mech. Mater. Eng. 2012, 7, 214–221. [Google Scholar]
  18. Khushairi, M.T.M.; Sharif, S.; Ani, J.S.M. Parameter Design for Hardness of Metal Filled Epoxy Matrix. Adv. Mater. Res. 2015, 1125, 152–156. [Google Scholar] [CrossRef]
  19. Barros, T.P.D.S.; Cavalcante, D.G.D.L.; de Oliveira, D.F.; Caluête, R.E.; de Lima, S.J.G. Study of the surface properties of the epoxy/quasicrystal composite. J. Mater. Res. Technol. 2019, 8, 590–598. [Google Scholar] [CrossRef]
  20. Jin, F.-L.; Li, X.; Park, S.-J. Synthesis and application of epoxy resins: A review. J. Ind. Eng. Chem. 2015, 29, 1–11. [Google Scholar] [CrossRef]
  21. Fernandes, A.D.C.; Souza, A.F.D.; Howarth, J.L.L. Mechanical and dimensional characterisation of polypropylene injection moulded parts in epoxy resin/aluminium inserts for rapid tooling. Int. J. Mater. Prod. Technol. 2016, 52, 37–52. [Google Scholar] [CrossRef]
  22. Khushairi, M.T.M.; Sharif, S.; Jamaludin, K.R.; Mohruni, A.S. Effects of Metal Fillers on Properties of Epoxy for Rapid Tooling Inserts. Int. J. Adv. Sci. Eng. Inf. Technol. 2017, 7, 1155. [Google Scholar] [CrossRef] [Green Version]
  23. Kuo, C.-C.; Xu, J.-Y.; Zhu, Y.-J.; Lee, C.-H. Effects of Different Mold Materials and Coolant Media on the Cooling Performance of Epoxy-Based Injection Molds. Polymers 2022, 14, 280. [Google Scholar] [CrossRef]
  24. Kuo, C.-C.; Wu, J.-Q. Development of a low-cost epoxy resin mold with high cooling efficiency. Int. J. Adv. Manuf. Technol. 2021, 113, 2065–2086. [Google Scholar] [CrossRef]
  25. El-Masry, M.M.; Imam, N. A comparative study between Ag-CuO/ epoxy and Mg-CuO/ epoxy hybrid nanocomposites: Impressive electrical, mechanical and thermal properties. J. Mater. Res. Technol. 2022, 18, 1784–1801. [Google Scholar] [CrossRef]
  26. Hamidon, M.H.; Sultan, M.T.; Ariffin, A.H.; Shah, A.U. Effects of fibre treatment on mechanical properties of kenaf fibre reinforced composites: A review. J. Mater. Res. Technol. 2019, 8, 3327–3337. [Google Scholar] [CrossRef]
  27. Gao, X.; Yang, W.; Cheng, L.; Ding, Y.; Zhan, J.; Tan, J. Epoxy resin composite containing nanocarbon-coated glass fiber and cloth for electromagnetic interference shielding. J. Mater. Res. Technol. 2021, 13, 1759–1766. [Google Scholar] [CrossRef]
  28. Singh, M.K.; Gautam, R.K. Structural, Mechanical, and Electrical Behavior of Ceramic-Reinforced Copper Metal Matrix Hybrid Composites. J. Mater. Eng. Perform. 2019, 28, 886–899. [Google Scholar] [CrossRef]
  29. Tekce, H.S.; Kumlutas, D.; Tavman, I.H. Effect of Particle Shape on Thermal Conductivity of Copper Reinforced Polymer Composites. J. Reinf. Plast. Compos. 2007, 26, 113–121. [Google Scholar] [CrossRef]
  30. ALWA ALWA HT RESIN:High Temperature Resin. Available online: https://www.alwa.de/en/products/high-temperature-resin/ (accessed on 2 January 2019).
  31. RenCast CW 47; (Switzerland) GmbH. 2014. Available online: https://www.obo-werke.de/fileadmin/templates/downloads/technische_datenblaetter/en/rencast-cw-47-hy-33.pdf (accessed on 23 January 2022).
  32. Altaf, K. Novel Techniques for Reducing Cooling Time in Polymer Injection Moulds using Rapid Tooling Technologies. Ph.D. Dissertation, Universiti Teknologi Petronas, Seri Iskandar, Malaysia, 2011. [Google Scholar]
  33. Khushairi, M.T.M.; Sharif, S.; Ani, J.S.M. Evaluation of Mechanical Properties of Filled Epoxy Composite for Improving Mould Performance—A Review. Appl. Mech. Mater. 2015, 735, 13–18. [Google Scholar] [CrossRef]
  34. Compound, E.C.; Neukadur vg alu. 1–2. Available online: https://www.altropol.de/wp-content/uploads/2016/09/E_VG_Alu.pdf (accessed on 23 January 2022).
  35. Pamphlet, T. TECHNICAL PAMPHLET RECKLI®; Epoxy WST: Perth, Australia. Available online: https://www.reckli.com/en/service/downloads (accessed on 23 January 2022).
  36. Gibson, I. Micro Prototyping and Fabrication in Manufacturing. In Handbook of Manufacturing Engineering and Technology; Springer: London, UK, 2013; pp. 1–14. ISBN 9781447149767. [Google Scholar]
  37. Segal, J.; Campbell, R. A review of research into the effects of rapid tooling on part properties. Rapid Prototyp. J. 2001, 7, 90–99. [Google Scholar] [CrossRef]
  38. Rahmati, S.; Dickens, P. Rapid tooling analysis of Stereolithography injection mould tooling. Int. J. Mach. Tools Manuf. 2007, 47, 740–747. [Google Scholar] [CrossRef]
  39. Martinho, P.G.; Bártolo, P.J.; Pouzada, A.S. Hybrid moulds: Effect of the moulding blocks on the morphology and dimensional properties. Rapid Prototyp. J. 2009, 15, 71–82. [Google Scholar] [CrossRef]
  40. Pouzada, A.S. Hybrid moulds: A case of integration of alternative materials and rapid prototyping for tooling. Virtual Phys. Prototyp. 2009, 4, 195–202. [Google Scholar] [CrossRef]
  41. Ferreira, J. Manufacturing core-boxes for foundry with rapid tooling technology. J. Mater. Process. Technol. 2004, 155–156, 1118–1123. [Google Scholar] [CrossRef]
  42. Vaezi, M.; Safaeian, D.; Chua, C. Gas turbine blade manufacturing by use of epoxy resin tooling and silicone rubber molding techniques. Rapid Prototyp. J. 2011, 17, 107–115. [Google Scholar] [CrossRef]
  43. Fernandes, C.; Pontes, A.J.; Viana, J.C.; Gaspar-Cunha, A. Modeling and Optimization of the Injection-Molding Process: A Review. Adv. Polym. Technol. 2016, 37, 429–449. [Google Scholar] [CrossRef]
  44. Moradi, S.; Calventus, Y.; Roman, F.; John, M. Hutchinson Achieving High Thermal Conductivity in Epoxy Composites: Effect of Boron Nitride Particle Size and Matrix-Filler Interface. Polimers 2019, 11, 1156. [Google Scholar] [CrossRef] [Green Version]
  45. Liu, C.; Chen, M.; Zhou, D.; Wu, D.; Yu, W. Effect of Filler Shape on the Thermal Conductivity of Thermal Functional Composites. J. Nanomater. 2017, 2017, 6375135. [Google Scholar] [CrossRef] [Green Version]
  46. Lee, J.; Yun, T.S.; Choi, S.-U. The Effect of Particle Size on Thermal Conduction in Granular Mixtures. Materials 2015, 8, 3975–3991. [Google Scholar] [CrossRef] [Green Version]
  47. Zhao, Y.; Zhai, Z.; Drummer, D. Thermal Conductivity of Aluminosilicate- and Aluminum Oxide-Filled Thermosets for Injection Molding: Effect of Filler Content, Filler Size and Filler Geometry. Polymers 2018, 10, 457. [Google Scholar] [CrossRef] [Green Version]
  48. Miracon Two Components Heat Resistance Epoxy Lamination System; 2020. Available online: https://www.miracon.com.my/epoxy-tooling-system/ (accessed on 12 February 2022).
  49. Bin Hussin, R.; Bin Sharif, S.; Rahim, S.Z.B.A.; Bin Suhaimi, M.A.; Khushairi, M.T.B.M.; El-Hadj, A.A.; Bin Shuaib, N.A. The potential of metal epoxy composite (MEC) as hybrid mold inserts in rapid tooling application: A review. Rapid Prototyp. J. 2021, 27, 1069–1100. [Google Scholar] [CrossRef]
  50. Zhao, S.; Schadler, L.S.; Duncan, R.; Hillborg, H.; Auletta, T. Mechanisms leading to improved mechanical performance in nanoscale alumina filled epoxy. Compos. Sci. Technol. 2008, 68, 2965–2975. [Google Scholar] [CrossRef]
  51. Sarkar, P.; Modak, N.; Sahoo, P. Mechanical and Tribological Characteristics of Aluminium Powder filled Glass Epoxy Composites. Mater. Today Proc. 2018, 5, 5496–5505. [Google Scholar] [CrossRef]
  52. Kumar, T.S.; Shivashankar, G.; Dhotey, K.; Singh, J. Experimental study wear rate of glass fibre reinforced epoxy polymer composites filled with aluminium powder. Mater. Today Proc. 2017, 4, 10764–10768. [Google Scholar] [CrossRef]
  53. Martin, M.; Hanagud, S.; Thadhani, N. Mechanical behavior of nickel+aluminum powder-reinforced epoxy composites. Mater. Sci. Eng. A 2007, 443, 209–218. [Google Scholar] [CrossRef]
  54. Liang, M.; Wong, K. Study of Mechanical and Thermal Performances of Epoxy Resin Filled with Micro Particles and Nanoparticles. Energy Procedia 2017, 110, 156–161. [Google Scholar] [CrossRef]
  55. ASTM D792-20; Standard Test Methods for Density and Specific Gravity (Relative Density) of Plastics by Displacement. ASTM: West Conshohocken, PA, USA, 2020.
  56. ASTM D2240; Standard Test Method for Rubber Property—Durometer Hardness. ASTM: West Conshohocken, PA, USA, 2017; Volume 5.
  57. Kalpakjian, S.; Schmid, S.R. Manufacturing Engineering and Technology, 8th ed.; Pearson: London, UK, 2020. [Google Scholar]
  58. ASTM D 695; Standard Test Method for Compressive Properties of Rigid Plastics. ASTM: West Conshohocken, PA, USA, 2016; Volume 3.
  59. ISO 3167; ISO 3167 Plastics—Multipurpose Test Specimens. ISO: Geneva, Switzerland, 2014. Available online: https://www.iso.org/standard/65105.html (accessed on 25 March 2022).
  60. Bhagyashekar, M.S.; Rao, K.; Rao, R.; Bhagyashekar, M.S.; Rao, K.; Rao, R. Studies on Rheological and Physical Properties of Metallic and Non-metallic Particulate Filled Epoxy Composites. J. Reinf. Plast. Compos. 2008, 28, 2869–2878. [Google Scholar] [CrossRef]
  61. Yemam, D.M.; Kim, B.-J.; Moon, J.-Y.; Yi, C. Mechanical Properties of Epoxy Resin Mortar with Sand Washing Waste as Filler. Materials 2017, 10, 246. [Google Scholar] [CrossRef] [Green Version]
  62. Tomori, T.; Melkote, S.; Kotnis, M. Injection mold performance of machined ceramic filled epoxy tooling boards. J. Mater. Process. Technol. 2004, 145, 126–133. [Google Scholar] [CrossRef]
  63. Chen, H.; Ginzburg, V.V.; Yang, J.; Yang, Y.; Liu, W.; Huang, Y.; Du, L.; Chen, B. Thermal conductivity of polymer-based composites: Fundamentals and applications. Prog. Polym. Sci. 2016, 59, 41–85. [Google Scholar] [CrossRef]
  64. Mai, V.-D.; Lee, D.-I.; Park, J.-H.; Lee, D.-S. Rheological Properties and Thermal Conductivity of Epoxy Resins Filled with a Mixture of Alumina and Boron Nitride. Polymers 2019, 11, 597. [Google Scholar] [CrossRef]
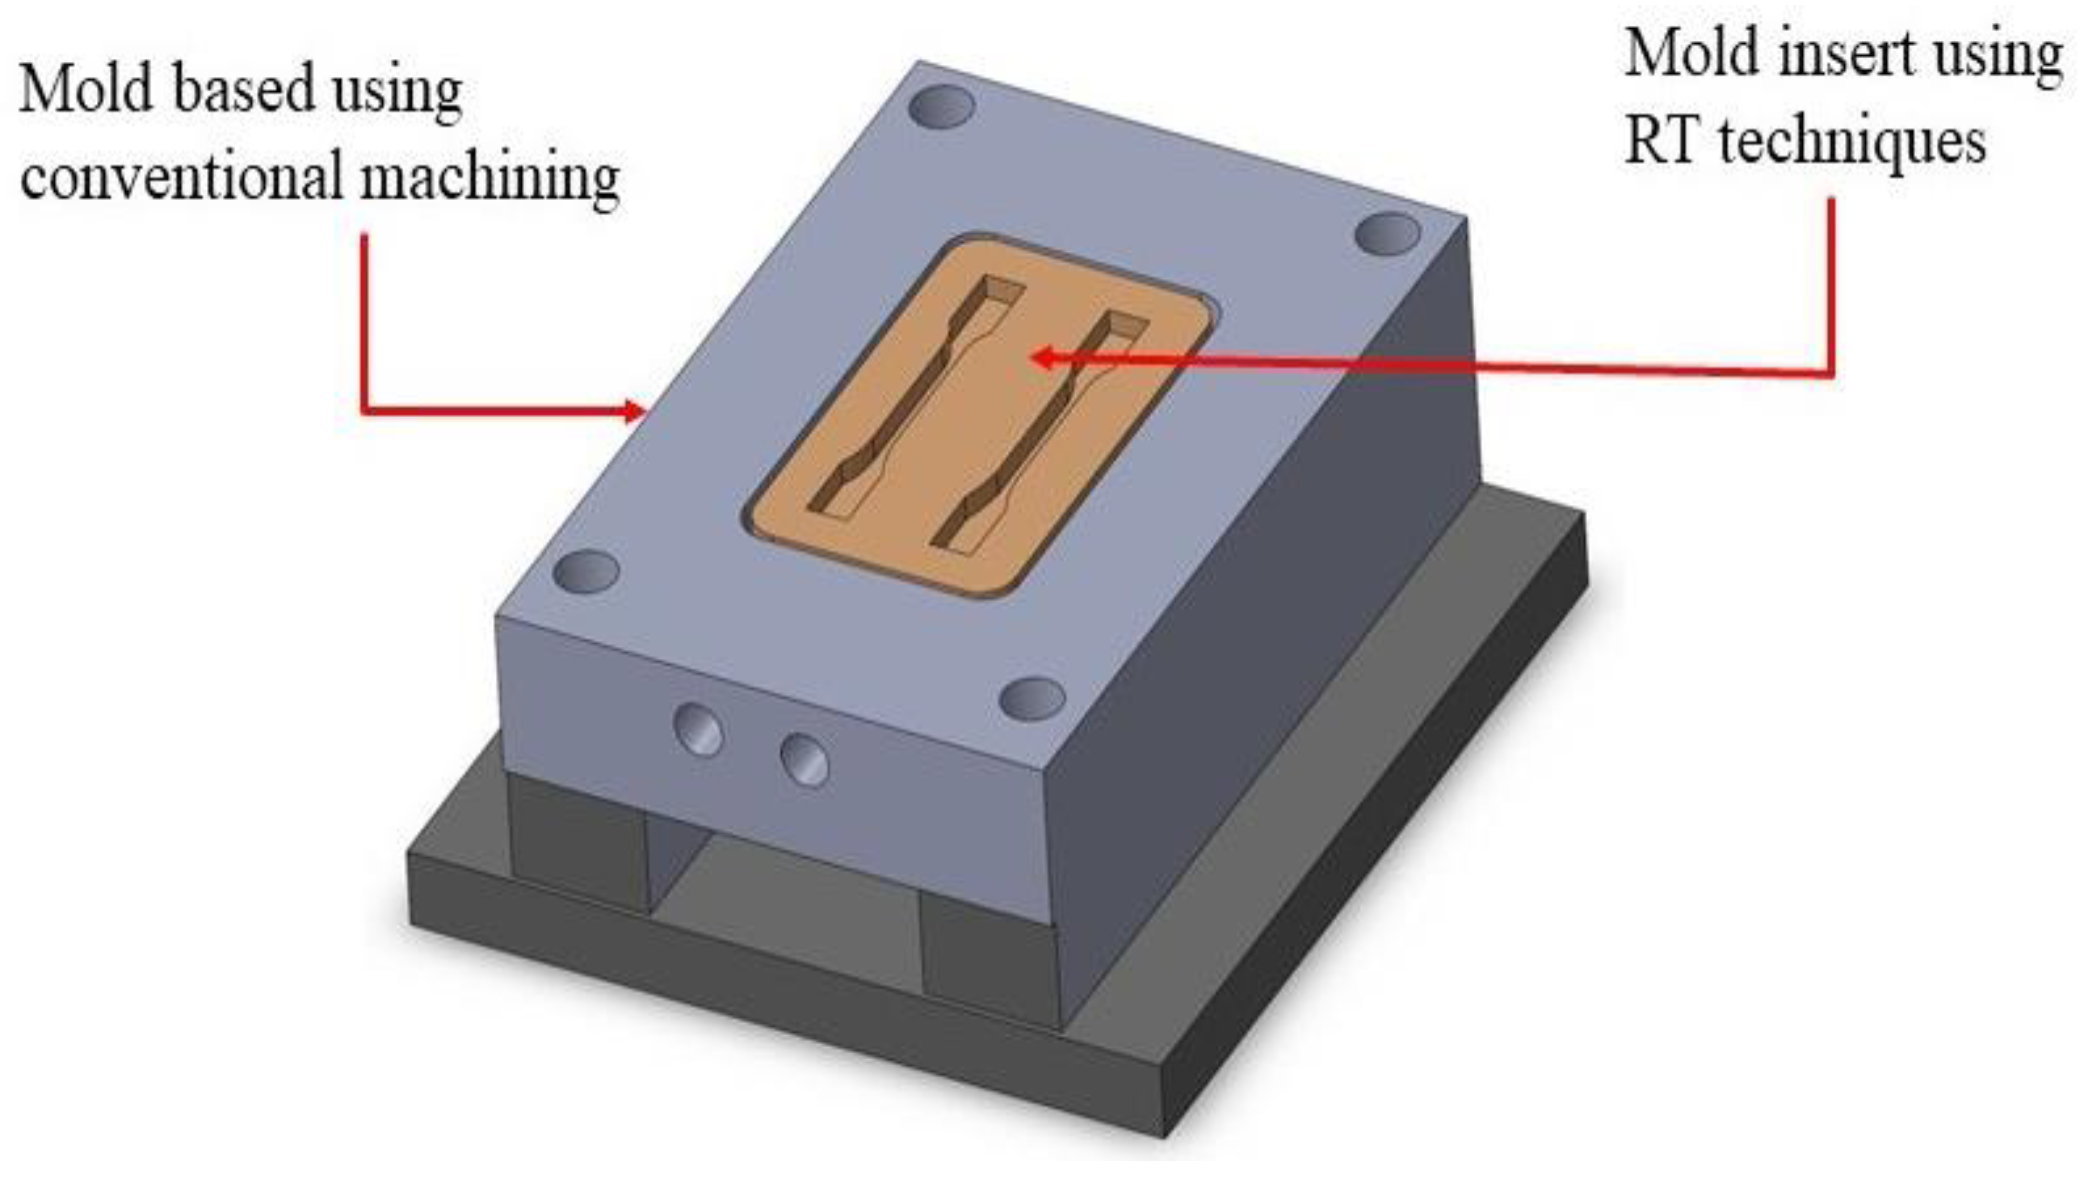
Figure 1. The hybrid-mold concept.
Jmmp 06 00134 g001
Figure 2. Flow Chart.
Jmmp 06 00134 g002
Figure 3. Particle size and shape.
Jmmp 06 00134 g003
Figure 4. Specimen preparation.
Jmmp 06 00134 g004
Figure 5. Positions of microstructure.
Jmmp 06 00134 g005
Figure 6. Optical micrographs of the 30% copper filled epoxy.
Jmmp 06 00134 g006
Figure 7. Density Test.
Jmmp 06 00134 g007
Figure 8. Hardness Test.
Jmmp 06 00134 g008
Figure 9. Compression test.
Jmmp 06 00134 g009
Figure 10. Thermal conductivity test.
Jmmp 06 00134 g010
Figure 11. Cavity insert design.
Jmmp 06 00134 g011
Figure 12. Effects of fillers on Density.
Jmmp 06 00134 g012
Figure 13. Effects of fillers on the hardness.
Jmmp 06 00134 g013
Figure 14. Effects of fillers on compressive strength.
Jmmp 06 00134 g014
Figure 15. Effects of fillers on thermal conductivity.
Jmmp 06 00134 g015
Figure 16. Summary of trend results.
Jmmp 06 00134 g016
Figure 17. Compressive strength test result for EBC filler.
Jmmp 06 00134 g017
Figure 18. Thermal conductivity test result for EBC filler.
Jmmp 06 00134 g018
Figure 19. Transient thermal analysis at high compressive strength.
Jmmp 06 00134 g019
Figure 20. Transient thermal analysis at high thermal conductivity.
Jmmp 06 00134 g020
Figure 21. Transient thermal analysis graph at high compressive strength.
Jmmp 06 00134 g021
Figure 22. Transient thermal analysis graph at high thermal conductivity.
Jmmp 06 00134 g022
Figure 23. MEC mold insert (60% copper filler).
Jmmp 06 00134 g023
Table 1. Filler Properties.
FillerShapeParticle Size (mm)Metal Contents (%)
AluminumSpherical40–65 µm99
BrassIrregular10–100 µm95
CopperIrregular10–100 µm99
Table 2. Composition of MEC for one set of specimens.
No.Type of FillersMixing Composition (grams)Total (100%)
Metal Fillers (± 1.5%)Epoxy ResinHardener
1.(EA, EB or EC)10%7.0 g60%42.0 g30%21.0 g70 g
2.15%10.5 g56.7%39.7 g28.3%19.8 g70 g
3.20%14.0 g53.3%37.3 g26.7%18.7 g70 g
4.25%17.5 g50%35.0 g25%17.5 g70 g
5.30%21.0 g46.7%32.7 g23.3%16.3 g70 g
6.35%24.5 g43.3%30.3 g21.7%15.2 g70 g
7.40%28.0 g40%28.0 g20%14.0 g70 g
8.50%35.0 g33.3%23.3 g16.7%11.7 g70 g
9.60%42.0 g26.7%18.7 g13.3%9.3 g70 g
Table 3. Properties of mold insert material at high compression value.
PropertyUnitEBECEBC
Percentage composition %20 (±1.5%)25 (±1.5%)30 (±1.5%)
Density, ρ g/cm31.48
(+0.02/−0.03)
1.51
(+0.02/−0.02)
1.70
(+0.08/−0.07)
Specific Heat, C p J/kg·K130013001300
Thermal Conductivity, k s t W/m·C1.03
(+0.09/−0.05)
1.34
(+0.08/−0.05)
1.29
(+0.08/−0.06)
CompressionMPa100.3
(+2.71/−2.14)
92.30
(+2.13/−2.88)
93.01
(+1.08/−1.65)
Coeff. of Thermal Expansion, CTE1/C3.5 to 5.0·10−6
Table 4. Properties of mold insert material at high thermal conductivity value.
PropertyUnitEBECEBC
Percentage composition%60 (±1.5%)60 (±1.5%)60 (±1.5%)
Density, ρ g/cm32.50
(+0.08/−0.07)
2.24
(+0.05/−0.06)
2.42
(+0.00/−0.01)
Specific Heat, C p J/kg·K130013001300
Thermal Conductivity, k s t W/m·C1.70
(+0.09/−0.06)
2.66
(+0.15/−0.08)
1.89
(+0.10/−0.09)
CompressionMPa84.00
(+1.43/−3.91)
80.20
(+1.51/−1.69)
80.87
(+0.57/−1.41)
Coeff. of Thermal Expansion, CTE1/C3.5 to 5.0·10−6
Table 5. Transient thermal analysis parameter settings.
NoParameterSetting
iStep2 (step 1 = 4 s, step 2 = 100 s)
iiMold temperature (initial condition)70 °C
iiiWater Temperature35 °C
ivConvection coefficient (cooling channel)(a) 5098 W/m2 °C
vEjection Temperature110 °C
viMelt Temperature(b) 245 °C
viiDiameter of cooling channel(c) 0.08 m
Table 6. Summary of Density values for EA, EB, and EC.
Filler TypePercentage Filler Composition (±1.5%)
10%15%20%25%30%35%40%50%60%
EAAverage1.211.271.321.361.381.451.491.591.69
+0.010.000.010.010.010.010.000.020.00
0.010.000.000.010.000.010.010.010.01
EBAverage1.261.411.481.631.741.851.982.262.50
+0.010.020.020.030.080.010.040.050.08
0.000.010.030.030.120.020.080.140.07
ECAverage1.251.311.401.511.631.691.862.022.24
+0.020.010.050.020.030.020.030.060.05
0.010.010.030.020.020.020.040.070.06
Table 7. Summary of Vickers hardness values for EA, EB, and EC.
Filler TypePercentage Filler Composition (±1.5%)
10%15%20%25%30%35%40%50%60%
EAAverage18.7419.5620.3421.0821.6222.1822.7023.4624.48
+0.260.240.660.420.380.120.300.140.53
0.640.260.440.480.520.180.200.261.18
EBAverage22.0423.2824.3624.8425.4625.8026.3026.9827.90
+1.060.820.240.160.240.200.400.320.40
0.741.280.160.140.260.400.300.580.60
ECAverage19.1820.3421.3622.0822.9623.5223.9424.7225.36
+0.620.361.240.820.640.580.660.680.44
0.281.141.360.380.661.021.040.720.46
Table 8. Summary of Compressive strength values for EA, EB, and EC.
Filler TypePercentage Filler Composition (±1.5%)
10%15%20%25%30%35%40%50%60%
EAAverage73.7578.3087.4993.5688.5080.2977.9476.5974.85
+1.772.022.160.871.001.841.641.781.49
0.873.852.841.001.491.351.161.210.86
EBAverage82.1789.97100.2998.2893.3590.3886.8385.1184.00
+1.602.062.711.851.982.162.702.591.43
2.531.332.142.452.020.984.054.393.91
ECAverage78.7283.0091.7792.3087.0283.1982.1981.3780.20
+2.562.441.462.132.401.702.681.751.45
2.863.161.902.881.701.922.741.281.52
Table 9. Summary of Thermal conductivity values for EA, EB, and EC.
Filler TypePercentage Filler Composition (±1.5%)
10%15%20%25%30%35%40%50%60%
EAAverage0.690.720.740.820.850.950.971.091.24
+0.100.060.150.200.170.070.090.080.04
0.090.060.080.110.100.060.080.100.05
EBAverage0.830.851.031.111.211.311.401.571.70
+0.050.140.090.090.160.060.090.100.09
0.060.080.050.110.230.080.090.080.06
ECAverage1.021.071.211.341.631.892.212.462.66
+0.070.090.100.080.080.090.090.080.15
0.070.080.120.050.080.120.100.060.08
Table 10. Summary of compressive strength values for EBC, EB, and EC.
Filler TypePercentage Filler Composition (±1.5%)
10%15%20%25%30%35%40%50%60%
EBCAverage81.3482.8787.5692.9893.0186.8783.5481.6680.87
+1.332.000.740.821.081.171.351.110.57
2.400.980.681.621.650.891.210.671.41
EBAverage82.1789.97100.2998.2893.3590.3886.8385.1184.00
+1.602.062.711.851.982.162.702.591.43
2.531.332.142.452.020.984.054.393.91
ECAverage78.7283.0091.7792.3087.0283.1982.1981.3780.20
+2.562.441.462.132.401.702.681.751.51
2.863.161.902.881.701.922.741.281.69
Table 11. Summary of Thermal conductivity values for EBC, EB, and EC.
Filler TypePercentage Filler Composition (±1.5%)
10%15%20%25%30%35%40%50%60%
EBCAverage0.850.891.021.161.291.401.481.671.89
+0.050.050.070.050.080.060.080.040.10
0.060.050.050.090.060.050.050.090.09
EBAverage0.830.851.031.111.211.311.401.571.70
+0.050.140.090.090.160.060.090.100.09
0.070.080.050.110.230.080.090.080.06
ECAverage0.051.071.211.341.631.892.212.462.66
+0.140.090.100.080.080.090.090.080.15
0.090.080.120.050.080.120.100.060.08
Table 12. Result of cooling time.
MEC MaterialHigh Compressive StrengthHigh Thermal Conductivity
Cooling Time% Composition (±1.5%)Cooling Time% Composition (±1.5%)
EB24.8 s2023.75 s60
EC20.5 s2518.9 s60
EBC23.7 s3022.62 s60
Table 13. Material properties of MEC mold insert (60% copper filler).
Experiment TestDensity2.24 g/cm3
Hardness25.36 Hv
Compressive Strength80.20 MPa
Thermal Conductivity2.66 WmK−1
Simulation TestCooling time18.9 s
Microstructural Image (filler distribution)Jmmp 06 00134 i001
Publisher’s Note: MDPI stays neutral with regard to jurisdictional claims in published maps and institutional affiliations.