Article

Structure and Mechanical Properties of Laser Powder Bed-Fused and Wrought PH13-8Mo-Type Precipitation Hardening Stainless Steels: Comparative Study

by
William Turnier Trottier
,
Alena Kreitcberg
and
Vladimir Brailovski
*
Department of Mechanical Engineering, École de Technologie Supérieure, 1100 Notre-Dame Street West, Montreal, QC H3C 1K3, Canada
*
Author to whom correspondence should be addressed.
J. Manuf. Mater. Process. 2021, 5(3), 67; https://doi.org/10.3390/jmmp5030067
Submission received: 20 May 2021 / Revised: 17 June 2021 / Accepted: 23 June 2021 / Published: 25 June 2021

Abstract

:
This work focuses on the structure and properties of a laser powder bed-fused (LPBF) precipitation hardening stainless steel and its chemically analogous wrought counterpart, both subjected to an identical combination of solution and aging treatments with the objective of maximizing the material hardness. It was observed that both the LPBF and wrought alloy follows similar evolution of their phase composition, microstructure, and mechanical properties throughout the different stages of the technological workflow. After a solution treatment at 850 °C for 0.5 h and an aging at 525 °C for 2 h, both alloys achieve their highest hardness of ~50 HRC. Notwithstanding this similarity, the LPBF alloy offers a finer microstructure and a lower amount of retained austenite than its wrought counterpart. This microstructure provides comparable strength characteristics to both the LPBF and wrought alloys, while offering a significantly higher ductility to the former as compared to the latter. The elongation at break of the LPBF alloy is, however, strongly build orientation-dependent, with a measured anisotropy of 23%. This anisotropy is caused by the presence of processing-induced pores (average pore size ~23 µm) in the LPBF alloy preferably distributed in planes oriented perpendicular to the build direction.

1. Introduction

Sales of industrial additive manufacturing (AM) systems, polymeric and metallic combined, have risen by an average of 15.5% since 2016 [1]. This increase is partly due to the new design possibilities they offer, which are either impossible or very costly with standard fabrication methods. The ability to print parts with very complex geometries offers designers the chance to optimize their products for bespoke applications. For example, an optimized placement of cooling channels in injection molds using the so-called “conformal cooling” process helps to uniformize the temperature and shorten the time of production of molded parts, while decreasing the risk of part distortions [1,2,3]. This liberation from the previous design paradigms creates an increasing demand for novel AM materials, such as precipitation hardening stainless steels, for example. These materials are mainly chosen for applications requiring high mechanical strength, corrosion resistance, and hardness [4,5,6], such as tooling, medical, and marine applications [7]. These metallic alloys achieve their high strength and hardness characteristics with the precipitation of intermetallic compounds in martensitic structures [8].
Recently, EOS GmbH introduced a new maraging stainless steel called Stainless Steel CX (SS CX) for use in laser powder bed fusion (LPBF). As a wrought alloy, Uddeholm Corrax® is chemically analogous to EOS SS CX. Both alloys belong to the PH13-8Mo family of low carbon precipitation hardening martensitic stainless steels [6], and their structural hardening mechanisms are expected to be the same [9]. In the initial (as-built) state, a PH13-8Mo-type LPBF stainless steel is expected to be mainly composed of martensite (M) blocks arranged in packets, with this morphology of martensite attributable to the low carbon content of the alloy (<0.06 wt.%) [10]. Furthermore, SS CX contains a significant amount of nickel (7.5–8.5 wt.%), which plays the role of austenite stabilizer and could lead to residual austenite (RA) being present in this alloy at room temperature. Indeed, despite the nature of the LPBF process, in which cooling rates go up to 107 deg/s [11], a significant amount of RA was found in the LPBF EOS SS CX steel. This amount varied as a function of the orientation of LPBF specimens during printing: ~10% in specimens oriented perpendicular to the build direction and ~2% in specimens oriented parallel to the build direction [7]. Notwithstanding the fact that there is no consensus on the solidification and solid-state phase transformation paths in LPBF PH steels, one plausible explanation for the heterogeneous distribution of RA in LPBF parts is the occurrence of the microsegregation-related phenomena in the presence of strongly heterogeneous temperature fields.
The maraging stainless steel printing process is generally followed by a solution treatment, which is carried out with a twofold objective: (a) reducing residual stresses introduced during the LPBF thermal cycle and (b) transforming RA into martensite to improve the material properties. The second objective is considered achieved when the RA fraction drops to below 1% [6] as higher amounts lead to a reduction in the alloy toughness and hardness [5]. If a fully martensitic microstructure is desired, a cooling to −78 °C after solution treatment can be carried out [12].
To maximize the material hardness, the solution-treated maraging stainless steel must be subjected to a precipitation hardening aging treatment. For EOS SS CX, aging at 525 °C for 2 h is recommended by the material manufacturer [2]. To maximize the hardness of Uddeholm Corrax®, the wrought analog to the SS CX, the manufacturer recommends aging at 525 °C for 4 h [13,14]. As there is a dearth of studies on the SS CX and Corrax®, a better understanding of their precipitation mechanisms may be obtained by looking into the literature on the PH13-8Mo alloy. For this class of maraging stainless steels, the main structural hardening element is Al [9], which precipitates as β-NiAl [6], and has a B2 superlattice structure (CsCl) [5,8,15]. The size of β-NiAl precipitates after aging was found to be in the range of 8 to 50 nm [6,15]. These spherical precipitates manifest homogeneous nucleation up to 150 nm in size [8], and are coherent with the matrix [6], even after overaging [8].
As EOS SS CX is a relatively novel AM material, only limited information on this alloy is available in the open literature, and the related studies focus primarily on its as-built state [4,7,9,16,17]. In the present work, the structure and mechanical properties of the LPBF SS CX alloy are studied through the following three stages of the technological workflow: 3D printing, solution treatment, and aging. For comparative basis, the same evolution study is performed with Uddeholm Corrax®, a chemically analogous wrought alloy. Note that in both cases, the objective is to reach the highest achievable hardness of the material.

2. Materials and Methods

2.1. Materials and Processing

An SS CX alloy powder was supplied by EOS GmbH (Krailling, Germany) with the following particle size distribution: d10 = 20 µm, d50 = 35 µm, and d90 = 50 µm, while the wrought analog Uddeholm Corrax® was supplied by Voestalpine High Performance Metals Ltd. (Mississauga, ON, Canada) as a 304 × 508 × 25 (mm) plate. An EOS M280 LPBF system equipped with a 400 W Yb-fiber laser was used to print samples from the SS CX powder. The process parameters recommended by EOS GmbH (Krailling, Germany) were applied: laser power 260 W, scanning speed 1067 mm/s, hatching distance 100 µm, and layer thickness 60 µm. The build plate temperature was kept at 80 °C and a stripe scanning strategy involving a rotation of 67° of the laser beam between the layers was applied.
A chemical composition analysis was performed on both alloys in their initial (I) conditions (as-built for SS CX and as-shipped, for Corrax), using a SPECTROMAXx Arc/Spark optical emission spectroscopy unit (Ametek, Inc., Berwyn, PA, USA). Before the tests, the spectrometer was calibrated using a combination of D2 and 1.7225 steel control samples provided by Ametek, Inc. (Berwyn, PA, USA). Five (5) measurements were made on both alloys and the average results of the analyses are presented in Table 1. The standard deviations were left out as they were below 0.05 wt.%.
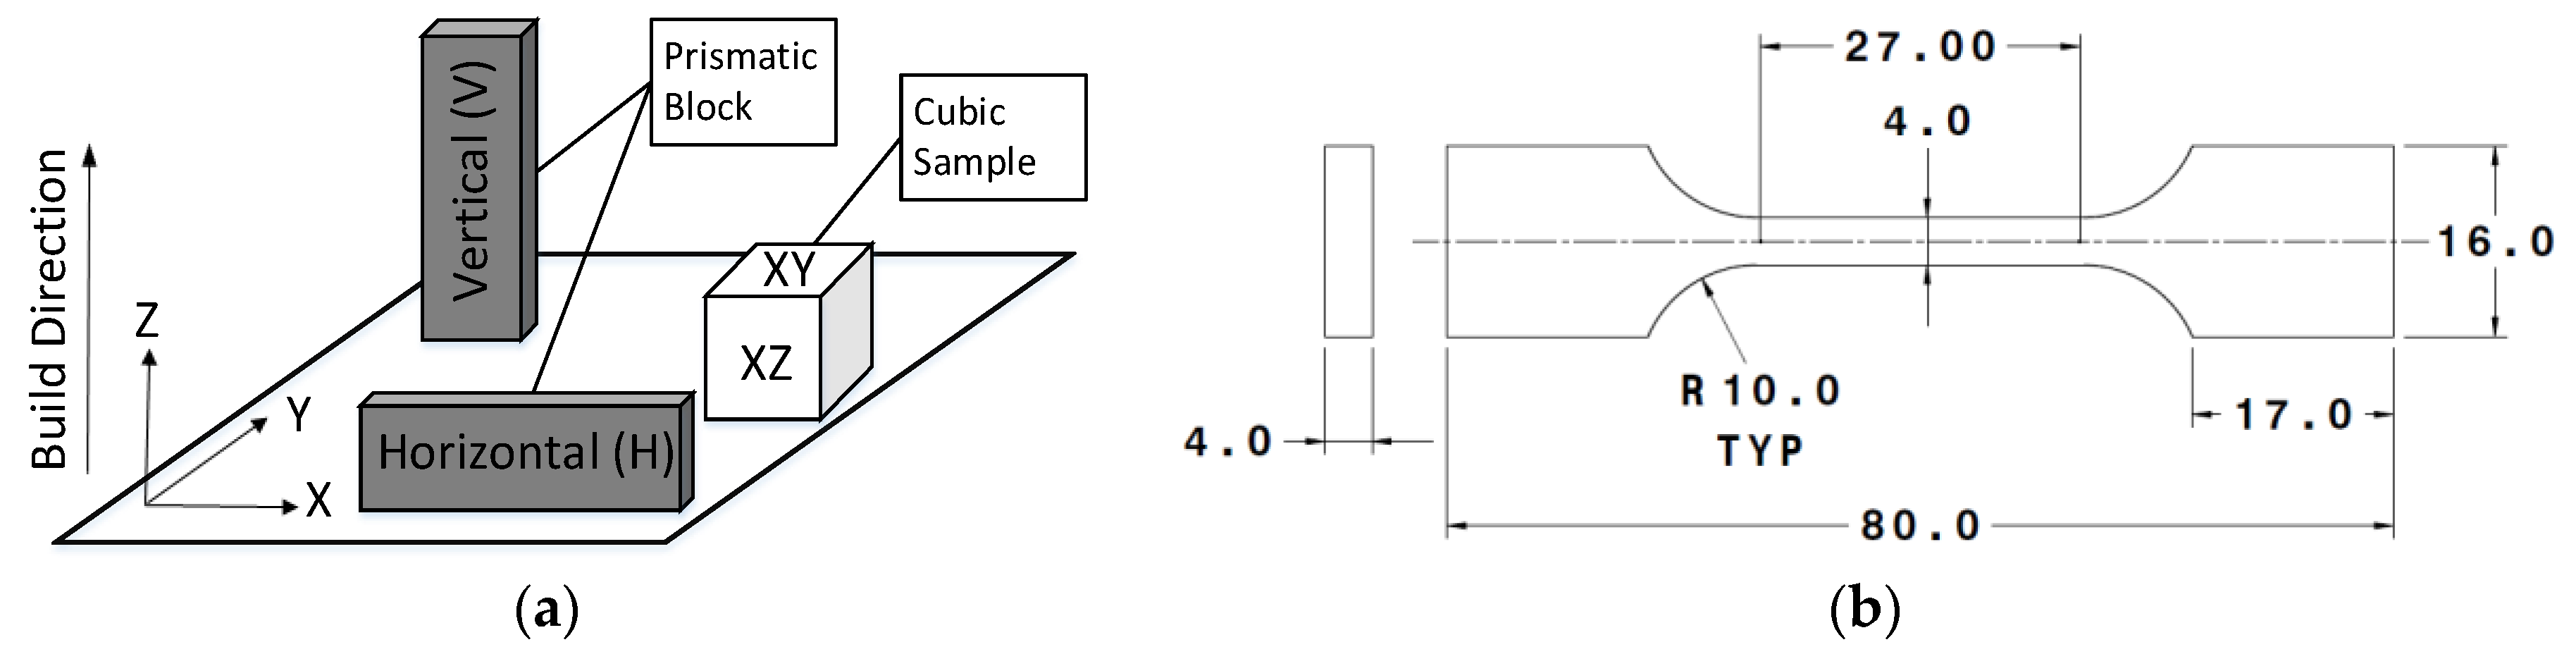
Two types of printed parts were produced for the studies (Figure 1a,b): 12 × 12 × 30 (mm) cubic samples, for the microstructure analysis, and hardness measurements and 20 × 6 × 84 (mm) prismatic blocks, for tensile testing. The cubic samples contained two main planes of interest: XY, perpendicular to the build direction, and XZ, parallel to the build direction. The prismatic blocks were built with two orientations: Vertical (V) with the tensile axis oriented along the build direction (BD), and Horizontal (H), with the tensile axis perpendicular to the BD (Figure 1a). The goal was to machine these prismatic blocks to produce uniaxial tensile testing samples shown in Figure 1b. Prior to the tests, the gauge area of each tensile sample was measured to improve the accuracy of the results obtained.
Directly after printing, all the parts were cut off the building platform and some of the cubic samples reserved in the as-built state for microstructure analysis and hardness measurements. The cubic samples and prismatic blocks of the same geometry were cut from the plate of the wrought alloy. Next, selected SS CX and Corrax® samples were subjected to a recommended solution treatment at 850 °C for 0.5 h under argon atmosphere [2,13] using a Nabertherm N41/H chamber furnace (Nabertherm GmbH, Lilienthal, Germany). After the solution treatment, the samples were cooled down in a protective gas box. Temperature measurements were performed using a K-Type thermocouple installed on the parts inside the protective gas box. To ensure the temperature remained within the target values, it was logged at a 0.5 Hz acquisition rate using a National Instruments NI USB-6210 acquisition card (National Instruments Corp., Austin, TX, USA).
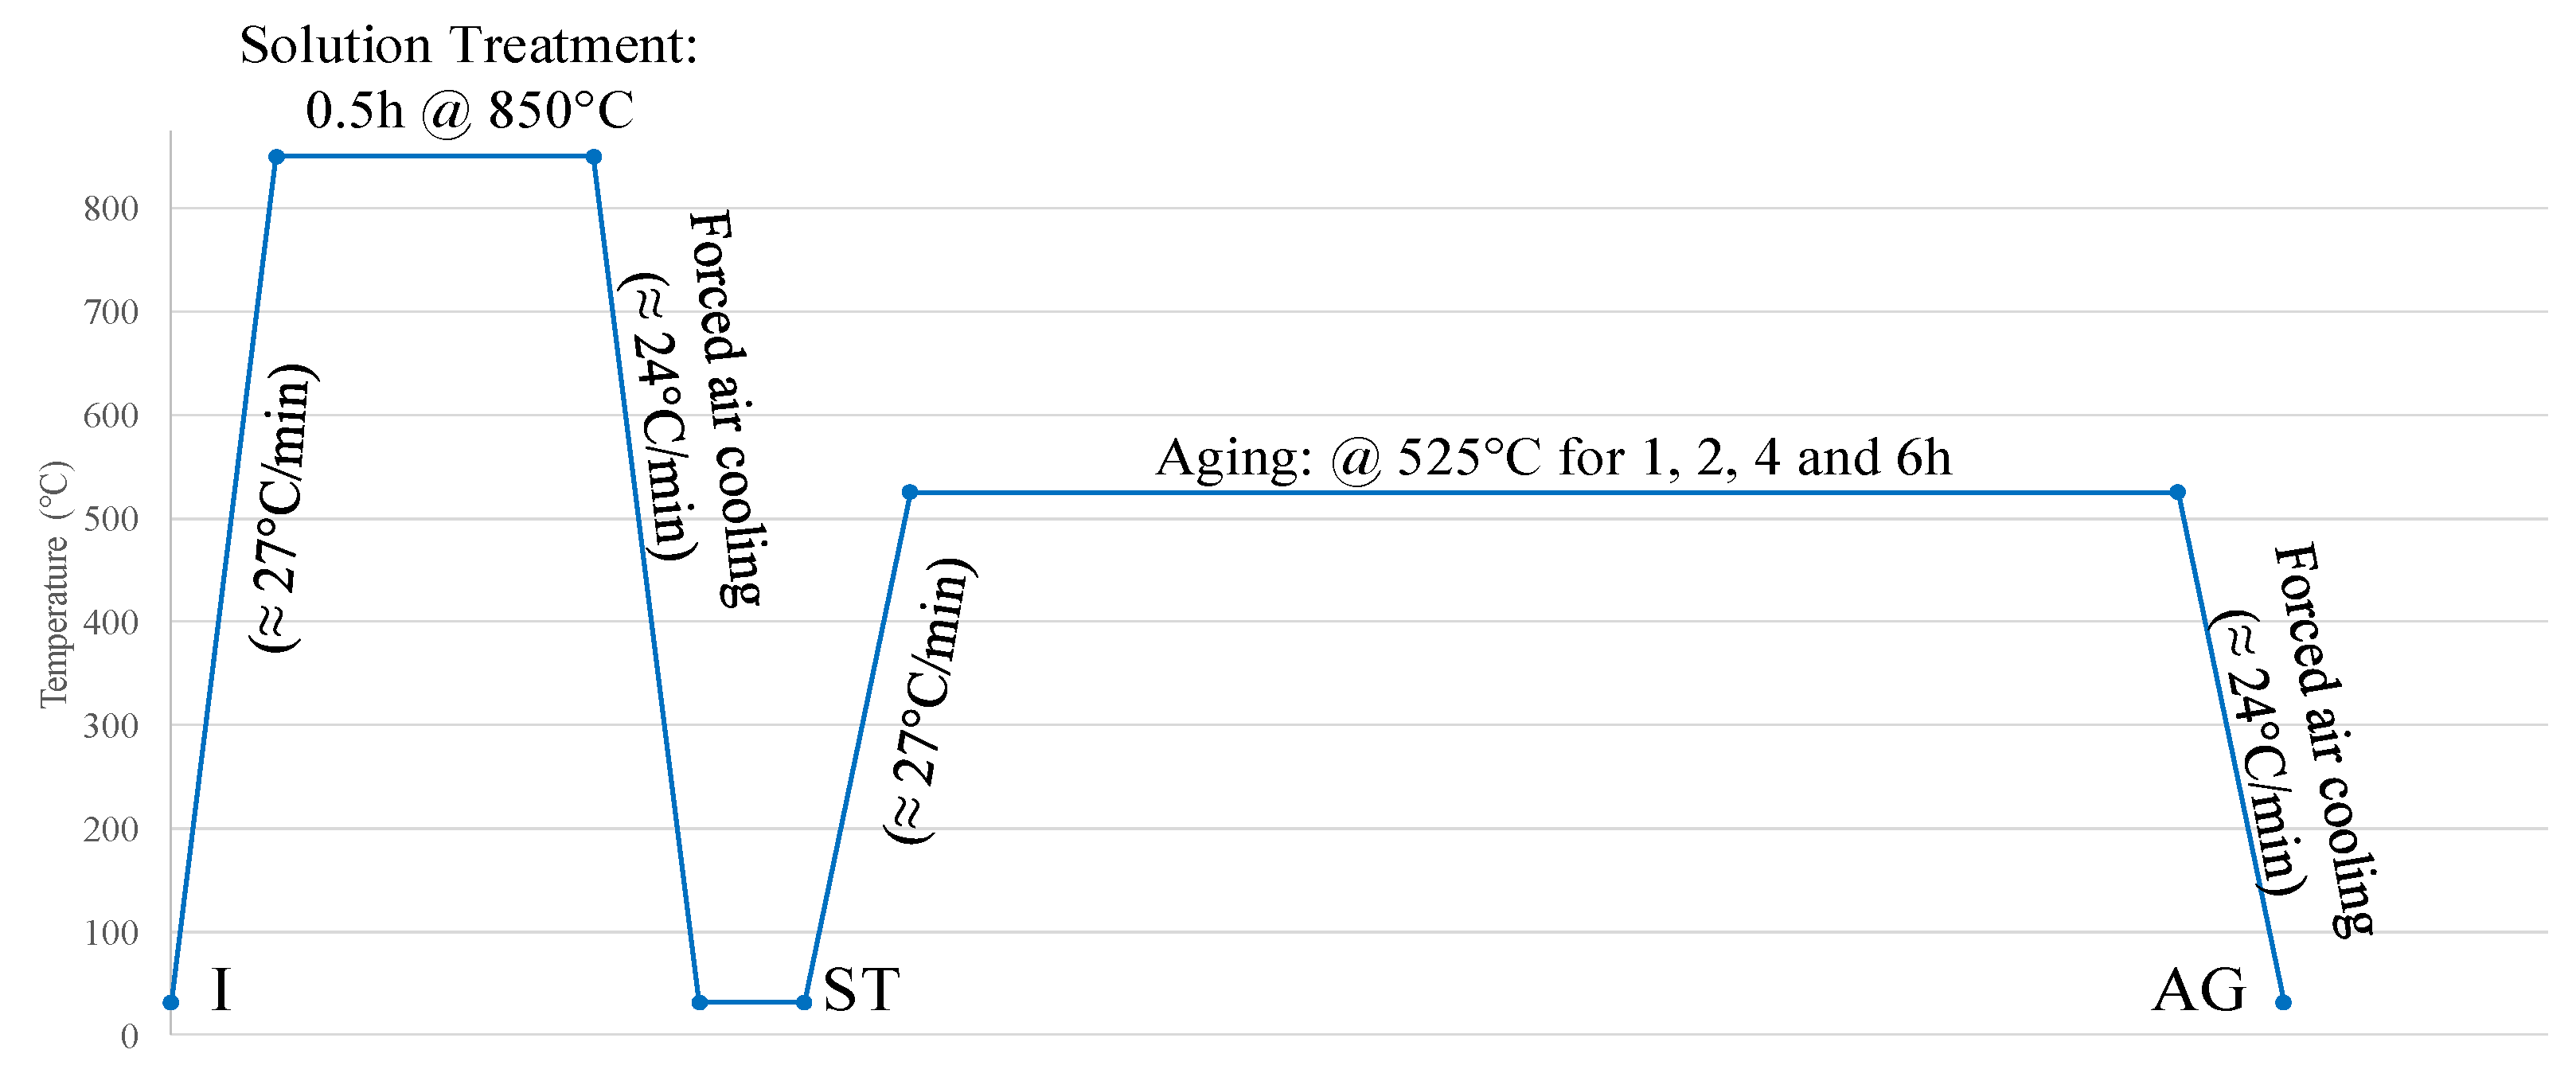
Finally, the solution-treated (ST) cubic samples of the LPBF and wrought alloys were subjected to a precipitation hardening aging treatment at 525 °C for 1, 2, 4, and 6 h (heat treatment profile is shown in Figure 2). The aging temperature of 525 °C was recommended by the manufacturers of both alloys to obtain a maximum hardness of 49–52 HRC [2,14]. However, the recommended aging times for these two alloys differed: for the LPBF SS CX alloy, aging at 525 °C for 2 h [2] was recommended, while for its wrought analog, it was for 4 h at the same temperature [13]. To cover both cases, the aging time was varied from 1 to 6 h, and the time leading to the highest hardness of both alloys was applied to post-treat the LPBF and wrought prismatic blocks. The blocks were finally machined to yield 5 tensile samples for each of the three processing states: initial (I), solution-treated (ST), and aged (AG) (Figure 2). In total, 30 tensile samples of the LPBF alloy (15 per build orientation) and 15 of its wrought equivalents were prepared.

2.2. Mechanical Testing

The hardness and axial tensile properties of both alloys were measured for each of the processing states (I, ST, and AG). For the hardness measurements, cubic samples were machined before the heat treatments to guarantee the parallelism of the surfaces. After the heat treatments, they were polished to remove the oxide layer formed on the surface. The equipment used for the hardness measurement in compliance with ASTM E18-19 [18] was a Mitutoyo HR-400 Rockwell Hardness Tester (Mitutoyo Corporation, Takatsu-ku, Kawasaki, Kanagawa, Japan) with a conical diamond indenter and a 150 kg load. Prior to the tests, a Mitutoyo 50 HRC standard hardness block (Part no: 19BAA039) was used to ensure proper calibration of the machine. Ten measurement (10) points were used on each plane (XY and XZ) and average values and standard deviations were calculated.
For tensile testing in accordance with ASTM E8/E8M-16a [19], an MTS 810 testing system (MTS Systems Corporation, Eden Prairie, MN, USA) equipped with an MTS 647 Hydraulic Wedge Grip, 100 kN load cell (661.20F-03) and MTS axial extensometer (634.12E-24) (calibrated according to the ASTM E83 Class B1) was used. The sample acquisition sample rate was set to 100 Hz and the strain rate, to 0.5 min−1.

2.3. Porosity and Microstructure Analyses

The processing-induced porosity in the as-built LPBF samples was evaluated using a Nikon XTH-225 (Nikon Metrology NV, Tring, UK) micro-computed tomograph (micro-CT) with a 225 kV reflection X-ray source. The gauge areas of the vertical and horizontal tensile specimens were analyzed with a 4.5 × 4.5 × 4.5 (µm) voxel size, a beam energy of 205 kV, and a 49 mA current using a 0.5 mm thick copper filter. The images were reconstructed using CT PRO 3D software (Nikon Metrology NV, Tring, UK), and image postprocessing was performed in the ORS-Dragonfly (Object Research Systems, Montreal, QC, Canada) software environment.
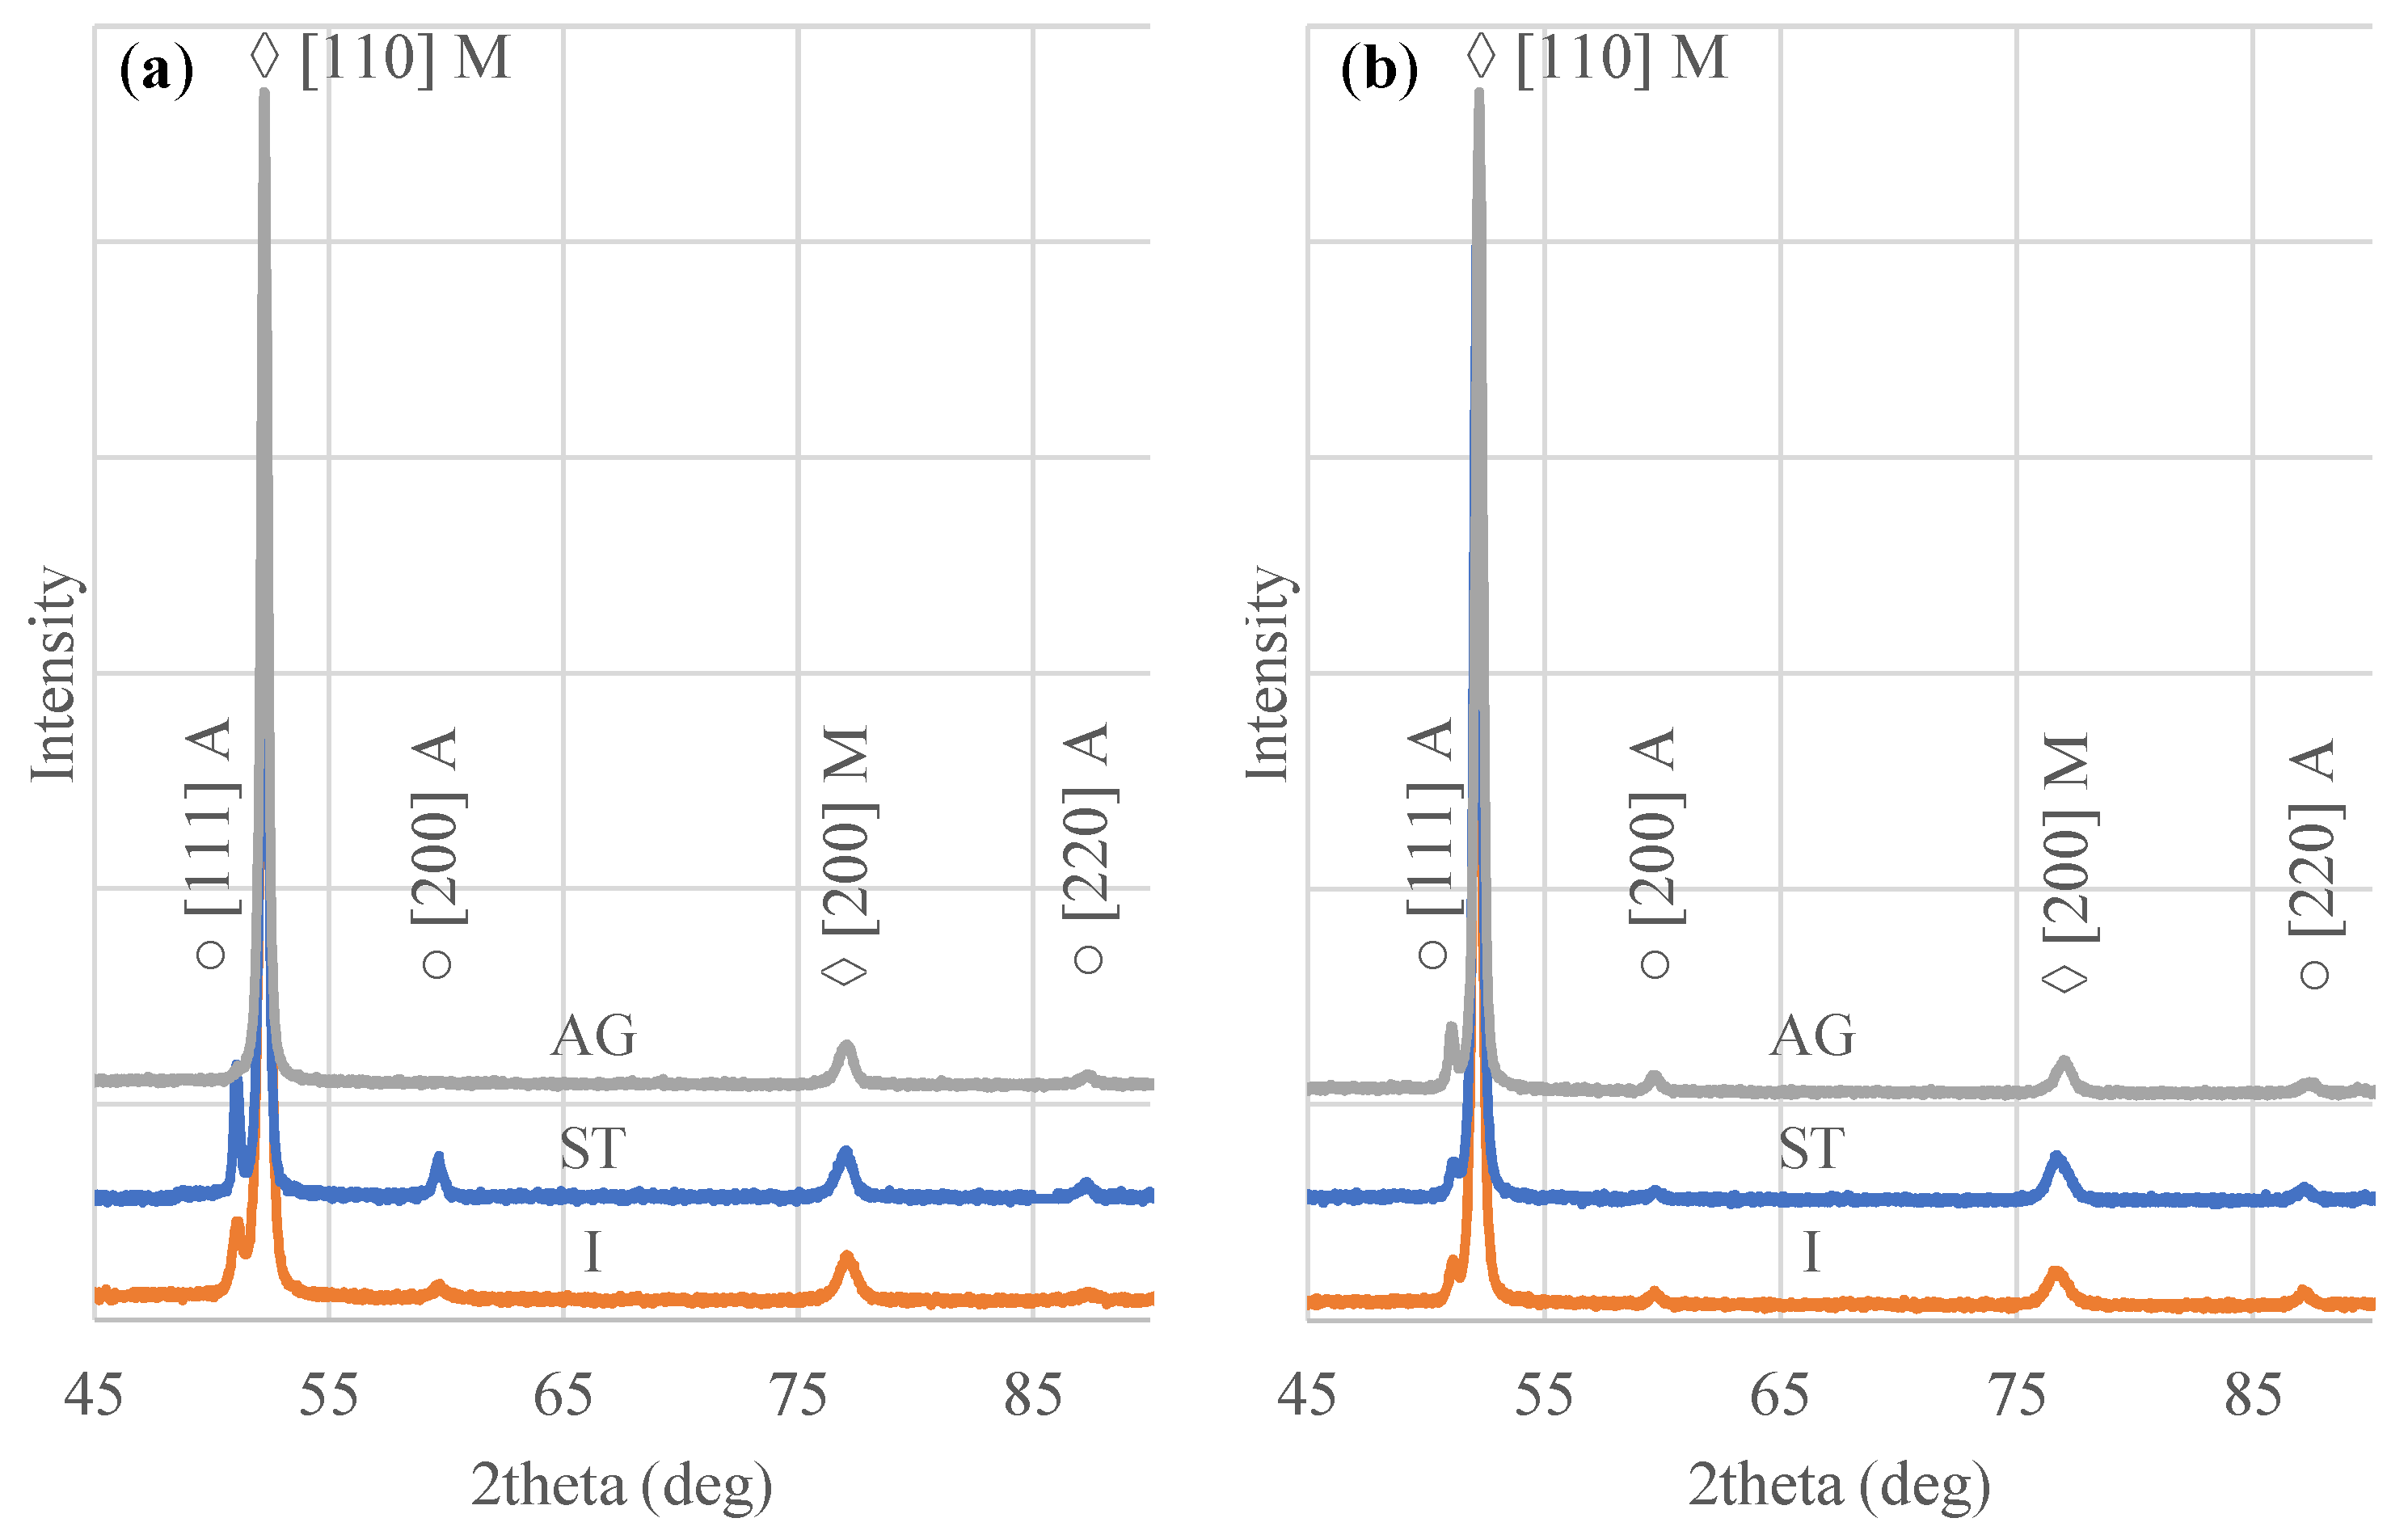
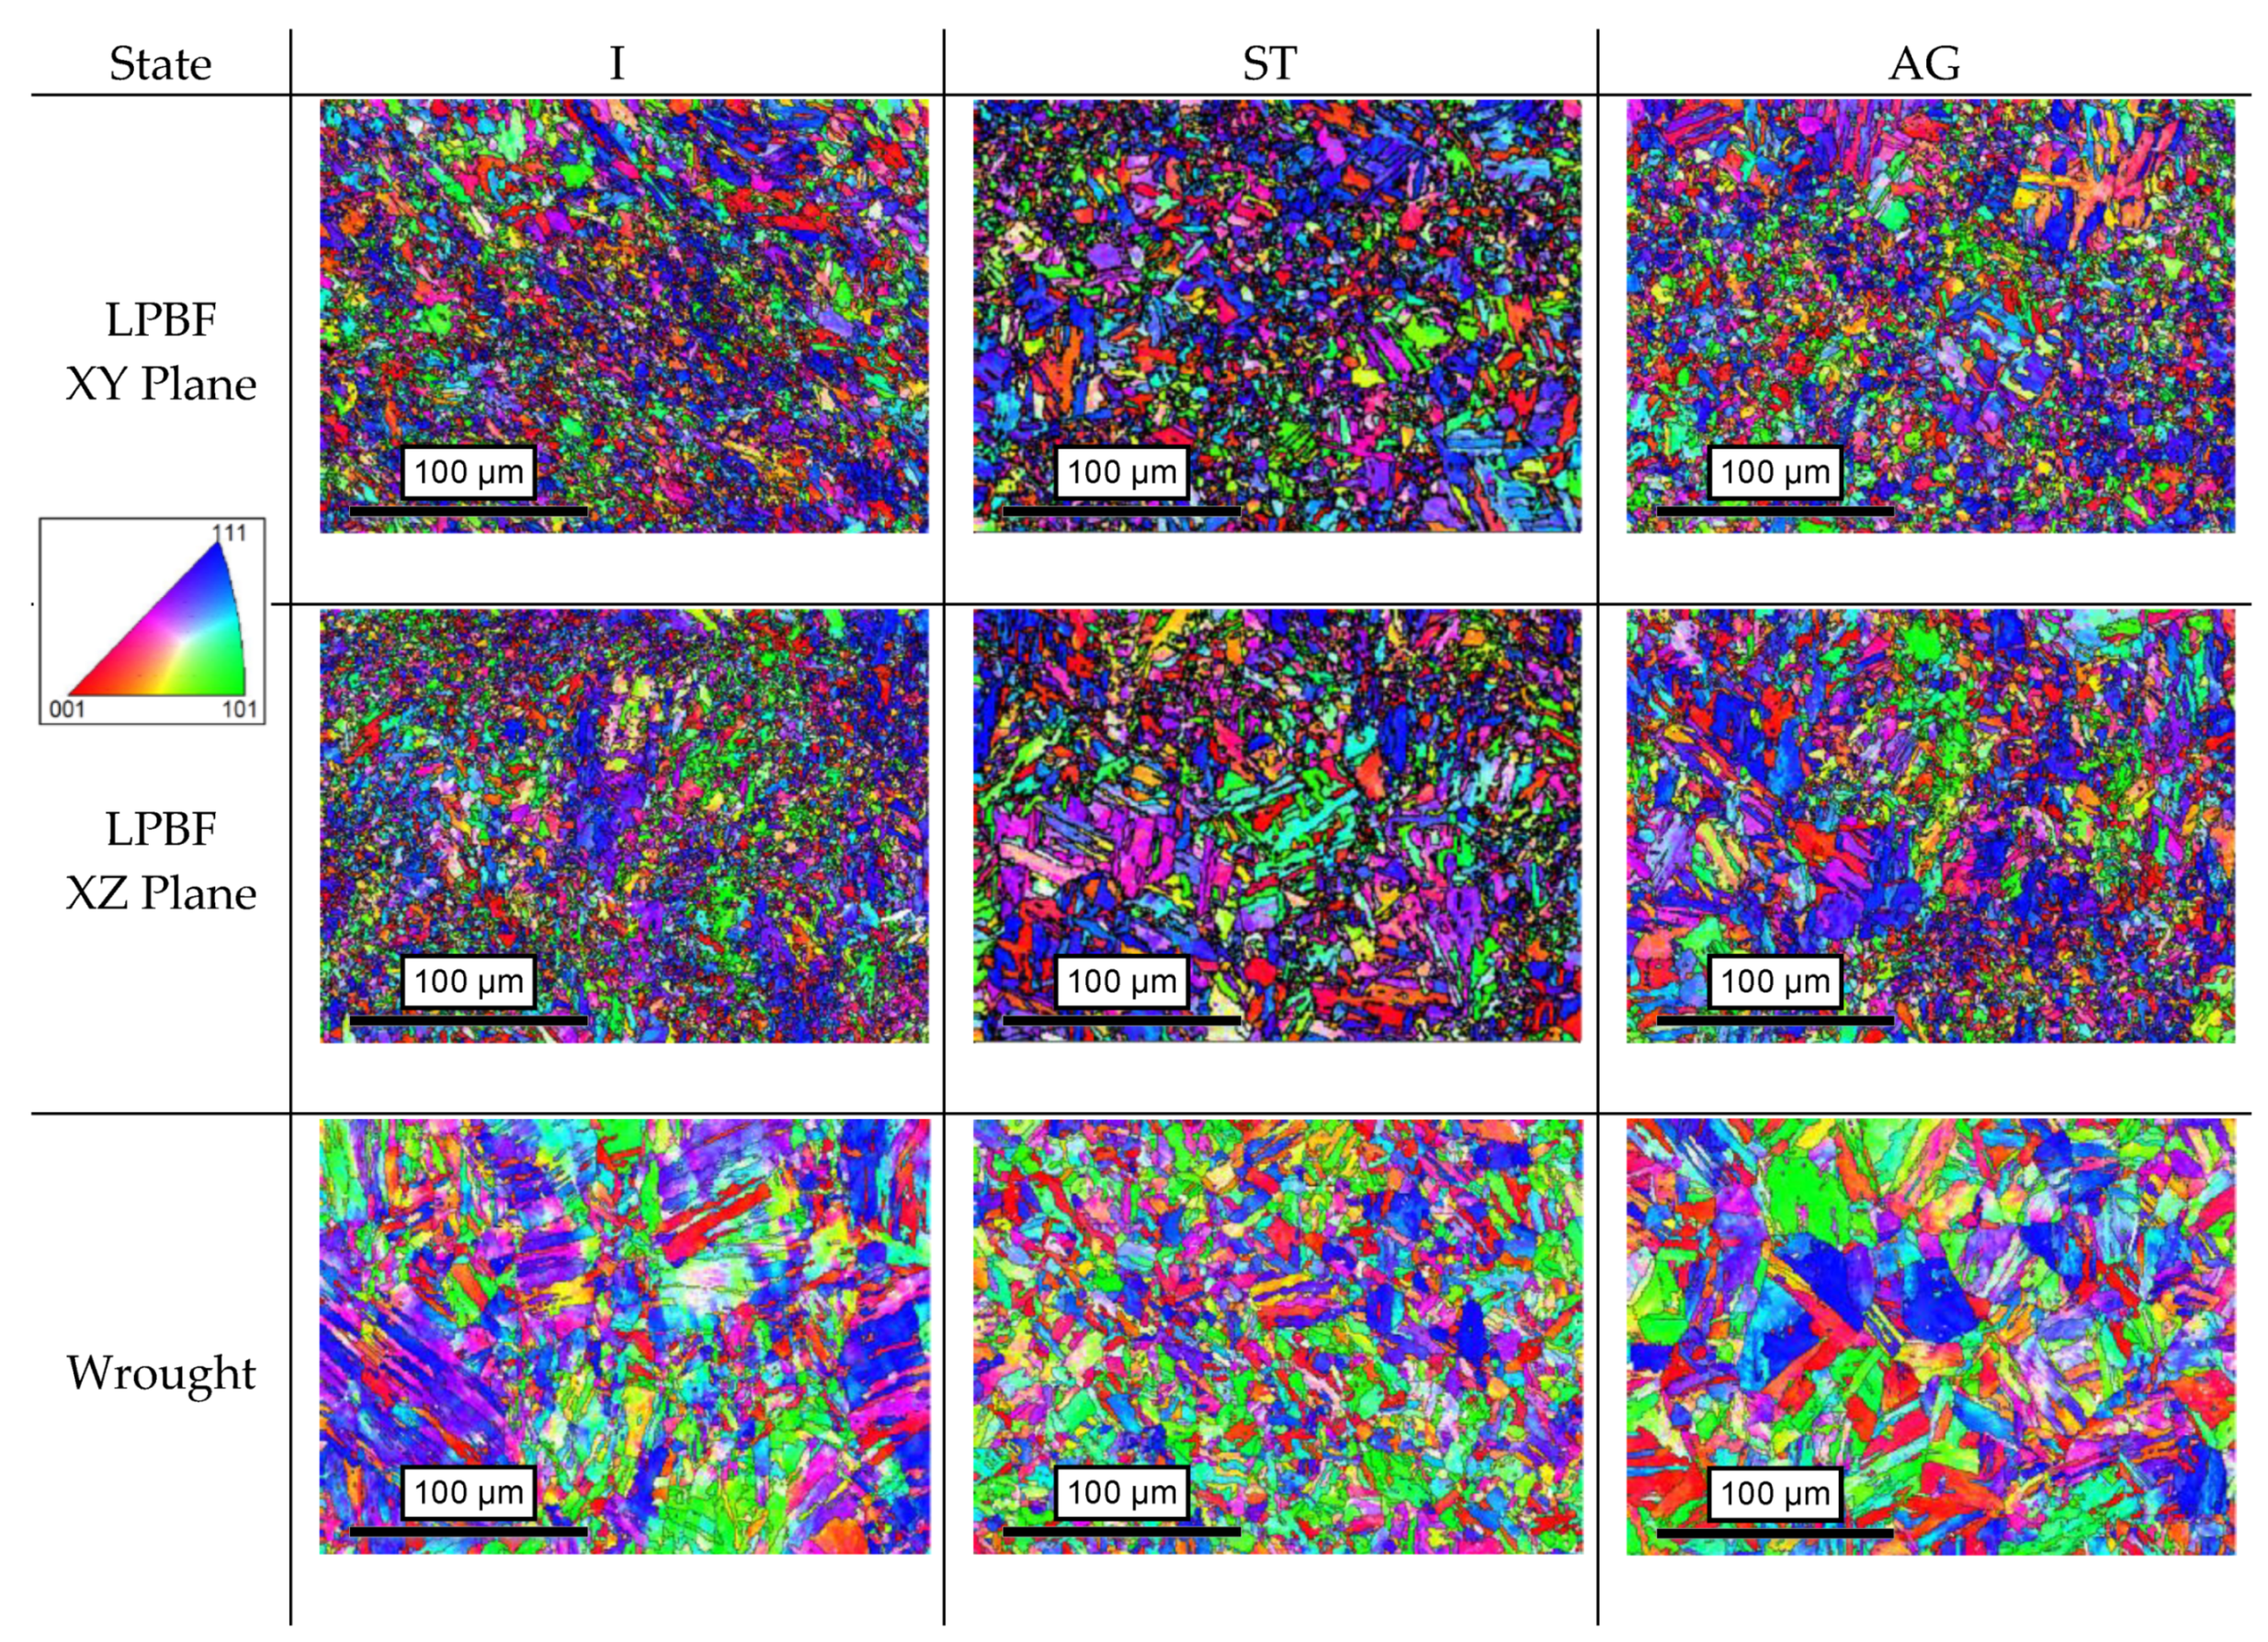
Microstructural analyses were performed on the LPBF and wrought alloys cubic samples in their I, ST, and AG states. Two planes of the SS CX samples (XY and XZ) and only one plane of the wrought samples were used in this study. All the cubic samples were mechanically polished up to a 0.05 µm particle size for the polishing solution. Next, the samples were ion-milled for 5 min using a Hitachi IM4000Plus Ion Milling System with a 4 kV high voltage and a 25 RPM rotation speed. A Hitachi SU8230 scanning electron microscope (SEM) equipped with an electron backscatter diffraction (EBSD) unit and an energy-dispersive X-ray spectroscopy (EDS) unit was used. Prior to the analyses, all the microscopy equipment units were calibrated. The following parameters were used for the EBSD analyses: a magnification of 500×, a step size of 0.1 µm, an aperture of 100 µm, and a scanning voltage of 25 kV. A working distance ranging between 16.1 and 17.4 mm was used. The samples were also tilted by 70°. The phase acquisition was set to ferrite (bcc) and austenite (fcc). After the reconstruction of martensite structural elements (blocks/packets) from the EBSD maps, phase distribution calculations were carried out using HKL2000 software from HKL Research Inc. A precipitation analysis by EDS was carried out on aged samples of both alloys at a 20 kX magnification with a scanning voltage of 5 kV and a fixed working distance of 13.5 mm. The phase compositions were analyzed using an X-ray diffractometer (Panalytical X’Pert3 XRD, Malvern Panalytical, Malvern, UK) with a Co-Kα radiation (λ = 1.7890100 Å), at 45 kV and 40 mA, a 2θ scan range of 45–90°, and a scan step of 0.0167. Prior to the analyses, the XRD was calibrated using a standardized Si sample provided by Malvern Panalytical (Malvern, UK). To calculate the XRD phase composition, the HighScore Plus software by Malvern Panalytical (Malvern, UK) was used with the reference intensity ratio (RIR) method for phase analysis. The main diffracted peaks for austenite and martensite phases were considered. The XRD and EDS analyses of the LPBF cubic samples were limited to the XY plane.

3. Results

3.1. Mechanical Properties

3.1.1. Hardness

Figure 3 and Table 2 present the material hardness evolution of both the LPBF and wrought alloys as a function of their processing states. As seen in Figure 3, both alloys manifest a similar hardness evolution. Although the hardness of the LPBF alloy in the XZ plane is slightly lower than in the XY plane, this difference is not statistically significant (p < 0.05). Furthermore, an aging time of 2 h leads to a maximum hardness of 50 ± 1 HRC in both alloys and both respect a maximum hardness range of 49 to 52 HRC, as specified by the manufacturers [2,14]. After aging for 4 and 6 h, the hardness of the wrought alloy stays within the 49–52 HRC range, while that of the LPBF alloy drops slightly below the manufacturer’s threshold of 49 HRC. As the objective of this study was to compare these alloys when they achieve their maximum hardness, a common aging time of 2 h (525 °C) was applied to all the prismatic blocks used to machine tensile testing samples.
To conclude on the statistical significance of the differences between the results obtained, a multifactor analysis of variance (two-way Anova) was carried out. The analysis was performed using the material hardness as a response variable. The first explanatory variable (factor) was the sample type (LPBF Horizontal and Vertical, or Wrought) and the second was the processing state (I, ST, AG1, AG2, AG3, AG4, and AG6). The significance level (α) was set to 0.05. The results of this analysis led to the following conclusion: for each processing state, differences in hardness between the samples are statistically significant (p < 0.05).

3.1.2. Tensile Testing

Typical stress–strain diagrams of the LPBF and wrought alloys obtained at each processing state are shown in Figure 4. For the LPBF alloy, the average value and the standard deviations of the mechanical characteristics (modulus of elasticity (E), yield strength (YS), ultimate tensile strength (UTS), and elongation at break (δ)) are collected in Table 3, while those of the wrought alloy are shown in Table 4. The corresponding histograms are presented in Figure 5.
To conclude on the statistical significance of the differences between the results obtained, a multifactor analysis of variance (two-way ANOVA) was carried out. The analysis was performed using the material strength, stiffness and ductility features (YS, UTS, E, and δ) as response variables. The first explanatory variable (factor) was the sample type (LPBF Horizontal and Vertical, or Wrought), and the second was the processing state (I, ST, AG). The significance level (α) was set to 0.05. The results of this analysis led to the following conclusion: for each processing state, differences in the YS, UTS, and δ values between the samples are statistically significant, while those in the elastic moduli E are not.
For both alloys, the highest strength characteristics (YS and UTS) are provided by the aged samples. For the LPBF alloy, aging increased the YS value by over 88%, and for the UTS, by over 57%, when compared to the initial state. This improvement is achieved at the expense of the material ductility: for the horizontal and vertical LPBF samples, the elongation at break is reduced by 49 and 41%, respectively. The same trend is observed for the wrought alloy: aging increased the YS value by over 86%, and for the UTS, by over 46%, when compared to the initial state, while the elongation at break was reduced by 55%.
For a more detailed analysis of the LPBF alloy, the anisotropy of its mechanical properties with respect to the build orientation is calculated as follows:
x = x max x min x max × 100 %
where x represents YS, UTS, or δ (E variations are not considered given their lack of statistical significance). The orientation dependence of the UTS values remains below 3% at any processing state, with the lowest being in the aged state at 1.2%. The YS values demonstrate greater build orientation dependencies: 9.3% in the initial state and 1.8% in the aged state. Globally, the orientation dependence of both strength characteristics is below 10% at any processing state, and in the aged state, it decreases to under 2%. By contrast to the strength characteristics, the elongation at break manifests a much greater build orientation dependence: 33% in the initial state and 23% in the aged state.
When comparing both alloys in the aged state, the UTS and YS values of the wrought alloy were respectively 4% and 9% lower than those of the LPBF alloy, for both build orientations. Moreover, in the aged state, the elongation at break of the wrought alloy was ~60% lower than that of the vertical LPBF samples and ~100% lower than that of the horizontal LPBF samples.

3.2. Porosity and Microstructure

3.2.1. Porosity

Figure 6 presents postprocessed CT images of the gauge sections of the tensile specimens. The pores are represented by colored specks and are projected from the 3D space to a 2D plane to offer a better visualization of the pore number, size, and orientation.
The porosities measured in the horizontal and vertical samples are 0.01 and 0.003%, respectively. For both orientations, an average equivalent diameter of pores is 23.4 ± 6.5 µm. The pores identified in each sample are grouped together in terms of their angular positions with respect to the reference axis (theta angle), the latter being parallel to the tensile axis. The histograms of the measured pore orientations inserted in the respective images of Figure 6 illustrate that in the horizontal samples (Figure 6a), pores are predominantly distributed along the tensile axis (0° and ±180° theta angles), while in the vertical samples (Figure 6b), they are predominantly distributed perpendicular to the tensile axis (±90° theta angles). These observations confirm that in both cases, the pores are mainly distributed between the layers of printed parts perpendicular to the build direction.

3.2.2. Phase Composition

Diffractograms of both alloys in different processing states: I (as-built or -shipped for the LPBF and wrought alloys, respectively), after ST and after AG (2 h), are shown in Figure 7. The austenitic peaks are identified by the symbol “○”, while the martensite peaks are identified by the symbol “◊”. From these XRD patterns, the percentage of residual austenite (RA) can be calculated (Table 5).
It can be seen that regardless of the state, martensite is dominant in both alloys, but some amounts of RA can still be observed. In the initial state, the LPBF alloy manifests a higher RA fraction than its wrought counterpart. After ST, the austenite content increases from 6.1 to 8.3% in the LPBF alloy, while the wrought alloy reveals a slight reduction in RA, going from 3.1 to 2.0%. After AG, the LPBF alloy presents a nearly fully martensitic microstructure, while the wrought alloy manifests a significant increase in austenite content, from 2 to 5.5%. After aging, no additional peaks, except A and M, can be observed in both alloys.
The EBSD phase distribution maps in the I, ST, and AG states reveal the presence of RA in both alloys (in orange in Figure 8) uniformly distributed in the martensite matrix (in blue). The volumetric fractions of RA calculated from the maps in Figure 8 can be found in Table 6, and they follow the same trends as those obtained by XRD.
As previously mentioned, the LPBF and wrought alloys are subject to precipitation hardening during their aging treatment. To validate the composition of these precipitates, the LPBF (XY plane) and wrought alloys are subjected to EDS analysis. As the main structural hardening element is Al [9], which precipitates as β-NiAl [6], Figure 9 presents the EDS composition maps for Ni and Al at a 20 kX magnification. Some individual precipitates are highlighted in red circles.
From the LPBF alloy EDS images, the mean size of the precipitates corresponds to 100.3 ± 24.0 nm and their density is ~0.16 particles/μm2. As no precipitates can be observed in the wrought alloy using the actual EDS setting (~10 × 10 nm per pixel), their size can be considered smaller than 2 × 2 pixels, i.e., <40 nm.

3.2.3. EBSD Orientation Maps

Figure 10 presents EBSD inverse pole figure (IPF) maps of the LPBF and wrought alloys in the initial, solution-treated, and aged states. For the LPBF alloy, the maps are presented with respect to the XY and XZ planes. For the XY plane, these maps were constructed using IPF-Z coloring (Z represents the build direction), while IPF-Y coloring (Y represents the build direction) was used for the XZ plane. The structural elements (martensite blocks/packets) were reconstructed using a misorientation angle of ≥15°.
The EBSD observations show that the microstructure of the wrought alloy in its initial state is composed of martensite packets, with the latter containing parallel arrangements of blocks. Due to significant cooling rates during the LPBF processing, these blocks/packets in the LPBF alloy are significantly finer. For both alloys, the block/packet size was measured using a Matlab script based on the MTEX toolbox, while disregarding structural elements smaller than 0.2 µm in size. To offer a better visual interpretation, block/packet size distributions corresponding to different processing states of both alloys are presented in Figure 11. The values of the interquartile boxes are presented in Table 7. Note that the minimum whisker value corresponds to a minimum measured size of the block/packet.
It can be observed from Figure 11 that for both alloys, irrespective of the processing state, the block/packet size distributions are positively skewed, thus showing a greater quantity of smaller structure elements. However, the mean block/packet size of the LPBF alloy is 5 to 30% finer than that of its wrought counterpart. This is also true for the interquartile range (IQR), which for the LPBF alloy is 45% smaller on average than for the wrought alloy. This indicates a smaller block/packet size distribution in the LPBF alloy as compared to its wrought counterpart. The ST and AG treatments lead to a structural coarsening of both alloys, with the greatest being on the XY plane of the LPBF alloy, where there is a 27% increase in the mean and a 17% increase in the IQR values. Finally, from the IPF maps, the majority of the blocks/packets manifest (111) orientation (blue) along the build direction in both the XY and XZ planes, thus indicating the dominant orientation of martensite, which does not significantly change after the ST and AG treatments.

4. Discussion

This study aimed to shed some light on the process–structure–property interactions of a novel LPBF precipitation hardening stainless steel (EOS SS CX) SS at three principal states of the technological workflow: as-built (AB), solution-treated (ST), and aged (AG), and to compare this evolution with that occurring in a chemically analogous wrought alloy. This objective is justified by the fact that the current state of the art is limited to the as-built state of this alloy [4,7,9,16,17], and no published information on the ST and AG states of this LPBF alloy was available at the time of this study. To obtain the benchmark data, essential for further investigations, it was deemed reasonable to limit the number of variables of this study, by applying the manufacturer-recommended laser processing conditions. Moreover, some of the postprocessing parameters used in this study were adopted from the literature (solution treatment temperature and time, and aging temperature). The only postprocessing parameter, namely, the time of aging, was varied and optimized.
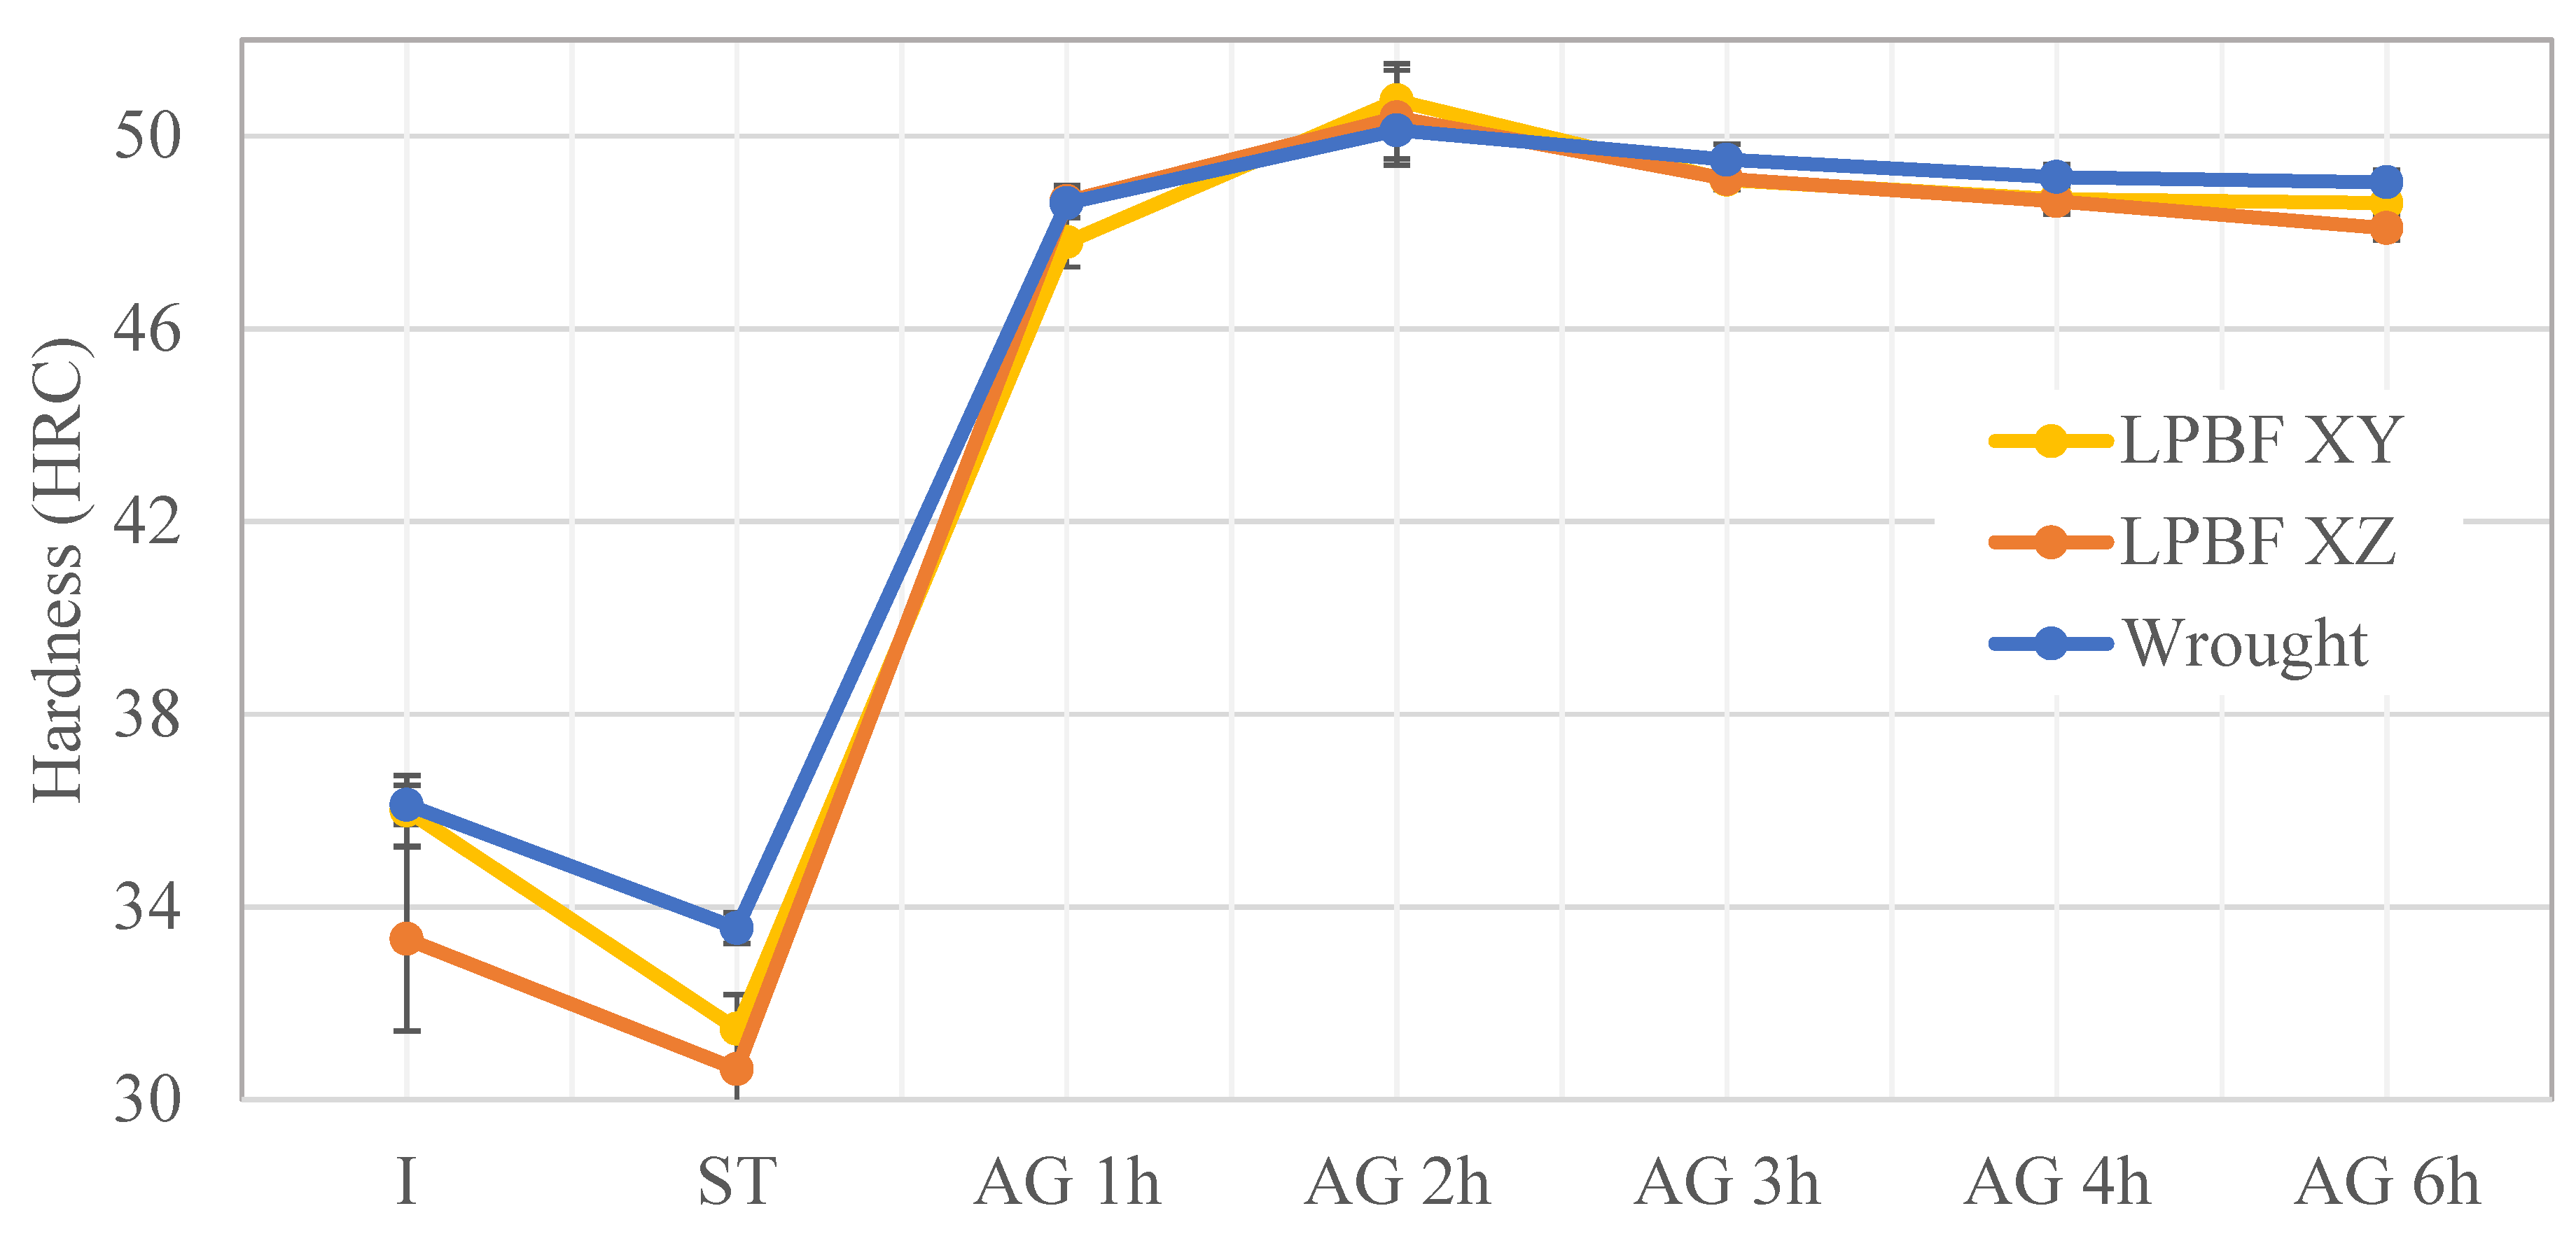
The first step of the study aimed to determine the heat treatment conditions leading to the maximum hardness of both alloys. It started with a solution treatment at 850 °C for 0.5 h, followed by forced air cooling, trying to produce a completely martensitic structure. An aging time analysis was then performed to determine the duration that offered the greatest hardness. It was found that aging at 525 °C for 2 h resulted in the 49–52 HRC hardness range for both alloys, as guaranteed by the manufacturers [2,14]. More specifically, the hardness achieved for the LPBF alloy was respectively 50.7 ± 0.8 HRC (XY plane) and 50.4 ± 1.0 HRC (XZ plane). Aging for periods beyond 2 h led to a slight decrease in the hardness obtained. This specific heat treatment procedure was used for both alloys of this study.
Both the EOS SS CX and the wrought Corrax® steels are related to the PH13-8Mo family of precipitation hardened martensitic stainless steels, and their chemical compositions are nearly identical and correspond to the manufacturers’ specifications [2,14]. Despite this composition similarity, the LPBF process leads to a significantly different initial microstructure as compared to the wrought alloy (see Table 8), and consequently, to a different sensitivity to the applied heat treatments.
In the initial state (as-built, for the LPBF and as-shipped, for the wrought alloy), both alloys contain mainly martensite with a relatively significant amount of austenite due to the presence of alloying elements (Ni, Mo, Mn, etc.), which stabilize austenite and decrease the martensite finish (Mf) temperature. Moreover, heating/cooling cycles during the LPBF processing and chemical inhomogeneity of the printed alloy led to RA formation along the block/packet boundaries. Therefore, the fraction of austenite (~6%) in the as-built LPBF alloy is higher than in its wrought counterpart (~3%) (Table). The martensitic structure of both alloys is very similar (packets of martensite contain blocks sharing close orientations).
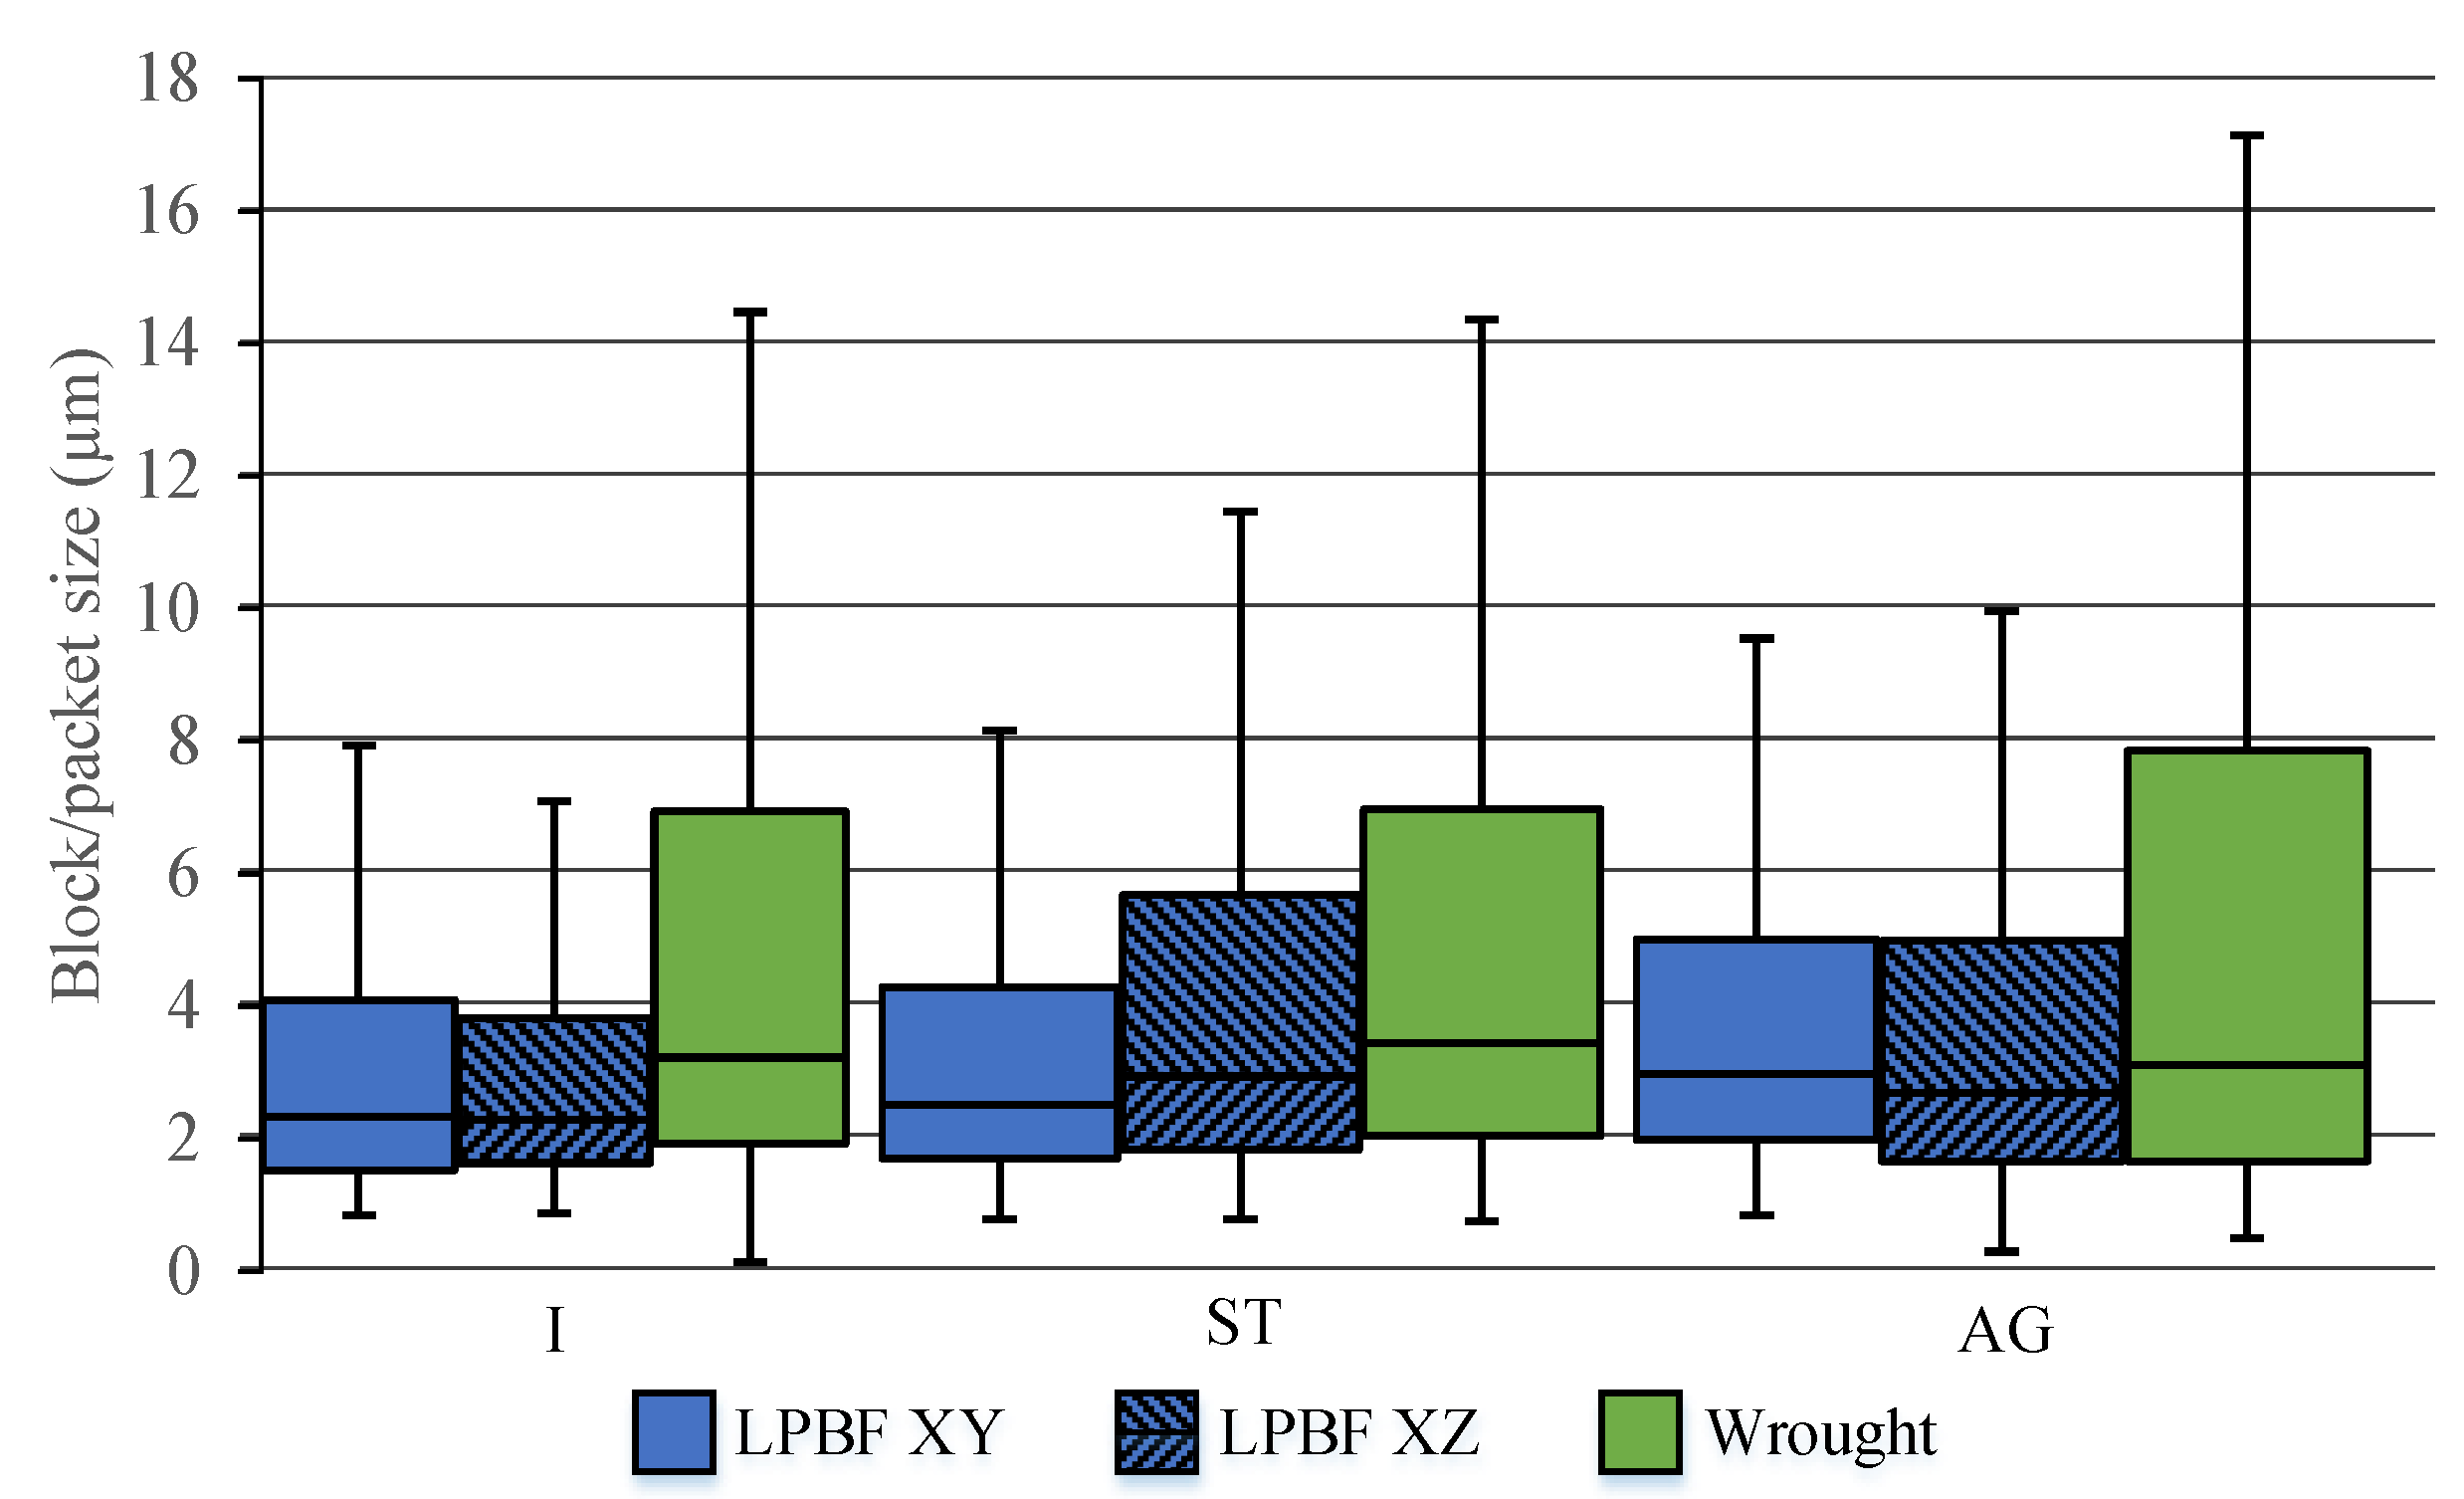
An increase in the mean block/packet size, which was observed after the solution treatment (850 °C for 0.5 h), indicates the beginning of the recrystallization process. The mean block/packet size in the LBPF alloy is still smaller than that in the wrought alloy (2.7 versus 3.4 μm). However, the austenite fraction increased slightly in the ST LPBF alloy as compared to its initial state (from 6 to 7.6% according to EBSD), while it drops slightly in the wrought alloy (from 3.1 to 2.0% according to EBSD). The first phenomenon could be due to a chemical inhomogeneity of the LPBF samples, in which some areas are still Ni-enriched, and consequently, have lower Mf temperatures than neighboring areas. The reduction in strength and hardness of both alloys after ST is typical for the first stage of the precipitation hardening routine [9,
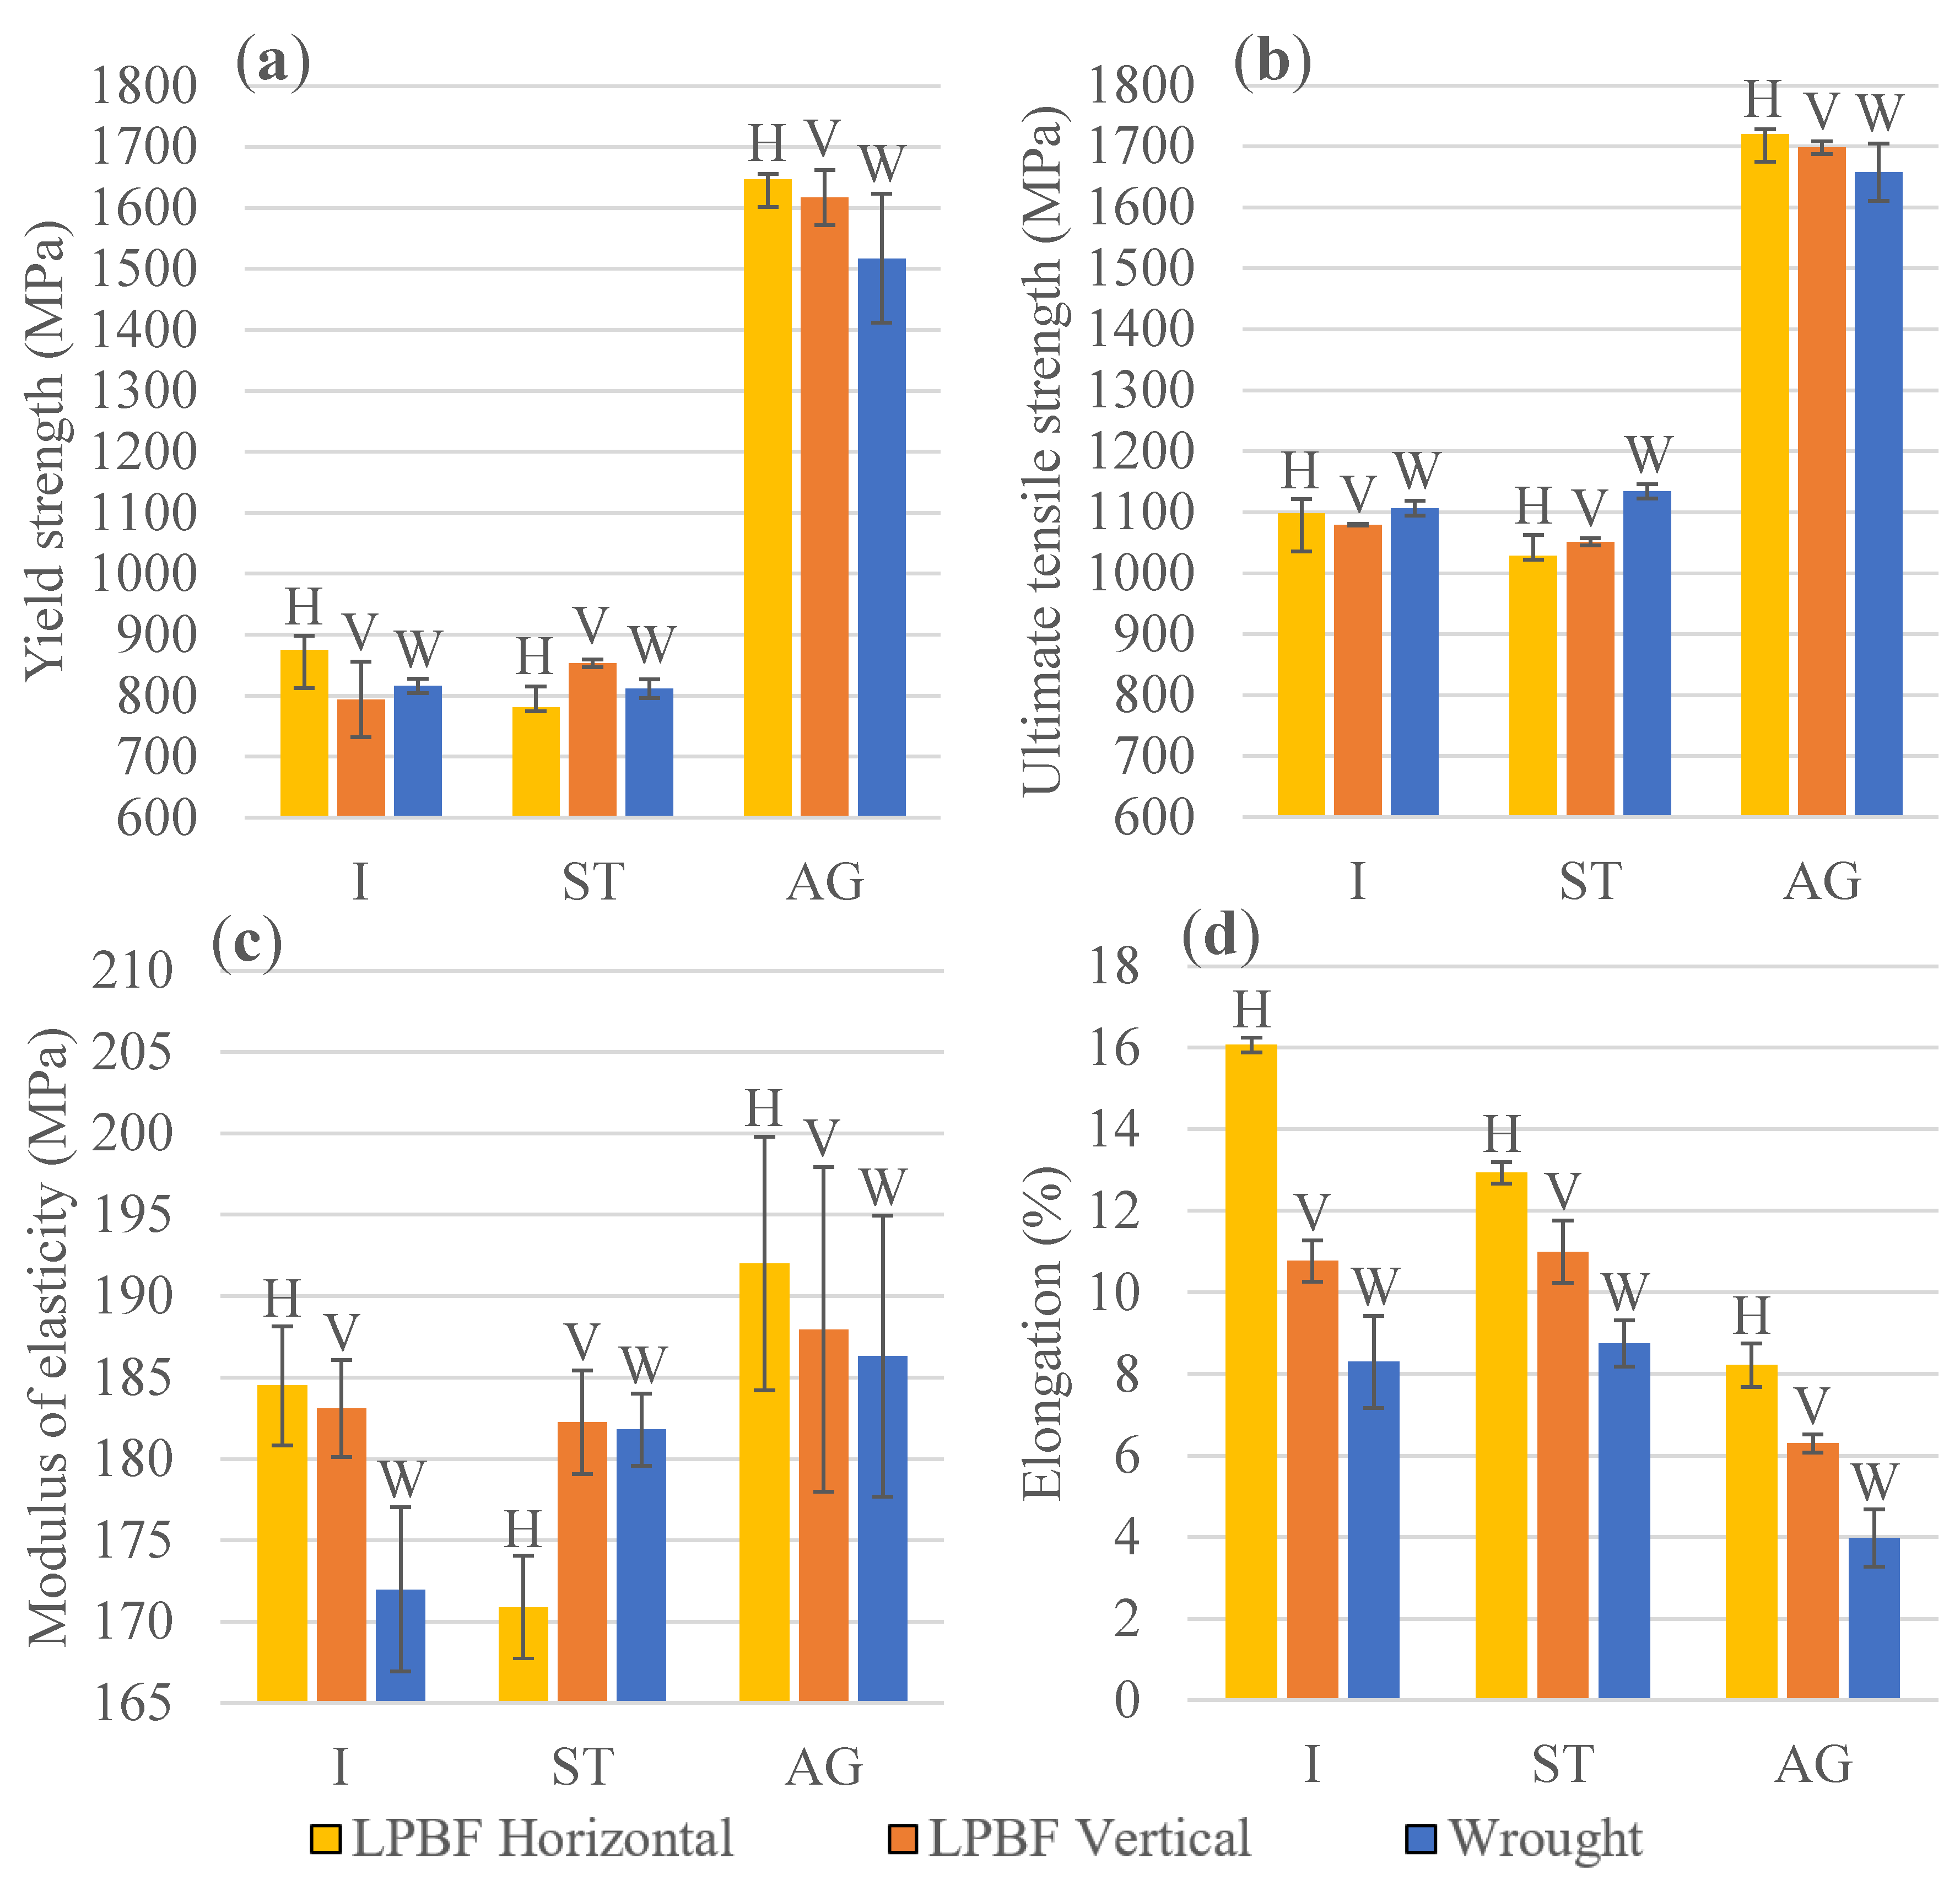
20], while a higher amount of austenite in the LPBF alloy could explain its lower strength characteristics as compared to the wrought alloy. Note that the solution treatment reduces the LPBF elongation build orientation dependence from 20 to 15%.
Aging of maraging steel generally provides (1) the recovery of martensite, (2) the precipitation of an intermetallic strengthening phase, and (3) the formation of RA from the martensitic phase. It was found that after aging, the fraction of austenite drops in the LPBF alloy (~1%) but increases in the wrought alloy (~4%) according to EBSD. In the wrought alloy, reverted austenite forms during aging, which is a common phenomenon in martensitic precipitation hardening stainless steels aged at intermediate temperatures [
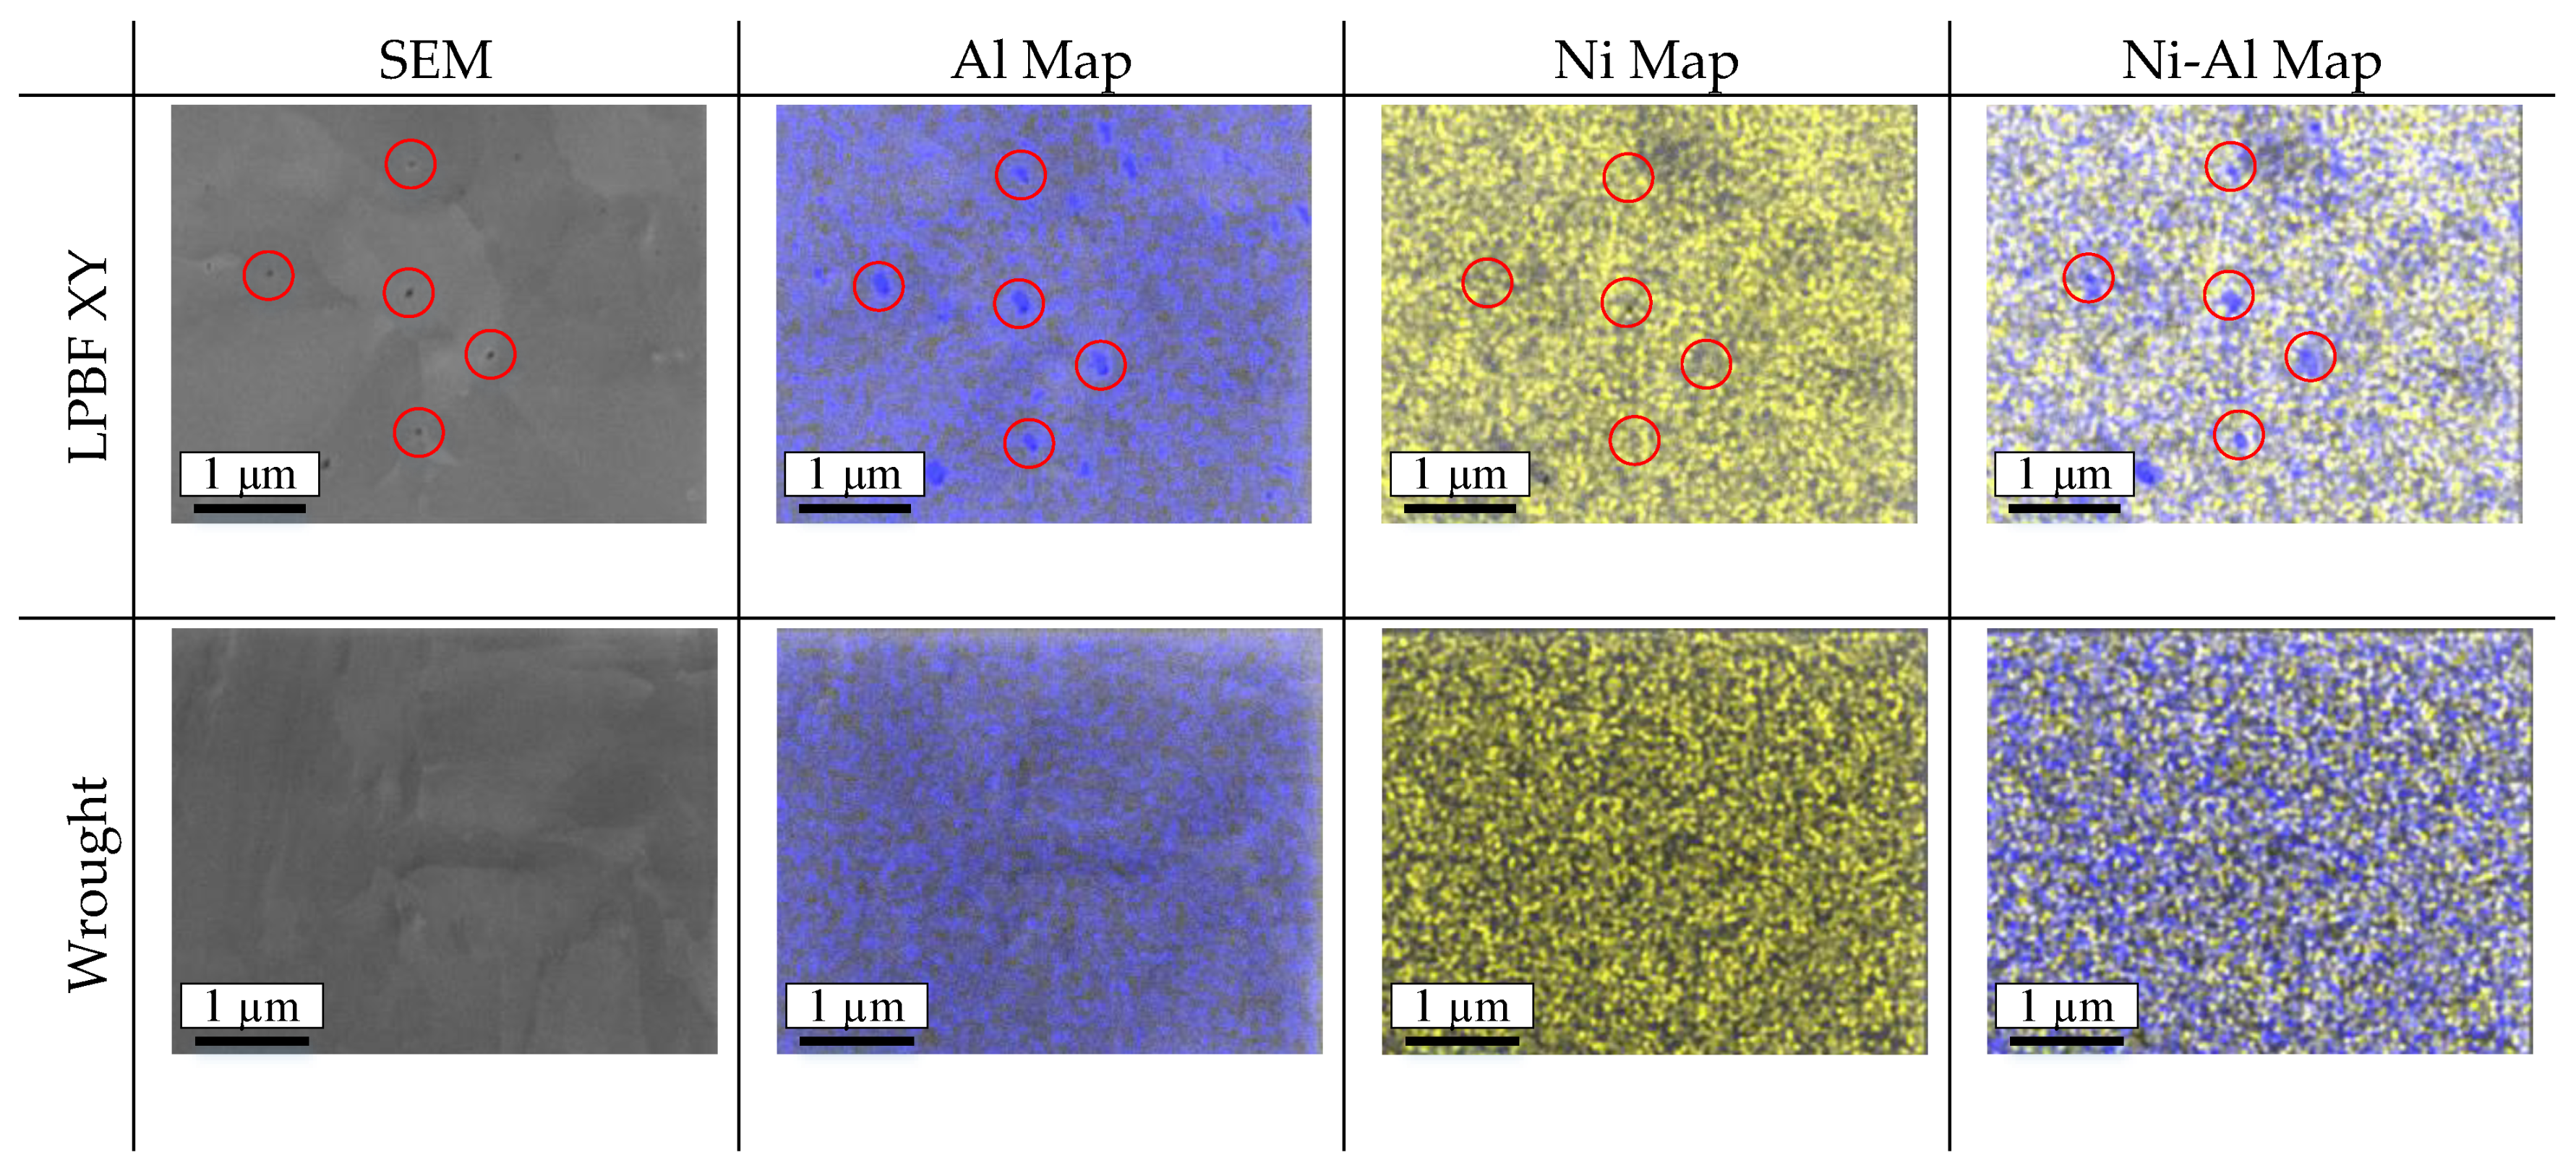
21]. Although the reasons for the RA fraction reduction in the LPBF alloy are not clear, a similar phenomenon was observed by Meredith, Zuback [22], where aging of the as-built 17-4 PH stainless steel at temperatures between 495 and 620 °C also decreased the fraction of retained austenite. In the same work [22], aging led to the formation of Al-rich precipitates, whose spherical particles were 100 nm in size, a value close to the findings of this work. The size of precipitates in the wrought alloy is supposed to be smaller than 40 nm, since their presence was not revealed using the actual EDS settings (2 × 2 consecutive 10 nm pixels), and this size range is in agreement with multiple data on this alloy [5,6,15].
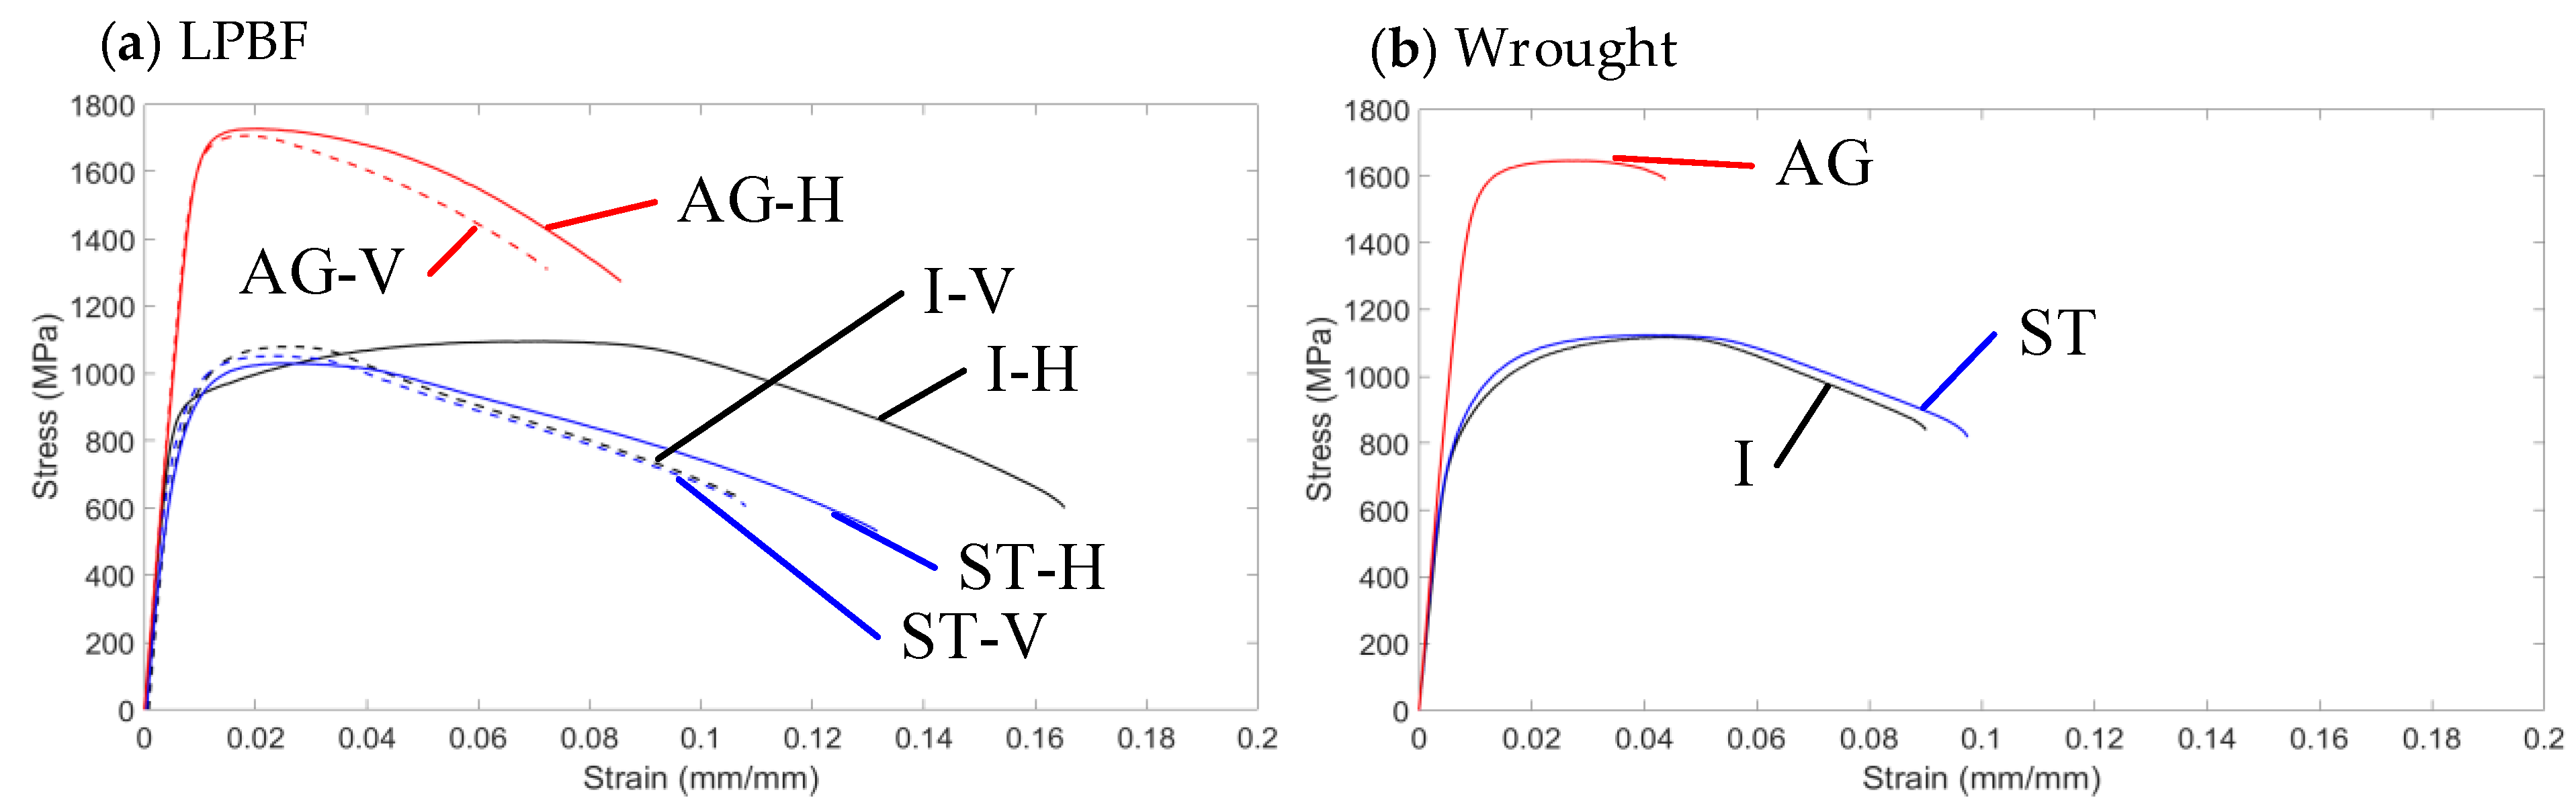
Both alloys exhibit a significant increase in material hardness (over 40%) and in the mechanical strength (over 50%) after aging. However, this improvement is reached at the expense of a lower material ductility (over 40% reduction). After aging, the mean block/packet size of martensite in the LPBF alloy was found to be slightly smaller than in the wrought alloy: (2.95 versus 3.09 μm, respectively) with similar blocks/packets sizes measured in the XY and XZ planes. The size of the structural elements and the difference in the amount of RA (~1.0 versus ~4.5% in the aged state of the LPBF and wrought alloys, respectively) significantly affect the mechanical properties of the alloys studied, and the finer the structural elements and the lower the amount of RA, the better the mechanical properties of the alloy. The mean size of β-NiAl precipitates in the LPBF alloy is significantly greater than that in the wrought alloy: 100 nm versus <40 nm. However, following the literature [6,8], such precipitates remain coherent with the martensite matrix and therefore, this difference itself cannot explain the differences in the mechanical behavior of the material. Even though all these observations are supported by the existing general body of knowledge for this family of precipitation hardening stainless steels [4,5,6,7,8,9,15,16,17], further studies are warranted to deepen our understanding of the microstructure of LPBF-processed and post-treated precipitation hardening stainless steel alloys.
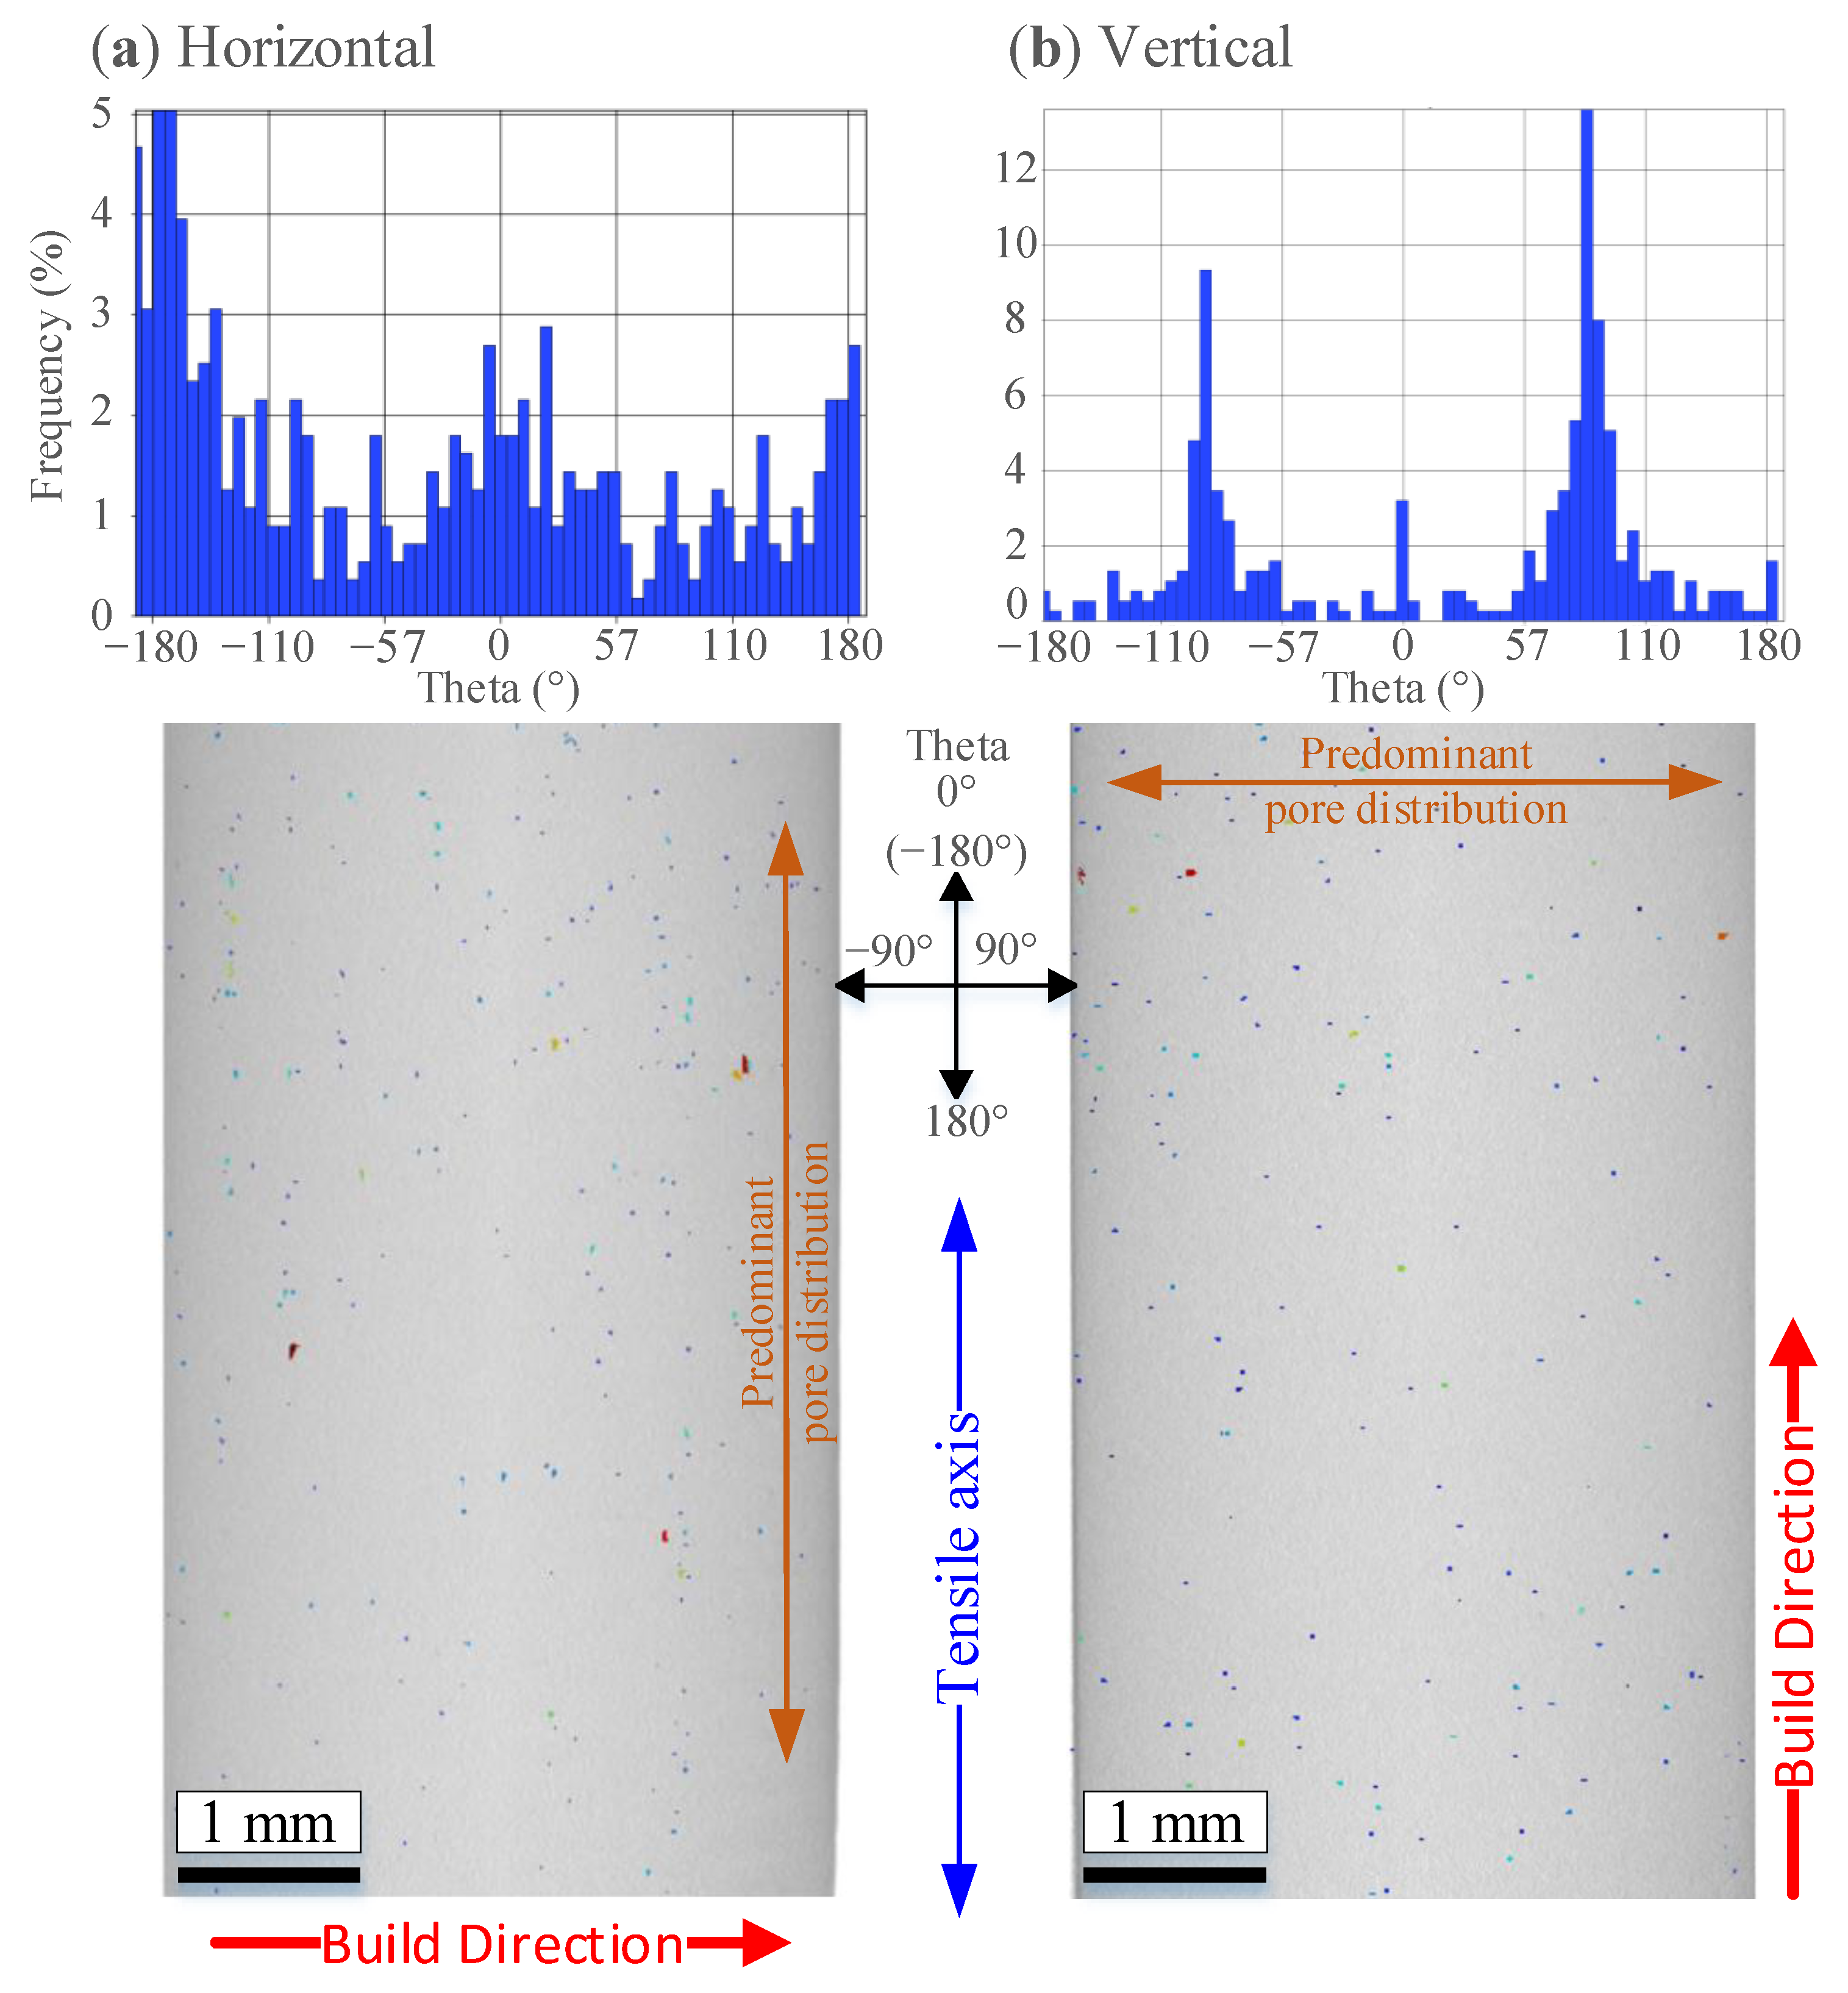
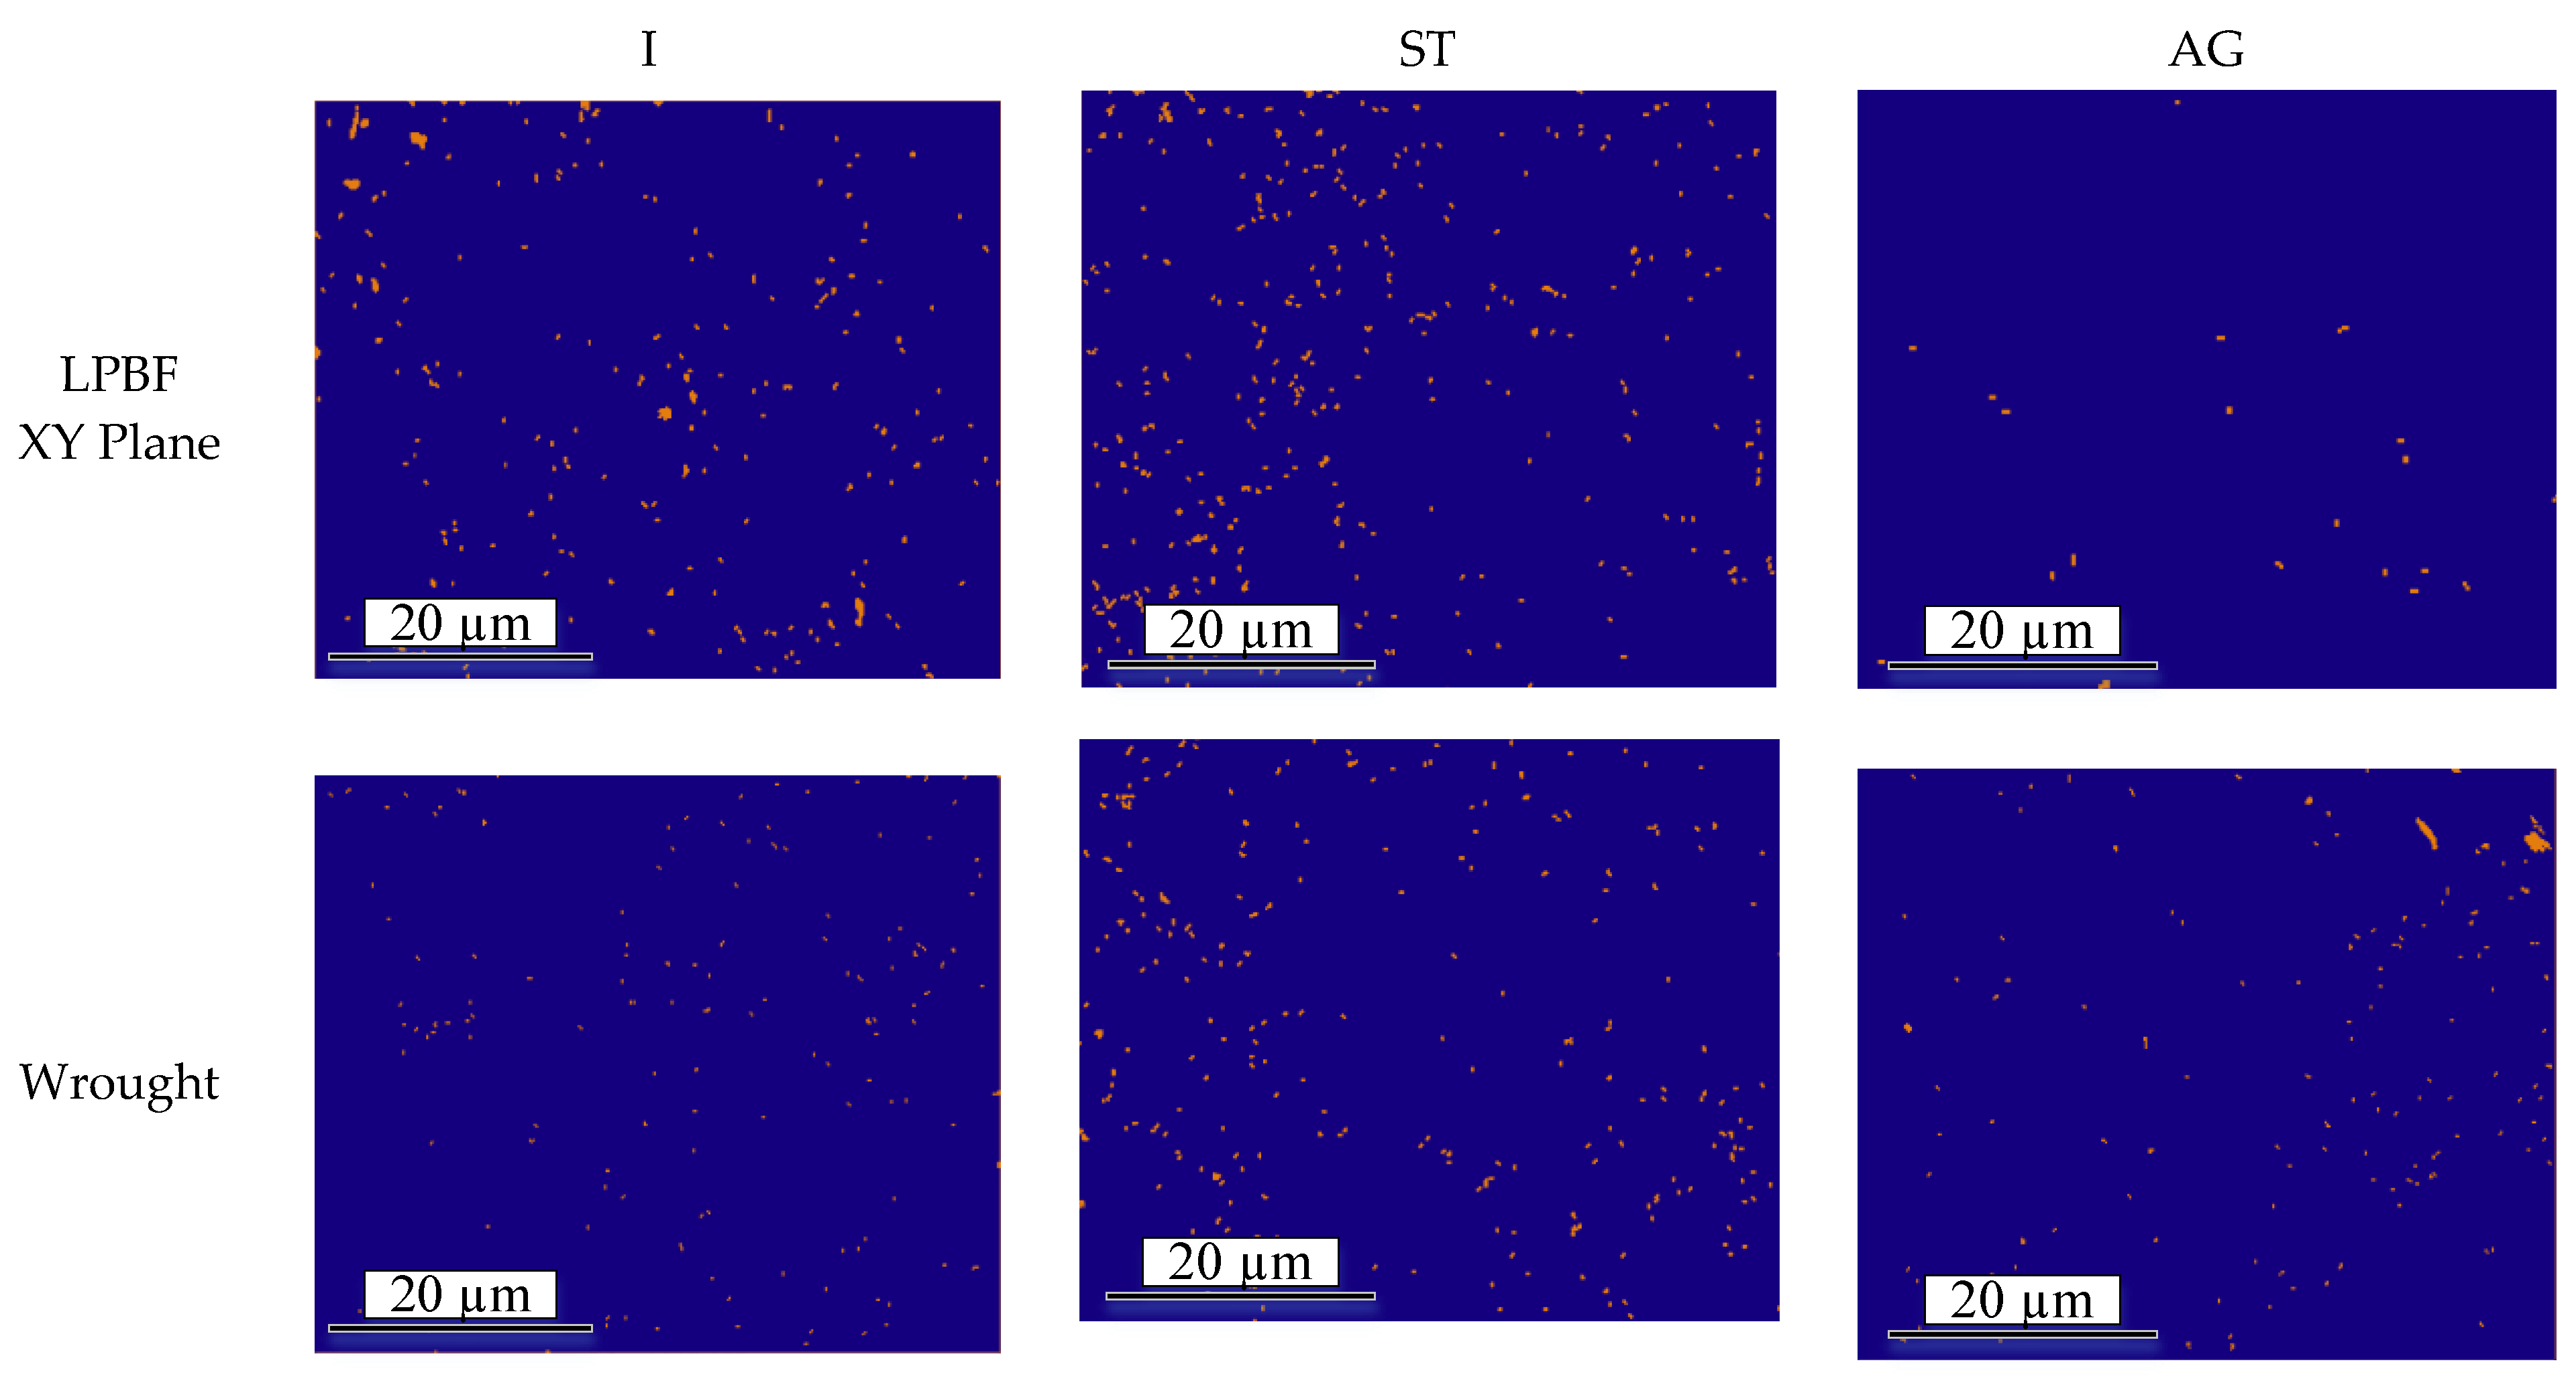
Note also that the LPBF alloy manifests significant anisotropy of its mechanical properties, especially in the elongation at break values (~23%). This anisotropy is due to the presence of processing-induced pores, preferentially distributed in planes perpendicular to the build direction. In the initial state, the LPBF alloy samples contained a limited amount of porosity when measured with micro-CT: 0.01% in the horizontal and 0.003% in the vertical samples. It was revealed that these pores, having an average equivalent diameter of ~25 µm, are predominantly distributed along the tensile axis of the horizontal samples and perpendicular to the tensile axis of the vertical samples, and their presence was not affected by the heat treatment sequence applied in this work. This particular pore distribution explains why, irrespective of the processing state, vertical samples demonstrated lower mechanical characteristics, especially lower ductility, than their horizontal counterparts.

5. Conclusions

Because EOS SS CX maraging stainless steel (LPBF) has only been recently released, only limited information on the alloy is available in the literature, thus motivating this study. This paper focused on the evolution of the microstructure and mechanical properties of EOS SS CX through the different phases of the technological workflow: as-built, solution-treated, and aged. For a comparative basis, the same evolution study is performed with Uddeholm Corrax®, a chemically analogous wrought alloy. Based on the results achieved, the main findings can be summarized as follows.
  • An aging time of 2 h at 525 °C allows the achievement of a maximum hardness of 50 HRC in the precipitation hardening laser powder bed-fused (LPBF) EOS SS CX alloy.
  • For two build orientations—horizontal and vertical, a total porosity in the LPBF EOS SS CX alloy, processed with a laser power of 260 W, a scanning speed of 1067 mm/s, a hatching distance of 100 µm and a layer thickness of 60 µm, does not exceed 0.01% with an average pore size of 23.4 µm.
  • The difference in the elongations at break of LPBF samples (8.2% versus 6.3% for the horizontal and vertical specimens, respectively) occurs because processing-induced pores are mainly distributed between the layers of printed parts, perpendicular to the build direction.
  • In the LPBF EOS SS CX alloy (aged state), the mean block/packet size of martensite is 2.3 µm, the size of β-NiAl precipitates is ~100 nm, and the amount of residual austenite is ~1.0%. In the wrought equivalent of this alloy, both the size of the martensite structural elements and the fraction of residual austenite are greater, thus explaining the overall lower mechanical properties of the latter as compared to the former.

Author Contributions

The work plan was developed by W.T.T. to meet the study objectives defined by V.B. The specimen design and the alloy selection were carried out by all the coauthors based on the state of the art, previous research of V.B., and the current trends in the field. The design, fabrication, and testing of the specimens were performed by W.T.T. with the aid of A.K. and V.B. V.B. and A.K. contributed to the data organization, results interpretation and drafting of the manuscript. All authors have read and agreed to the published version of the manuscript.

Funding

This work was financially supported by Bauer Hockey Corporation and the Mitacs Accelerate program [grant number IT14838].

Data Availability Statement

The data presented in this study are available on request from the corresponding author. The data are not publicly available due to privacy.

Acknowledgments

The authors are grateful to S.E. Brika (CT scan), E. Herrera (XRD), M. Letenneur (porosity analysis), S. Plamondon (mechanical testing), R. Romanica (general support) and M. Saadati (SEM, spectroscopy and XRD) and technicians in the ÉTS laboratories, for their technical support.

Conflicts of Interest

The authors declare no conflict of interest.

References

  1. Campbell, I.; Diegel, O.; Kowen, J.; Wohlers, T. Wohlers Report 2020: 3D Printing and Additive Manufacturing State of the Industry; Wohlers Associates: Fort Collins, CO, USA, 2020. [Google Scholar]
  2. EOS GmbH. EOS Stainless Steel CX Datasheet; EOS GmbH Ltd.: Krailling, Germany, 2019. [Google Scholar]
  3. Mayer, S. Optimised Mould Temperature Control Procedure Using DMLS; EOS GmbH Ltd.: Krailling, Germany, 2009. [Google Scholar]
  4. Sanjari, M.; Hadadzadeh, A.; Pirgazi, H.; Shahriari, A.; Amirkhiz, B.S.; Kestens, L.A.; Mohammadi, M. Selective laser melted stainless steel CX: Role of built orientation on microstructure and micro-mechanical properties. Mater. Sci. Eng. A 2020, 786, 139365. [Google Scholar] [CrossRef]
  5. Höring, S.; Abou-Ras, D.; Wanderka, N.; Leitner, H.; Clemens, H.; Banhart, J. Characterization of reverted austenite during prolonged ageing of maraging steel CORRAX. Steel Res. Int. 2009, 80, 84–88. [Google Scholar] [CrossRef]
  6. Hochanadel, P.W.; Edwards, G.R.; Robino, C.V.; Cieslak, M.J. Heat treatment of investment cast PH 13-8 Mo stainless steel: Part I. Mechanical properties and microstructure. Metall. Mater. Trans. A 1994, 25, 789–798. [Google Scholar] [CrossRef]
  7. Shahriari, A.; Khaksar, L.; Nasiri, A.; Hadadzadeh, A.; Amirkhiz, B.S.; Mohammadi, M. Microstructure and corrosion behavior of a novel additively manufactured maraging stainless steel. Electrochim. Acta 2020, 339, 135925. [Google Scholar] [CrossRef]
  8. Seetharaman, V.; Sundararaman, M.; Krishnan, R. Precipitation hardening in a PH 13-8 Mo stainless steel. Mater. Sci. Eng. 1981, 47, 1–11. [Google Scholar] [CrossRef]
  9. Bajaj, P.; Hariharan, A.; Kini, A.; Kürnsteiner, P.; Raabe, D.; Jägle, E.A. Steels in additive manufacturing: A review of their microstructure and properties. Mater. Sci. Eng. A 2020, 772, 138633. [Google Scholar] [CrossRef]
  10. Stormvinter, A.; Borgenstam, A.; Hedström, P. Investigation of lath and plate martensite in a carbon steel. In Solid State Phenomena; Trans Tech Publications Ltd.: Stafa-Zurich, Switzerland, 2011. [Google Scholar] [CrossRef]
  11. Letenneur, M.; Kreitcberg, A.; Brailovski, V. The Average Grain Size and Grain Aspect Ratio in Metal Laser Powder Bed Fusion: Modeling and Experiment. J. Manuf. Mater. Process. 2020, 4, 25. [Google Scholar] [CrossRef] [Green Version]
  12. Lippold, J.C.; Kotecki, D.J. Welding Metallurgy and Weldability of Stainless Steels; John Wiley & Sons: Hoboken, NJ, USA, 2005. [Google Scholar]
  13. Uddeholm. Corrax Heat Treatment Guidelines; Uddeholms: Hagfors, Sweden, 2018. [Google Scholar]
  14. Uddeholm. Corrax Datasheet; Uddeholms: Hagfors, Sweden, 2016. [Google Scholar]
  15. Guo, Z.; Sha, W.; Vaumousse, D. Microstructural evolution in a PH13-8 stainless steel after ageing. Acta Mater. 2003, 51, 101–116. [Google Scholar] [CrossRef]
  16. Hadadzadeh, A.; Amirkhiz, B.S.; Li, J.; Mohammadi, M. Microstructure Evolution in Direct Metal Laser Sintered Corrax Maraging Stainless Steel. In TMS 2019 148th Annual Meeting & Exhibition Supplemental Proceedings; Springer International Publishing: Cham, Switzerland, 2019. [Google Scholar] [CrossRef]
  17. Asgari, H.; Mohammadi, M. Microstructure and mechanical properties of stainless steel CX manufactured by Direct Metal Laser Sintering. Mater. Sci. Eng. A 2017, 709, 82–89. [Google Scholar] [CrossRef]
  18. ASTM. E18-19 Standard Test Methods for Rockwell Hardness of Metallic Materials; ASTM International: West Conshohocken, PA, USA, 2019. [Google Scholar]
  19. ASTM. E8/E8M-16A Standard Test Methods for Tension Testing of Metallic Materials; ASTM International: West Conshohocken, PA, USA, 2016. [Google Scholar]
  20. Callister, W.D. Materials Science and Engineering an Introduction; John Wiley: Hoboken, NJ, USA, 2007. [Google Scholar]
  21. Peng, X.Y.; Zhou, X.L.; Hua, X.Z.; Wei, Z.W.; Liu, H.Y. Effect of Aging on Hardening Behavior of 15-5 PH Stainless Steel. J. Iron Steel Res. Int. 2015, 22, 607–614. [Google Scholar] [CrossRef]
  22. Meredith, S.D.; Zuback, J.S.; Keist, J.S.; Palmer, A.T. Impact of composition on the heat treatment response of additively manufactured 17–4 PH grade stainless steel. Mater. Sci. Eng. A 2018, 738, 44–56. [Google Scholar] [CrossRef]
Figure 1. (a) LPBF samples and (b) uniaxial tensile testing samples (dimensions in mm).
Jmmp 05 00067 g001
Figure 2. Heat treatment profile applied to the LPBF and wrought alloys: control points correspond to the initial (I), solution-treated (ST), and aged (AG) processing states.
Jmmp 05 00067 g002
Figure 3. Hardness of the LPBF and wrought alloys as a function of processing state.
Jmmp 05 00067 g003
Figure 4. Typical engineering stress-engineering strain tensile diagrams: (a) LPBF alloys (V—vertical and H—horizontal) and (b) wrought alloy corresponding to the different processing states: I (initial), ST (solution-treated) and AG (aged, 2 h).
Jmmp 05 00067 g004
Figure 5. Mechanical properties of the LPBF (H—horizontal and V—vertical) and wrought (W) alloys at different process states: I (initial), ST (solution-treated) and AG (aged, 2 h): (a) Yield strength (YS), (b) Ultimate tensile strength (UTS), (c) Modulus of elasticity (E), (d) Elongation at break (δ).
Jmmp 05 00067 g005
Figure 6. Reconstructed CT images of the (a) horizontal and (b) vertical tensile samples.
Jmmp 05 00067 g006
Figure 7. XRD patterns of the (a) LPBF and (b) wrought alloys.
Jmmp 05 00067 g007
Figure 8. Phase distribution maps of the LPBF and wrought alloys: martensite is presented in blue and RA is presented in orange.
Jmmp 05 00067 g008
Figure 9. EDS composition maps for Ni and Al of the LPBF and wrought alloys in the 2 h-aged state.
Jmmp 05 00067 g009
Figure 10. EBSD IPF maps of the LPBF and wrought alloys in the initial, solution-treated, and aged states; color crystalline orientation code is inserted.
Jmmp 05 00067 g010
Figure 11. Boxplot of the block/packet size distribution of the LPBF and wrought alloys in different processing states.
Jmmp 05 00067 g011
Table 1. Measured chemical compositions of the EOS Stainless Steel CX and Uddeholm Corrax® in the initial state.
ElementFeCrNiMoAlMnSiC
EOS SS CX (LPBF) (wt.%)bal.12.409.391.461.610.110.180.03
Corrax® (Wrought) (wt.%)bal.12.189.381.371.810.280.210.05
Table 2. Hardness (HRC) of the LPBF and wrought alloys as a function of processing state.
Initial StateSTAging Time, h(min)
1 (60)2 (120)3 (180)4 (240)6 (360)
LPBFXY36.0 ± 0.731.5 ± 0.747.8 ± 0.550.7 ± 0.849.1 ± 0.248.7 ± 0.348.6 ± 0.2
XZ33.3 ± 1.930.6 ± 0.748.7 ± 0.350.4 ± 1.049.1 ± 0.248.7 ± 0.248.1 ± 0.3
Wrought36.1 ± 0.433.6 ± 0.348.6 ± 0.350.1 ± 0.649.5 ± 0.349.2 ± 0.349.0 ± 0.3
Table 3. Mechanical properties of the LPBF alloy at different processing states.
StateISTAG 2 h
OrientationHorizontalVerticalHorizontalVerticalHorizontalVertical
Modulus of elasticity (E)GPa184.5 ± 3.7183.1 ± 3.0170.9 ± 3.2182.3 ± 3.2192.0 ± 7.8188.0 ± 10.0
Yield strength (YS)MPa874.8 ± 23.6793.7 ± 62.3781.7 ± 33.8853.4 ± 6.61647.3 ± 8.31617.2 ± 45.0
Ultimate tensile strength (UTS)MPa1098.3 ± 2.51079.5 ± 1.21029.3 ± 1.01051.8 ± 5.81719.5 ± 15.01698.1 ± 10.4
Elongation at break (δ)%16.06 ± 0.1910.76 ± 0.5112.93 ± 0.2610.99 ± 0.768.22 ± 0.546.31 ± 0.22
Table 4. Mechanical properties of the wrought alloy at different processing states.
StateISTAG 2 h
Modulus of elasticity (E)GPa172.0 ± 5.1181.8 ± 2.2186.3 ± 8.6
Yield strength (YS)MPa816.5 ± 11.7811.6 ± 15.31517.6 ± 105.6
Ultimate tensile strength (UTS)MPa1106.8 ± 12.31134.3 ± 11.91657.9 ± 47.0
Elongation at break (δ)%8.30 ± 1.138.76 ± 0.573.98 ± 0.70
Table 5. Table of the measured percentage of RA from the XRD patterns.
RA (wt.%)
StateISTAG
LPBF XY6.18.3<1.0
Wrought3.12.05.5
Table 6. Table of the measured percentage of RA from the phase distribution maps.
RA (wt.%)
StateISTAG
LPBF XY6.07.61.1
Wrought3.03.64.0
Table 7. Interquartile range box data from block/packet size measurements.
Block/Packet Size (µm)
StateISTAG
Q1MedQ3IQRQ1MedQ3IQRQ1MedQ3IQR
LPBF XY plane1.532.334.092.561.692.494.252.561.962.954.963.00
LPBF XZ plane1.642.293.822.181.812.915.633.811.652.674.943.28
Wrought1.923.236.945.022.033.416.904.881.653.097.786.12
Table 8. Measured block/packet size and RA of the LPBF and the wrought alloys at different processing states.
StateISTAG
Block/Pack. Size (µm)RA (%)Block/Pack. Size (µm)RA (%)Block/Pack. Size (µm)RA (%)
MedIQRXRDEBSDMedIQRXRDEBSDMedIQRXRDEBSD
LPBF XY plane2.332.566.16.02.492.568.37.62.953.000.01.1
Wrought3.235.023.13.03.414.882.03.63.096.125.54.0
Publisher’s Note: MDPI stays neutral with regard to jurisdictional claims in published maps and institutional affiliations.

