Article

A Method for Orderly and Parallel Planning of Public Route Networks for Logistics Based on Urban Low-Altitude Digital Airspace Environment Risks

College of Civil Aviation, Nanjing University of Aeronautics and Astronautics, Nanjing 211106, China
*
Author to whom correspondence should be addressed.
Drones 2025, 9(9), 634; https://doi.org/10.3390/drones9090634
Submission received: 28 July 2025 / Revised: 3 September 2025 / Accepted: 8 September 2025 / Published: 9 September 2025

Abstract

Highlights

What are the main findings?
  • A parallel system has been developed to facilitate the partitioning of airspace into vertical and horizontal grids, quantify risks, and construct a virtual planning environment for public route networks.
  • An orderly planning framework for public route networks has been proposed, which achieves safe and conflict-free design of the route network.
What is the implication of the main finding?
  • This paper presents a refined technical framework for planning urban low-altitude terminal public route networks, enhancing research on route network planning through a comprehensive consideration of global airspace resource allocation and multi-dimensional risk factors.
  • Furthermore, it supports the planning of urban low-altitude public route networks characterized by high safety, minimal inflection points, and stringent segregation. This facilitates large-scale low-altitude terminal logistics operations and expands the application of parallel system theory in the context of spatially conflict-free route network planning.

Abstract

With the rapid development of urban air mobility, achieving safe and segregated flight for unmanned aerial vehicles amid the surging demand for low-altitude logistics has become a critical issue. This paper proposes a method for planning the public route network of urban low-altitude terminal logistics while considering environmental risks in the digital airspace. First, based on parallel system theory, we develop a digital airspace environment model that supports public route network planning by mapping physical and social elements to an artificial system. Furthermore, we establish a digital airspace grid partitioning system, develop grid access rules, and create a quantification model for urban low-altitude airspace environmental risks. Utilizing a layered airspace approach, this paper configures approach–departure grids, develops methods for initial public route network planning, and facilitates orderly re-planning of routes, ultimately establishing a hub-and-spoke public route network with segregation. This study conducts detailed case simulation studies based on realistic constraints, focusing on environmental risk, accurate grid configuration, comprehensive cost, algorithm complexity, and network scale. Simulation results demonstrate that the proposed method effectively constructs conflict-free networks, while maintaining low risks and inflection points. The findings align with the current development stage of urban air mobility characterized by the principle of ‘isolation first, then integration.’ This approach enables a gradual transition from route isolation to future integrated flight, thereby providing technical support for advancing low-altitude logistics operations.

1. Introduction

In recent years, unmanned aerial vehicles (UAVs) have gained significant traction across various fields due to their high efficiency and flexibility. In urban logistics and distribution, UAVs effectively address the challenges of the high cost and low timeliness of “last-mile” terminal delivery [1,2,3,4], serving as a vital means for transporting fresh produce and emergency supplies. Additionally, they have gradually transitioned traditional manual labor into scenarios such as environmental monitoring [5,6], agricultural and forestry protection [7], and power/communication inspection [8,9], undertaking high-risk and high-frequency tasks. As a pioneering sector of the low-altitude economy, route planning for logistics transportation typically employs an enterprise-independent management model, which lacks overall coordination and collaborative mechanisms. This fragmented approach not only hampers the intensive utilization of low-altitude airspace resources but also increases the likelihood of UAV flight conflicts due to overlapping routes, thereby endangering both flight safety and the safety of ground personnel.
To systematically couple the physical elements of low-altitude airspace with the social elements related to stakeholders, it is essential to conduct a fine-grained partitioning of airspace grids and a discrete quantification of risks. Furthermore, exploring the hierarchical and unified planning of the public route network (PRN) to achieve route isolation has emerged as a critical issue for the integrated and sustainable development of low-altitude airspace and the collaborative management of air traffic.

1.1. Related Prior Work

This section will focus on three aspects, physical and social information processing, risk grid discrete quantitative modeling, and public route network planning, to conduct a comprehensive literature review.
In the complex urban low-altitude environment, the interplay between physical and social multi-dimensional attributes is significant. The Cyber–Physical–Social System (CPSS) serves as a framework that integrates these physical entities and social elements [10]. Its core value lies in its ability to uniformly map the physical and social components of urban low-altitude airspace into the artificial cyber world, thereby providing multi-dimensional decision support for the planning of the PRN in terminal logistics. Unlike traditional Cyber–Physical Systems (CPSs) [3], which primarily focus on physical interactions, the CPSS incorporates additional considerations for social systems and leverages the virtual cyber world to transcend the limitations imposed by resources, time, and space in the physical world. Currently, parallel systems have been extensively applied in various domains, including parallel transportation [11,12,13], parallel cities [14,15], parallel power grids [16,17], and parallel manufacturing [18,19]. In the context of UAV-related CPSSs, Faiçal et al. [20] proposed a Systems of Systems (SOS)-based CPS framework for ‘last-mile’ UAV delivery. This framework integrates geofencing, pick-up and delivery infrastructure, and airspace information to enhance the operational efficiency of low-altitude logistics. In the domain of UAV power grid trajectory planning, reference [17] developed a CPSS framework for the acceptance inspection of power grid line projects, incorporating physical information such as tower height and type and terrain features, while employing an improved Glowworm Swarm Optimization (GSO) strategy to plan safe flight paths. Liu et al. [3] concentrated on ultra-low temperature logistics delivery by integrating physical information regarding buildings, social environmental noise, and other factors to conduct single-trajectory planning for ultra-low temperature aircraft. Although CPSS frameworks have been applied to UAV trajectory planning in the power grid and logistics sectors, existing studies primarily focus on single-UAV path optimization. They do not adequately address the coupling of physical and social factors in urban low-altitude scenarios or perform multi-dimensional airspace risk quantification, nor do they integrate safe and efficient planning of the public route network.
The fine-grained discrete quantification of low-altitude airspace risks is contingent upon the partitioning of a three-dimensional (3D) airspace grid. This process also necessitates the precise mapping of multi-dimensional environmental risk attributes to corresponding grid units. Currently, in addition to traditional fixed rigid partitioning methods [21], multi-level discrete partitioning technologies represented by GeoSOT [22,23] have emerged as the mainstream approach. This methodology systematically divides the Earth’s surface to construct a dedicated grid system that facilitates efficient spatial data organization and management. Building on grid partitioning, researchers have conducted low-altitude risk assessments that concentrate on ground risk [4,24,25,26,27], mid-air risk [28,29,30,31,32], third-party risk [33,34,35], and their interrelated interactions. Ground risk assessment evaluates the potential threats posed by UAVs to ground personnel or property through the quantification [4,24,25] of indicators, kinetic energy calculations [26], and statistical predictions [27]. Mid-air risk assessments focus on collision probabilities with obstacles [28,29], other aircraft [30], and birds [31,32]. Third-party risk encompasses non-operational impacts such as privacy [33], noise [33,34], and indirect safety [35]. Presently, the discrete quantification of airspace risks predominantly relies on fixed rigid grid partitioning, which poses challenges for risk quantification assessments across varying scales. Therefore, multi-scale grids are essential for implementing discrete risk quantification under 3D grids of differing sizes and types, thereby providing a robust environmental foundation for the meticulous planning of low-altitude route networks.
The current urban low-altitude PRN primarily encompasses various types, including road-network-type [21,36], obstacle-avoidance [37], demand-driven [38], and hub-and-spoke networks. In the context of road-network-type PRNs, Xu et al. [36] and Mohammed et al. [21] constructed PRNs utilizing ground road networks. For obstacle-avoidance PRNs, Zhang et al. [37] developed route structures that avoid obstacles by employing Voronoi diagram algorithms to cluster tall urban buildings. In the case of demand-driven PRNs, Li et al. [38] proposed a point-to-point UAV logistics PRN driven by logistics demand. Hub-and-spoke networks exhibit significant advantages in terminal logistics distribution. Hu et al. [39] introduced a hub-and-spoke network coordinating merchants, UAVs, transfer centers, trucks, and consumer communities. Gao et al. [40] planned a hub-and-spoke route network based on the Traveling Salesman Problem for UAVs. Li et al. [41] proposed a bi-level hub-and-spoke route network that accounts for the segregation of logistics transshipment and terminal delivery operations, utilizing a genetic algorithm to solve the route network planning model. However, this method primarily focuses on the route network structure and neglects the influence of airspace environment risks on the PRN. In conclusion, existing urban low-altitude PRN planning predominantly addresses single dimensions (such as physical obstacle avoidance and logistics demand response), lacking a systematic approach that considers global airspace resource coordination and multi-dimensional risk factors. Notably, route planning for terminal logistics has yet to establish a dynamic matching mechanism with airspace environment risks.

1.2. Our Contributions

This study proposes a method for planning PRNs for urban low-altitude terminal logistics UAVs based on the CPSS, resulting in four key contributions:
(1)
A parallel system framework for PRN planning for UAVs in urban low-altitude terminal logistics is constructed. Physical and social elements associated with the hub-and-spoke PRN in the real world are parallelly mapped to the artificial system.
(2)
A quantitative assessment of airspace grid environmental risks in urban low-altitude digital airspace is conducted. On the basis of vertical–horizontal grid partitioning, differentiated grid flight access rules are formulated, and environmental risks in urban low-altitude airspace are quantified.
(3)
An orderly planning methodology for PRNs is proposed. By precisely configuring approach–departure grid (AD-Grid) resources in layered airspace, an accurate one-to-one matching between AD-Grids and take-off and landing points (VTOL-Ps) is achieved. Initial planning and iterative re-planning of the route network are performed sequentially, ultimately resulting in a safe, segregated, and conflict-free hub-and-spoke PRN.
(4)
Using Nanjing Liuhe District as an empirical research case, study analyses are conducted. These detailed studies analyses include systematic environmental risk assessment, average risk value analysis, statistical analysis of average inflection points, comprehensive cost calculation, algorithm complexity analysis, and PRN scale planning analysis.

2. Foundation of Research

2.1. Basic Concept and Problem Description

In this section, key terms such as airspace grid, UAV, vertical take-off and landing sites, and public route network are further defined.
The airspace grid [42] refers to a systematic partitioning of the air traffic management area into a series of uniformly sized and interconnected units, achieved through a recursive partitioning method.
The vertical take-off and landing site (VTOL-S) [43] is a designated area for aircraft, including helicopters and UAVs, that possess vertical take-off and landing capabilities. Based on scale, service coverage, and capacity, VTOL-Ss are classified into three main categories: vertical take-off and landing centers (VTOL-Cs), vertical take-off and landing fields (VTOL-Fs), and vertical take-off and landing points (VTOL-Ps).
Low-altitude public air routes refer to designated air corridors specifically intended for the simultaneous operation of multiple aircraft within the low-altitude and ultra-low-altitude airspace [43]. The collection of public air routes under low-altitude management constitutes the PRN. As a shared and fixed infrastructure for urban air mobility (UAM) that serves multiple types of aircraft, users, and multiple industries, the PRN is characterized by unified airspace resource allocation and collaborative access among multiple agents. This distinguishes it significantly from enterprise private routes—which are independently planned by a single entity and restricted exclusively to its own UAVs. The core concept of the PRN is being ‘public’. During the planning process, it is essential to ensure that airspace resources are not monopolized by a single enterprise, service objects are not limited to exclusive individual use, and operating rules are not privately exclusive. Ultimately, this approach aims to achieve fair access for multiple agents and optimal global benefits.
This study addresses the distribution and collection challenges of UAV logistics parcels between centralized distribution hubs and various service outlets at the logistics terminal level. It conducts an in-depth analysis of the planning of fixed hub-and-spoke logistics PRNs at the terminal level. Figure 1 presents a schematic diagram of hub-and-spoke centralized distribution for low-altitude terminal logistics parcels. The centralized distribution hub, functioning as a VTOL-F in urban low-altitude airspace, is responsible for the centralized storage and distribution of parcels. The service outlet, designated as a VTOL-P in urban low-altitude airspace, serves as the terminal node where users can complete their parcel pickup.

2.2. Research Hypothesis

Based on the analysis conducted, the following assumptions are proposed:
(1)
All UAVs involved in this study process vertical take-off and landing capabilities, enabling them to meet the take-off and landing requirements in complex low-altitude environments.
(2)
Adverse weather conditions, such as thunderstorms and strong winds, are not considered to impact flight operations, as they can lead to significant suspensions or delays in urban terminal areas.
(3)
All goods are dispatched from VTOL-Fs and transported by UAVs to designated VTOL-Ps.
(4)
The planned PRN is confined to a single altitude layer within the layered airspace.

3. Establish Parallel System

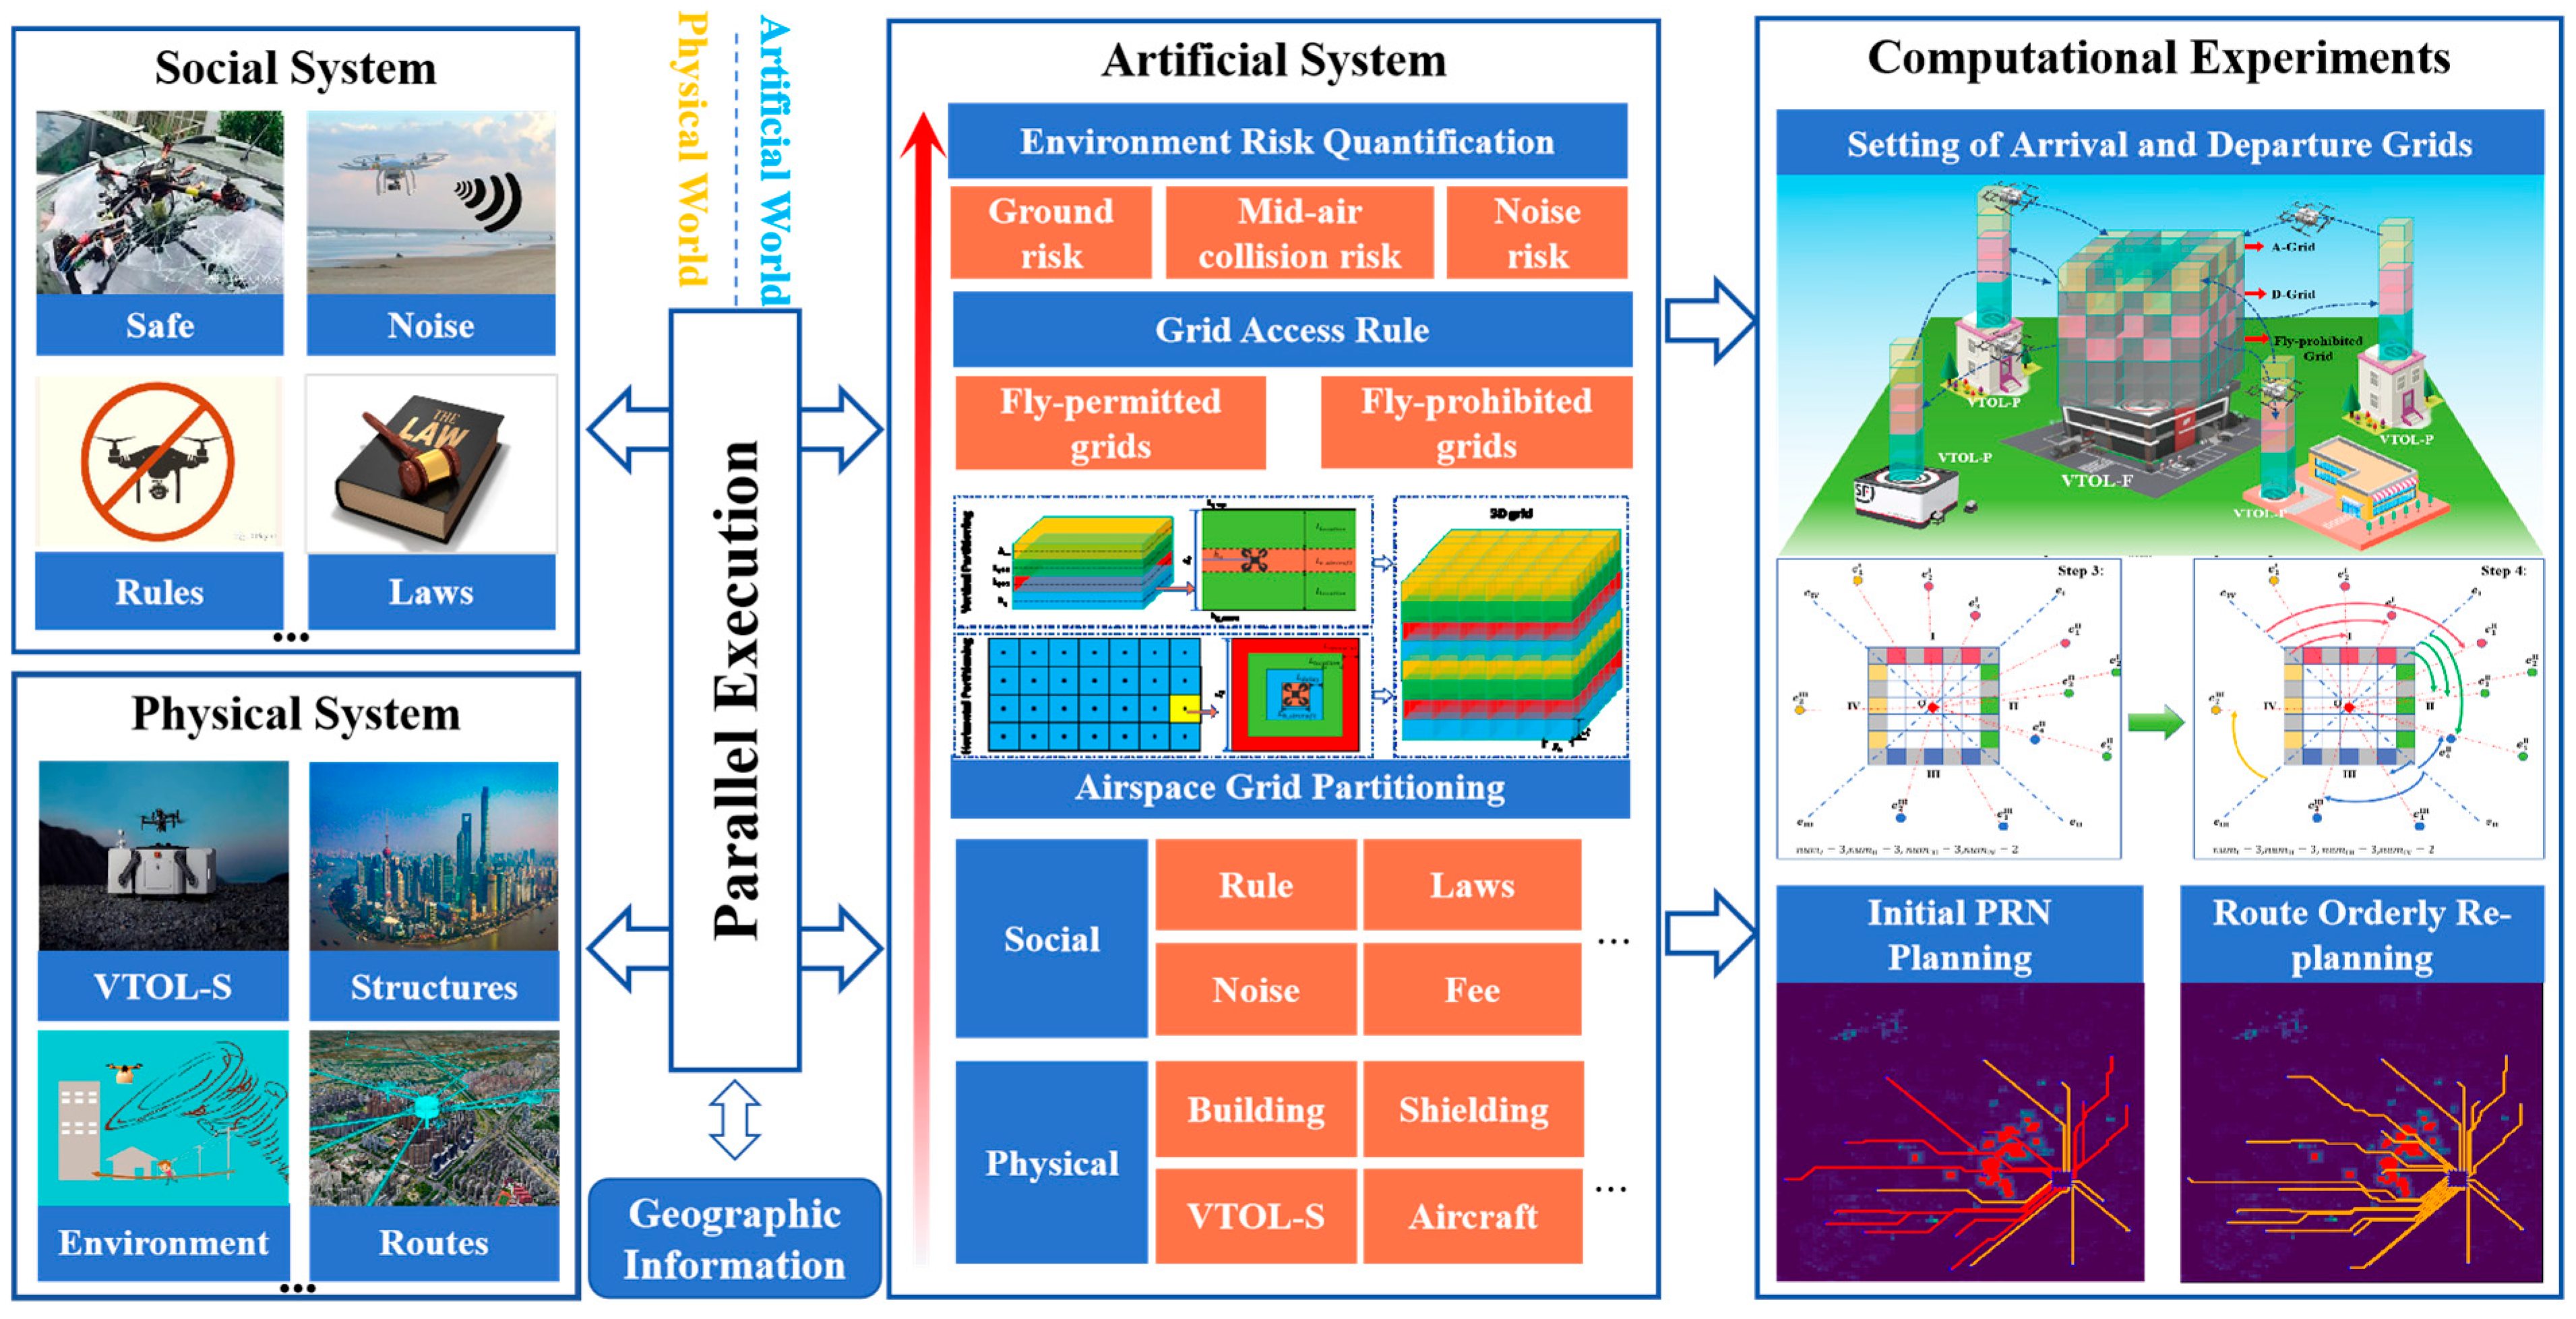
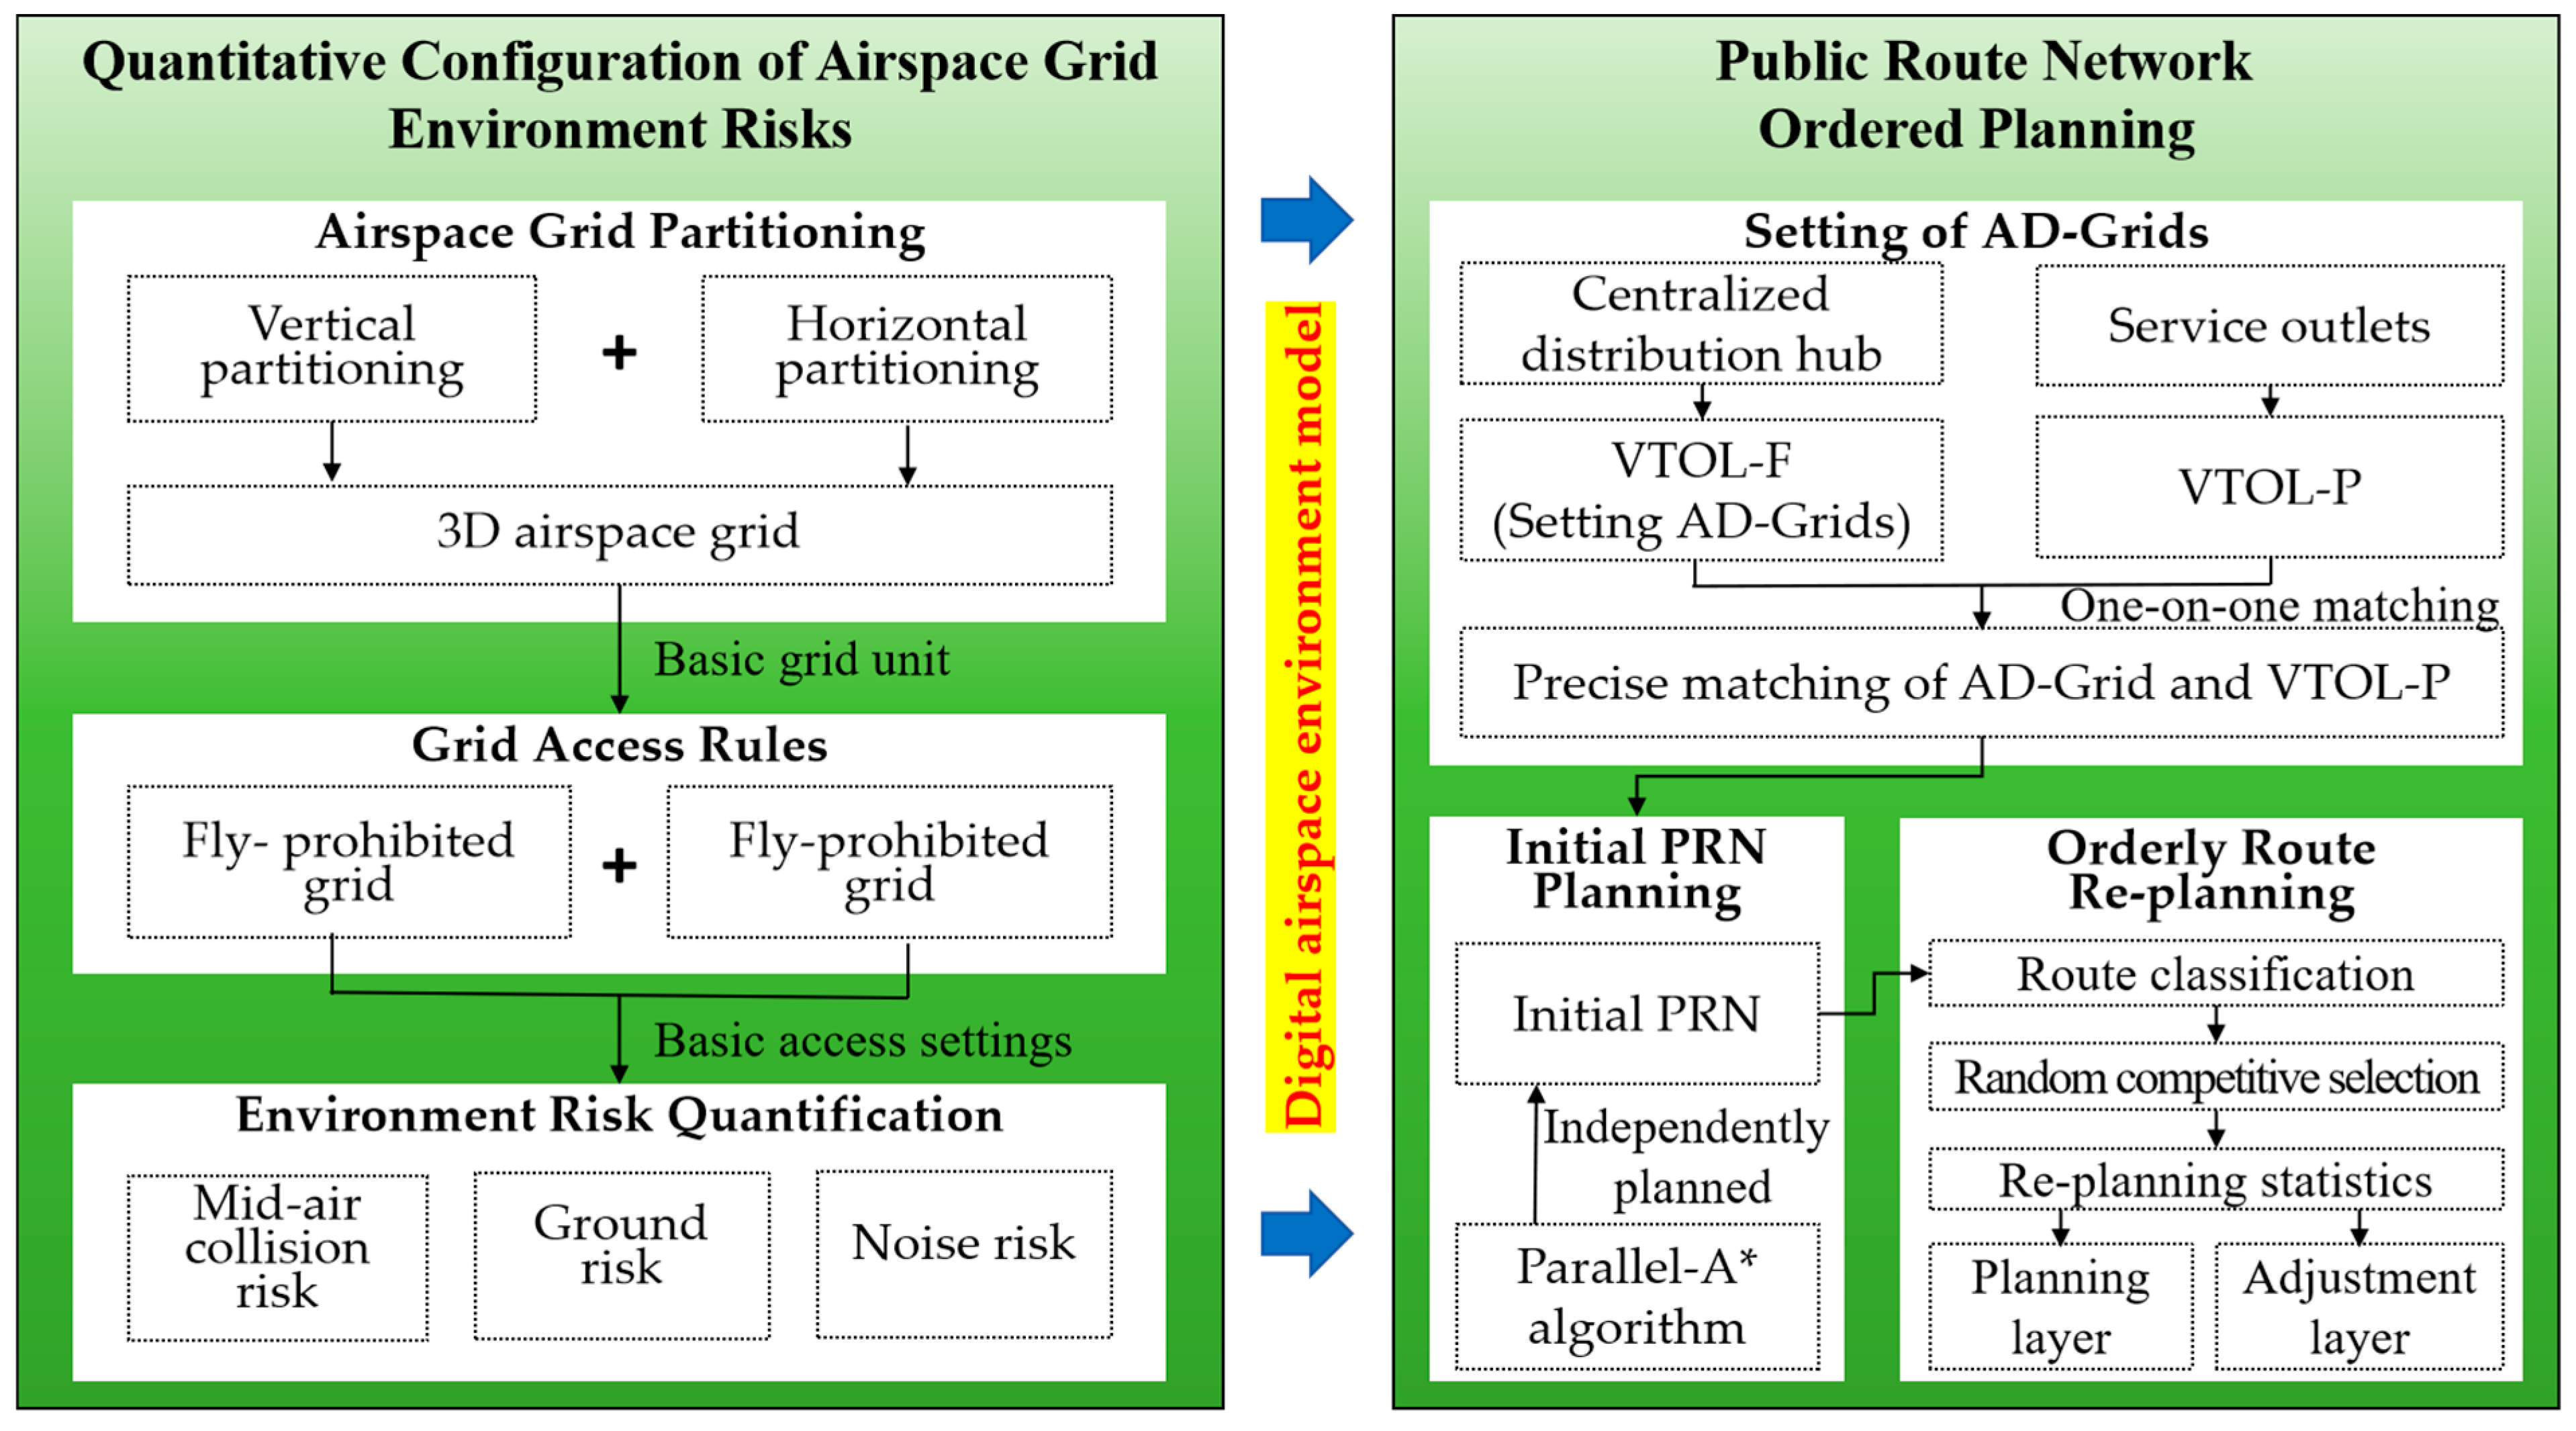
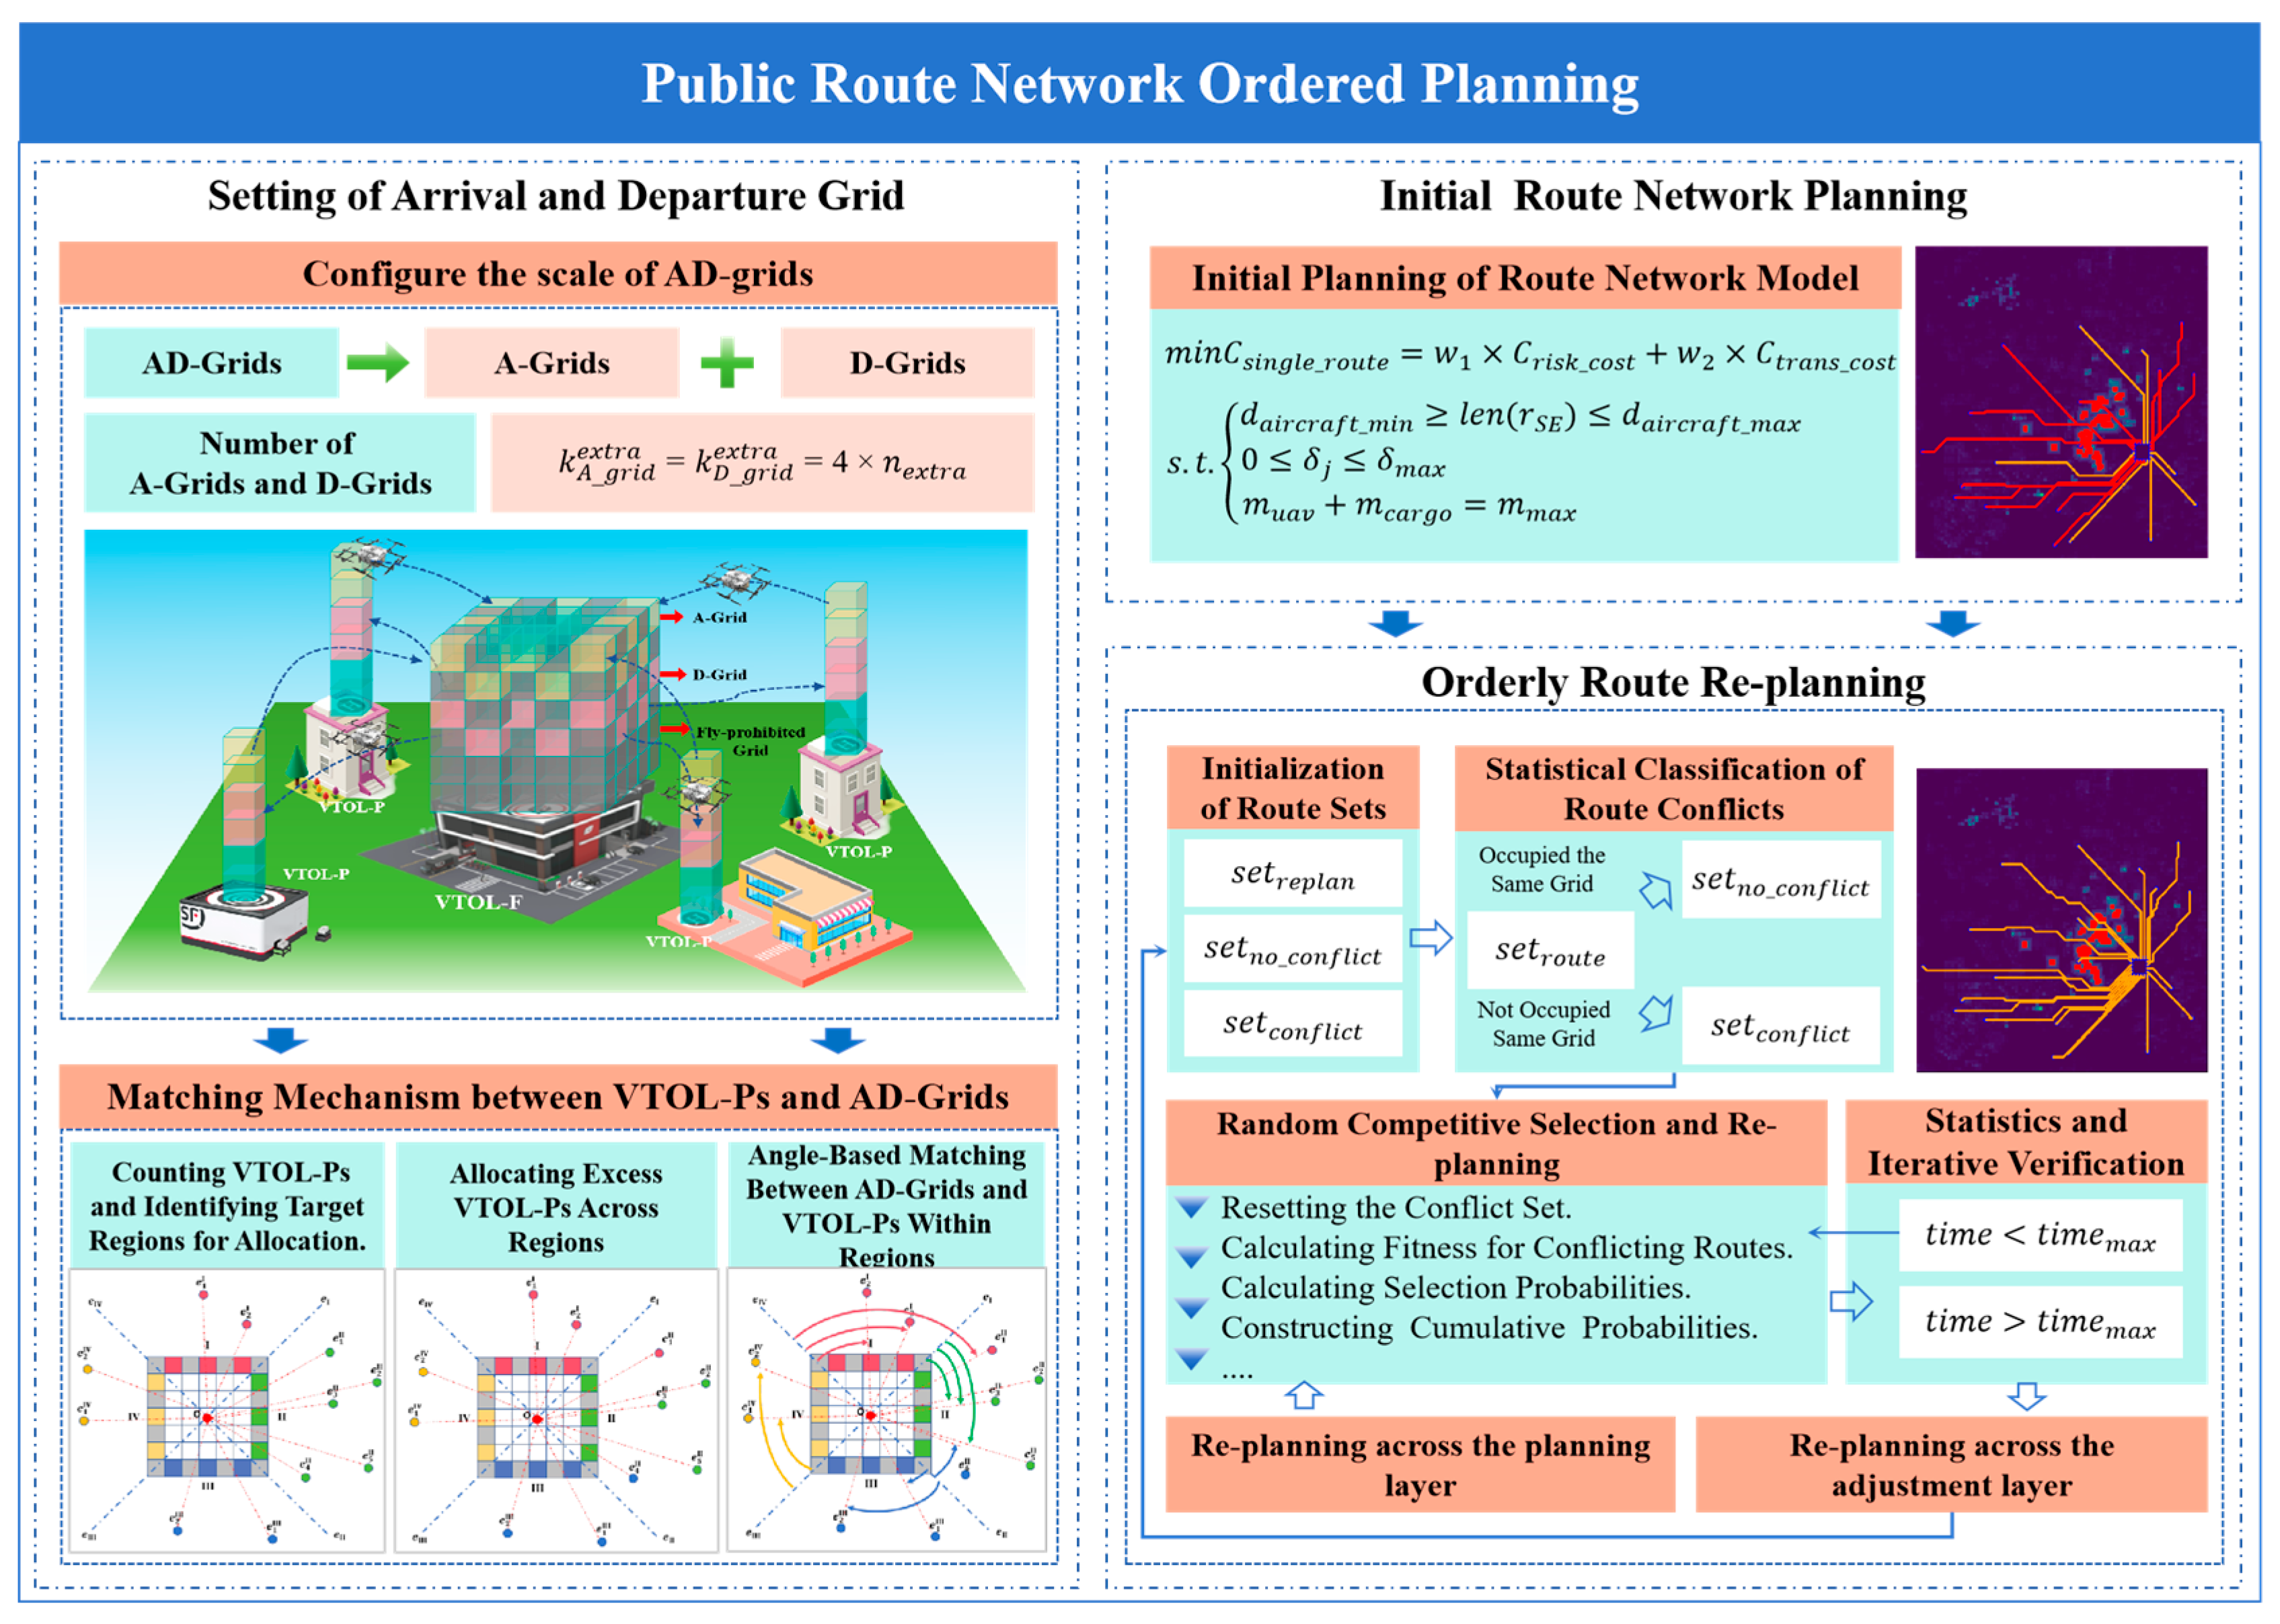
The parallel system [44] maps relevant elements from both the physical system (e.g., buildings, airspace environments, PRNs) and the social system (e.g., flight safety, noise, efficiency, regulations) into an artificial system. This process enables the quantitative configuration of airspace grid risks and the formation of a digital airspace environment model. Ultimately, a methodological framework for PRN planning for urban low-altitude terminal logistics UAVs is established, followed by the execution of computational experiments. The CPSS parallel system framework is illustrated in Figure 2. This section elaborates on two key components: the quantitative configuration of airspace grid environmental risks through artificial system construction and the planning of PRNs via computational experiments. To facilitate readers’ understanding of the workflow of this article, a technical flowchart for planning PRNs for urban low-altitude terminal logistics UAVs is provided, illustrating the dependencies and interfaces among the sub-methods, as depicted in Figure 3 (The contents in Figure 3 will be elaborated and explained further below. To better understand the content in the figure, you can read the subsequent sections).

3.1. Quantitative Configuration of Airspace Grid Environment Risks

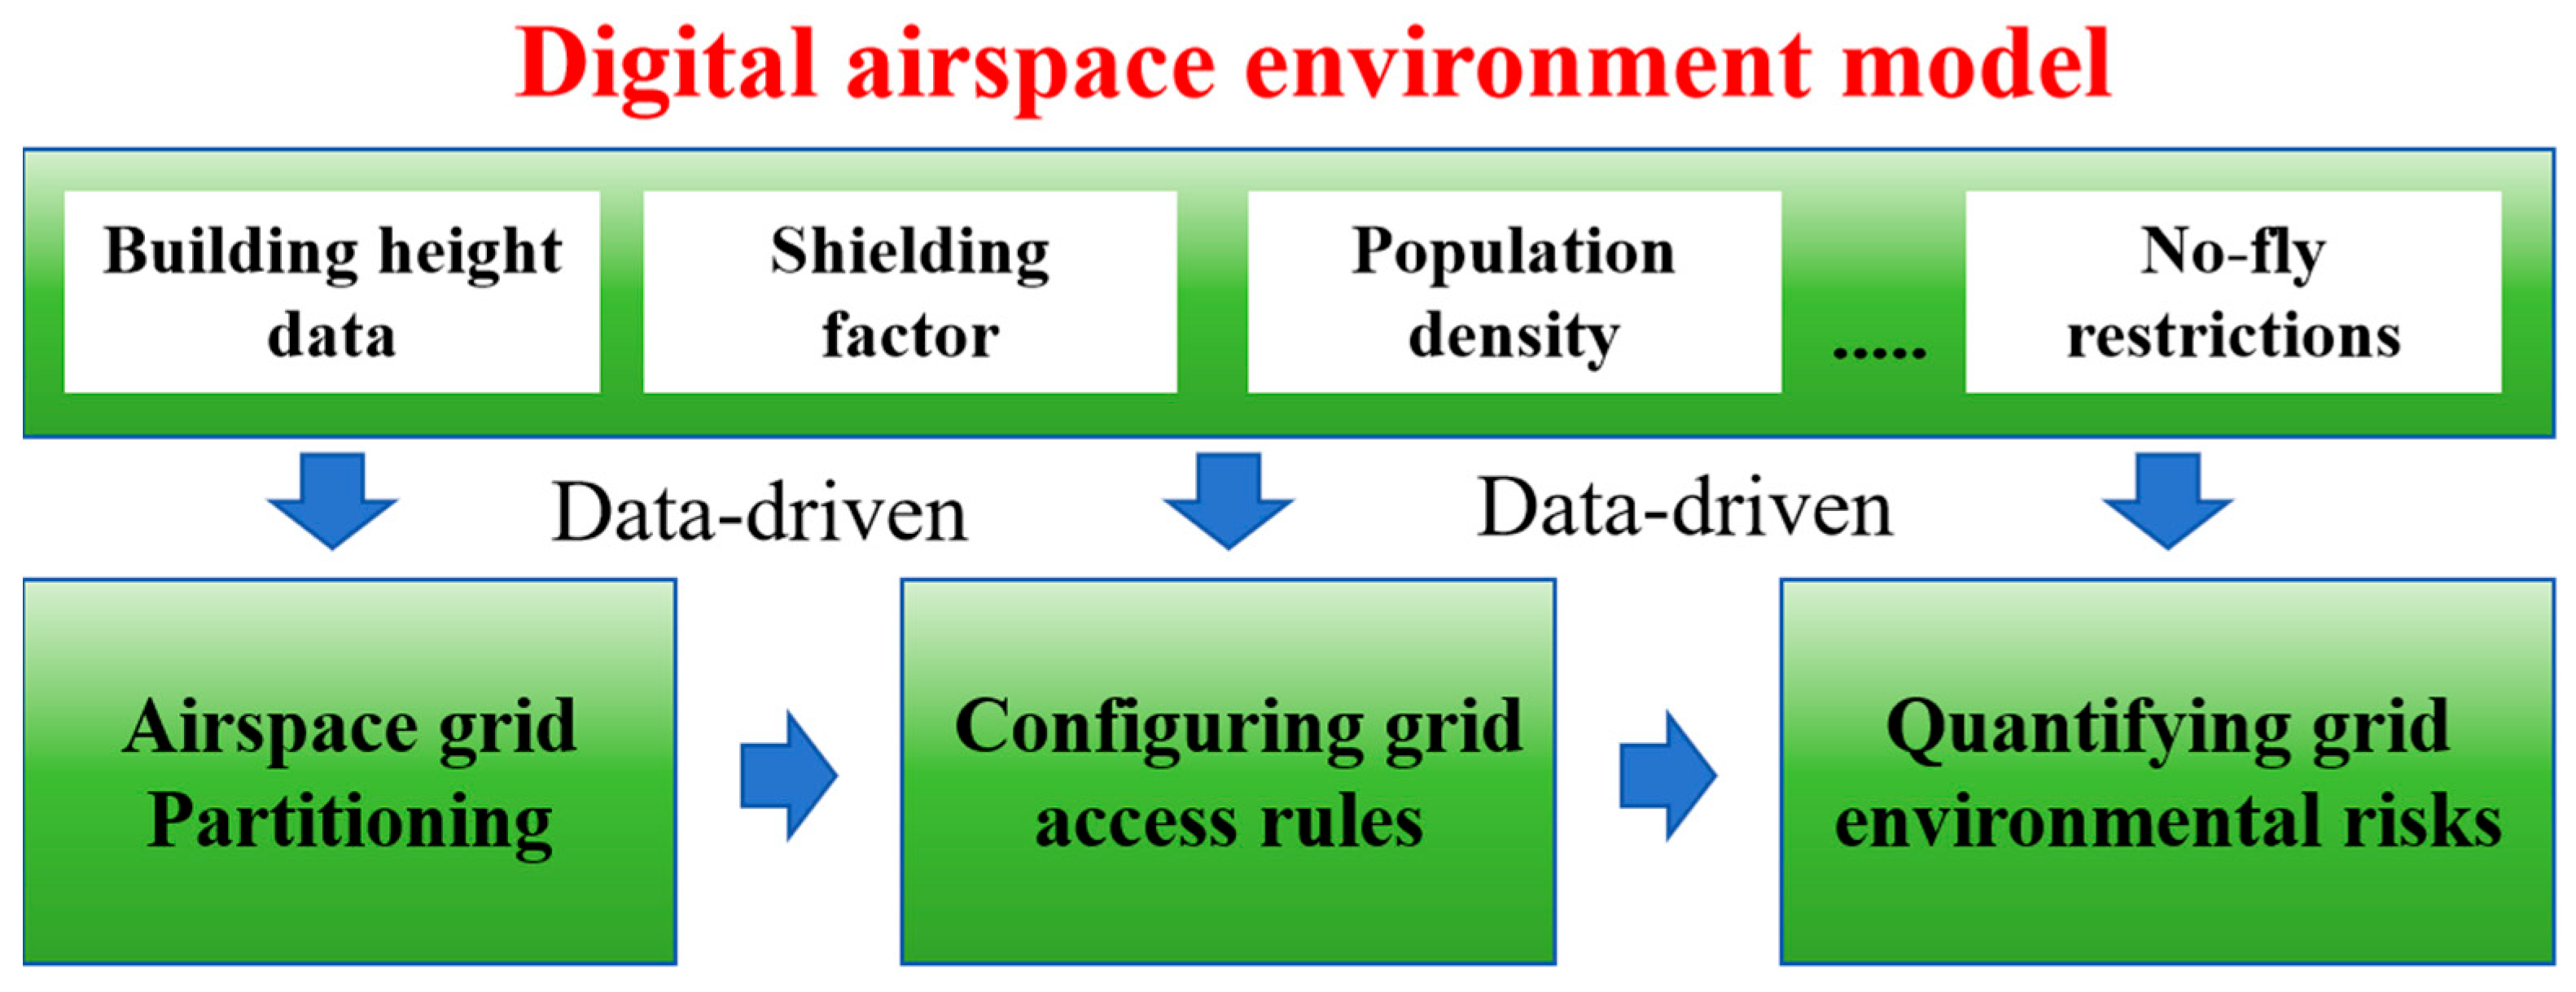
Airspace discretization relies on city building height data, and it incorporates factors such as shielding, population density, and military site control within the physical airspace. By partitioning airspace into grid units, establishing grid access rules, and quantifying environmental risks associated with each grid, a digital airspace environment model is constructed. The construction process of this digital airspace environment model is illustrated in Figure 4.

3.1.1. Airspace Grid Partitioning

Airspace grid partitioning serves as the foundation for digital airspace environment modeling and PRN planning. Using mean sea level as the benchmark, this paper employs the grid vertical–horizontal partitioning method proposed in reference [23] to conduct vertical and horizontal partitioning of the low-altitude airspace, specifically within the range of 0–3000 m.
Vertical partitioning involves dividing the airspace according to a specified vertical interval S v , yielding a set of horizontal airspace layers denoted as H s e t = { h 1 , h 2 , , h q , } , where h q represents the altitude of the q -th horizontal airspace layer. The S v for the vertical interval for partitioning is not a constant value; rather, it is jointly determined by the vertical dimension of the UAV L v _ U A V and the positioning device error L l o c a t i o n , expressed as:
S v = L v _ U A V + 2 × L l o c a t i o n
Horizontal partitioning accounts for four key horizontal minimum interval factors: UAV horizontal dimension L h _ U A V , displacement due to communication delay L d e l a y , displacement resulting from maximum speed deceleration L s p e e d C u t , and displacement caused by positioning device error L d e l a y , which are then mapped onto the corresponding G e o S O T grid at level n . The horizontal partitioning can be expressed as follows:
S h = G e o S O T ( L h _ U A V + 2 × ( L l o c a t i o n + L s p e e d C u t + L d e l a y ) )
where G e o S O T ( · ) denotes the function for mapping the UAV minimum horizontal interval to the corresponding G e o S O T grid level; and L s p e e d C u t represents the displacement caused by the deceleration of the maximum speed V m a x of the UAV when subjected to the maximum wind resistance level.
As shown in Figure 5, the schematic diagram of airspace grid partitioning illustrates the partitioning process in both vertical and horizontal dimensions. First, the vertical interval S v  and horizontal interval S h  are determined separately. Based on these two parameters, a horizontal–vertical joint partitioning is performed, ultimately establishing a 3D grid system for the digital airspace.

3.1.2. Grid Access Rule

After completing the partitioning of the airspace grid, it is essential to establish grid access rules to filter airspace grids that meet the criteria for safe operations and to identify areas deemed risky, which are designated as flight-prohibited. This serves as a foundational compliance measure for the subsequent quantitative assessment of airspace environmental risks and the orderly planning of the PRN.
The grid access rules categorize grids into two distinct types: fly-permitted grids and fly-prohibited grids. This classification can be articulated as follows:
A i = 0 fly - permitted 1 fly - prohibited
Fly-permitted grids refer to areas within the airspace that UAVs are allowed to enter, whereas fly-prohibited grids are designated areas that UAVs are forbidden to access. The access rules based on the attributes of low-altitude airspace grids are shown in Table 1.

3.1.3. Environment Risk Quantification

After confirming the grid access rules information, it is essential to further configure the environmental risk attributes for the airspace grid. The environment risks primarily encompass those triggered by urban physical and social factors. This configuration is primarily composed of three components: mid-air collision risk R c o l l i s i o n i , ground risk R c r a s h i , and noise risk R n o i s e i :
E i = γ 1 × R c o l l i s i o n i + γ 2 × R c r a s h i + γ 3 × R n o i s e i 3
where R c o l l i s i o n i , R c r a s h i , and R n o i s e i represent the normalized value of the three risks respectively; γ 1 , γ 2 , and γ 3 are the corresponding weight coefficients, respectively. To ensure consistency and comparability among the risk values, we employ a normalization method, which is articulated as follows:
F ( x ) = F ( u ) F ( u ) m i n F ( u ) m a x F ( u ) m i n
where F ( x ) represents the normalized value of each sub-risk, F ( x ) represents the actual value of each sub-risk, and F ( x ) m i n and F ( x ) m a x represent the minimum and maximum values of each sub-risk.
Building on the previous discussion of environment risks, the following sections will proceed to introduce the three risks.
(1)
Mid-air Collision Risk
The mid-air collision risk [23] is quantified using the potential field method, which assigns repulsive forces to grid points corresponding to physical obstacles. This mechanism ensures that route planning inherently avoids such obstacles. Consequently, the impact of an obstacle f on the mid-air collision risk U f i of surrounding grid i can be expressed as:
U f i = 1 i s e t o w n f 0.5 i s e t 1 s t f 0.25 i s e t 2 n d f 0 i s e t e l s e
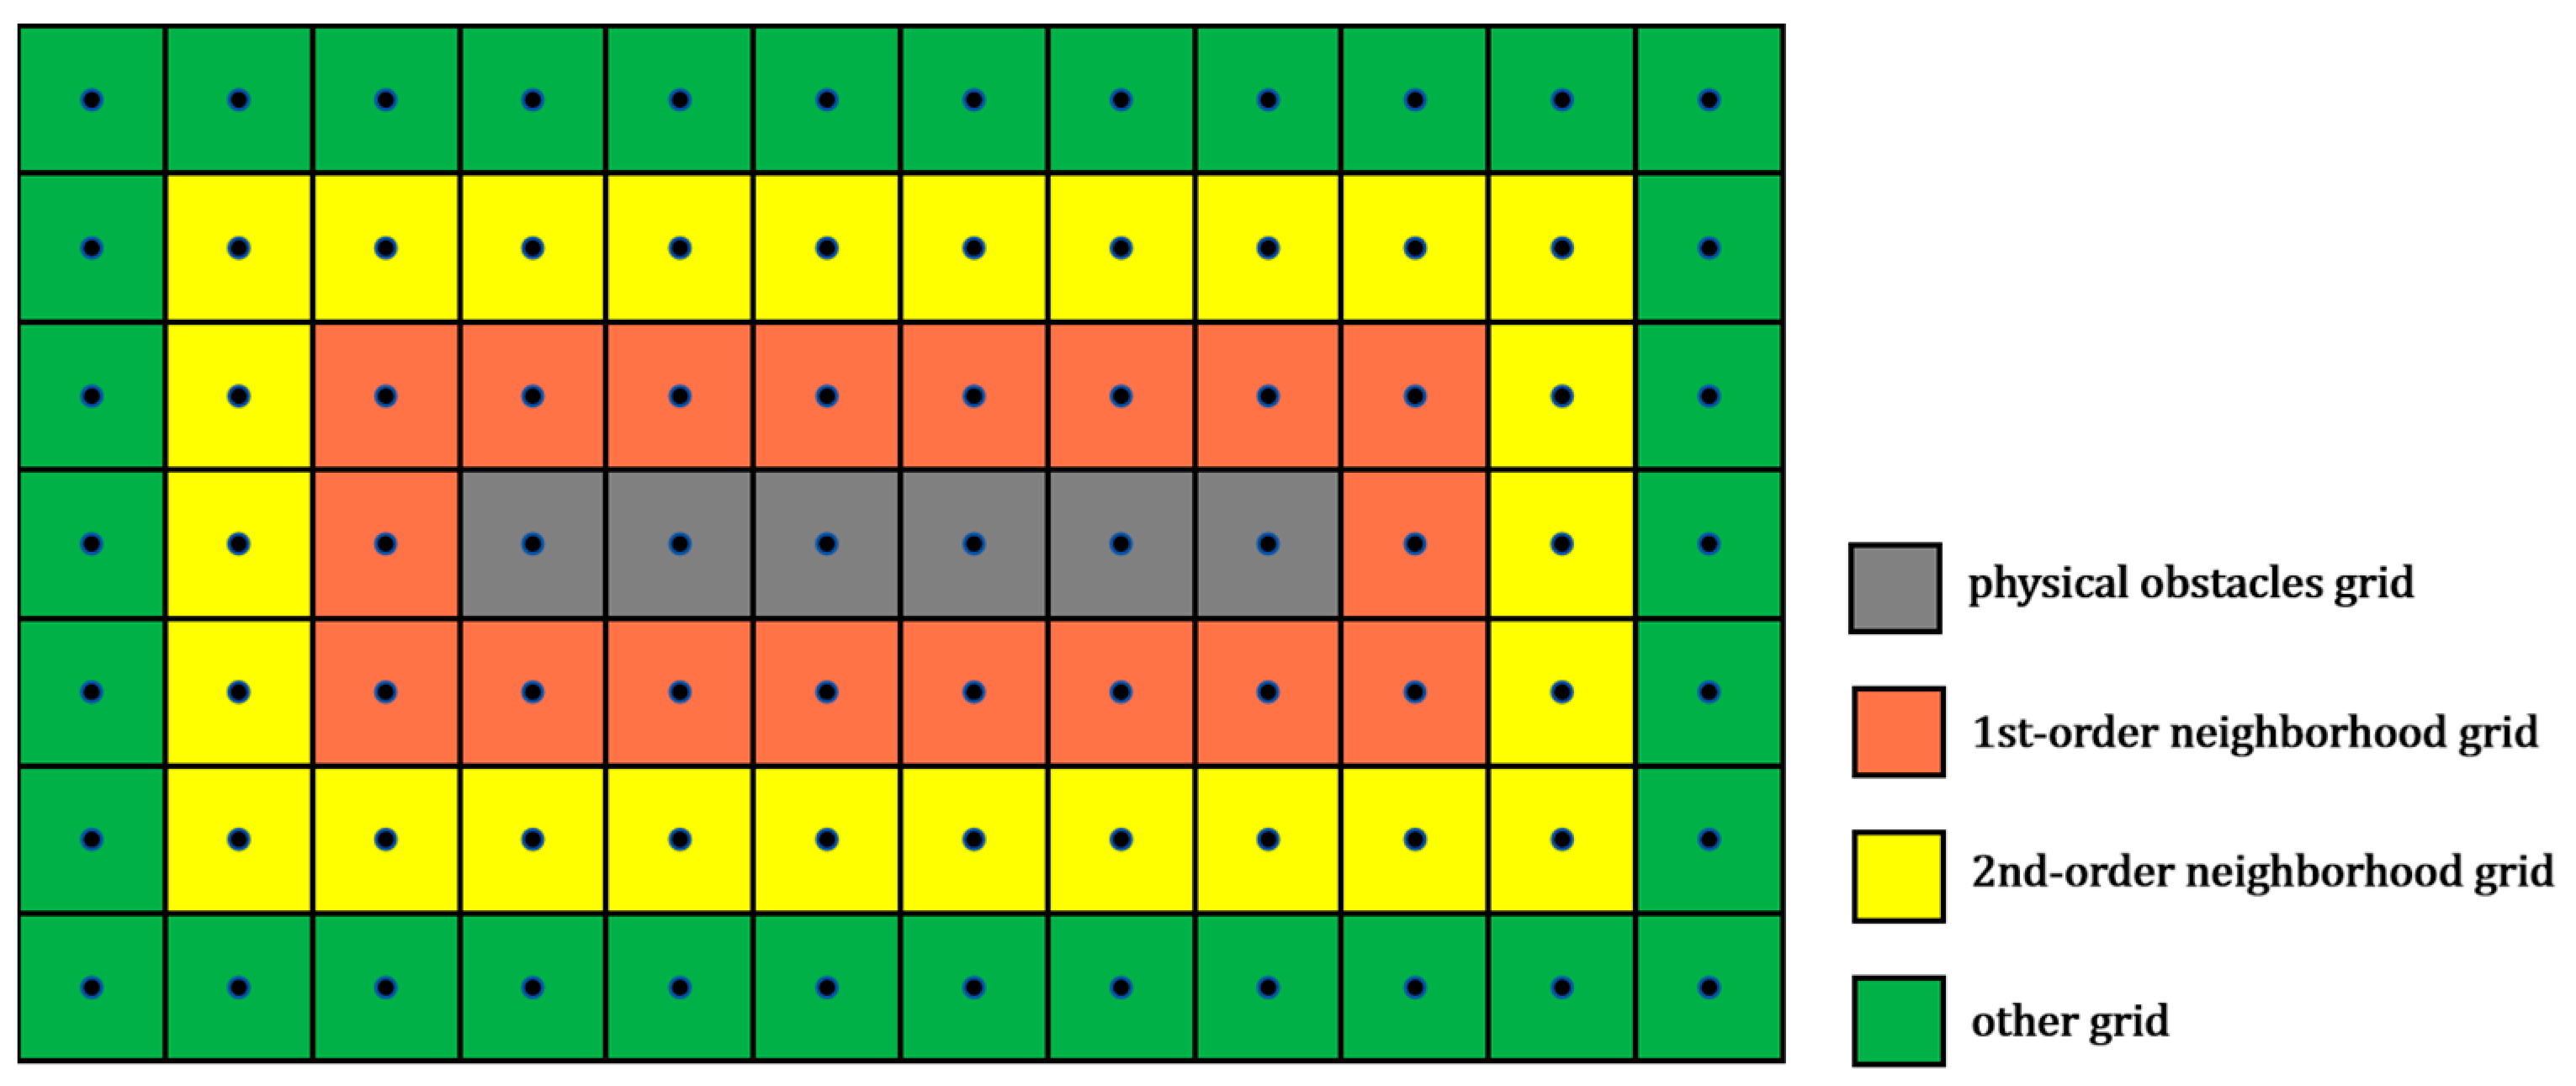
where s e t o w n f , s e t 1 s t f , s e t 2 n d f , and s e t e l s e , respectively, represent the sets of grids that are influenced by the potential field intensity of mid-air collision risks associated with the fly-prohibited grid. s e t o w n f denotes the grid corresponding to the obstacle itself; s e t 1 s t f represents the first-order neighbor grids around the obstacle; s e t 2 n d f represents the second-order neighbor grids around the obstacle; and s e t e l s e refers to other grids that are not affected by the repulsive force of the obstacle, as illustrated in Figure 6.
The grid i may be simultaneously affected by mid-air collision risks generated by multiple physical obstacles. R c o l l i s i o n i is defined as the total mid-air collision risk exerted on the grid i by all adjacent obstacle grids. The specific formula is as follows:
R c o l l i s i o n i = f = 1 l e n ( s e t U f i ) U f i
where s e t U f i denotes the set of physical obstacles exerting an influence on grid i .
(2)
Ground Risk
The ground risk pertains to the potential hazards that may threaten the safety of ground personnel during UAV flight. The risk can be quantified and expressed in relation to the grid i :
R c r a s h i = P u a v × N p e o p l e i × E n × ( 1 G S i )
where P u a v denotes the crash accident rate of the UAV; N p e o p l e refers to the number of people colliding with the UAV in the event of an accident [45]; and G S is the shielding factor for grid i , which reflects the exposure level of ground personnel within the UAV flight area. The value of the shielding factor is provided in Table 2 [46]. E n represents the kinetic energy of the UAV at impact. E n can be expressed as:
E n = m a l l g h q + 0.5 m a l l v 2
where m a l l represents the total mass of the UAV at impact. This mass is composed of the UAV’s inherent mass m u a v and the carried package m c a r g o , such that m a l l = m u a v + m c a r g o . Here, v denotes the impact speed of the UAV.
(3)
Noise Risk
Noise risk refers to the adverse impact of UAV noise on residents during flights in urban airspace. The noise risk R n o i s e i of the grid i can be quantified as:
R n o i s e i = φ L h 1 h u a v 2 + d p e o p l e 2
where h u a v represents the UAV’s vertical height above the ground; φ denotes the conversion for translating sound intensity to sound level; d p e o p l e represents the horizontal distance between the UAV and people; and L h is the reference noise value generated by the UAV [47].

3.2. PRN Ordered Planning

To achieve orderly planning of PRNs for urban low-altitude terminal UAV logistics and ensure conflict-free segregation between routes, a systematic planning framework is established. We further achieve precise matching between the approach–departure grids (AD-Grids) of VTOL-Fs and VTOL-Ps following the completion of quantitative airspace grid environmental risks. Based on the matching results, the Parallel-A* algorithm [23] is employed for the orderly planning of the routes. Ultimately, this creates a complete hub-and-spoke logistics PRN.

3.2.1. Setting of AD-Grids

Considering the vertical take-off and landing capabilities of UAVs, the VTOL-F can function as a logistics distribution center. This logistics distribution station is characterized by frequent take-off and landing requirements and a multitude of access routes. To ensure the segregated operation of each route within the route network and to meet the hub-and-spoke distribution demand that all goods are dispatched from a VTOL-F to a designated VTOL-P, it is essential to configure the scale of AD-Grids within the airspace of the VTOL-Fs according to the number of terminal VTOL-Ps. Furthermore, to maintain the segregated operation of each route in the PRN, the scale and layout of AD-Grids must be dynamically adjusted based on the number of terminal VTOL-Ps. Additionally, a one-to-one matching mechanism between VTOL-Ps and AD-Grids should be established, allowing for precise mapping between VTOL-Ps and these grids.
The PRN planned in this paper is confined to a single altitude layer within the layered airspace. Concurrently, routes with distinct functional attributes are allocated to separate altitude layers to further ensure physical segregation and operational safety among the routes. As illustrated in Figure 7, two arrival grid (A-Grid) layers and two departure grid (D-Grid) layers are, respectively, configured in the VTOL-F. The upper A-Grid layer serves as the route planning layer, while the lower layer functions as the route adjustment layer. In the case of the D-Grids, the lower layer acts as the route planning layer, and the upper layer is designated for route adjustments. This AD-Grid configuration in the VTOL-F allows for a limited number of routes, requiring re-planning to be situated in the middle adjustment layer, while standard arrival and departure routes are positioned at the extremes, thereby enhancing the vertical safety distance between them. Furthermore, to bolster the safety of the VTOL-F terminal airspace, no-fly grids (gray grids in Figure 7) are alternately established between the AD-Grids. It is important to note that this paper exclusively addresses route planning between the AD-Grids and VTOL-Ps, and does not cover route planning within the internal airspace of the VTOL-F.
Due to the fixed delivery requirements from each VTOL-F to VTOL-Ps, separate arrival and departure routes will be established. Each fixed delivery requirement will independently utilize one A-Grid and one D-Grid, thereby achieving precise matching of AD-Grids and VTOL-Ps. As the number of routes increases, the quantity of AD-Grids designated within the VTOL-F airspace will also rise. Using the central grid of the VTOL-F as a reference, in this paper it expands outward layer by layer, designating the VTOL-F center as Layer 0. The number of AD-Grids that can be established in each outward expansion layer is as follows:
K A G r i d n e x t r a = K D G r i d n e x t r a = 4   ×   n e x t r a
where K A G r i d n e x t r a and K D G r i d n e x t r a represent the number of A-Grids and D-Grids configured in the n e x t r a layer.
Therefore, for a VTOL-F with P routes, the number of outward-extended layers of the A-Grid extended outwards that need to be configured is n e x t r a = P 4 . Given that the allocation methods for both the A-Grid and D-Grid are identical, the following content and simulation study will be elaborated in detail using the A-Grid as an example.
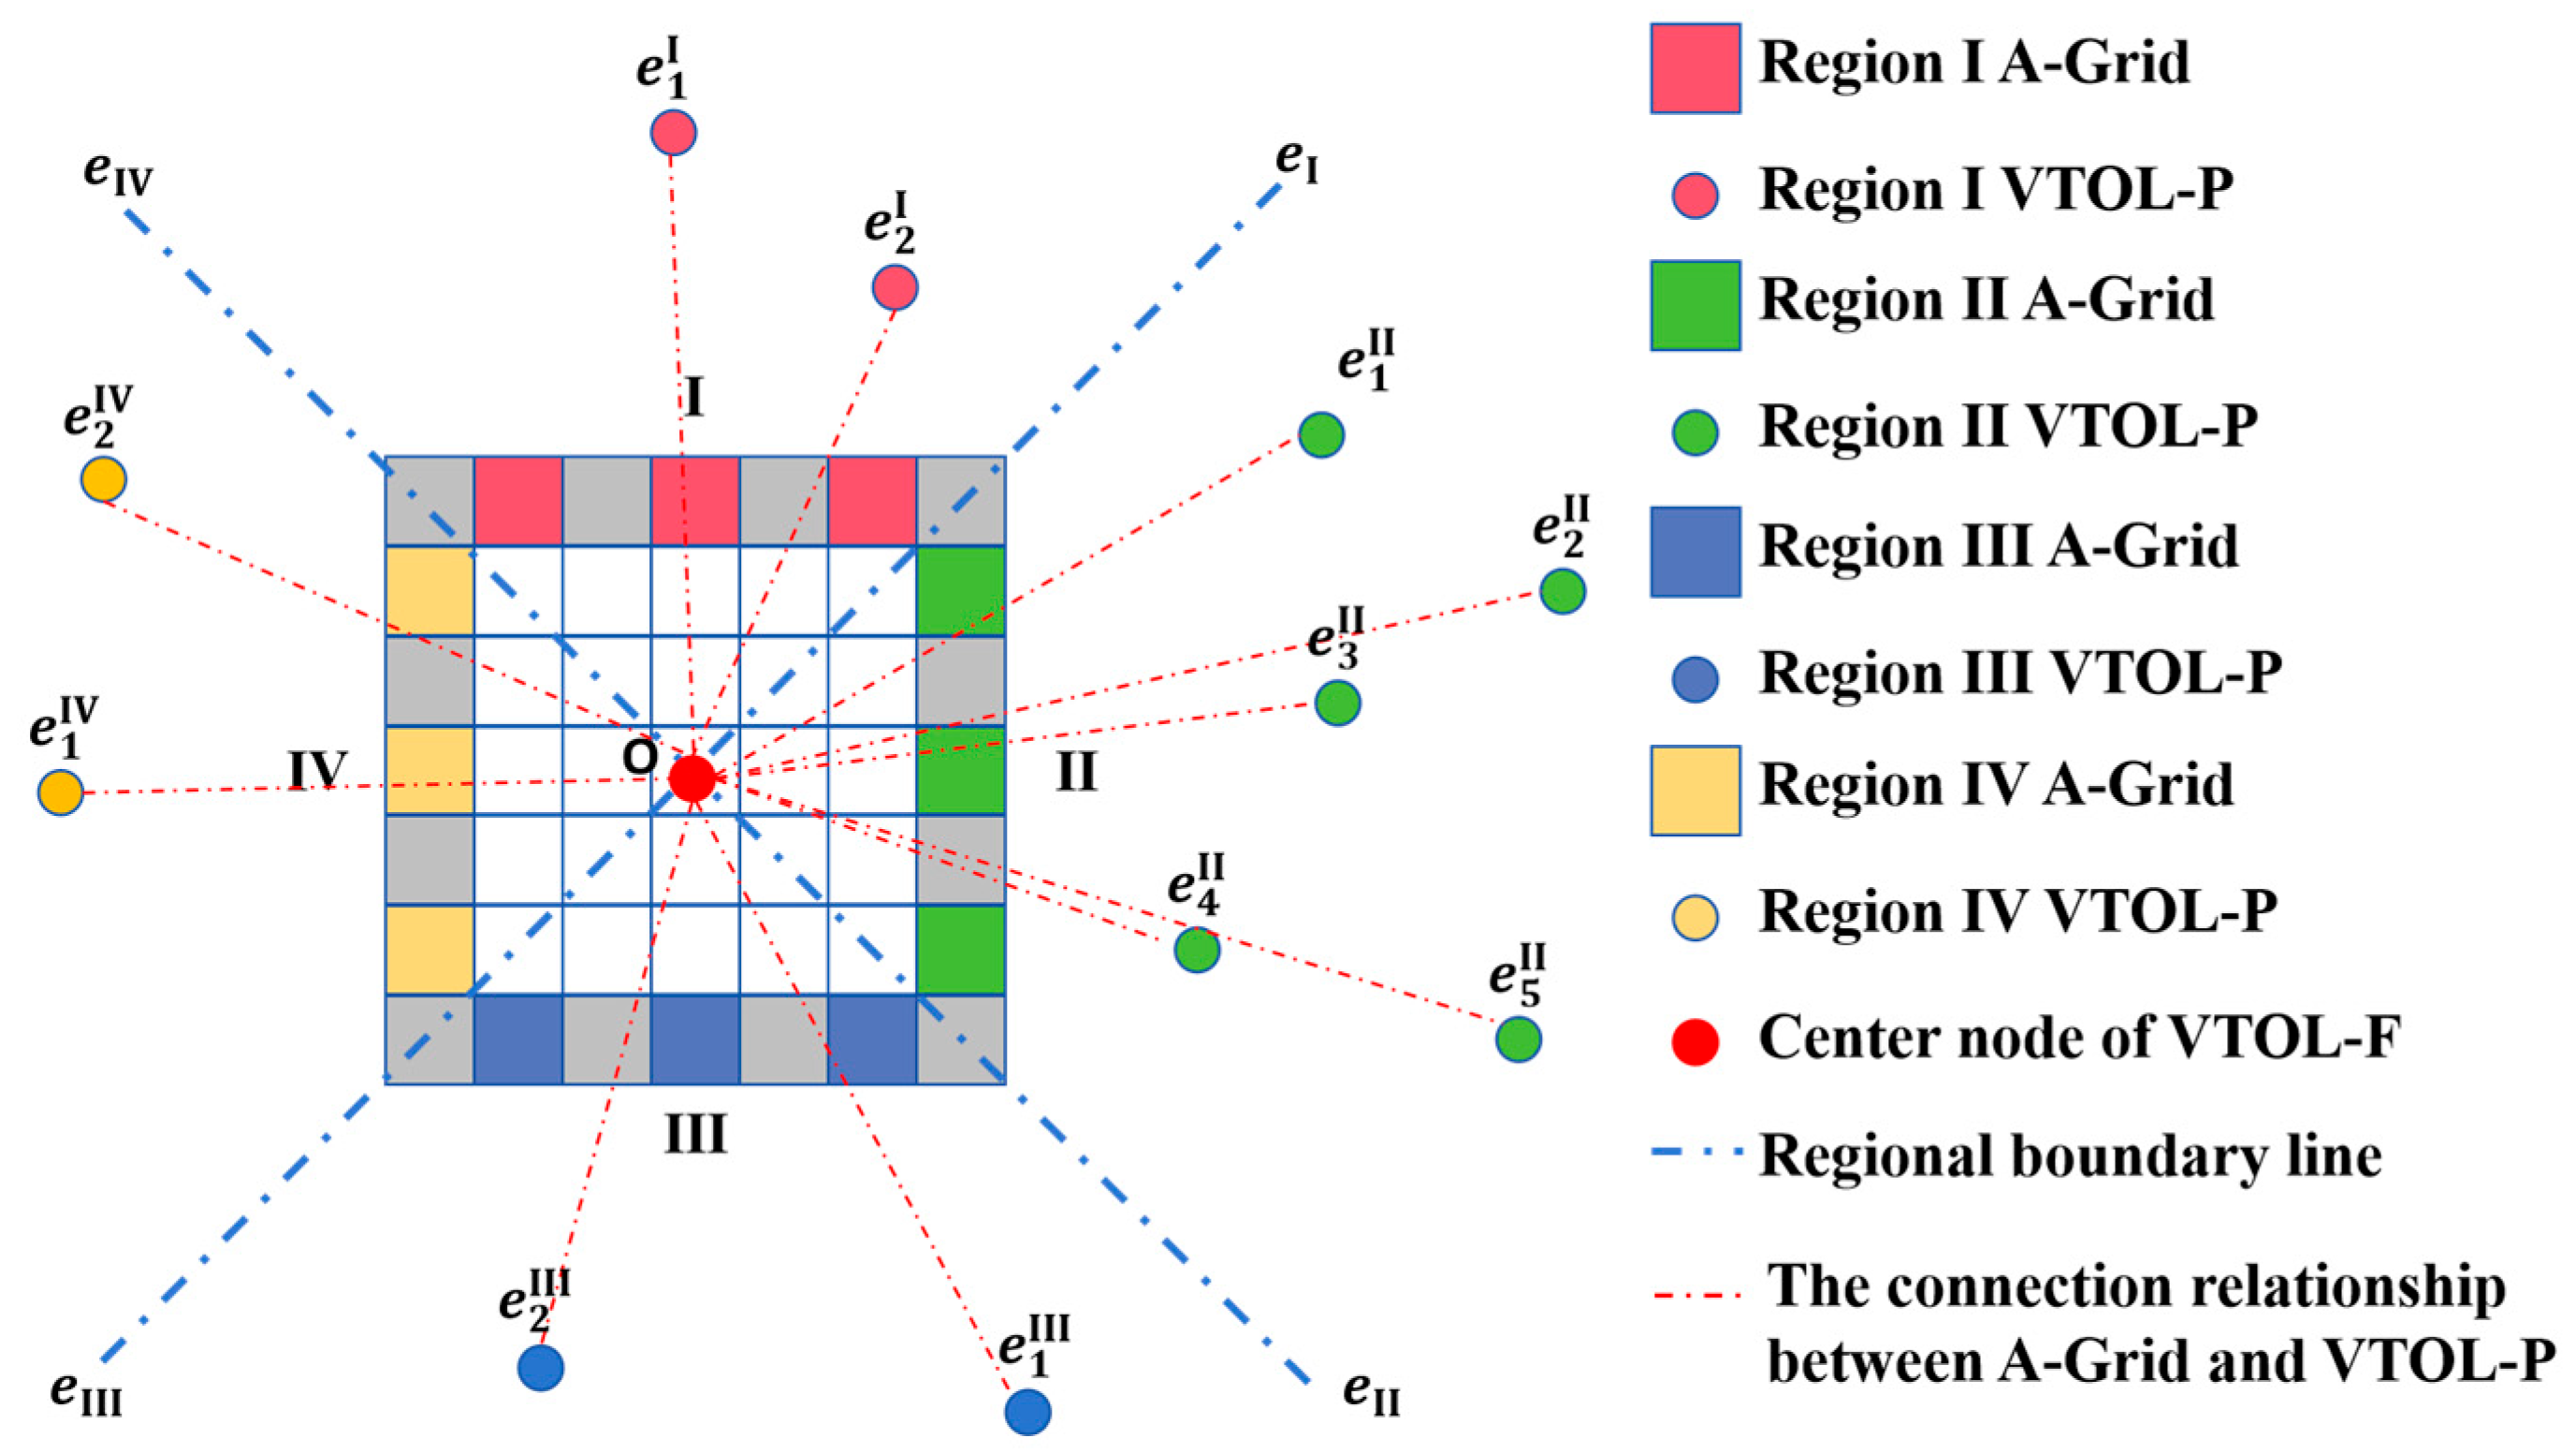
For ease of calculation, the airspace for PRN planning is divided into four regions (I, II, III, and IV), with boundaries e I , e I I ,   e I I I , and e I V , respectively, as illustrated in Figure 8. Using this division, we count the number of VTOL-Ps within each region; s e t o Χ denotes the set of A-Grids and s e t d Χ denotes the set of grids corresponding to VTOL-Ps, and these sets are expressed as:
s e t o Χ = { o 1 Χ , , o t Χ , , o T Χ }
s e t d X = { d 1 X , , d k X , , d K X }
where T is the number of A-Grids in region X of the VTOL-F; o t X is the t -th A-Grid in region X of the VTOL-F; K is the number of VTOL-P grids in region X of the VTOL-F; and d k X is the k -th VTOL-P grid in region X of the VTOL-F.
The regions are ranked in descending order according to the number of VTOL-Ps (i.e., the corresponding count of A-Grids) within the VTOL-F’s airspace. For a region with an A-Grid count T , if the number of VTOL-Ps in that region exceeds T , the excess VTOL-Ps must be reallocated to other regions. As illustrated in Figure 8, region II contains five VTOL-Ps but only three A-Grids; therefore, the excess VTOL-Ps need to be reallocated to other regions.
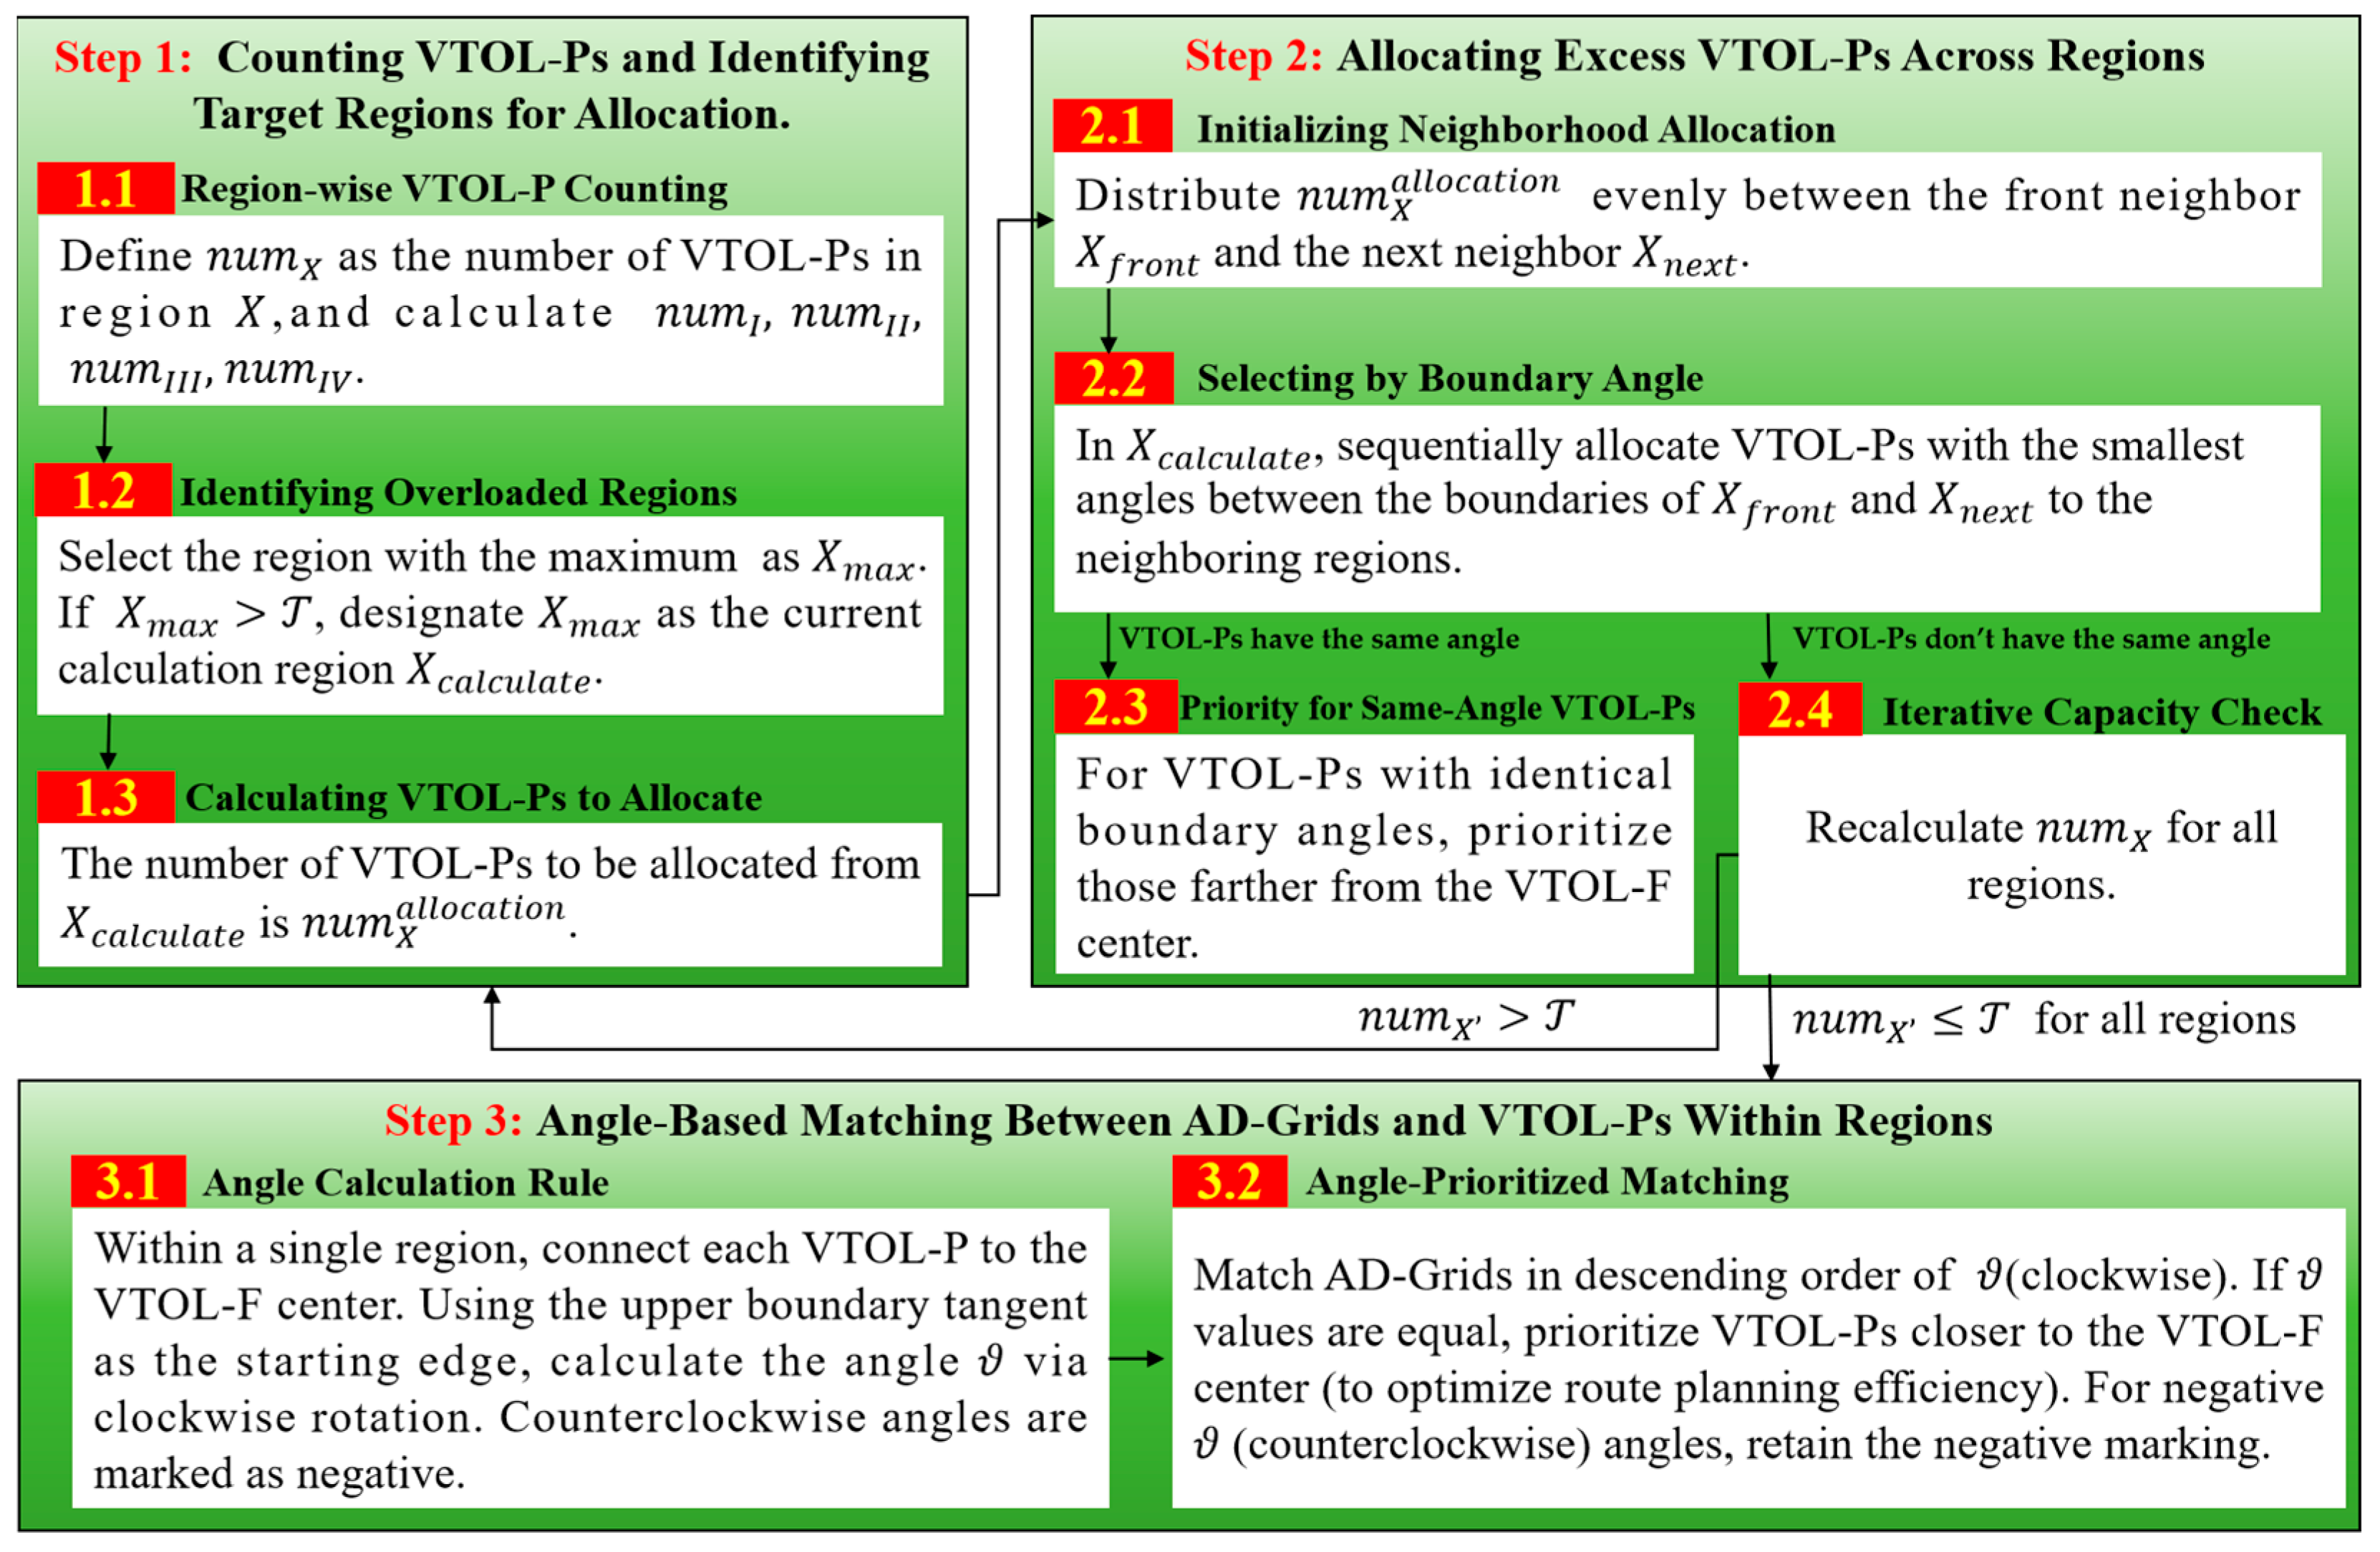
Next, we will further elaborate on the precise matching of AD-Grids to VTOL-Ps. To facilitate a better understanding of this precise matching method, this paper has developed a flowchart that illustrates the steps for the precise matching of AD-Grids to VTOL-Ps, as depicted in Figure 9.
The steps for the precise matching of AD-Grids to VTOL-Ps are as follows:
Step 1: Counting VTOL-Ps and identifying target regions for allocation.
Step 1.1: Region-wise VTOL-P counting. Define n u m X as the number of VTOL-Ps in region X { I , I I , I I I , I V } , and calculate n u m I , n u m I I , n u m I I I , n u m I V .
Step 1.2: Identifying overloaded regions. Select the region with the maximum n u m X as X m a x . If n u m X > T (where T = K A G r i d n e x t r a / 4 ), designate X m a x as the current calculation region X c a l c u l a t e .
Step 1.3: Calculating VTOL-Ps to allocate. The number of VTOL-Ps to be allocated from X c a l c u l a t e is n u m X a l l o c a t i o n = n u m X T .
Step 2: Allocating excess VTOL-Ps across regions (neighboring region priority).
Step 2.1: Initializing neighborhood allocation. Distribute n u m X a l l o c a t i o n evenly between the front neighbor X f r o n t and the next neighbor X n e x t (e.g., if X c a l c u l a t e = I I , then X f r o n t = I and X n e x t = I I I ).
Step 2.2: Selecting by boundary angle. In X c a l c u l a t e , sequentially allocate VTOL-Ps with the smallest angles between the boundaries of X f r o n t and X n e x t to the neighboring regions. If multiple VTOL-Ps share the same angle, proceed to Step 2.3.
Step 2.3: Priority for same-angle VTOL-Ps. For VTOL-Ps with identical boundary angles, prioritize those farther from the VTOL-F center.
Step 2.4: Iterative capacity check. Recalculate n u m X for all regions. If n u m X > T still holds, repeat Steps 2.1–2.3 until n u m X < T for all regions.
Step 3: Angle-based matching between AD-Grids and VTOL-Ps within regions.
Step 3.1: Angle calculation rule. Within a single region, connect each VTOL-P to the VTOL-F center. Starting from the upper boundary tangent as the initial edge, calculate the angle ϑ through clockwise rotation. Counterclockwise angles are designated as negative.
Step 3.2: Angle-prioritized matching. Involves matching AD-Grids in descending order of ϑ (clockwise). If ϑ values are equal, prioritize VTOL-Ps closer to the VTOL-F center in order to enhance route planning efficiency. For negative ϑ (counterclockwise angles), retain the negative marking (as shown in Figure 10c).
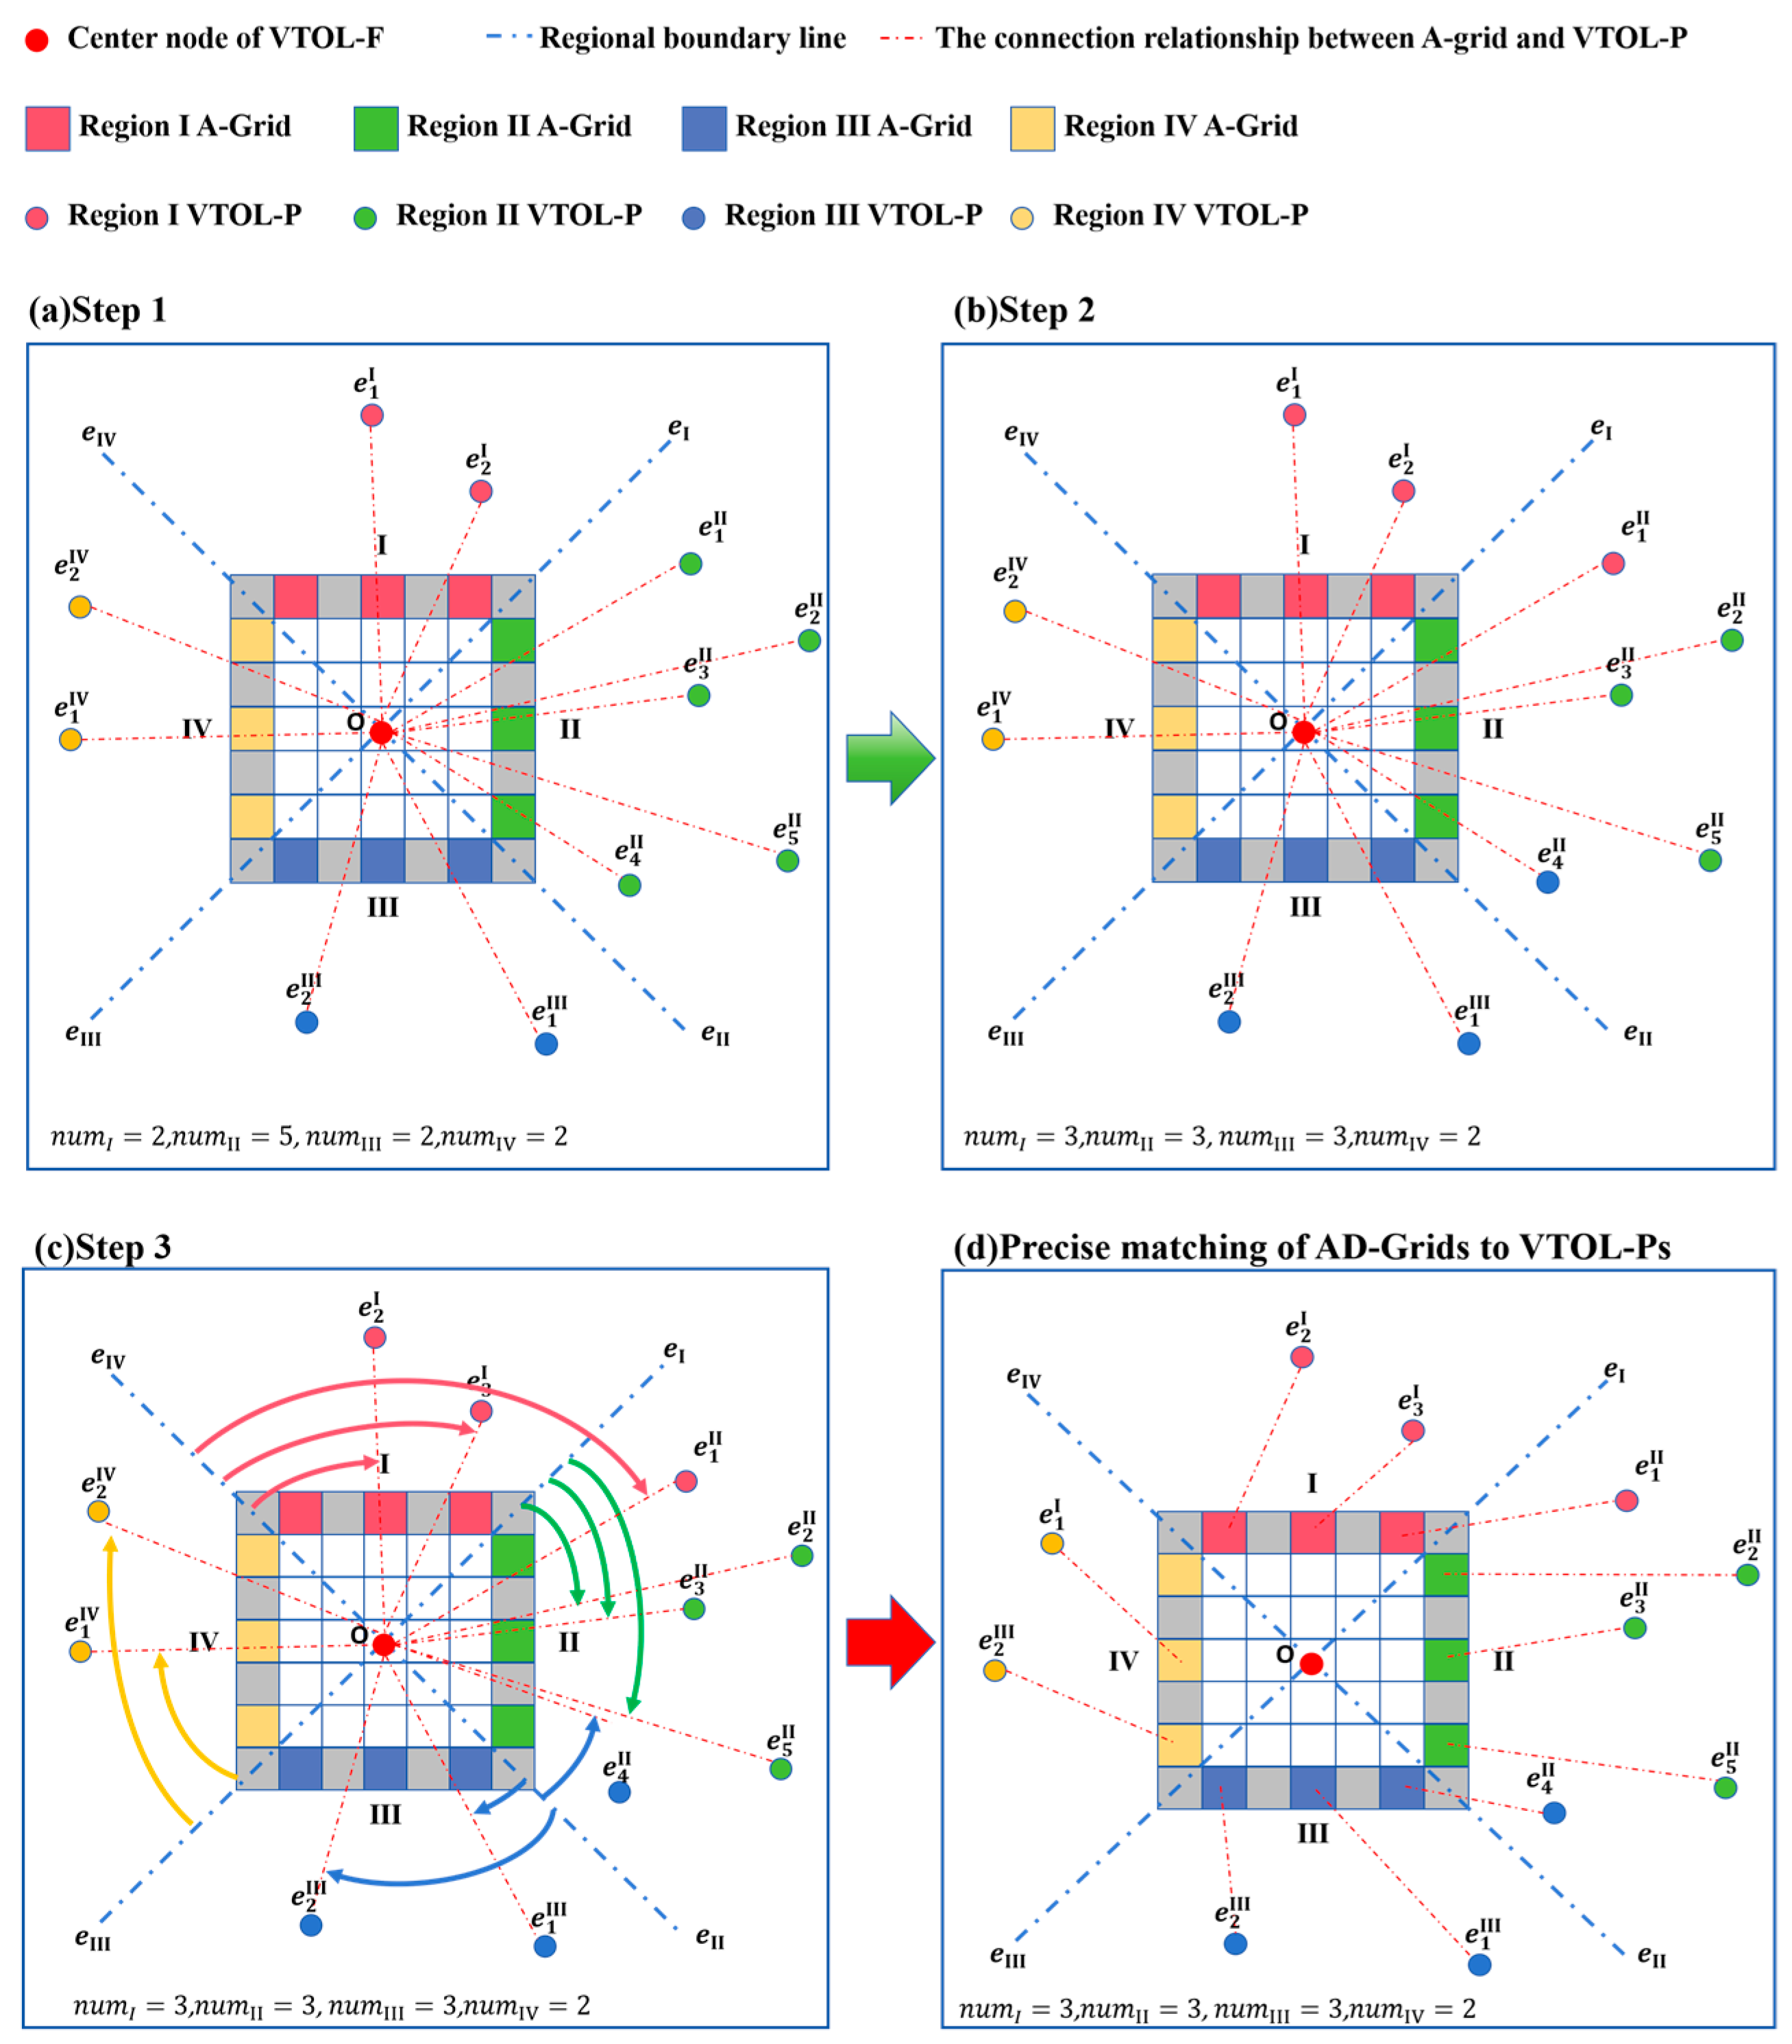
Based on the procedural description outlined in the preceding sections, this paper presents an example of precise matching between VTOL-P and AD-Grids, thereby enhancing the readers’ understanding of the matching methodology employed between AD-Grids and VTOL-Ps. And a diagram is provided in Figure 10. The specific contents are detailed as follows:
By counting the number of VTOL-Ps in the four regions, we obtain n u m I = 2 ,   n u m I I = 5 ,   n u m I I I = 2 , n u m I V = 2 . Since the number of VTOL-Ps in Region II exceeds the AD-Grid capacity ( n u m I I = 5 > T ,   w h e r e   T = 3 ), Region II is selected as the target for allocation X c a l c u l a t e = X I I .
The excess VTOL-Ps in Region II are e 1 I I and e 4 I I . Following the neighboring region priority rule, these are allocated to the front neighbor X f r o n t = X I and the next neighbor X n e x t = X I I I . Based on the minimum boundary angle principle (Step 2.2 in Figure 9), e 1 I I is assigned to Region I and e 4 I I to Region III. After allocation, the counts are updated to: n u m I = 3 ,   n u m I I = 3 ,   n u m I I I = 3 ,   n u m I V = 2 . A capacity check (Step 2.4 in Figure 9) confirms all regions satisfy n u m X T , allowing us to proceed to the next step.
Using clockwise boundary angles as the sorting criterion, AD-Grids are matched to VTOL-Ps following the minimum angle priority rule (arc annotations in Figure 10c indicate angle priority levels).
After Steps 1–3, the precise matching result between AD-Grids and VTOL-Ps is obtained. The number of VTOL-Ps in each region perfectly aligns with the AD-Grid capacity, thereby verifying the method’s feasibility.

3.2.2. Initial PRN Planning

In Section 3.2.1, the OD-pair set s e t o d (where OD denotes one-to-one mapping between A-Grids and VTOL-Ps) can be derived. To enable orderly PRN planning, an initial route is first independently planned for each OD-pair in s e t o d under the current airspace environment. Each route is planned independently to avoid inter-route interference, resulting in the initial route set s e t r o u t e .
The initial PRN planning stage employs the Parallel-A* algorithm, which simultaneously optimizes two metrics: the airspace risk cost and the number of path inflection points. The objective function consists of two components: the route risk cost C r i s k _ c o s t and the UAV transportation cost C t r a n s _ c o s t . C r i s k _ c o s t and C t r a n s _ c o s t can be expressed as:
C r i s k _ c o s t = t = 1 n E t , t 1                          = t = 1 n l t 1 , t × E t + E t 1 2
C t r a n s _ c o s t = t = 1 n P t 1 , t                                          = t = 1 n l t 1 , t × f e × τ ( m c a r g o )
where E t 1 , t and P t 1 , t represent the environment risk and transportation operation cost of the edge formed by grid points t 1 and t ; l t 1 , t represents the Euclidean distance between grid points t 1 and t ; f e is the cost paid unit of UAV energy consumption [48]; and τ ( m c a r g o ) is the penalty coefficient when the load is m c a r g o [48], which can be expressed as:
τ ( m c a r g o ) = τ m a x 1 m m a x × m c a r g o + 1
where τ m a x is the maximum penalty value for goods, and m m a x is the maximum weight of goods.
In summary, the objective function of single-route planning can be expressed as:
m i n C s i n g l e _ r o u t e = w 1 × C r i s k _ c o s t + w 2 × C t r a n s _ c o s t
where w 1 and w 2 are adjustable parameters representing the risk weight and the cost weight, respectively, and w 1 + w 2 = 1 .
Constraints mainly include the range constraint, steering angle constraint, and maximum take-off weight constraint:
(1)
Range Constraint
R o u t e m i n l e n ( R S E ) R o u t e m a x
This constraint represents the flight range of the UAV. The distance l e n ( R S E ) of the planned route R S E must neither be less than the UAV’s minimum flight range R o u t e m i n nor greater than its maximum flight range R o u t e m a x .
(2)
Steering Angle Constraint
0 δ j δ m a x
This constraint restricts the maximum turning angle of the UAV, indicating that during the route planning, the turning angle δ j of the UAV must not exceed the maximum turning angle δ m a x .
(3)
Maximum Take-off Weight
m u a v + m c a r g o < m m a x
This constraint represents the UAV’s maximum take-off weight. It indicates that the sum of m u a v and m c a r g o must be less than the UAV’s maximum take-off weight m m a x .
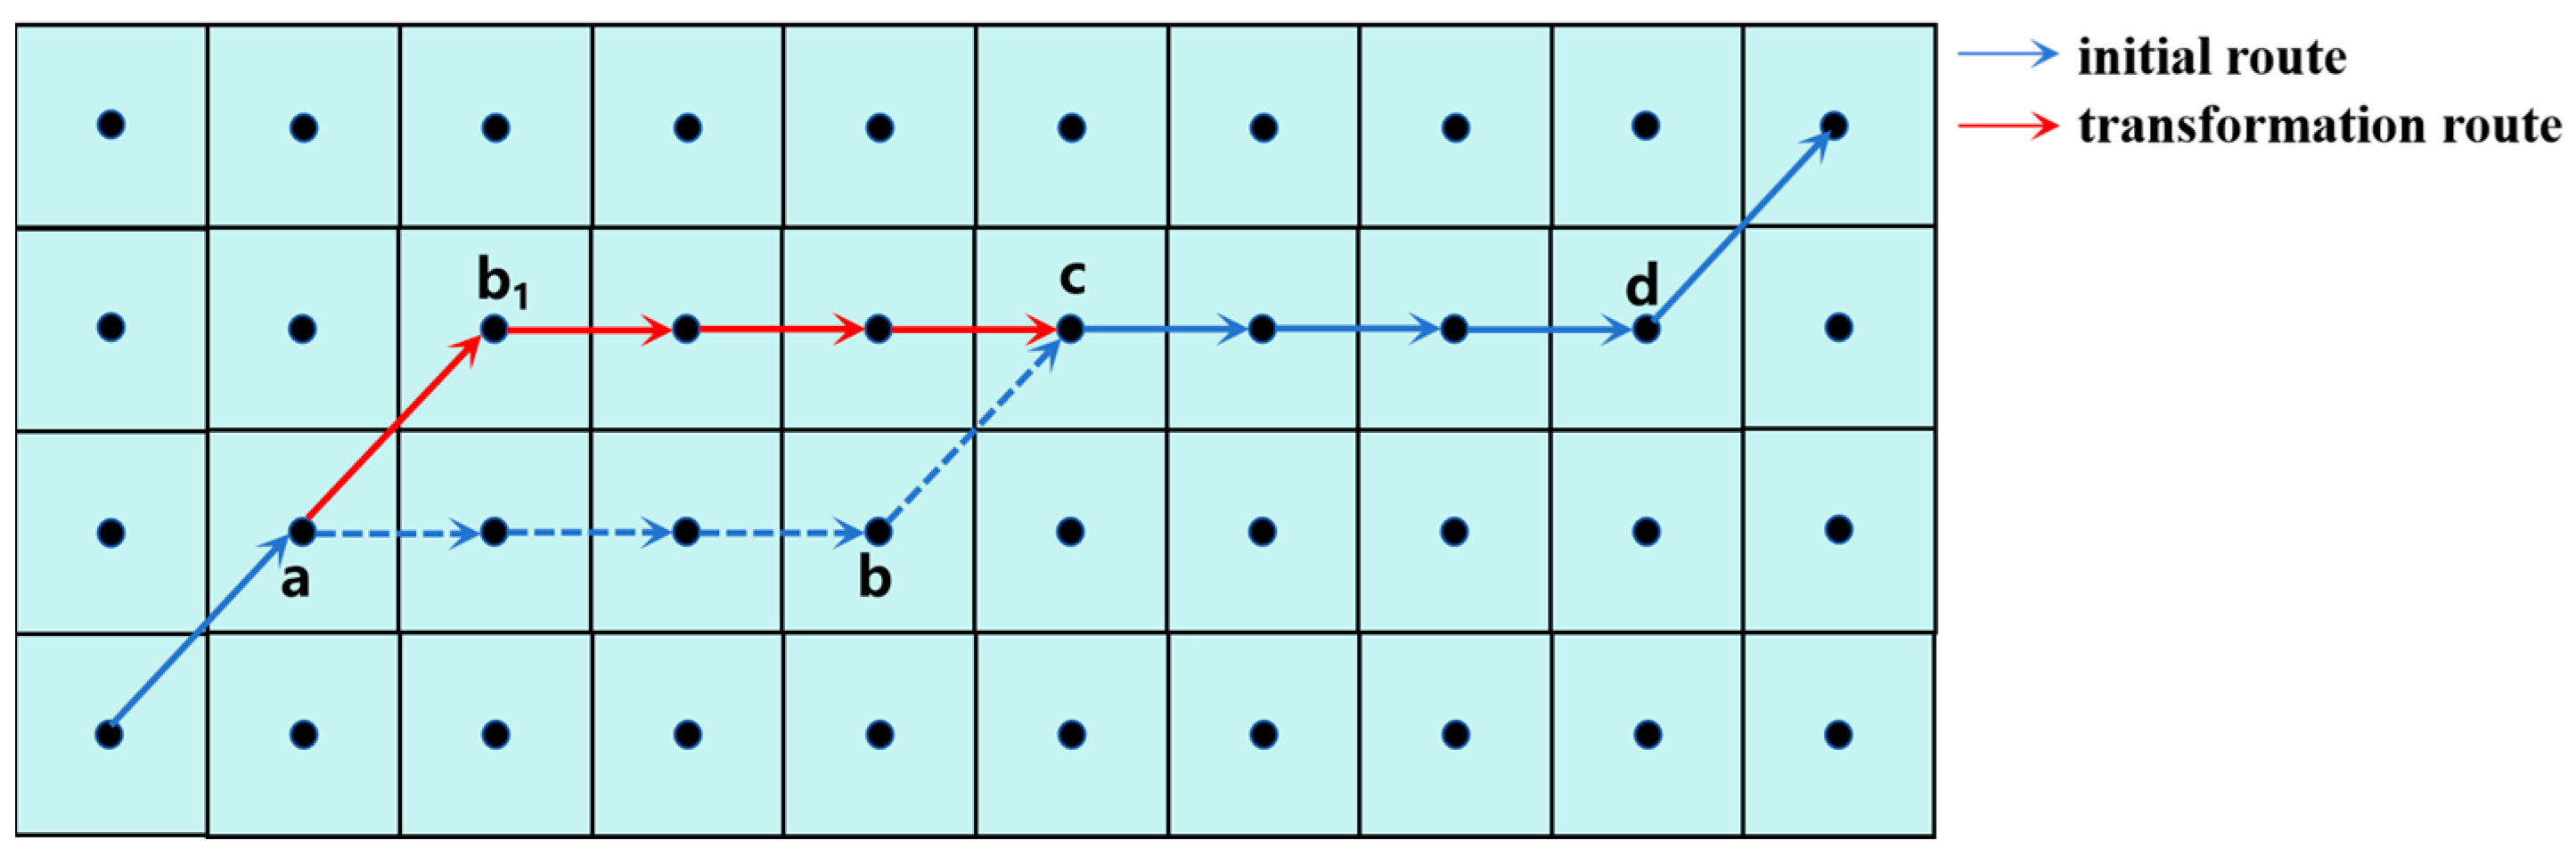
Following the modeling process, the Parallel-A* algorithm, as proposed in reference [23], is utilized for single-route planning. The fundamental concept of the Parallel-A* algorithm involves employing parallelogram translation to perform translational adjustments on route segments with lengths shorter than l e n m i n , as shown in Figure 11. During this translation process, environment risks are thoroughly assessed. Translation of candidate segments is permitted; when the environment risks associated with the translated segments a b 1 and b 1 c are less than or equal to those of the original segments a b and b c , segment translation is permitted. Thus, while ensuring low risks, we reduce the inflection points generated in the initial route planning stage (i.e., the turning points where abrupt direction changes occur between route segments). This method effectively facilitates the planning of a single route, thereby forming the initial PRN.

3.2.3. Orderly Route Re-Planning

Following the completion of the initial PRN planning, route overlap conflicts are likely to arise, necessitating the re-planning of overlapping routes within the PRN framework. This paper develops a re-planning model aimed at jointly optimizing the average risk cost and the average inflection point cost.
The average risk cost C a v e _ r i s k refers to the mean of the total risk costs associated with all routes within a specific airspace environment in the route network. It is expressed as follows:
m i n C a v e _ r i s k = k = 1 r o u t e _ n u m C r i s k _ c o s t k K            
where k represents the k -th successfully planned route in the same layer; C r i s k _ c o s t k represents the risk cost of the k -th planned single route; and r o u t e _ n u m is the total number of planned routes.
The average inflection point cost C a v e _ i n f l e c t i o n refers to the mean of the total number of inflection points across all routes within a specified airspace environment. Its expression is as follows:
m i n C a v e _ i n f l e c t i o n = k = 1 r o u t e _ n u m u = 1 n C t u r n u n
where C t u r n u is the inflection point cost [23] of grid u , which is composed of the turning angle δ u and the max turning angle δ m a x , and can be expressed as:
C t u r n u = δ u δ m a x
In summary, the PRN comprehensive cost C n e t w o r k can be expressed as follows:
m i n C n e t w o r k = C a v e _ r i s k + C a v e _ i n f l e c t i o n 2
where C a v e _ c o s t and C a v e _ i n f l e c t i o n represent the normalized average risk cost and the average cost of inflection points, as normalized using Formula (5).
v V e u v v V e v u = 0 , u s e t s t a r t s e t e n d
v V e u v v V e v u = 1 , u s e t s t a r t
v V e v u v V e u v = 1 , u s e t e n d
u , v E e u v 1 , u , v E
e u v { 0 ,   1 } , u , v E
where e u v = 1 indicates that the edge from grid point u to grid v is selected, and e u v = 0 indicates the edge is not selected; σ u v represents the cost of the edge from grid point u to grid v .
  • Constraint (25) ensures that for every intermediate grid point (excluding VTOL-Ps and AD-Grids), the out-degree is equal to the in-degree, thereby guaranteeing the continu-ity of the planned route.
  • Constraints (26) and (27) collectively ensure that each route in the PRN originates from an A-Grid and terminates at a VTOL-P.
  • Constraint (28) ensures that each grid is traversed by at most one route, thereby achieving conflict-free route segregation within the PRN.
  • Constraint (29) restricts each edge to two states: selected or not selected.
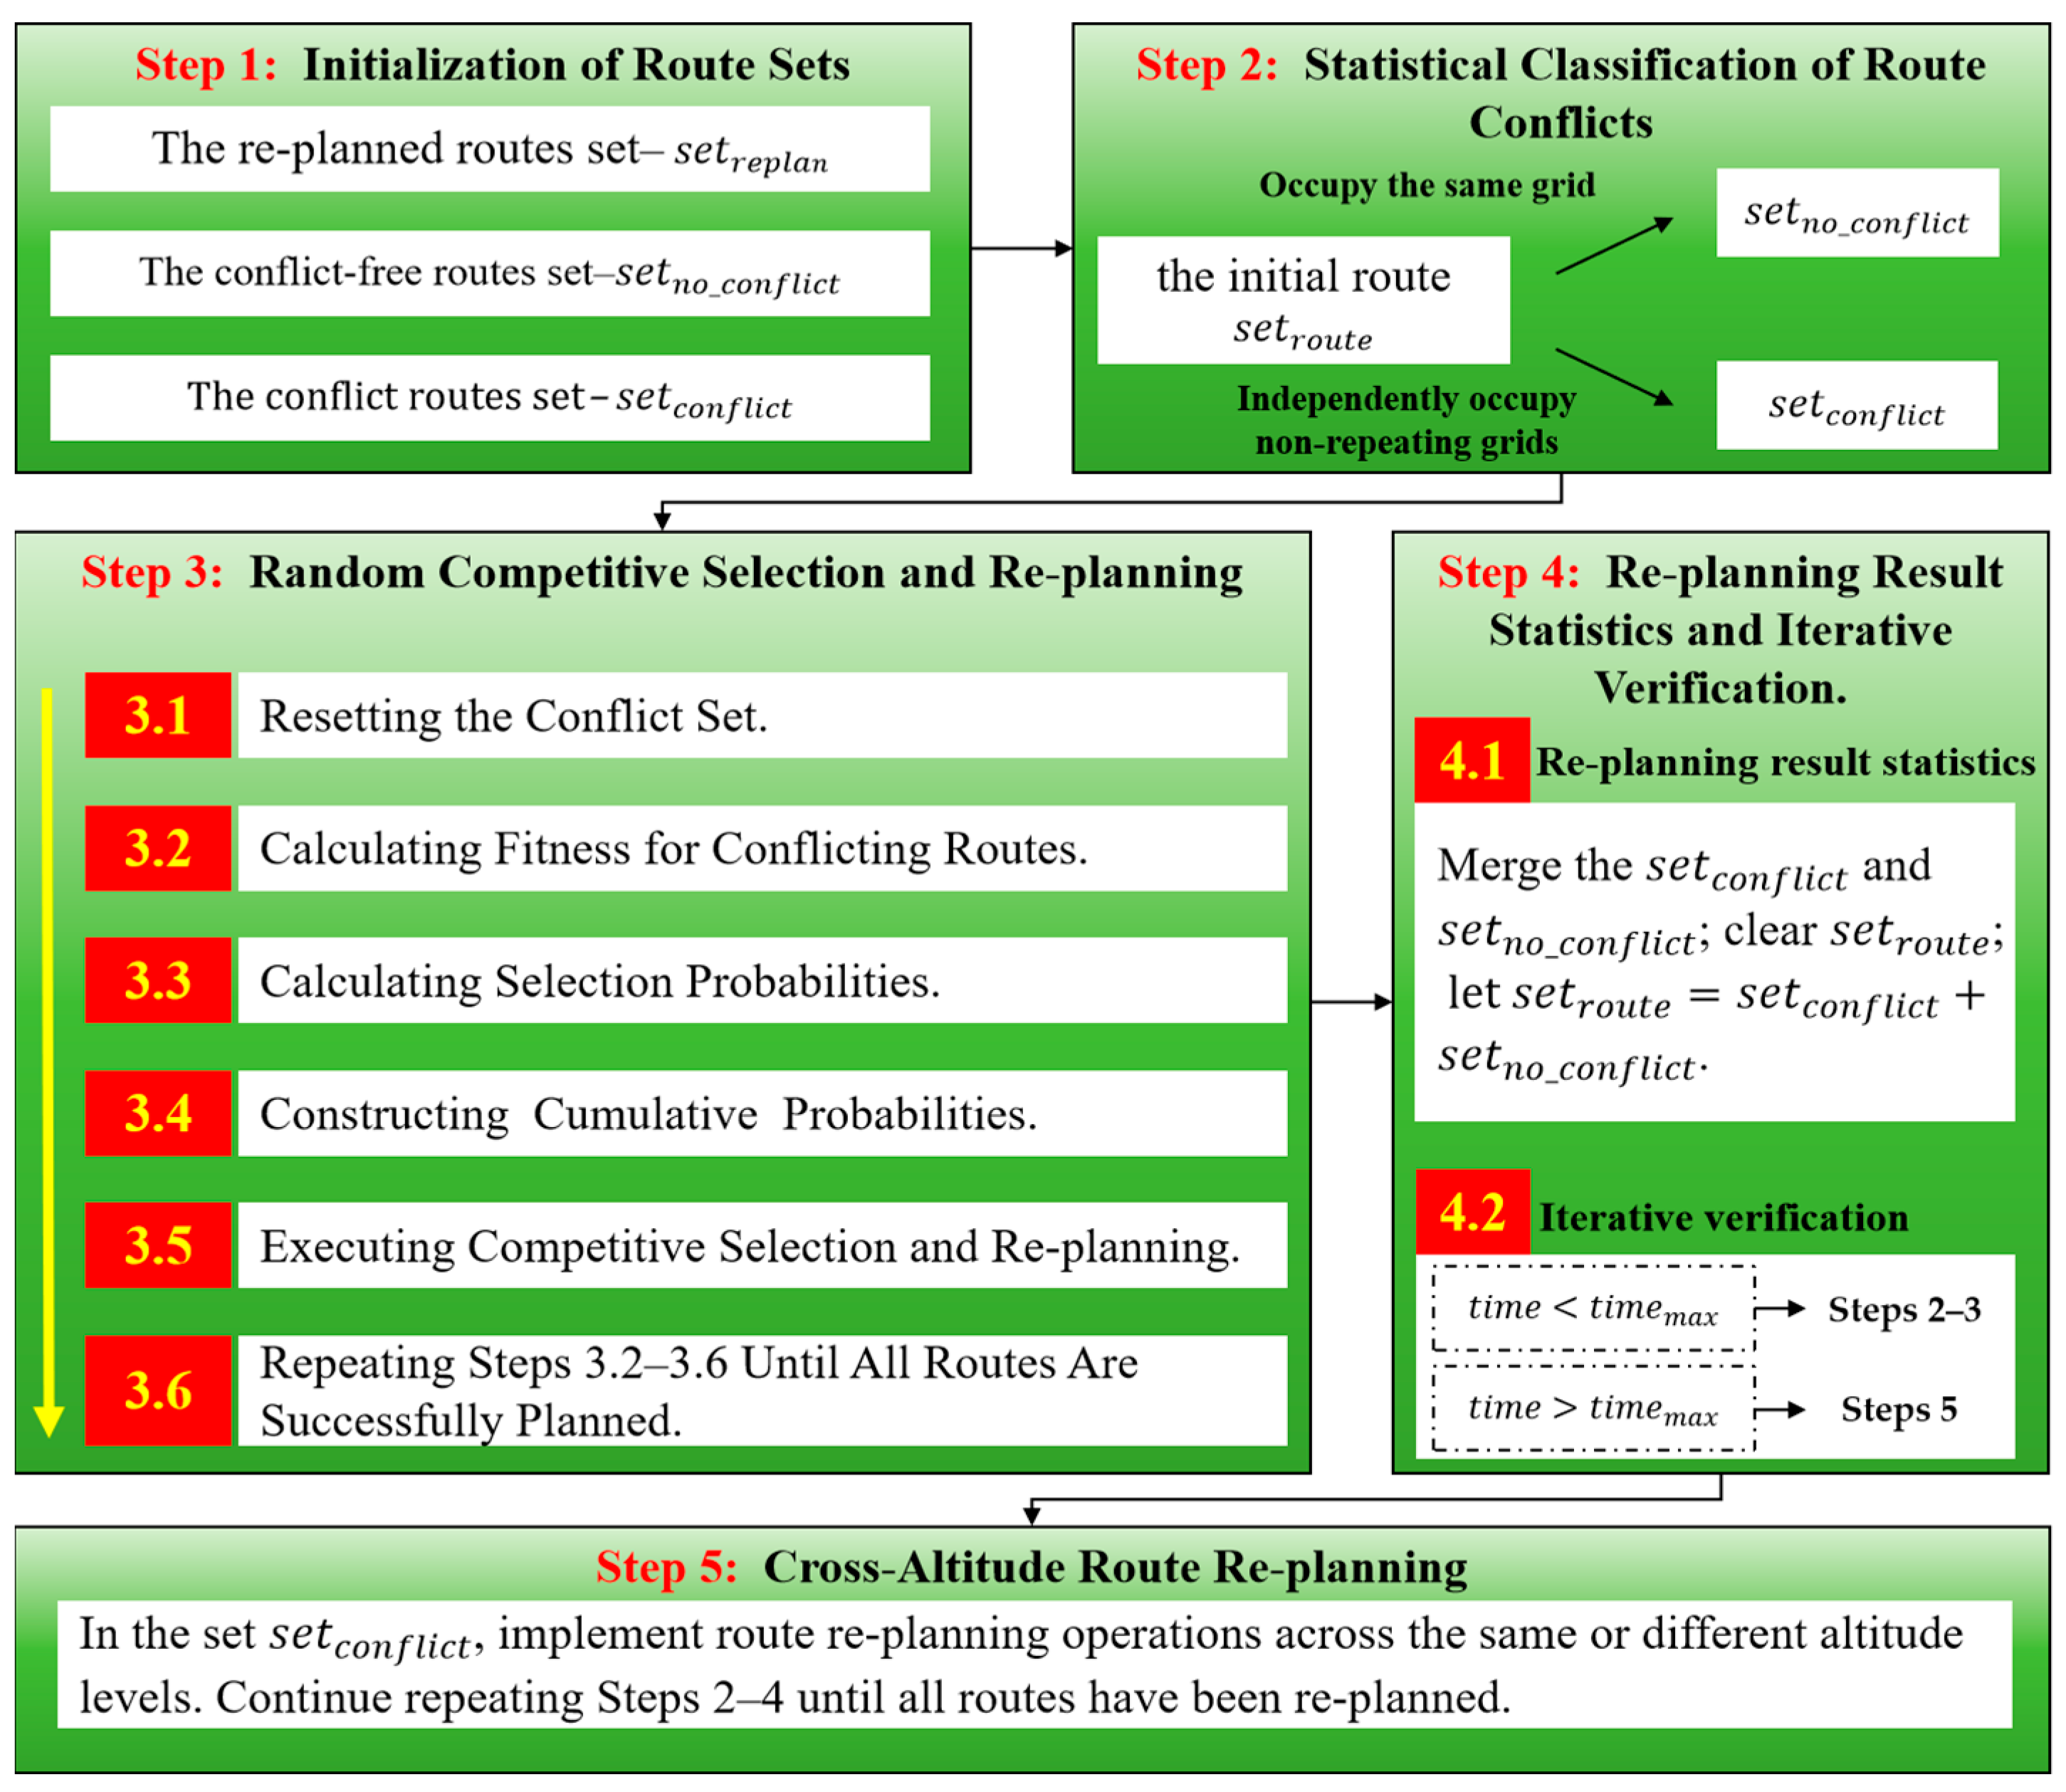
This paper introduces an innovative route re-planning method that considers competition probabilities, utilizing a random competitive selection approach to choose routes for re-planning. The primary steps are outlined below:
Step 1: Initialization of route sets: Establish initial empty sets s e t r e p l a n , s e t r e p l a n , and s e t c o n f l i c t , representing the re-planned routes set, the conflict-free routes set, and the conflict routes set, respectively. Designate all initialized routes as conflict routes, that is, s e t c o n f l i c t  =  s e t r o u t e .
Step 2: Statistical classification of route conflicts: Statistically analyze the initial route set s e t r o u t e , classify routes that simultaneously occupy the same grid into category s e t c o n f l i c t , and classify routes that independently occupy non-repeating grids into category s e t n o _ c o n f l i c t .
Step 3: Random competitive selection and re-planning.
Step 3.1: Resetting the conflict set: Count the current route conflict situation. Let s e t r e p l a n = s e t c o n f l i c t and empty s e t c o n f l i c t .
Step 3.2: Calculating fitness for conflicting routes: Calculate the environment risk airspace cost for each conflict route and establish each conflict route’s fitness using the expression:
f ( r o u t e i ) = 1 C s i n g l e _ r o u t e i
where s i n g l e _ r o u t e i represents the i -th conflict route.
Step 3.3: Calculating selection probabilities: Calculate the probability of selection for each conflict route:
p ( r o u t e i ) = f ( s i n g l e _ r o u t e i ) k = 1 m f ( s i n g l e _ r o u t e i )
where k represents the k -th conflict route, and m is the total number of conflict routes.
Step 3.4: Constructing cumulative probabilities: Calculate the cumulative probability for each route in the public network:
q i = j = 1 i p ( s i n g l e _ r o u t e i )
Step 3.5: Executing competitive selection and re-planning: Implement random competition selection. Each iteration involves selecting a pair of individuals using a roulette wheel mechanism, allowing these two individuals to compete against each other. The individual exhibiting higher fitness will be chosen, and the flight routes will be planned utilizing the ARO-IA* algorithm. If the planning is successful, the newly planned route will be added to the conflict-free route set s e t n o _ c o n f l i c t , while the previous planning result will be removed from the re-planned set s e t r e p l a n . Conversely, if the planning fails, the route will be temporarily stored in the failed route planning set s e t c o n f l i c t , while the original planning result is removed from s e t r e p l a n .
Step 3.6: Termination condition for iteration: Continue repeating Steps 3.2–3.5 until all routes in s e t r e p l a n are successfully planned.
Step 4: Re-planning result statistics and iterative verification.
Step 4.1: Re-planning result statistics: Merge the conflict route set s e t c o n f l i c t with the conflict-free route set s e t n o _ c o n f l i c t . In this process, first clear the original route set s e t r o u t e , then let s e t r o u t e = s e t c o n f l i c t + s e t n o _ c o n f l i c t .
Step 4.2: Iterative verification: If the same result occurs fewer times t i m e < t i m e m a x than the set threshold in s e t r o u t e , repeat Steps 2–3; if the condition t i m e t i m e m a x , proceed to Step 5.
Step 5: Cross-altitude route re-planning: For the routes within the set s e t c o n f l i c t , implement route re-planning operations across the same or different altitude levels. This process will be repeated through Steps 2–4 until all routes have been re-planned.
The flowchart for the orderly route re-planning is illustrated in Figure 12.

3.2.4. Technical Process of the PRN Orderly Planning

After two stages of initial PRN planning and orderly route re-planning, the hub-and-spoke PRN for urban low-altitude UAV logistics has been successfully established. For a comprehensive overview of the technical process involved in the PRN orderly planning, please refer to Figure 13.

4. Case Study Analysis

4.1. Parameter Settings

Considering data availability, safety, and controllability, this paper selected the Liuhe District of Nanjing City for our case studies—supported by real-world datasets including the district’s measured building height, population density, and shielding distribution data. Furthermore, this study integrates multi-dimensional data from this district, including building height, population density, and shielding distribution, to support the risk quantification configuration case study for airspace grids. Additionally, the urban low-altitude environment necessitates personnel safety assurance and airspace control constraints; thus, field experiments are susceptible to safety hazards and complicate the precise control of variables. To systematically analyze the impact of different parameters on the planning effect of the PRN, this paper conducts a series of case study analyses based on the digital airspace environment model of this area. These include environment risk analysis, AD-Grid configuration analysis, average risk cost and average inflection point cost analysis, comprehensive cost analysis, algorithm complexity analysis, and PRN scale planning analysis.
The airspace grid partitioning range is defined by longitude between 118.77° E and 118.87° E, and latitude between 32.29° N and 32.39° N. For route network planning, this paper establishes the A-Grids altitude layer at h q = 95   m . The logistics UAVs referenced in this study are primarily based on the ARK-40 configuration. Detailed specifications of the UAV, the airspace grid model, and the PRN planning parameters are specifically presented in Table 3. The grid coordinates for the VTOL-F are (113,132), while the coordinates for the VTOL-Ps are detailed in Table 4, which includes a total of 20 VTOL-Ps, and the n e x t r a = 5 . To facilitate representation, the grid coordinates in this paper correspond to the respective airspace grid indices of the VTOL-Ps, derived from the defined study airspace boundaries and the GeoSOT grid-level conversion of the latitude and longitude coordinates of the VTOL-Ps.

4.2. Environment Risk Analysis

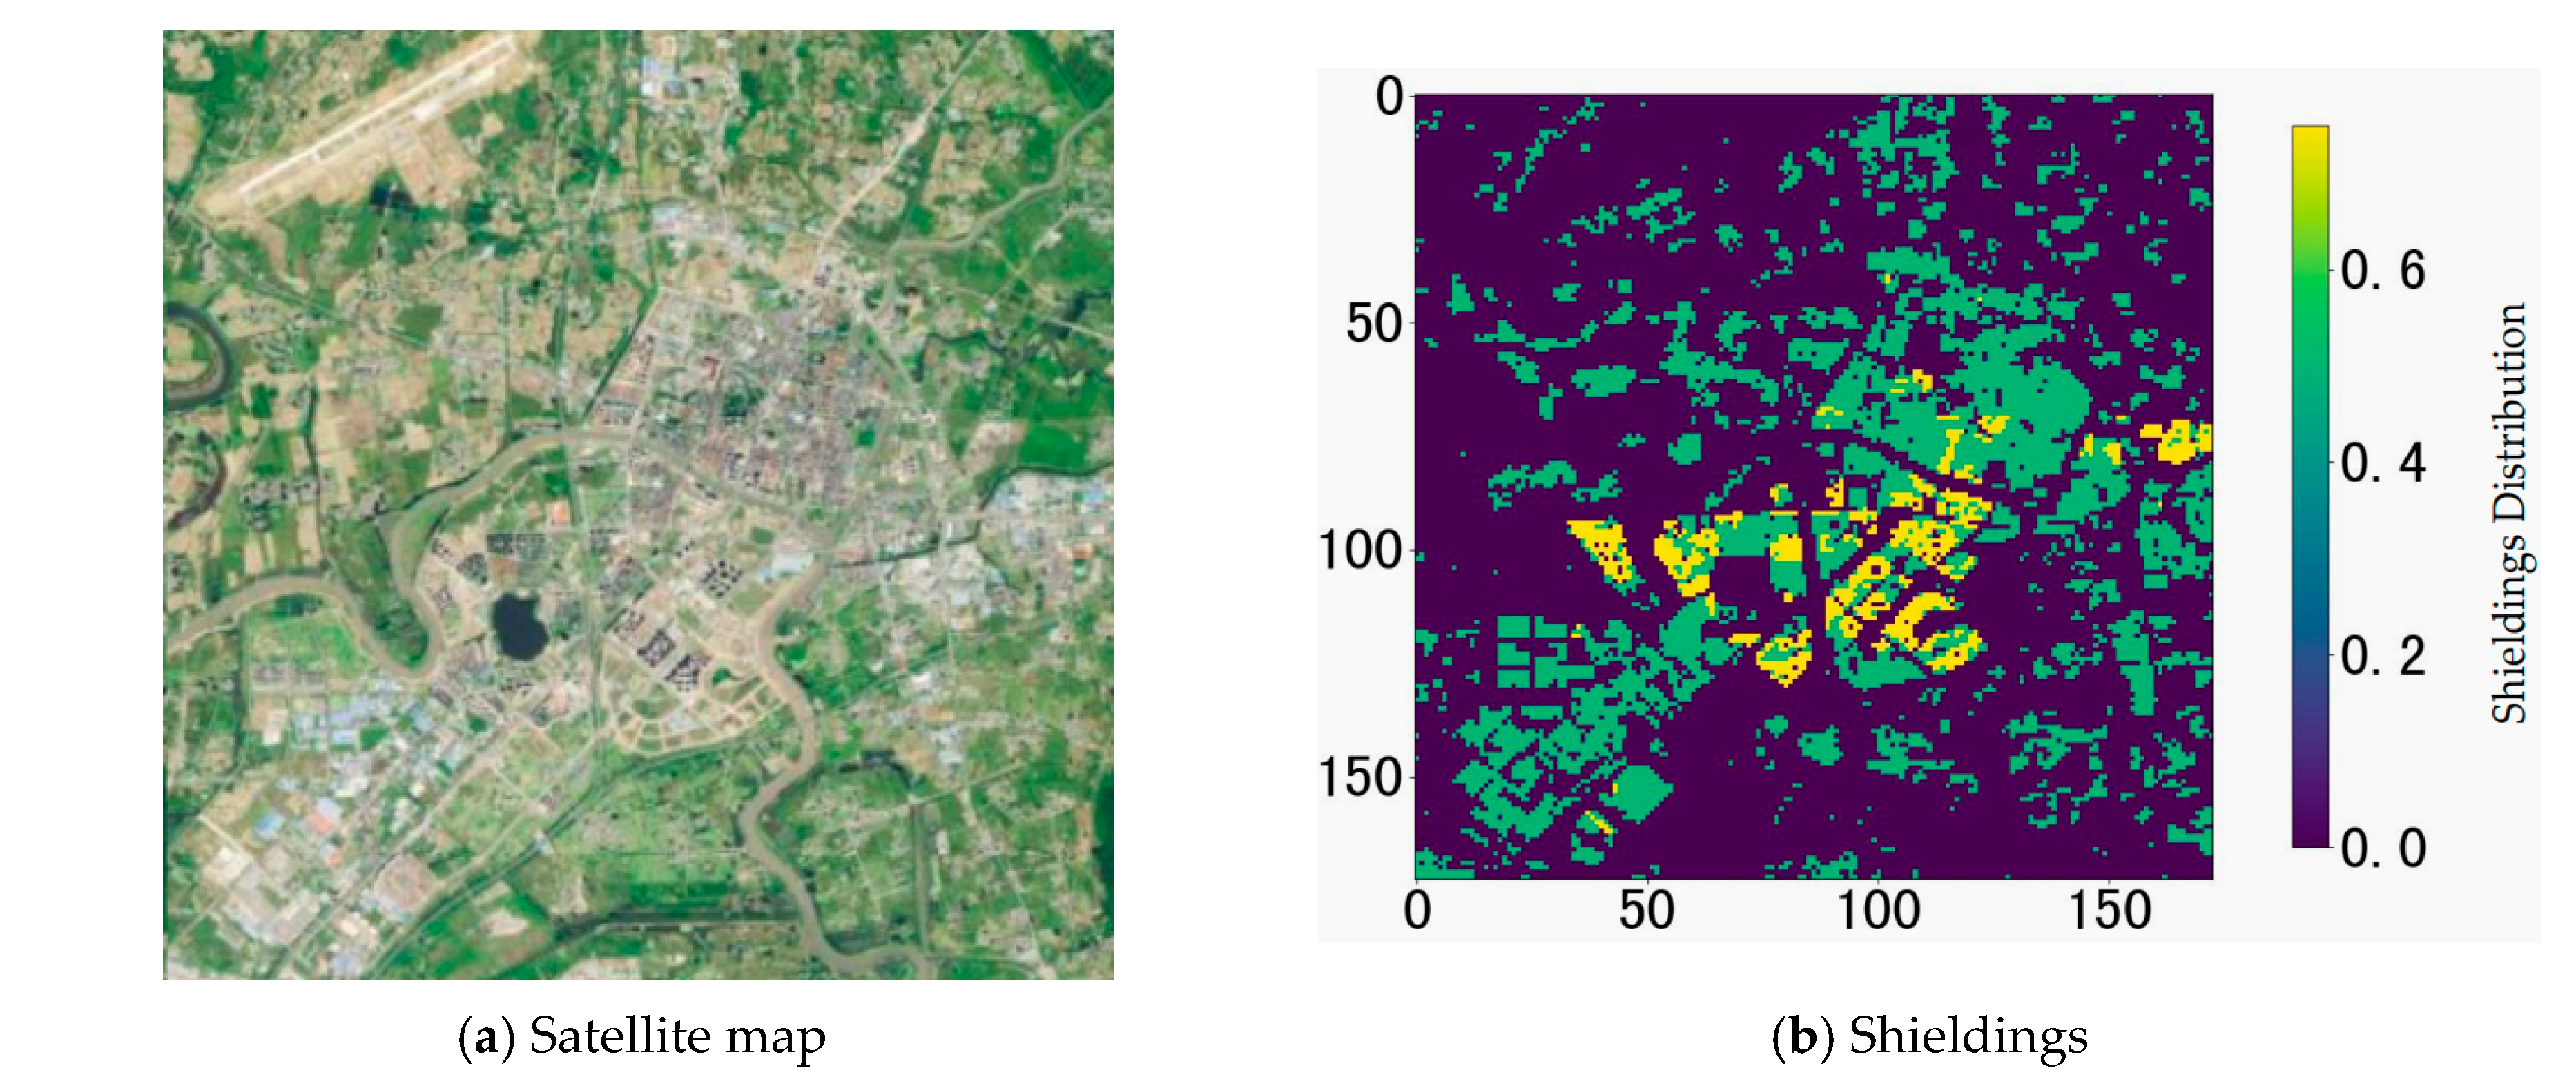
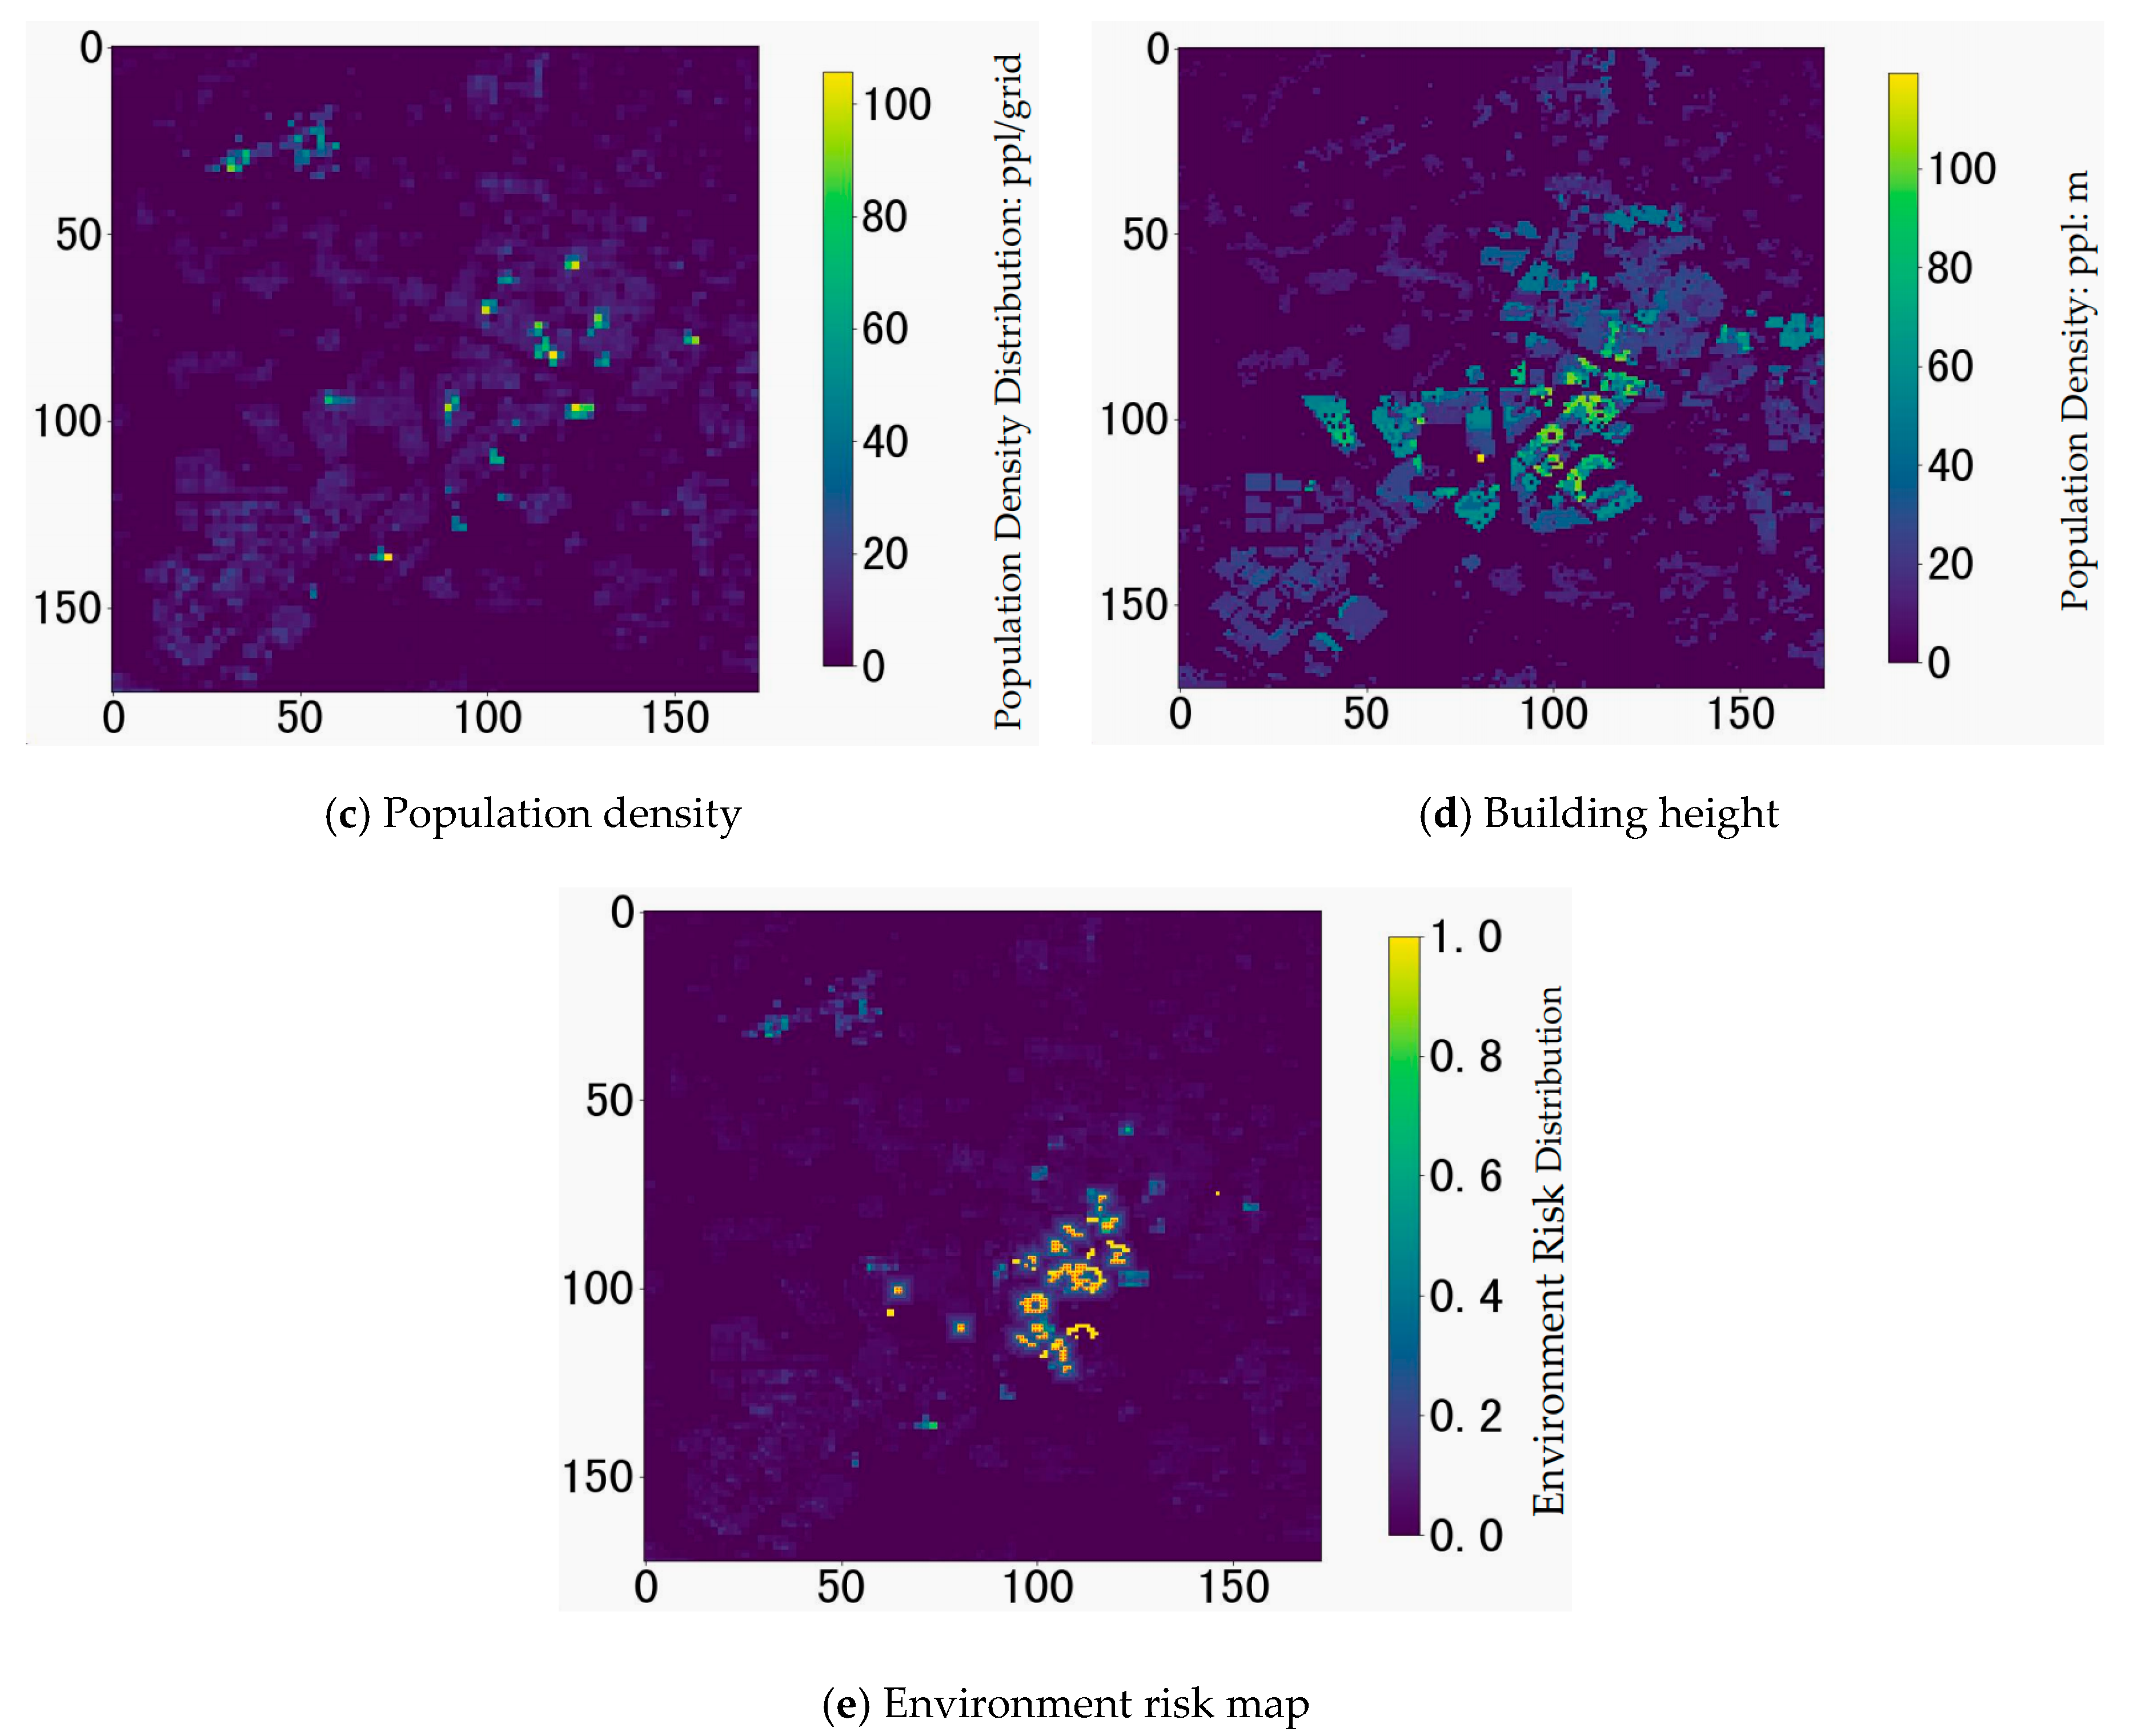
The environment risk parameter settings prioritize human life, assigning a higher weight to ground risk due to its direct impact on personal safety. Therefore, the weights are set as γ 1 = 0.25 , γ 2 = 0.5 , and γ 3 = 0.25 [23,34]. To facilitate understanding, this paper includes maps illustrating the digital airspace environment information and the distribution of environmental risk in the Liuhe District, as shown in Figure 14. Specifically, Figure 14a presents the satellite map of the Liuhe District, Figure 14b shows the shielding distribution map, Figure 14c illustrates the population density distribution map, Figure 14d depicts the building height distribution map, and Figure 14e depicts the environmental risk map.

4.3. Analysis of AD-Grid Configuration

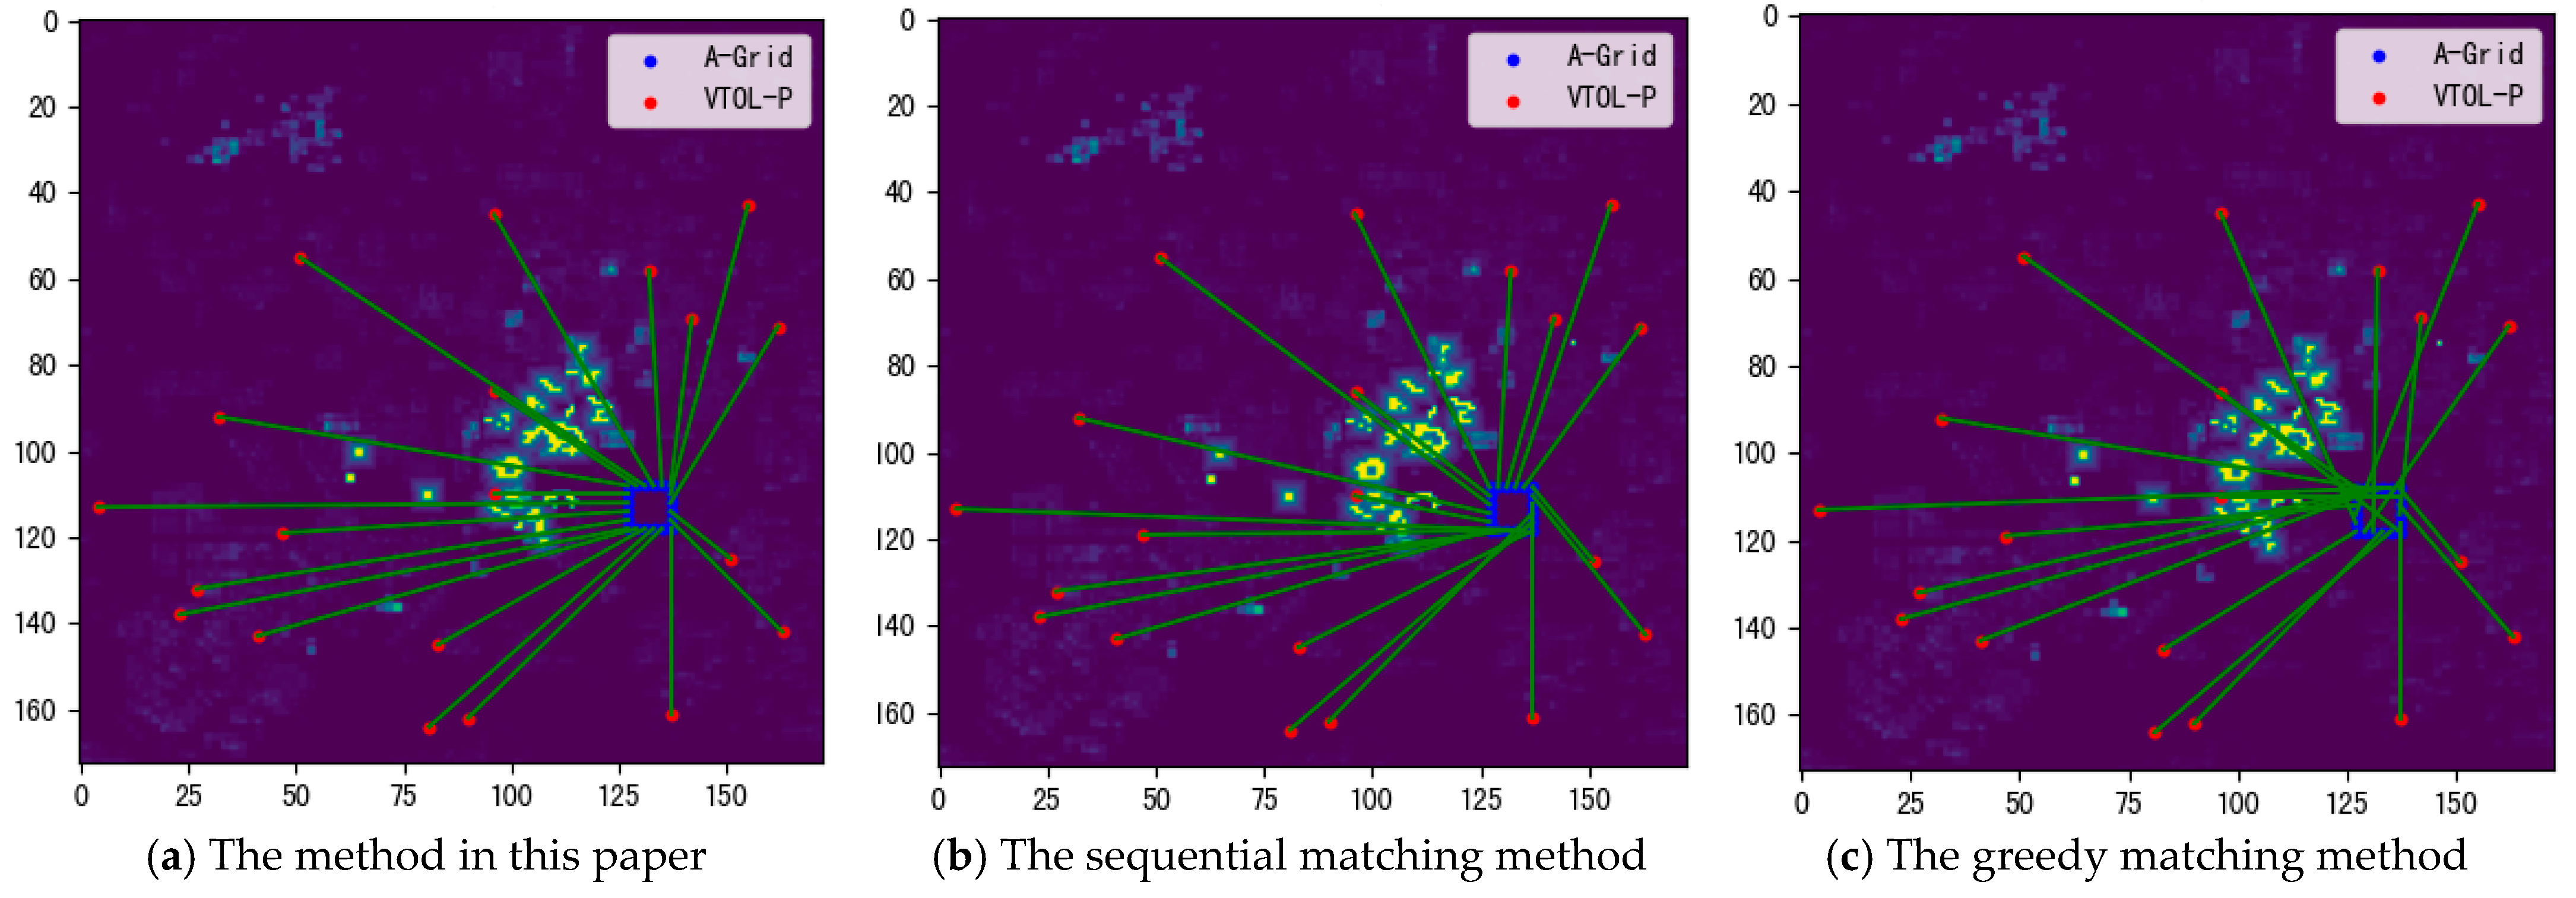
This paper investigates the precise matching strategies between AD-Grids and VTOL-Ps. In addition to the proposed precise AD-Grid matching strategy, comparisons are made with sequential matching and greedy matching methods. Furthermore, the connectivity performance of the PRN is evaluated both during initial planning and after completion.
The operational details of each method are elaborated as follows:
(1)
The sequential matching method begins at the upper-right corner of the A-Grid, calculating the orientation of VTOL-Ps relative to D-Grids. It prioritizes linking A-Grids to VTOL-Ps with congruent orientations, thereby completing the matching while maintaining a regular directional distribution.
(2)
The greedy matching method first computes the Euclidean distance between each VTOL-P and the A-Grid centroid, then sorts them in ascending order of distance. Subsequently, it sequentially assigns each VTOL-P to the nearest A-Grid. Figure 15 illustrates the schematic diagrams of the three AD-Grid configuration strategies described above.
This paper evaluates the connectivity rate of PRN route planning using three distinct methods, with results summarized in Table 5. Prior to optimization, both the proposed method and the sequential matching method achieved an initial connectivity rate of 30%, while the greedy matching method only attained a rate of 5%. Following optimization, the connectivity rate of the proposed method increased to 100%, in contrast to 70% for the sequential matching method and 20% for the greedy matching method. These findings further underscore that the precision of the initial AD-Grid to VTOL-P matching has a direct impact on subsequent PRN formation. Specifically, the sequential method relies solely on angular criteria for one-to-one matching, while the greedy method is based solely on Euclidean distance. In contrast, the proposed method synthesizes both metrics, confirming that the integration of distance and angle factors enhances the robustness of PRN construction.

4.4. Analysis of Average Risk Cost and Average Inflection Point Cost

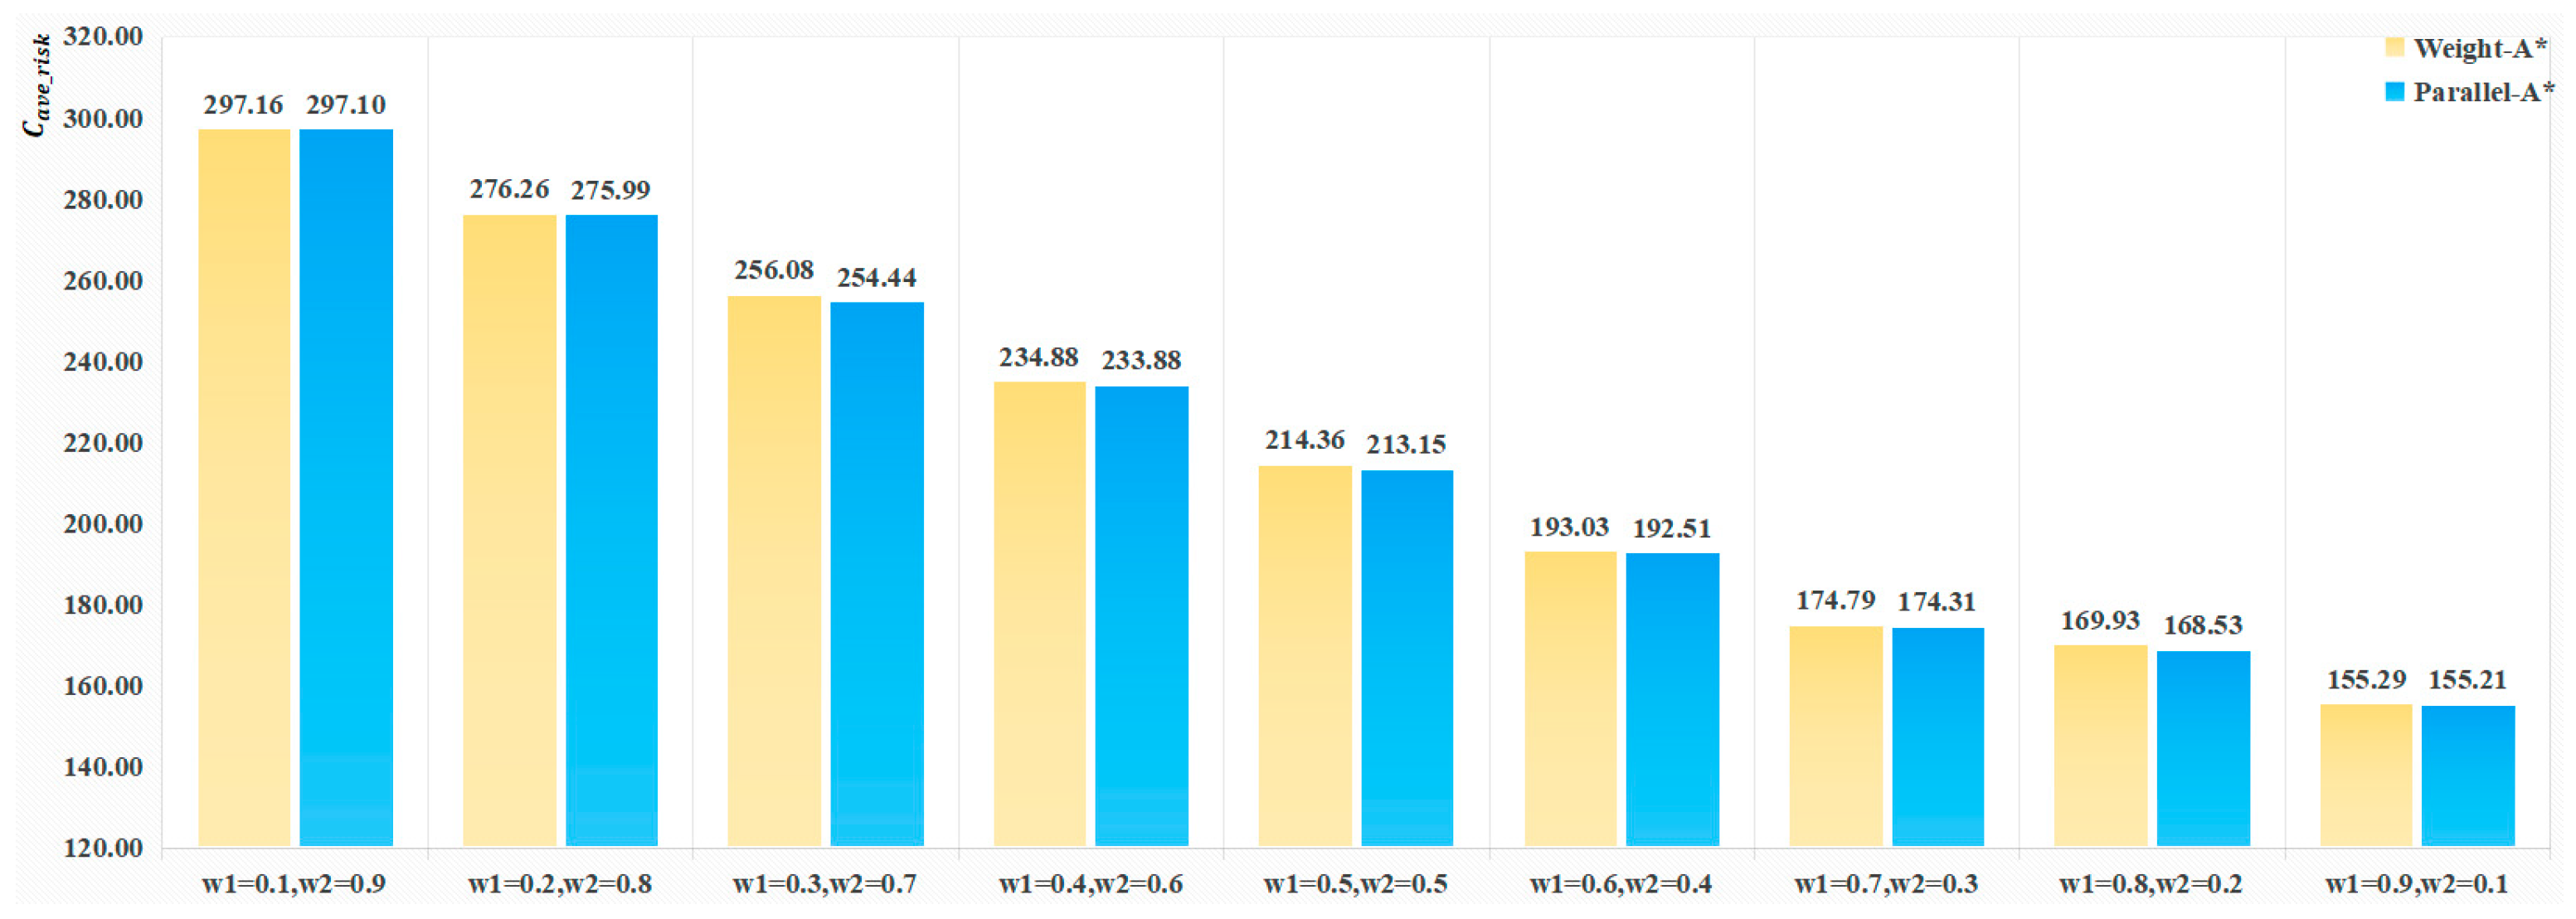
This section focuses on analyzing the trend of average risk cost under variations in the parameters. To ensure scientific rigor and comparability, the Weight-A* algorithm [45] has been selected as the benchmark. The Weight-A* algorithm exclusively incorporates risk factors during route planning while neglecting the impact of inflection points on PRN planning. As demonstrated in Figure 16, the average risk cost of the Parallel-A* algorithm is marginally lower than that of the Weight-A* algorithm, and in certain scenarios, it performs comparably. This can be attributed to the algorithm’s distinctive translational adjustment mechanism: segment translation occurs only when the candidate parallelogram meets a risk-equivalent or lower-risk condition. This approach not only effectively reduces route inflection points but also preserves strong low-risk performance during single-route planning.
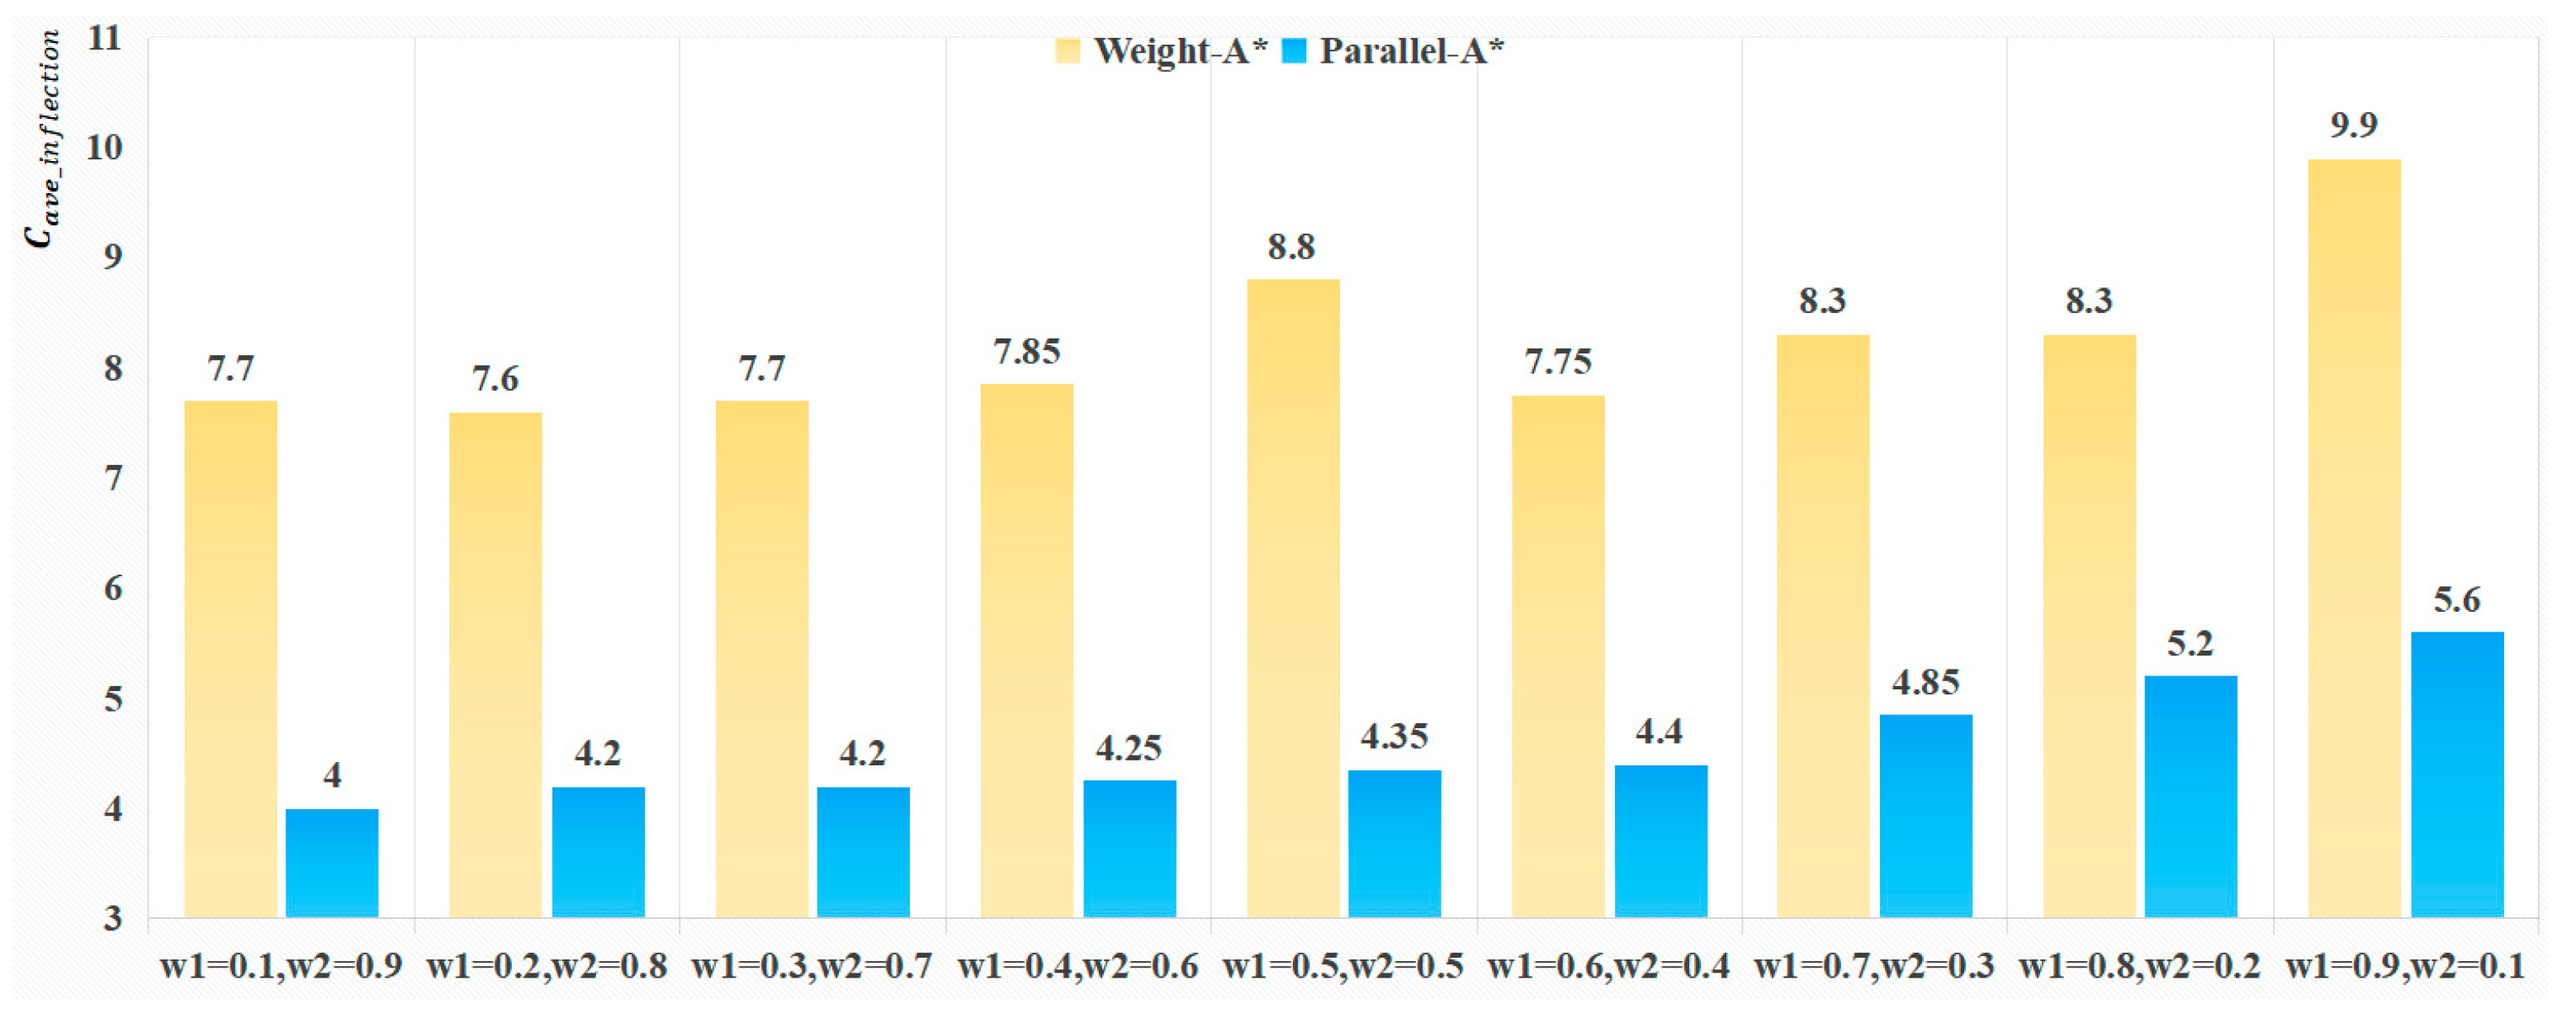
In the analysis of the average inflection point cost presented in Figure 17, Parallel-A* consistently exhibits superior performance, with its average inflection point cost remaining lower than Weight-A*. Collectively, these results demonstrate that the proposed algorithm can (1) effectively manage risk levels during orderly PRN planning; (2) significantly reduce the number of inflection points and enhance route efficiency; and (3) mitigate operational risks for UAVs. Thus, it provides a more robust solution for PRN planning in urban low-altitude logistics.

4.5. Analysis of Comprehensive Cost

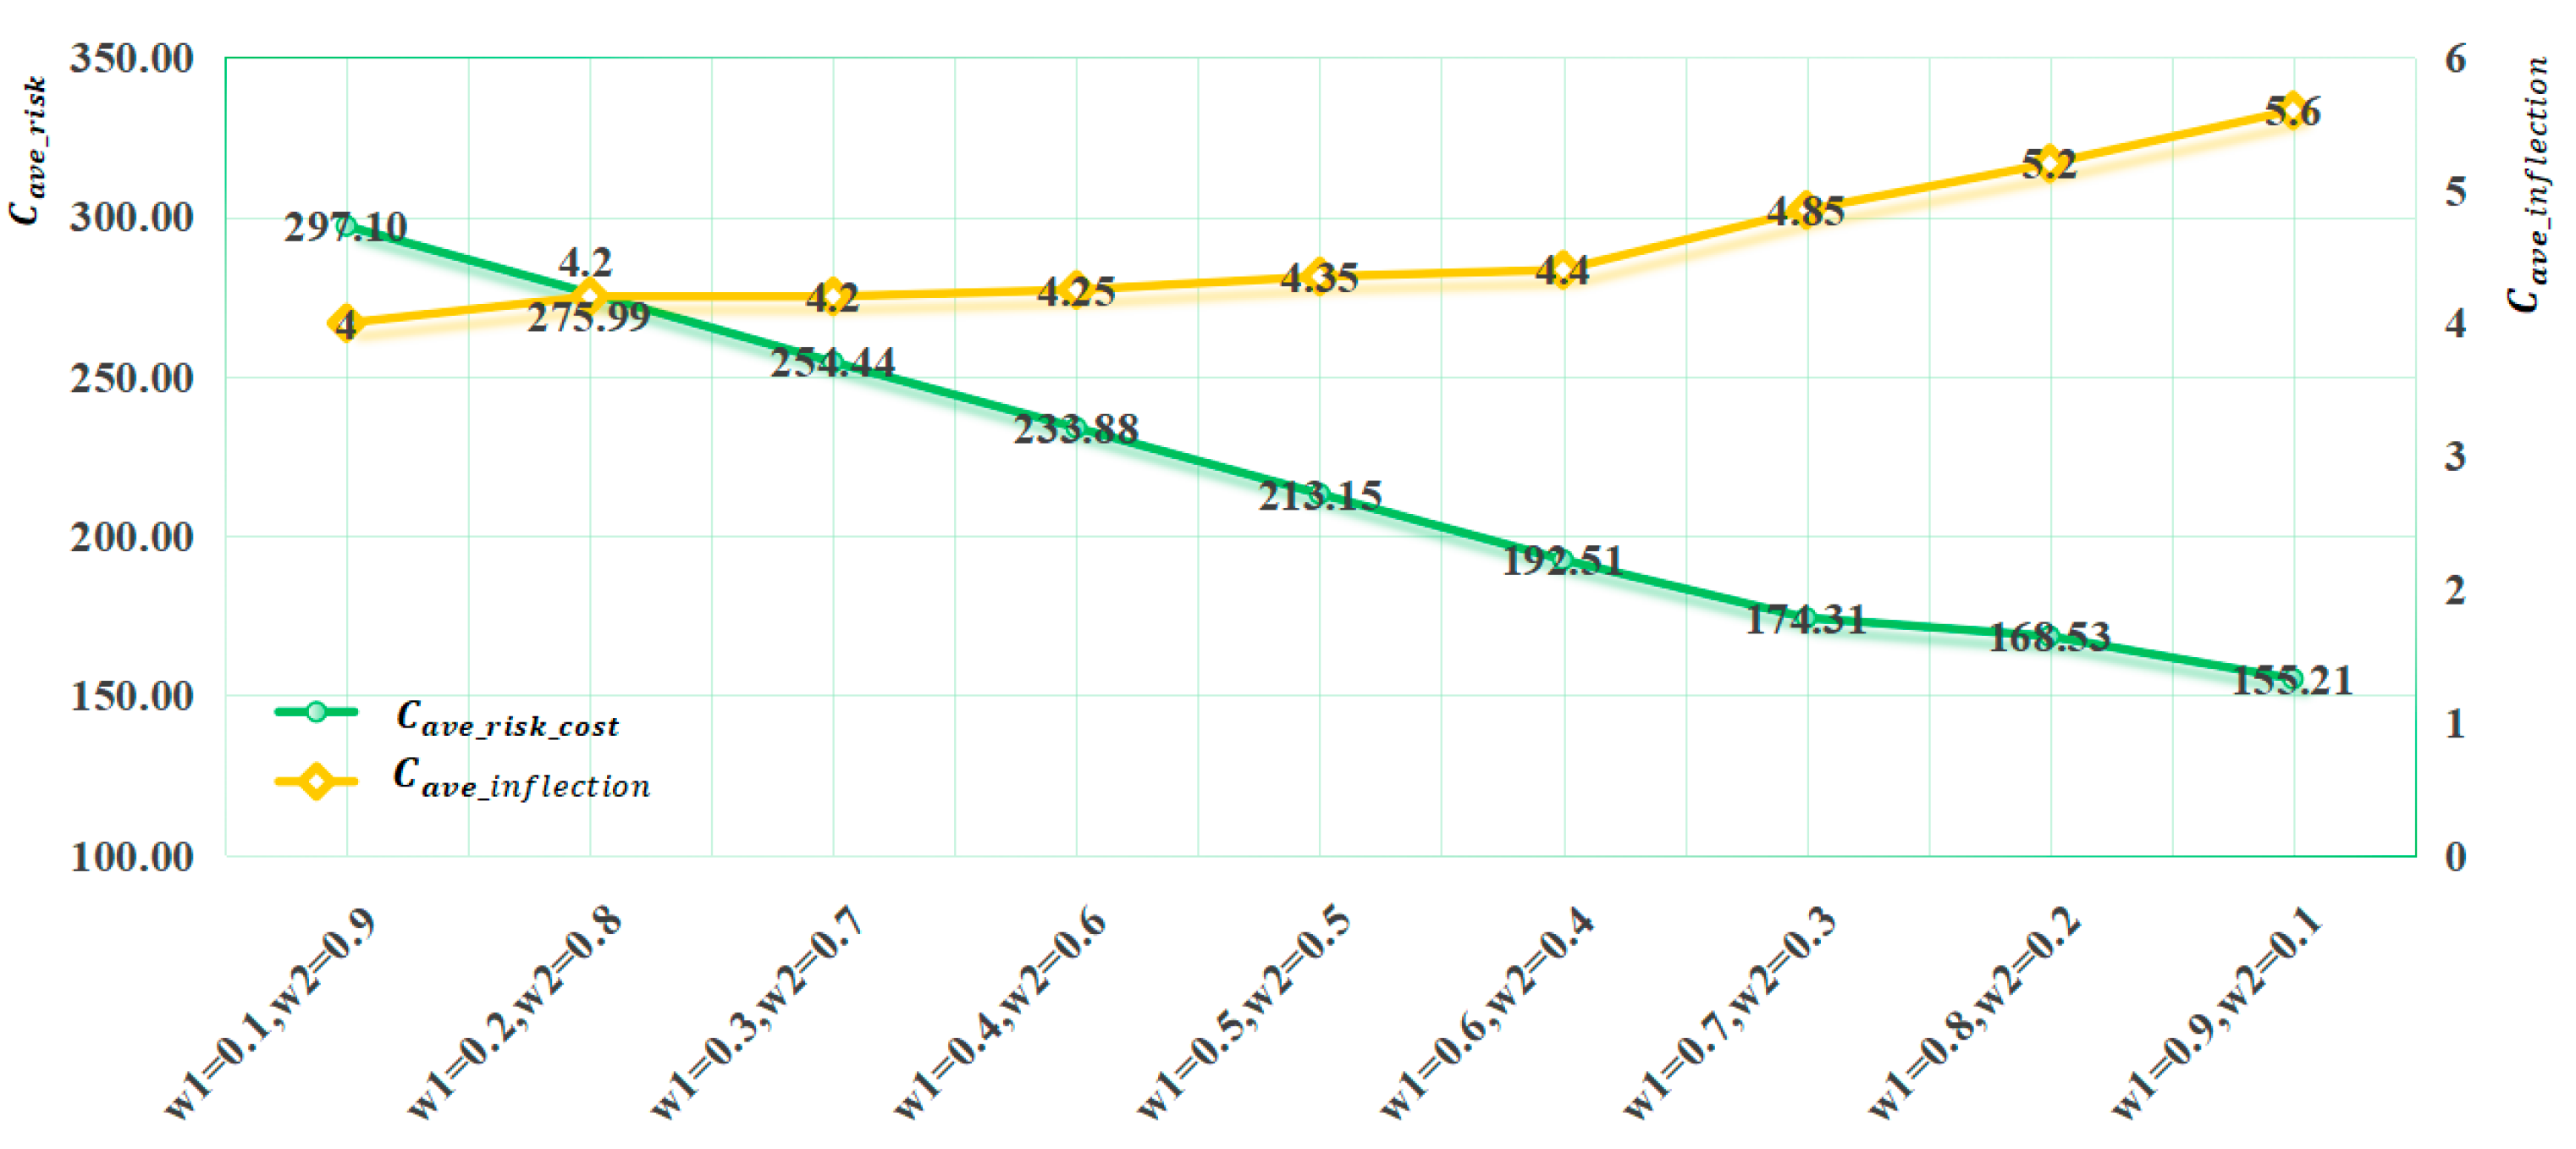
Figure 18 intuitively illustrates the variation patterns of the average risk cost C a v e _ r i s k and the average inflection point cost C a v e _ i n f l e c t i o n for the proposed PRN orderly planning method under various route planning parameter settings. It is evident that as the risk cost weight w 1 gradually increases, C a v e _ r i s k exhibits a continuous downward trend. This phenomenon indicates that elevating w 1 can effectively reduce risks incurred during route planning. Conversely, C a v e _ i n f l e c t i o n increases monotonically with the growth of w 1 , implying that a higher w 1 steers route planning toward low-risk environments, thereby increasing the count of inflection points. Such a trade-off relationship provides a crucial foundation for understanding the intrinsic connection between risk preferences and route morphology in PRN planning.
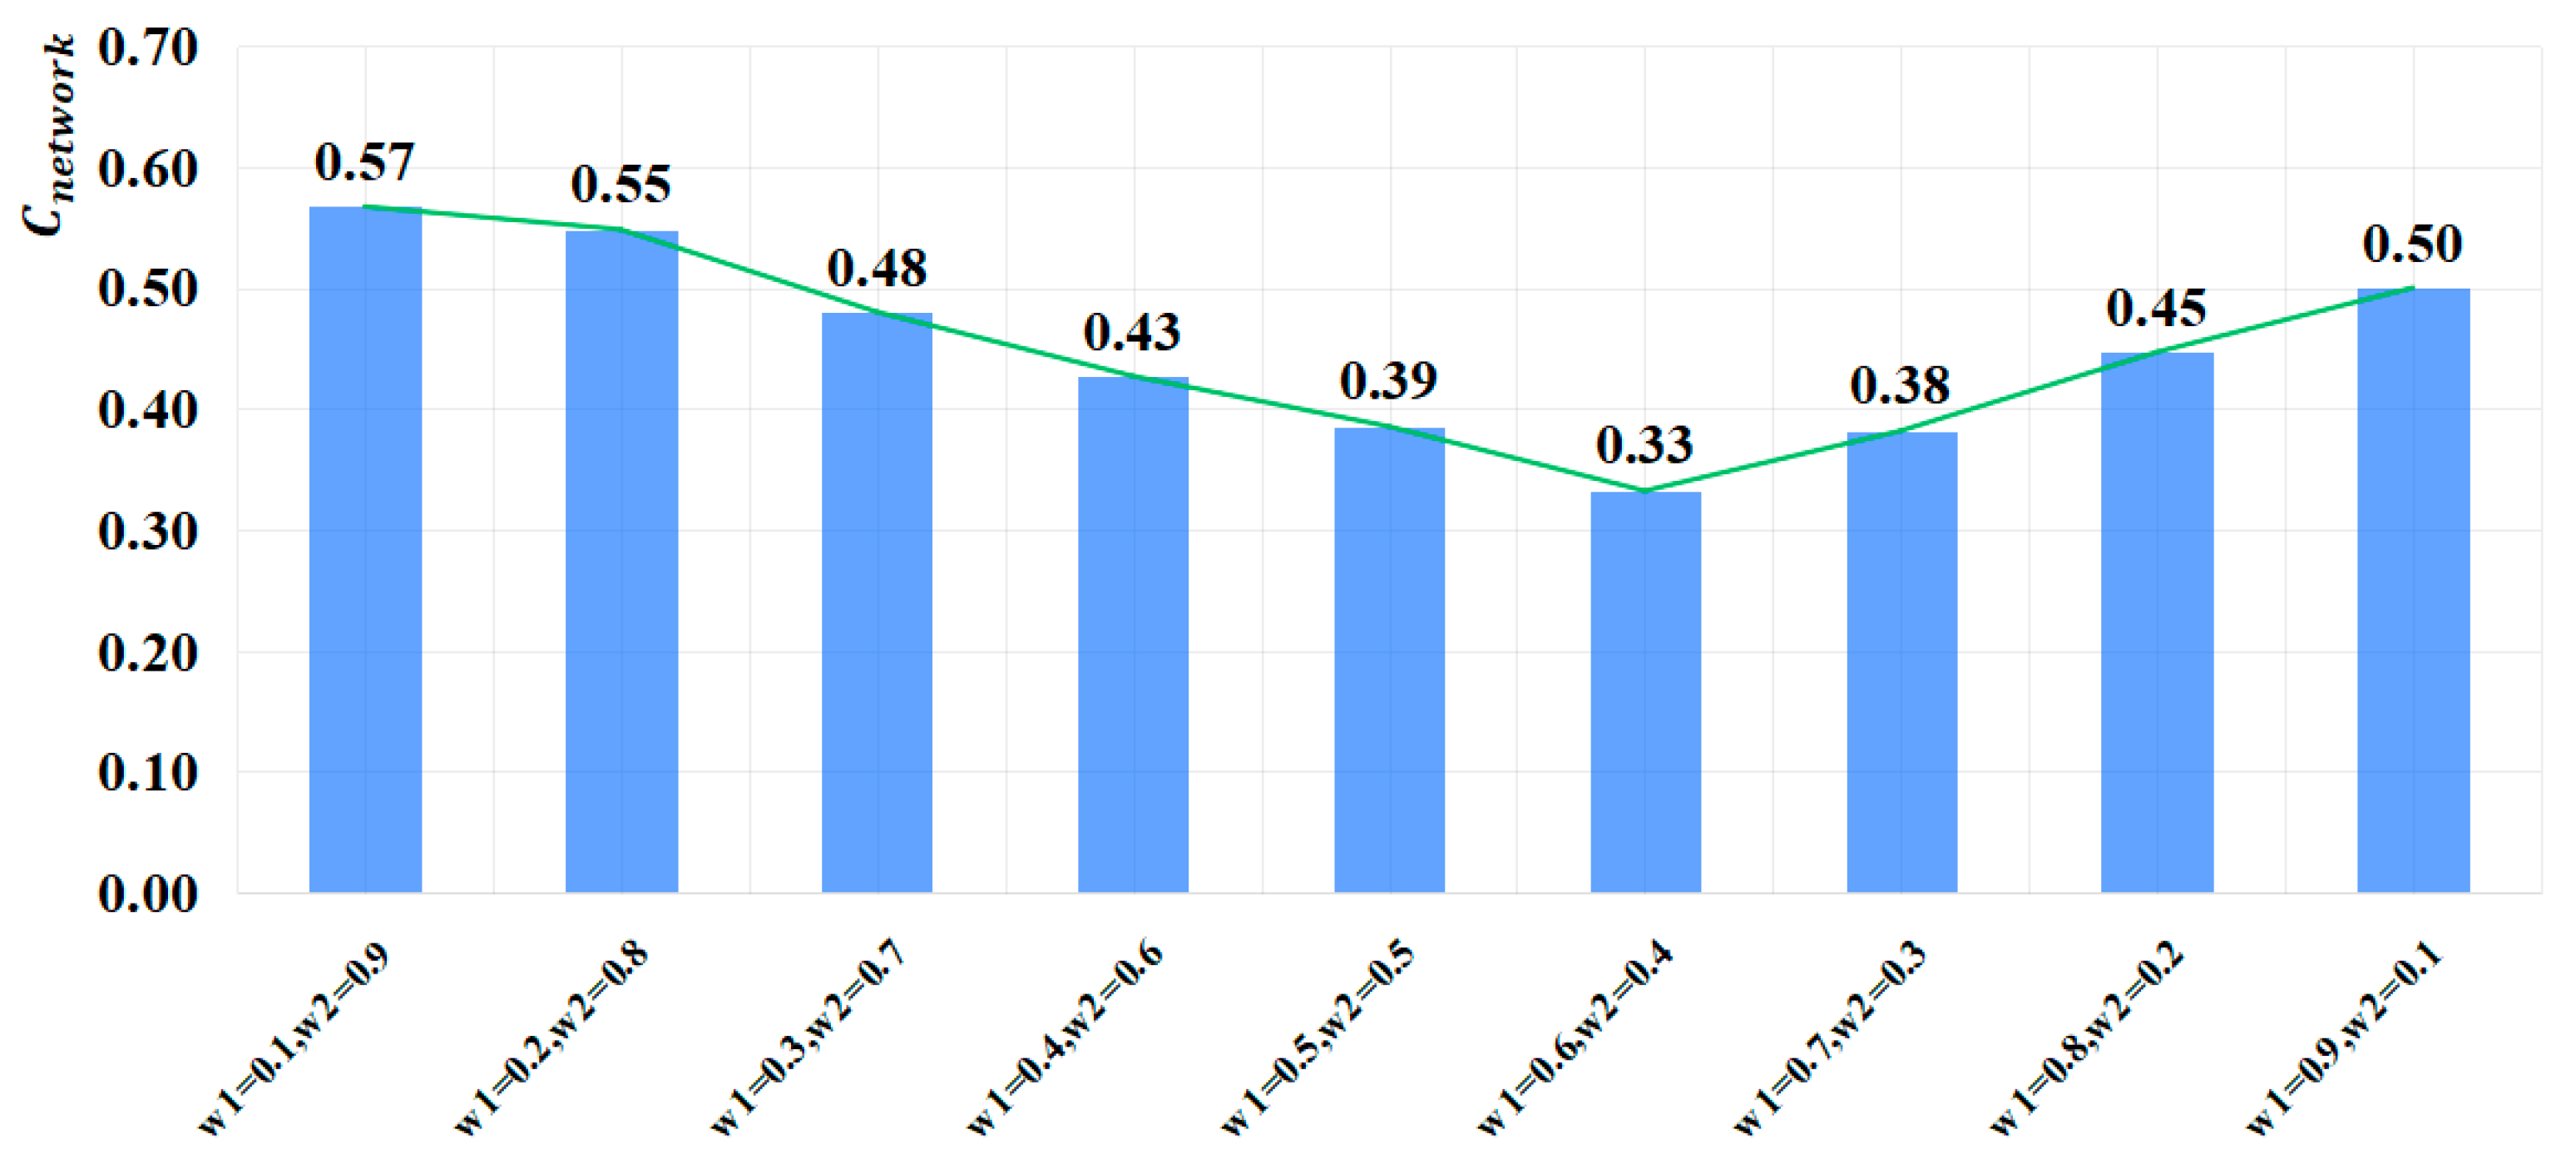
Figure 19 illustrates the variation trend of the C n e t w o r k under different parameter configurations. When w 1 falls within the range 0 w 1 0.6 , the C n e t w o r k continuously decreases; conversely, when w 1 is in the range 0.6 < w 1 1 , the C n e t w o r k gradually increases. This result clearly demonstrates that under the condition w 1 = 0.6 , w 2 = 0.4 , the C n e t w o r k obtained by using the proposed route planning method achieves its global minimum.

4.6. Comparative Analysis

This section further presents the case study analysis results of the Weight-A* and Parallel-A* algorithms following the completion of initial PRN planning and orderly route re-planning. In the case study results, the optimal parameters for the Weight-A* and Parallel-A* algorithms are set as w 1 = 0.6   a n d   w 2 = 0.4 , respectively. As illustrated in Figure 20, compared with the Weight-A* algorithm, the routes planned by the Parallel-A* algorithm exhibit significantly fewer inflection points, effectively enhancing the overall efficiency of the route network. The A* algorithm successfully plans only 85% of the routes. This limitation arises because it does not account for risk factors during planning and focuses solely on minimizing distance, which leads to routes being planned close to obstacles. Consequently, it struggles to plan routes in the areas with dense red no-fly zones in Figure 20c, ultimately failing to achieve comprehensive connectivity planning for the PRN.

4.7. Algorithm Complexity Analysis and PRN Scale Planning Analysis

The complexity of the core algorithm in this study is primarily manifested in three critical stages: AD-Grid matching, initial PRN planning, and orderly route re-planning. The complexity of AD-Grid matching is correlated with the number of VTOL-Ps, denoted as P , and the regional partitioning strategies. This process involves two phases: regional VTOL-P statistic, which has a complexity O ( P 2 ) , and regional angle calculation and grid matching, which has a complexity of O ( P × l o g P ) ). The total complexity of for this stage is O ( P 2 + P × l o g P ) . For initial route planning, the Parallel-A* algorithm is employed to plan M routes, with each single-route planning requiring the search of N grid units, resulting in a complexity of O ( M × N l o g N ) . In the stage of orderly route re-planning, conflict detection involving M routes incurs a complexity of O ( M 2 ) . The random competitive selection process—including fitness calculation, probability distribution, and roulette selection—exhibits a complexity of O ( M ) per step. Given K iterations to resolve conflicts, the total complexity for re-planning becomes O ( K × M 2 ) . Collectively, the overall complexity of the algorithm is determined by the grid scale N , the quantity of VTOL-Ps P , the route count M , and the number of iterations K, expressed as O ( P 2 + P × l o g P + M × N l o g N + K × M 2 ) .
Focusing on urban terminal low-altitude logistics networks, which are constrained by airspace limitations and the service capacity of VTOL-Fs, this case study analysis phase targets small-scale VTOL clusters. The Parallel-A* algorithm features an orderly public route planning architecture that inherently supports scalability to large-scale complex scenarios. To systematically analyze the effects of scale on route network planning, a multi-scale gradient case study analysis is performed that examines the evolution from terminal to regional scenarios, with randomly generated VTOL-Ps forming route scale gradients M M = 50 ; 100 ; 150 ;   . . . ; 950 ; 1000 . Two grid systems address scenario differences: the terminal scenario uses the prototype’s 64 m × 64 m fine grids to ensure precision, while the regional scenario spans 118.70° E–119.00° E and 31.85° N–32.05° N, using 128 m × 128 m grids. Each scale undergoes 20 repeated simulations, and the results are averaged to minimize random errors. This process aims to explore the scale-dependent relationship between computational time and route scale, as illustrated in Figure 21. The study analysis demonstrates that due to a larger number of partitions and a broader planning scope in the regional scenario, the computational time across all route scales is significantly higher than that in the terminal scenario. Furthermore, the computational time for both scenarios exhibits an approximately linear growth trend with the increase in route scale. This further validates the adaptability of the proposed orderly route planning method in scenarios with varying scale ranges and transportation scales, while also providing a relevant foundation for subsequent large-scale and high-complexity urban PRN planning.

5. Conclusions

This study aims at addressing the orderliness and safety issues associated with the operation of urban low-altitude terminal logistics UAVs by proposing an orderly planning method for PRNs based on a parallel system. Initially, this method integrates the core elements of physical and social systems, performing parallel discrete mapping of these elements to the corresponding artificial system. Subsequently, it achieves 3D discrete gridding of low-altitude airspace through horizontal and vertical partitioning, simultaneously formulating airspace access rules, refining the configuration of airspace environment risks, and establishing a digital airspace environment model. In the design of the PRN planning scheme, three key functions are realized: precise and unique matching between VTOL-P and AD-Grids, initial route planning based on the Parallel-A* algorithm, and orderly re-planning of conflicting routes through a random competitive selection mechanism. Using the Liuhe District of Nanjing as an empirical case, this paper conducts terminal layered PRN planning to meet the delivery demand from VTOL-F to VTOL-P. Comparative study analyses are further carried out with the Weight-A* and A* algorithms to validate the proposed methods concerning grid precision configuration effects, average risk costs, average inflection point costs, comprehensive costs, algorithm complexity, and scale adaptability. The results indicate that, in non-adverse meteorological environments, the layered PRN planned using the proposed method achieves a high success rate. While maintaining low environment risks, this method significantly reduces redundant inflection points and effectively enhances route quality and operational efficiency. When the risk weight and cost weight are set to 0.6 and 0.4, respectively, the comprehensive cost of the route network in the Liuhe District reaches its minimum, providing a quantitative basis for practical PRN planning. Furthermore, this algorithm outperforms the two comparative algorithms in terms of both route planning success rate and inflection point control, thereby fully demonstrating its technical advantages. Additionally, this paper presents an analysis of algorithm complexity as well as PRN gradient scale planning analysis, further validating the algorithm’s adaptability in route planning across various scales. In conclusion, targeting the requirements of regular logistics delivery tasks for vertical take-off and landing aircraft, the method proposed in this paper meets the PRN planning needs for urban low-altitude terminal logistics in terms of both efficiency and safety.
This study proposes a method for planning the public route networks of urban low-altitude terminal logistics. While the effectiveness of the methodological framework has been validated through empirical research, issues persist such as insufficient coverage of dynamic environmental factors and inadequate adaptability to multi-agent scenarios. However, the adaptability of the findings from this study to the ‘segregation before integration’ phase of UAM is evident not only in achieving the current objective of ‘safe segregation’ but also in establishing a technical foundation for the subsequent ‘integration’ phase. Future research will focus on further collecting and integrating key information, including urban dynamic meteorological data, 4G/5G communication signal data, and urban historical no-fly-zone records. The emphasis will be on optimizing risk quantification models and dynamic planning methods for route networks in multi-agent and large-scale real-world scenarios supported by dynamic environmental information.

Author Contributions

Methodology, Writing—original draft, Project administration, O.F.; Conceptualization, H.Z.; Software, W.T.; Visualization, F.W. and G.Z. All authors have read and agreed to the published version of the manuscript.

Funding

This research was funded by the National Social Science Fund of China (Major Program) [Grant Number: 22&ZD169]; National Natural Science Foundation of China [Grant Number: U2333214]; China Postdoctoral Science Foundation [Grant Number: 2023M741687]; Jiangsu Province Youth Science and Technology Talent Support Program [Grant Number: JSTJ-2024-309]; and Jiangsu Provincial Transportation Science and Technology Project [Grant Number: 2024G06].

Data Availability Statement

The original contributions presented in this study are included in the article; further inquiries can be directed to the corresponding author.

Conflicts of Interest

The authors declare that there are no known competing financial interests or personal relationships that could have appeared to influence the work reported in this paper.

Abbreviations

The following abbreviations are used in this manuscript:
UAVUnmanned Aerial Vehicle
PRNPublic Route Network
CPSSCyber–Physical–Social System
CPSCyber–Physical System
GSOGlowworm Swarm Optimization
3DThree-Dimensional
UAMUrban Air Mobility
AD-GridApproach–Departure Grid
VTOL-SVertical Take-Off and Landing Site
VTOL-CVertical Take-Off and Landing Center
VTOL-FVertical Take-Off and Landing Field
VTOL-PVertical Take-Off and Landing Point
A-GridArrival Grid
D-GridDeparture Grid

References

  1. Deng, M.; Yang, Q.; Peng, Y. A real-time path planning method for urban low-altitude logistics UAVs. Sensors 2023, 23, 7472. [Google Scholar] [CrossRef] [PubMed]
  2. Han, C.; Jeon, H.; Oh, J.; Lee, H. Dynamic Order Picking Method for Multi-UAV System in Intelligent Warehouse. Remote Sens. 2022, 14, 6106. [Google Scholar] [CrossRef]
  3. Liu, H.; Tsang, Y.P.; Lee, C. A cyber-physical social system for autonomous drone trajectory planning in last-mile superchilling delivery. Transp. Res. Part C Emerg. Technol. 2024, 158, 104448. [Google Scholar] [CrossRef]
  4. Shao, P. Risk assessment for UAS logistic delivery under UAS traffic management environment. Aerospace 2020, 7, 140. [Google Scholar] [CrossRef]
  5. Lyu, R.; Zhang, J.; Pang, J.; Zhang, J. Modeling the impacts of 2D/3D urban structure on PM2.5 at high resolution by combining UAV multispectral/LiDAR measurements and multi-source remote sensing images. J. Clean. Prod. 2024, 437, 140613. [Google Scholar] [CrossRef]
  6. Yang, C.; Zhu, W.; Sun, J.; Xu, X.; Wang, R.; Lu, Y.; Zhang, S.; Zhou, W. Assessing the effects of 2D/3D urban morphology on the 3D urban thermal environment by using multi-source remote sensing data and UAV measurements: A case study of the snow-climate city of Changchun, China. J. Clean. Prod. 2021, 321, 128956. [Google Scholar] [CrossRef]
  7. Yamashita, R.; Kidoguchi, K.; Oshima, T.; Ishigaki, A. Sustainable paddy farming in rural Japan: Leveraging farmer integration and agricultural UAVs for synergistic solutions. J. Clean. Prod. 2024, 475, 143685. [Google Scholar] [CrossRef]
  8. Li, X.; Li, Y.; Chen, Y.; Zhang, G.; Liu, Z. Deep Learning-Based Target Point Localization for UAV Inspection of Point Cloud Transmission Towers. Remote Sens. 2024, 16, 817. [Google Scholar] [CrossRef]
  9. Tang, G.; Gu, J.; Zhu, W.; Claramunt, C.; Zhou, P. HD Camera-Equipped UAV Trajectory Planning for Gantry Crane Inspection. Remote Sens. 2022, 14, 1658. [Google Scholar] [CrossRef]
  10. Yang, J.; Wang, X.; Wang, Y.T.; Liu, Z.M.; Li, X.S.; Wang, F.Y. Parallel Intelligence and CPSS in 30 Years: An ACP Approach. Acta Autom. Sinica 2023, 49, 614–634. [Google Scholar]
  11. Wang, F.; Zheng, N.; Cao, D.; Martinez, C.M.; Li, L.; Liu, T. Parallel driving in CPSS: A unified approach for transport automation and vehicle intelligence. IEEE/CAA J. Autom. Sin. 2017, 4, 577–587. [Google Scholar] [CrossRef]
  12. Dong, H.; Zhu, H.; Li, Y.; Lv, Y.; Gao, S.; Zhang, Q.; Ning, B. Parallel intelligent systems for integrated high-speed railway operation control and dynamic scheduling. IEEE Trans. Cybern. 2018, 48, 3381–3389. [Google Scholar] [CrossRef]
  13. Aslam, M.M.; Shafik, W.; Hidayatullah, A.F.; Kalinaki, K.; Gul, H.; Zakari, R.Y.; Tufail, A. Intelligent Transportation Systems: A Critical Review of Integration of Cyber-physical Systems (CPS) and Industry 4.0. Digit. Commun. Netw. 2025; in press. [Google Scholar]
  14. Lu, Y.S.; Wang, F.Y.; Zhang, Y.; Zhang, X.D. Parallel cities: Framework, methodology, and application. Chin. J. Intell. Sci. Technol. 2019, 1, 311–317. [Google Scholar]
  15. Saritha, I.G.; Naveen, I.G.; Sowmyashree, M.S. CPS Secured Hybridization Technique for Healthcare in Smart Cities. In 5G Green Communication Networks for Smart Cities; Apple Academic Press: Palm Bay, FL, USA, 2025; pp. 77–93. [Google Scholar]
  16. Ma, S.; Liu, H.; Pan, N.; Wang, S. Study on an autonomous distribution system for smart parks based on parallel system theory against the background of Industry 5.0. J. King Saud Univ.-Comput. Inf. Sci. 2023, 35, 101608. [Google Scholar] [CrossRef]
  17. Liu, H.; Sun, Y.; Cao, J.; Chen, S.; Pan, N.; Dai, Y.; Pan, D. Study on UAV parallel planning system for transmission line project acceptance under the background of industry 5.0. IEEE Trans. Ind. Inform. 2022, 18, 5537–5546. [Google Scholar] [CrossRef]
  18. Wang, F.; Gao, Y.; Shang, X.; Zhang, J. Parallel manufacturing and industries 5.0: From virtual manufacturing to intelligent manufacturing. Sci. Technol. Rev. 2018, 36, 10–22. [Google Scholar]
  19. Aleisa, M.A. Enhancing Security in CPS Industry 5.0 using Lightweight MobileNetV3 with Adaptive Optimization Technique. Sci. Rep. 2025, 15, 18677. [Google Scholar] [CrossRef]
  20. Faiçal, B.S.; Marcondes, C.A.; Loubach, D.S.; Sbruzzi, E.F.; Verri, F.A.; Marques, J.C.; Pereira, L.A.; Maximo, M.R.; Curtis, V.V. A Cyber-Physical System’s Roadmap to Last-Mile Delivery Drones. IEEE Aerosp. Electron. Syst. Mag. 2023, 38, 6–16. [Google Scholar] [CrossRef]
  21. Mohamed Salleh, M.F.B.; Wanchao, C.; Wang, Z.; Huang, S.; Tan, D.Y.; Huang, T.; Low, K.H. Preliminary concept of adaptive urban airspace management for unmanned aircraft operations. In Proceedings of the 2018 AIAA Information Systems-AIAA Infotech@ Aerospace, Kissimmee, FL, USA, 8–12 January 2018; American Institute of Aeronautics and Astronautics: Kissimmee, FL, USA, 2018; p. 2260. [Google Scholar]
  22. Xu, X.Y.; Wan, L.J.; Chen, P.; Dai, J.B.; Cai, M. An Airspace Raster Representation Method Based on GeoSOT Grid. J. Air Force Eng. Univ. (Nat. Sci. Ed.) 2021, 22, 15–22. [Google Scholar]
  23. Feng, O.; Zhang, H.; Tang, W.; Wang, F.; Feng, D.; Zhong, G. Digital Low-Altitude Airspace Unmanned Aerial Vehicle Path Planning and Operational Capacity Assessment in Urban Risk Environments. Drones 2025, 9, 320. [Google Scholar] [CrossRef]
  24. Martin, T.; Huang, Z.F.; McFadyen, A. Airspace risk management for UAVs a framework for optimising detector performance standards and airspace traffic using JARUS SORA. In Proceedings of the 2018 IEEE/AIAA 37th Digital Avionics Systems Conference (DASC), London, UK, 23–27 September 2018; IEEE: New York, NY, USA, 2018; pp. 1516–1525. [Google Scholar]
  25. CAAC Management Regulations for Trial Operation of Specific Types of UAVs. Available online: https://www.caac.gov.cn/XXGK/XXGK/GFXWJ/201902/t20190201_194511.html (accessed on 1 February 2019).
  26. Jiao, Q.; Liu, Y.; Zheng, Z.; Sun, L.; Bai, Y.; Zhang, Z.; Sun, L.; Ren, G.; Zhou, G.; Chen, X. Ground risk assessment for unmanned aircraft systems based on dynamic model. Drones 2022, 6, 324. [Google Scholar] [CrossRef]
  27. Han, P.; Zhao, Y.F.; Liu, H. Assessment system construction and trend foresight of UAV ground impact risk. J. Civ. Aviat. Univ. China 2021, 39, 40–47. [Google Scholar]
  28. Banerjee, P.; Gorospe, G.; Ancel, E. 3D representation of UAV-obstacle collision risk under off-nominal conditions. In Proceedings of the 2021 IEEE Aerospace Conference (50100), Big Sky, MT, USA, 6–13 March 2021; IEEE: New York, NY, USA, 2021; pp. 1–7. [Google Scholar]
  29. Jie, C.; Yuan, Z.; Cheng-long, L.I.; Bo, J.; Dong-lai, L. Minimum Risk Path Planning Algorithm for Urban Very-low-level Logistics Scenarios. Sci. Technol. Eng. 2023, 23, 690–698. [Google Scholar]
  30. Han, P.; Zhou, B.; Zhang, E.Y. Air Collision Risk of Manned Drones in Multiple Scenarios in the Terminal Area. J. Xihua Univ. (Nat. Sci. Ed.) 2022, 41, 8–11. [Google Scholar]
  31. Li, J.; Zhong, G.; Zhang, X.W.; Zhang, H.H. Research on calculation method of aerial collision risk of urban low-altitude UAV. Mod. Transp. Metall. Mater. 2022, 2, 20–30. [Google Scholar]
  32. Kutpanova, Z.; Kadhim, M.; Zheng, X.; Zhakiyev, N. Multi-UAV path planning for multiple emergency payloads delivery in natural disaster scenarios. J. Electron. Sci. Technol. 2025, 23, 100303. [Google Scholar] [CrossRef]
  33. Re, X.; Cheng, C. Construction and application of third-party risk model for unmanned aerial vehicle operation in urban environment. China Saf. Sci. J. 2021, 31, 15–20. [Google Scholar]
  34. Pang, B.; Hu, X.; Dai, W.; Low, K.H. UAV path optimization with an integrated cost assessment model considering third-party risks in metropolitan environments. Reliab. Eng. Syst. Saf. 2022, 222, 108399. [Google Scholar] [CrossRef]
  35. Jiang, C.; Blom, H.A.; Sharpanskykh, A. Third party risk indicators and their use in safety regulations for UAS operations. In Proceedings of the AIAA Aviation 2020 Forum, Virtual Event, 15–19 June 2020; p. 2901. [Google Scholar]
  36. Xu, C.; Liao, X.; Ye, H.; Yue, H. Iterative construction of low-altitude UAV air route network in urban areas: Case planning and assessment. J. Geogr. Sci. 2020, 30, 1534–1552. [Google Scholar] [CrossRef]
  37. Zhang, H.; Tian, T.; Feng, O.; Wu, S.; Zhong, G. Research on Public Air Route Network Planning of Urban Low-Altitude Logistics Unmanned Aerial Vehicles. Sustainability 2023, 15, 12021. [Google Scholar] [CrossRef]
  38. Li, S.; Zhang, H.; Yi, J.; Liu, H. A bi-level planning approach of logistics unmanned aerial vehicle route network. Aerosp. Sci. Technol. 2023, 141, 108572. [Google Scholar] [CrossRef]
  39. Hu, Z.; Huang, Y.; Li, Y.; Bao, X. Drone-Based Instant Delivery Hub-and-Spoke Network Optimization. Drones 2024, 8, 247. [Google Scholar] [CrossRef]
  40. Gao, C.; Hu, Z.; Wang, Y. Optimizing the Hub-and-Spoke Network with Drone-Based Traveling Salesman Problem. Drones 2023, 7, 6. [Google Scholar] [CrossRef]
  41. Li, Z.; Li, S.; Lu, J.; Wang, S. Air Route Network Planning Method of Urban Low-Altitude Logistics UAV with Double-Layer Structure. Drones 2025, 9, 193. [Google Scholar] [CrossRef]
  42. Zhu, Y.; Xie, H.; Pu, F.; Zhang, Y.; He, W. Research of Airspace Gridding Method and Its Application in Air Traffic Management. Adv. Aeronaut. Sci. Eng. 2021, 12, 12–24. [Google Scholar]
  43. Liao, X.; Xu, C.; Ye, H.; Tan, X.; Fang, S.; Huang, Y.; Lin, J. Critical Infrastructures for Developing UAVs’ Applications and Low-altitude Public Air-route Network Planning. Bull. Chin. Acad. Sci. 2022, 37, 977–988. [Google Scholar]
  44. Fraga-Lamas, P.; Fernández-Caramés, T.M.; Da Cruz, A.M.R.; Lopes, S.I. An Overview of Blockchain for Industry 5.0: Towards Human-centric, Sustainable and Resilient Applications. IEEE Access 2024, 12, 116162–116201. [Google Scholar] [CrossRef]
  45. Zhang, H.; Wang, F.; Feng, D.; Du, S.; Zhong, G.; Deng, C.; Zhou, J. A Logistics UAV Parcel-Receiving Station and Public Air-Route Planning Method Based on Bi-Layer Optimization. Appl. Sci. 2023, 13, 1842. [Google Scholar] [CrossRef]
  46. Primatesta, S.; Rizzo, A.; la Cour-Harbo, A. Ground risk map for unmanned aircraft in urban environments. J. Intell. Robot. Syst. 2020, 97, 489–509. [Google Scholar] [CrossRef]
  47. Alexander, W.N.; Whelchel, J. Flyover noise of multi-rotor sUAS. In Proceedings of the Inter-Noise and Noise-Con Congress and Conference Proceedings, Madrid, Spain, 30 September 2019; Institute of Noise Control Engineering: Madrid, Spain, 2019; Volume 259, pp. 2548–2558. [Google Scholar]
  48. Zhang, Q.; Xu, W.; Zhang, H.; Zou, Y.; Chen, Y. Path planning for logistics UAV in complex low-altitude airspace. J. Beijing Univ. Aeronaut. Astronaut. 2020, 46, 1275–1286. [Google Scholar]
Figure 1. The schematic diagram of hub-and-spoke centralized distribution for low-altitude terminal logistics.
Drones 09 00634 g001
Figure 2. CPSS parallel system framework.
Drones 09 00634 g002
Figure 3. The technical flowchart for planning PRNs for urban low-altitude terminal logistics UAVs.
Drones 09 00634 g003
Figure 4. The construction process of the digital airspace environment model.
Drones 09 00634 g004
Figure 5. The schematic diagram of airspace grid partitioning [23].
Drones 09 00634 g005
Figure 6. The schematic diagram of obstacle grid s e t o w n f , s e t 1 s t f , s e t 2 n d f , and s e t e l s e .
Drones 09 00634 g006
Figure 7. Schematic diagram of the setting of AD-Grids.
Drones 09 00634 g007
Figure 8. Setup of A-Grid zones in VTOL-F.
Drones 09 00634 g008
Figure 9. The flowchart for the precise matching of AD-Grids to VTOL-Ps.
Drones 09 00634 g009
Figure 10. Steps of the precise matching of AD-Grids to VTOL-Ps.
Drones 09 00634 g010
Figure 11. Schematic diagram of the parallelogram transformation method.
Drones 09 00634 g011
Figure 12. Flowchart of the orderly route re-planning.
Drones 09 00634 g012
Figure 13. Technical process of the PRN orderly planning.
Drones 09 00634 g013
Figure 14. The digital airspace environment information and environmental risk distribution map of the Liuheng area.
Drones 09 00634 g014aDrones 09 00634 g014b
Figure 15. The schematic diagrams of the above three AD-Grid configuration methods.
Drones 09 00634 g015
Figure 16. Variation trends of average risk cost for Weight-A* and Parallel-A* with parameters.
Drones 09 00634 g016
Figure 17. Variation trends of average route inflection point cost for Weight-A* and Parallel-A* with parameters.
Drones 09 00634 g017
Figure 18. Variation diagram of average risk cost and average inflection point cost under different parameters.
Drones 09 00634 g018
Figure 19. Variation diagram of the PRN C n e t w o r k under different parameters.
Drones 09 00634 g019
Figure 20. The results of Weight-A*, Parallel-A*, and A* algorithms after completing the ordered PRN planning.
Drones 09 00634 g020
Figure 21. The results of the computational time of orderly planning for terminal grids and regional grids under different route scales.
Drones 09 00634 g021
Table 1. Airspace grid access rules.
PropertyGrid Access Rules
Communication signal blind spots F l y - p r o h i b i t e d
Electromagnetic interference area F l y - p r o h i b i t e d
Physical obstacles F l y - p r o h i b i t e d
Buildings F l y - p r o h i b i t e d
Government and military key areas F l y - p r o h i b i t e d
Special event areas F l y - p r o h i b i t e d
Temporary no-fly zones established under dynamic demand conditions F l y - p r o h i b i t e d
Other F l y - p e r m i t t e d
Table 2. Values of the shielding factor.
Shielding TypeValue
No Shelters0.00
Scattered Trees0.25
Vehicles and Low-rise Structures0.50
High-rise Structures0.75
Industrial Structures1.00
Table 3. Model parameters.
ParameterValueParameterValueParameterValue
h q / m 95 m u a v / k g 10 f e /(¥· k w h 1 ) 1.2
L v _ U A V / m 2.36 m c a r g o / k g 5 τ m a x 3
L l o c a t i o n / m 4 v /(m/s) 14 R o u t e m i n / k m 0.5
L h _ U A V / m 1.2 φ 10 R o u t e m a x / k m 30
L s p e e d C u t / m 16.3 h u a v / m 95 m m a x / k g 20
L d e l a y / m 1.4 d p e o p l e / 9.14 9.14 t i m e m a x 10
S v / m 10.36 L h / d b 55 l e n m i n / m 100
S h / m 64 P / n u m b e r 12
P u a v 6.04 × 10 5 δ m a x 180
Table 4. Coordinates of VTOL-Ps.
NumberCoordinatesNumberCoordinatesNumberCoordinatesNumberCoordinates
1(69, 142)6 (161, 137) 11 (162, 90) 16 (92, 32)
2(43, 155)7 (138, 23) 12 (132, 27) 17 (86, 96)
3 (71, 162)8 (143, 41) 13 (113, 4) 18 (55, 51)
4 (125, 151)9 (145, 83) 14 (119, 47) 19 (64, 85)
5 (142, 163) 10 (164, 81) 15 (110, 96)20 (58, 132)
Table 5. Connectivity rates of route planning for results of different AD-Grid configurations.
TypeConnectivity Rate Before OptimizationConnectivity Rate After Optimization
The method in this paper30%100%
The sequential matching method30%70%
The greedy matching method5%20%
Disclaimer/Publisher’s Note: The statements, opinions and data contained in all publications are solely those of the individual author(s) and contributor(s) and not of MDPI and/or the editor(s). MDPI and/or the editor(s) disclaim responsibility for any injury to people or property resulting from any ideas, methods, instructions or products referred to in the content.