Article

Marine Unmanned Surface Vehicle Measurements of Solar Irradiance Under Typhoon Conditions

1
State Key Laboratory of Atmospheric Environment and Extreme Meteorology, Institute of Atmospheric Physics, Chinese Academy of Sciences, Beijing 100029, China
2
State Key Laboratory of Remote Sensing and Digital Earth, Aerospace Information Research Institute, Chinese Academy of Sciences, Beijing 100101, China
3
Laboratory of Middle Atmosphere and Global Environment Observation, Institute of Atmospheric Physics, Chinese Academy of Sciences, Beijing 100029, China
4
Xinyu Guoke Science & Technology Co., Ltd., Xinyu 338018, China
5
Meteorological Observation Center of the China Meteorological Administration, Beijing 100081, China
*
Author to whom correspondence should be addressed.
Drones 2025, 9(6), 395; https://doi.org/10.3390/drones9060395
Submission received: 13 April 2025 / Revised: 22 May 2025 / Accepted: 23 May 2025 / Published: 25 May 2025

Abstract

:
Autonomous unmanned surface vehicles (USVs) offer transformative potential for collecting marine meteorological data under extreme weather conditions, yet their capability to provide reliable solar radiation measurements during typhoons remains underexplored. This study evaluates shortwave downward radiation (SWDR) data obtained by a solar-powered USV (developed by IAP/CAS, Beijing, China) that successfully traversed Typhoon Sinlaku (2020), compared with Himawari-8 satellite products. The SUSV acquired 1 min resolution SWDR measurements near the typhoon center, while satellite data were collocated spatially and temporally for validation. Results demonstrate that the USV maintained uninterrupted operation and power supply despite extreme sea states, enabling continuous radiation monitoring. After averaging, high-frequency SWDR data exhibited minimal bias relative to Himawari-8 to mitigate wave-induced attitude effects, with a mean bias error (MBE) of 13.64 W m−2 under cloudy typhoon conditions. The consistency between platforms confirms the SUSV’s capacity to deliver accurate in situ radiation data where traditional observations are scarce. This work establishes that autonomous SUSVs can critically supplement satellite validation and improve radiative transfer models in typhoon-affected oceans, addressing a key gap in severe weather oceanography.

1. Introduction

Solar radiation drives energy, mass, and water vapor exchange between the ocean and atmosphere, while serving as a critical renewable energy source [1,2,3,4,5]. Although land-based and coastal radiation observation networks have expanded significantly, remote oceanic regions remain poorly observed due to technical challenges in deployment, energy supply, and maintenance [6,7,8,9]. Accurate marine radiation data are essential for validating satellite products, assessing solar energy resources, and improving climate models—particularly under extreme weather conditions where observations are scarce [10,11,12,13,14].
Although multi-satellite remote sensing can provide global solar radiation data [15,16,17,18], high-quality ground-based measurements serve as essential benchmarks for validating satellite retrievals and numerical forecast products. Over land, the World Climate Research Programme (WCRP) established the Background Surface Radiation Network (BSRN) to supply high-standard radiation data for this purpose, with its 76 stations spanning the Earth’s surface from 80° N to 90° S [19]. In China, the China Meteorological Administration (CMA) radiation observation network and the Chinese Ecosystem Research Network (CERN) provide hourly radiation measurements at 128 and 38 stations, respectively [20,21]. However, such reference data are virtually absent over open oceans, which are limited by the logistical constraints of traditional platforms (e.g., islands, buoys, ships).
Marine observations are conducted from various platforms, including islands, oil platforms, marine meteorological buoys, and ships [22,23,24,25]. Island-based automatic stations can continuously monitor and provide real-time data; however, these stations typically require regular manual maintenance and calibration [26]. Similarly, while oil platforms offer continuous observation capabilities, their fixed locations limit spatial coverage, providing only point observations [27]. Compared to these stationary platforms, buoys and research vessels offer greater flexibility and mobility. Ocean buoys can withstand severe marine conditions and provide long-term, continuous data, meeting specific research requirements. However, they typically accommodate fewer instruments and measure fewer parameters (e.g., sea surface temperature and waves) than other platforms [28,29,30,31,32]. Research vessels can be equipped with a wide array of instruments, but their operation and maintenance costs are substantial, and their observational capabilities and crew safety are constrained by both severe weather and rough sea conditions. Fixed platforms (e.g., oil rigs) lack spatial coverage, while ships and buoys face high costs, limited instrumentation, or weather-dependent operation [33,34].
Unmanned surface vehicles (USVs) offer a transformative solution, combining autonomy, mobility, and cost-effectiveness for marine meteorological monitoring [35,36,37,38,39,40,41]. The Institute of Atmospheric Physics (IAP/CAS) has pioneered two USV types: a diesel-powered semi-submersible (USSV) for extreme weather resilience and a solar-powered USV (SUSV) for long-endurance missions [42,43,44]. During Typhoon Sinlaku (2020) [45,46,47], the SUSV successfully traversed the storm center, collecting unique 1 min resolution shortwave downward radiation (SWDR) data—a rare dataset for typhoon conditions [44]. For detailed information of the SUSV, such as the meteorological and oceanographic observation system or technical parameters, refer to [44].
This study investigates the radiation observation results during this typhoon process. The primary objectives are to evaluate the accuracy and reliability of SWDR measurements from a solar-powered USV in typhoon conditions by validating them against Himawari-8 satellite products. This addresses two key gaps: (1) the absence of high-frequency in situ radiation data in typhoons, and (2) the need for autonomous platforms to supplement satellite validation. Our results demonstrate the SUSV’s capability to deliver reliable radiation measurements in harsh marine environments, paving the way for improved ocean radiation databases and model accuracy. The paper is organized as follows: Section 2 describes related works, Section 3 gives the data and quality control methods, Section 4 presents the primary findings and comparison results, and Section 5 concludes with a summary and discussion.

2. Related Works

USVs and other autonomous platforms have emerged as valuable tools for marine meteorological and oceanographic observations, enabling data collection from previously inaccessible or hazardous regions.
Traditional observational platforms, such as fixed towers and buoys, offer high-quality data but are often limited by high operational costs and their fixed observation locations. This static nature inherently restricts their ability to move with and continuously track dynamic extreme weather phenomena like typhoons, leading to spatial and temporal observational gaps.
While various USVs and other autonomous systems have been developed to address these limitations, their capabilities vary significantly. For instance, platforms like Saildrone have demonstrated impressive robustness and success in collecting a range of general meteorological data (e.g., wind speed, air temperature, atmospheric pressure) during severe weather events such as hurricanes. However, dedicated high-resolution radiation measurements under such extreme conditions remain notably limited in the existing literature.
This study addresses this critical gap by deploying a SUSV. The SUSV utilized in this study offers distinct advantages for such demanding environments. Its solar charging capability enables prolonged endurance, crucial for tracking transient events like typhoons over extended periods. This autonomy, combined with its specialized pyranometer, allows for continuous, high-resolution SWDR measurements directly at the sea surface during a typhoon’s passage—a unique and particularly scarce dataset. This provides essential data for validating satellite products and improving atmospheric models in extreme conditions.
To further illustrate the diverse approaches and clearly highlight the novelty of our work, Table 1 provides a comparative summary of platforms, measured parameters, and the weather conditions under which observations were conducted in relevant previous studies.

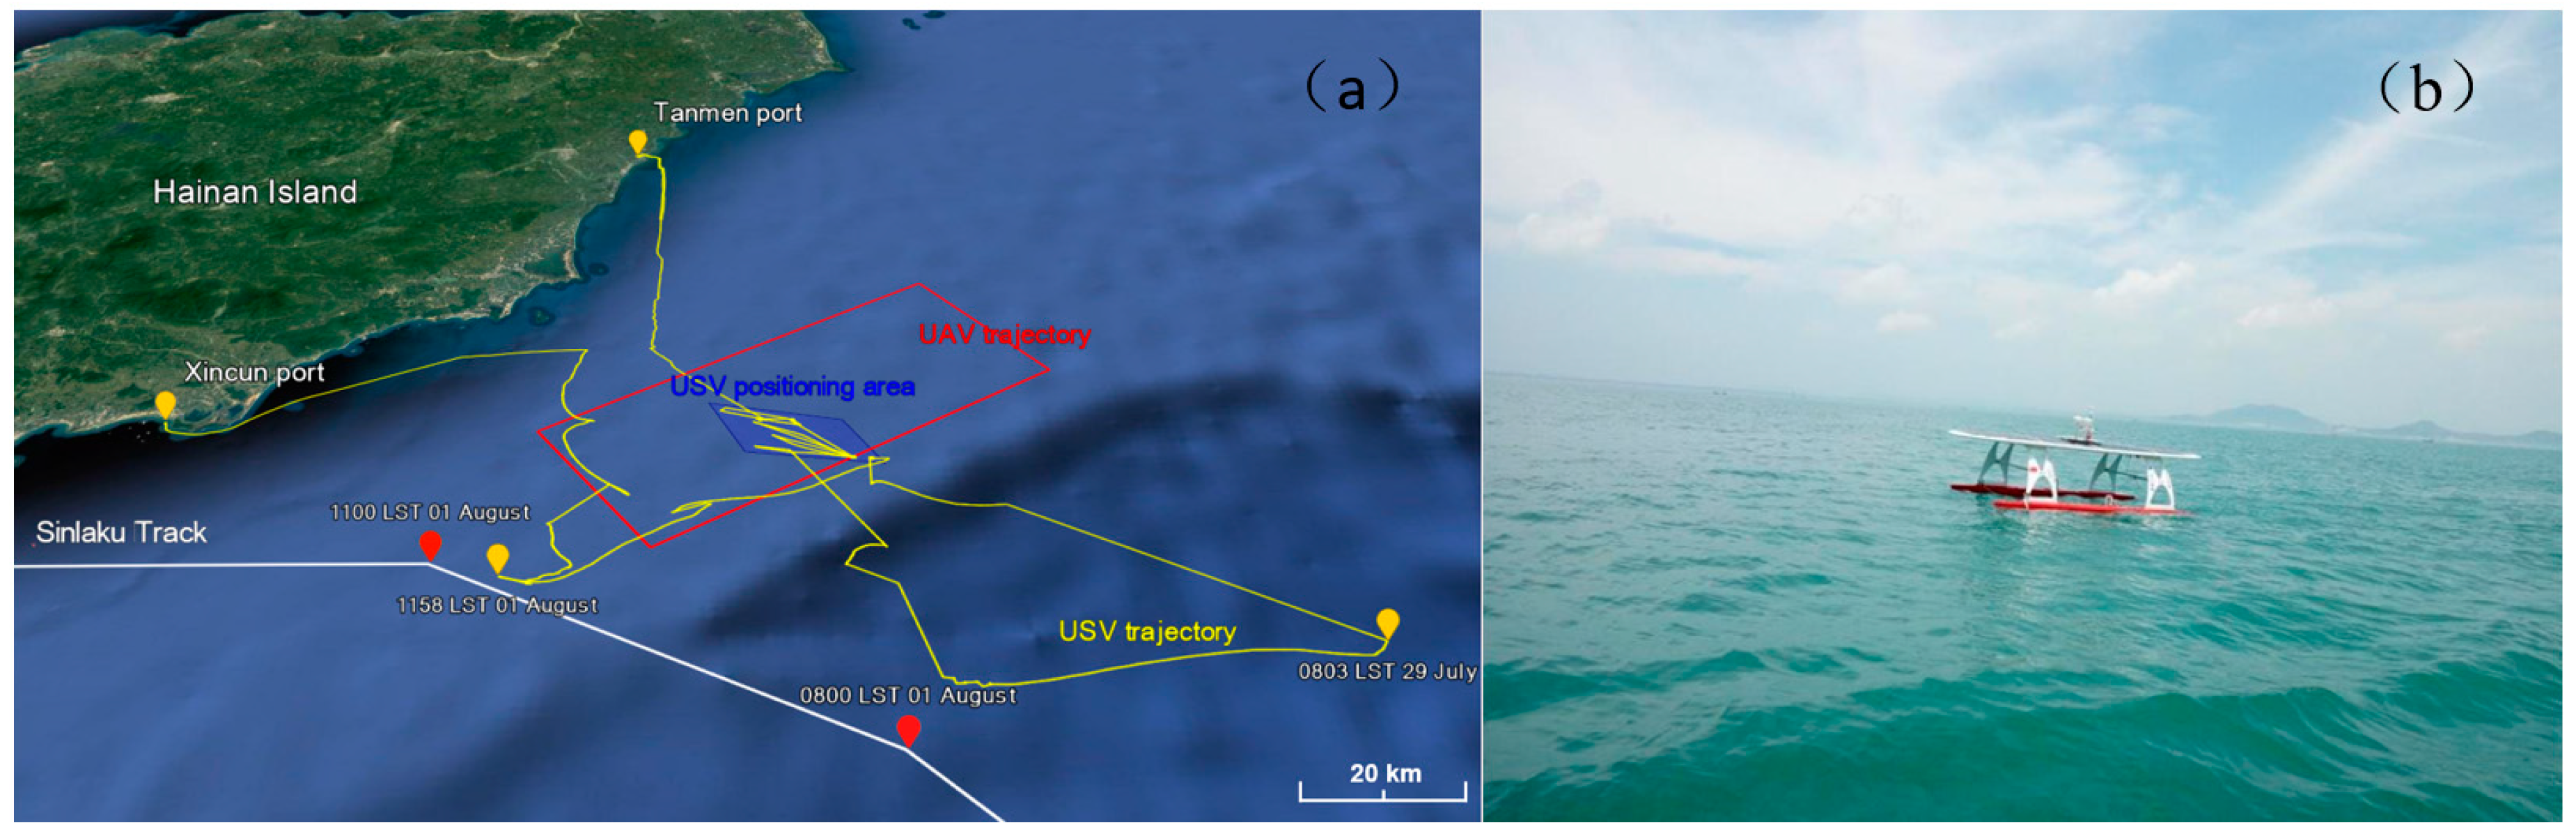
3. Experiment and Data

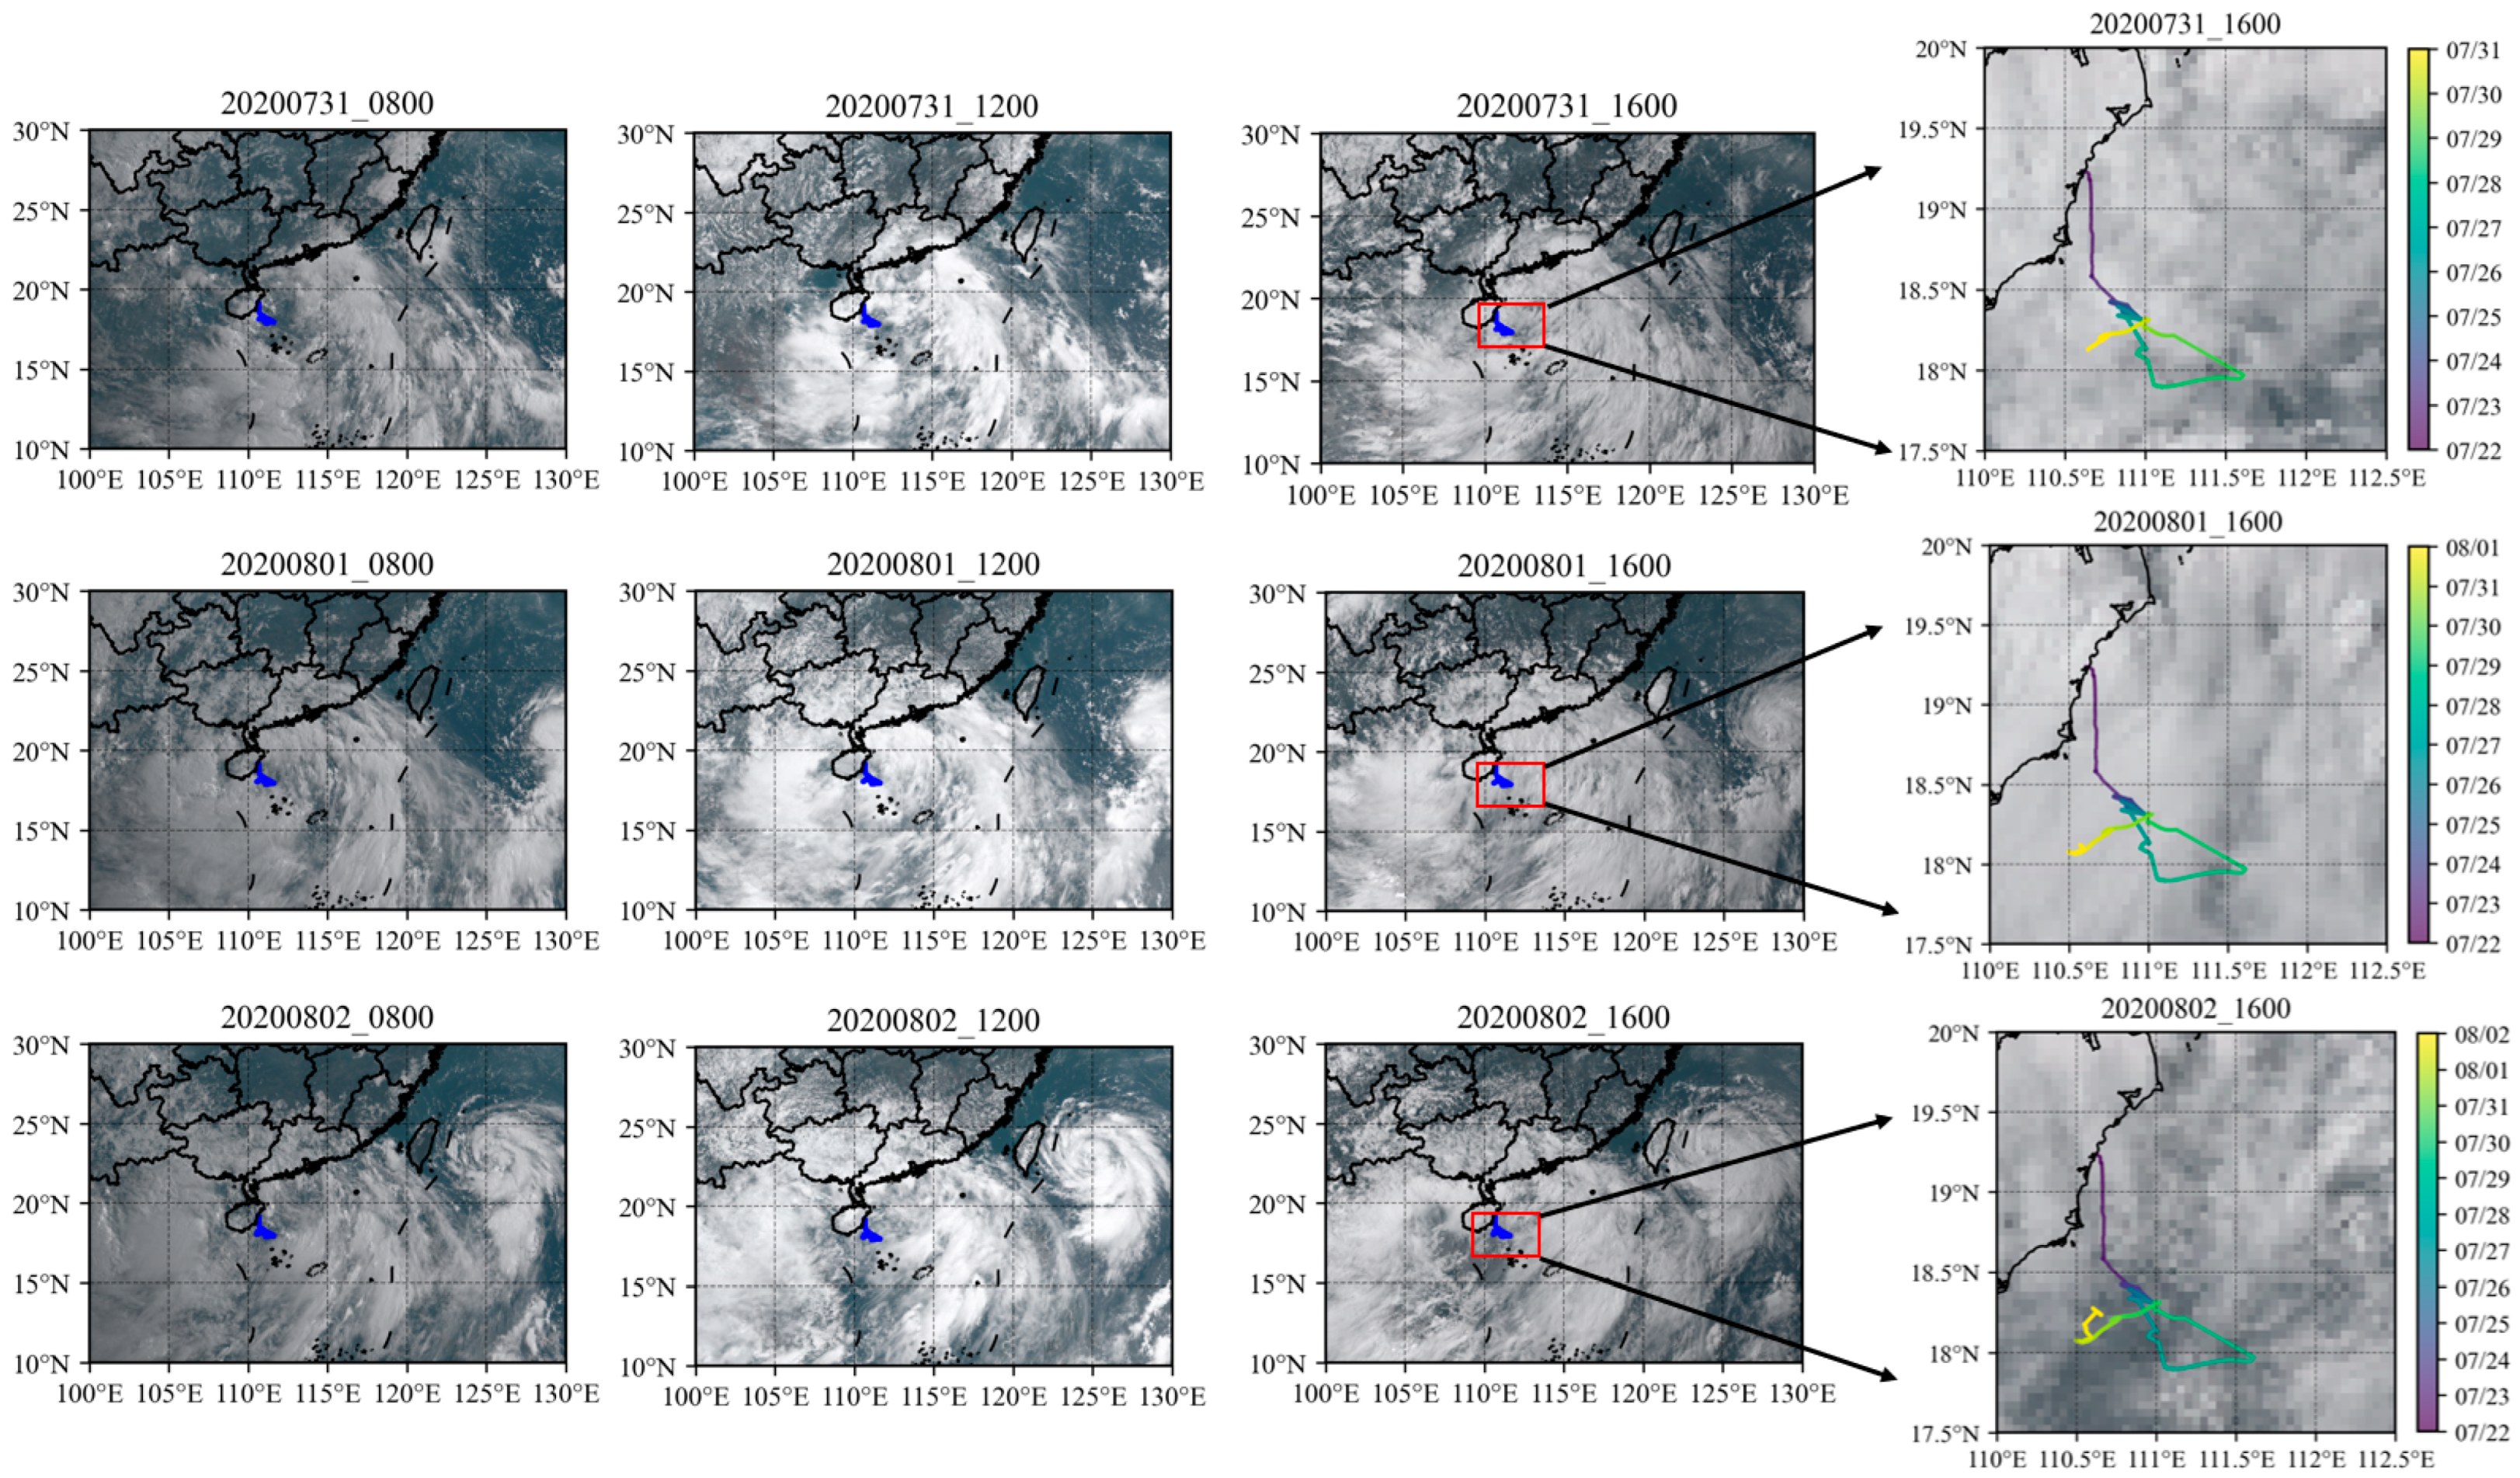
3.1. Typhoon Process

Typhoon Sinlaku (202003) developed from a tropical depression in the South China Sea at 0700 UTC on 31 July 2020. Within 24 h, the system intensified into a typhoon near Sanya, Hainan Island (20 km west of the coast) with a northwestward motion at 25 km/h. After crossing Hainan’s southern region and entering the Beibu Gulf, Sinlaku made landfall near Thanh Hoa City, Vietnam, at 0840 UTC on 2 August, with maximum sustained winds of 18 m s−1 before weakening to tropical storm strength [44,45,46,47].
During this event, the SUSV successfully traversed Typhoon Sinlaku’s center on 1 August 2020 (see Figure 1 for track details), collecting high-resolution observations at 1-min temporal resolution. With a typical cruising speed of 1.5–2.5 m s−1, the platform achieved an effective spatial resolution of approximately 100 m (90–150 m range). This high-resolution dataset, encompassing radiation measurements alongside wind speed and precise positioning data, provided valuable real-time information for typhoon tracking and intensity forecasting. For detailed information on the SUSV, refer to Chen’s work [44].

3.2. Radiation Data from the SUSV

The IAP’s SUSV offers four key advantages over traditional marine observation platforms like buoys: (1) autonomous deployment, data collection, and transmission capabilities; (2) long-duration and long-range operational capacity enabled by solar power; (3) enhanced stability in rough seas due to its semi-submersible design that minimizes wave impacts; and (4) high temporal resolution (1 min) real-time observations transmitted via Beidou satellite.
For radiation measurements, the SUSV carries lightweight SP-110 pyranometers (±5% accuracy) specifically designed for marine applications. These silicon-cell pyranometers have a sensitivity of 0.2 mV per W m−2 and a calibration factor of 5 W m−2 per mV, with a calibration uncertainty of less than 3%. The sensors are designed for the continuous measurement of total shortwave radiation within a spectral range of 360 to 1120 nm, featuring a directional (cosine) response of ±5% at a 75° zenith angle. The pyranometers are characterized by a non-linearity of less than 1% up to 2000 W m−2, a response time of less than 1 ms, and a measurement repeatability of less than 1%. These compact sensors, with a diameter of 24 mm and a height of 33 mm, weigh 90 g and are suitable for harsh marine environments, operating reliably within a temperature range of −40 to 70 °C and are capable of being submerged in water up to 30 m. These sensors measure SWDR with 1 min resolution. The instrumentation configuration includes a pair of upward/downward pyranometers mounted centrally on the solar panel, 60 cm above sea surface; an Airmar automatic weather station (AWS) positioned 30 cm above the panel; and a minimum of 2 m of separation between radiation sensors and AWS to prevent interference.
The SWDR data may contain inconsistencies from three main sources: (1) instrument errors, (2) data transmission issues, and (3) missing measurements. Additional quality challenges arise from platform attitude variations during operation. To ensure data reliability, we implemented a three-stage quality control protocol adapted from BSRN standards. The first step of the physically possible value test involves checking whether the radiation data conforms to their physical theoretical maximum values and climatic extremes. The SWDR observations that exceed the reasonable range are deemed erroneous and discarded. The threshold criteria used for this test is taken from the quality control method recommended by the BSRN [52,53,54,55]. Base measurements for the SWDR range from −4 W·m−2 to 2000 W·m−2. When μ > 0 (μ is the cosine of the solar zenith angle), SWDR < 1.5·SC·μ1.2 + 100 (SC is the solar constant), and when μ < 0, SWDR should be less than 50 W·m−2. The −4 W m−2 lower bound acknowledges minor negative readings from instrument noise and temperature effects, avoiding artificial zero cutoffs. The 2000 W m−2 upper limit respects the physical maximum solar radiation at Earth’s surface. Daytime thresholds adapt to μ, using a formula with the SC and empirical factors for atmospheric influence. Nighttime SWDR is capped at 50 W m−2 to filter out sensor noise when solar radiation is absent. Further, in the second step, the missing values in raw 1 min data are filled with null values. Lastly, to eliminate data errors caused by drastic changes in the attitude of the SUSV and the effect of null results, the data were averaged over 10 min. The 10 min average reduces noise from SUSV attitude variations caused by waves and aligns the data’s temporal resolution with the 10 min resolution of Himawari-8 satellite data.
Figure 2 demonstrates the effectiveness of this processing, showing that the 10 min averages (0–1000 W·m−2 range) maintain the original 1 min data’s temporal pattern while smoothing extreme values. This processed dataset provides stable, high-quality radiation measurements suitable for comparison with satellite observations.

3.3. Radiation Data from Himawari-8

Because in situ ground truth observations were lacking, Himawari-8 satellite data were used for comparison. Specifically, the SWDR product obtained from the Advanced Himawari Imager (AHI) onboard the Himawari-8 satellite is used to validate the accuracy of the SUSV’s radiation data. Himawari-8, launched by the Japan Meteorological Agency, is an advanced geostationary satellite offering high temporal and spatial resolution. The AHI on Himawari-8 boasts high spatial (0.5–2 km), spectral (16 wavelengths), and temporal (2.5–10 min) resolution, covering a wide latitude and longitude range (60° S to 60° N and 80° E to 160° W), demonstrating significant potential for monitoring clouds and aerosols [56,57,58]. The radiation data utilized in this study are from the “Cloud Remote Sensing, Atmospheric Radiation and Renewal Energy Application” (CARE) product, accessible via the following website: http://www.slrss.cn/care/ (accessed on 1 January 2024). The hourly and daily root mean square errors (RMSE) of the SWDR from the CARE product are 104.9 W m−2 and 31.5 W m−2, respectively [59,60]. The temporal and spatial resolutions of the SWDR data are 10 min and 5 km, respectively. It is important to note that the radiation results derived from the Himawari-8 satellite also possess inherent uncertainties.

4. Results

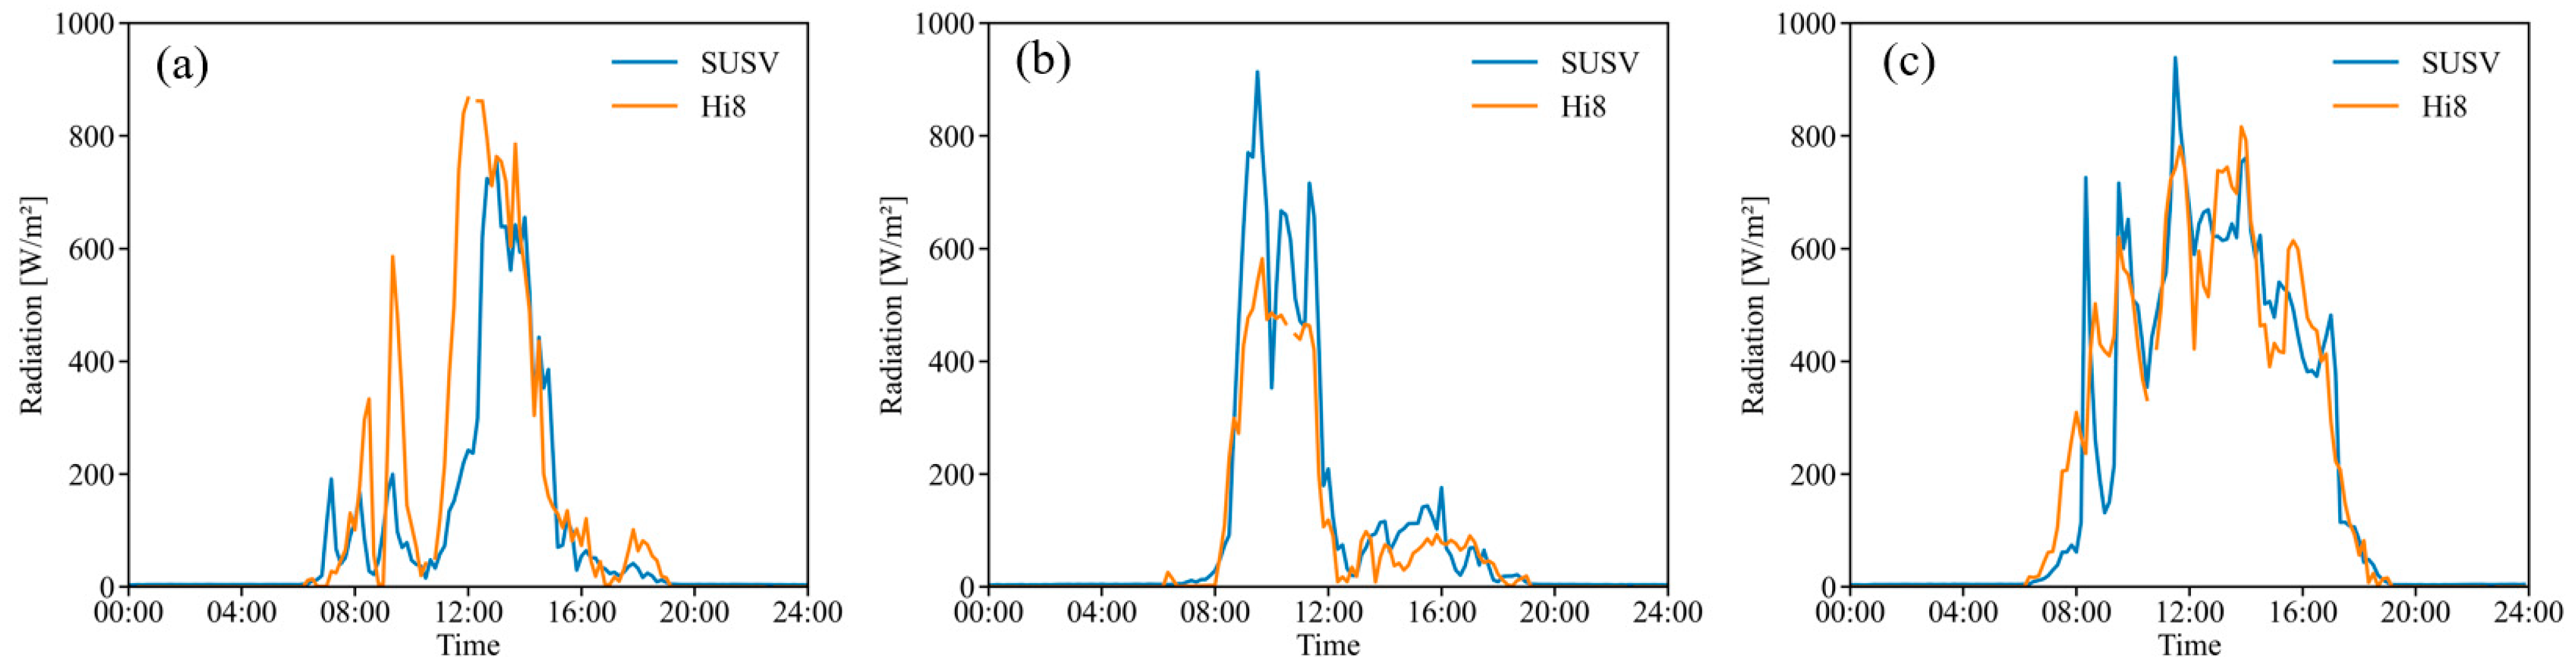
4.1. Continuous Observation by the SUSV Under Typhoon Conditions

The IAP’s SUSV experienced the formation and dissipation of Typhoon Sinlaku at sea between 31 July and 2 August. As seen the RGB images from the Himawari-8 satellite and the track of the SUSV (Figure 3), the cloud system of Typhoon Sinlaku continuously covered the SUSV. The whole process can be divided into three stages, Stage 1 (31 July): the tropical depression was in the South China Sea, and the SUSV’s track was obscured by the tropical low-pressure clouds (seen in the top row of Figure 3). Stage 2 (1 August): the tropical depression was strengthened into Typhoon Sinlaku, a typical typhoon cloud pattern was formed, and the SUSV was completely covered by the cloud system (in the middle row of Figure 3). Stage 3 (2 August): Typhoon Sinlaku landed and transformed into a tropical storm, the cloud system was no longer as complete as in the previous stage but still covered the track of the SUSV (bottom row of Figure 3). Overall, the solar radiation received by the SUSV was almost blocked by the typhoon cloud system. Despite this hindrance, the SUSV system succeeded in sustaining its operation and ensuring the regular functioning of the observational instruments under the scattered light conditions.
Figure 4 shows wind speed and direction data from SUSV, illustrating that the SUSV indeed experienced the three stages of the typhoon. Typhoon Sinlaku’s path, which was downloaded from the International Best Track Archive for Climate Stewardship (IBTrACS) [61,62,63,64,65]. These data allow us to better demonstrate how the SUSV can provide more detailed information. The 1 min temporal resolution data from the SUSV reveals peak wind speeds that are very close to those provided by IBTrACS, showcasing the SUSV’s ability to capture fine-scale wind variations during the typhoon. The highest wind speed was around 15 m/s.
The minimum distance between the SUSV and the Sinlaku was approximately 2 km. On 31 July, as the typhoon slowly moved closer to the SUSV, the maximum wind speed recorded by the typhoon tracking system was close to that measured by the SUSV, around 13 m/s. On 1 August, when the distance between the SUSV and the typhoon center was at its minimum of about 2 km, the SUSV was positioned in the typhoon’s eye, resulting in a noticeable decrease in the measured wind speed. By 2 August, the SUSV had moved more than 300 km away from the typhoon, leading to a larger discrepancy in wind speed measurements.

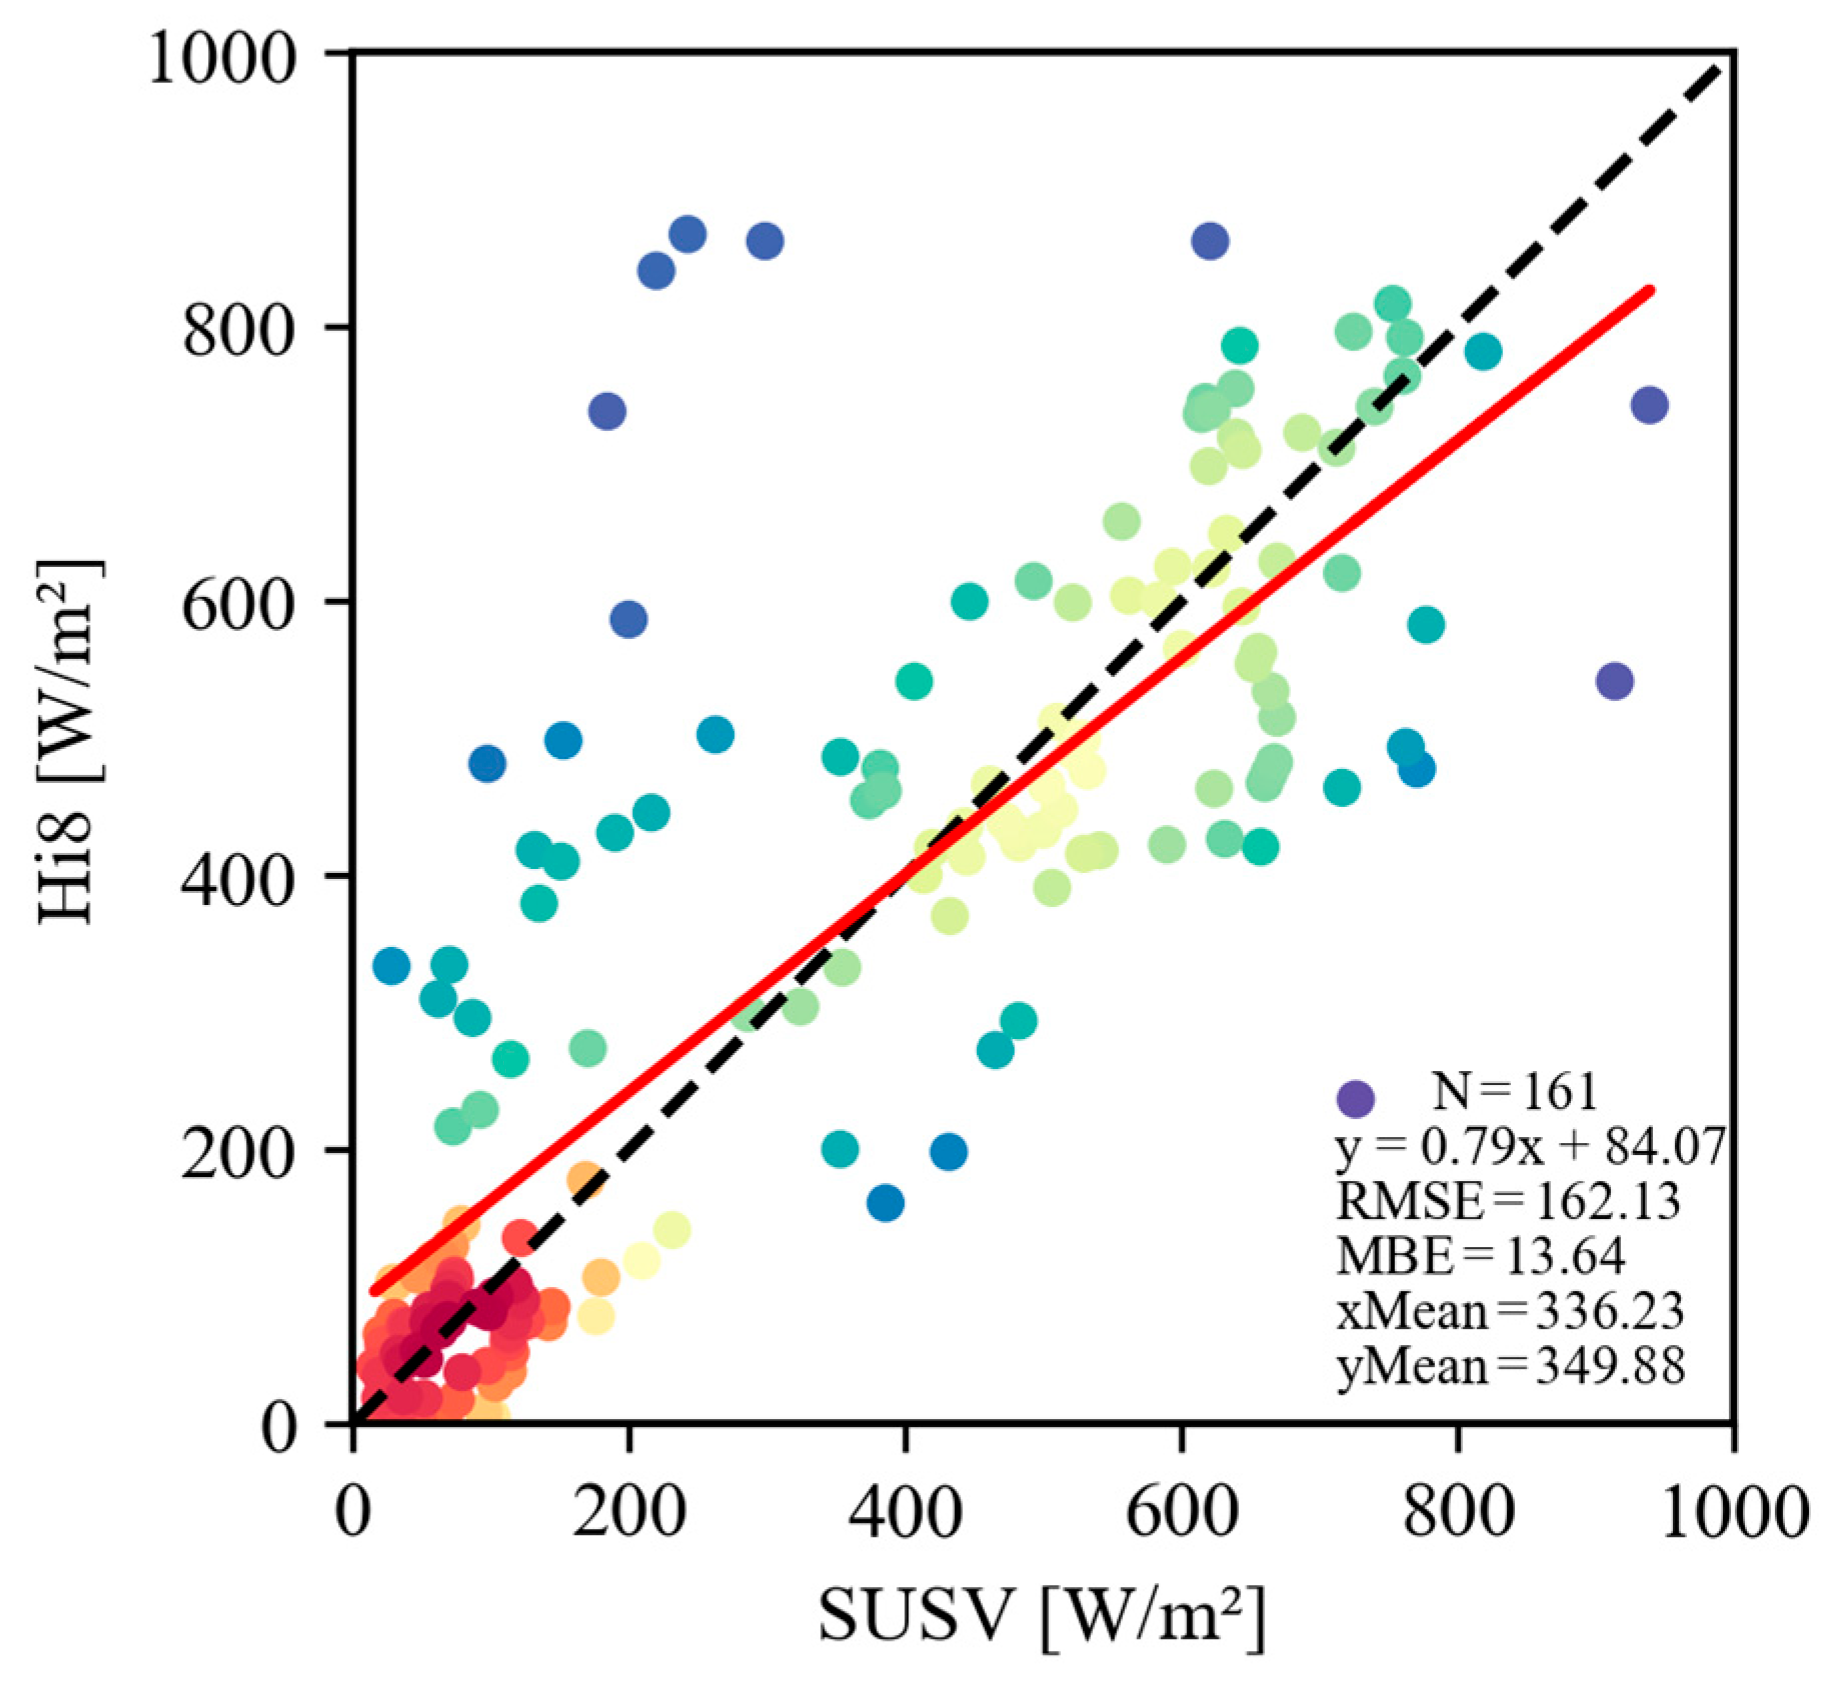
4.2. Comparison of Radiation from the SUSV and Himawari-8

Figure 5 presents a time-series comparison between the 10 min averaged SWDR from the SUSV and Himawari-8 on 31 July, 1 August, and 2 August, respectively. Overall, the satellite and the SUSV observations exhibit consistent trends. However, the SUSV’s results display more fluctuations and provide a better representation of regional features, whereas the satellite results show an average of the pixel results, which are more homogeneous. For Stage 1 (31 July), the satellite data were overall higher than the observations of the SUSV (Figure 5a). This difference can be attributed to partial cloud cover in satellite pixels, leading to higher values. Since the satellite retrieves an average value across the pixel and often interprets it as cloud-free, any sub-pixel cloud contamination—especially if the SUSV is located under a cloudy portion—can result in an overestimation compared to ground-based measurements. For Stage 2 (1 August, Figure 5b), as the typhoon cloud system covered the area entirely, the satellite and the SUSV’s observations showed consistent trends. The SUSV’s observations were slightly higher and more variable than the satellite data, because the satellite data represent the averaged value of a pixel with resolution of 5 km. In Stage 3 (Figure 5c), the typhoon turned into a tropical storm after making landfall, resulting in less compact cloud structures compared to the previous stages. Consequently, the satellite observations are higher than the SUSV observed values, similar to Stage 1.
In summary, the satellite and the SUSV observations exhibit consistent trends. However, the SUSV data demonstrate greater temporal variability compared to Himawari-8, characterized by more frequent and larger shifts in SWDR intensity over short time scales. For instance, SUSV data captures rapid changes caused by passing clouds or wave-induced sensor movement, which are often smoothed out in the satellite data’s larger spatial footprint. This high-frequency variability is crucial for some applications. For solar energy applications, this variability impacts grid stability and power plant management. For atmospheric research, it refines our understanding of radiative transfer at the ocean surface.
Figure 6 displays the scatter distributions of the SUSV SWDR versus Himawari-8 products. In order to prevent the influence of zero values during the nighttime, the time periods between 8:00 and 17:00 local time from 31 July to 2 August 2020 are shown here. Overall, the SUSV and the Himawari exhibit reasonable agreement, which show that two datasets exhibit a similar fit to the 1:1 line. The mean SWDR values are 336.23 W m−2 and 349.88 W m−2 for the SUSV and the Himawari-8, respectively, indicating a slight overestimation by the satellite data. The correlation coefficient is 0.67. The value of RMSE is 162.13 W m−2 and the mean bias error (MBE) is 13.64 W m−2. The relative RMSE and MBE are 46.3% and 3.9%, respectively. In general, Himawari-8 SWDR tends to be slightly overestimated. The SUSV data provide valuable high-resolution in situ observations that can supplement and validate satellite data. Further research will be directed towards identifying and mitigating the sources of error contributing to the RMSE, such as improving sensor calibration, refining attitude correction algorithms, and exploring advanced data fusion techniques. This will enhance the accuracy and reliability of SUSV-based radiation measurements, making them more suitable for a wider range of applications, including solar energy forecasting and climate modeling.

5. Conclusions and Discussion

From 31 July to 1 August 2020, the IAP’s SUSV successfully passed through the Typhoon Sinlaku (202003). The SUSV collected the real-time marine meteorological data of the typhoon process with high temporal resolution (1 min), which contains SWDR data. The radiation data under typhoon conditions are valuable and urgently need to be further verified and evaluated to improve the reference for the development of atmospheric radiation observation in the ocean. The present study compared and validated the SWDR measured by the SUSV with the satellite radiation products from Himawari-8. The main findings are as follows:
(1) The IAP’s SUSV could charge and operate normally while traversing Typhoon Sinlaku, enabling stable, prolonged, and long-distance observations. (2) The impact of attitude changes in the SUSV can be mitigated through quality control of physical extremes and averaging of 10 min data. (3) The SWDR obtained by the SUSV under typhoon weather conditions corresponded with the Himawari-8 radiation data, with a high degree of accuracy. The RMSE is 162.13 W m−2 and MBE is 13.64 W m−2.
The SUSV can provide reliable radiation measurements in typhoon conditions. However, the fluctuations in the SUSV data highlight its sensitivity to local variations, which can be both an advantage for detailed studies and a challenge for broader comparisons. Future work could explore more sophisticated methods to correct for orientation effects and further refine the accuracy of the measurements. Statistical and uncertainty analyses reinforce the credibility of the SUSV data and demonstrate its potential for improving marine radiation observation coverage and accuracy.
Future research should explore the potential of long-term SUSV deployments to monitor trends in marine radiation and meteorological conditions. Integrating SUSV data into real-time forecasting models could enhance the prediction of extreme weather events, such as typhoons. Furthermore, SUSV applications extend beyond typhoon studies. The continuous monitoring of monsoon activity and high-resolution irradiance mapping for offshore solar energy forecasting represent promising avenues. These expanded applications highlight the versatility of USVs in advancing our understanding of ocean–atmosphere interactions and supporting the development of marine renewable energy resources.
Given its capabilities, the solar-powered marine unmanned surface vehicle has significant potential for diverse applications. By deploying the SUSV at sea, it can provide the continuous, real-time monitoring of the intensity of solar radiation on the ocean surface, which is critical to understanding and predicting the efficiency and yield of solar power generation. Furthermore, the SUSV can be utilized in observing marine ecosystems, enhancing our understanding of climate change and marine ecosystems. This dual functionality underscores the SUSV’s importance in advancing both renewable energy research and environmental monitoring [66,67].

Author Contributions

Conceptualization, H.C. and H.S.; methodology, S.M.; software, K.X. and H.S.; validation, J.L. and Y.C.; formal analysis, K.X.; investigation, J.L.; resources, S.M. and X.Z.; data curation, W.H. and X.F.; writing—original draft preparation, K.X. and H.S.; writing—review and editing, H.C. and H.S.; visualization, K.X.; supervision, H.L.; project administration, H.L.; funding acquisition H.S. All authors have read and agreed to the published version of the manuscript.

Funding

This research was funded by the Open Fund of State Key Laboratory of Remote Sensing Science (grant no. OFSLRSS202217), the Key Technologies Research and Development Program (grant no. 2018YFC1506401), and the National Natural Science Foundation of China (grant no. 41627808).

Data Availability Statement

The raw data supporting the conclusions of this article will be made available by the authors upon reasonable request.

Acknowledgments

The authors would like to acknowledge all the members of the SUSV team for their efforts on the SUSV-based meteorological observation system.

Conflicts of Interest

Author Yaojiang Chen was employed by the company Xinyu Guoke Science & Technology Co., Ltd. The remaining authors declare that the research was conducted in the absence of any commercial or financial relationships that could be construed as a potential conflict of interest.

Abbreviations

The following abbreviations are used in this manuscript:
USVUnmanned surface vehicles
SWDRShortwave downward radiation
IAP/CASInstitute of Atmospheric Physics, Chinese Academy of Sciences
WCRPWorld Climate Research Programme
BSRNBackground Surface Radiation Network
CMAChina Meteorological Administration
CERNChinese Ecosystem Research Network
USSVDiesel-powered semi-submersible
SUSVSolar-powered USV
AWSAutomatic weather station
SCSolar constant
μCosine of the solar zenith angle
AHIAdvanced Himawari Imager
CARECloud Remote Sensing, Atmospheric Radiation and Renewal Energy Application
RMSERoot mean square errors
IBTrACSInternational Best Track Archive for Climate Stewardship
MBEMean bias error

References

  1. Rogers, R.; Aberson, S.; Aksoy, A.; Annane, B.; Black, M.; Cione, J.; Dorst, N.; Dunion, J.; Gamache, J.; Goldenberg, S.; et al. NOAA’S hurricane intensity forecasting experiment: A progress report. Bull. Am. Meteorol. Soc. 2013, 94, 859–882. [Google Scholar] [CrossRef]
  2. Trenberth, K.E.; Stepaniak, D.P. The flow of energy through the Earth’s climate system. Q. J. R. Meteorol. Soc. 2004, 130, 2677–2701. [Google Scholar] [CrossRef]
  3. Sen, Z. Solar Energy Fundamentals and Modeling Techniques: Atmosphere, Environment, Climate Change and Renewable Energy; Springer: Berlin/Heidelberg, Germany, 2008. [Google Scholar]
  4. Kumar, V.; Shrivastava, R.; Untawale, S. Solar energy: Review of potential green & clean energy for coastal and offshore applications. Aquat. Procedia 2015, 4, 473–480. [Google Scholar] [CrossRef]
  5. Jin, Z.; Stamnes, K.; Weeks, W.F.; Tsay, S. The effect of sea ice on the solar energy budget in the atmosphere-sea ice-ocean system: A model study. J. Geophys. Res. Oceans 1994, 99, 25281–25294. [Google Scholar] [CrossRef]
  6. McArthur, L.J.B. Baseline Surface Radiation Network (BSRN)-Operation Manual Version 2.1; WMO/TD: Geneva, Switzerland, 2005; p. 1274. [Google Scholar]
  7. Lee, S.; Lee, J.; Kim, H.; Park, J.; Baek, S.; Song, Y.; Seo, J.-M.; Kim, S. In-situ remotely controllable ocean radiation monitoring system. J. Instrum. 2020, 15, P06027. [Google Scholar] [CrossRef]
  8. Bishop, J.K.B.; Rossow, W.B. Spatial and temporal variability of global surface solar irradiance. J. Geophys. Res. Oceans 1991, 96, 16839–16858. [Google Scholar] [CrossRef]
  9. Kato, S.; Rutan, D.A.; Rose, F.G.; Caldwell, T.E.; Ham, S.-H.; Radkevich, A.; Thorsen, T.J.; Viudez-Mora, A.; Fillmore, D.; Huang, X. Uncertainty in satellite-derived surface irradiances and challenges in producing surface radiation budget climate data record. Remote Sens. 2020, 12, 1950. [Google Scholar] [CrossRef]
  10. Tedetti, M.; Sempéré, R. Penetration of ultraviolet radiation in the marine environment. A review. Photochem. Photobiol. 2006, 82, 389–397. [Google Scholar] [CrossRef]
  11. Black, P.G.; D’Asaro, E.A.; Drennan, W.M.; French, J.R.; Niiler, P.P.; Sanford, T.B.; Terrill, E.J.; Walsh, E.J.; Zhang, J.A. Air–Sea Exchange in Hurricanes: Synthesis of Observations from the Coupled Boundary Layer Air–Sea Transfer Experiment. Bull. Am. Meteorol. Soc. 2007, 88, 357–374. [Google Scholar] [CrossRef]
  12. Edson, J.B.; Jampana, V.; Weller, R.A.; Bigorre, S.P.; Plueddemann, A.J.; Fairall, C.W.; Miller, S.D.; Mahrt, L.; Vickers, D.; Hersbach, H. On the exchange of momentum over the open ocean. J. Phys. Oceanogr. 2013, 43, 1589–1610. [Google Scholar] [CrossRef]
  13. Emanuel, K. 100 years of progress in tropical cyclone research. Meteorol. Monogr. 2018, 59, 15.1–15.68. [Google Scholar] [CrossRef]
  14. Zhang, J.A.; Rogers, R.F.; Nolan, D.S.; Marks, F.D. On the characteristic height scales of the hurricane boundary layer. Mon. Weather Rev. 2011, 139, 2523–2535. [Google Scholar] [CrossRef]
  15. Hammer, A.; Heinemann, D.; Hoyer, C.; Kuhlemann, R.; Lorenz, E.; Müller, R.; Beyer, H.G. Solar energy assessment using remote sensing technologies. Remote Sens. Environ. 2003, 86, 423–432. [Google Scholar] [CrossRef]
  16. Jia, D.; Yang, L.; Gao, X.; Li, K. Assessment of a new solar radiation nowcasting method based on FY-4A satellite imagery, the McClear model and SHapley additive explanations (SHAP). Remote Sens. 2023, 15, 2245. [Google Scholar] [CrossRef]
  17. Omali, T.U. Review of Climate Change Assessment Using Solar Radiation Data from Satellite Remote Sensing. Int. J. Sci. Res. Multidiscip. Stud. 2023, 9, 1–10. [Google Scholar]
  18. Zhou, Y.; Liu, Y.; Wang, D.; Liu, X.; Wang, Y. A review on global solar radiation prediction with machine learning models in a comprehensive perspective. Energy Convers. Manag. 2021, 235, 113960. [Google Scholar] [CrossRef]
  19. Ohmura, A.; Dutton, E.G.; Forgan, B.; Frohlich, C.; Gilgen, H.; Hegner, H.; Heimo, A.; König-Langlo, G.; McArthur, B.; Muller, G.; et al. Baseline Surface Radiation Network (BSRN/WCRP): New precision radiometry for climate research. Bull. Am. Meteorol. Soc. 1998, 79, 2115–2136. [Google Scholar] [CrossRef]
  20. Du, Y.; Shi, H.; Zhang, J.; Xia, X.; Yao, Z.; Fu, D.; Hu, B.; Huang, C. Evaluation of MERRA-2 hourly surface solar radiation across China. Sol. Energy 2022, 234, 103–110. [Google Scholar] [CrossRef]
  21. Shi, H.; Yang, D.; Wang, W.; Fu, D.; Gao, L.; Zhang, J.; Hu, B.; Shan, Y.; Zhang, Y.; Bian, Y.; et al. First estimation of high-resolution solar photovoltaic resource maps over China with Fengyun-4A satellite and machine learning. Renew. Sustain. Energy Rev. 2023, 184, 113549. [Google Scholar] [CrossRef]
  22. Xiang, C.; Qian, C. Application of ocean-based observation data on improving tropical cyclone intensity analysis over the South China Sea. J. Mar. Meteorol. 2018, 38, 20–27. [Google Scholar]
  23. Yuan, S.; Li, Y.; Bao, F.; Xu, H.; Yang, Y.; Yan, Q.; Zhong, S.; Yin, H.; Xu, J.; Huang, Z.; et al. Marine environmental monitoring with unmanned vehicle platforms: Present applications and future prospects. Sci. Total. Environ. 2022, 858, 159741. [Google Scholar] [CrossRef] [PubMed]
  24. O’Carroll, A.G.; Armstrong, E.M.; Beggs, H.M.; Bouali, M.; Casey, K.S.; Corlett, G.K.; Dash, P.; Donlon, C.J.; Gentemann, C.L.; Høyer, J.L.; et al. Observational needs of sea surface temperature. Front. Mar. Sci. 2019, 6, 00420. [Google Scholar] [CrossRef]
  25. García-Sánchez, G.; Mancho, A.M.; Ramos, A.G.; Coca, J.; Pérez-Gómez, B.; Álvarez-Fanjul, E.; Sotillo, M.G.; García-León, M.; García-Garrido, V.J.; Wiggins, S. Very high resolution tools for the monitoring and assessment of environmental hazards in coastal areas. Front. Mar. Sci. 2021, 7, 605804. [Google Scholar] [CrossRef]
  26. Ding, M.; Zou, X.; Sun, Q.; Yang, D.; Zhang, W.; Bian, L.; Lu, C.; Allison, I.; Heil, P.; Xiao, C. The PANDA automatic weather station network between the coast and Dome A, East Antarctica. Earth Syst. Sci. Data 2022, 14, 5019–5035. [Google Scholar] [CrossRef]
  27. Kao, S.-L.; Chang, K.-Y.; Hsu, T.-W. A marine GIS-based alert system to prevent vessels collision with offshore platforms. J. Mar. Sci. Technol. 2021, 29, 597–608. [Google Scholar] [CrossRef]
  28. Ma, J.; Bai, R.; Shen, H.; Ding, J.; Wang, H.; Sun, Q. Design and Application of Buoy-Based Automatic Weather Station for Arctic. In Proceedings of the 2024 Academic Conference of China Instrument and Control Society (ACCIS), Chengdu, China, 28–31 July 2024; pp. 262–266. [Google Scholar]
  29. Holthuijsen, L.H.; Powell, M.D.; Pietrzak, J.D. Wind and waves in extreme hurricanes. J. Geophys. Res. Oceans 2012, 117. [Google Scholar] [CrossRef]
  30. Lenan, L.; Melville, W.K. Autonomous surface vehicle measurements of the ocean’s response to tropical cyclone Freda. J. Atmos. Ocean. Technol. 2014, 31, 2169–2190. [Google Scholar] [CrossRef]
  31. Rosa, T.L.; Piecho-Santos, A.M.; Vettor, R.; Soares, C.G. Review and prospects for autonomous observing systems in vessels of opportunity. J. Mar. Sci. Eng. 2021, 9, 366. [Google Scholar] [CrossRef]
  32. Johnson, G.; Dykstra, K.; Ordell, S.; Tetreault, B.; Kohlmann, K. Improving Meteorological Models Using Ships’ Weather Data Communicated via AIS. In Proceedings of the 34th International Technical Meeting of the Satellite Division of The Institute of Navigation (ION GNSS+ 2021), St. Louis, MO, USA, 20–24 September 2021; pp. 485–501. [Google Scholar]
  33. Yang, L.; Wang, D.; Huang, J.; Wang, X.; Zeng, L.; Shi, R.; He, Y.; Xie, Q.; Wang, S.; Chen, R.; et al. Toward a Mesoscale Hydrological and Marine Meteorological Observation Network in the South China Sea. Bull. Am. Meteorol. Soc. 2015, 96, 1117–1135. [Google Scholar] [CrossRef]
  34. Xiaotu, L.; Xuefen, Z.; Wansuo, D.; Hong, L.; Zhiqiu, G.; Chuanhai, Q.; Bingke, Z.; Jie, T. Experiment on coordinated observation of offshore typhoon in China. Adv. Earth Sci. 2019, 34, 671–678. [Google Scholar]
  35. Wu, J.; Li, R.; Li, J.; Zou, M.; Huang, Z. Cooperative unmanned surface vehicles and unmanned aerial vehicles platform as a tool for coastal monitoring activities. Ocean Coast. Manag. 2022, 232, 106421. [Google Scholar] [CrossRef]
  36. Yaakob, O.; Mohamed, Z.; Hanafiah, M.S.; Suprayogi, D.; Abdul Ghani, M.; Adnan, F.; Mukti, M.; Din, J. Development of unmanned surface vehicle (USV) for sea patrol and environmental monitoring. In Proceedings of the International Conference on Marine Technology, Harbin, China, 25–28 June 2012; pp. 20–22. [Google Scholar]
  37. Kum, B.-C.; Shin, D.-H.; Lee, J.H.; Moh, T.; Jang, S.; Lee, S.Y.; Cho, J.H. Monitoring applications for multifunctional unmanned surface vehicles in marine coastal environments. J. Coast. Res. 2018, 85, 1381–1385. [Google Scholar] [CrossRef]
  38. Jorge, V.A.M.; Granada, R.; Maidana, R.G.; Jurak, D.A.; Heck, G.; Negreiros, A.P.F.; dos Santos, D.H.; Gonçalves, L.M.G.; Amory, A.M. A survey on unmanned surface vehicles for disaster robotics: Main challenges and directions. Sensors 2019, 19, 702. [Google Scholar] [CrossRef] [PubMed]
  39. Bae, I.; Hong, J. Survey on the developments of unmanned marine vehicles: Intelligence and cooperation. Sensors 2023, 23, 4643. [Google Scholar] [CrossRef]
  40. Wang, L.; Li, H.; Lin, J.; Yan, X.; Lu, G.; Wu, S.; Peng, W. Vibration Energy Harvesting from an Unmanned Surface Vehicle: Concept Design and Open Sea Tests. SSRN Electron. J. 2023, 222, 119895. [Google Scholar] [CrossRef]
  41. Wang, L.; Peng, W.; Huang, D.; Lin, J.; Huang, T. Data-Driven Modelling On Power Generation Of Wave-Powered USV. Ocean Eng. 2023, 291, 116477. [Google Scholar] [CrossRef]
  42. Chen, H.; Li, J.; Xuan, Y.; Huang, X.; Zhu, W.; Zhu, K.; Shao, W. First Rocketsonde Launched from an Unmanned Semi-submersible Vehicle. Adv. Atmospheric Sci. 2019, 36, 339–345. [Google Scholar] [CrossRef]
  43. Chen, H.; Li, J.; Ma, S.; Hu, S. Progress of the marine meteorological observation technologies. Sci. Tech. Rev. 2019, 37, 91–97. [Google Scholar]
  44. Chen, H.; Li, J.; He, W.; Ma, S.; Wei, Y.; Pan, J.; Zhao, Y.; Zhang, X.; Hu, S. IAP’s Solar-Powered Unmanned Surface Vehicle Actively Passes through the Center of typhoon Sinlaku (2020). Adv. Atmospheric Sci. 2021, 38, 538–545. [Google Scholar] [CrossRef]
  45. Zhang, X.; Li, L.; Yang, R.; Guo, R.; Sun, X.; Luo, J.; Chen, H.; Liu, D.; Tang, K.; Peng, W.; et al. Comprehensive Marine Observing Experiment Based on High-Altitude Large Unmanned Aerial Vehicle (South China Sea Experiment 2020 of the “Petrel Project”). Adv. Atmospheric Sci. 2021, 38, 531–537. [Google Scholar] [CrossRef]
  46. Li, C.; Wang, X.; Zhu, L.; Liu, K.; Zong, C.; Wei, N.; Li, D. Enhanced impacts evaluation of Typhoon Sinlaku (2020) on atmospheric microplastics in South China Sea during the East Asian Summer Monsoon. Sci. Total. Environ. 2022, 806, 150767. [Google Scholar] [CrossRef] [PubMed]
  47. Liu, L.; Han, Y.; Xia, Y.; Guo, Q.; Gao, W.; Guo, J. Investigation of atmospheric dynamic and thermodynamic structures of typhoon sinlaku (2020) from high-resolution dropsonde and two-way rawinsonde measurements. Remote Sens. 2022, 14, 2704. [Google Scholar] [CrossRef]
  48. Zhang, C.; Foltz, G.R.; Chiodi, A.M.; Mordy, C.W.; Edwards, C.R.; Meinig, C.; Zhang, D.; Mazza, E.; Cokelet, E.D.; Burger, E.F.; et al. Hurricane Observations by Uncrewed Systems. Bull. Am. Meteorol. Soc. 2023, 104, E1893–E1917. [Google Scholar] [CrossRef]
  49. Allotta, B.; Bartolini, F.; Caiti, A.; Costanzi, R.; Di Corato, F.; Fenucci, D.; Gelli, J.; Guerrini, P.; Monni, N.; Munafò, A.; et al. Typhoon at CommsNet 2013: Ex-perimental Experience on AUV Navigation and Localization. IFAC Proc. Vol. 2014, 47, 3370–3375. [Google Scholar] [CrossRef]
  50. Specht, M.; Specht, C.; Lasota, H.; Cywiński, P. Assessment of the Steering Precision of a Hydrographic Unmanned Surface Vessel (USV) along Sounding Profiles Using a Low-Cost Multi-Global Navigation Satellite System (GNSS) Receiver Supported Autopilot. Sensors 2019, 19, 3939. [Google Scholar] [CrossRef]
  51. Riihimaki, L.D.; Cronin, M.F.; Acharya, R.; Anderson, N.; Augustine, J.A.; Balmes, K.A.; Berk, P.; Bozzano, R.; Bucholtz, A.; Connell, K.J.; et al. Ocean surface radiation measurement best practices. Front. Mar. Sci. 2024, 11, 1359149. [Google Scholar] [CrossRef]
  52. Long, C.N.; Shi, Y. An automated quality assessment and control algorithm for surface radiation measurements. Open Atmos. Sci. J. 2008, 2, 23–37. [Google Scholar] [CrossRef]
  53. Driemel, A.; Augustine, J.; Behrens, K.; Colle, S.; Cox, C.; Cuevas-Agulló, E.; Denn, F.M.; Duprat, T.; Fukuda, M.; Grobe, H.; et al. Baseline Surface Radiation Network (BSRN): Structure and data description (1992–2017). Earth Syst. Sci. Data 2018, 10, 1491–1501. [Google Scholar] [CrossRef]
  54. Gueymard, C.A.; Ruiz-Arias, J.A. Extensive worldwide validation and climate sensitivity analysis of direct irradiance predictions from 1-min global irradiance. Sol. Energy 2016, 128, 1–30. [Google Scholar] [CrossRef]
  55. García, R.D.; Cuevas, E.; Ramos, R.; Cachorro, V.E.; Redondas, A.; Moreno-Ruiz, J.A. Description of the Baseline Surface Radiation Network (BSRN) station at the Izaña Observatory (2009–2017): Measurements and quality control/assurance procedures. Geosci. Instrum. Methods Data Syst. 2019, 8, 77–96. [Google Scholar] [CrossRef]
  56. Da, C. Preliminary assessment of the Advanced Himawari Imager (AHI) measurement onboard Himawari-8 geostationary satellite. Remote Sens. Lett. 2015, 6, 637–646. [Google Scholar] [CrossRef]
  57. Okuyama, A.; Andou, A.; Date, K.; Hoasaka, K.; Mori, N.; Murata, H.; Tabata, T.; Takahashi, M.; Yoshino, R.; Bessho, K. Preliminary validation of Himawari-8/AHI navigation and calibration. Proc. SPIE 2015, 9607, 663–672. [Google Scholar]
  58. Zhu, Z.; Gu, J.; Xu, B.; Shi, C. Characterization of Himawari-8/AHI to Himawari-9/AHI infrared observations continuity. Int. J. Remote Sens. 2023, 45, 121–142. [Google Scholar] [CrossRef]
  59. Letu, H.; Ma, R.; Nakajima, T.Y.; Shi, C.; Hashimoto, M.; Nagao, T.M.; Baran, A.J.; Nakajima, T.; Xu, J.; Wang, T.; et al. Surface Solar Radiation Compositions Observed from Himawari-8/9 and Fengyun-4 Series. Bull. Amer. Meteor. Soc. 2023, 104, E1772–E1789. [Google Scholar] [CrossRef]
  60. Letu, H.; Nakajima, T.Y.; Wang, T.; Shang, H.; Ma, R.; Yang, K.; Baran, A.J.; Riedi, J.; Ishimoto, H.; Yoshida, M.; et al. A New Benchmark for Surface Radiation Products over the East Asia-Pacific Region Retrieved from the Himawari-8/AHI Next-Generation Geostationary Satellite. Bull. Amer. Meteor. Soc. 2022, 103, 1–40. [Google Scholar] [CrossRef]
  61. Knapp, K.R.; Kruk, M.C.; Levinson, D.H.; Diamond, H.J.; Neumann, C.J. The international best track archive for climate stewardship (IBTrACS) unifying tropical cyclone data. Bull. Amer. Meteor. Soc. 2010, 91, 363–376. [Google Scholar] [CrossRef]
  62. Ying, M.; Zhang, W.; Yu, H.; Lu, X.; Feng, J.; Fan, Y.; Zhu, Y.; Chen, D. An Overview of the China Meteorological Administration Tropical Cyclone Database. J. Atmos. Ocean. Technol. 2014, 31, 287–301. [Google Scholar] [CrossRef]
  63. Schreck, C.J.; Knapp, K.R.; Kossin, J.P. The impact of best track discrepancies on global tropical cyclone climatologies using IBTrACS. Mon. Weather. Rev. 2014, 142, 3881–3899. [Google Scholar] [CrossRef]
  64. Xu, Z.; Guo, J.; Zhang, G.; Ye, Y.; Zhao, H.; Chen, H. Global tropical cyclone size and intensity reconstruction dataset for 1959–2022 based on IBTrACS and ERA5 data. Earth Syst. Sci. Data 2024, 16, 5753–5766. [Google Scholar] [CrossRef]
  65. Levinson, D.H.; Knapp, K.; Kruk, M.C.; Kossin, J.P. The international best track archive for climate stewardship (IBTrACS) project: Overview of methods and indian ocean statistics. In Indian Ocean Tropical Cyclones and Climate Change; Charabi, Y., Ed.; Springer: Dordrecht, The Netherlands, 2010. [Google Scholar]
  66. Nordin, M.H.; Sharma, S.; Khan, A.; Gianni, M.; Rajendran, S.; Sutton, R. Collaborative Unmanned Vehicles for Inspection, Maintenance, and Repairs of Offshore Wind Turbines. Drones 2022, 6, 137. [Google Scholar] [CrossRef]
  67. Barreto, J.; Cajaíba, L.; Teixeira, J.B.; Nascimento, L.; Giacomo, A.; Barcelos, N.; Fettermann, T.; Martins, A. Drone-monitoring: Improving the detectability of threatened marine megafauna. Drones 2021, 5, 14. [Google Scholar] [CrossRef]
Figure 1. (a) The IAP’s SUSV’s tracking map during the South China Sea Typhoon Observation Experiment from 22 July to 4 August 2020. The map displays the SUSV track in yellow, while the tracks of Typhoon Sinlaku are shown in white. (b) The IAP’s SUSV conducted sea trials near Tanmen Port of Hainan Island in June 2020.
Drones 09 00395 g001
Figure 2. Time series of 1 min raw (blue lines) and 10 min (orange lines) averaged shortwave downward radiation (SWDR) from the SUSV during the typhoon from 31 July to 2 August 2020.
Drones 09 00395 g002
Figure 3. True-color images of Himawari-8 from 31 July to 2 August 2020 (left at 0800, middle at 1200, and right at 1600), featuring blue dots to denote the moving track of the SUSV. The zoomed-in area on the far right is a detailed view of the SUSV’s trajectory, with colors indicating different dates.
Drones 09 00395 g003
Figure 4. Wind data averaged with 1 min from the SUSV for three stages under typhoon conditions (31 July 2020, 1 August 2020, and 2 August 2020, respectively). The first row shows wind direction (red arrows), and the second row shows wind speed (in blue). The black star dots are the wind speed of Sinlaku from the International Best Track Archive for Climate Stewardship (IBTrACS). The right axes show the relative distance between the SUSV and Sinlaku (red lines). The location information was obtained from the IBTrACS.
Drones 09 00395 g004
Figure 5. Time series plots of shortwave downward radiation (SWDR) for the SUSV (blue lines) and Himawari-8 (orange lines) on (a) 31 July 2020, (b) 1 August 2020, and (c) 2 August 2020, respectively.
Drones 09 00395 g005
Figure 6. Scatterplot of shortwave downward radiation (SWDR) from the SUSV and Himawari-8 for the 31 July–2 August 2020 period from 8:00 to 17:00 local time. The black dashed line indicates the 1:1 line. The red line illustrates the linear regression outcome. The colors indicate the density of data points.
Drones 09 00395 g006
Table 1. Summary of observation platform for radiation and meteorological data collection.
PlatformsSensorsMeasured VariablesWeather ConditionsAdvantages/Limitations
Solar power USV
from this paper [44]
Pyranometer, automatic weather stationRadiation, temperature, humidity, etc.TyphoonTilts need be corrected
Saildrone [48]3D ultrasonic, GNSS, et al.Temperature, humidity, flux, etc.HurricaneTilts need be corrected
Autonomous underwater vehicle [49]Acoustic USBL systemsAcousticTyphoonSpace limited
USV [50]GNSSHumidityClear skyPower limited
Fixed towers [51]Pyranometer, automatic weather stationRadiation, temperature, humidity, etc.All conditionsNear shore
Buoys [51]Automatic weather stationTemperature, humidity, etc.All conditionsFixed location
Disclaimer/Publisher’s Note: The statements, opinions and data contained in all publications are solely those of the individual author(s) and contributor(s) and not of MDPI and/or the editor(s). MDPI and/or the editor(s) disclaim responsibility for any injury to people or property resulting from any ideas, methods, instructions or products referred to in the content.

