
Graph-Based Target Association for Multi-Drone Collaborative Perception Under Imperfect Detection Conditions

 ,
,
Abstract
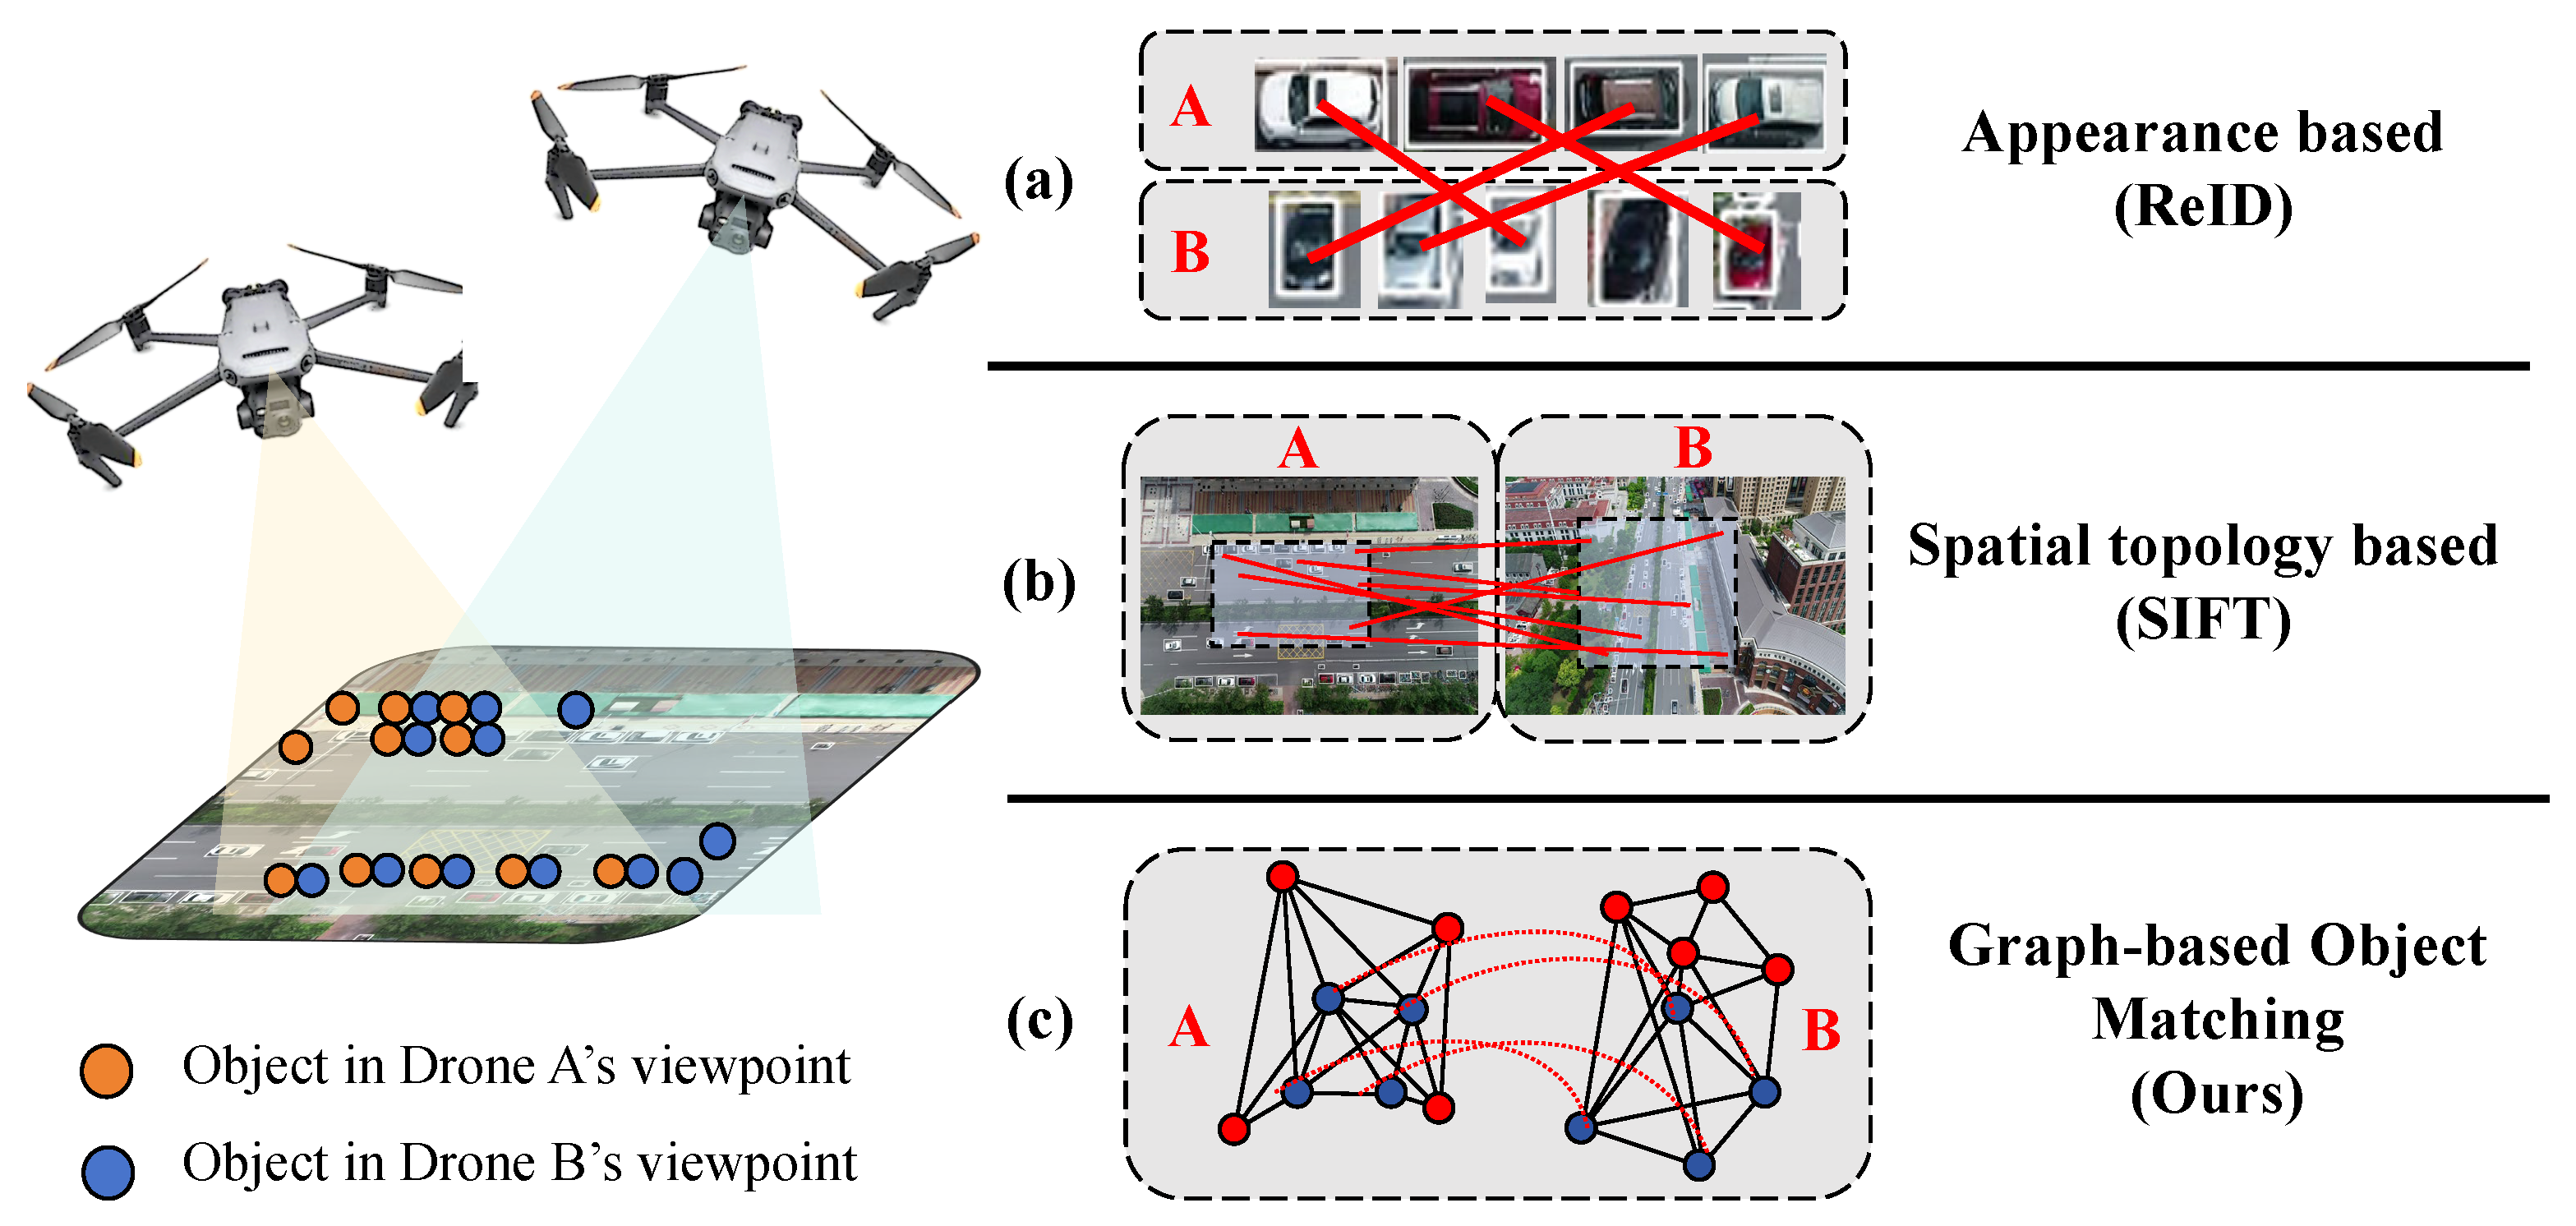
1. Introduction
2. Related Works
2.1. Multi-View Remote Sensing
2.2. Object Detection
2.3. Re-Identification
2.4. Multi-Camera Multi-Target Tracking
3. Method
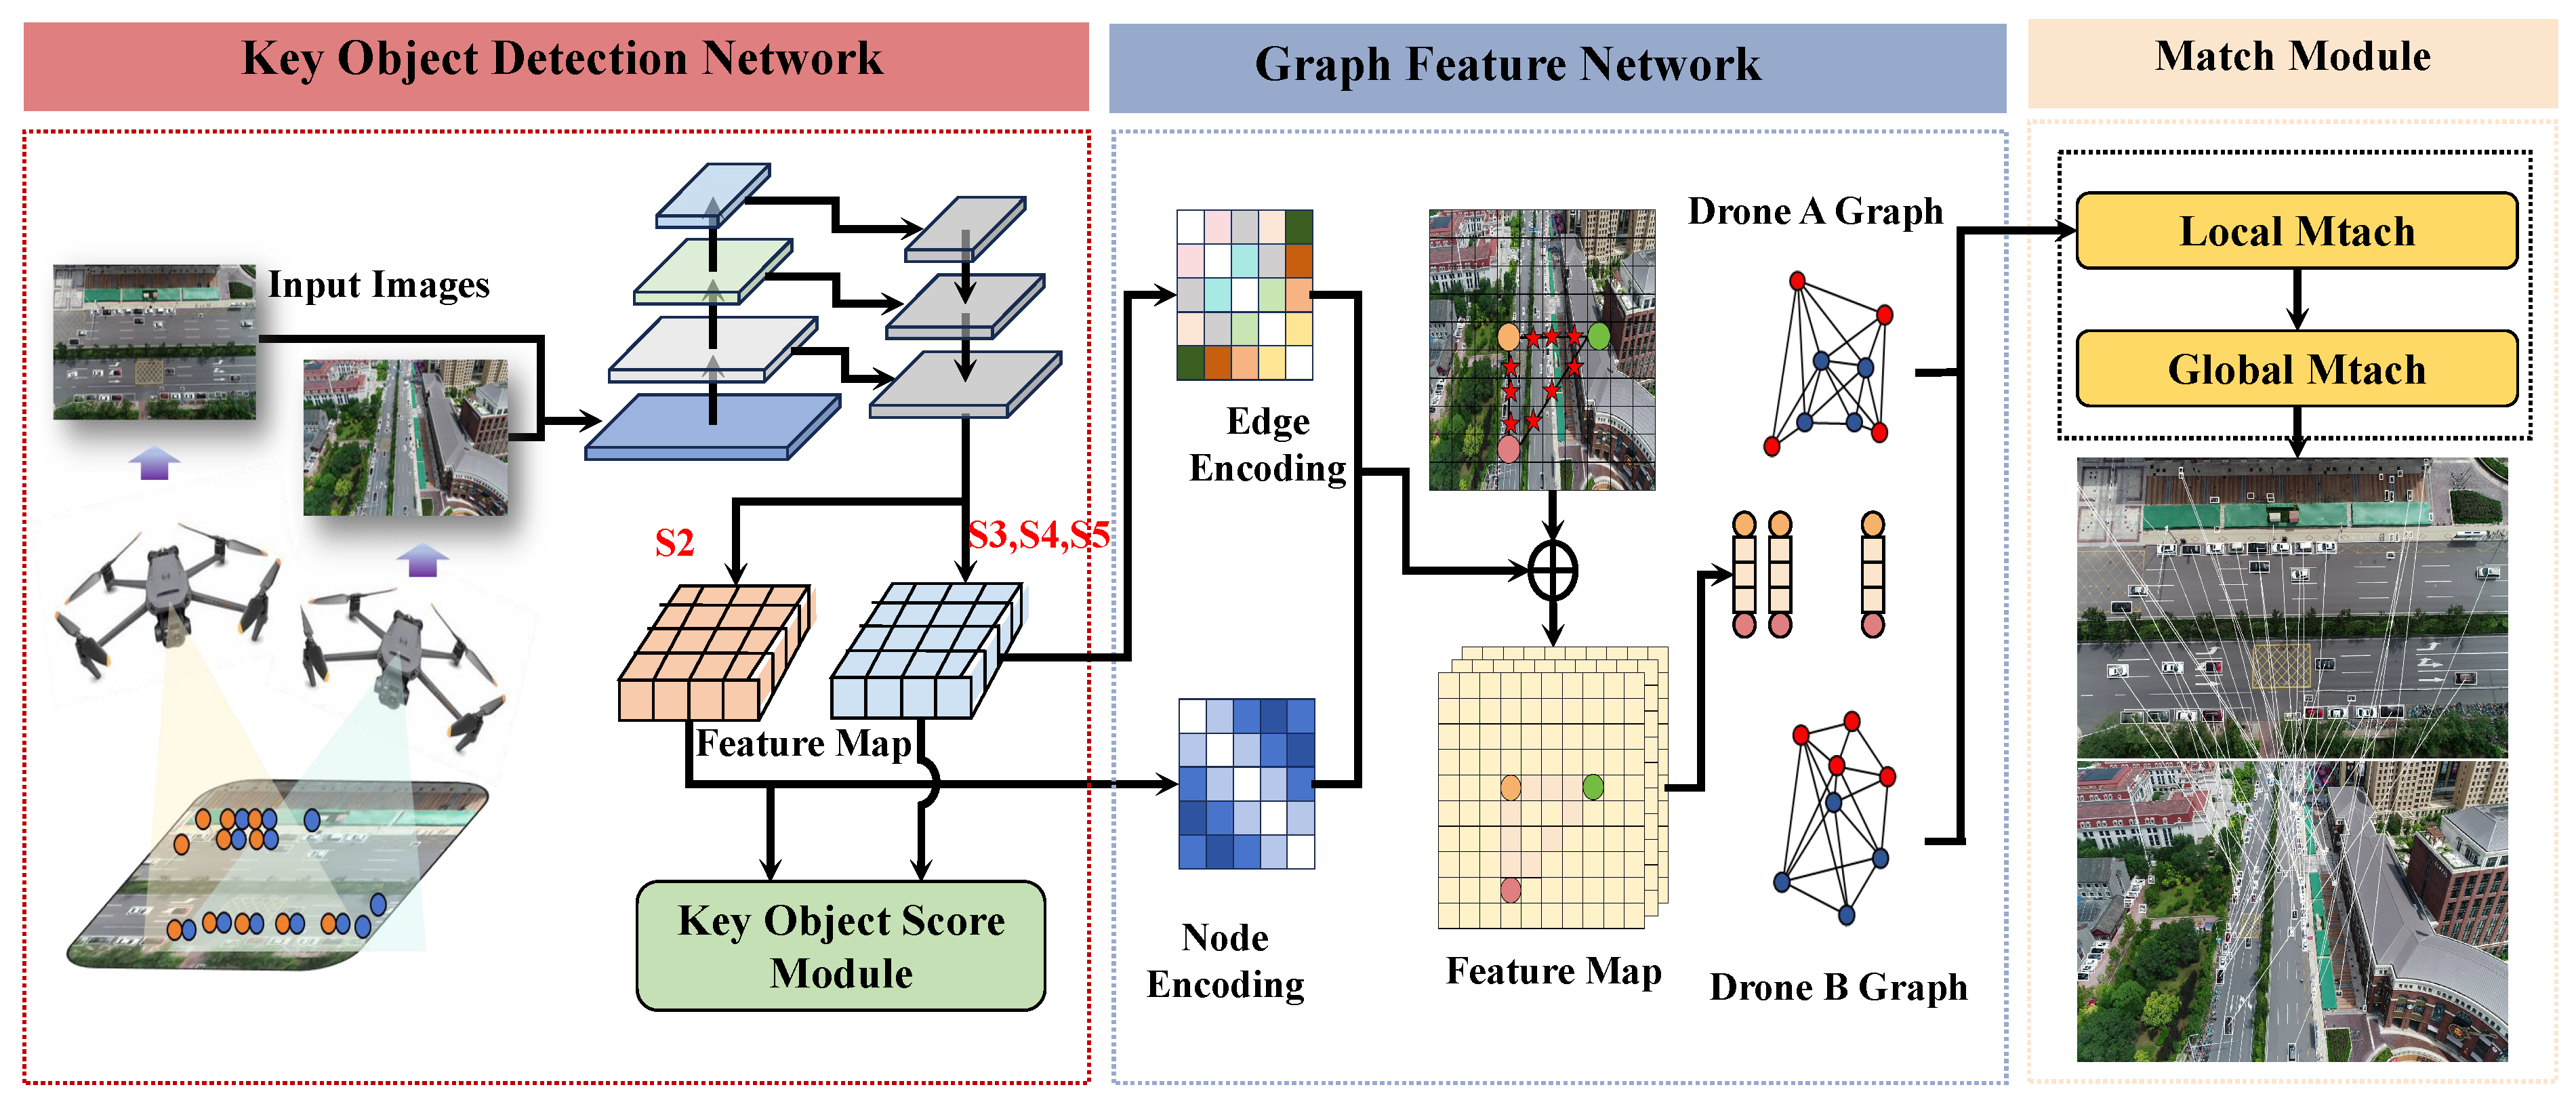
3.1. Overall Framework
3.2. Key Object Detection Network
3.3. Graph Feature Network
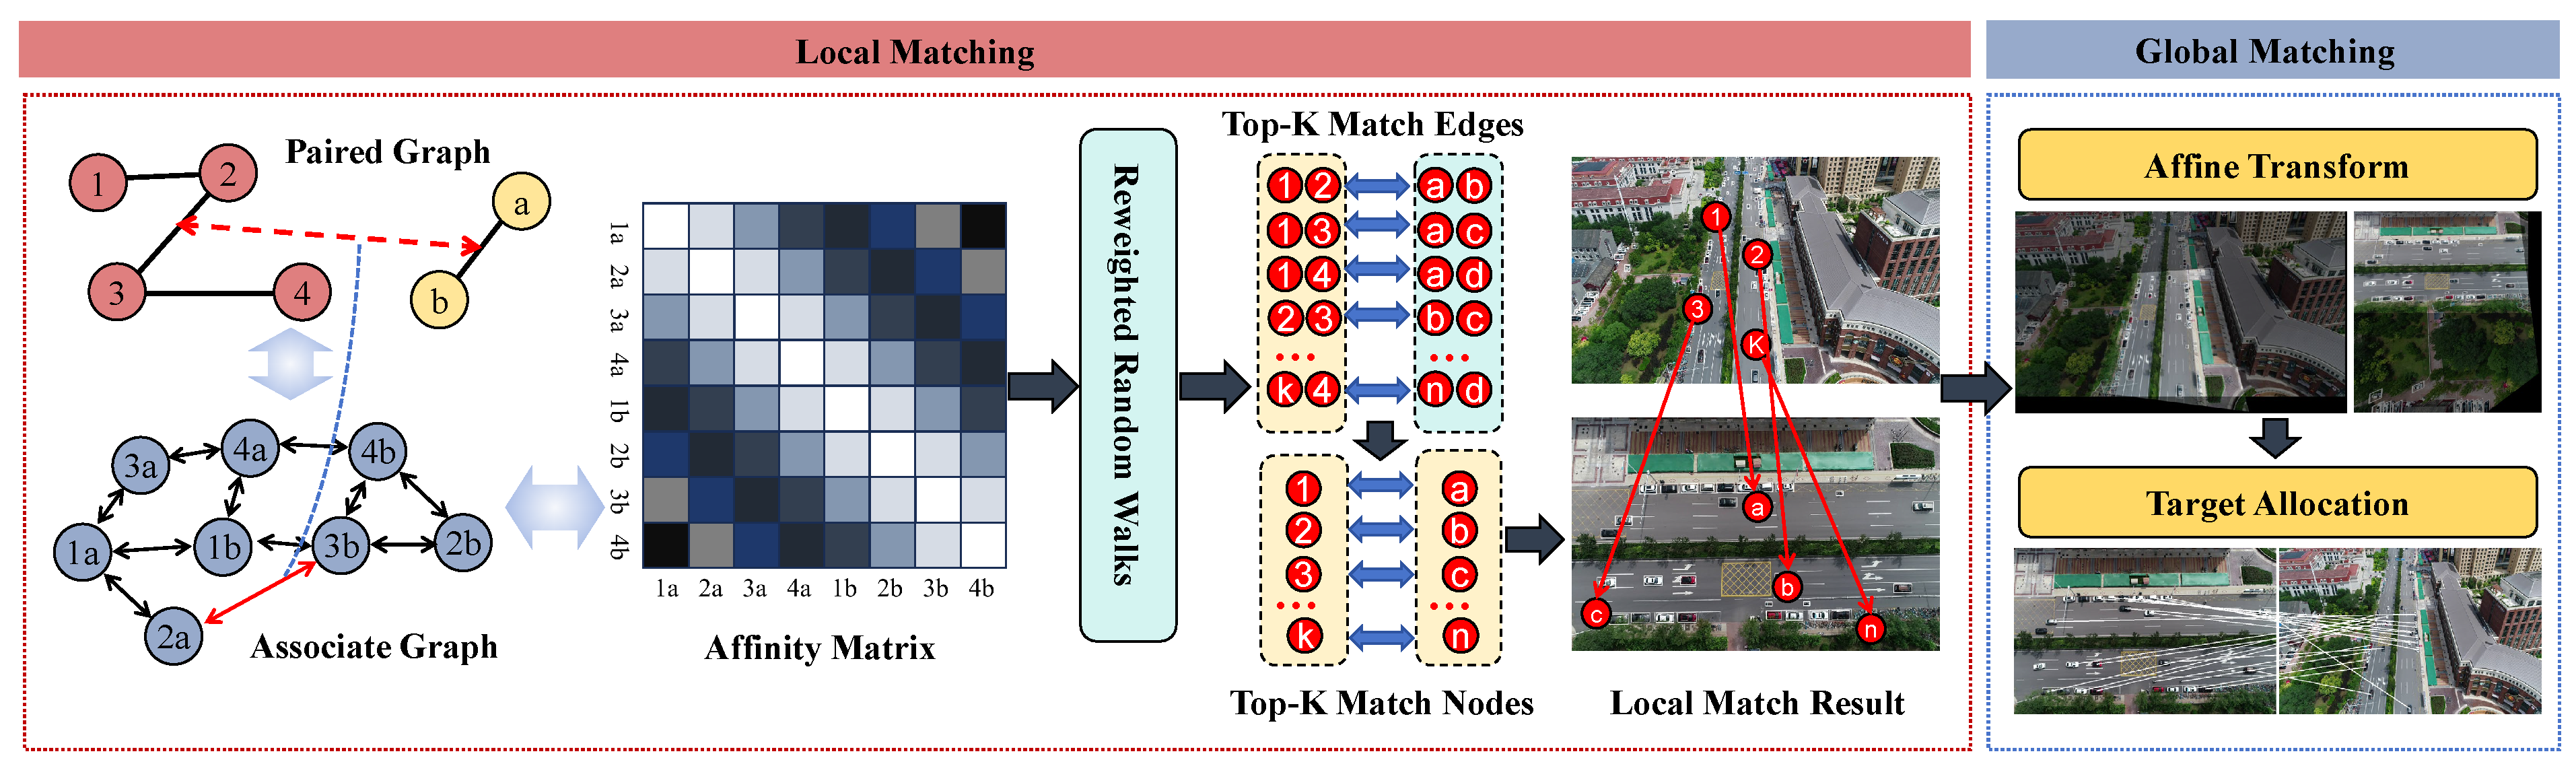
3.4. Match Module
4. Experiment
4.1. Experiment Implementation
4.2. Compared with Other Methods
4.3. Ablation Study
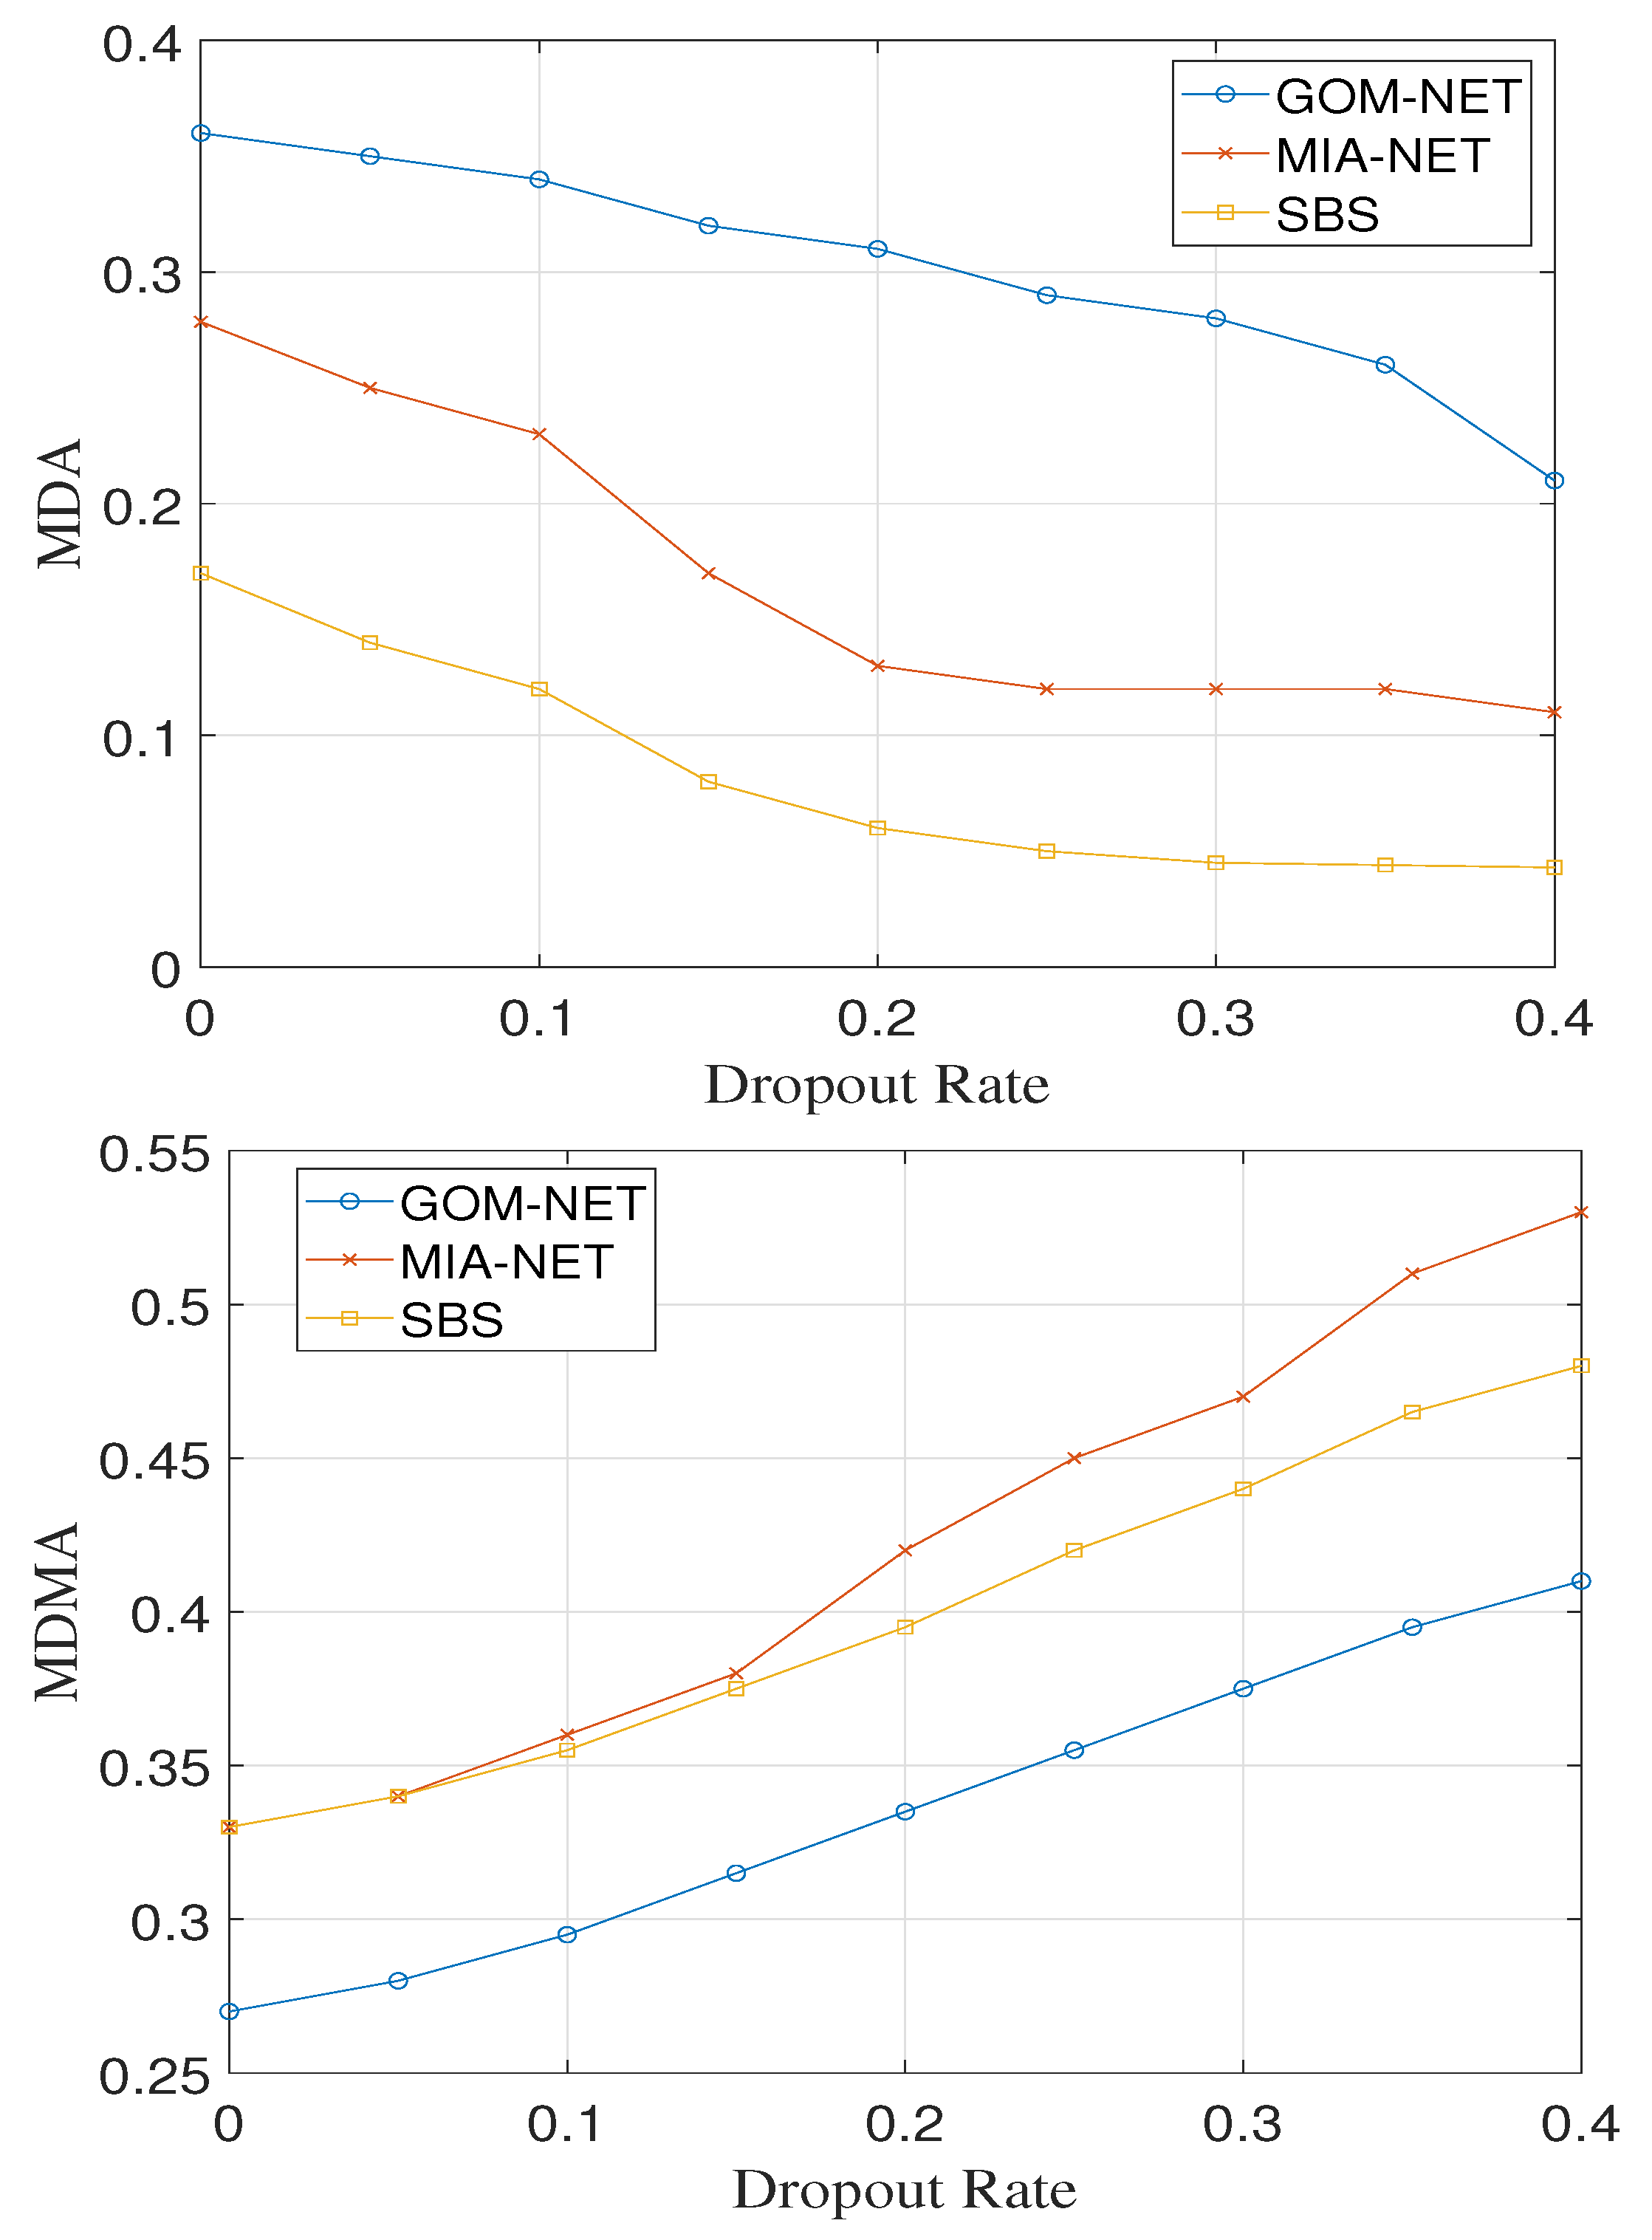
4.3.1. Ablation on Imperfect Detection
4.3.2. Ablation on Encoding Module
5. Conclusions
Author Contributions
Funding
Data Availability Statement
Conflicts of Interest
References
- Horyna, J.; Krátký, V.; Pritzl, V.; Báca, T.; Ferrante, E.; Saska, M. Fast Swarming of UAVs in GNSS-Denied Feature-Poor Environments Without Explicit Communication. IEEE Robotics Autom. Lett. 2024, 9, 5284–5291. [Google Scholar] [CrossRef]
- Humais, M.A.; Chehadeh, M.; Azzam, R.; Boiko, I.; Zweiri, Y.H. VisTune: Auto-Tuner for UAVs Using Vision-Based Localization. IEEE Robotics Autom. Lett. 2024, 9, 9111–9118. [Google Scholar] [CrossRef]
- Li, Q.; Yuan, H.; Fu, T.; Yu, Z.; Zheng, B.; Chen, S. Multispectral Semantic Segmentation for UAVs: A Benchmark Dataset and Baseline. IEEE Trans. Geosci. Remote. Sens. 2024, 62, 1–17. [Google Scholar] [CrossRef]
- Zhao, H.; Ren, K.; Yue, T.; Zhang, C.; Yuan, S. TransFG: A Cross-View Geo-Localization of Satellite and UAVs Imagery Pipeline Using Transformer-Based Feature Aggregation and Gradient Guidance. IEEE Trans. Geosci. Remote. Sens. 2024, 62, 1–12. [Google Scholar] [CrossRef]
- Xing, L.; Qu, H.; Xu, S.; Tian, Y. CLEGAN: Toward Low-Light Image Enhancement for UAVs via Self-Similarity Exploitation. IEEE Trans. Geosci. Remote. Sens. 2023, 61, 1–14. [Google Scholar] [CrossRef]
- Zhao, Y.; Su, Y. Estimation of Micro-Doppler Parameters With Combined Null Space Pursuit Methods for the Identification of LSS UAVs. IEEE Trans. Geosci. Remote. Sens. 2023, 61, 1–11. [Google Scholar] [CrossRef]
- Wang, X.; Huang, K.; Zhang, X.; Sun, H.; Liu, W.; Liu, H.; Li, J.; Lu, P. Path planning for air-ground robot considering modal switching point optimization. In Proceedings of the 2023 International Conference on Unmanned Aircraft Systems (ICUAS), Warsaw, Poland, 6–9 June 2023; pp. 87–94. [Google Scholar]
- Zhao, Y.; Su, Y. Sparse Recovery on Intrinsic Mode Functions for the Micro-Doppler Parameters Estimation of Small UAVs. IEEE Trans. Geosci. Remote. Sens. 2019, 57, 7182–7193. [Google Scholar] [CrossRef]
- Liu, X.; Qi, J.; Chen, C.; Bin, K.; Zhong, P. Relation-Aware Weight Sharing in Decoupling Feature Learning Network for UAV RGB-Infrared Vehicle Re-Identification. IEEE Trans. Multim. 2024, 26, 9839–9853. [Google Scholar] [CrossRef]
- Bouhlel, F.; Mliki, H.; Hammami, M. Person re-identification from UAVs based on Deep hybrid features: Application for intelligent video surveillance. Signal Image Video Process. 2024, 18, 8313–8326. [Google Scholar] [CrossRef]
- Li, W.; Chen, Q.; Gu, G.; Sui, X. Object matching of visible-infrared image based on attention mechanism and feature fusion. Pattern Recognit. 2025, 158, 110972. [Google Scholar] [CrossRef]
- Liu, Z.; Shang, Y.; Li, T.; Chen, G.; Wang, Y.; Hu, Q.; Zhu, P. Robust Multi-Drone Multi-Target Tracking to Resolve Target Occlusion: A Benchmark. IEEE Trans. Multim. 2023, 25, 1462–1476. [Google Scholar] [CrossRef]
- Bisio, I.; Garibotto, C.; Haleem, H.; Lavagetto, F.; Sciarrone, A. Vehicular/Non-Vehicular Multi-Class Multi-Object Tracking in Drone-Based Aerial Scenes. IEEE Trans. Veh. Technol. 2024, 73, 4961–4977. [Google Scholar] [CrossRef]
- Khan, M.U.; Dil, M.; Alam, M.Z.; Orakazi, F.A.; Almasoud, A.M.; Kaleem, Z.; Yuen, C. SafeSpace MFNet: Precise and Efficient MultiFeature Drone Detection Network. IEEE Trans. Veh. Technol. 2024, 73, 3106–3118. [Google Scholar] [CrossRef]
- Souli, N.; Kolios, P.; Ellinas, G. Multi-Agent System for Rogue Drone Interception. IEEE Robotics Autom. Lett. 2023, 8, 2221–2228. [Google Scholar] [CrossRef]
- Safa, A.; Verbelen, T.; Ocket, I.; Bourdoux, A.; Catthoor, F.; Gielen, G.G.E. Fail-Safe Human Detection for Drones Using a Multi-Modal Curriculum Learning Approach. IEEE Robotics Autom. Lett. 2022, 7, 303–310. [Google Scholar] [CrossRef]
- Huang, Y.; Liu, W.; Li, Y.; Yang, L.; Jiang, H.; Li, Z.; Li, J. MFE-SSNet: Multi-Modal Fusion-Based End-to-End Steering Angle and Vehicle Speed Prediction Network. Automot. Innov. 2024, 7, 1–14. [Google Scholar] [CrossRef]
- Wang, P.; Wang, Y.; Li, D. DroneMOT: Drone-based Multi-Object Tracking Considering Detection Difficulties and Simultaneous Moving of Drones and Objects. In Proceedings of the IEEE International Conference on Robotics and Automation, ICRA 2024, Yokohama, Japan, 13–17 May 2024; pp. 7397–7404. [Google Scholar]
- Ardö, H.; Nilsson, M.G. Multi Target Tracking from Drones by Learning from Generalized Graph Differences. In Proceedings of the 2019 IEEE/CVF International Conference on Computer Vision Workshops, ICCV Workshops 2019, Seoul, Republic of Korea, 27–28 October 2019; pp. 46–54. [Google Scholar]
- Cui, J.; Du, J.; Liu, W.; Lian, Z. TextNeRF: A Novel Scene-Text Image Synthesis Method based on Neural Radiance Fields. In Proceedings of the IEEE/CVF Conference on Computer Vision and Pattern Recognition, Seattle, WA, USA, 16–22 June 2024; pp. 22272–22281. [Google Scholar]
- Chen, L.; Liu, C.; Li, W.; Xu, Q.; Deng, H. DTSSNet: Dynamic Training Sample Selection Network for UAV Object Detection. IEEE Trans. Geosci. Remote. Sens. 2024, 62, 1–16. [Google Scholar] [CrossRef]
- Xu, J.; Fan, X.; Jian, H.; Xu, C.; Bei, W.; Ge, Q.; Zhao, T. YoloOW: A Spatial Scale Adaptive Real-Time Object Detection Neural Network for Open Water Search and Rescue From UAV Aerial Imagery. IEEE Trans. Geosci. Remote. Sens. 2024, 62, 1–15. [Google Scholar] [CrossRef]
- Zhang, X.; Gong, Y.; Lu, J.; Li, Z.; Li, S.; Wang, S.; Liu, W.; Wang, L.; Li, J. Oblique Convolution: A Novel Convolution Idea for Redefining Lane Detection. IEEE Trans. Intell. Veh. 2023, 9, 4025–4039. [Google Scholar] [CrossRef]
- Shi, X.; Yin, Z.; Han, G.; Liu, W.; Qin, L.; Bi, Y.; Li, S. BSSNet: A Real-Time Semantic Segmentation Network for Road Scenes Inspired from AutoEncoder. IEEE Trans. Circuits Syst. Video Technol. 2023, 34, 3424–3438. [Google Scholar] [CrossRef]
- Ren, S.; He, K.; Girshick, R.B.; Sun, J. Faster R-CNN: Towards Real-Time Object Detection with Region Proposal Networks. IEEE Trans. Pattern Anal. Mach. Intell. 2017, 39, 1137–1149. [Google Scholar] [CrossRef] [PubMed]
- Gong, Y.; Lu, J.; Liu, W.; Li, Z.; Jiang, X.; Gao, X.; Wu, X. Sifdrivenet: Speed and image fusion for driving behavior classification network. IEEE Trans. Comput. Soc. Syst. 2023, 11, 1244–1259. [Google Scholar] [CrossRef]
- Liu, W.; Lu, J.; Liao, J.; Qiao, Y.; Zhang, G.; Zhu, J.; Xu, B.; Li, Z. FMDNet: Feature-Attention-Embedding-Based Multimodal-Fusion Driving-Behavior-Classification Network. IEEE Trans. Comput. Soc. Syst. 2024, 11, 6745–6758. [Google Scholar] [CrossRef]
- Zhu, X.; Su, W.; Lu, L.; Li, B.; Wang, X.; Dai, J. Deformable detr: Deformable transformers for end-to-end object detection. arXiv 2020, arXiv:2010.04159. [Google Scholar]
- Liu, W.; Gong, Y.; Zhang, G.; Lu, J.; Zhou, Y.; Liao, J. GLMDriveNet: Global–local Multimodal Fusion Driving Behavior Classification Network. Eng. Appl. Artif. Intell. 2024, 129, 107575. [Google Scholar] [CrossRef]
- He, K.; Gkioxari, G.; Dollár, P.; Girshick, R.B. Mask R-CNN. IEEE Trans. Pattern Anal. Mach. Intell. 2020, 42, 386–397. [Google Scholar] [CrossRef]
- Redmon, J.; Divvala, S.K.; Girshick, R.B.; Farhadi, A. You Only Look Once: Unified, Real-Time Object Detection. In Proceedings of the 2016 IEEE Conference on Computer Vision and Pattern Recognition, CVPR 2016, Las Vegas, NV, USA, 27–30 June 2016; pp. 779–788. [Google Scholar]
- Redmon, J.; Farhadi, A. YOLO9000: Better, Faster, Stronger. arXiv 2016, arXiv:1612.08242. [Google Scholar]
- Redmon, J.; Farhadi, A. YOLOv3: An Incremental Improvement. arXiv 2018, arXiv:1804.02767. [Google Scholar]
- Gong, Y.; Lu, J.; Wu, J.; Liu, W. Multi-modal fusion technology based on vehicle information: A survey. arXiv 2022, arXiv:2211.06080. [Google Scholar]
- Yan, C.; Zhang, H.; Li, X.; Yuan, D. R-SSD: Refined single shot multibox detector for pedestrian detection. Appl. Intell. 2022, 52, 10430–10447. [Google Scholar] [CrossRef]
- Tan, Q.; Yang, X.; Qiu, C.; Jiang, Y.; He, J.; Liu, J.; Wu, Y. SCCMDet: Adaptive Sparse Convolutional Networks Based on Class Maps for Real-Time Onboard Detection in Unmanned Aerial Vehicle Remote Sensing Images. Remote Sens. 2024, 16, 1031. [Google Scholar] [CrossRef]
- Du, B.; Huang, Y.; Chen, J.; Huang, D. Adaptive Sparse Convolutional Networks with Global Context Enhancement for Faster Object Detection on Drone Images. In Proceedings of the IEEE/CVF Conference on Computer Vision and Pattern Recognition, Vancouver, BC, Canada, 17–24 June 2023; pp. 13435–13444. [Google Scholar]
- Ye, M.; Shen, J.; Lin, G.; Xiang, T.; Shao, L.; Hoi, S.C. Deep learning for person re-identification: A survey and outlook. IEEE Trans. Pattern Anal. Mach. Intell. 2021, 44, 2872–2893. [Google Scholar] [CrossRef]
- Ning, E.; Wang, C.; Zhang, H.; Ning, X.; Tiwari, P. Occluded person re-identification with deep learning: A survey and perspectives. Expert Syst. Appl. 2024, 239, 122419. [Google Scholar] [CrossRef]
- Gan, Y.; Liu, W.; Gan, J.; Zhang, G. A segmentation method based on boundary fracture correction for froth scale measurement. Appl. Intell. 2024, 1–22. [Google Scholar] [CrossRef]
- Li, Z.; Zhang, T.; Zhou, M.; Tang, D.; Zhang, P.; Liu, W.; Yang, Q.; Shen, T.; Wang, K.; Liu, H. MIPD: A Multi-sensory Interactive Perception Dataset for Embodied Intelligent Driving. arXiv 2024, arXiv:2411.05881. [Google Scholar]
- Wang, G.; Yuan, Y.; Chen, X.; Li, J.; Zhou, X. Learning Discriminative Features with Multiple Granularities for Person Re-Identification. In Proceedings of the 26th ACM international conference on Multimedia, New York, NY, USA, 22–26 October 2018. [Google Scholar]
- Luo, H.; Gu, Y.; Liao, X.; Lai, S.; Jiang, W. Bag of Tricks and A Strong Baseline for Deep Person Re-identification. arXiv 2019, arXiv:1903.07071. [Google Scholar]
- Zhang, Y.; Wang, C.; Wang, X.; Zeng, W.; Liu, W. FairMOT: On the Fairness of Detection and Re-identification in Multiple Object Tracking. Int. J. Comput. Vis. 2021, 129, 3069–3087. [Google Scholar] [CrossRef]
- Zhu, J.; Li, Q.; Gao, C.; Ge, Y.; Xu, K. Camera-aware re-identification feature for multi-target multi-camera tracking. Image Vis. Comput. 2024, 142, 104889. [Google Scholar] [CrossRef]
- Xu, Y.; Liu, X.; Liu, Y.; Zhu, S. Multi-view People Tracking via Hierarchical Trajectory Composition. In Proceedings of the 2016 IEEE Conference on Computer Vision and Pattern Recognition, CVPR 2016, Las Vegas, NV, USA, 27–30 June 2016; pp. 4256–4265. [Google Scholar]
- Sun, Y.; Cheng, C.; Zhang, Y.; Zhang, C.; Zheng, L.; Wang, Z.; Wei, Y. Circle Loss: A Unified Perspective of Pair Similarity Optimization. In Proceedings of the 2020 IEEE/CVF Conference on Computer Vision and Pattern Recognition, CVPR 2020, Seattle, WA, USA, 13–19 June 2020; pp. 6397–6406. [Google Scholar]
- Hermans, A.; Beyer, L.; Leibe, B. In Defense of the Triplet Loss for Person Re-Identification. arXiv 2017, arXiv:1703.07737. [Google Scholar]
- Bryan, B.; Gong, Y.; Zhang, Y.; Poellabauer, C. Second-Order Non-Local Attention Networks for Person Re-Identification. In Proceedings of the 2019 IEEE/CVF International Conference on Computer Vision, ICCV 2019, Seoul, Republic of Korea, 27 October–2 November 2019; pp. 3759–3768. [Google Scholar]
- Chen, T.; Ding, S.; Xie, J.; Yuan, Y.; Chen, W.; Yang, Y.; Ren, Z.; Wang, Z. ABD-Net: Attentive but Diverse Person Re-Identification. In Proceedings of the 2019 IEEE/CVF International Conference on Computer Vision, ICCV 2019, Seoul, Republic of Korea, 27 October–2 November 2019; pp. 8350–8360. [Google Scholar]
- He, L.; Liao, X.; Liu, W.; Liu, X.; Cheng, P.; Mei, T. FastReID: A Pytorch Toolbox for General Instance Re-identification. In Proceedings of the 31st ACM International Conference on Multimedia, MM 2023, Ottawa, ON, Canada, 29 October–3 November 2023; El-Saddik, A., Mei, T., Cucchiara, R., Bertini, M., Vallejo, D.P.T., Atrey, P.K., Hossain, M.S., Eds.; ACM: New York, NY, USA, 2023; pp. 9664–9667. [Google Scholar]

| Method | mAP0.5 of Drone A | mAP0.5 of Drone A | Total mAP0.5/% ↑ | FPS ↑ | MDMA ↓ | MDA ↑ |
|---|---|---|---|---|---|---|
| CAR | 53.19 | 49.90 | 51.21 | 1.92 | 0.41 | 0.12 |
| Circle Loss | 53.19 | 49.90 | 51.21 | 2.41 | 0.39 | 0.10 |
| SCAL | 53.19 | 49.90 | 51.21 | 1.92 | 0.37 | 0.11 |
| SONA | 53.19 | 49.90 | 51.21 | 0.72 | 0.38 | 0.11 |
| ABDNet | 53.19 | 49.90 | 51.21 | 1.92 | 0.38 | 0.13 |
| SpCL | 53.19 | 49.90 | 51.21 | 0.72 | 0.37 | 0.12 |
| MEB-Net | 53.19 | 49.90 | 51.21 | 1.92 | 0.36 | 0.13 |
| SBS | 53.19 | 49.90 | 51.21 | 4.81 | 0.33 | 0.17 |
| MIA-Net | 53.27 | 50.37 | 51.64 | 1.67 | 0.33 | 0.26 |
| GTA-Net (ours) | 53.34 | 50.63 | 52.98 | 4.06 | 0.27 | 0.37 |
| Node Encoding | Edge Encoding | Stage | MDMA ↓ | MDA ↑ |
|---|---|---|---|---|
| ✗ | ✗ | - | 0.35 | 0.26 |
| ✓ | ✗ | - | 0.30 | 0.31 |
| ✗ | ✓ | stage 2 | 0.32 | 0.32 |
| ✓ | ✓ | stage 2 | 0.27 | 0.37 |
| ✓ | ✓ | stage 3 | 0.26 | 0.33 |
| ✓ | ✓ | stage 4 | 0.24 | 0.31 |
| ✓ | ✓ | stage 5 | 0.24 | 0.29 |
Disclaimer/Publisher’s Note: The statements, opinions and data contained in all publications are solely those of the individual author(s) and contributor(s) and not of MDPI and/or the editor(s). MDPI and/or the editor(s) disclaim responsibility for any injury to people or property resulting from any ideas, methods, instructions or products referred to in the content. |
© 2025 by the authors. Licensee MDPI, Basel, Switzerland. This article is an open access article distributed under the terms and conditions of the Creative Commons Attribution (CC BY) license (https://creativecommons.org/licenses/by/4.0/).
Share and Cite
Tan, Q.; Yang, X.; Qiu, C.; Liu, W.; Li, Y.; Zou, Z.; Huang, J. Graph-Based Target Association for Multi-Drone Collaborative Perception Under Imperfect Detection Conditions. Drones 2025, 9, 300. https://doi.org/10.3390/drones9040300
Tan Q, Yang X, Qiu C, Liu W, Li Y, Zou Z, Huang J. Graph-Based Target Association for Multi-Drone Collaborative Perception Under Imperfect Detection Conditions. Drones. 2025; 9(4):300. https://doi.org/10.3390/drones9040300
Chicago/Turabian StyleTan, Qifan, Xuqi Yang, Cheng Qiu, Wenzhuo Liu, Yize Li, Zhengxia Zou, and Jing Huang. 2025. "Graph-Based Target Association for Multi-Drone Collaborative Perception Under Imperfect Detection Conditions" Drones 9, no. 4: 300. https://doi.org/10.3390/drones9040300
APA StyleTan, Q., Yang, X., Qiu, C., Liu, W., Li, Y., Zou, Z., & Huang, J. (2025). Graph-Based Target Association for Multi-Drone Collaborative Perception Under Imperfect Detection Conditions. Drones, 9(4), 300. https://doi.org/10.3390/drones9040300