Article

Optimal Coverage Path Planning for UAV-Assisted Multiple USVs: Map Modeling and Solutions

1
Key Laboratory of Micro-Inertial Instrument and Advanced Navigation Technology, Ministry of Education, School of Instrument Science and Engineering, Southeast University, Nanjing 210096, China
2
Purple Mountain Laboratories, Nanjing 211111, China
*
Author to whom correspondence should be addressed.
Drones 2025, 9(1), 30; https://doi.org/10.3390/drones9010030
Submission received: 11 November 2024 / Revised: 16 December 2024 / Accepted: 3 January 2025 / Published: 5 January 2025

Abstract

:
With the increasing demand for marine monitoring, the use of coverage path planning based on unmanned aerial vehicle (UAV) aerial images to assist multiple unmanned surface vehicles (USVs) has shown great potential in marine applications. However, achieving accurate map modeling and optimal path planning are still key challenges that restrict its widespread application. To this end, an innovative coverage path planning algorithm for UAV-assisted multiple USVs is proposed. First, a semantic segmentation algorithm based on the YOLOv5-assisted prompting segment anything model (SAM) is designed to establish an accurate map model. By refining the axial, length, width, and coordinate information of obstacles, the algorithm enables YOLOv5 to generate accurate object bounding box prompts and then assists SAM in automatically and accurately extracting obstacles and coastlines in complex scenes. Based on this accurate map model, a multi-objective stepwise optimization coverage path planning algorithm is further proposed. The algorithm divides the complete path into two parts, the straight paths and the turning paths, and both the path length and the number of turns is designed, respectively, to optimize each type of path step by step, which significantly improves the coverage effect. Experiments prove that in various complex marine coverage scenarios, the proposed algorithm achieves 100% coverage, the redundancy rate is less than 2%, and it is superior to existing advanced algorithms in path length and number of turns. This research provides a feasible technical solution for efficient and accurate marine coverage tasks and lays the foundation for unmanned marine supervision.

1. Introduction

An unmanned surface vehicle (USV) is a typical piece of marine intelligent equipment, characterized by its low cost, excellent maneuverability, and a high degree of autonomy and intelligence [1,2]. Equipped with advanced communication modules and sensors, a USV can undertake a variety of military or civilian marine monitoring tasks, such as offshore defense [3], marine surveying [4], and marine rescue [5]. Compared with a single USV, multiple USVs can perform coverage tasks more efficiently [6]. For example, in a rescue task, multiple USVs equipped with different devices can form a rescue formation, which not only ensures the completeness of the USV rescue system but also improves the probability of locating targets. Therefore, the multiple USVs system, which is more reliable and flexible, is becoming an increasingly important research focus in the field of unmanned marine equipment [7].
Coverage path planning (CPP) is the key for multiple USVs in performing marine monitoring tasks [8,9]. The CPP of multiple USVs can be described as follows: based on a known map model, multiple USVs start from an initial point and navigate through the entire task region except for obstacles, while striving to optimize objectives, such as minimizing time, reducing redundant paths, and maximizing coverage rate [10,11]. Therefore, the CPP of multiple USVs usually needs to solve two core issues: (1) establishing an accurate map model; and (2) designing an efficient and reasonable coverage path.
For map modeling, multiple USVs can acquire global maps in various ways, including satellite remote sensing images [12,13], static electronic maps [14,15], and unmanned aerial vehicle (UAV) aerial images [16]. Satellite remote sensing images cover a wide area and provide long-term historical data, which is helpful for analyzing changes in the marine environment. However, such images usually have a low resolution, and their data update frequency is limited due to satellite orbit constraints. In contrast, static electronic maps have a higher resolution, but they also suffer from a low update frequency, making them unable to reflect real-time changes in the marine environment. On the other hand, UAVs can rapidly acquire and update data, making them well-suited to the dynamic changes of the sea surface environment. Additionally, UAVs can be flexibly deployed to different flight areas and altitudes for targeted aerial photography according to specific mission requirements. Therefore, considering the image resolution, real-time performance, and flexibility, UAV aerial image-assisted coverage path planning for multiple USVs is regarded as the optimal choice [17].
The coverage path planning of multiple USVs is divided into two categories: centralized coverage [18] and decentralized coverage [19,20,21]. As a whole-unit planning method, centralized coverage can significantly simplify task management complexity and enhances formation coordination efficiency, especially in scenarios where the coverage area is complete and continuous. For example, the centralized coverage enables unified planning of USV trajectories, transforming multi-vessel collaborative operations into a single “overall mission” and effectively mitigating resource allocation conflicts. However, in complex local environments, the lack of fine-grained control over individual USVs may reduce coverage precision. Additionally, its heavy reliance on robust communication networks can result in performance degradation under signal-constrained conditions. In contrast, the decentralized coverage involves two steps: first, the target region needs to be divided into different sub-regions according to the requirements of the marine coverage task; second, USVs are guided to specific sub-regions for individual path planning, considering the differences between the USVs. It gives each USV greater autonomy by breaking the task down into individual autonomous units, enabling more precise control and local optimization in complex environments. However, decentralized coverage faces challenges in task management due to increased complexity, and in scenarios requiring coordinated continuous coverage, the absence of overall system-wide coordination may lead to inefficiencies. This is particularly evident in offshore areas where the coverage demands are often consistent and contiguous, making it difficult for decentralized methods to fully capitalize on their potential for local optimization.
In this paper, UAV aerial images are utilized to assist in map modeling, and centralized coverage is used as the foundational framework of the multiple USVs coverage path planning algorithm. However, as illustrated in Figure 1, in offshore monitoring areas with a variety of complex coastlines, there are still two critical challenges to be solved in the map modeling and centralized coverage path planning:
(1) 
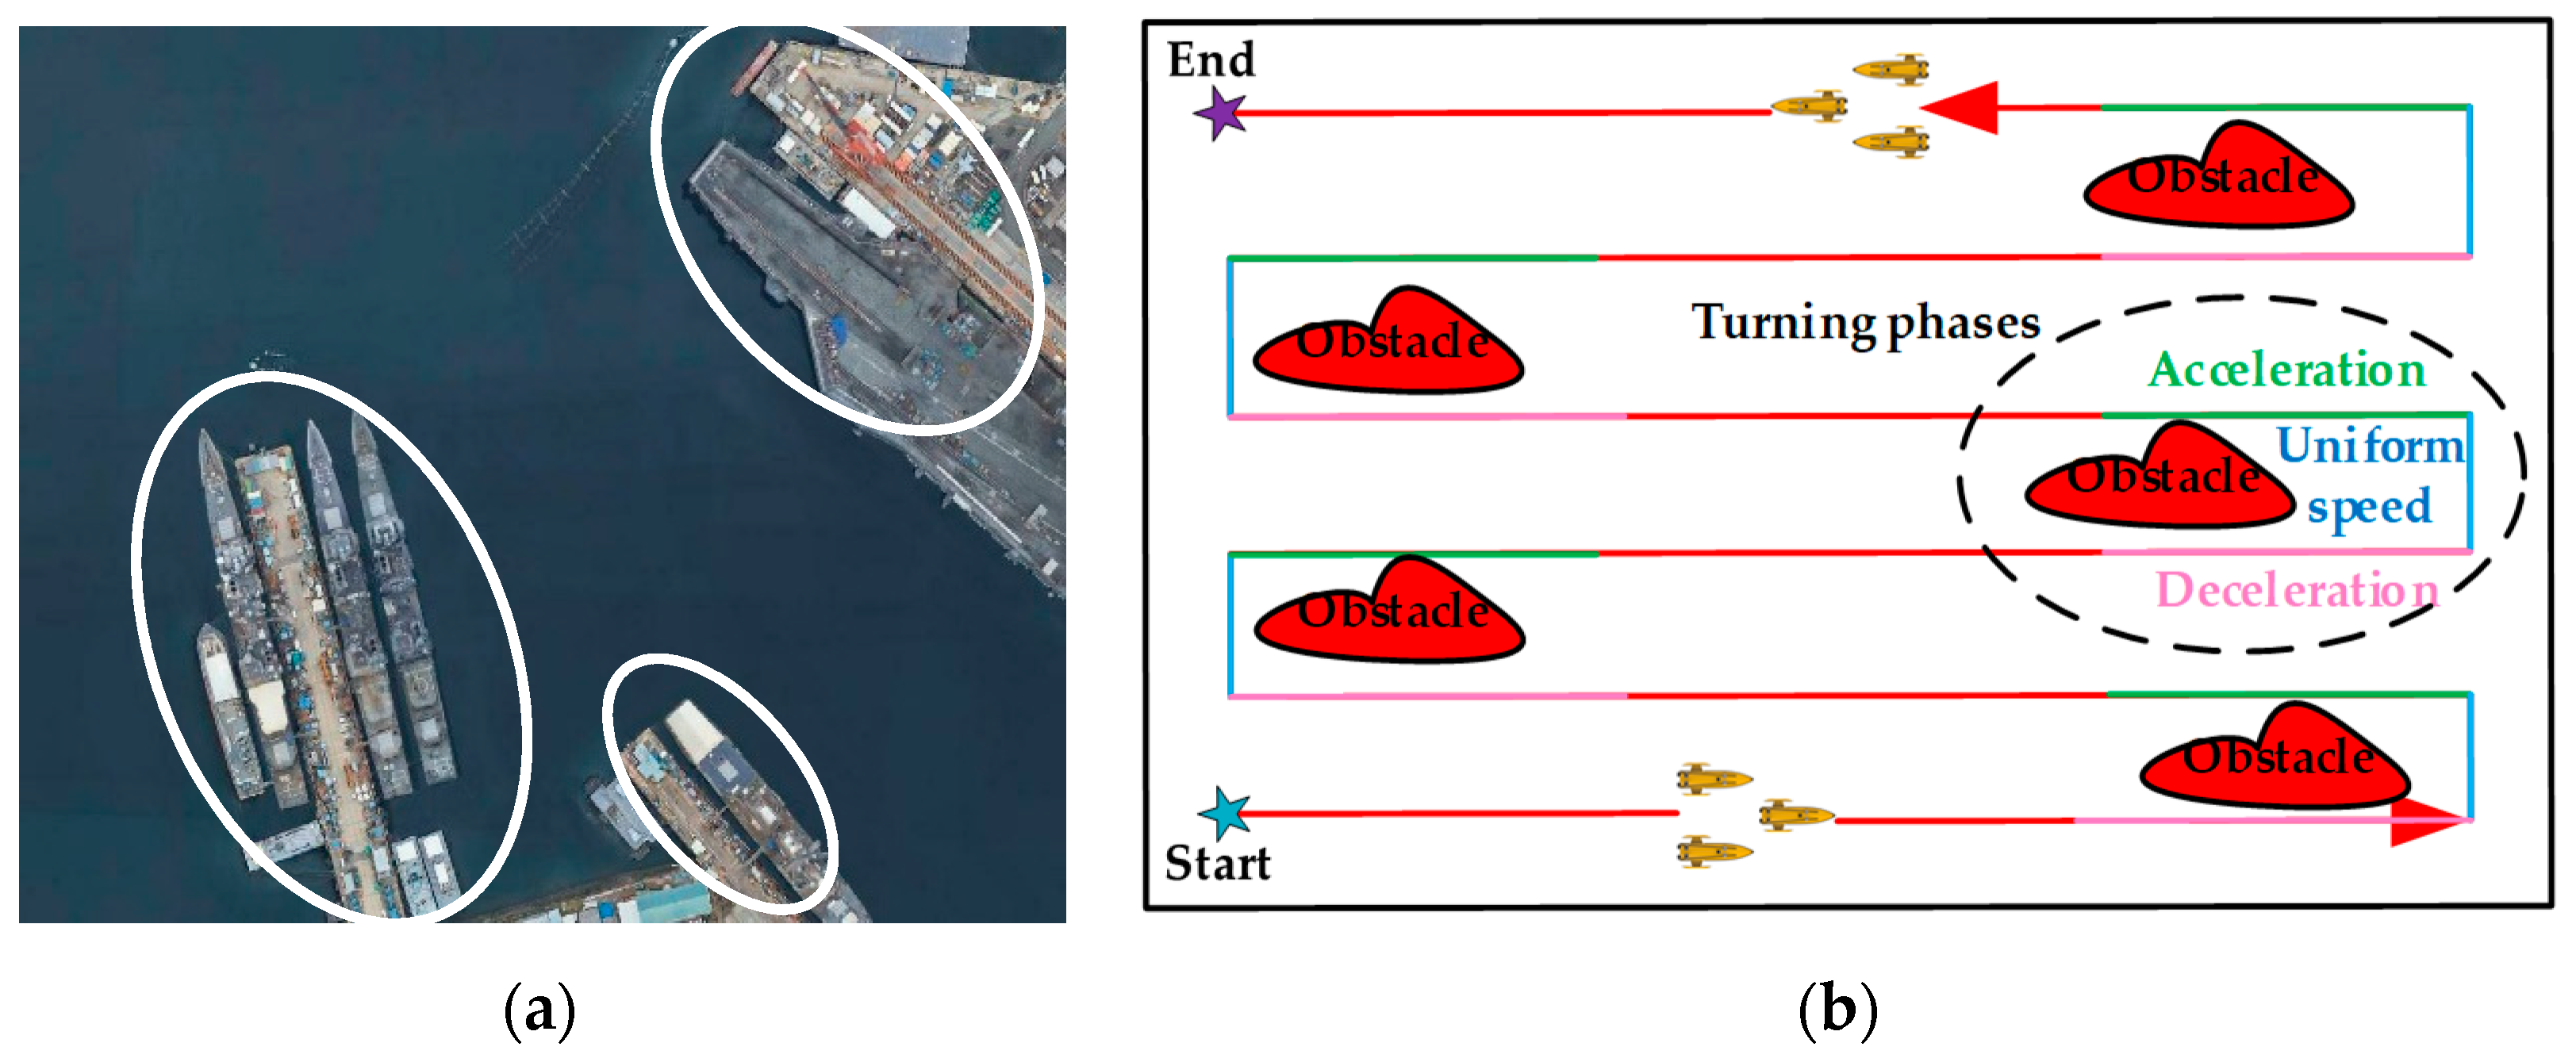
Obstacle extraction and accurate mapping: UAV aerial images often contain static obstacles, such as coastlines with complex shapes and small-scale cargo ships with similar appearances. Traditional map modeling methods struggle to ensure the accurate extraction of these challenging obstacles.
(2) 
Impact of turns on coverage efficiency: Obstacles can interrupt the straight paths of multiple USVs, significantly increasing the number of turns required. Each turn forces the USV to undergo a “deceleration–uniform speed–acceleration” motion phase, during which it must overcome inertia and water flow resistance. Consequently, more frequent turns lead to additional power consumption. However, current commonly used CPP algorithms only take path length and time as optimization objectives, and do not consider the influence of turns on the overall coverage efficiency.
To address the challenges, an optimal coverage path planning algorithm for UAV-assisted multiple USVs is proposed. Firstly, to establish an accurate map model, the automatic obstacle extraction of UAV aerial images is performed by utilizing an optimized segment anything model (SAM). Then, the number of turns and the path length are introduced to optimize the coverage path step by step. Finally, a sea-surface coverage operation system involving UAVs and USVs is constructed.
The contributions of this work are as follows:
(1)
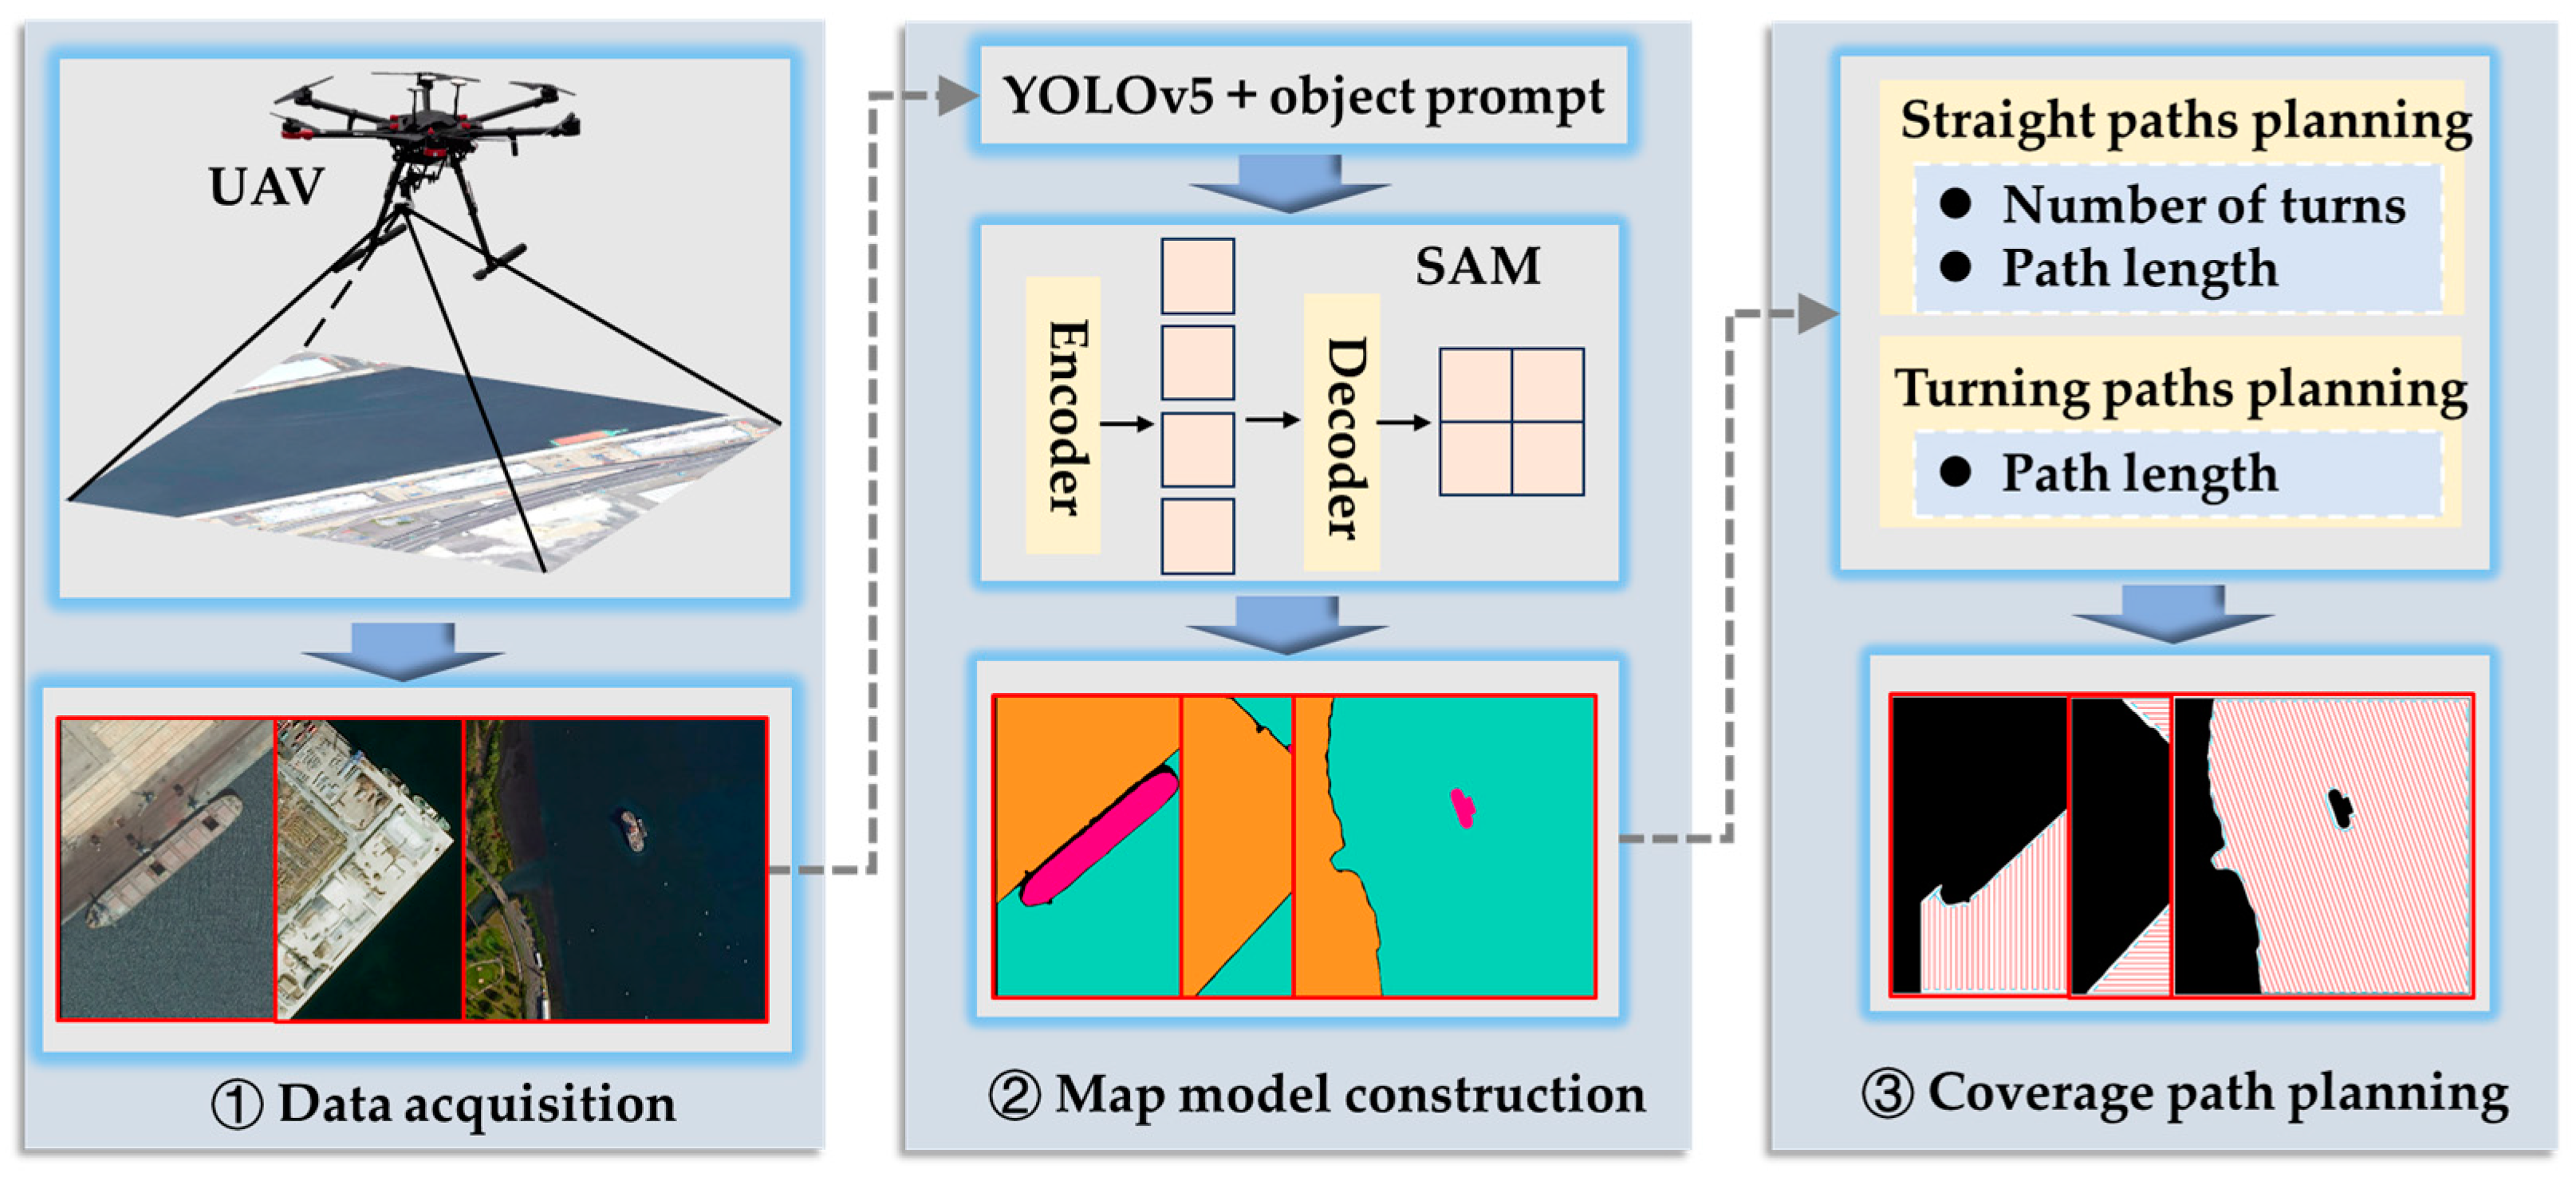
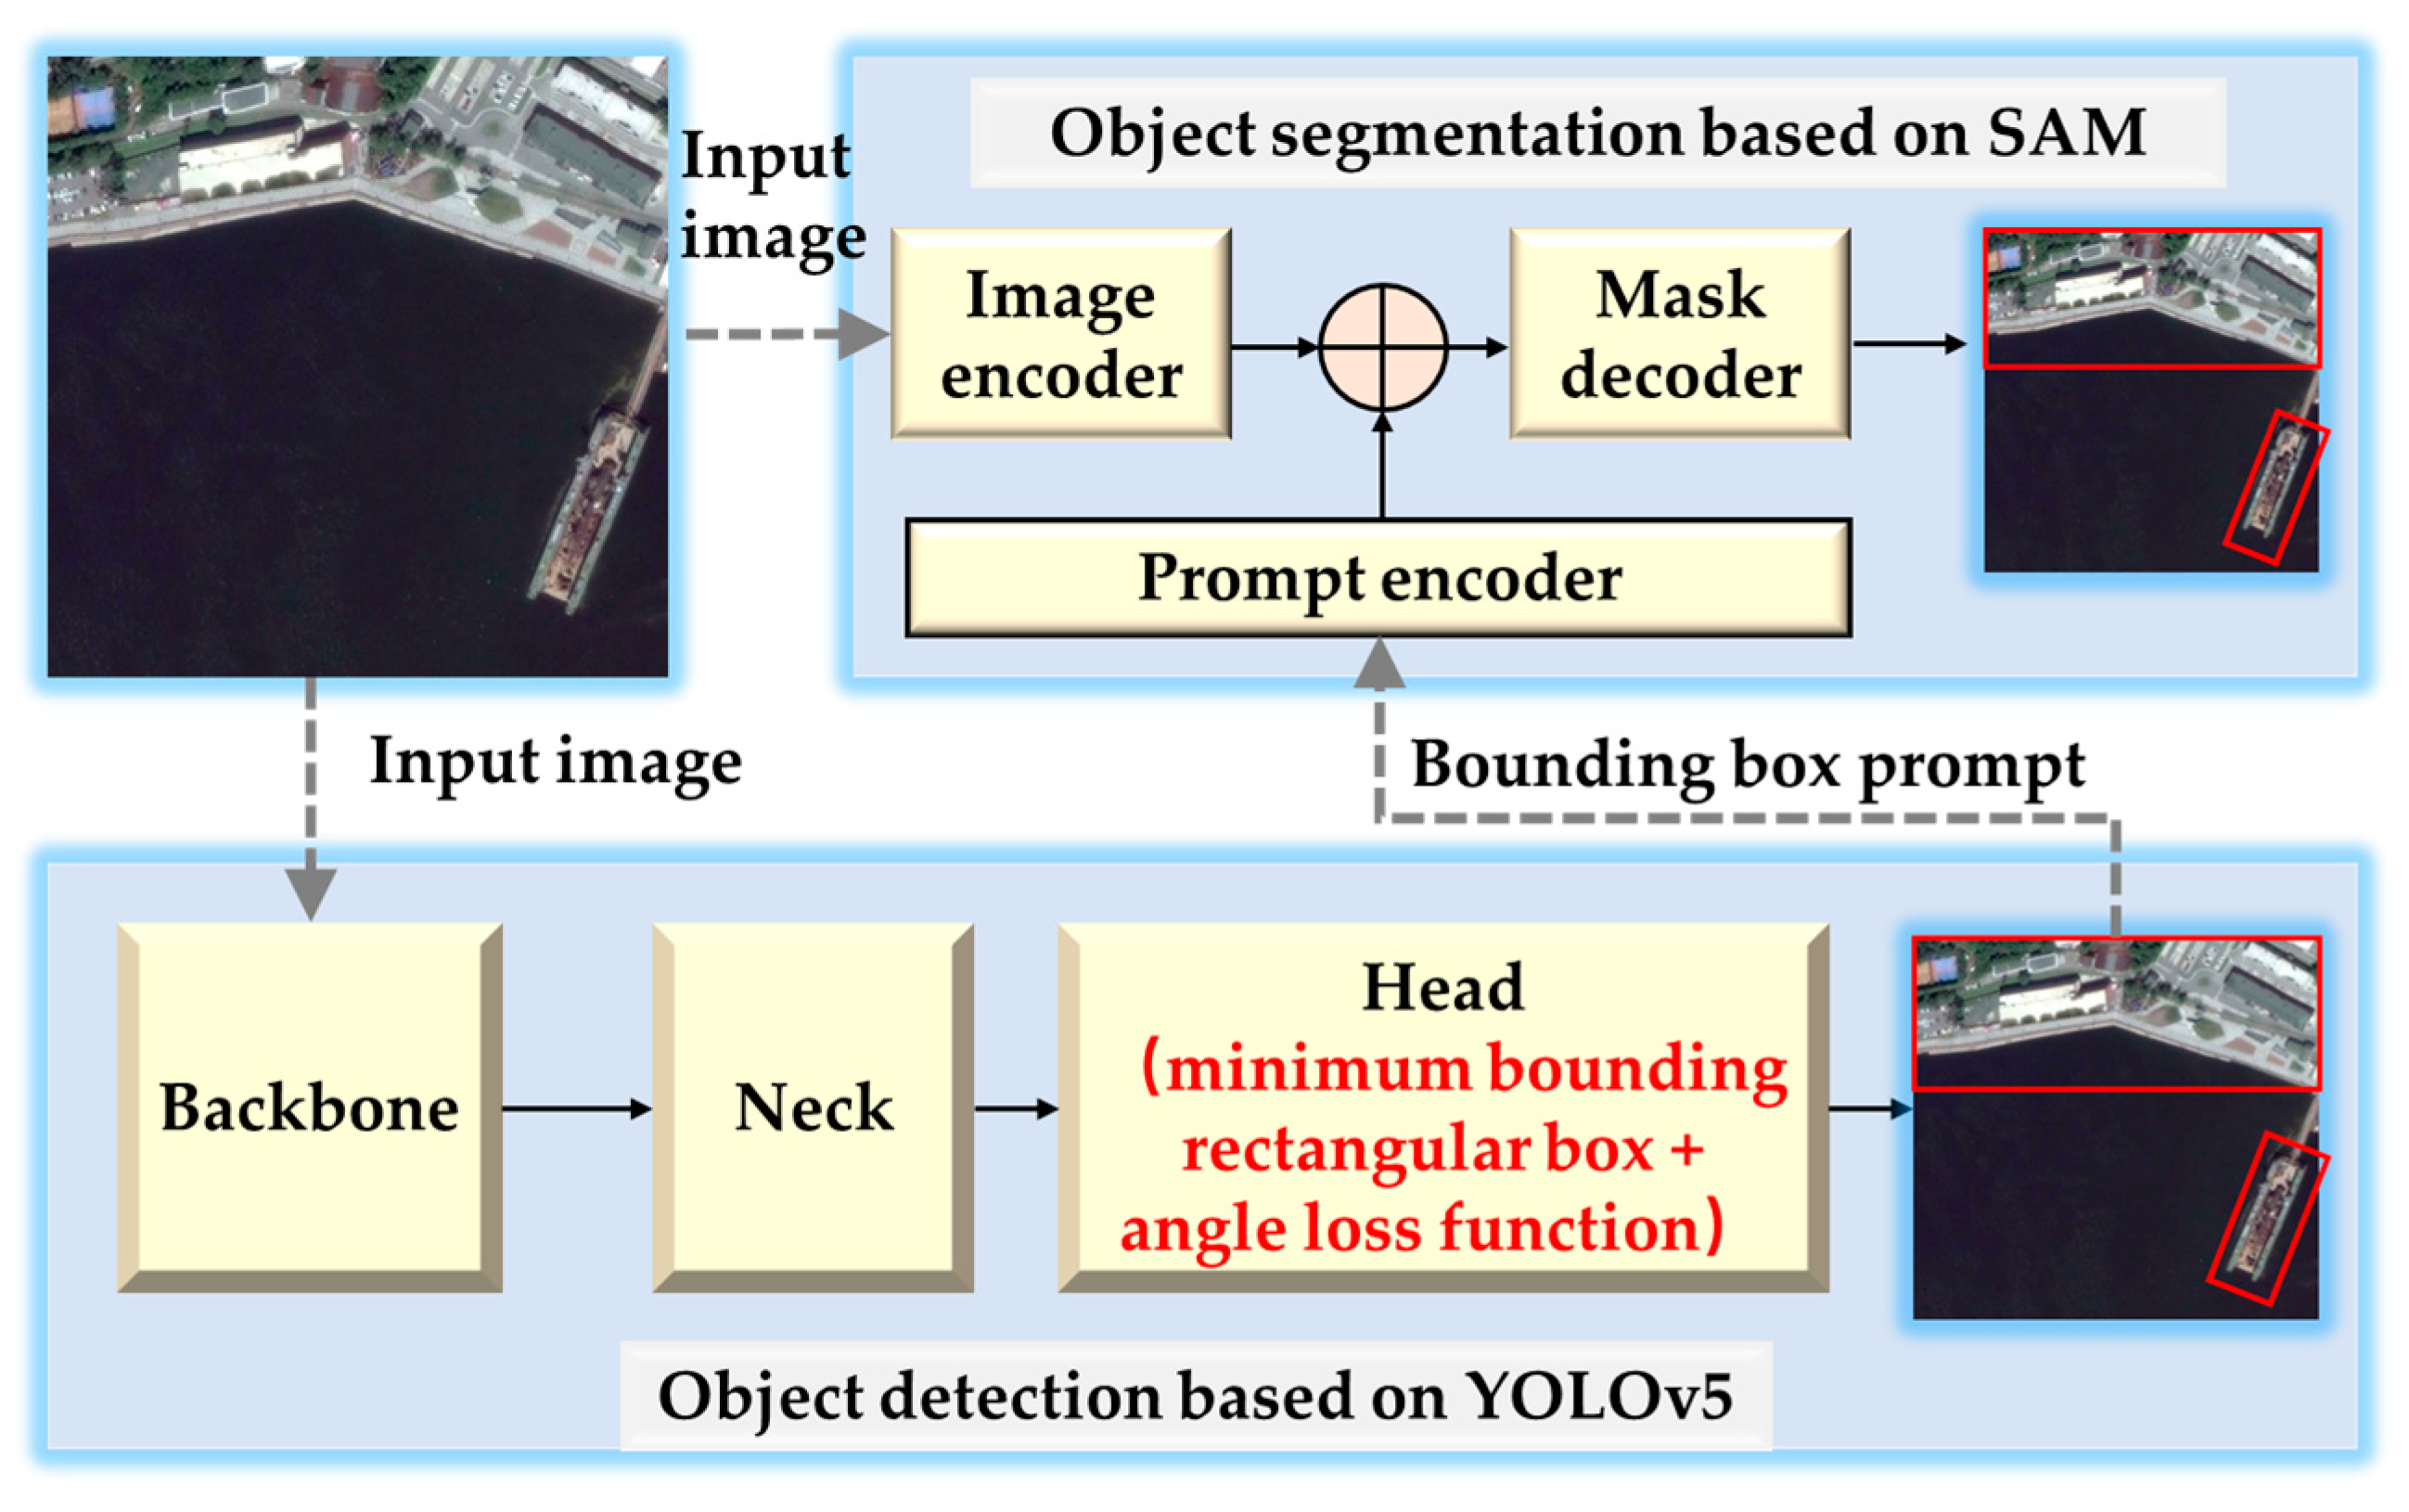
To establish an accurate map model, a semantic segmentation algorithm based on YOLOv5-assisted SAM is proposed. By redefining the representation of the minimum bounding rectangular box and a new angle loss function, the accurate object bounding box prompt is obtained. It can guide SAM to automatically and precisely segment obstacles in UAV aerial images.
(2)
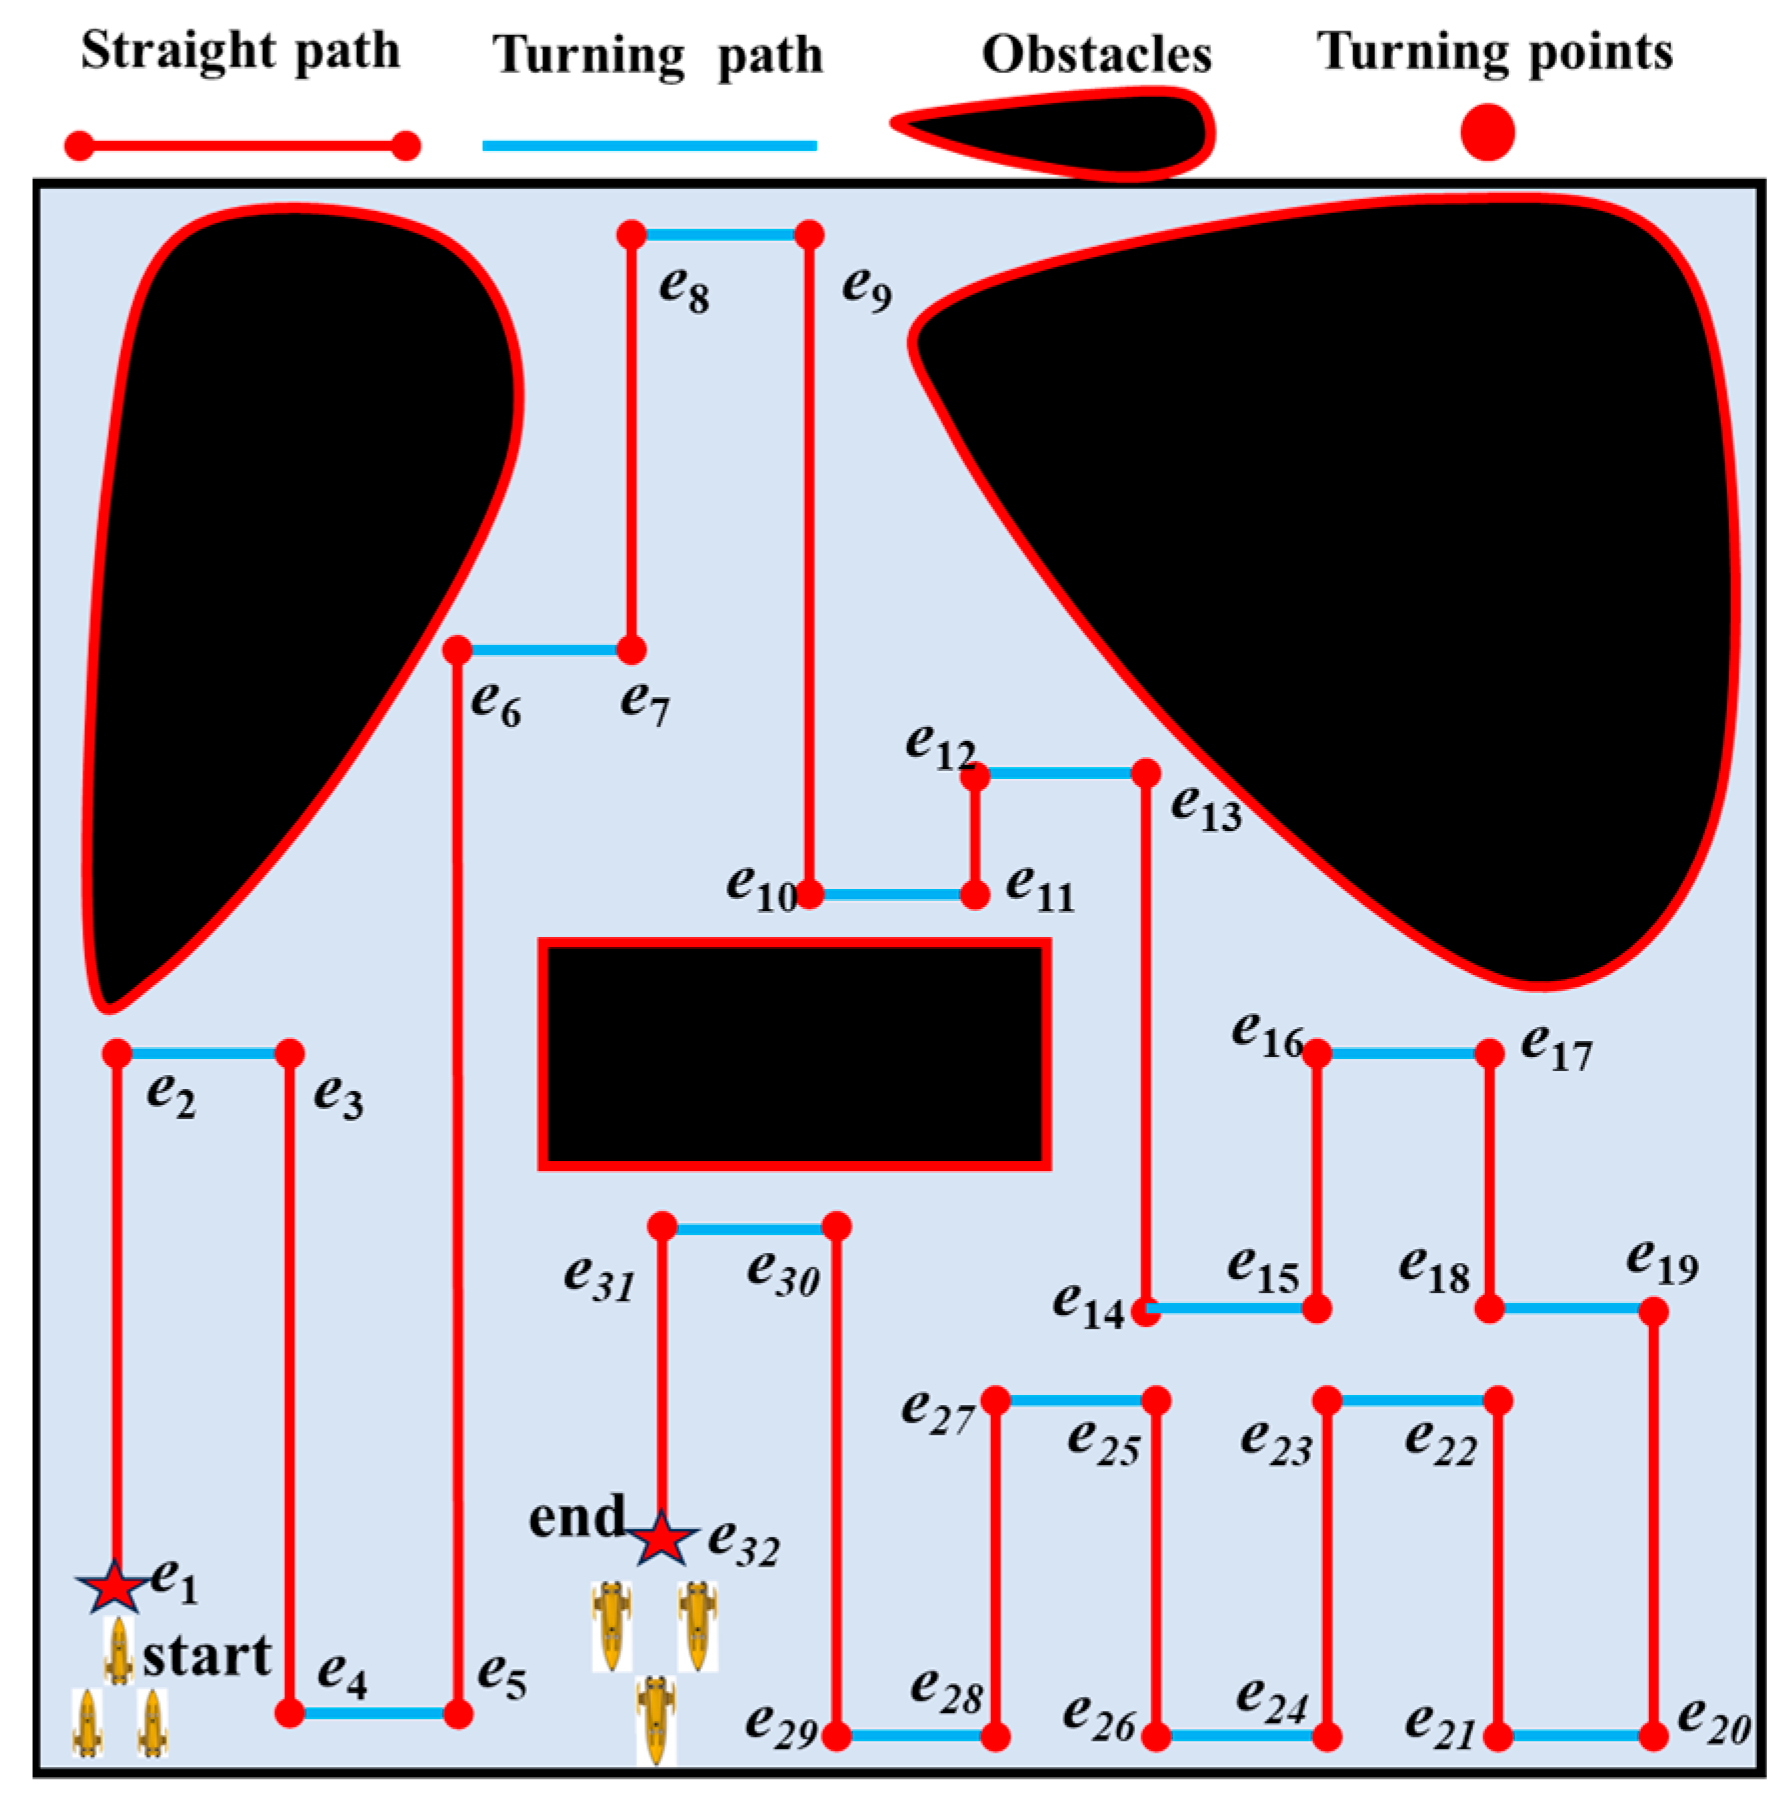
A coverage path planning algorithm based on multi-objective stepwise optimization is proposed. The algorithm divides the complete coverage path into straight paths and turning paths. In the two path planning steps, the number of turns and the path length are used as constraints to make the generated path optimal.
(3)
A novel collaborative operation system of a UAV and multiple USVs is constructed. The USVs are guided to carry out marine coverage operations with the UAV aerial images as input, which provides more comprehensive and effective perception results by segmentation. The use of large language model technology for accurate map modeling is explored in this paper, and the effectiveness of the proposed coverage path planning algorithm is verified on several complex map models.
The remainder of this paper is organized as follows. Section 2 reviews the related work. In Section 3, the proposed method is presented, including the map modeling method and the coverage path planning method. In Section 4, neural network training and experiments under different scenarios are performed. Finally, Section 5 concludes the paper.

2. Related Work

2.1. Map Modeling Based on UAV Aerial Images

For map modeling based on UAV aerial images, obstacle extraction is typically performed by object detection or semantic segmentation [22]. Compared with object detection, semantic segmentation enables pixel-level feature extraction, offering higher precision. Currently, semantic segmentation algorithms for UAV aerial images are predominantly based on convolutional neural networks, such as the DeepLab series [23], U-Net [24], and fully convolutional networks (FCN) [25]. To address the challenges of complex backgrounds, Chen et al. [26] introduced a multi-branch connection network architecture in DeepLabv3, which integrates features from different branches to enhance semantic segmentation accuracy when power lines overlap with intricate backgrounds. To tackle the challenges of multi-class small objects, Lin et al. [27] optimized the U-Net architecture by introducing dense connections, separable convolutions, batch normalization layers, and tanh activation functions, effectively improving the segmentation performance of small vegetative objects. To address the problem of blurred boundaries, Wang et al. [28] enhanced FCN by adding a nearest-neighbor feature selection module and a dynamic label strategy, thus improving the accuracy of small object label alignment. These studies have significantly promoted the application of semantic segmentation algorithms in UAV aerial images. However, UAV aerial images in offshore areas have complex backgrounds, small objects, and blurred coastline boundaries. Traditional convolutional neural networks have poor adaptability when dealing with such complex problems and often require the integration of multiple strategies to effectively address a single problem. Currently, the segment anything model (SAM), developed by Meta AI, has broken through the limitations of convolutional neural networks by introducing large language model technology and has demonstrated excellent generalization capabilities on UAV aerial images datasets [29]. This progress highlights the transformative impact of large language models (LLMs), which are also widely explored in the field of large language models such as artificial general intelligence (AGI) and GPT. These models show extraordinary ability in understanding, generating, and integrating complex information, thus providing opportunities for collaborative applications across multiple domains. However, SAM still needs prompting assistance to help achieve the fine segmentation of objects, which limits its applicability in complex real scenes. By integrating the latest advances in AGI and LLMS, such as context aware decision-making and adaptive learning mechanisms, future iterations of SAM may overcome this limitation. For example, LLMs can help generate adaptive prompting assistance for SAM, enabling it to perform fine segmentation with less human intervention. In addition, AGI may allow a more intelligent feature extraction and decision-making process and enhance the generalization ability of SAM on different and dynamic datasets. These integrations can not only improve the performance of SAM, but also make it more closely combined with human like cognitive ability and ultimately accelerate its application in automated image analysis tasks.

2.2. Centralized Coverage Path Planning for Multiple USVs

In centralized coverage path planning for multiple USVs, the entire USV formation is treated as a fixed formation, simplifying the multi-agent decentralized coverage path planning problem into one for a single agent. Currently, commonly used single-agent coverage path planning algorithms include the A* algorithm [30], the bio-inspired neural network (BINN) [31], the ant colony optimization (ACO) [32], the genetic algorithm (GA) [33], and the greedy algorithm [34], etc. While these algorithms show clear advantages in specific applications, their performance can vary and be limited when applied to complex offshore environments. The A* algorithm is known for its ability to determine the optimal path in a grid environment and is suitable for coverage tasks in regular regions. However, when applied to a large-scale marine area, the A* algorithm can lead to frequent path turns, which can increase computational overhead and reduce coverage efficiency. Similarly, due to its adaptability, BINN algorithms perform well in dynamic and unpredictable environments. but its high randomness may lead to increased path redundancy in complex environment, affecting coverage quality and efficiency. Heuristic algorithms such as ACO and GA are widely recognized for their powerful global optimization capabilities and flexibility in exploring multipath selection. However, these algorithms often simplify or ignore the USV motion constraints during the planning process. In addition, the design of these algorithms is complex, the scope of application is relatively small, and there are certain limitations in the application of large-scale and diverse marine environments. The greedy algorithm performs well in some fast path planning scenarios because of its small computation and simple implementation, but its limitation is that it is easy to fall into local optimal coverage, and it is difficult to ensure the comprehensiveness and uniformity of coverage in global path coverage planning. Considering the complex coastlines and various obstacles in offshore areas, designing a robust coverage path planning algorithm needs to balance many factors. These include minimizing the number of turns, achieving a high coverage rate with a low repeated rate, maintaining a real-time response, and manageable computing costs. This balance is crucial for enhancing the operational efficiency of USV formations in these complex environments.

3. Proposed Methodology

The proposed algorithm includes three main steps, as shown in Figure 2. Firstly, UAVs are used to collect an aerial images dataset of the offshore area. Secondly, semantic segmentation is performed using the YOLOv5-assisted prompting SAM to obtain an initial map model. This initial map model is then binarized for further processing. Finally, based on the accurate binary map model, coverage path planning is performed, and the optimal straight paths and turning paths are generated, respectively, with the constraints of the number of turns and the path length.
In addition to the above software design, the construction of a UAV–USV maritime cooperative coverage system necessitates the integration of specific hardware configurations. To ensure stable path planning and formation maintenance, each USV is equipped with a high-precision GNSS module and a suite of sensors, including cameras, inertial measurement units (IMUs), and marine radars, to enable obstacle avoidance capabilities. Reliable communication is also critical for effective cooperative operations within the USV formation. Long-range radio communication facilitates seamless information exchange between USVs and between the USV leader and the UAV. In this framework, the USV formation adopts a “leader–follower” strategy, whereby only the leader USV maintains direct communication with the UAV. This hierarchical approach simplifies the communication network while ensuring the efficiency and stability of cooperative operations.
The core of the algorithm is detailed in the following two aspects: (1) the semantic segmentation algorithm based on YOLOv5-assisted SAM; (2) the coverage path planning algorithm based on multi-objective stepwise optimization. These key techniques ensure accurate obstacle extraction and efficient path planning to minimize turns while maintaining optimal coverage.

3.1. Semantic Segmentation Algorithm Based on YOLOv5-Assisted Prompting SAM

To solve the problem that SAM struggles to achieve automatic segmentation due to the lack of object prompts, a semantic segmentation algorithm based on YOLOv5-assisted SAM is proposed. The algorithm architecture is shown in Figure 3, which consists of two core modules: a YOLOv5-based object detector and a SAM-based segmentation model. The YOLOv5 module is responsible for detecting obstacles such as coastlines and ships, and generating object bounding box prompts to label the obstacles in UAV aerial images. By accurately identifying potential obstacles like coastlines and ships, YOLOv5 can guide SAM to focus on these regions, thereby improving the accuracy and robustness of automatic segmentation. This algorithm ensures that SAM can better handle complex environments by leveraging YOLOv5’s precise detection to prompt its segmentation process.
The traditional YOLOv5 architecture consists of three main modules: Backbone, Neck, and Head. The Head module is responsible for predicting the coordinates information of bounding boxes, specifically the coordinates of the center point and the dimensions (length and width) of the bounding rectangles. However, the predicted coordinates of YOLOv5 are only suitable for generating standard bounding boxes and do not effectively yield the minimum bounding rectangular boxes of the objects. In UAV aerial images, due to the diverse orientations and close arrangements of ship obstacles, directly applying the traditional YOLOv5 for detection can result in an excessive Intersection over Union (IoU) between adjacent ship obstacles. This issue not only decreases the recall rate of object detection but also prevents the detected bounding boxes from accurately fitting the shapes of the ship obstacles. Consequently, the generated bounding boxes struggle to provide accurate prompts for subsequent SAM semantic segmentation.
To address the above problem while maintaining the prediction speed of the traditional YOLOv5, the minimum bounding rectangle box is redefined as tx, ty, tw, th, and tθ. Among them, tx and ty represent the coordinate of the center point of the rectangular box, and tw and th represent the lengths of the rectangular box’s long side or short side, respectively. When rotating counterclockwise from the positive x-axis, the first encountered side is defined as tw, with the other side corresponding to th. The rotation angle is tθ and has a value range of [−90°, 0°]. The specific definition of the minimum bounding rectangle box is shown in Figure 4, where the red line represents tw, and the other side represents th. For the minimum bounding rectangular box output by the improved YOLOv5, the angle loss function needs to be designed. To reduce the learning interval and simplify the training process, the original angle tθ is predicted from −45°, setting the value range to (0°, −45°] and [0°, 45°), effectively halving the original learning interval and reducing the learning complexity. The redefined angle loss function is as follows:
L t θ = λ c o o r d i = 0 H 2 j = 0 B I i j o b j ( t θ i π 4 t ^ θ i ) 2 .
Finally, the total loss function of YOLOv5 includes four components: localization loss, angle loss, confidence loss, and class loss. The complete formulation of the total loss function can be expressed as follows:
L o s s = L ( t x , t y , t w , t h ) + L t θ + L i o u + L c l a s s = λ c o o r d i = 0 H 2 j = 0 B I i j o b j [ ( t x i t ^ x i ) 2 + ( t y i t ^ y i ) 2 ] = λ c o o r d i = 0 H 2 j = 0 B I i j o b j [ ( t w i t ^ w i ) 2 + ( t h i t ^ h i ) 2 ] + λ c o o r d i = 0 H 2 j = 0 B I i j o b j ( t θ i π 4 t ^ θ i ) 2 + i = 0 H 2 j = 0 B I i j o b j ( C i C i ) 2 + λ c o o r d i = 0 H 2 j = 0 B I i j o b j ( C i C i ) 2 + i = 0 H 2 I i j o b j c c l s a s s e s ( P i ( c ) P i ( c ) ) 2
where λ c o o r d is the training weight, set to 0.5, H is the number of grid cells, and B is the number of anchor boxes. I i j o b j represents whether the j-th anchor box of the i-th grid cell is responsible for predicting this specific object. If so, I i j o b j = 1 , otherwise, I i j o b j = 0 . Ci is the object classification, and Pi represents the classification probability.
SAM utilizes the minimum bounding rectangular box provided by YOLOv5 to focus on specific regions, applying image encoding techniques and leveraging contextual information for segmentation. The SAM framework is an interactive segmentation method based on prompts (foreground/background points, bounding boxes, and masks) and consists of three main components: the image encoder, the prompt encoder, and the mask decoder. SAM uses MAE to process the image into intermediate features and encodes the previous prompts into embedding tokens. The cross-attention mechanism of the mask decoder enables interaction between the image features and the prompt embeddings, and finally produces a mask output that can be expressed as:
F img = Δ i-enc ( I )
F sparse = Δ p-enc ( p sparse )
F dense = Δ p-enc ( p dense )
F out = Cat ( T mc-filter , T IoU , F sparse )
Μ = Δ m-dec ( F img + F dense , F out )
where, I represents the original image, and Fimg represents the intermediate image features. psparse includes sparse prompts such as bounding boxes and Fsparse is the result of encoding these sparse prompts. pdense refers to the coarse segmentation mask, and Fdense is the dense representation extracted by the prompt encoder, which serves as an optional input for SAM. Tmc-filter and TIoU are pre-inserted learnable tokens, representing four different mask filters and their corresponding IoU predictions. M denotes the predicted multi-choice masks. In this paper, diversified outputs are not required, so the first mask is directly selected as the final prediction.
The initial map model after semantic segmentation is binarized to create a grid map suitable for coverage path planning. This grid map classifies the environmental information of the USVs into two states: non-navigable regions and navigable regions. The information of the grid map is defined as follows:
M a p ( i , j ) = 0 n a v i g a b l e   r e g i o n s 1 non-navigable   r e g i o n s
where Map(i, j) represents the grid information of the map, j is the index of the number of columns in the subdivision window of the grid map, and i is the index of the number of rows in the subdivision window of the grid map.

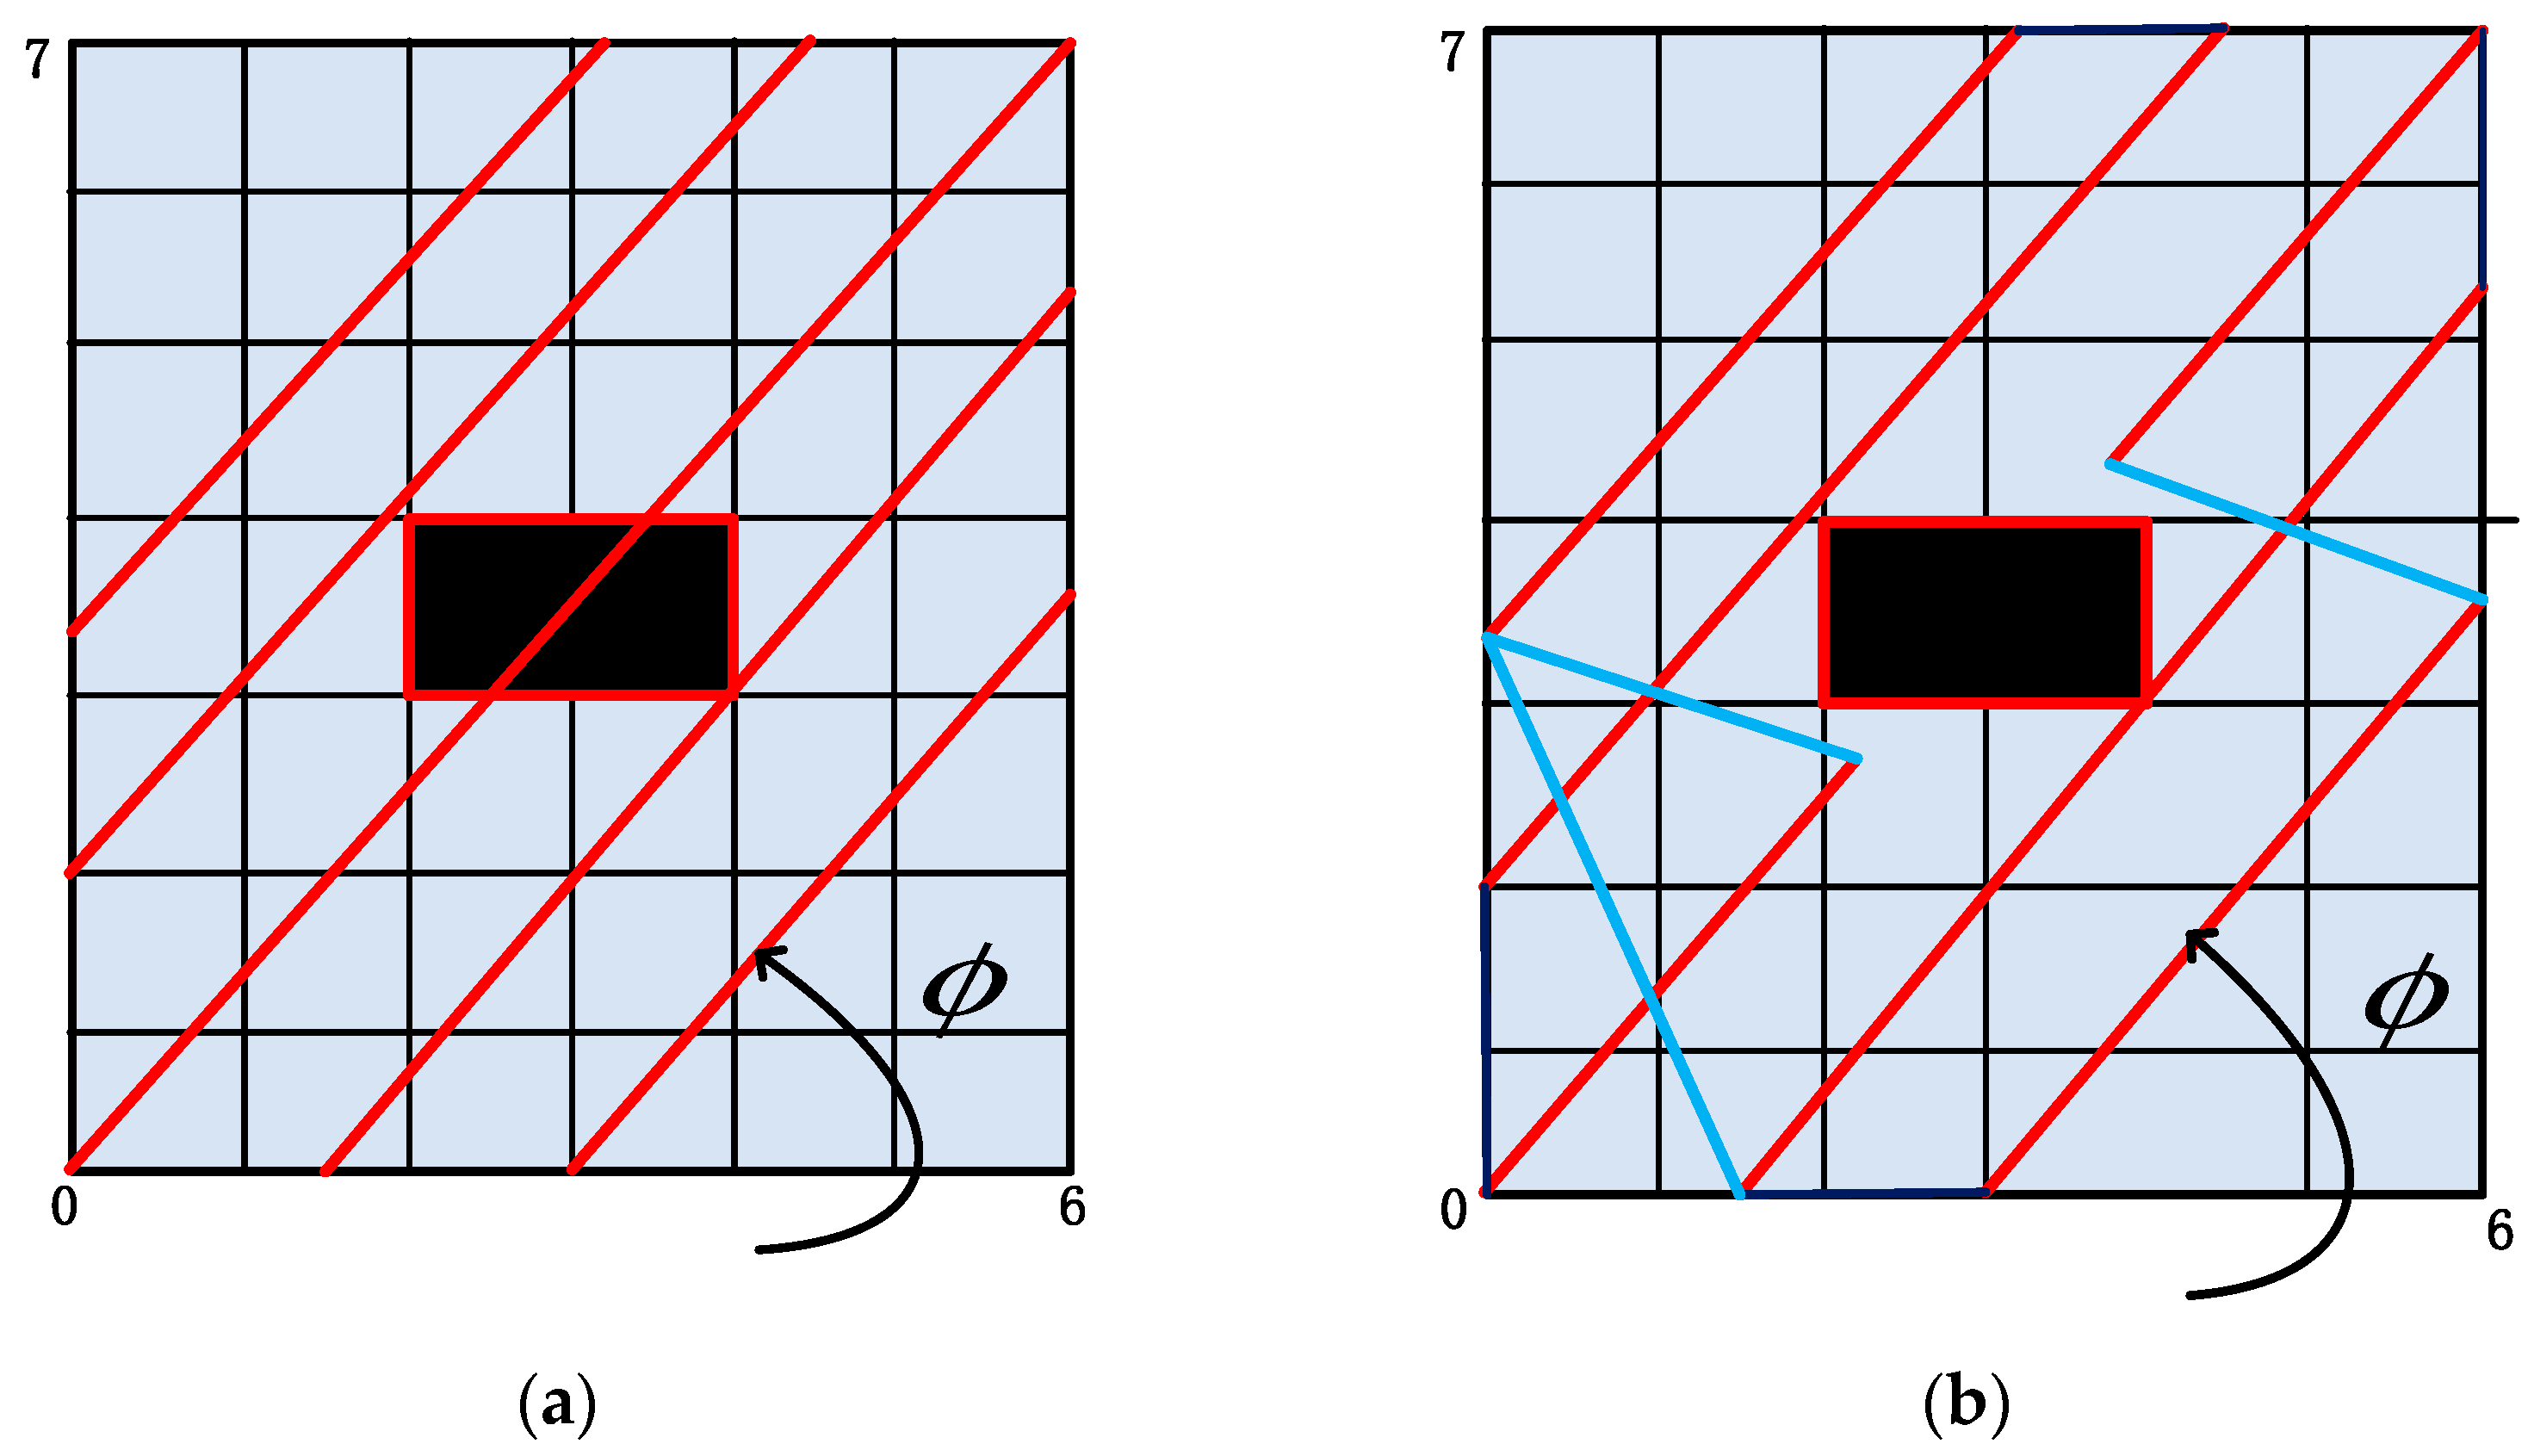
3.2. Coverage Path Planning Algorithm Based on Multi-Objective Stepwise Optimization

Based on the established grid map model, a coverage path planning algorithm based on multi-objective stepwise optimization is proposed. As shown in Figure 5, the multiple USVs adopt an “inverted V-shaped” formation, which triples the operational efficiency compared to a single USV. The CPP algorithm proposed in this paper is designed specifically for offshore coverage tasks. Given that offshore coverage areas are typically complete and continuous, centralized coverage eliminates the need to address task assignment and agent-specific differences, resulting in higher efficiency. The USV formation in this study adopts an inverted V-shaped formation, which provides a wide front monitoring range, enabling the early detection and avoidance of obstacles, and enhancing the overall safety of the formation. Furthermore, the moderate spacing between USVs within the formation helps maintain stable communication links, facilitating efficient information sharing and streamlined command coordination.
Figure 6 shows a schematic of the coverage path of the multiple USVs, where the black regions represent non-navigable regions in the map model. Common coverage modes of CPP algorithms include the following: spiral mode, backward and forward reentry mode, and random walk mode [35]. Since the number of turns is taken as the optimization objective in this paper, the forward and backward reentry is chosen as the coverage mode for the coverage path planning. Compared to spiral mode and random walk mode, the forward and backward reentry mode covers the area by linear motion and only makes 180° or 90° turns at the boundary, significantly reducing the turn frequency. In addition, the path of the forward and backward reentry mode is regular and has high repeatability, simple planning and easy implementation, and low computational complexity. Compared with complex paths such as spiral mode, it does not require a lot of dynamic adjustment and is more suitable for large offshore areas.
In maps containing multiple non-navigable regions, the coverage path of the USV formation may be interrupted by ship or coastline obstacles. Therefore, the path planning is optimized in two parts: straight paths (represented by red lines) and turning paths (represented by blue lines). Firstly, in the straight path planning, since the USVs need to decelerate, travel at a uniform speed, and then accelerate, the energy consumption of turning paths is significantly higher than during straight paths. Thus, the number of turning points must be minimized (the red points, e1e32). The straight paths are optimized with the objectives of minimizing both the path length and the number of turns (blue denotes each turning path). Then, in the turning path planning, the greedy algorithm is used to optimize the shortest path length, and the turning points formed by the straight paths are efficiently connected. Ultimately, the complete optimal coverage path is obtained.
Straight Path Planning: As shown in Figure 7, when the back-and-forth motion is used as the USV formation coverage mode, each straight path remains parallel to the next straight path, meaning the initial straight path and final straight path are always parallel. These parallel straight paths are defined as a series of parallel straight lines. By adjusting the slope and intercept of these parallel lines, the straight path group can be rotated. Finally, by optimizing the parallel straight lines to satisfy both the constraints of minimizing the number of turns and path length, a set of straight paths that can effectively avoid obstacles is generated. A set of parallel straight paths are defined as follows:
L = j α 1 m + 1 + ζ 1   if   ϕ 45 , 45 i α 2 n + 1 + ζ 2 if   ϕ 90 , 45 45 , 90
where ϕ is the slope of the straight paths, ϕ = tan 1 ( α 1 m + 1 ) or ϕ = tan 1 ( α 2 n + 1 ) , α 1 = 1 m , α 2 = 1 n define ζ 1 and ζ 2 as the intercepts of the straight paths on the horizontal and vertical axes, respectively. n is the total number of grids on the vertical axis, and m is the total number of grids on the horizontal axis. j is the total number of columns in the grid map’s subdivided window, and i is the total number of rows in the grid map’s subdivided window. In Figure 7, n = 7 and m = 6 represent the specific grid dimensions used for the operation of the task scenario
ζ 1 = w α 1 2 + ( m + 1 ) 2 m + 1 , ζ 2 = w α 2 2 + ( n + 1 ) 2 n + 1
where w represents the operational width of the USV formation.
After the straight paths are defined, the ϕ and ζ values are adjusted to make the straight paths be least interrupted by obstacles. When the straight paths are interrupted by obstacles, the number of turns will increase, and the energy consumption will also increase. The cost function for limiting the number of turns is defined as follows:
min l i j = min ( i = 1 , j = 1 i = n , j = m l i j ) if   L M a p i j = 1 , l i j = 1
where Map(i, j) is the binary grid map model, calculated by (8). L M a p i j = 1 , l i j = 1 represents if the straight path L passes through the obstacles in the map, the number of windows cells l i j in the i-th row and j-th column it passes is denoted as 1, and l i j is the total number of windows through obstacles.
When L M a p i j = 0 , l i j = 1 , the cost function for limiting the path length is defined as follows:
L p a t h = ( m + 1 ) 2 + α 1 2 m + 1   · i = 1 , j = 1 i = n , j = m l i j ( n + 1 ) 2 + α 2 2 n + 1     · i = 1 , j = 1 i = n , j = m l i j  
where L M a p i j = 0 , l i j = 1 represents if the straight path L passes through the region to be covered in the map, and the number of windows cells l i j in the i-th row and j-th column it passes is denoted as 1.
Turning Path Planning: According to the planned straight paths, the sampling position points are obtained, and the point set E is generated. Then, point e in point set E follows the rule of “left to right, top to bottom” to generate a sequential list of turning paths. This rule defines two neighborhoods for each straight path: one consisting of path segments belonging to the list of adjacent straight paths, and the other comprising path segments that do not belong to the same list. These straight paths that do not belong to the same list are usually interrupted by obstacles. Turning paths are generated between adjacent nodes based on the principle of shortest path length, utilizing the greedy algorithm. Traditionally the greedy algorithm only focuses on the local optimal solution of paths, neglecting global optimality [33]. In this paper, the optimized straight paths have been obtained by constraining the number of turns, thus transforming the global optimal coverage path planning problem of the greedy algorithm into a local optimal problem of connecting straight path nodes. Furthermore, the length cost function is introduced to further constrain the greedy algorithm and limit the path length when searching for nodes. The length cost function is as follows:
D min x ( e i + 1 ) x ( e i )
where D is the search length of the greedy algorithm, which is less than the minimum Euclidean distance between node e i + 1 and node e i .
The pseudo-codes of the coverage path planning algorithm based on multi-objective stepwise optimization are shown in Algorithm 1.
Algorithm 1: Coverage path planning algorithm based on multi-objective stepwise optimization
Input: Map model Map (i, j), Operational width of the USVs w
Output: Optimal coverage path (straight paths and turning paths)
Step1: Straight paths planning
1:    For  ϕ in [−90°, 90°] Do
2:      If   min l i j  Then
3:        calculate   L p a t h , E = ( e i ,   e i + 1 )
4:   End if
5:    End For
Step2: Turning paths planning
1:     For   e i ,   e i + 1 in E  Do
2:      If   feasible   ( < e i ,   e i + 1 > )   and   D min x ( e i + 1 ) x ( e i )  Then
3:        Connect   ( e i ,   e i + 1 )
4:    End if
5:     End For

4. Simulation Experiments

In this section, the experiment is divided into two parts. First, the semantic segmentation algorithm based on the YOLOv5-assisted prompting SAM is used to perform semantic segmentation on UAV aerial images. The segmentation results are then binarized to obtain an accurate map model. The outcomes of this part provide an accurate input map for the subsequent coverage path planning algorithm. Second, a series of comparative experiments between the proposed CPP algorithm and some advanced algorithms are carried out in different scenes. To clearly demonstrate the effectiveness of the proposed algorithm for coverage tasks in complex offshore areas, the UAV aerial images are selected to contain scenarios with intricate coastlines and ship obstacles.

4.1. Effect Verification of Semantic Segmentation Algorithm

4.1.1. Parameter Setting

All semantic segmentation algorithms are implemented using the PyTorch platform with Ubuntu 20.04 operating system and four Tesla V-100 GPUs. The YOLOv5 is trained for 80 epochs, with an image size of 800 × 800 pixels, a batch size of 32, and a learning rate set to 0.0001. The Adam optimizer is used, and the confidence and IoU thresholds are set to 0.70 and 0.60, respectively. The SAM used a pre-trained ViT-Base model, retaining the prompt encoder to handle the encoding of bounding box prompts and updating its parameters during training.
The YOLOv5 training dataset is selected from the DOTA dataset [36], which is a public dataset specifically designed for object detection in UAV aerial images and contains a wealth of offshore scene images. By training with the DOTA dataset, a high-performance YOLOv5 object detection model is obtained. The bounding box prompts generated by the proposed model can effectively guide the SAM with strong generalization capability to automatically segment ship obstacles and complex coastlines in the UAV aerial images.
Due to the inconsistency of object sample distribution, there is a risk of sample imbalance. Compared with other evaluation indicators, the mean Intersection of Union (mIoU) is more sensitive to categories with smaller sample sizes. Therefore, mIoU is used as the evaluation indicator of semantic segmentation accuracy. Additionally, considering the multi-scale characteristics of objects in UAV aerial images, the mean IoU for small objects (mIoU_s) is also computed. The mIoU is defined as follows:
mIoU = 1 N c l a s s i C b IoU i
where Nclass denotes the total number of object categories to be segmented, Cb is the set of all category pixels, and i is the number of pixels.

4.1.2. Ablation Experiments

To demonstrate that the minimum bounding rectangular box prompts generated by YOLOv5 can better assist SAM in segmenting UAV aerial images, the bounding rectangular box generated by the traditional YOLOv5 and the minimum bounding rectangular box generated by the improved YOLOv5 are input into the SAM model as object bounding box prompts, respectively, and the semantic segmentation results are analyzed. Table 1 presents the SAM segmentation results under different object box prompts.
As shown in Table 1, compared with the traditional bounding rectangular box prompts, the minimum bounding rectangular box generated by the improved YOLOv5 are used as the object box prompts, which significantly improves the segmentation accuracy of the SAM. Specifically, the mIoU increased by 8.8%, and the mIoU_s indicator increased by 10.8%. It can also be observed that the segmentation accuracy of small objects is increased more. This is because in UAV aerial images the details of small obstacles are easier to lose. When only traditional bounding boxes are used as prompts, particularly when dealing with densely arranged small objects, the bounding boxes are prone to overlap with each other, exacerbating issues of missed detection and false detection. Therefore, the use of minimum bounding boxes is more suitable for addressing segmentation challenges involving small objects.

4.1.3. Comparative Experiments

To demonstrate the superiority of the proposed semantic segmentation algorithm based on YOLOv5-assisted SAM, five classic and advanced semantic segmentation algorithms are selected for comparative experiments with the proposed algorithm. These five algorithms include U-Net [24], DeeplabV3+ [23], FCN [25], Mask2Former [37], and DDRNet [38]. U-Net, FCN, and DeeplabV3+ are classic semantic segmentation algorithms. U-Net, with its encoder–decoder structure forming a “U-shaped,” has achieved significant success in the field of medical image segmentation. DeeplabV3+ is the latest version of the Deeplab series, which introduces atrous convolution and multi-scale information fusion to enhance the ability of the semantic segmentation algorithm to identify object boundaries and details. DDRNet and Mask2Former are popular semantic segmentation algorithms developed in the past three years. Based on the classic semantic segmentation algorithms, different attention mechanisms, context modeling, and multi-scale processing techniques are introduced to achieve more accurate image segmentation results.
Table 2 shows the semantic segmentation comparison results of the six algorithms. Among the classic semantic segmentation algorithms, DeeplabV3+ has the highest mIoU and mIoU_s values, outperforming other classic algorithms. Among advanced semantic segmentation algorithms, Mask2Former has the best performance, with the mIoU reaching 92.3% and the mIoU_s reaching 90.2%, which are improved compared with the classic algorithms. In addition, the proposed semantic segmentation algorithm achieves the highest results on both indicators, with an mIoU of 96.4%, which is 4.1% higher than that of Mask2Former, and the mIoU_s is 93.1%, which is 2.9% higher than Mask2Former. In general, the proposed algorithm has obvious advantages in segmentation effect, especially in the segmentation processing of small objects in the UAV aerial images. This proves that the proposed algorithm has a better perception ability of object information in UAV aerial images and has the ability to effectively segment small objects. The generated object bounding box prompts can better guide SAM to segment the object information in UAV aerial images and have a more refined map modeling effect.
Figure 8 shows the semantic segmentation results of UAV aerial images across different scenarios, including the original UAV aerial images, the semantic segmentation results, and the binary map results. Each of the six different scenarios contain obstacles such as ships and coastlines at varying scales. As shown in Figure 8, the proposed semantic segmentation algorithm effectively distinguishes between obstacles and navigable regions. It is worth noting that in Figure 8b–f, the ship obstacles are some visually similar and small objects, which can still be accurately identified and segmented by the proposed algorithm. These visualized segmentation results further verify the superiority of the proposed algorithm in the semantic segmentation of UAV aerial images, especially the ability to accurately identify and effectively segment small-scale ship objects in complex scenarios, indicating the applicability and reliability of the proposed algorithm in complex offshore environments.

4.2. Effect Verification of Coverage Path Planning Algorithm

4.2.1. Parameter Setting

The input map models of the coverage path planning algorithm are the six binary maps in Figure 8, whose size are 800 pixels × 800 pixels. The application scenario of the path coverage algorithm is the marine monitoring of USV formation in offshore areas, and the work width is 14 pixels.
Before the simulation, it is necessary to explain the parameters of the UAV and its onboard camera to meet the task requirements of the UAV aerial photography. The DJI quadcopter aerial photography UAV is used in the study, and the specific parameters are shown in Table 3. The energy consumption of the UAV is very important. In this experiment, it is assumed that the UAV always belongs to the ideal condition of sufficient energy.
The effectiveness of the coverage path planning algorithm is evaluated by key performance indicators such as coverage rate, repetition rate, path length Lpath, and number of turns TN. These indicators can be specifically defined as follows.
The coverage rate indicates the coverage degree of the target region after the USV formation completes the path planning. The higher the coverage rate, the better the coverage effect of the path planning algorithm on the entire target region. It is defined as the ratio of the covered region to the target region:
C r = S n S × 100 %
where Cr represents the coverage rate, S represents the total region of the target sea region, and Sn represents the covered region.
The repetition rate indicates the degree of repeated coverage of the covered region by the USV formation in path planning, also known as the redundancy rate. The lower the repetition rate, the higher the coverage efficiency of the path, which avoids resource waste. It is defined as the ratio of repeated coverage region to target region:
R r = S r S × 100 %
where Rr is the repetition rate, and Sr is the repeated covered region.
The path length Lpath refers to the total path length traveled by the USV formation during the entire path planning process. The shorter the path length, the smaller the distance overhead of path planning, which is particularly important for energy saving and improving execution efficiency. TN indicates the number of turns that the USV formation makes during path planning. The USV must slow down and reaccelerate when turning, which means that the average speed when turning is lower than the average speed when driving in a straight line. Therefore, fewer turns help to reduce the energy consumption of the USV and improve the coverage efficiency.

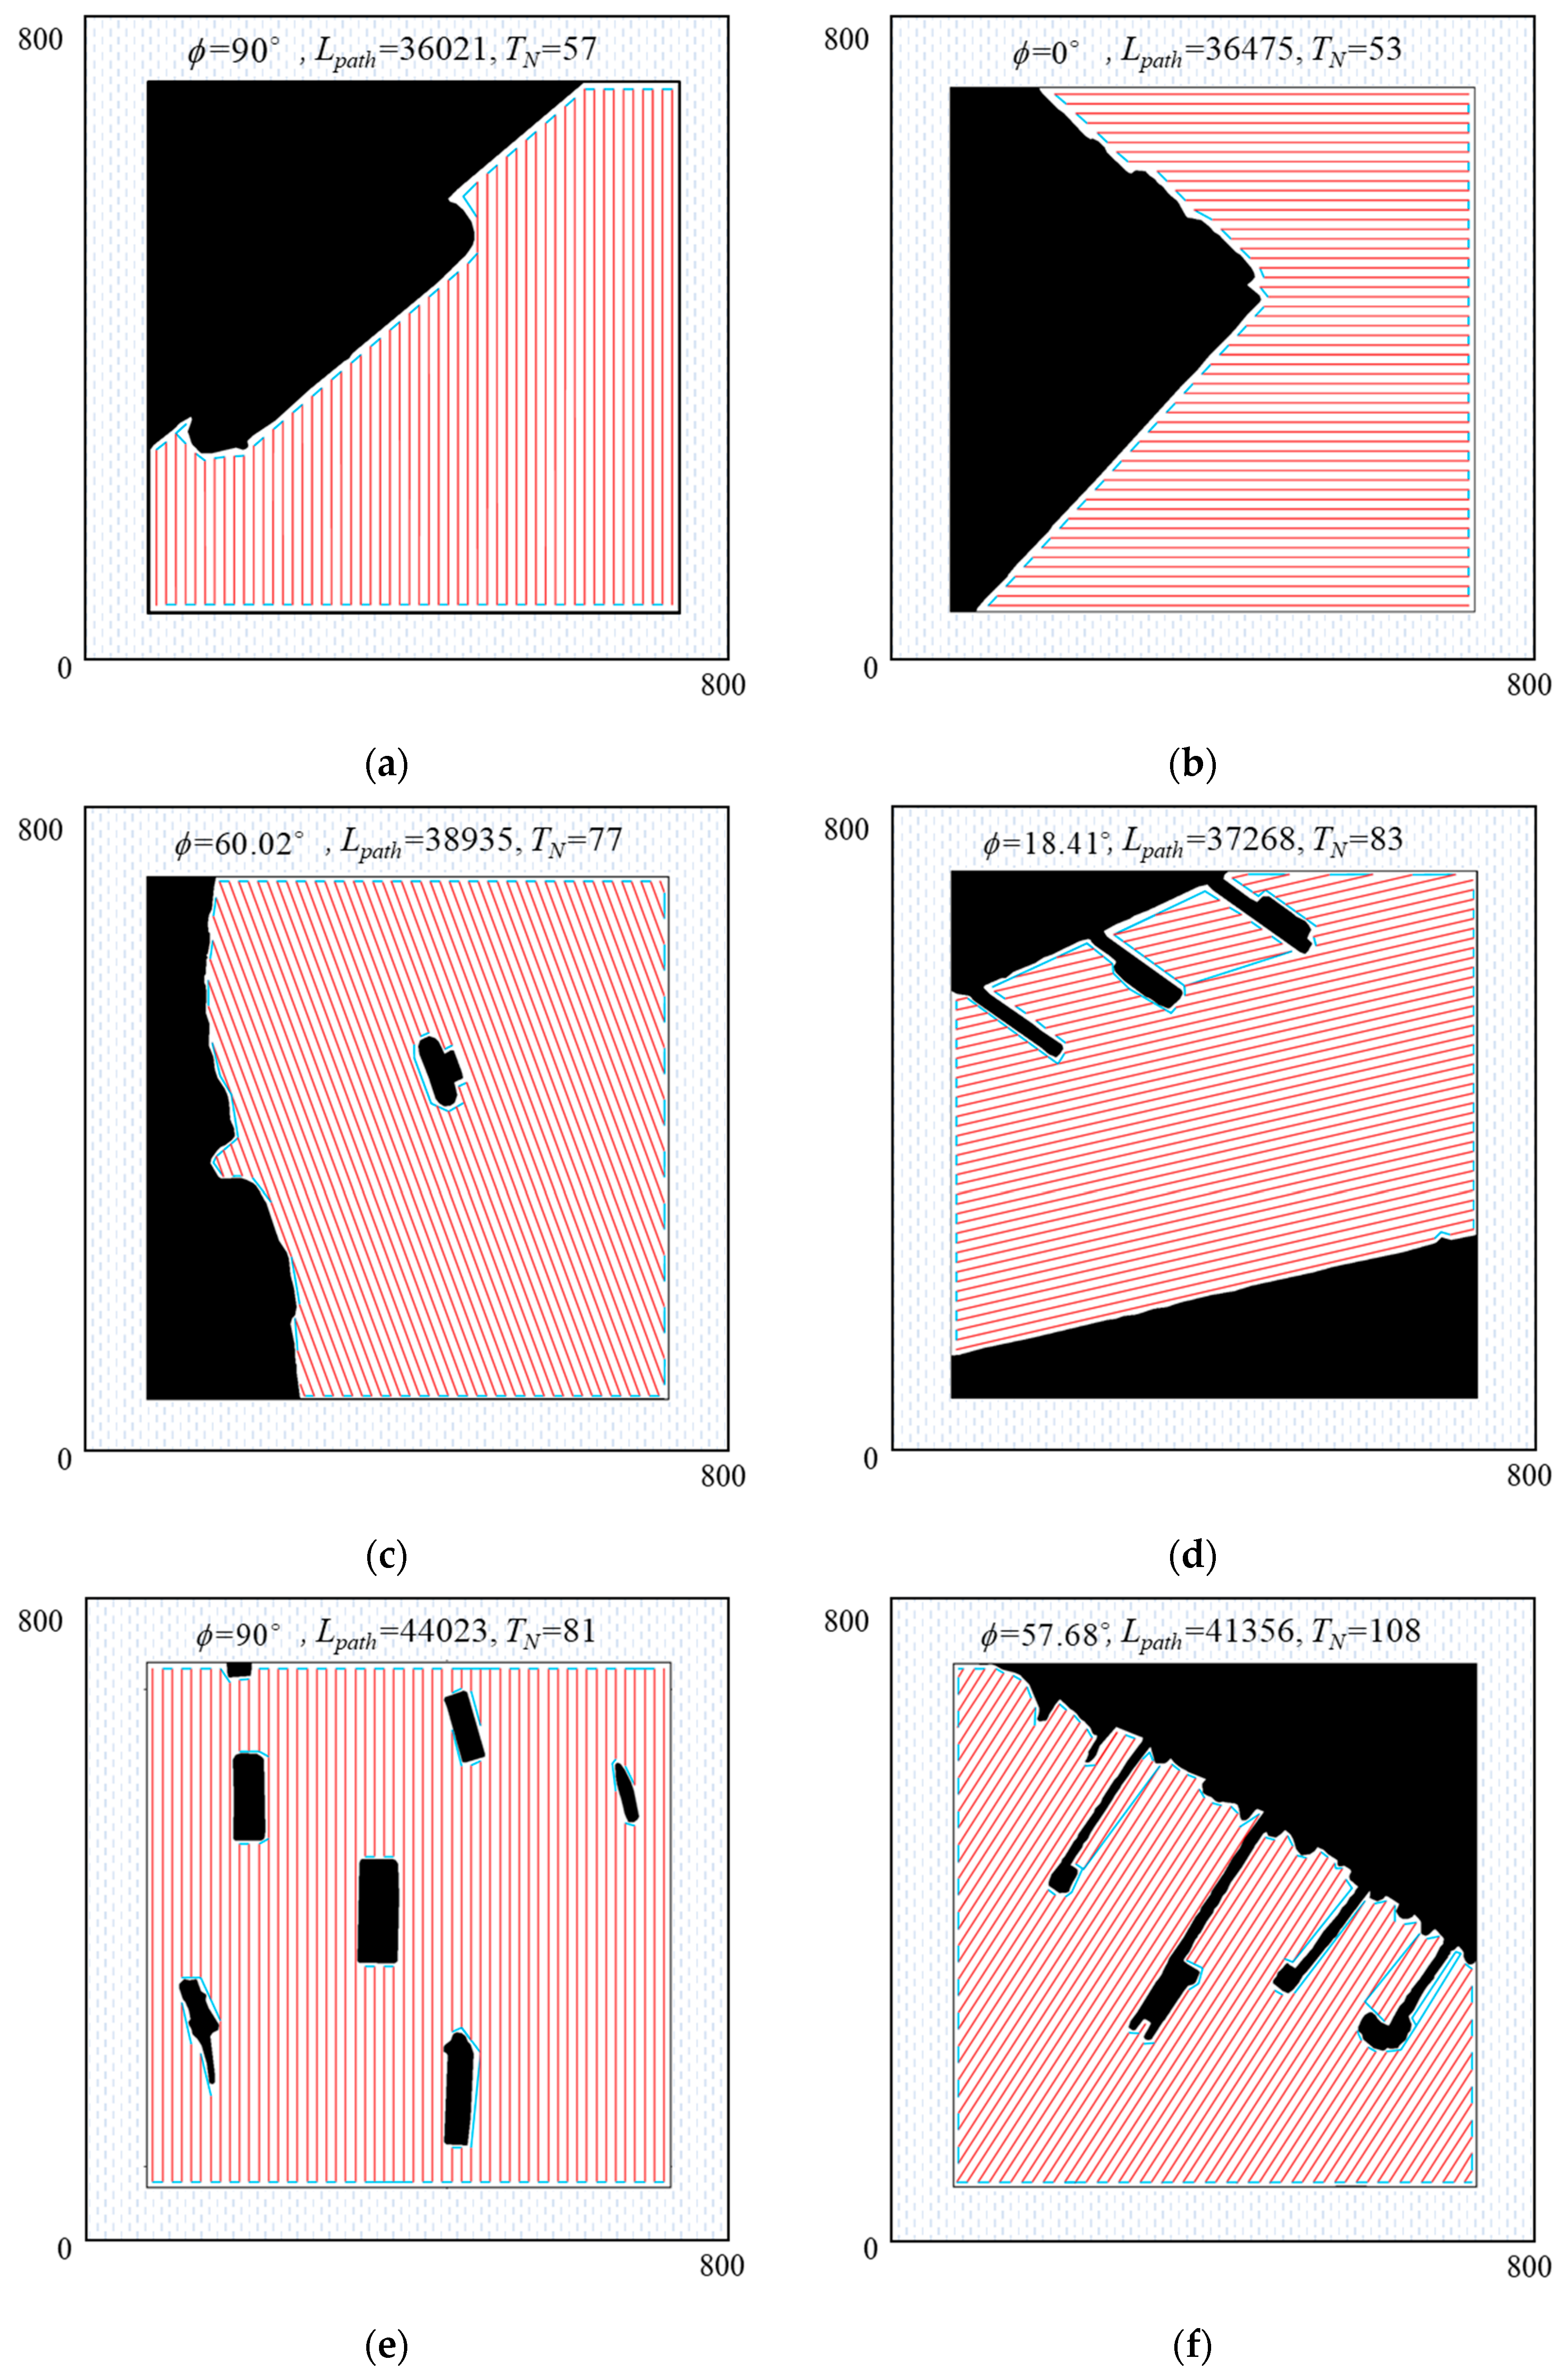
4.2.2. Coverage Path Planning Visual Result Analysis

In the task of path coverage in an offshore area, a USV needs to ensure efficient coverage of the target area within limited energy and time. Core indicators include: (1) the coverage rate (Cr) needs to ensure 100% coverage to avoid missing the target area. (2) The repetition rate (Rr) directly affects the path efficiency and energy consumption. (3) The shorter the path length (Lpath), the less the task execution time, and the lower the energy consumption. (4) The number of turns (TN) represents the computational complexity of the algorithm. The less the number of turns means the lower the amount of calculation and the lower the energy consumption of the USV, which is conducive to real-time planning and dynamic adjustment.
The six binary map models generated in Figure 8 are denoted as M1, M2, M3, M4, M5, and M6, respectively, and the optimal coverage path is obtained by using the proposed coverage path planning algorithm based on multi-objective stepwise optimization. The visualization results are shown in Figure 9, where the black regions represent the obstacles such as the coastline and cargo ships, the red straight lines represent the planned straight paths, and the blue straight lines represent the turning paths. In the simpler map models (M1 and M2), the planned path is less disturbed by obstacles, and the slopes of the planned straight paths are 0° and 90°, respectively. However, when the targeted region is more complex and the planning path is interfered with by more obstacles (M3, M4, M5, and M6), the number of turns in the path increases significantly. The number of turns in M6 is 47.2% higher than that in M1, and the slopes of the straight paths planning in M3, M4 and M6 are 60.02°, 18.41°, and 57.68°, respectively. It can be seen that in complex offshore areas, due to the existence of irregular obstacles, the path planning task will be more complex. The proposed algorithm adjusts the direction of the straight paths, controls the number of turns, avoids obstacles as much as possible, and performs planning that is more adapted to the map models.

4.2.3. Comparative Experiments

To further verify the performance advantages and technical advancement of the proposed coverage path planning algorithm, two sets of comparative experiments are designed. First, to verify the effectiveness of the proposed algorithm in the stepwise optimization of straight paths and turning paths, it is compared with the traditional greedy algorithm [34]. Second, in order to evaluate the technical advancement of the proposed algorithm, the A* algorithm [30], the BINN [31], the ACO [32] and the GA [33] are selected as comparison algorithms to demonstrate the superiority of the proposed algorithm over the existing mainstream algorithms. All comparison algorithms are common coverage path planning algorithms and have been used in many application scenarios.
Table 4 shows the comparison results between the proposed CPP algorithm and the traditional greedy algorithm. It can be seen that both algorithms achieve a 100% coverage rate Cr in all scenarios, demonstrating their ability to completely cover the target regions. However, the proposed CPP algorithm has obvious advantages in Rr. In M1, the Rr of the traditional greedy algorithm is 1.1%, while for the proposed algorithm it is only 0.1%, reducing the redundancy by about 91%. In the M6, the Rr of the traditional greedy algorithm is as high as 19.8%, while the proposed algorithm reduces it to 4.1%, significantly reducing the proportion of duplicate paths. This shows that by introducing the constraint of the number of turns, the proposed CPP algorithm can effectively reduce the redundancy in the path and make the path planning of the task region more efficient and more adaptable. This advantage also shows that the proposed algorithm can effectively reduce the overlap in the path and improve the coverage efficiency of the path, especially for resource constrained task scenarios. The proposed CPP algorithm generates shorter paths in all scenarios. In M3, the Lpath of the traditional greedy algorithm is 39,408 pixels, while the proposed algorithm optimizes it to 38,935 pixels, reducing it by about 1.2%. In the more complex M5, the Lpath of the traditional greedy algorithm is 45,142 pixels, while the proposed algorithm is only 44,023 pixels, which is an optimization of about 2.5%. The reduction of path length directly reduces the task execution time and energy consumption, which is particularly critical for energy constrained platforms. The proposed CPP algorithm also shows significant advantages in the number of turns. In M4, the traditional greedy algorithm needs 141 turns, while the proposed algorithm only needs 83 turns, reducing the number of turns by about 41%. In M6, the proposed algorithm optimizes the number of turns from 131 to 108, which reflects its efficiency in complex conditions. In summary, the proposed algorithm performs well in all indicators, especially in complex scenarios M3, M4, M5, and M6, where it outperforms other algorithms in terms of the repetition rate, the path length, and the number of turns. This shows that the proposed algorithm has a higher efficiency and adaptability in path planning, and can provide more advanced solutions, especially in complex environments.
Table 5 shows the coverage path planning performance comparison results between the proposed algorithm and other advanced algorithms. All the algorithms have achieved a 100% coverage rate in the six scenarios, which shows that all the algorithms can meet the basic requirements of path planning and ensure the complete coverage of the target area. In terms of repetition rate (Rr), the Rr of the other algorithms are close in M1 and M2 scenes, but in complex scenes M3, M4, M5, and M6, the repetition rate increases significantly. The Rr of the A* algorithm is as high as 20.5% in M6 and 10.4% in M4. The Rr of BINN is 16.9% in M6 and 8.6% in M4. The ACO algorithm scores 18.9% in M6, which is slightly better than the A* algorithm, but it is still high. The Rr of the GA algorithm is slightly better, which is 17.8% in M6, but it is still significantly higher than the proposed CPP algorithm. The Rr of the proposed CPP algorithm is significantly reduced in all scenarios, especially in M6, and the Cr is only 4.1%, which is reduced by more than 80% compared with the A* algorithm. This result proves that the proposed CPP algorithm can effectively reduce the overlap in the path planning process and greatly improve the efficiency of path planning. In terms of path length, the A* algorithm reaches 43,885 pixels in M6 and 44,576 pixels in M5. The path length of the BINN algorithm in M5 and M6 is 45,143 pixels and 42,586 pixels, respectively. The path length of the ACO algorithm is slightly better than that of the A* algorithm, but it still reaches 43,003 pixels in M6. The path length of the GA algorithm is optimized, which is 42,756 pixels in M6. The proposed CPP algorithm shows the shortest path length in all scenarios. For example, it is 41,356 pixels in M6, which is 5.8% shorter than the A* algorithm and about 8.5% shorter than BINN. The significant reduction of path length proves the efficiency of the CPP algorithm in path planning, which is especially suitable for application scenarios that need to reduce energy consumption. In terms of the number of turns, the number of turns the A* algorithm reaches is 138 in M6 and 135 in M4. BINN has a high number of turns, with 126 in M6. The GA algorithm turns 129 times in M6. The proposed CPP algorithm is the lowest in all scenarios, especially in M6, where it is only 108, which is 30 times less than the A* algorithm, and further reduces the computational overhead. This result shows that the proposed CPP algorithm can significantly reduce the computational burden while realizing path optimization and is more suitable for task scenarios with high real-time requirements. The proposed CPP algorithm divides the coverage path into two parts: the straight paths and the turning paths. When the number of turns is used as a constraint in the straight path planning, the slope of the straight paths will choose the angle that is least interrupted by obstacles, while other algorithms do not consider this factor, and their slopes are all 0° or 90°. Fewer turns not only mean smoother path planning, but it also reduces the complexity during task execution, especially in dynamic environments. In summary, the proposed algorithm performs well in all indicators, especially in complex scenarios M3, M4, M5, and M6, where it outperforms other algorithms in terms of repetition rate, path length, and number of turns. This shows that the proposed algorithm has a higher efficiency and adaptability in path planning, and can provide more advanced solutions, especially in complex environments.

5. Conclusions

A coverage path planning algorithm for UAV aerial images to assist multiple USVs is proposed. The proposed algorithm combines CPP technology with large model semantic segmentation technology to construct a USV path coverage system suitable for complex marine supervision tasks. A semantic segmentation algorithm based on the YOLOv5-assisted prompting SAM is proposed for map modeling. By adding multi-dimensional information, YOLOv5 outputs the minimum rectangular target box prompt, thereby guiding SAM to achieve refined obstacle information extraction. In addition, based on the established refined map model, a coverage path planning algorithm based on multi-objective stepwise optimization is proposed, which divides the full coverage path into straight paths and turning paths, and is optimized according to the path length and the number of turns. The above multiple sets of experiments prove the superiority of the proposed UAV assisted USV coverage path planning algorithm. In the terms of map modeling, compared with other semantic segmentation algorithms, the mIoU of the proposed semantic segmentation algorithm is increased by 5.92% on average, and the mIoU_s is increased by 7.74% on average, which shows that the proposed semantic segmentation algorithm can obtain a more accurate map model, especially for UAV aerial images with small objects. In terms of the CPP algorithm, in the six different map models, the proposed CPP algorithm has an average increase of 79.54%, 1.57%, and 21.97% in Rr, Lpath, and TN, respectively, which further proves that the proposed CPP algorithm has certain advantages in terms of time, applicability, feasibility, and computational efficiency. In the future, in order to further improve the unmanned management level of the UAV–USV cooperative marine covering operation system, real-time environmental awareness technology can be considered to improve the dynamic environmental adaptability of the cooperative covering operation system, so as to better meet the actual marine operation needs. In addition, the energy consumption of the UAV and USVs and the further development of practical experiments are the focus of future research.

Author Contributions

Conceptualization, S.P. and X.X.; methodology, S.P. and X.X.; software, S.P. and X.X.; data curation, S.P., X.X. and Y.C; writing—original draft preparation, S.P. and Y.C.; writing—review and editing, S.P. and Y.C.; visualization, S.P. and Y.C.; project administration, X.X. and L.Z.; funding acquisition, X.X. and L.Z. All authors have read and agreed to the published version of the manuscript.

Funding

This work was supported in part by the National Natural Science Foundation of China under Grant 52301395.

Data Availability Statement

The original contributions presented in this study are included in the article. Further inquiries can be directed to the corresponding author.

Conflicts of Interest

The authors declare no conflicts of interest.

References

  1. He, Z.; Li, L.; Xu, H.; Zong, L.; Dai, Y. Collaborative Obstacle Detection for Dual USVs Using MGNN-DANet with Movable Virtual Nodes and Double Attention. Drones 2024, 8, 418. [Google Scholar] [CrossRef]
  2. Li, J.; Zhang, G.; Shan, Q.; Zhang, W. A novel cooperative design for USV–UAV systems: 3-D mapping guidance and adaptive fuzzy control. IEEE Trans. Control Netw. Syst. 2022, 10, 564–574. [Google Scholar] [CrossRef]
  3. Du, B.; Xie, W.; Zhang, W.; Chen, H. A target tracking guidance for unmanned surface vehicles in the presence of obstacles. IEEE Trans. Intell. Transp. Syst. 2023, 25, 4102–4115. [Google Scholar] [CrossRef]
  4. Li, J.; Zhang, G.; Jiang, C.; Zhang, W. A survey of maritime unmanned search system: Theory, applications and future directions. Ocean Eng. 2023, 285, 115359. [Google Scholar] [CrossRef]
  5. Jin, X.; Er, M.J. Cooperative path planning with priority target assignment and collision avoidance guidance for rescue unmanned surface vehicles in a complex ocean environment. Adv. Eng. Inform. 2022, 52, 101517. [Google Scholar] [CrossRef]
  6. Qian, L.P.; Zhang, H.; Wang, Q.; Wu, Y.; Lin, B. Joint multi-domain resource allocation and trajectory optimization in UAV-assisted maritime IoT networks. IEEE Internet Things J. 2022, 10, 539–552. [Google Scholar] [CrossRef]
  7. Bae, I.; Hong, J. Survey on the developments of unmanned marine vehicles: Intelligence and cooperation. Sensors 2023, 23, 4643. [Google Scholar] [CrossRef] [PubMed]
  8. Zhao, Z.; Zhu, B.; Zhou, Y.; Yao, P.; Yu, J. Cooperative path planning of multiple unmanned surf ace vehicles for search and coverage task. Drones 2022, 7, 21. [Google Scholar] [CrossRef]
  9. Zhao, L.; Bai, Y.; Paik, J.K. Optimal coverage path planning for USV-assisted coastal bathymetric survey: Models, solutions, and lake trials. Ocean Eng. 2024, 296, 116921. [Google Scholar] [CrossRef]
  10. Lin, S.; Liu, A.; Wang, J.; Kong, X. A review of path-planning approaches for multiple mobile robots. Machines 2022, 10, 773. [Google Scholar] [CrossRef]
  11. Luo, J.; Su, Y. Path planning for Multi-USV target coverage in complex environments. Ocean Eng. 2024, 312, 119090. [Google Scholar] [CrossRef]
  12. Liang, J.; Zhang, J.; Ma, Y.; Zhang, C.-Y. Derivation of bathymetry from high-resolution optical satellite imagery and USV sounding data. Mar. Geod. 2017, 40, 466–479. [Google Scholar] [CrossRef]
  13. Kulbacki, A.; Lubczonek, J.; Zaniewicz, G. Acquisition of Bathymetry for Inland Shallow and Ultra-Shallow Water Bodies Using PlanetScope Satellite Imagery. Remote Sens. 2024, 16, 3165. [Google Scholar] [CrossRef]
  14. Yang, X.; Shi, Y.; Liu, W.; Ye, H.; Zhong, W.; Xiang, Z. Global path planning algorithm based on double DQN for multi-tasks amphibious unmanned surface vehicle. Ocean Eng. 2022, 266, 112809. [Google Scholar]
  15. Luo, J.; Zhuang, J.; Jin, M.; Xu, F.; Su, Y. An energy-efficient path planning method for unmanned surface vehicle in a time-variant maritime environment. Ocean Eng. 2024, 301, 117544. [Google Scholar] [CrossRef]
  16. Li, W.; Ge, Y.; Guan, Z.; Ye, G. Synchronized motion-Based UAV–USV cooperative autonomous landing. J. Mar. Sci. Eng. 2022, 10, 1214. [Google Scholar] [CrossRef]
  17. Wang, Y.; Liu, W.; Liu, J.; Sun, C. Cooperative USV–UAV marine search and rescue with visual navigation and reinforcement learning-based control. ISA Trans. 2023, 137, 222–235. [Google Scholar] [CrossRef] [PubMed]
  18. Cao, Y.; Cheng, X.; Mu, J. Concentrated coverage path planning algorithm of UAV formation for aerial photography. IEEE Sens. J. 2022, 22, 11098–11111. [Google Scholar] [CrossRef]
  19. Soltero, D.E.; Schwager, M.; Rus, D. Decentralized path planning for coverage tasks using gradient descent adaptive control. Int. J. Robot. Res. 2014, 33, 401–425. [Google Scholar] [CrossRef]
  20. Almadhoun, R.; Taha, T.; Seneviratne, L.; Zweiri, Y. Multi-robot hybrid coverage path planning for 3D reconstruction of large structures. IEEE Access 2021, 10, 2037–2050. [Google Scholar] [CrossRef]
  21. Hui, Y.; Zhang, X.; Shen, H.; Lu, H.; Tian, B. Dppm: Decentralized exploration planning for multi-uav systems using lightweight information structure. IEEE Trans. Intell. Veh. 2023, 9, 613–625. [Google Scholar] [CrossRef]
  22. Zhang, W.; Wang, K.; Wang, Y.; Yan, L.; Wang, F.-Y. A loss-balanced multi-task model for simultaneous detection and segmentation. Neurocomputing 2021, 428, 65–78. [Google Scholar] [CrossRef]
  23. Chen, L.-C.; Papandreou, G.; Kokkinos, I.; Murphy, K.; Yuille, A.L. Deeplab: Semantic image segmentation with deep convolutional nets, atrous convolution, and fully connected crfs. IEEE Trans. Pattern Anal. Mach. Intell. 2017, 40, 834–848. [Google Scholar] [CrossRef]
  24. Zhou, Z.; Siddiquee, M.M.R.; Tajbakhsh, N.; Liang, J. Unet++: Redesigning skip connections to exploit multiscale features in image segmentation. IEEE Trans. Med. Imaging 2019, 39, 1856–1867. [Google Scholar] [CrossRef]
  25. Long, J.; Shelhamer, E.; Darrell, T. Fully convolutional networks for semantic segmentation. In Proceedings of the IEEE Conference on Computer Vision and Pattern Recognition, Boston, MA, USA, 7–12 June 2015; pp. 3431–3440. [Google Scholar]
  26. Chen, G.; Hao, K.; Wang, B.; Li, Z.; Zhao, X. A power line segmentation model in aerial images based on an efficient multibranch concatenation network. Expert Syst. Appl. 2023, 228, 120359. [Google Scholar] [CrossRef]
  27. Lin, N.; Quan, H.; He, J.; Li, S.; Xiao, M.; Wang, B.; Pan, J.; Li, N. Urban vegetation extraction from high-resolution remote sensing imagery on SD-UNet and vegetation spectral features. Remote Sens. 2023, 15, 4488. [Google Scholar] [CrossRef]
  28. Wang, Y.; Wu, G.; Guo, Y.; Huang, Y.; Shibasaki, R. Learn to extract building outline from misaligned annotation through nearest feature selector. Remote Sens. 2020, 12, 2722. [Google Scholar] [CrossRef]
  29. Zuo, L.; Gao, S.; Li, Y.; Li, L.; Li, M.; Lu, X. A fast and robust algorithm with reinforcement learning for large UAV cluster mission planning. Remote Sens. 2022, 14, 1304. [Google Scholar] [CrossRef]
  30. Guo, B.; Kuang, Z.; Guan, J.; Hu, M.; Rao, L.; Sun, X. An improved a-star algorithm for complete coverage path planning of unmanned ships. Int. J. Pattern Recognit. Artif. Intell. 2022, 36, 2259009. [Google Scholar] [CrossRef]
  31. Tan, X.; Han, L.; Gong, H.; Wu, Q. Biologically inspired complete coverage path planning algorithm based on Q-learning. Sensors 2023, 23, 4647. [Google Scholar] [CrossRef] [PubMed]
  32. Li, H.; Chen, Y.; Chen, Z.; Wu, H. Multi-UAV cooperative 3D coverage path planning based on asynchronous ant colony optimization. In Proceedings of the IEEE 2021 40th Chinese Control Conference (CCC), Shanghai, China, 26–28 July 2021; pp. 4255–4260. [Google Scholar]
  33. Wu, G.; Wang, M.; Guo, L. Complete Coverage Path Planning Based on Improved Genetic Algorithm for Unmanned Surface Vehicle. J. Mar. Sci. Eng. 2024, 12, 1025. [Google Scholar] [CrossRef]
  34. Liu, C.; Mao, Q.; Chu, X.; Xie, S. An improved A-star algorithm considering water current, traffic separation and berthing for vessel path planning. Appl. Sci. 2019, 9, 1057. [Google Scholar] [CrossRef]
  35. Xing, B.; Yu, M.; Liu, Z.; Tan, Y.; Sun, Y.; Li, B. A review of path planning for unmanned surface vehicles. J. Mar. Sci. Eng. 2023, 11, 1556. [Google Scholar] [CrossRef]
  36. Xia, G.S.; Bai, X.; Ding, J.; Zhu, Z.; Belongie, S.; Luo, J.; Datcu, M.; Pelillo, M.; Zhang, L. DOTA: A large-scale dataset for object detection in aerial images. In Proceedings of the IEEE Conference on Computer Vision and Pattern Recognition, Salt Lake City, UT, USA, 18–22 June 2018; pp. 3974–3983. [Google Scholar]
  37. Cheng, B.; Misra, I.; Schwing, A.G.; Kirillov, A.; Girdhar, R. Masked-attention mask transformer for universal image segmentation. In Proceedings of the IEEE/CVF Conference on Computer Vision and Pattern Recognition, New Orleans, LA, USA, 18–24 June 2022; pp. 1290–1299. [Google Scholar]
  38. Pan, H.; Hong, Y.; Sun, W.; Jia, Y. Deep dual-resolution networks for real-time and accurate semantic segmentation of traffic scenes. IEEE Trans. Intell. Transp. Syst. 2022, 24, 3448–3460. [Google Scholar] [CrossRef]
Figure 1. Two critical challenges in offshore areas for multiple USVs coverage path planning: (a) static obstacles in UAV aerial image; (b) increased number of turns due to obstacles.
Drones 09 00030 g001
Figure 2. General workflow of the proposed algorithm, where the UAV provides extensive obstacles and map information to guide the USVs to generate an obstacle avoidance coverage path.
Drones 09 00030 g002
Figure 3. Flowchart of the semantic segmentation algorithm based on YOLOv5-assisted SAM.
Drones 09 00030 g003
Figure 4. Schematic of the minimum bounding rectangular box.
Drones 09 00030 g004
Figure 5. Schematic of the USV formation.
Drones 09 00030 g005
Figure 6. Schematic of the coverage path of the multiple USVs.
Drones 09 00030 g006
Figure 7. Groups of straight paths with different slopes: (a) straight paths; (b) straight paths and turning paths, where the straight paths can avoid obstacles by connecting turning path.
Drones 09 00030 g007
Figure 8. Semantic segmentation results of UAV aerial images across different scenarios.
Drones 09 00030 g008aDrones 09 00030 g008b
Figure 9. Visual results of the optimal coverage path planned by the coverage path planning algorithm based on multi-objective stepwise optimization (a) M1; (b) M2; (c) M3; (d) M4; (e) M5; (f) M6.
Drones 09 00030 g009
Table 1. SAM segmentation results with different object box prompts.
Bounding Box PromptsmIoUmIoU_s
YOLOv5
(Traditional bounding box)
87.6%82.3%
Improved YOLOv5
(Minimum bounding box)
96.4%93.1%
Table 2. The semantic segmentation comparison results of different segmentation algorithms.
TypeMethodmIoUmIoU_s
Classic semantic segmentation algorithmsU-Net [24]90.6%84.3%
DeeplabV3+ [23]91.4%86.1%
FCN [25]86.2%78.6%
Semantic segmentation algorithms in the past three years Mask2Former [37]92.3%90.2%
DDRNet [38]91.9%87.6%
Proposed algorithm96.4%93.1%
Table 3. The parameters of the UAV and the onboard camera.
ParameterFlight HeightFlight SpeedVertical Field of ViewHorizontal Field of ViewPitch
Angle
Camera
Installation Angle
Value0.1 km36 km/h70°94°−90°~+30°
Table 4. Path planning performance comparison results between the proposed algorithm and the traditional greedy algorithm.
AlgorithmEvaluation IndicatorsM1M2M3M4M5M6
Greedy algorithm [34]Cr (%)100%100%100%100%100%100%
Rr (%)1.1%0.8%5.6%9.3%2.3%19.8%
Lpath (pixel)36,06436,54139,40838,38945,14243,325
TN667610814192131
Proposed CPP algorithmCr (%)100%100%100%100%100%100%
Rr (%)0.1%0%1.1%2.0%0.3%4.1%
Lpath (pixel)36,02136,47538,93537,26844,02341,356
TN5753778381108
Table 5. Path planning performance comparison results between the proposed algorithm and other advanced algorithms.
AlgorithmEvaluation
Indicators
M1M2M3M4M5M6
A* algorithm [30]Cr (%)100%100%100%100%100%100%
Rr (%)0.7%0.5%6.5%10.4%1.2%20.5%
Lpath (pixel)36,04436,48939,44838,38944,57643,885
TN636611113587138
BINN [31]Cr (%)100%100%100%100%100%100%
Rr (%)1.2%1.0%6.0%8.6%2.1%16.9%
Lpath (pixel)36,05336,57039,32237,81645,14342,586
TN687310712991126
ACO [32]Cr (%)100%100%100%100%100%100%
Rr (%)1.1%0.7%5.8%9.0%1.8%18.9%
Lpath (pixel)36,05236,54339,23438,03444,78443,003
TN657010312590131
GA [33]Cr (%)100%100%100%100%100%100%
Rr (%)1.1%0.8%5.5%8.5%2.0%17.8%
Lpath (pixel)36,05436,55639,19837,76844,98742,756
TN67719811793129
Proposed CPP algorithmCr (%)100%100%100%100%100%100%
Rr (%)0.1%0%1.1%2.0%0.3%4.1%
Lpath (pixel)36,02136,47538,93537,26844,02341,356
TN5753778381108
Disclaimer/Publisher’s Note: The statements, opinions and data contained in all publications are solely those of the individual author(s) and contributor(s) and not of MDPI and/or the editor(s). MDPI and/or the editor(s) disclaim responsibility for any injury to people or property resulting from any ideas, methods, instructions or products referred to in the content.

