Abstract
The runway detection algorithm for fixed-wing aircraft is a hot topic in the field of aircraft visual navigation. High accuracy, high fault tolerance, and lightweight design are the core requirements in the domain of runway feature detection. This paper aims to address these needs by proposing a lightweight runway feature detection algorithm named YOMO-Runwaynet, designed for edge devices. The algorithm features a lightweight network architecture that follows the YOMO inference framework, combining the advantages of YOLO and MobileNetV3 in feature extraction and operational speed. Firstly, a lightweight attention module is introduced into MnasNet, and the improved MobileNetV3 is employed as the backbone network to enhance the feature extraction efficiency. Then, PANet and SPPnet are incorporated to aggregate the features from multiple effective feature layers. Subsequently, to reduce latency and improve efficiency, YOMO-Runwaynet generates a single optimal prediction for each object, eliminating the need for non-maximum suppression (NMS). Finally, experimental results on embedded devices demonstrate that YOMO-Runwaynet achieves a detection accuracy of over 89.5% on the ATD (Aerovista Runway Dataset), with a pixel error rate of less than 0.003 for runway keypoint detection, and an inference speed exceeding 90.9 FPS. These results indicate that the YOMO-Runwaynet algorithm offers high accuracy and real-time performance, providing effective support for the visual navigation of fixed-wing aircraft.
1. Introduction
Visual landing navigation is a critical technology in the aviation field, essential for both fixed-wing aircraft and rotary-wing drones. It helps aircraft obtain an accurate position and direction information during landing through the use of cameras and image processing algorithms [1]. High-precision runway image recognition is essential for achieving safe and efficient landings. However, due to the interference of complex environmental conditions, lighting variations, and image noise, achieving high-precision runway detection remains a challenging task. Simultaneously, the demand for lightweight algorithms is also a critical consideration due to the constraints of onboard embedded computing. In recent years, numerous international research teams have focused on navigation methods for fixed-wing aircraft during the approach and landing phases [2]. Runway detection algorithms, as a significant component of visual navigation or integrated navigation systems, have garnered widespread attention from researchers.
Localizing target areas within airport environments is vital for object detection and remote sensing image processing. Single features cannot fully describe targets, leading to the misidentification of non-airport images with linear features (like roads) as airport areas, complicating subsequent recognition and change detection [3]. To address the above issues, researchers have proposed a large-scale remote sensing image airport localization method based on the complementarity of contextual knowledge. This method uses contextual information from airport areas to construct a feature dictionary that includes both shallow visual knowledge and high-level semantic knowledge. The salient maps of the extracted knowledge are then fused. A simple Ostu segmentation method (which determines the threshold based on the analysis of the grayscale histogram of the image) is employed to eliminate false alarms, resulting in the final airport areas [4]. The relative position coordinates and area of the detected airports are also provided.
For runway landmark detection, traditional methods use Sobel and Hough Transform (HT) operators to extract image edges, or calculate results using geometric information such as vanishing points. These methods then construct multiple triangles from the two long sides and the bottom edge of a white rectangle for visual navigation. However, such methods only perform well when the aircraft is near one end of the runway and under optimal lighting conditions [5,6].
Similarly, to address the feature extraction problem in runway detection, Zhang Le et al. [7] proposed a line feature-based runway detection method. This method uses the Hough transform to extract all line segments in the image and then filters out the invalid line segments based on given numerical attribute parameters such as spacing and line length, ultimately extracting the two side edges of the runway. However, this method can only detect the edges of the airport runway and its accuracy is limited. Using a similar image processing approach, the team led by Cao Yunfeng used saliency map analysis to extract the runway ROI, then applied the Hough transform to find the runway edges, and finally identified the upper and lower boundaries of the lines using a gradient projection method. Nevertheless, this method is also limited as it requires the scene to have a salient background and heavily relies on the airport’s prior parameters, making it challenging to apply to different airport detection tasks without modifications [8].
To enhance the generalization capability of runway detection methods and address the limitations of traditional algorithms, many researchers have turned to deep learning methods. For example, Men et al. [9]. proposed a semantic segmentation-based runway detection method for remote sensing images. They used the DeepLabv3 deep Convolutional Neural Network (DCNN), which first employs ResNet50 to extract features and then uses Atrous Spatial Pyramid Pooling (ASPP) to achieve precise segmentation results. However, the polygons obtained from semantic segmentation are not regular, making it difficult to extract runway edges from the segmentation structure when the image quality is low. Moreover, semantic segmentation models have high computational demands, making the real-time processing on embedded devices challenging.
To address issues of real-time performance and low accuracy, Mingqiang Chen et al. utilized MobileNetV3 to construct the backbone [10], and modified its lightweight reduced Atrous Spatial Pyramid Pooling (LRASPP) structure through a recombination module to generate segmentation and line probability maps [11]. Amit proposed an end-to-end airport runway detection network based on a two-stage Faster-RCNN architecture, consisting of a region proposal network and classification layers. This method employs convolutional networks based on regions, transfer learning, domain-specific algorithms, and data augmentation techniques, achieving a runway detection accuracy of 92.1%. However, this approach can only detect runway areas and not the runway edge lines or feature points [12].
Moreover, runway detection and lane detection share technical overlaps in similar dimensional scenarios, such as post-landing detection methods for aircraft. Thus, this study references some advanced lane line detection methods [13]. Zhou S. et al. proposed a detection method using geometric model parameters such as lane starting point, width, curvature, and initial direction [14]. Shen Y. et al. proposed a lane detection method using a region of interest (ROI) and the firefly algorithm. They dynamically adjust the ROI width based on the previous frame’s lane detection results, calculated from the vanishing point [15]. Wang J. et al. [16] employed morphological operations such as erosion and dilation to eliminate the noise points for subsequent density clustering using DBSCAN, facilitating feature point extraction. Finally, the improved RANSAC algorithm was used to fit the feature points. Notably, the method of coarse detection of ROI regions to finely detect feature points helps in the global optimization and approximation of detection results. It is evident that issues such as large-scale camera changes and small distant target areas in runway detection still require careful consideration [17,18,19,20,21].
The analysis of state-of-the-art research reveals the following challenges in current runway detection problems:
- One of the most significant challenges is the highly variable environmental conditions. Factors such as the changing weather, shadows, sun glare, and seasonal variations affect the visual appearance of the runway, complicating the detection process [22].
- Taxiways and apron areas may closely resemble runways, leading to false detections by the detection system [23,24,25].
- High-quality runway image datasets are scarce, primarily due to the restricted access to airport environments and the complexity of capturing aerial images that accurately represent various landing scenarios [26,27,28].
- Currently, many advanced research methods use traditional algorithms for detection in single runway scenarios, making it difficult to achieve high-precision detection in diverse runway scenarios.
- Existing algorithms struggle to meet the real-time operational requirements of embedded systems.
To address these issues and improve the accuracy, real-time performance, and robustness of current runway detection algorithms, this paper proposes the YoMo-Runwaynet real-time runway detection algorithm. The main contributions are as follows:
- A lightweight network structure following the YOMO inference framework is designed, combining the advantages of YOLOv10 and MobileNetV3 in feature extraction and operational speed.
- Firstly, a lightweight attention module is introduced into MnasNet, and the improved MobileNetV3 is used as the backbone network to enhance the feature extraction efficiency. Then, PANet and SPPnet are incorporated to aggregate features from multiple effective feature layers. Finally, to reduce the latency and improve efficiency, YOMO-Runwaynet generates a single optimal prediction for each object, eliminating the need for non-maximum suppression (NMS).
- Experiments conducted on the RK3588 embedded platform show that the proposed runway detection algorithm achieves an accuracy of 89.5%, with an inference speed of ≤40 ms per frame on a single-core NPU.
This paper presents the YOMO-Runwaynet model for the runway keypoint inference algorithms. Additionally, a portion of the Aerovista Runway Dataset, which includes real-world data collected from different airports and simulated data based on the UE platform, is publicly released for research purposes. If you have any questions, you can contact us via email.
2. Methodology
2.1. Yolo Roi Object Detection
By eliminating non-maximum suppression (NMS) and optimizing various model components, YOLOv10 achieves state-of-the-art performance while significantly reducing computational overhead. Extensive experiments have demonstrated its excellent trade-off between accuracy and latency across multiple model scales. Due to the balance between performance and efficiency, the YOLO series has remained at the forefront of this research field. However, the reliance on NMS and architectural inefficiency have limited the achievement of optimal performance. YOLOv10 addresses these issues by introducing dual-task training without NMS and an overall efficiency- and accuracy-driven model design strategy [29,30,31,32].
The architecture of YOLOv10 has undergone several key innovations based on the advantages of previous YOLO models. The model architecture consists of the following components:
- Backbone: Responsible for feature extraction, the backbone network in YOLOv10 utilizes an enhanced version of CSPNet (cross-stage partial network) to improve gradient flow and reduce computational redundancy.
- Neck: It is designed to aggregate the features of different scales and pass them to the head, including the PAN (path aggregation network) layer for efficient multi-scale feature fusion.
- One-to-one head: During inference, it generates a single optimal prediction for each object, eliminating the need for non-maximum suppression (NMS), thus reducing latency and increasing efficiency.
- Consistent matching metric: During assignment, both one-to-one and one-to-many methods use a unified metric to quantitatively evaluate the consistency between predictions and instances. To achieve the prediction-aware matching for these two branches, a unified matching metric is employed.
These innovations significantly enhance YOLOv10’s efficiency while maintaining high performance.
Here, p represents the classification score, and and b denote the predicted and ground truth bounding boxes, respectively. s indicates whether the anchor point of the prediction falls within the spatial prior of the instance. α and β are crucial hyperparameters that balance the impact of semantic prediction tasks and localization regression tasks. The metrics for one-to-many and one-to-one matching are represented as , , respectively. The parameters αo2m, αo2o relate to the weight or confidence in the one-to-many allocation. They adjust the strategy for matching predictions with multiple targets. Higher values of α might increase the strictness of the matching process, thus affecting the training outcomes of the model. βo2m, βo2o: These parameters adjust the matching thresholds or scoring criteria. They define the tolerance or scoring standards for multi-target matching. Higher values of β may relax the matching conditions, allowing more predictions to match targets. These metrics influence label assignment and supervision for the two heads.
2.2. Enhanced MobileNet
MobileNetV3 is a comprehensive upgrade of traditional MobileNet models, designed for efficient mobile neural networks. It uses depthwise separable convolutions to enhance the computational efficiency by separating spatial filtering and feature generation. Specifically, this involves a lightweight depthwise convolution layer for spatial filtering and a more complex 1 × 1 pointwise convolution layer for feature generation [33,34,35]. Linear bottlenecks and inverted residual structures are introduced to handle low-rank problems more efficiently. This architecture includes a 1 × 1 expansion convolution layer, followed by a depthwise convolution layer, and finally a 1 × 1 projection layer, maintaining residual connections when input and output channels are equal. This design ensures compact input and output representations while expanding to higher-dimensional feature spaces internally, enhancing each channel’s nonlinear transformation capabilities. In MnasNet, the lightweight attention modules are introduced after the expanded depthwise convolution layers to focus on critical features. These modules are effectively utilized for a more efficient model. Traditional swish and squeeze-and-excitation modules use the sigmoid function, which is inefficient and it is difficult to maintain precision in fixed-point arithmetic. By adopting a modified swish nonlinear function and introducing hard sigmoid to replace the traditional sigmoid function, MobileNetV3 improves the computational efficiency and accuracy. Specifically, the structural block design of the network is shown in Figure 1.
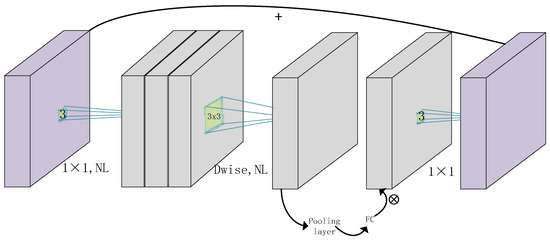
Figure 1.
Mobilenet V3 block structure (using depthwise separable convolutions to enhance the computational efficiency by separating the spatial filtering and feature generation).
In the network structure, the input image first passes through a 1 × 1 convolutional kernel combined with a nonlinear activation function (NL). This step primarily adjusts the number of channels while introducing nonlinearity. Next, it goes through a depthwise separable convolution layer, where each input channel undergoes a 3 × 3 spatial convolution operation (Dwise). This design significantly reduces the computational complexity and the number of parameters, enhancing computational efficiency while maintaining feature extraction capabilities.
Following this, a pooling layer is used to downsample the feature map, reducing the spatial dimensions to extract more abstract features. The feature map then goes through a fully connected layer (FC) for further processing and weight computation, typically flattening the feature map into a one-dimensional vector for easier feature fusion and classification.
Another 1 × 1 convolutional kernel is then applied to further adjust the number of channels and introduce nonlinearity, fine-tuning the number of channels in the feature map. Finally, a skip connection is used to add the input directly to the output. This design helps mitigate the vanishing gradient problem and improves the model’s training performance.
3. Architectural Design of Neural Networks
3.1. Architectural Design of YOMO-Runwaynet
Using MobileNetV3 as the backbone, we enhance the extraction of features from the three initial effective feature layers by leveraging two new operations: pointwise group convolution and channel shuffle. This approach significantly reduces the computational costs while maintaining accuracy. The designed MobileNetV3 uses a shortcut network architecture, replacing elementwiseadd with concatenation and incorporating PANet. Unlike dense connections, channel shuffling improves function mixing, greatly enhancing the real-time performance. MobileNetV3 serves as Runwaynet’s backbone, excelling in runway detection tasks with Runwaynet and Runwaynet0.5. The network structure is shown in Figure 2.

Figure 2.
The YOMO-Runwaynet network framework.
- Backbone network: MobileNetV3 extracts three initial effective feature layers from the images.
- Enhanced feature extraction network: Using SPP and PANet to fuse and optimize the initial feature layers for better results.
- Prediction network head: Utilizes extracted runway features to make predictions and produce results.
During the bottom–up process, the size of the feature maps changes after certain layers while remaining unchanged after others. Features are extracted from the last layer of each stage to construct a feature pyramid. Higher-level feature maps undergo nearest-neighbor upsampling and are then connected laterally to lower-level features, thereby enhancing the higher-level features. This upsampling process inserts new elements between existing pixels to enlarge the original image size. This ensures that the upsampled feature maps match the size of the feature maps from subsequent layers, allowing the utilization of lower-level spatial detail information.
In YOMO-Runwaynet, an improved MobileNetV3 serves as the backbone network. For the neck, SPP (spatial pyramid pooling) and PAN (path aggregation network) are used to aggregate features. In the head, both regression and classification are employed to generate a single optimal prediction per object during inference. This approach eliminates the need for non-maximum suppression (NMS), thereby reducing latency and enhancing efficiency.
3.2. Branch Calculation Method of YOMO-Runwaynet
Specifically, in the YOMO-Runwaynet detection algorithm, our goal is to design the network with a focus on efficiency and accuracy. The input image is first divided into sub-images. If the center of a target to be detected falls within one of these sub-images, B prediction boxes is generated around that sub-image to include the target. The internal structure of the network, as shown in Figure 3, consists of three main components: the backbone, the neck, and the head.
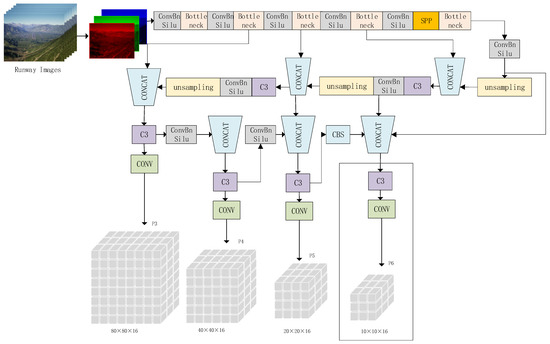
Figure 3.
YOMO-Runwaynet module branch calculation method.
- Backbone: Utilizes the improved MobileNetV3 for feature extraction.
- Neck: Employs SPP (spatial pyramid pooling) and PAN (path aggregation network) for feature aggregation.
- Head: Combines regression and classification to produce a single optimal prediction for each object during inference, eliminating the need for non-maximum suppression (NMS) to reduce latency and enhance efficiency.
In Figure 3, a key block called ConvBnSilu is defined, as shown in the figure. This block consists of a Conv layer, BN layer, and SILU activation function. The ConvBnSilu block is utilized in many other blocks. Figure 3 also shows the output labels of the head, including the bounding box (bbox), confidence (conf), classification (cls), and four Landmarks (the four corner points of the runway). Landmarks are a new addition to YOMO-Runwaynet, making it a runway detector with landmark outputs. Without Landmarks, the final dimension 16 should be 6. The output dimensions in P3 are , in P4 are , in P5 are , and in P6 are , with each anchor size adjusted as needed. The specific structures of the modules are detailed in Figure 4.

Figure 4.
Runwaynet internal structure.
The Stem structure in YOMO-Runwaynet replaces the original focus layer. Inspired by DenseNet, the C3 module splits the input into two halves: one half goes through a ConvBnSilu block, several Bottleneck blocks, and then a Conv layer, while the other half goes through a Conv layer before being merged, followed by another ConvBnSilu block. As shown in the SPPnet module, YOMO-Runwaynet modifies kernel sizes from 13 × 13, 9 × 9, 5 × 5 to 7 × 7, 5 × 5, 3 × 3, enhancing the runway detection performance. The fc layer predicts class-agnostic foreground/background masks efficiently and with better generalization by utilizing a larger variety of training samples. The mask size is 28 × 28, reshaped to match the FCN-predicted mask’s spatial size. Final mask prediction is achieved by adding FCN masks for each class with the fc foreground/background prediction, avoiding the compression of hidden spatial feature maps into short feature vectors, which helps retain spatial information.
4. Runway Geographic Information Point Extraction
4.1. Runway Keypoint Detection Method
In YOMO-Runwaynet, runway detection is treated as a general object detection task. From a data perspective, features such as pose, scale, occlusion, lighting, and blur present in runway detection also appear in other detection tasks. From a runway-specific perspective, features like the four corner points, landmarks, and runway edges correspond to general shape and color variations in other detection problems. Landmarks are special but not unique as they are just the key points of an object, similar to license plate detection. Adding landmark regression to the head of an object prediction model is straightforward. Challenges in runway detection, such as large scale, small runway, and dense scenes, are common in general object detection. Therefore, runway detection can be considered a sub-task of general object detection. The definition of the runway feature points is shown in Figure 5.
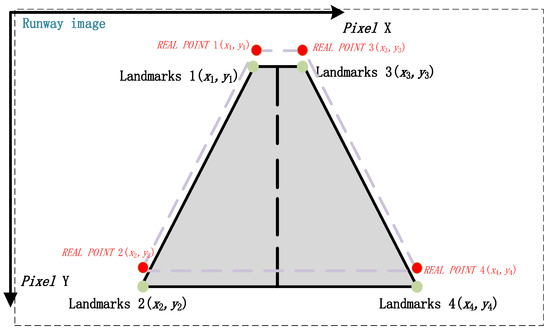
Figure 5.
Definition of the runway feature corner point information.
In YOMO-Runwaynet, runway detection is treated as a general object detection task. From a data perspective, features such as pose, scale, occlusion, lighting, and blur present in runway detection also appear in other detection tasks. From a runway-specific perspective, features like the four corner points, landmarks, and runway edges correspond to general shape and color variations in other detection problems. Landmarks are special but not unique as they are just the key points of an object, similar to license plate detection. Adding landmark regression to the head of YoMo-RunwayNet object prediction model is straightforward. Challenges in runway detection, such as large scale, small runway, and dense scenes, are common in general object detection. Therefore, runway detection can be considered a sub-task of general object detection.
4.2. Runway Landmarks Loss Wing
Due to the Gaussian distribution of key sample point features in actual runway data, the detection of runway feature points is considered during the mid-phase when the aircraft is between 600 ft and 100 ft above ground with a runway lateral pixel greater than 5. The network training focuses more on samples with small or medium errors. As a result, YOMO-Runwaynet employs a new loss function designed to address these considerations.
In previous key point detection tasks, common loss functions for landmark regression were L2, L1, or smooth-L1. MTCNN used the L2 loss function. However, these loss functions are not sensitive to small errors. To overcome this issue, Wing loss was proposed:
As shown in the Formula (2), the positive number limits the range of the nonlinear part to the interval. Conain the curvature of the nonlinear region, and is a constant smooth to connect the linear and nonlinear parts of the segment. The value of is a small value, because it will make the network training unstable, and will cause the gradient explosion problem due to a small error. The actual non-linear part of the function simply takes the curve of between and scales it to W along the X and Y axes. In addition, translation is applied along the Y axis to make , and continuity is imposed on the loss function.
The loss function of the landmark point vector and its ground truth is:
where is the predicted value and is the true value.
The target detection loss function in the ROI detection network is , then the new total loss function is:
where is the weighting factor of the landmark regression loss function.
Landmark acquisition: where i = 1, 2, …, 8, correspond to the x and y of the upper left, lower left, upper right and lower right corners of the runway, respectively.
In this paper, we analyze and compare the three loss functions of L1, L2, and smooth L1.
where s is the ground-truth of the runway key point, the function is equivalent to:
The L1 loss function expression is given as follows:
The rate of change of the L1 loss function is:
The L2 loss function expression is given as follows:
The rate of change of the L2 loss function is:
Smooth L1. The loss function definition and its rate of change are shown in Equations (10) and (11).
The Wing loss function used in this paper is compared with other loss functions, as shown in Figure 6. Notably, the Smooth L1 loss is a special case of the Huber loss. While the L2 loss function has been widely used in previous keypoint detection tasks, it is more sensitive to outliers. The comparison demonstrates the Wing loss function’s effectiveness in reducing the impact of outliers and improving performance in keypoint detection tasks.
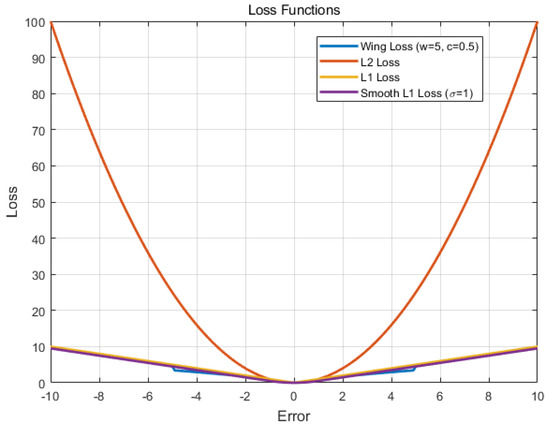
Figure 6.
Loss function.
For the L2 loss function, as x increases, the gradient of the L2 loss with respect to x also increases. This leads to instability during the initial training phase when the predicted values significantly differ from the ground truth, as the large gradients result in unstable training. The L1 loss function has a constant gradient, and during the later training stages, when the difference between the predicted values and ground truth is small, the absolute value of the gradient remains 1. If the learning rate remains unchanged, the loss function will fluctuate near a stable value, making it difficult to achieve higher accuracy.
The smooth L1 loss function addresses this by having smaller gradients for small x and limiting the gradient for large x, preventing the significant disruption of network parameters. The Wing loss function presented in this paper perfectly avoids the shortcomings of both L1 and L2 losses, offering stability and precision.
For the L2 loss function, when x increases, the gradient of L2 loss to x also increases, which leads to the difference in the beginning of training, when the predicted value from groundtruth is too large, the gradient of the loss function on the predicted value is very large, leading to unstable training. The gradient of the L1 loss function is constant. In the late training, the difference between the predicted value and ground-truth is small, and the absolute value of the predicted derivative is still 1. At this time, if the learning rate (learning rate) remains unchanged, the loss function will fluctuate near the stable value, and it is difficult to continue to converge to achieve higher accuracy. For the smooth L1 loss function, at x is small, the gradient was also small, while x is large, the absolute value of the gradient for x would not be so large as to destroy the network parameters. The wing loss function presented here perfectly avoids the defects of L1 and L2 loss. The results of the analysis are shown in Table 1.

Table 1.
Characteristics and applicable scenarios of different loss functions.
5. Aerovista Runway Dataset
The training and testing of the YOMO-Runwaynet algorithm is based on real flight data collection and UE platform simulation, utilizing the Aerovista Runway Dataset (ATD). This dataset includes runway data from eight different scenarios covering various terrains such as mountains, cities, farmland, and oceans, reflecting typical global airports. To ensure robustness, the data are further divided into different weather conditions like sunny, rainy, snowy, and foggy, totaling 16 scenarios. The dataset comprises 11,904 sequential images, including multi-runway civil airports and infrared runway data, as shown in Figure 7.
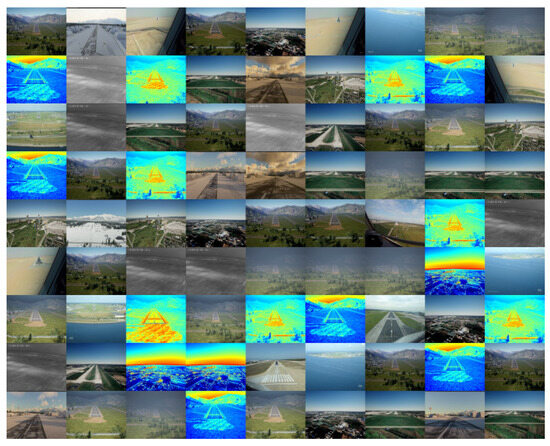
Figure 7.
Aerovista runway dataset (airport runway data for each scenario).
Due to the difficulty in obtaining high-quality runway image data, existing public runway datasets are still in their early stages. To advance runway feature detection and visual positioning navigation algorithms, this paper publicly shares high-quality sequential image data from mountain scenarios under various weather conditions for researchers to use as a common dataset.
The specifics of the Aerovista Runway Dataset (ATD) are detailed in Table 2. Multiple datasets were collected using different camera parameters and resolutions. This study considers the influence of various factors such as the different camera sampling frequencies, field of view angles, and varying weather and environmental conditions on the runway feature imaging in large-scale high-altitude scenarios. The collected runway data meet international standards for the visual approach to landing the aircraft.

Table 2.
Aerovista runway dataset composition and runway data collection conditions.
6. Testing and Verification
6.1. YOMO-Runwaynet Training and Testing
The proposed YOMO-Runwaynet algorithm was evaluated on the Aerovista Runway Dataset (ATD) containing 11,904 runway images. The dataset was split, with 80% for training and 20% for testing. During the training of YOMO-Runwaynet, the initial learning rate can be set to 0.001. StepLR is chosen for the learning rate scheduling, with a total of 400 training epochs. The learning rate decays to 0.1 times its original value every 10 epochs. The maximum gradient norm is set to 2.0.
The mean average precision (mAP) was used as the evaluation metric. After 400 epochs of training, the precision of the YOMO-Runwaynet converged to 0.855. The recall of YOMO-Runwaynet converged to 0.829, and mAP also converged to 0.895. as shown in Figure 8a,b, respectively.
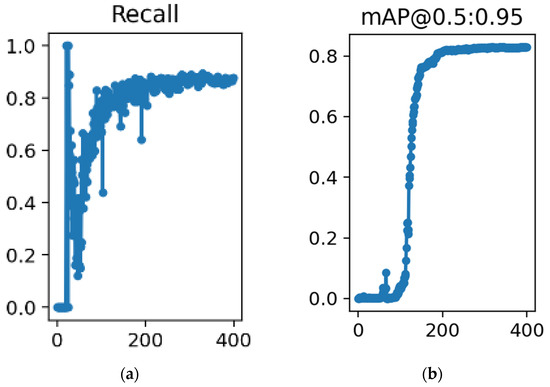
Figure 8.
Results after model convergence (in the indicators of YOMO-Runwaynet: (a) model recall convergence results; and (b) the mAP results of the model).
After training with 400 epochs, the trained model was verified on the ATD-1080p multi-scene dataset, and the detection results were visualized. The inference results of multiple sets of scenes and different weather are shown in Figure 9.
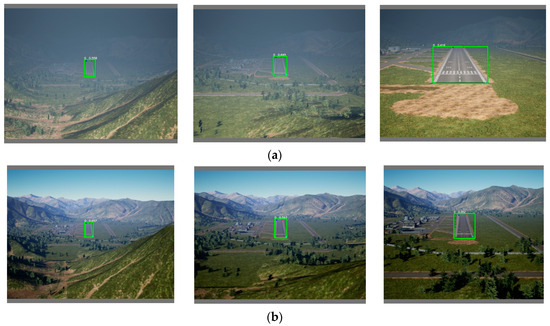

Figure 9.
YOMO-Runwaynet testing results on the ATD mountain scene dataset (data from different altitude segments in mountain scenes: each group from left to right corresponds to altitudes of 300 ft, 200 ft, and 150 ft. Each row represents a set of data corresponding to: (a) foggy day; (b) sunny day; and (c) rainy and snowy day).
The detection results show that YOMO-Runwaynet achieved runway detection outcomes at different flight altitudes in the ATD-Mountain dataset’s mountain scenarios. As illustrated in Figure 9a, the results are shown for foggy conditions at flight altitudes of 300 ft, 200 ft, and 150 ft.
Additionally, experiments were conducted based on the ATD-City scenario, which included urban scenes with different visible light camera installation angles and infrared data detection results, as shown in Figure 10.
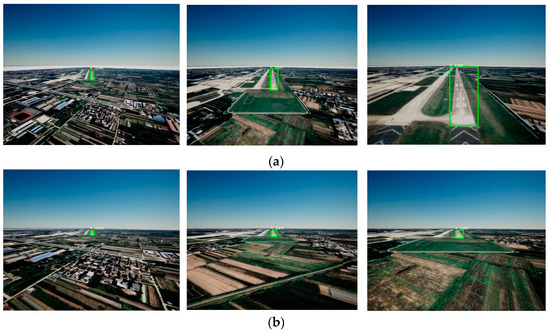
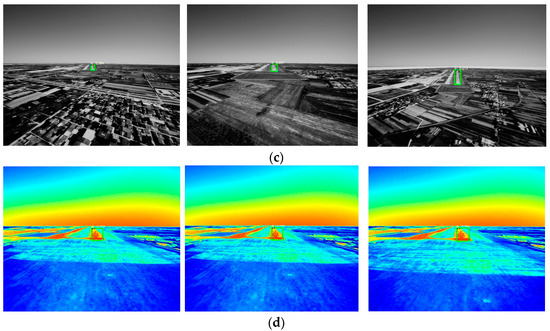
Figure 10.
YOMO-Runwaynet testing results on the ATD urban scene dataset (data from different altitude segments in urban scenes: each group starts from the first column with altitudes of 600 ft, 300 ft, and 150 ft. Each row represents a set of data corresponding to: (a) sunny day with dual runways, camera installation angle 0°; (b) sunny day with dual runways, camera installation angle 3.5°; (c) urban scene with infrared camera; (d) farmland scene, camera installation angle 5°).
From the results, it can be seen that the proposed YOMO-Runwaynet achieves effective visual detection under urban scenarios, meeting the requirements for corner point extraction. In Figure 10a,b, with camera installation angles of 3.5° and 0°, respectively, the visual distortion caused by large-scale information and field of view is evident, showing noticeable shape differences of the airport runway in the images. Despite this, the algorithm performs well on both datasets. Similarly, Figure 10c,d show detection results in environments with features similar to runways, such as multiple runways in urban areas and farmland. YOMO-Runwaynet accurately delineates the runway ROI and extracts the characteristic corner points of the runway. In summary, YOMO-Runwaynet consistently detects runways in various weather conditions, different scenes, and with different camera sensors (infrared and visible light), demonstrating a strong generalization capability and high accuracy in runway feature point detection.
6.2. Geographic Beacon Point Detection Pixel Error
The detection of runway key points is performed by comparing the detected values with the ground truth pixel values. To account for pixel noise errors, the pixel comparison experiments utilize visual Gaussian noise modeling. This method introduces random noise in both horizontal and vertical directions to simulate noise in images collected under various extreme weather conditions.
The row pixel error transfer coefficient for airport runway feature points is denoted as , and the column pixel error transfer coefficient is denoted as . The standard deviations of row and column pixel errors (, ) are represented as and , respectively. The simplification is expressed as:
correlation, .
Assuming that each parameter follows a Gaussian distribution with zero mean, the variables are independent of each other, and the correlation coefficient is zero, then the row, column pixel error and approximately follow a Gaussian distribution with zero mean, as follows:
Based on the YOMO-Runwaynet detection of the 800 ATD runway continuous data test sets (including Gaussian noise), the runway sequence data resolution is 1920 × 1080. The four corners are defined as . Known geographic beacon latitude, longitude, height information, and pixel coordinate values were analyzed and compared, as shown in Figure 11.
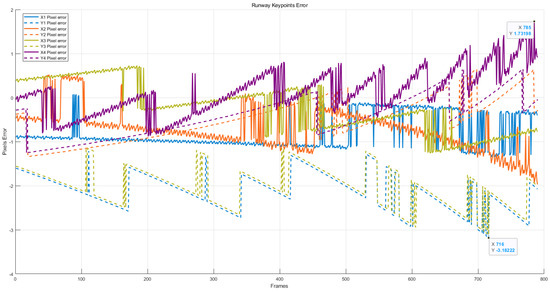
Figure 11.
Horizontal and longitudinal pixel error of runway feature points.
The definition of the detected corner points is shown in Figure 11. REALPOINT 1–4 and landmarks 1–4 represent the pixel ground truth and YOMO-Runwaynet detection values for the four corner points, respectively. These points correspond to the runway’s top–left (X1, Y1), bottom–left (X2, Y2), top–right (X3, Y3), and bottom–right (X4, Y4) corners. The pixel error results for these key points are calculated based on the feature corner error Equations (11)–(14). It can be seen that the lateral pixel X1 in the upper left corner has a maximum error of 1.12, The longitudinal pixel Y1 error is 3.18; the lateral pixel X2 at the lower left point has a maximum error of 1.98, Y2 maximum pixel difference is 1.3. This is available for the above analysis. The maximum pixel difference in the upper-right point is X3 Error max = 1.25, respectively, Y3 Error max = 3.05. The lower right point pixel error is X4 Error max = 1.73, Y4 Error max = 1.25. In conclusion, in the 1080p ATD runway test set containing Gaussian noise, the pixel error of the detection algorithm can be achieved: the pixel error rate of the lateral Xi detection is less than 0.001, and the pixel error rate of longitudinal Yi detection is less than 0.003.
6.3. Algorithm Robustness Verification Results
Weather conditions are a crucial factor in runway visual detection tasks. As discussed in Section 5 of this paper, the ATD dataset includes various airport runway data under different weather conditions such as rain, fog, and snow. These weather variations directly impact the accuracy of runway detection algorithms during flight operations. Section 6.2 of this paper conducted an independent evaluation of the X and Y coordinate errors for each corner point, demonstrating the high accuracy of the corner point detection by the algorithm. Additionally, we performed accuracy validation using three sets of ATD simulation data under rain, snow, and fog conditions to derive a comprehensive performance evaluation of YOMO-Runwaynet. The experimental results are presented in Table 3.

Table 3.
Performance results of YOMO-Runwaynet on runway data detection in different airport environments.
YOMO-Runwaynet has been validated on runway data below 600 ft in different weather conditions. The experiments evaluated the algorithm’s comprehensive performance (noise resistance and generalization ability) from various angles, including weather conditions, visibility, and artificial noise. The results show that, for runway data in four different weather conditions, the proposed algorithm achieved a detection accuracy of 93.5% on simulated clear weather visible light mountain runway data. The average pixel coordinate detection error of the four runway corners was −0.8359, with an RMSE of 1.6, which is better than the comprehensive data detection results.
In extreme weather conditions, the detection accuracy in foggy weather was 87.6%, slightly lower than in clear, rainy, and snowy weather. This is mainly because, at an altitude of 600 ft in foggy weather, runway visibility is low, and the visible distance is short. Although data augmentation strategies were applied to all data during the experiments to enhance the algorithm’s detection accuracy, environmental noise inevitably affects the detection results. Therefore, the average corner error and RMSE were 1.193 and 2.06, respectively.
Additionally, comparing infrared clear weather data with visible light data, the detection accuracy of the infrared real runway data was 88.2%, which met expectations and showed no significant difference from the simulated data. This indicates that YOMO-Runwaynet can achieve excellent detection results under extreme weather and different visibility conditions.
Furthermore, in the runway data detection experiment with added horizontal and vertical random Gaussian noise of two pixels, the average corner error was 2.32 pixels, and the RMSE was 2.52. This is primarily due to the higher randomness of artificial noise. Overall, in the verification of extreme weather runway data, different visibility condition data (visible/infrared), and artificial noise data, YOMO-Runwaynet achieved satisfactory results.
6.4. Ablation Study and Performance of the Model
The YOMO-Runwaynet model adopts a lightweight network structure, featuring models of varying scales such as YOMO-Runwaynet-s and YOMO-Runwaynet-n. The complexity of these models increases with the network scale, with YOMO-Runwaynet-s having higher complexity. The YOMO-Runwaynet algorithm transforms the entire object detection task into a single neural network’s forward propagation process, resulting in fast inference speed. The inference speed of the YOMO-Runwaynet model depends on the model scale and hardware. This study uses an embedded edge computing platform to conduct comparative tests of several algorithms. The YOMO-Runwaynet-n lightweight model is used, with the model parameters shown in Table 4.

Table 4.
Real-time performance and accuracy metrics of advanced existing models.
The number of parameters in the YOMO-Runwaynet model increases with the scale of the model. Smaller models have fewer parameters, while larger models have more, leading to increased storage space requirements and computational complexity. Based on the demands of fixed-wing aircraft visual navigation and the need for real-time performance on embedded systems, YOMO-Runwaynet achieves a detection accuracy of up to 85%. The YOMO-Runwaynet-n model boasts a latency of less than 11ms, enabling nearly 90.9 FPS processing speed. Overall, YOMO-Runwaynet performs excellently in runway detection tasks.
In summary, the research of YOMO-Runwaynet focuses on accuracy, real-time performance, and robustness as core algorithm indicators. Through verification and analysis, the main structural advantages of YOMO-Runwaynet include the following points: (1) The proposed YOMO-Runwaynet algorithm features high accuracy and lightweight characteristics, enabling the model to run efficiently, even in environments with limited computing resources. By significantly reducing the model’s parameter count and computational load through depthwise separable convolutions, it reduces the memory requirements and increases detection speed. (2) In addition to maintaining the model’s lightweight nature, it still possesses strong feature extraction capabilities. This is mainly due to its efficient block structure and the activation functions used in this paper, allowing for high detection accuracy even with low latency. (3) The YOMO-Runwaynet model performs excellently, not only on PCs, but also in environments with limited memory and computing power, such as mobile devices and embedded systems. Experimental results show that this combined model maintains high accuracy and fast response times in various real-world runway scenarios. (4) In the field of runway detection discussed in this paper, the detection algorithm needs to quickly and accurately detect targets. (5) The proposed YOMO-Runwaynet model can provide low-latency and high-accuracy detection results in rainy, snowy, and foggy weather as well as various runway scenarios, thereby enhancing the overall performance and robustness of the detection algorithm.
7. Conclusions
Visual landing navigation is a crucial technology in the aviation field, assisting pilots in acquiring accurate position and direction information during aircraft landing. In the task of runway image detection, the high-precision detection of runway landmarks is key to achieving safe and efficient landings. Therefore, this paper designs a lightweight network structure following the YOMO inference framework, combining the advantages of YOLO and MobileNetV3 in feature extraction and operational speed. Firstly, a lightweight attention module is introduced into MnasNet, and the improved MobileNetV3 is used as the backbone network to enhance the feature extraction efficiency. Then, PANet and SPPnet are incorporated to aggregate features from multiple effective feature layers. Finally, to reduce latency and improve efficiency, YOMO-Runwaynet generates a single optimal prediction for each object, eliminating the need for non-maximum suppression (NMS).
Validation on the RK3588 embedded platform shows that the proposed algorithm achieves an accuracy of 89.5% on the ATD runway dataset, with an inference speed of ≤40 ms per frame on a single-core NPU. The detection accuracy for the horizontal pixel Xi exceeds 99.9%, and for the vertical pixel Yi, exceeds 99.7%.
In summary, the proposed YOMO-Runwaynet can achieve the high-precision detection of runway corner points in different scenarios and weather conditions, meeting the real-time requirements of edge devices, and providing visual front-end results for the research on the automatic landing of fixed-wing aircraft. Additionally, the YOMO-Runwaynet detection algorithm and a portion of the Aerovista Runway Dataset are publicly released for research use.
8. Patents
An invention patent application has been submitted for this study, and the patent has been accepted for review.
Author Contributions
Conceptualization, W.D. and Z.Z. (Zhengjun Zhai); methodology, W.D. and S.S.; software, X.L.; validation, L.W. and W.D.; formal analysis, W.D., L.W. and D.W.; investigation, W.D., S.S. and S.L.; resources, Z.Z. (Zhaozi Zu); data curation, X.L., D.W. and W.D.; writing—original draft preparation, W.D.; writing—review and editing, W.D. and L.W.; visualization, X.L. and W.D.; supervision, Z.Z. (Zhengjun Zhai); project administration, Z.Z. (Zhaozi Zu); funding acquisition, Z.Z. (Zhengjun Zhai). All authors have read and agreed to the published version of the manuscript.
Funding
This research was funded by the Ministry of Industry and Information Technology of the People’s Republic of China and AVIC Xi’an Flight Automatic Control Research Institute, grant number [MJZ1-8N22].
Data Availability Statement
The source code and test dataset are available at: https://github.com/davidw369/YoMoRunwaynet, accessed on 15 July 2024.
Conflicts of Interest
The authors declare that there are no conflicts of interest regarding the publication of this paper.
Correction Statement
This article has been republished with a minor correction to the existing affiliation information. This change does not affect the scientific content of the article.
References
- Wang, Z.; Zhao, D.; Cao, Y. Visual Navigation Algorithm for Night Landing of Fixed-Wing Unmanned Aerial Vehicle. Aerospace 2022, 9, 615. [Google Scholar] [CrossRef]
- Guo, M. Airport localization based on contextual knowledge complementarity in large scale remote sensing images. EAI Endorsed Trans. Scalable Inf. Syst. 2022, 9, e5. [Google Scholar] [CrossRef]
- Yin, S.; Li, H.; Teng, L. Airport Detection Based on Improved Faster RCNN in Large Scale Remote Sensing Images. Sens. Imaging 2020, 21, 49. [Google Scholar] [CrossRef]
- Wang, Q.; Feng, W.; Yao, L.; Zhuang, C.; Liu, B.; Chen, L. TPH-YOLOv5-Air: Airport Confusing Object Detection via Adaptively Spatial Feature Fusion. Remote Sens. 2023, 15, 3883. [Google Scholar] [CrossRef]
- Li, H.; Kim, P.; Zhao, J.; Joo, K.; Cai, Z.; Liu, Z.; Liu, Y. Globally optimal and efficient vanishing point estimation in atlanta world. In Proceedings of the European Conference on Computer Vision, Glasgow, UK, 17 November 2020; pp. 153–169. [Google Scholar]
- Lin, Y.; Wiersma, R.; Pintea, S. Deep vanishing point detection: Geometric priors make dataset variations vanish. In Proceedings of the IEEE Conference on Computer Vision and Pattern Recognition (CVPR), New Orleans, LA, USA, 18–24 June 2022; pp. 6103–6113. [Google Scholar]
- Zhang, L.; Cheng, Y.; Zhai, Z. Real-time Accurate Runway Detection based on Airborne Multi-sensors Fusion. Def. Sci. J. 2017, 67, 542–550. [Google Scholar] [CrossRef]
- Xu, Y.; Cao, Y.; Zhang, Z. Monocular Vision Based Relative Localization For Fixed-wing Unmanned Aerial Vehicle Landing. Sensors 2022, 29, 1–14. [Google Scholar]
- Men, Z.C.; Jiang, J.; Guo, X.; Chen, L.J.; Liu, D.S. Airport runway semantic segmentation based on DCNN in high spatial resolution remote sensing images. Int. Arch. Photogramm. Remote Sens. Spat. Inf. Sci. 2020, 42, 361–366. [Google Scholar] [CrossRef]
- Ding, W.; Wu, J. An airport knowledge-based method for accurate change analysis of airport runways in VHR remote sensing images. Remote Sens. 2020, 12, 3163. [Google Scholar] [CrossRef]
- Chen, M.; Hu, Y. An image-based runway detection method for fixed-wing aircraft based on deep neural network. IET Image Process. 2024, 18, 1939–1949. [Google Scholar] [CrossRef]
- Amit, R.A.; Mohan, C.K. A robust airport runway detection network based on R-CNN using remote sensing images. IEEE Aerosp. Electron. Syst. Mag. 2021, 36, 4–20. [Google Scholar] [CrossRef]
- Hao, W.Y. Review on lane detection and related methods. Cogn. Robot. 2023, 3, 135–141. [Google Scholar] [CrossRef]
- Zhou, S.; Jiang, Y.; Xi, J.; Gong, J.; Xiong, G.; Chen, H. A novel lane detection based on geometrical model and gabor filter. In Proceedings of the 2010 IEEE Intelligent Vehicles Symposium, La Jolla, CA, USA, 21–24 June 2010; pp. 59–64. [Google Scholar]
- Shen, Y.; Bi, Y.; Yang, Z.; Liu, D.; Liu, K.; Du, Y. Lane line detection and recognition based on dynamic ROI and modified firefly algorithm. Int. J. Intell. Robot. Appl. 2021, 5, 143–155. [Google Scholar] [CrossRef]
- Wang, J.; Hong, W.; Gong, L. Lane detection algorithm based on density clustering and RANSAC. In Proceedings of the 2018 Chinese Control And Decision Conference (CCDC), Shenyang, China, 9–11 June 2018; pp. 919–924. [Google Scholar]
- Bhavadharini, R.M.; Sutha, J. A Robust Road Lane Detection Using Computer Vision Approach for Autonomous Vehicles. In Proceedings of the 2024 International Conference on Advances in Data Engineering and Intelligent Computing Systems (ADICS), Chennai, India, 18–19 April 2024; pp. 1–6. [Google Scholar]
- Wang, W. OpenCV-based Lane Line Detection Method for Mountain Curves. Acad. J. Sci. Technol. 2024, 10, 79–82. [Google Scholar] [CrossRef]
- Kishor, S.; Nair, R.R.; Babu, T.; Sindhu, S.; Vilashini, S.V. Lane Detection for Autonomous Vehicles with Canny Edge Detection and General Filter Convolutional Neural Network. In Proceedings of the 2024 11th International Conference on Computing for Sustainable Global Development (INDIACom), New Delhi, India, 28 February–1 March 2024; pp. 1331–1336. [Google Scholar]
- Li, Z.; Lan, P.; Zhang, Q.; Yang, L.; Nie, Y. Lane Line Detection Network Based on Strong Feature Extraction from USFDNet. In Proceedings of the 2024 IEEE 4th International Conference on Power, Electronics and Computer Applications (ICPECA), Shenyang, China, 26–28 January 2024; pp. 229–234. [Google Scholar]
- Gong, X.; Abbott, L.; Fleming, G. A survey of techniques for detection and tracking of airport runways. In Proceedings of the 44th AIAA Aerospace Sciences Meeting and Exhibit, Reno, Nevada, 9–12 January 2006; pp. 1436–1449. [Google Scholar]
- Zhao, Y.; Chen, D.; Gong, J. A Multi-Feature Fusion-Based Method for Crater Extraction of Airport Runways in Remote-Sensing Images. Remote Sens. 2024, 16, 573. [Google Scholar] [CrossRef]
- Luo, Q.; Chen, J.; Zhang, X.; Zhang, T. Multi-scale target detection for airfield visual navigation of taxiing aircraft. In Proceedings of the 2024 4th International Conference on Neural Networks, Information and Communication (NNICE), Guangzhou, China, 19–21 January 2024; pp. 749–753. [Google Scholar]
- Zakaria, N.J.; Shapiai, M.I.; Abd Ghani, R.; Yassin, M.N.M.; Ibrahim, M.Z.; Wahid, N. Lane detection in autonomous vehicles: A systematic review. IEEE Access 2023, 11, 3729–3765. [Google Scholar] [CrossRef]
- Haris, M.; Hou, J.; Wang, X. Lane line detection and departure estimation in a complex environment by using an asymmetric kernel convolution algorithm. Vis. Comput. 2023, 39, 519–538. [Google Scholar] [CrossRef]
- Dai, J.; Wu, L.; Wang, P. Overview of UAV target detection algorithms based on deep learning. In Proceedings of the 2021 IEEE 2nd International Conference on Information Technology, Big Data and Artificial Intelligence (ICIBA), Chongqing, China, 17–19 December 2021; Volume 2, pp. 736–745. [Google Scholar]
- Li, N.; Liang, C.; Huang, L.Y.; Chen, J.; Min, J.; Duan, Z.X.; Li, J.; Li, M.C. Framework for Unknown Airport Detection in Broad Areas Supported by Deep Learning and Geographic Analysis. Appl. Earth Obs. Remote Sens. 2021, 14, 6328–6338. [Google Scholar] [CrossRef]
- Boukabou, I.; Kaabouch, N. Electric and magnetic fields analysis of the safety distance for UAV inspection around extra-high voltage transmission lines. Drones 2024, 8, 47. [Google Scholar] [CrossRef]
- Wang, C.-Y.; Yeh, I.-H.; Liao, H.-Y. Yolov9: Learning what you want to learn using programmable gradient information. arXiv 2024, arXiv:2402.13616. [Google Scholar]
- Li, C.; Li, L.; Geng, Y.; Jiang, H.; Cheng, M.; Zhang, B.; Ke, Z.; Xu, X.; Chu, X. Yolov6 v3.0: A full-scale reloading. arXiv, 2023; arXiv:2301.05586. [Google Scholar]
- Niu, S.; Nie, Z.; Li, G.; Zhu, W. Early Drought Detection in Maize Using UAV Images and YOLOv8+. Drones 2024, 8, 170. [Google Scholar] [CrossRef]
- Hosang, J.; Benenson, R.; Schiele, B. Learning Non-maximum Suppression. In Proceedings of the IEEE Conference on Computer Vision and Pattern Recognition (CVPR), Honolulu, HI, USA, 21–26 July 2017; pp. 6469–6477. [Google Scholar]
- Howard, A.; Sandler, M.; Chu, G.; Chen, L.C.; Chen, B.; Tan, M.; Wang, W.; Zhu, Y.; Pang, R.; Vasudevan, V.; et al. Searching for MobileNetV3. In Proceedings of the IEEE/CVF International Conference on Computer Vision (ICCV), Seoul, Republic of Korea, 27 October–2 November 2019; pp. 1314–1324. [Google Scholar]
- Prasad, S.B.R.; Chandana, B.S. Mobilenetv3: A deep learning technique for human face expressions identification. Int. J. Inf. Technol. 2023, 15, 3229–3243. [Google Scholar] [CrossRef]
- Cao, Z.; Li, J.; Fang, L.; Yang, H.; Dong, G. Research on efficient classification algorithm for coal and gangue based on improved MobilenetV3-small. Int. J. Coal Prep. Util. 2024, 1–26. [Google Scholar] [CrossRef]
- Zhang, X.; Zhou, X.; Lin, M.; Sun, J. Shufflenet: An extremely efficient convolutional neural network for mobile devices. In Proceedings of the Proceedings of the IEEE Conference on Computer Vision and Pattern Recognition, Salt Lake City, UT, USA, 18–23 June 2018; pp. 6848–6856. [Google Scholar]
Disclaimer/Publisher’s Note: The statements, opinions and data contained in all publications are solely those of the individual author(s) and contributor(s) and not of MDPI and/or the editor(s). MDPI and/or the editor(s) disclaim responsibility for any injury to people or property resulting from any ideas, methods, instructions or products referred to in the content. |
© 2024 by the authors. Licensee MDPI, Basel, Switzerland. This article is an open access article distributed under the terms and conditions of the Creative Commons Attribution (CC BY) license (https://creativecommons.org/licenses/by/4.0/).