

Enhancing Urban Mobility through Traffic Management with UAVs and VLC Technologies


Abstract
:1. Introduction
1.1. Background
- Real-Time Processing Speed: YOLO processes frames at high speed, ranging from 45 frames per second (fps) for larger networks to 150 fps for smaller networks. This real-time processing capability is crucial for applications like traffic management, where timely detection and response are essential. YOLO’s speed advantage ensures swift processing of video frames, enabling rapid decision-making in dynamic traffic scenarios.
- Efficiency in Resource Usage: YOLO is known for its efficiency in resource utilization, making it well-suited for deployment on resource-constrained devices like UAVs. While it may have comparatively lower recall and increased localization error, the trade-off is acceptable in scenarios where real-time processing and efficiency are prioritized.
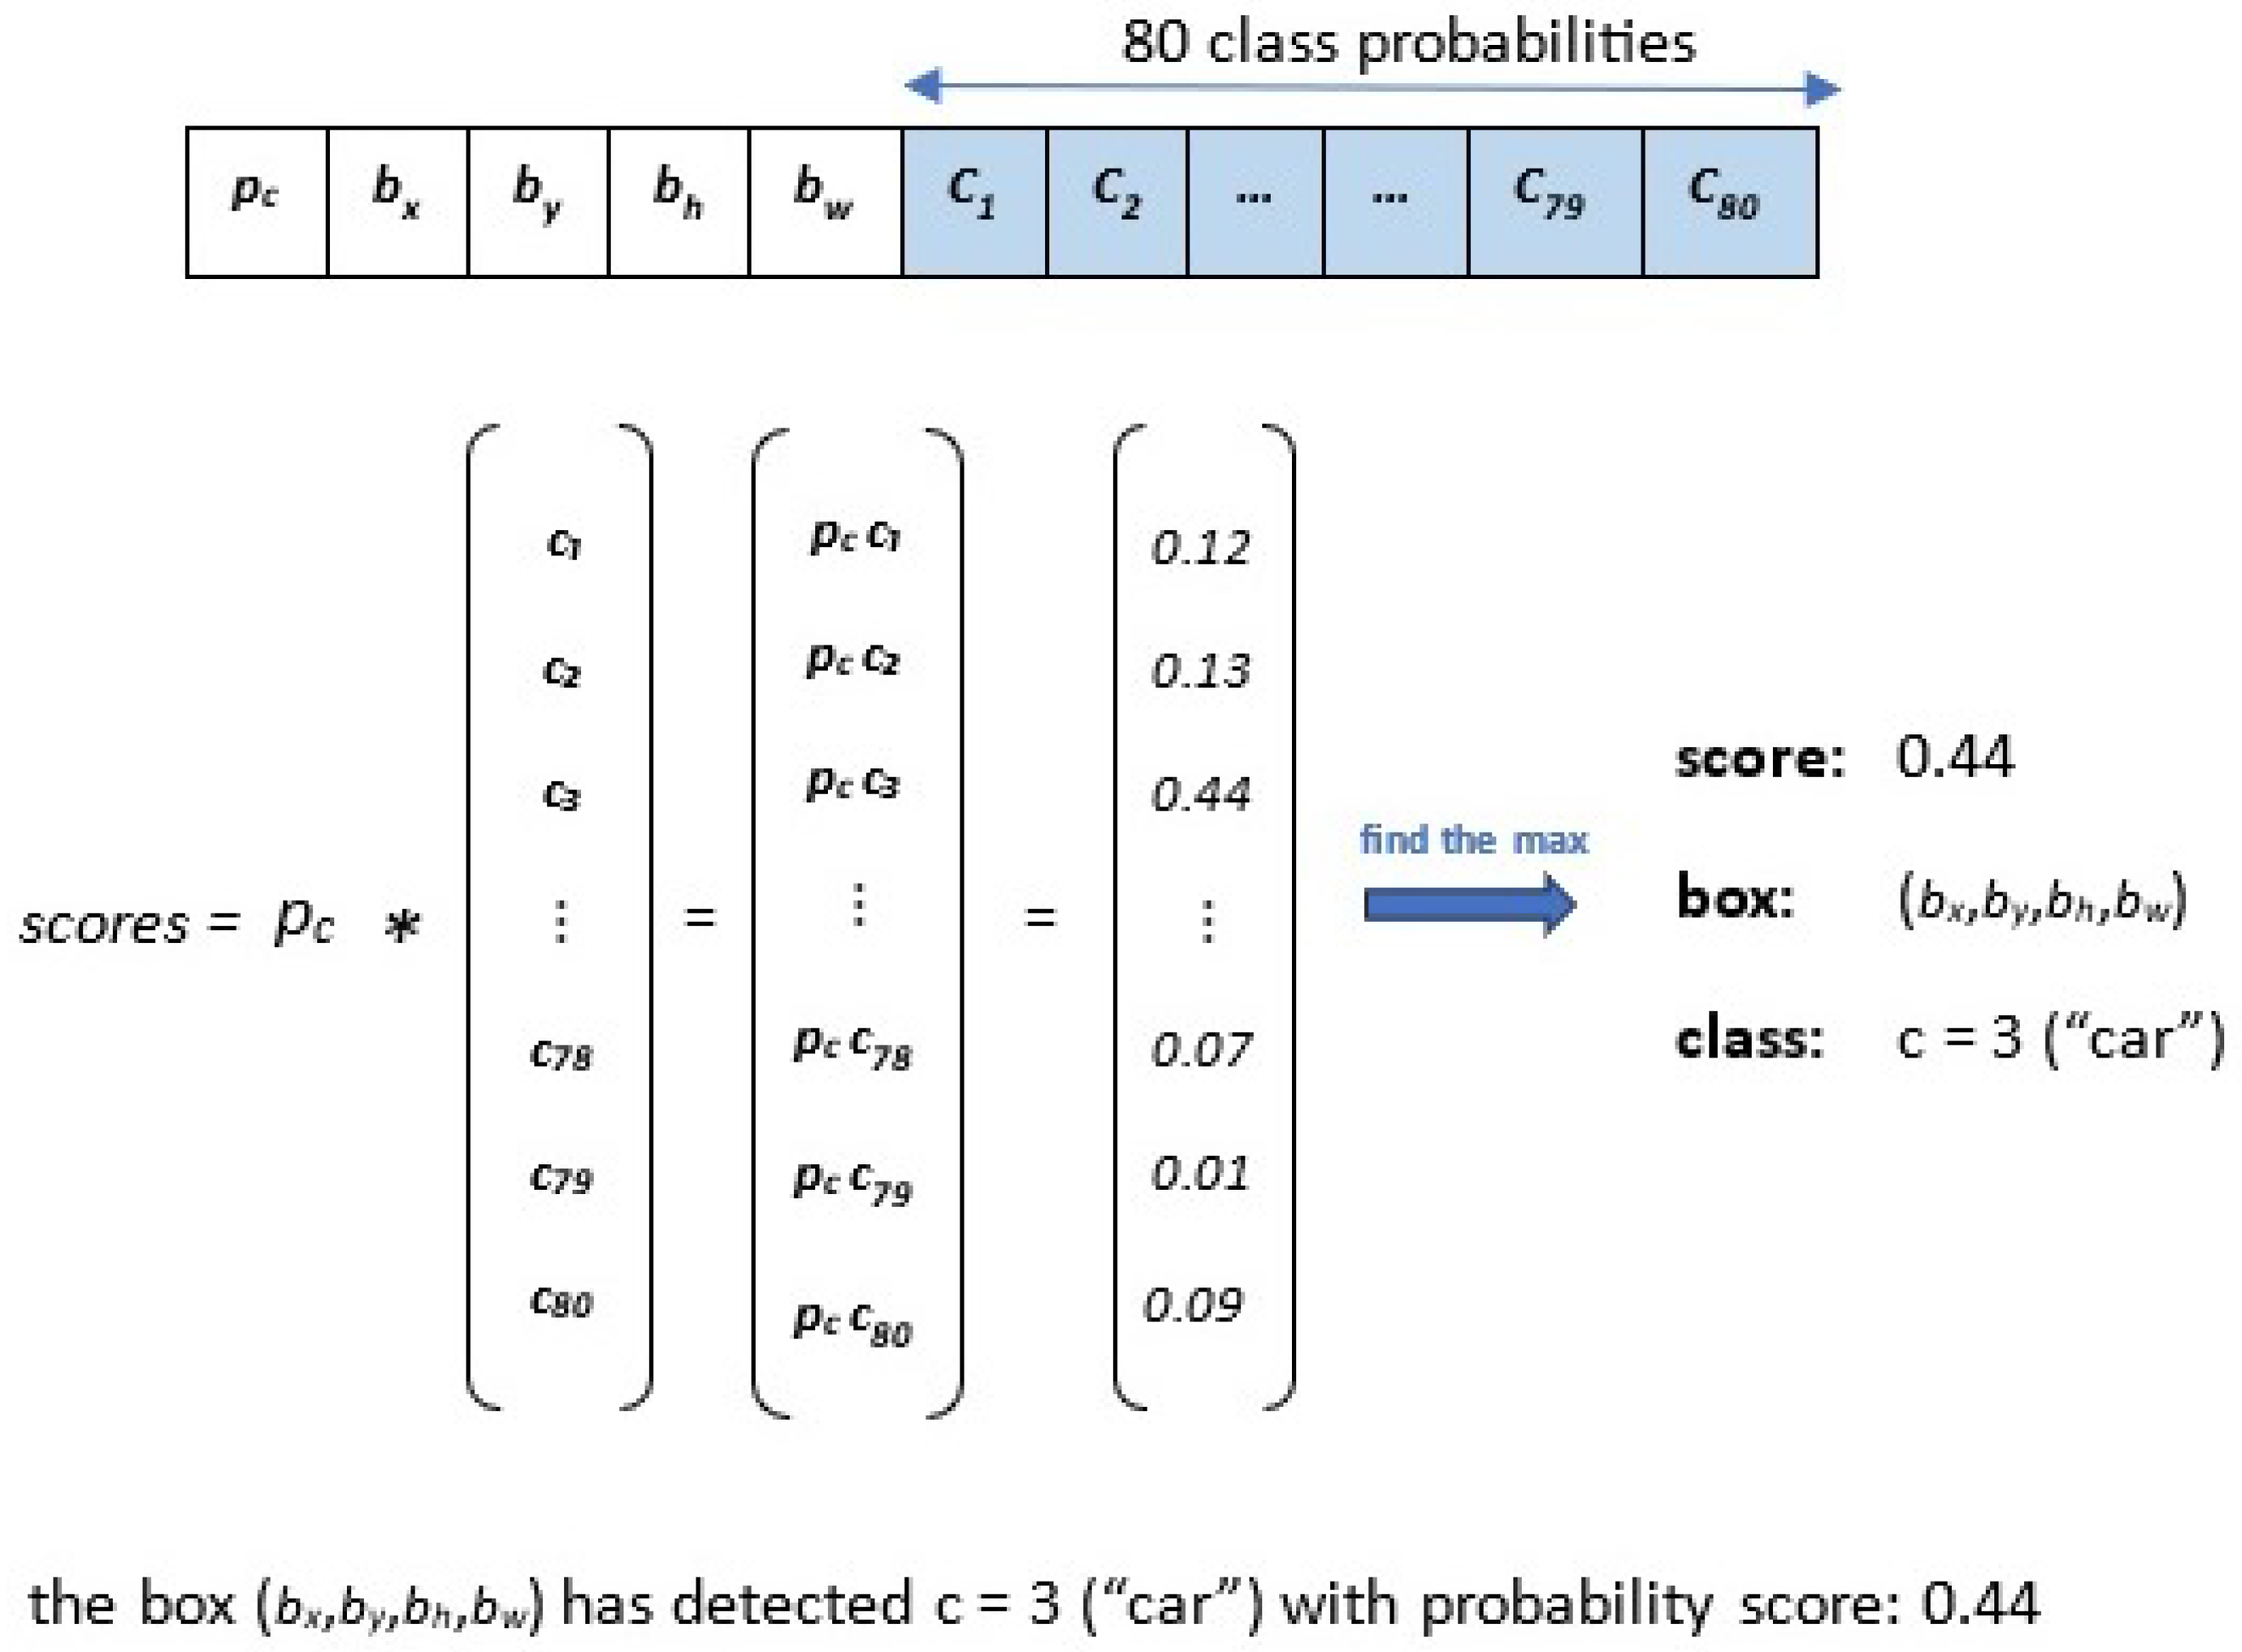
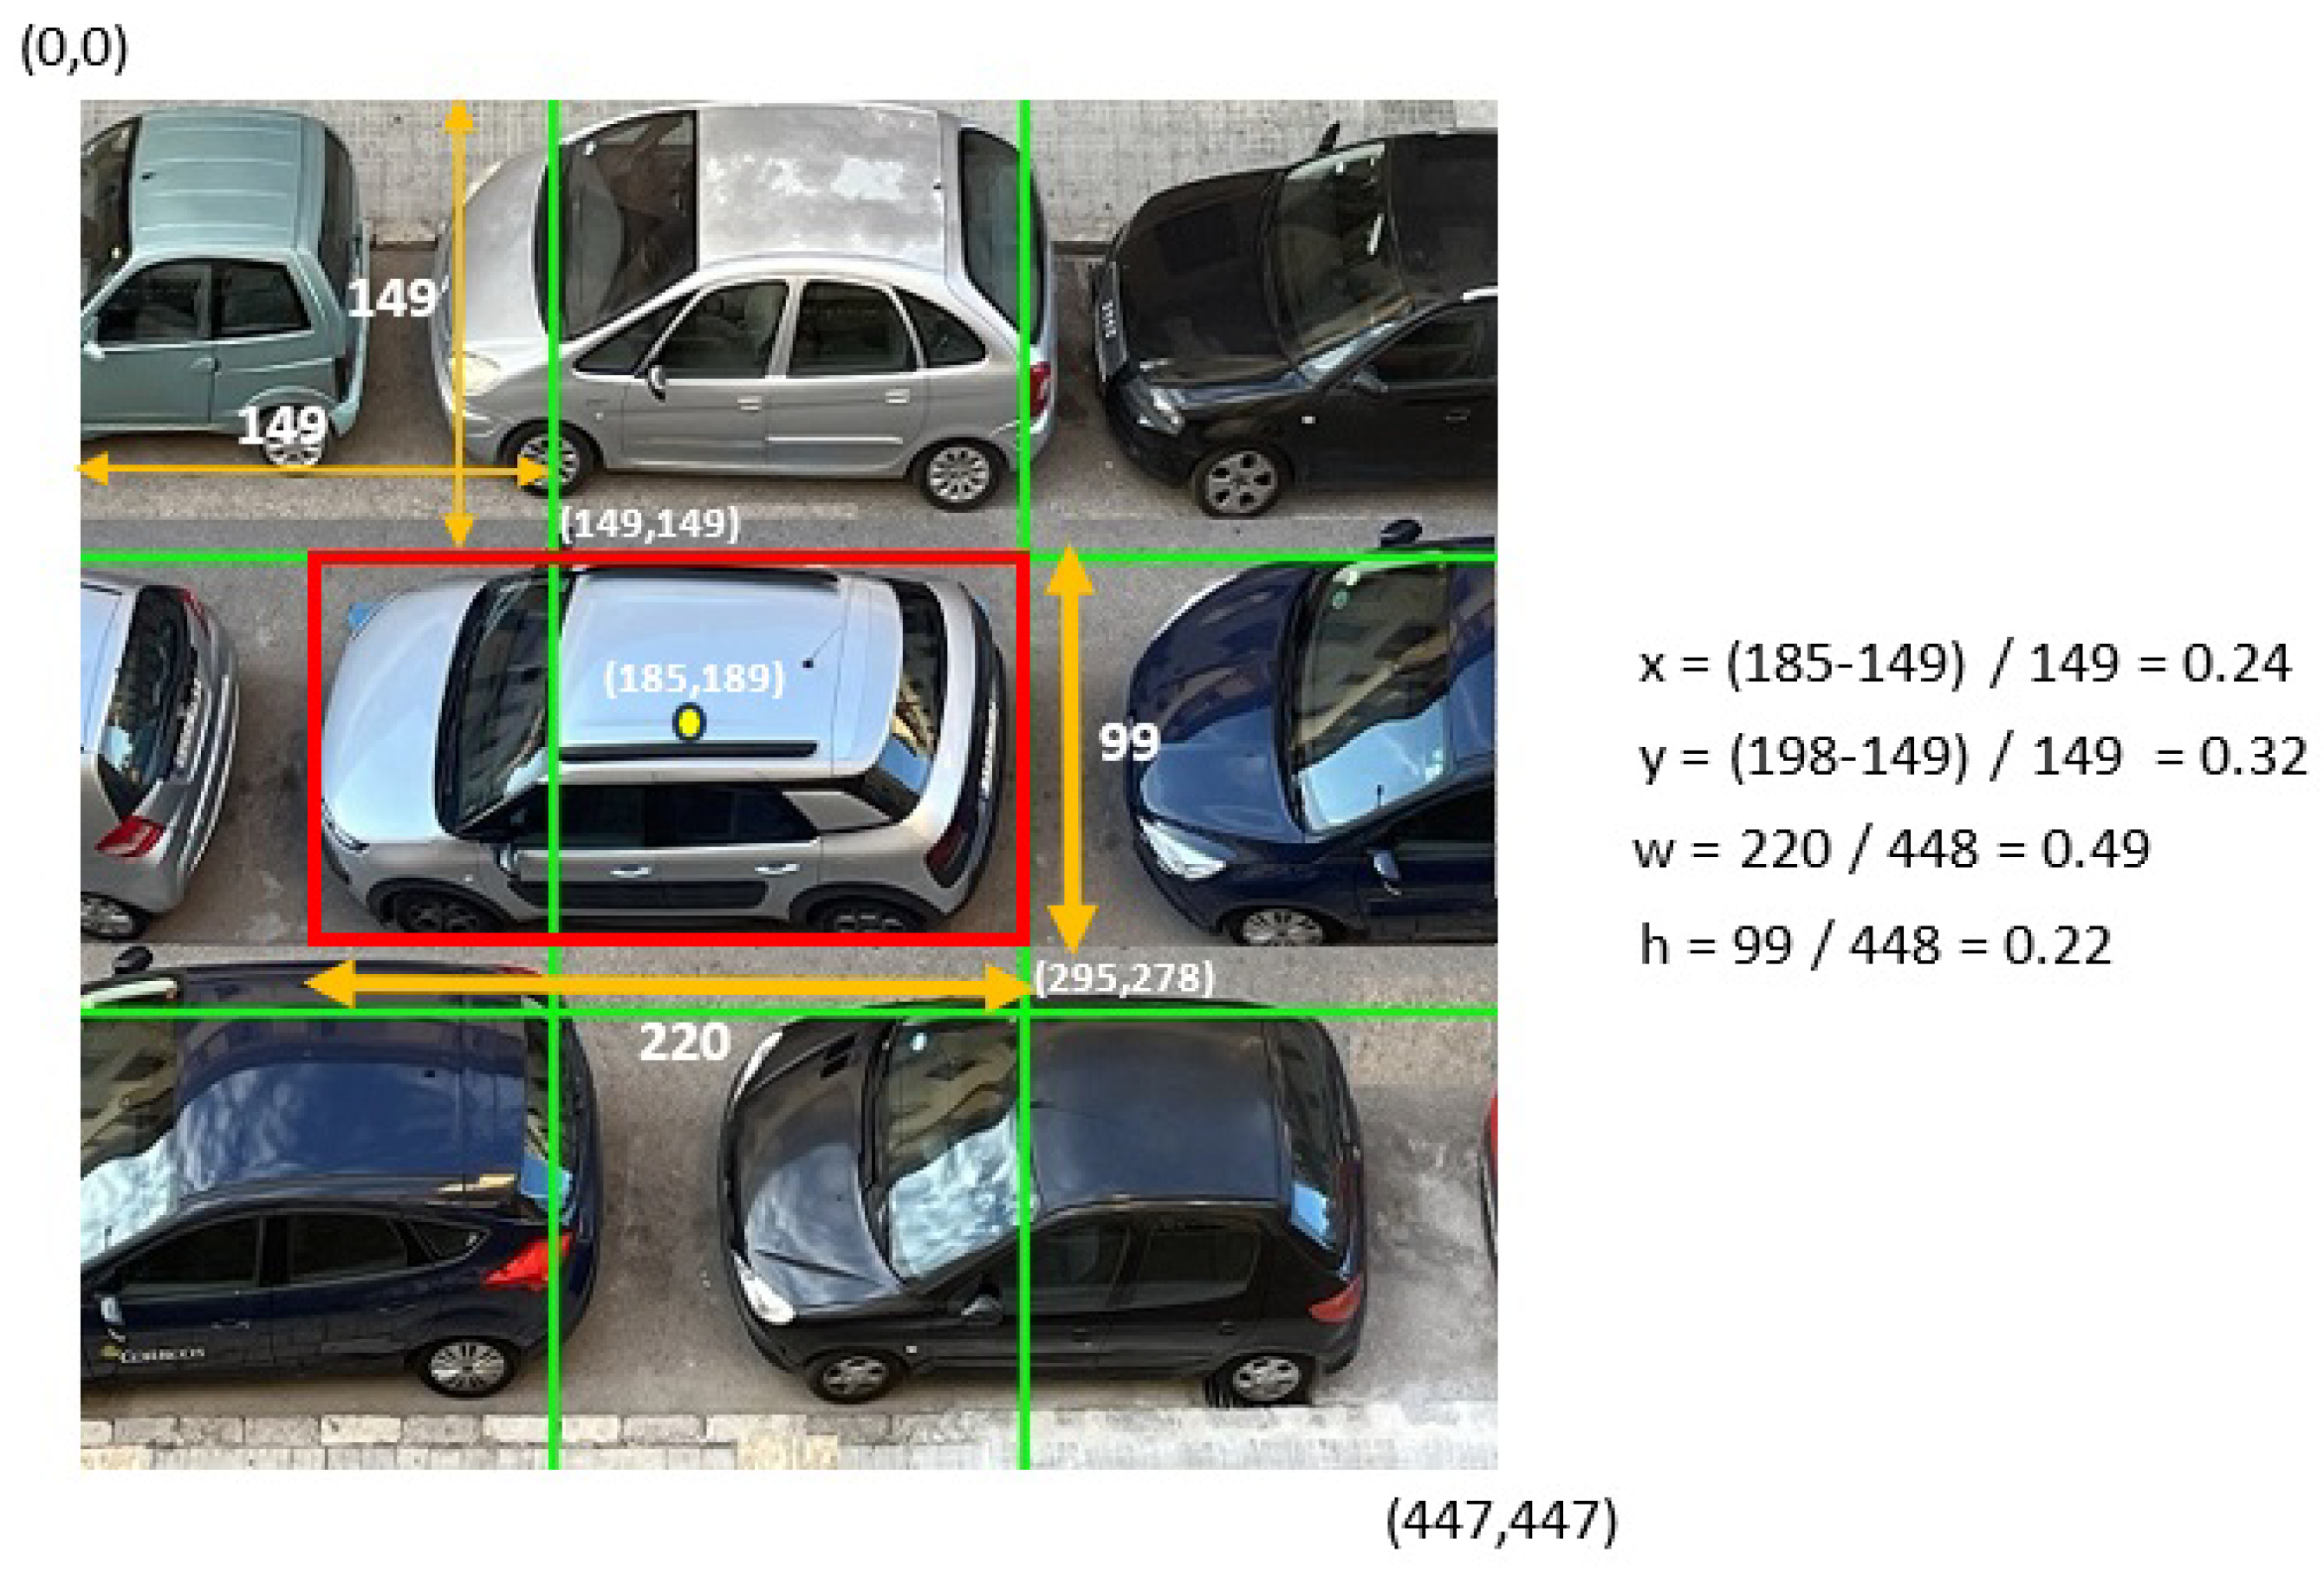
- Single-Pass Object Detection: YOLO follows a single-pass object detection approach, dividing the input image into a grid and directly predicting bounding boxes and class probabilities. This design contrasts with two-pass methods like Faster R-CNN. The single-pass architecture aligns to minimize processing time and resource usage.
- Simplicity and Ease of Integration: YOLO’s simplicity and straightforward architecture make implementing and integrating into the overall system easier. The streamlined design contributes to faster inference and facilitates deployment on UAVs with limited computational capabilities.
- Suitability for UAV Applications: Considering the use case involving Unmanned Aerial Vehicles (UAVs) for traffic management, YOLO’s balance between speed and accuracy aligns with the requirements of real-time processing images captured by UAVs.
1.2. Our Contribution
- Identifying traffic patterns from analyzed images and utilizing a Congestion Traffic Algorithm (CTA) to ascertain the presence of congestion.
- Formulating a message format protocol rooted in variable length, facilitating seamless information exchange among the components of the proposed system.
- Creating a communication protocol that enables system elements to engage with one another and assists them in determining their operational states. This is crucial in ensuring that the system functions optimally within the dynamic context of smart cities and contributes to the broader objective of improving urban mobility through efficient traffic management.
2. Traffic Management Prototype System
2.1. Overview System Architecture
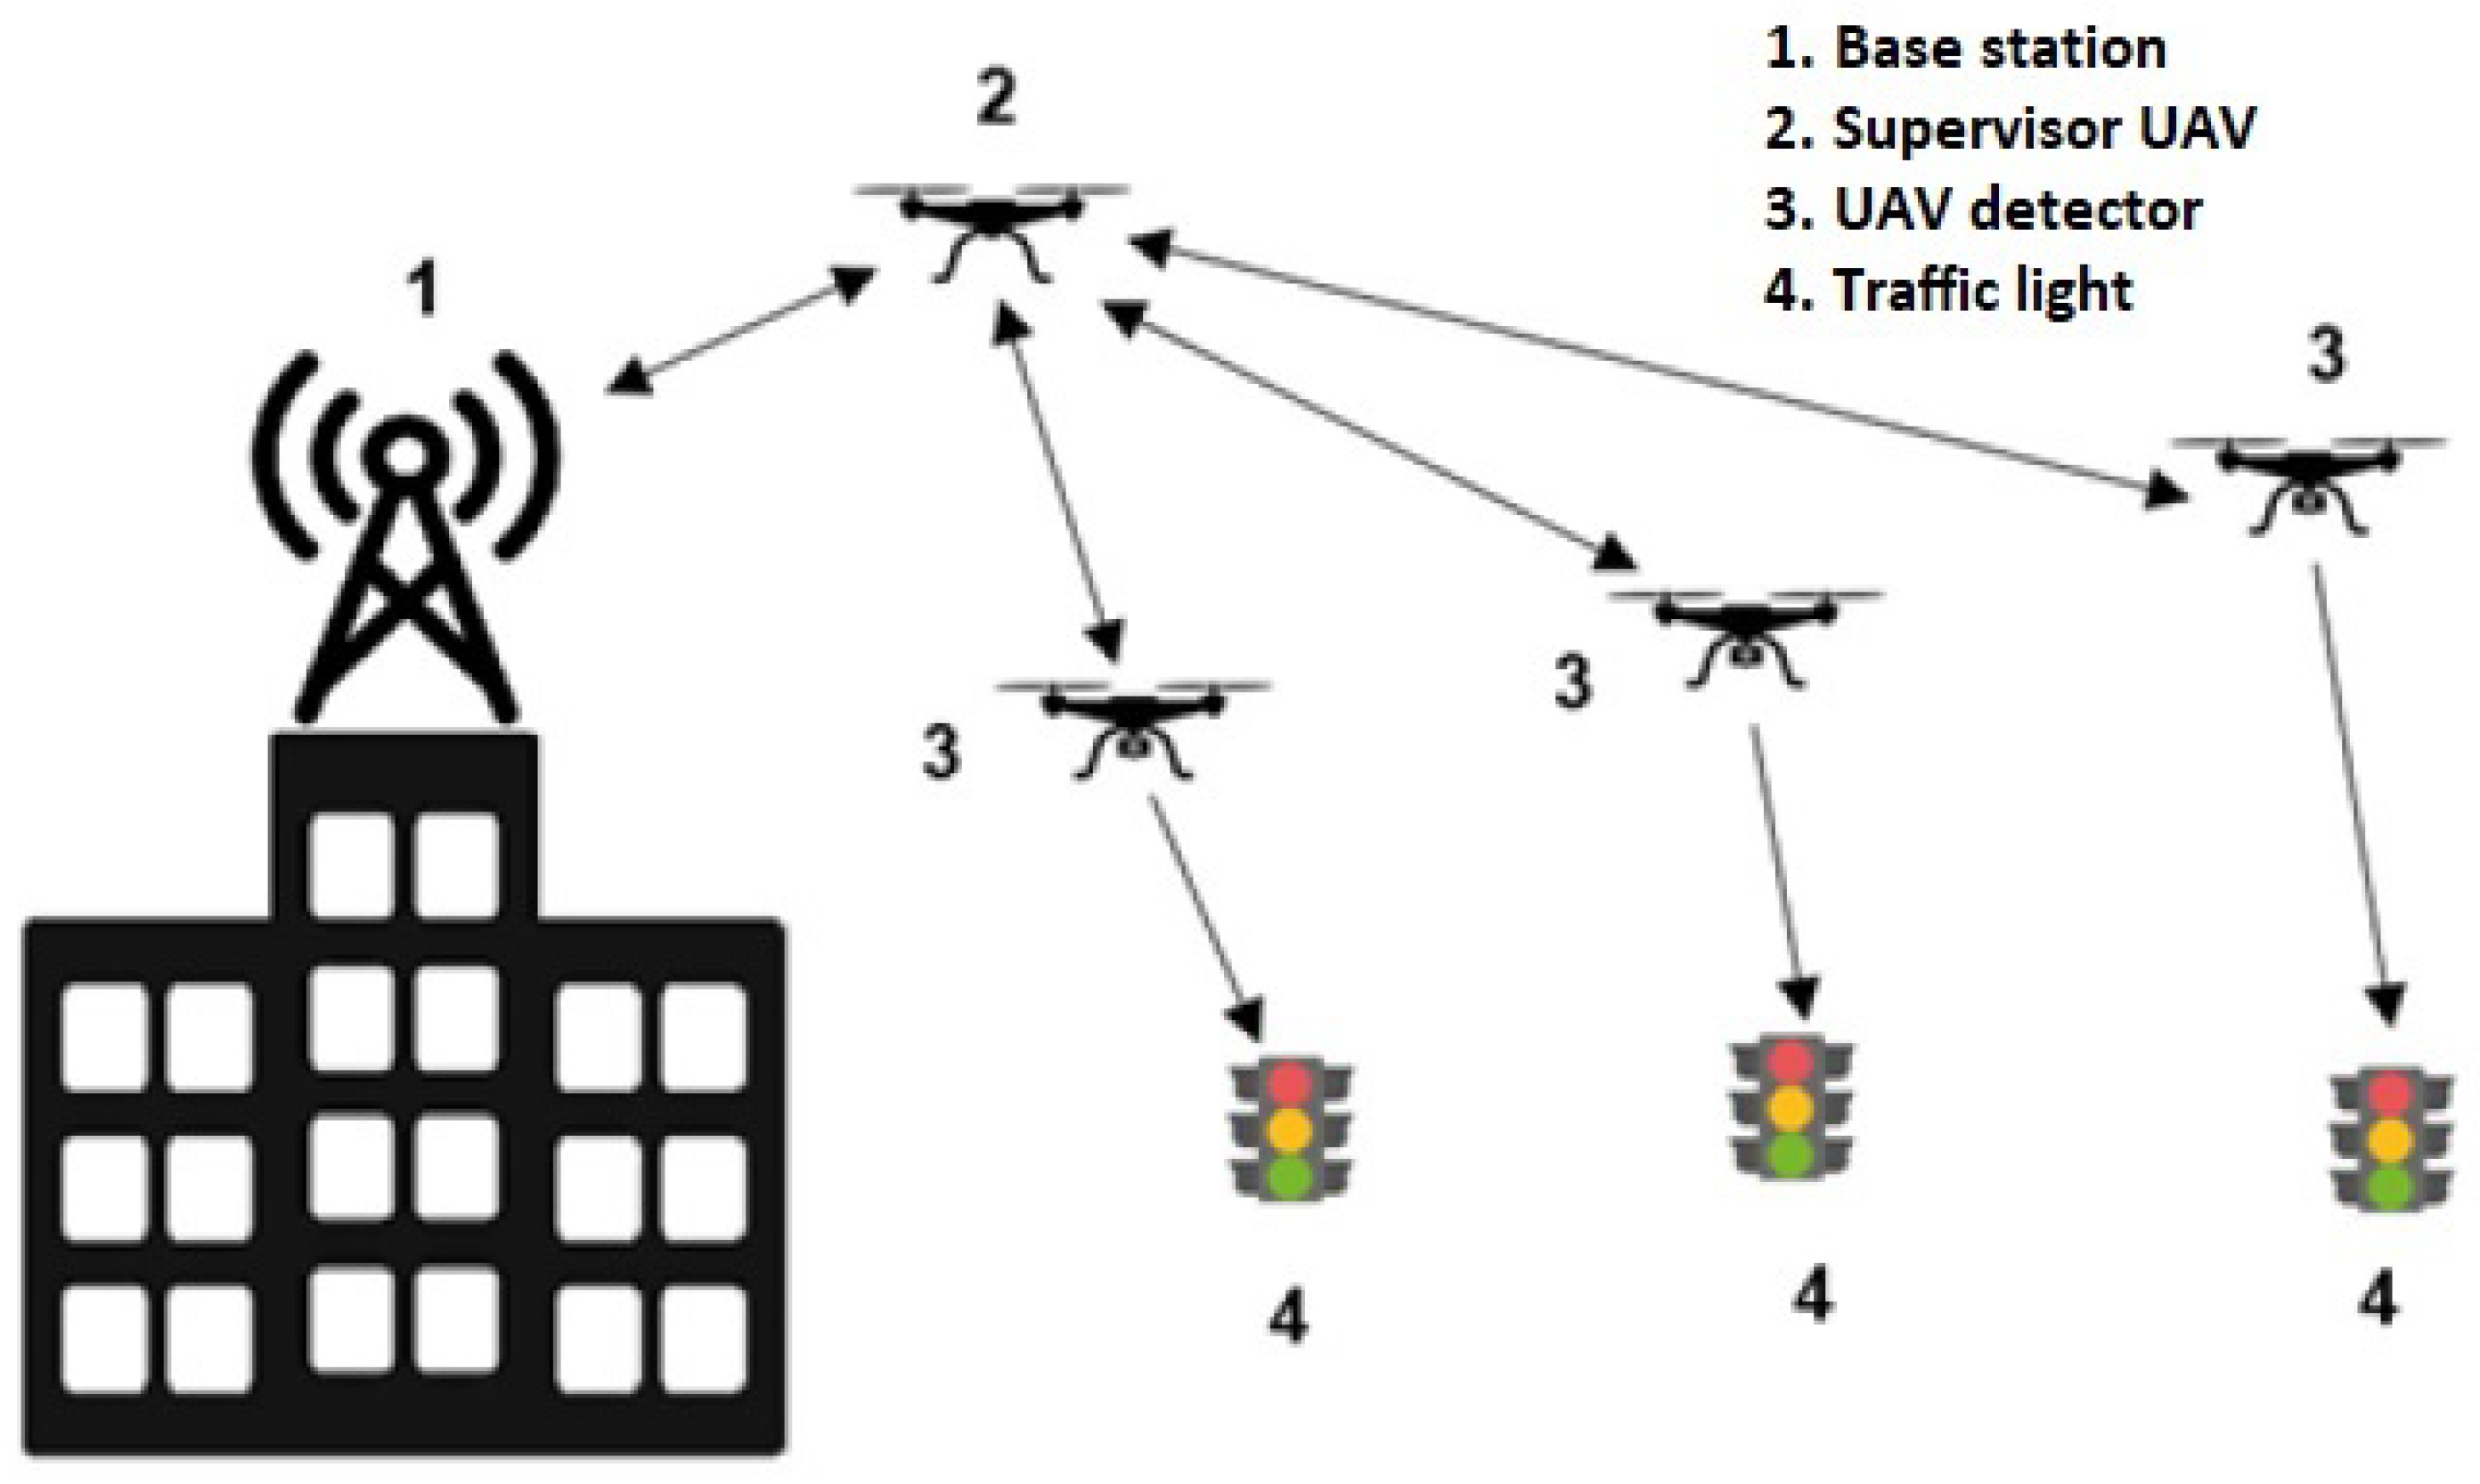
- Base station: Our first system element is the base station. This station must be located on high ground or close to the supervised traffic area since direct vision is required in VLC technology. Likewise, UAVs must return to a safe place where they can recharge their batteries or be attended to in case of failure. This is why the location becomes important because UAVs should not travel a long distance. The access to this location should also be controlled to avoid intruders or incidents. The base station’s main function is to send and receive information from the supervisor UAV, so we have a bidirectional link between these two elements.
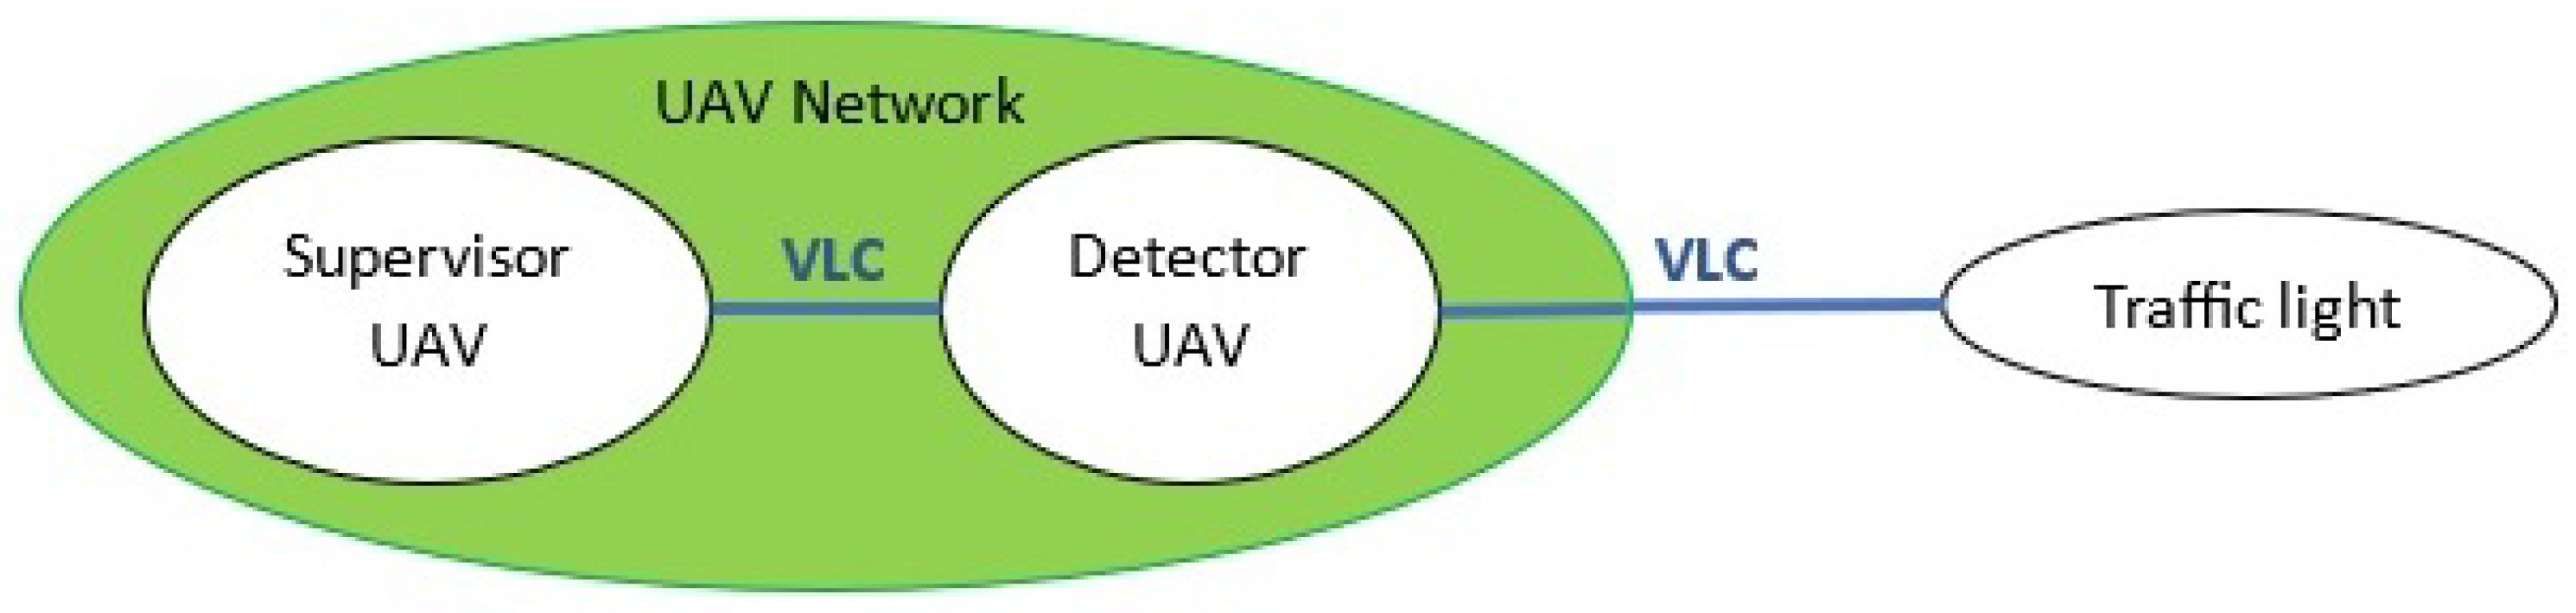
- Supervisor UAV: This supervisor UAV will link the UAVs monitoring the traffic and traffic lights between the base station. Due to this, we will have bidirectional links to the base station and UAV detector.This element provides us with two main functions. The first one is to inform the base station of the status of the detector UAVs and traffic lights. The second function will allow us to modify the traffic congestion parameter associated with the detector UAVs to make our system more sensitive to traffic jams.In case a supervisor UAV must return to the base station at any time due to an incident or low battery, the detector UAVs could operate autonomously. The only temporarily unavailable features would be the information updates regarding traffic lights and detector UAV status, as well as the ability to adjust the traffic congestion parameter for the detector UAVs. These two specific functions will be reinstated upon their return to the base station or when a supervisor UAV re-establishes connection. This decision ensures that the service remains unaffected in case of an incident, and supervision can be restored by deploying a new supervisor UAV.
- Detector UAV: This element is a key piece of the architecture as it is tasked with executing the three fundamental functions for traffic regulation, which are as follows:
- (a)
- Taking aerial photographs.
- (b)
- Detect traffic intensity.
- (c)
- Notify the traffic light of the need to change its operating mode.
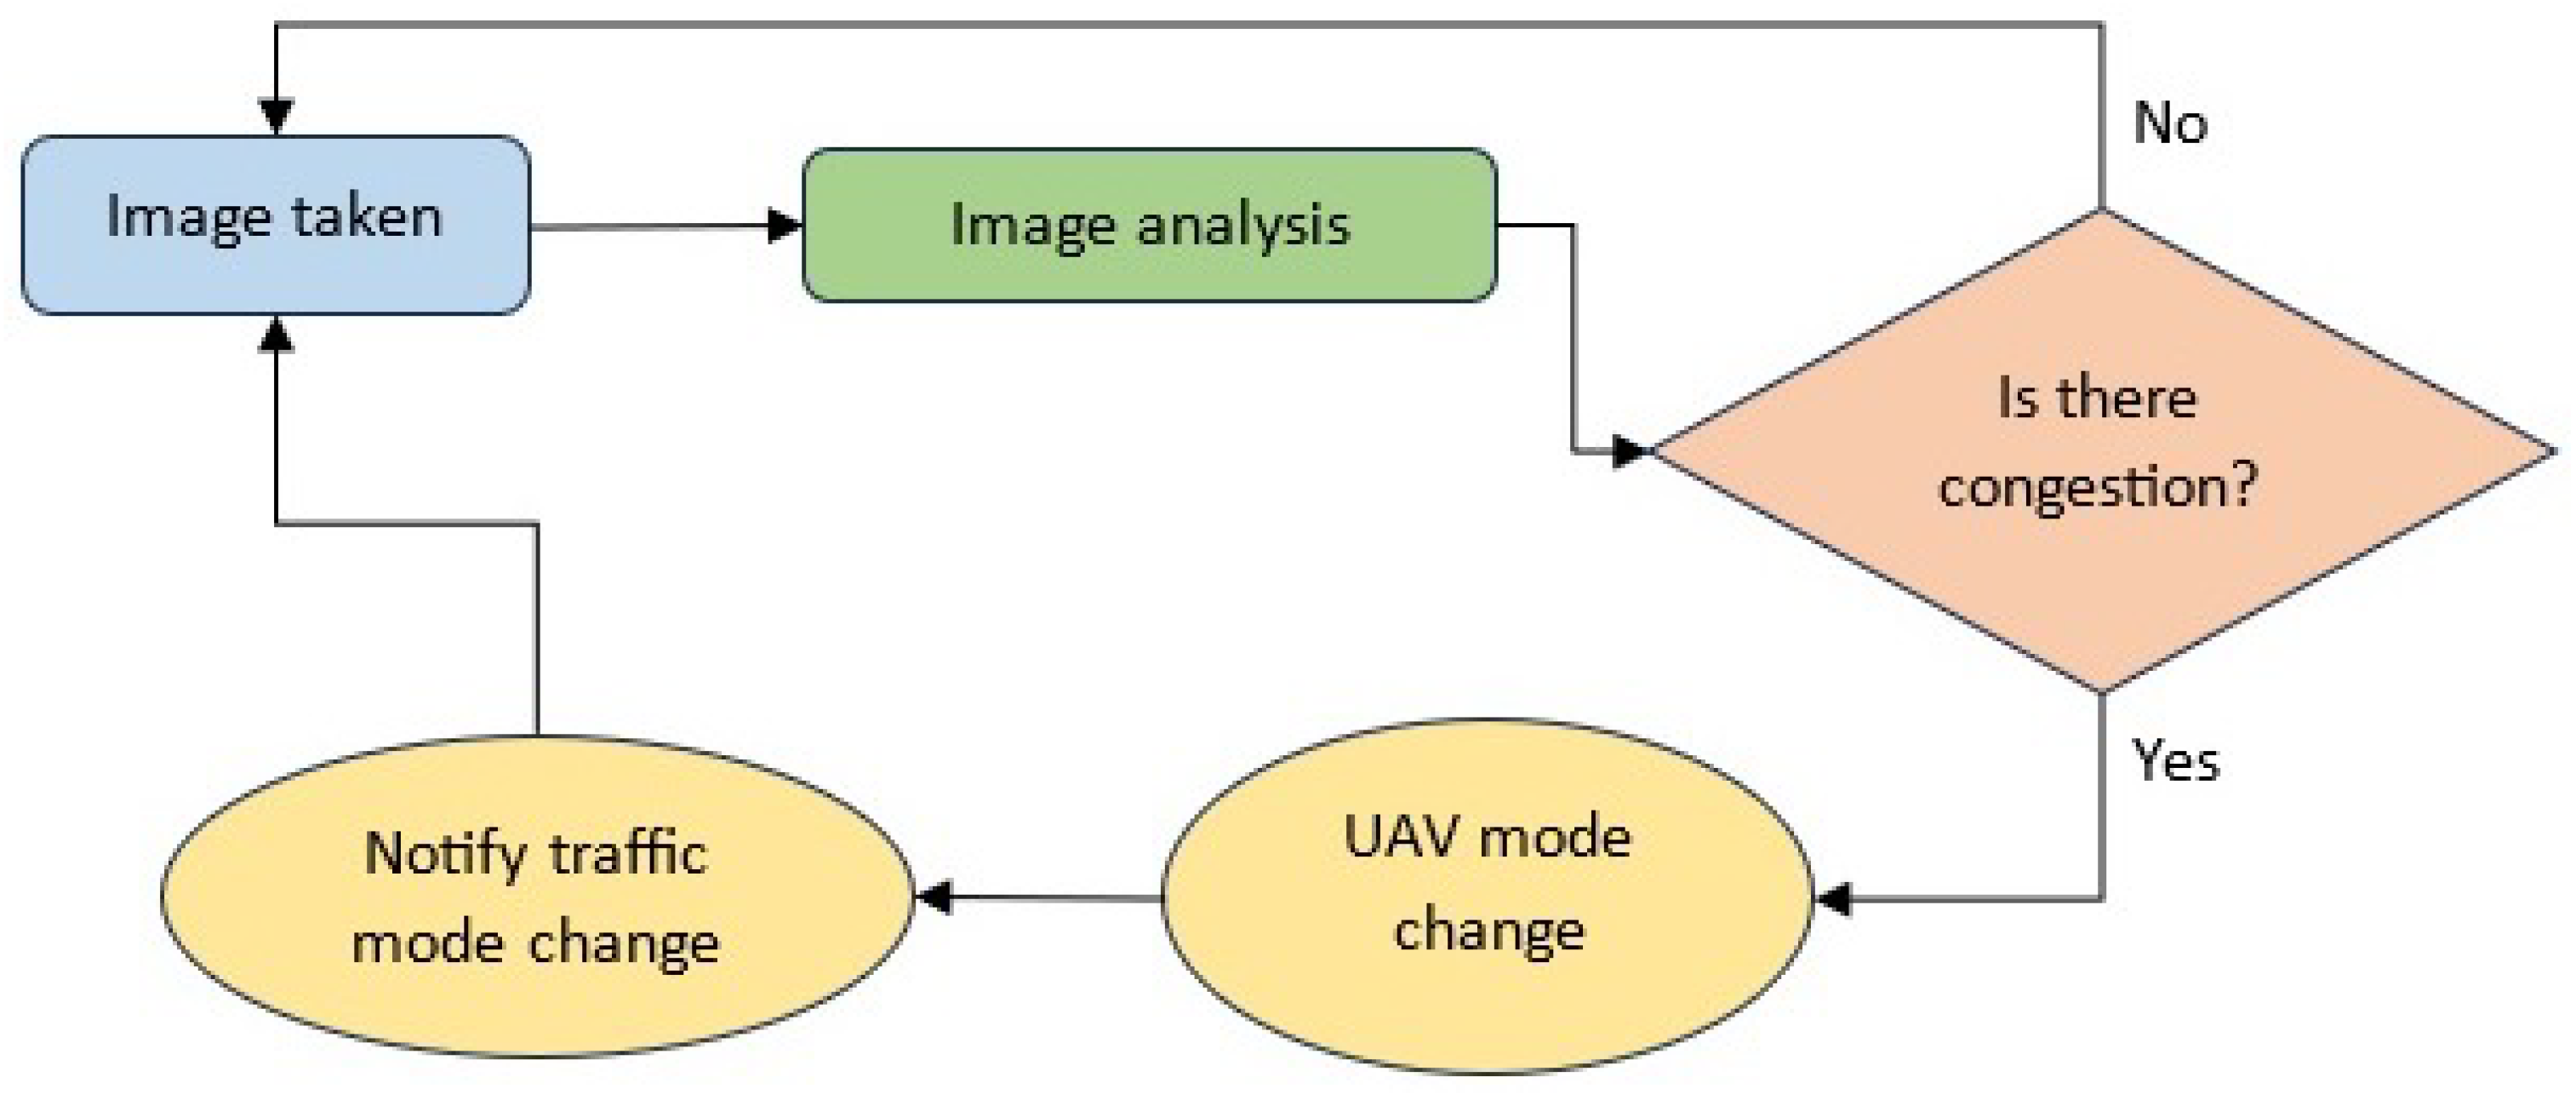
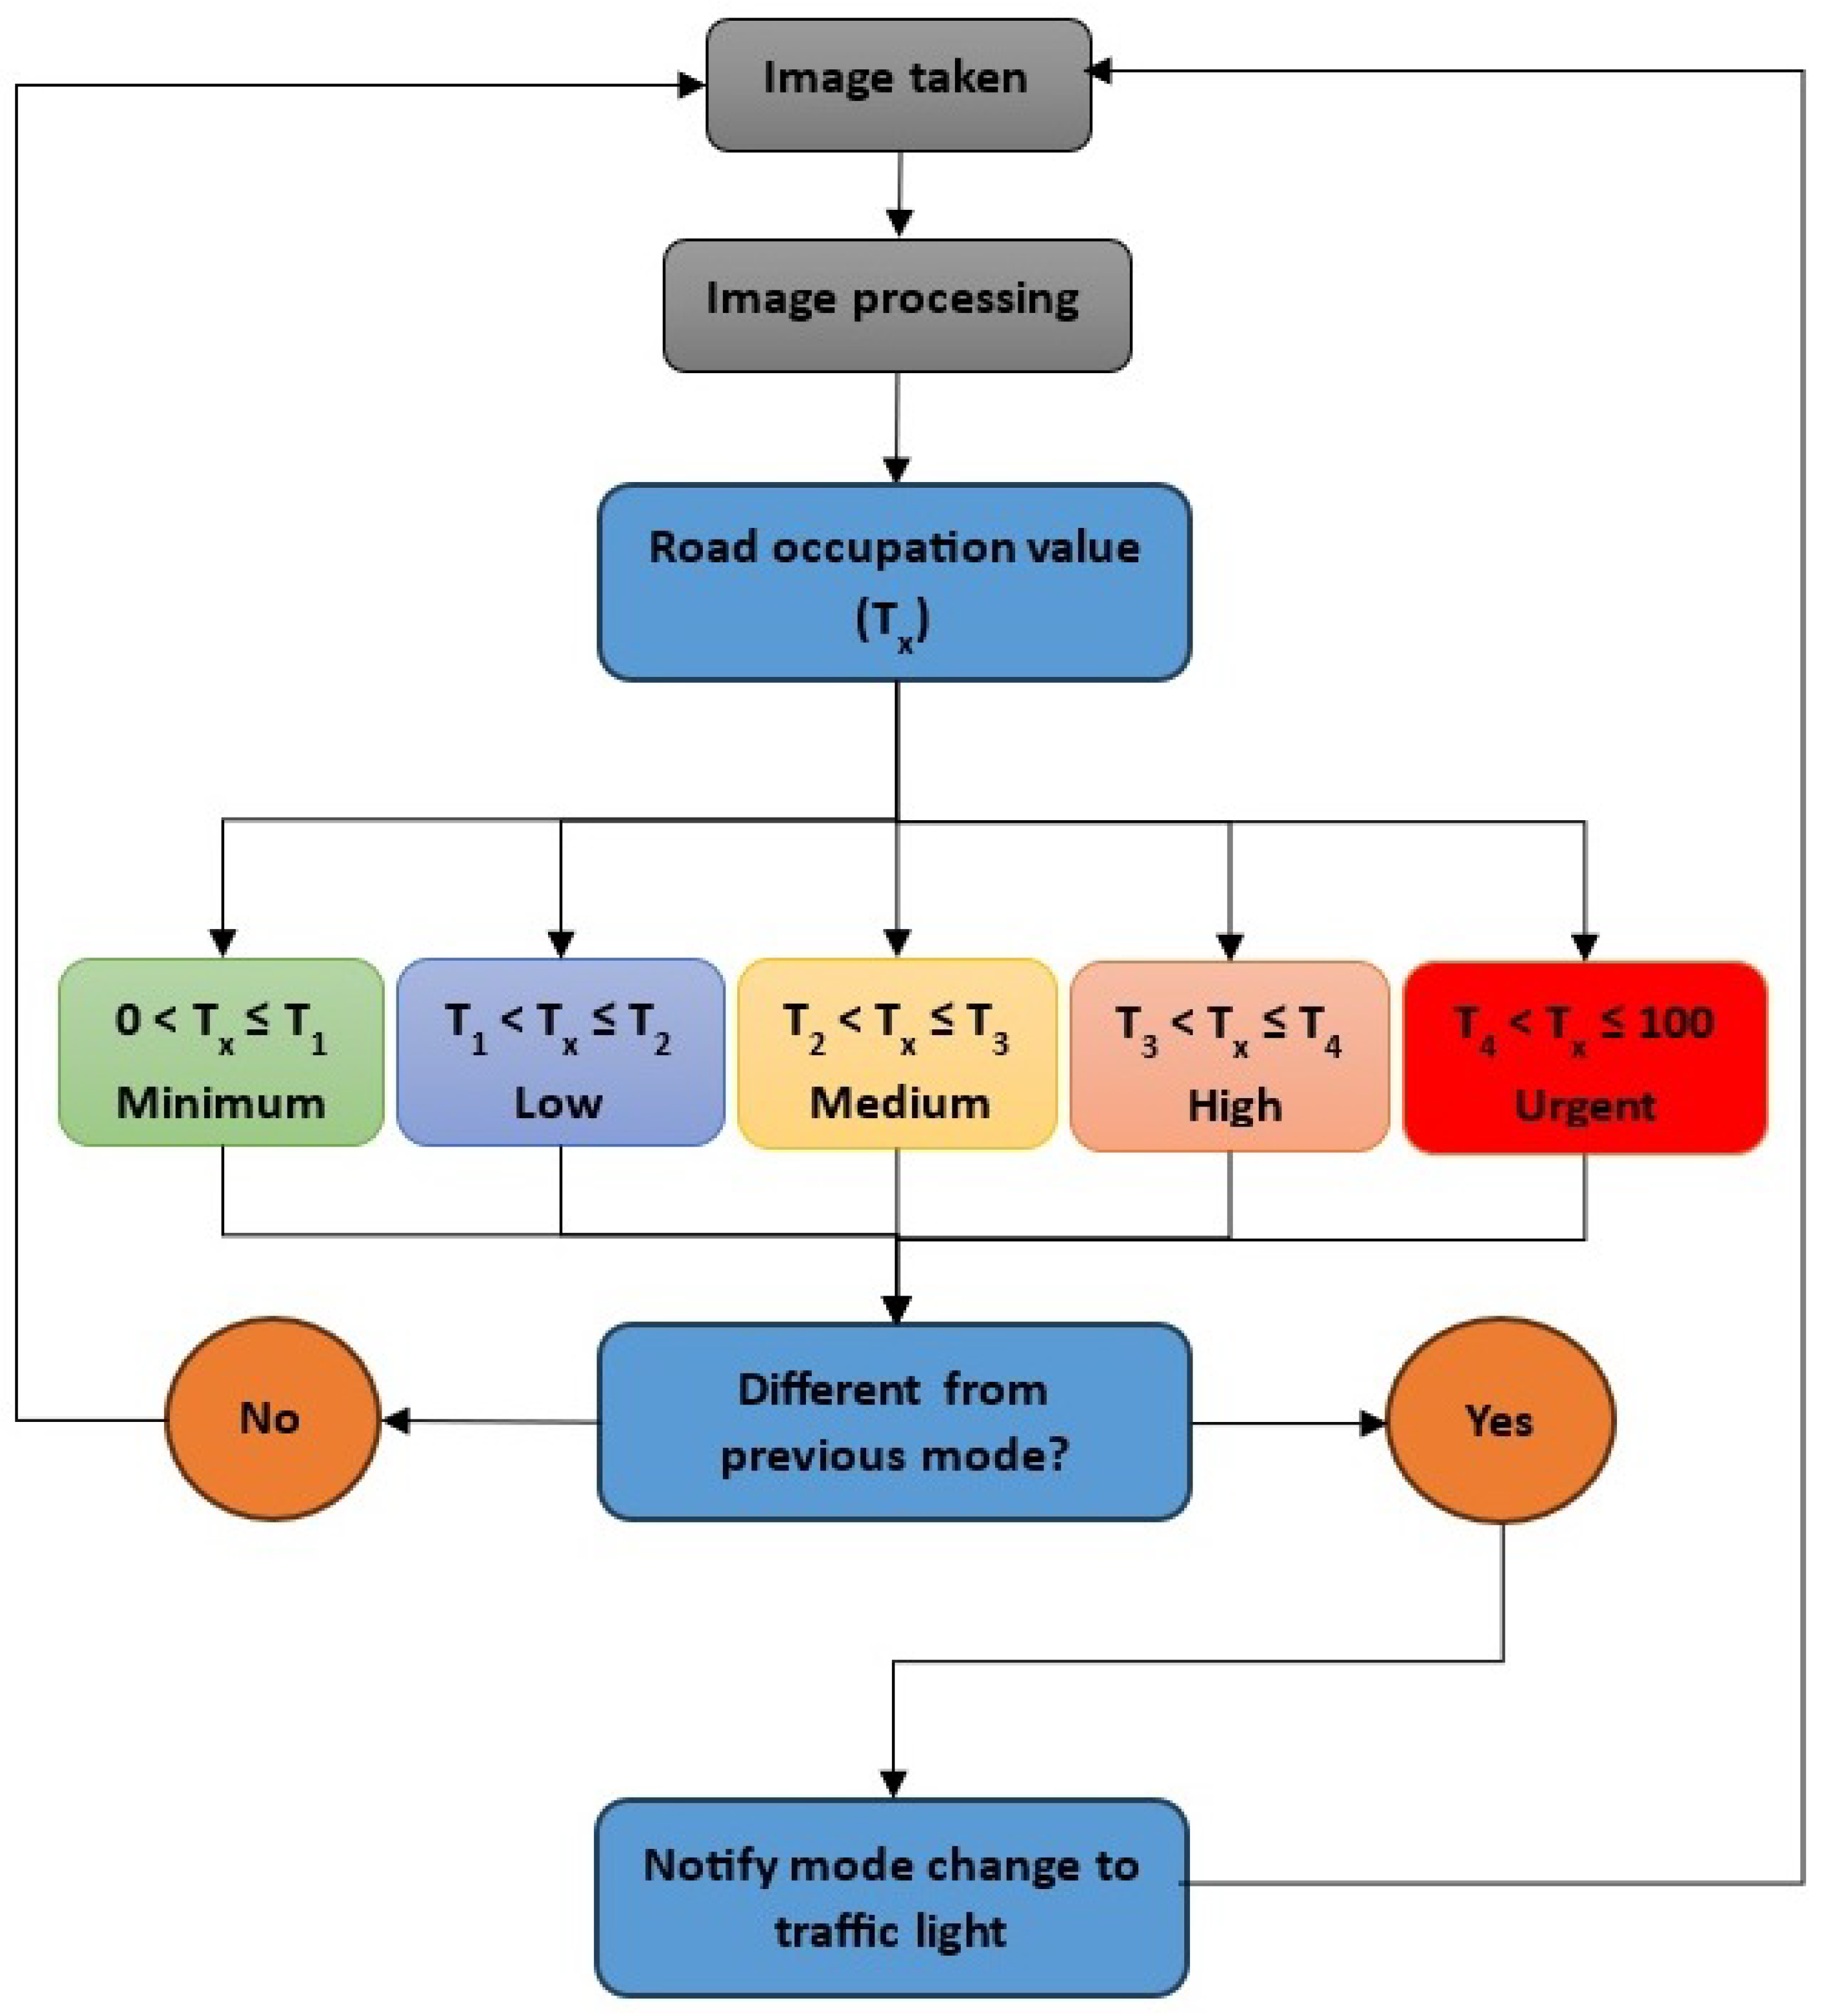
The initial function involves capturing aerial images of streets or intersections controlled by the traffic light. For this purpose, the UAV will be equipped with a camera responsible for this task. The image resolution must meet the minimum quality standards. In other words, if the image is not sufficiently clear for vehicle identification, accurate detection and proper traffic management would be compromised. If the UAV has to supervise more than one traffic light, it will have the supervised traffic light map as configuration, and each one of the traffic lights will have its address to receive information from the UAV.The second function of the detector UAV is to detect the intensity of the apparent traffic in it once the photograph is taken to know if there is saturation. To do this, the UAV will have an object detection algorithm. After the image processing by the UAV, it uses parameters extracted from the image to compare the occupancy of vehicles on the road with certain predefined values. Depending on this comparison, the UAV will notify the traffic light if it is necessary to change the configuration of the red and green lights and the time they must remain active. Within the value of the congestion parameter extracted from the image, it will be located within certain ranges of values that will be defined for the system so that if the parameter is contained in a certain range, both the UAV and the traffic light must be found in a given mode of operation. In the same way, if there is a change in the image parameter and it enters a new range, the UAV and the traffic light may have to make a mode change to adapt to the latest traffic conditions.The third function is to notify the traffic light of the need to change the operating mode to adapt to a new traffic situation. To do this, through VLC technology, the detector UAV will inform, using our defined protocol, the traffic light that must make the change.Because of the functions exposed to this, we will have bidirectional links to the UAV supervisor and a one-way link to the traffic light.In Figure 2, we can observe the operational process of a detector UAV as depicted in its flow chart. The sequence initiates with the UAV capturing an image. Subsequently, the UAV analyzes to determine whether there is congestion or vehicle saturation within the monitored area. If not, the UAV will reattempt image capture after a designated waiting period and proceed with a fresh analysis. However, if saturation is detected, the detector UAV will transition to a different mode and relay the necessity for a mode shift to the associated traffic light. Upon notifying the traffic light, another waiting period ensues. The specific mode of operation determines this duration before the UAV proceeds to capture another image. - Traffic light: This component controls the intersection and manages vehicle flow through its signals. In our configuration, it operates as a passive device, receiving information and creating a one-way link from the detector UAV.The traffic lights will operate in two primary modes: autonomous and remote. In autonomous mode, a traffic light controller will regulate the traffic lights, as is traditionally done. Conversely, in the remote mode, changes in the traffic lights will be guided by a detector UAV based on captured and processed information.
2.2. Technologies
2.3. Element Interconnection
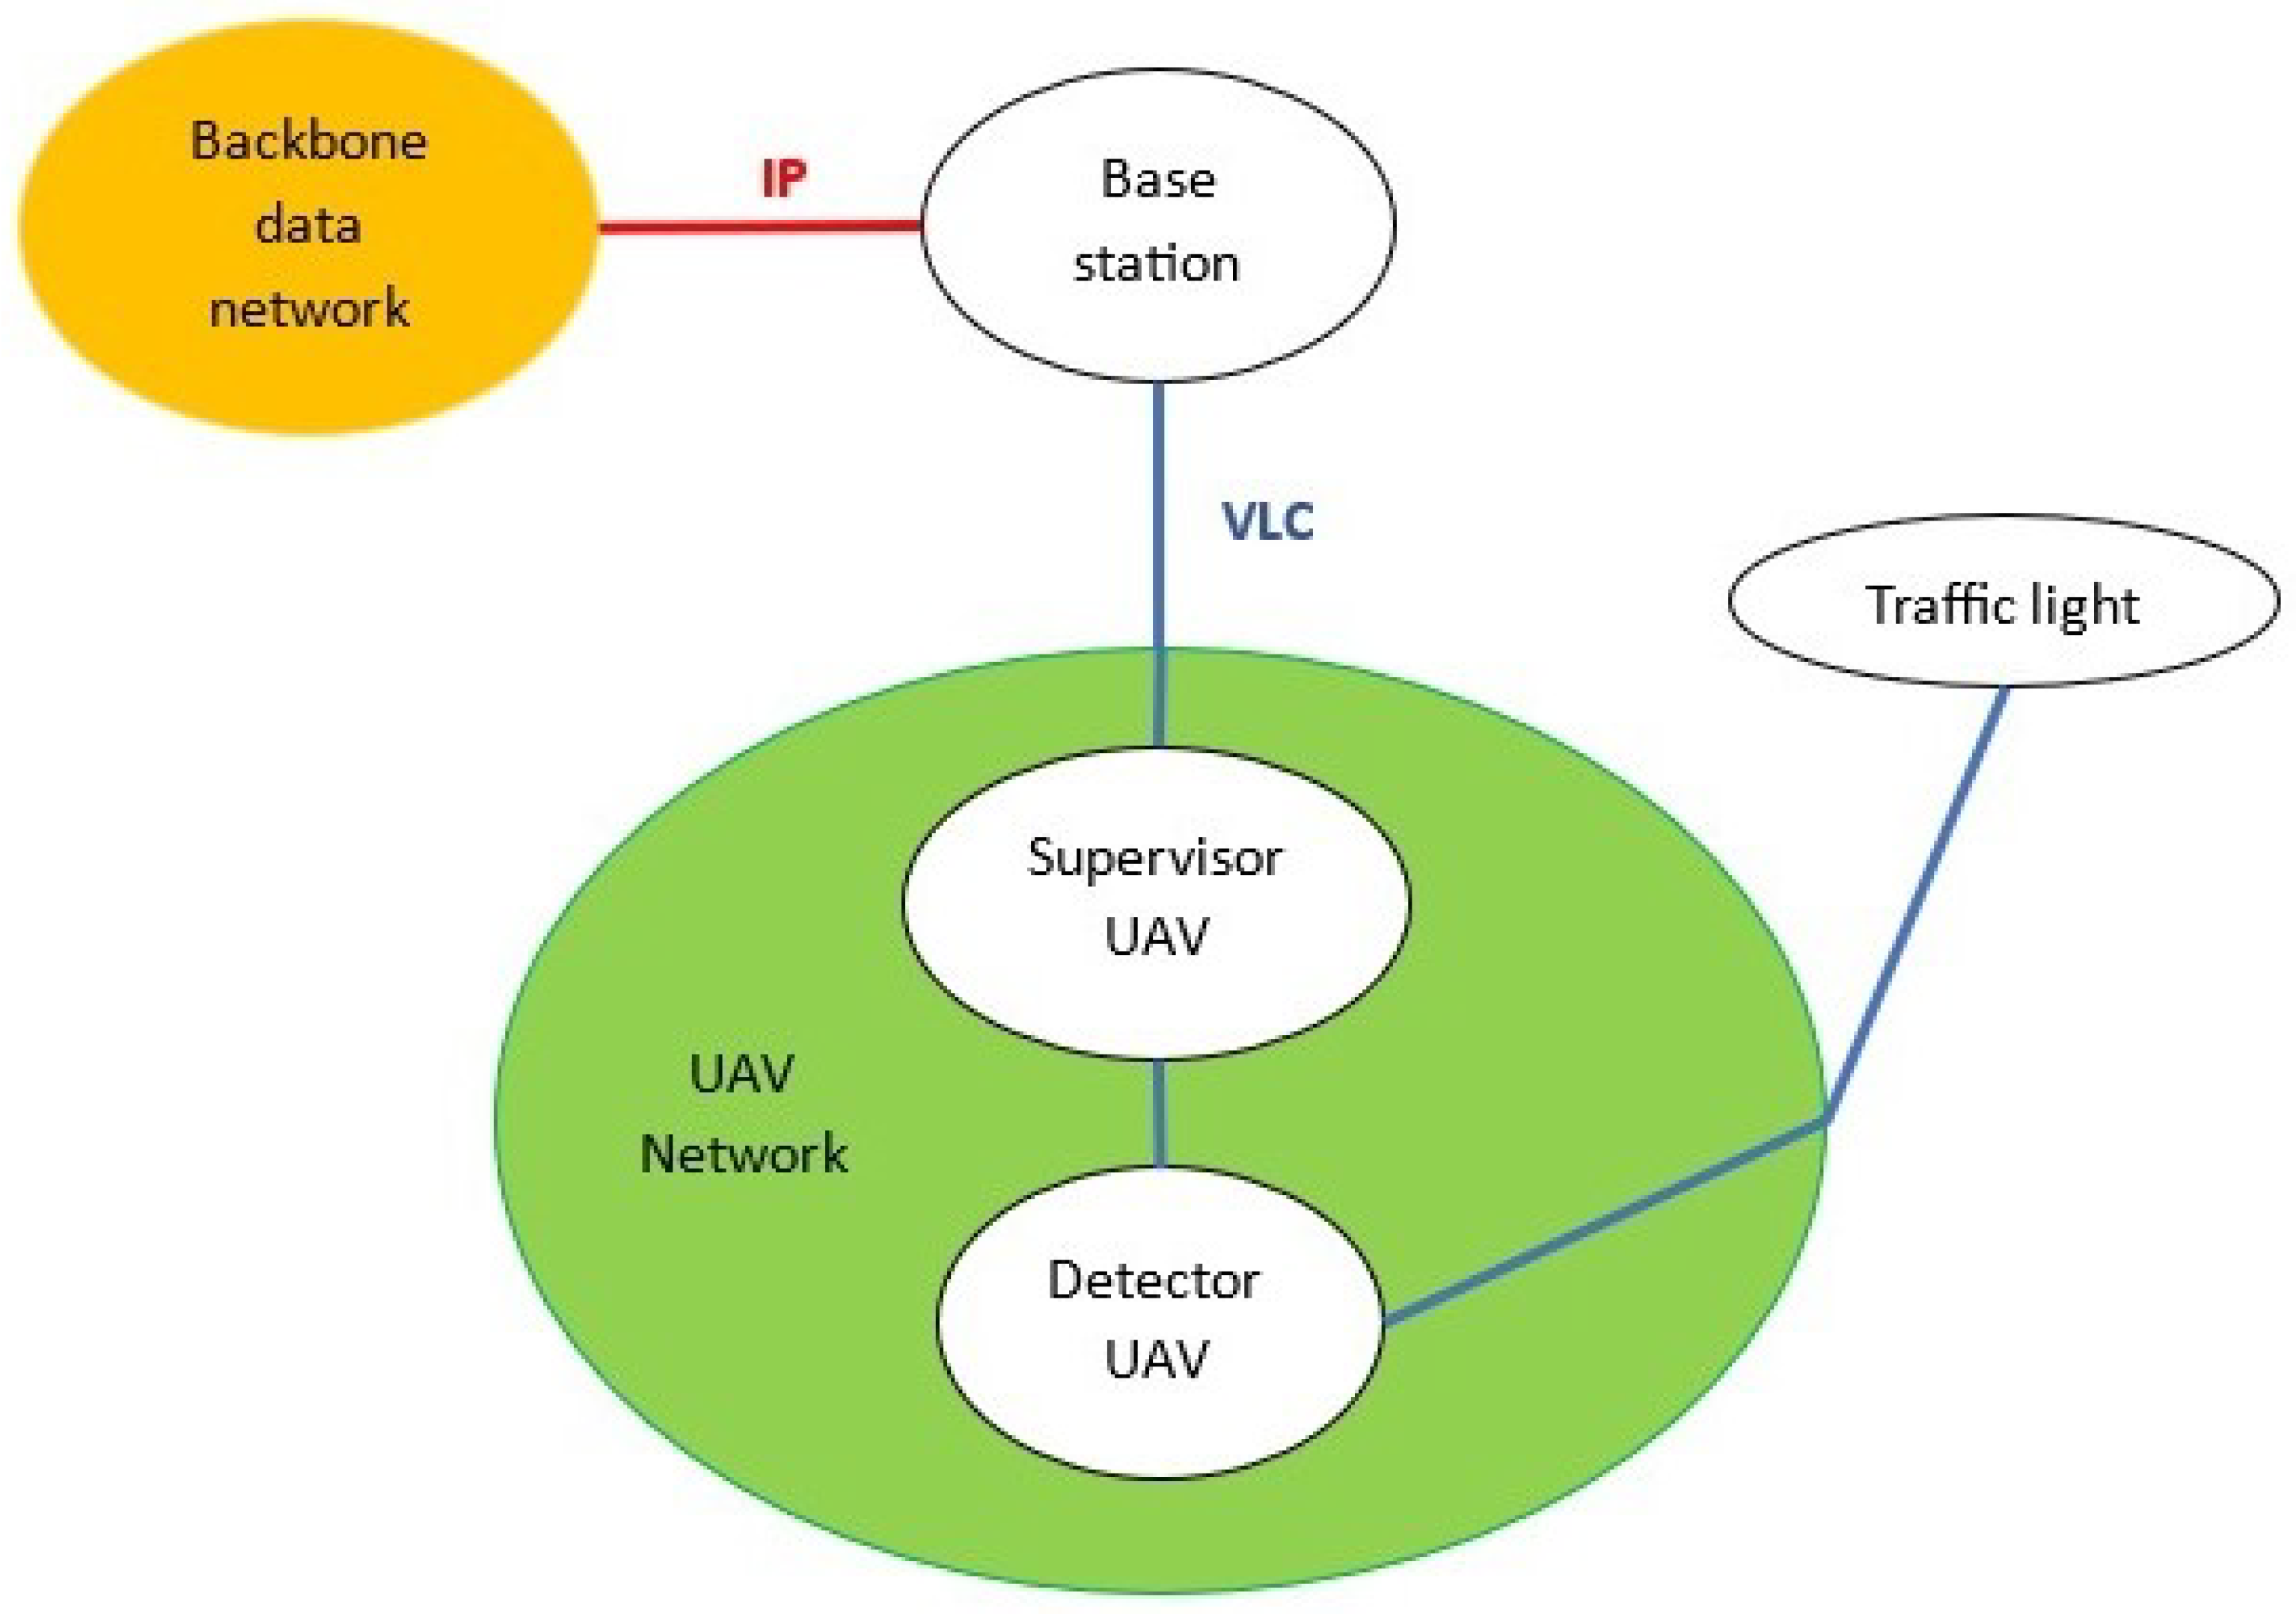
- Base station: we can take a look at Figure 4 to see how the base station is interconnected.In order to establish VLC communication between the base station and the supervisor UAV, our base station has to have a VLC transmitter and receiver. On the part of the backbone network, we will not have problems since, in this case, with any network access device, we could send and receive data if we have access to them.Regarding the issue of powering the systems, as we are working with a fixed installation with access to an electrical supply, we should not have any problem powering our devices, which are the VLC transmitter, VLC receiver, and battery charging stations for UAVs.
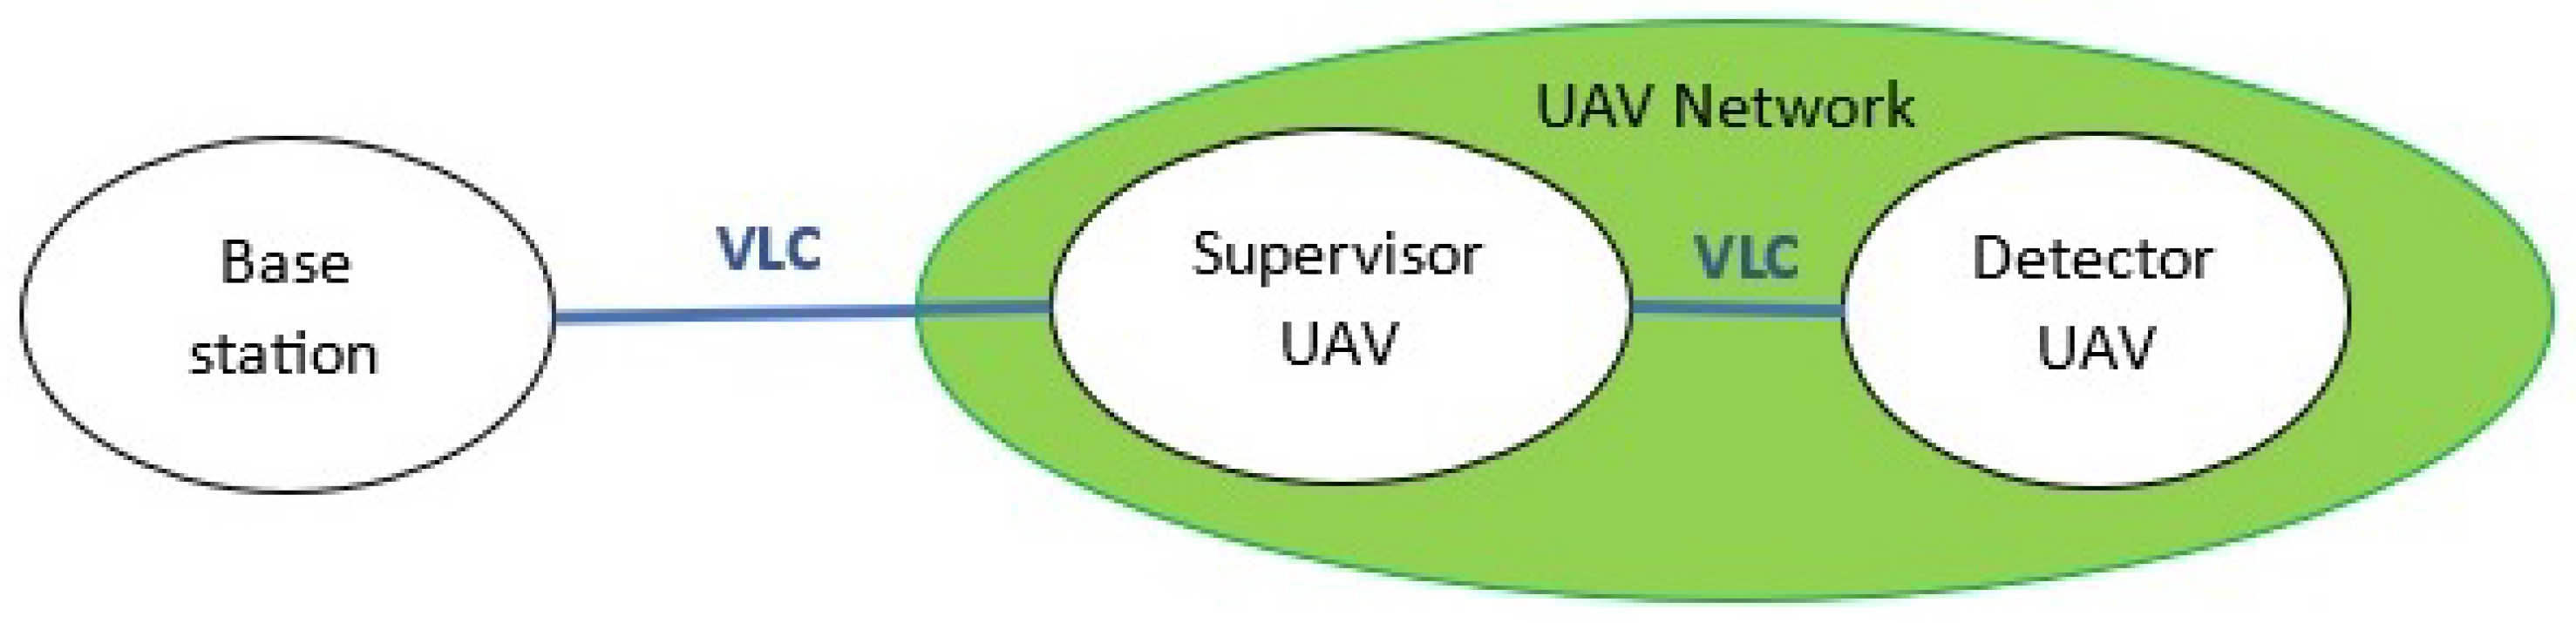
- Supervisor UAV: as we see in Figure 5, the supervisor UAV has to have a VLC transmitter and receiver on board to be able to communicate with the base station and the detector UAV. Due to the supervisory function, it is not necessary for it to have any other gadget on board; thus, we can reduce its weight and thereby increase flight time.
- Detector UAV: as we exposed in Section 2.1, the UAV detector has to notify the traffic light of the need to change the operating mode to adapt to a new traffic situation. To do this, through VLC technology, the detector UAV will inform, using our defined protocol, the traffic light that must make the change. Attending to hardware issues, this UAV will have on board a high-definition camera that allows us to obtain the images to be processed, as well as a VLC transmitter and receiver. In Figure 6, we can observe the connections of this UAV through VLC with the other system elements with which it will communicate.
- Traffic light: this component functions as a passive device, solely receiving information. Consequently, we will require a VLC receiver linked to the detector UAV responsible for its remote operation.The power supply for the traffic light is easily managed, as we have access to the electrical grid. The transition between autonomous and remote modes can be executed through a relay triggered by the traffic light. This arrangement enables the control signal from the traffic light regulator to be interrupted when the traffic light needs to operate remotely.
3. Algorithms Integrated in the Prototype
3.1. Image Processing Algorithm
3.2. Traffic Congestion or Saturation Detection
- Step 1: UAV takes an aerial photograph and processes it. After this, we will obtain a road occupation value .
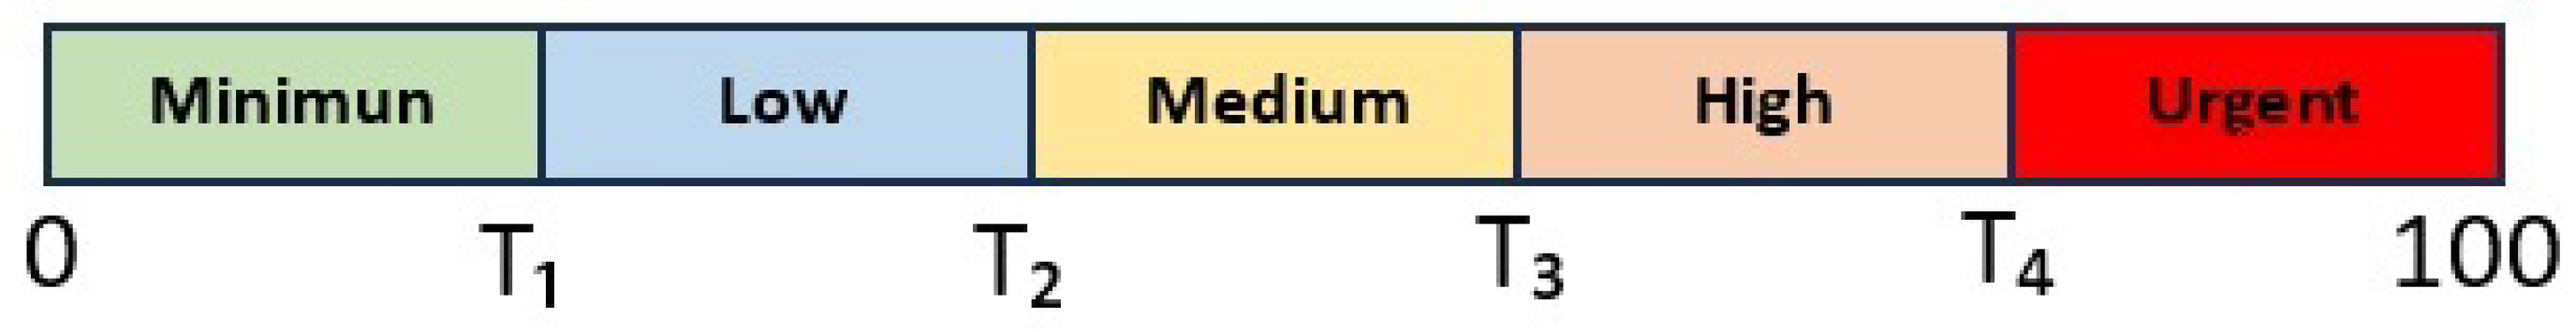
- Step 2: value obtained is compared to the limit threshold values of the mode segments to know at which mode is located.
- Step 3: once defines the mode we are in, it is compared to the previous mode detected by the UAV. In case they are not the same, the UAV will notify the traffic light it has to change to the mode where is located and, after that, return to take images. On the other hand, if the previous mode is the same, the UAV returns to take a photograph.
4. Protocols
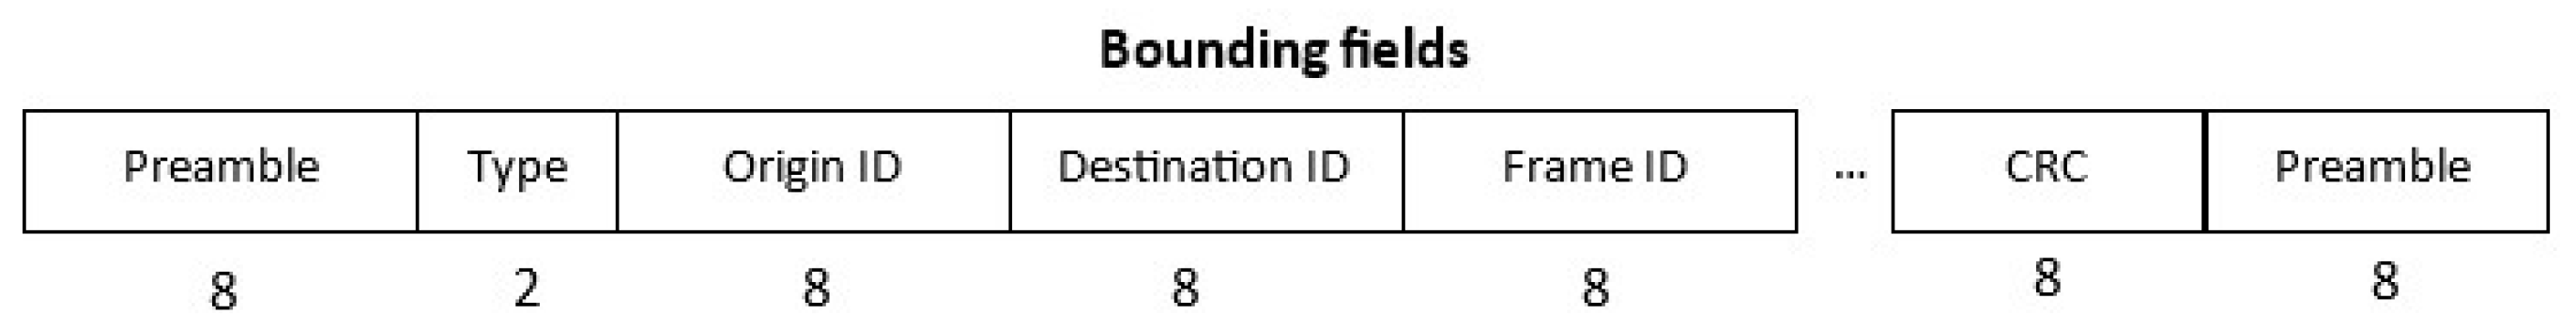
4.1. Message Format Protocol
- The first one is the delimitation of frames through which the beginning and end of a data block can be known, thus allowing synchronization between sender and receiver.
- The second function it provides us is error control, which can ensure that the information received corresponds to the original issued.
- Finally, the third function is that it allows flow control so that it prevents the sender from saturating the temporary storage memory, or buffer, from receiving the destination due to the different speed or occupancy of the two parties.
- If the bits are 00, we are talking about a supervision frame in which we find relative information about which mode each detector UAV is in. These types of frames are exchanged between the detector UAV and the supervisor UAV, where the former informs the latter of what mode they are in, and the latter sends the information of the mode in which all the detector UAVs it supervises are in the base station.
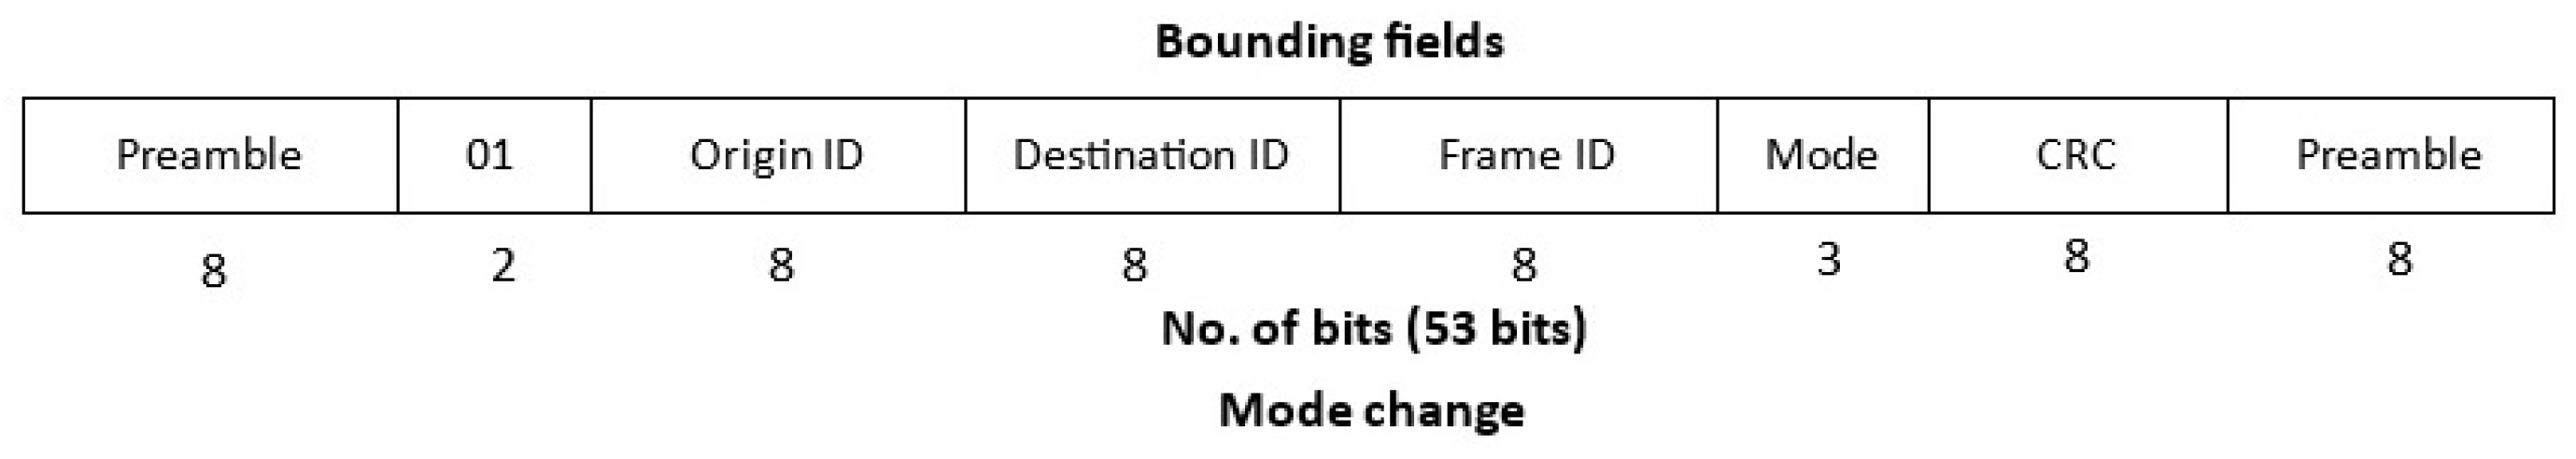
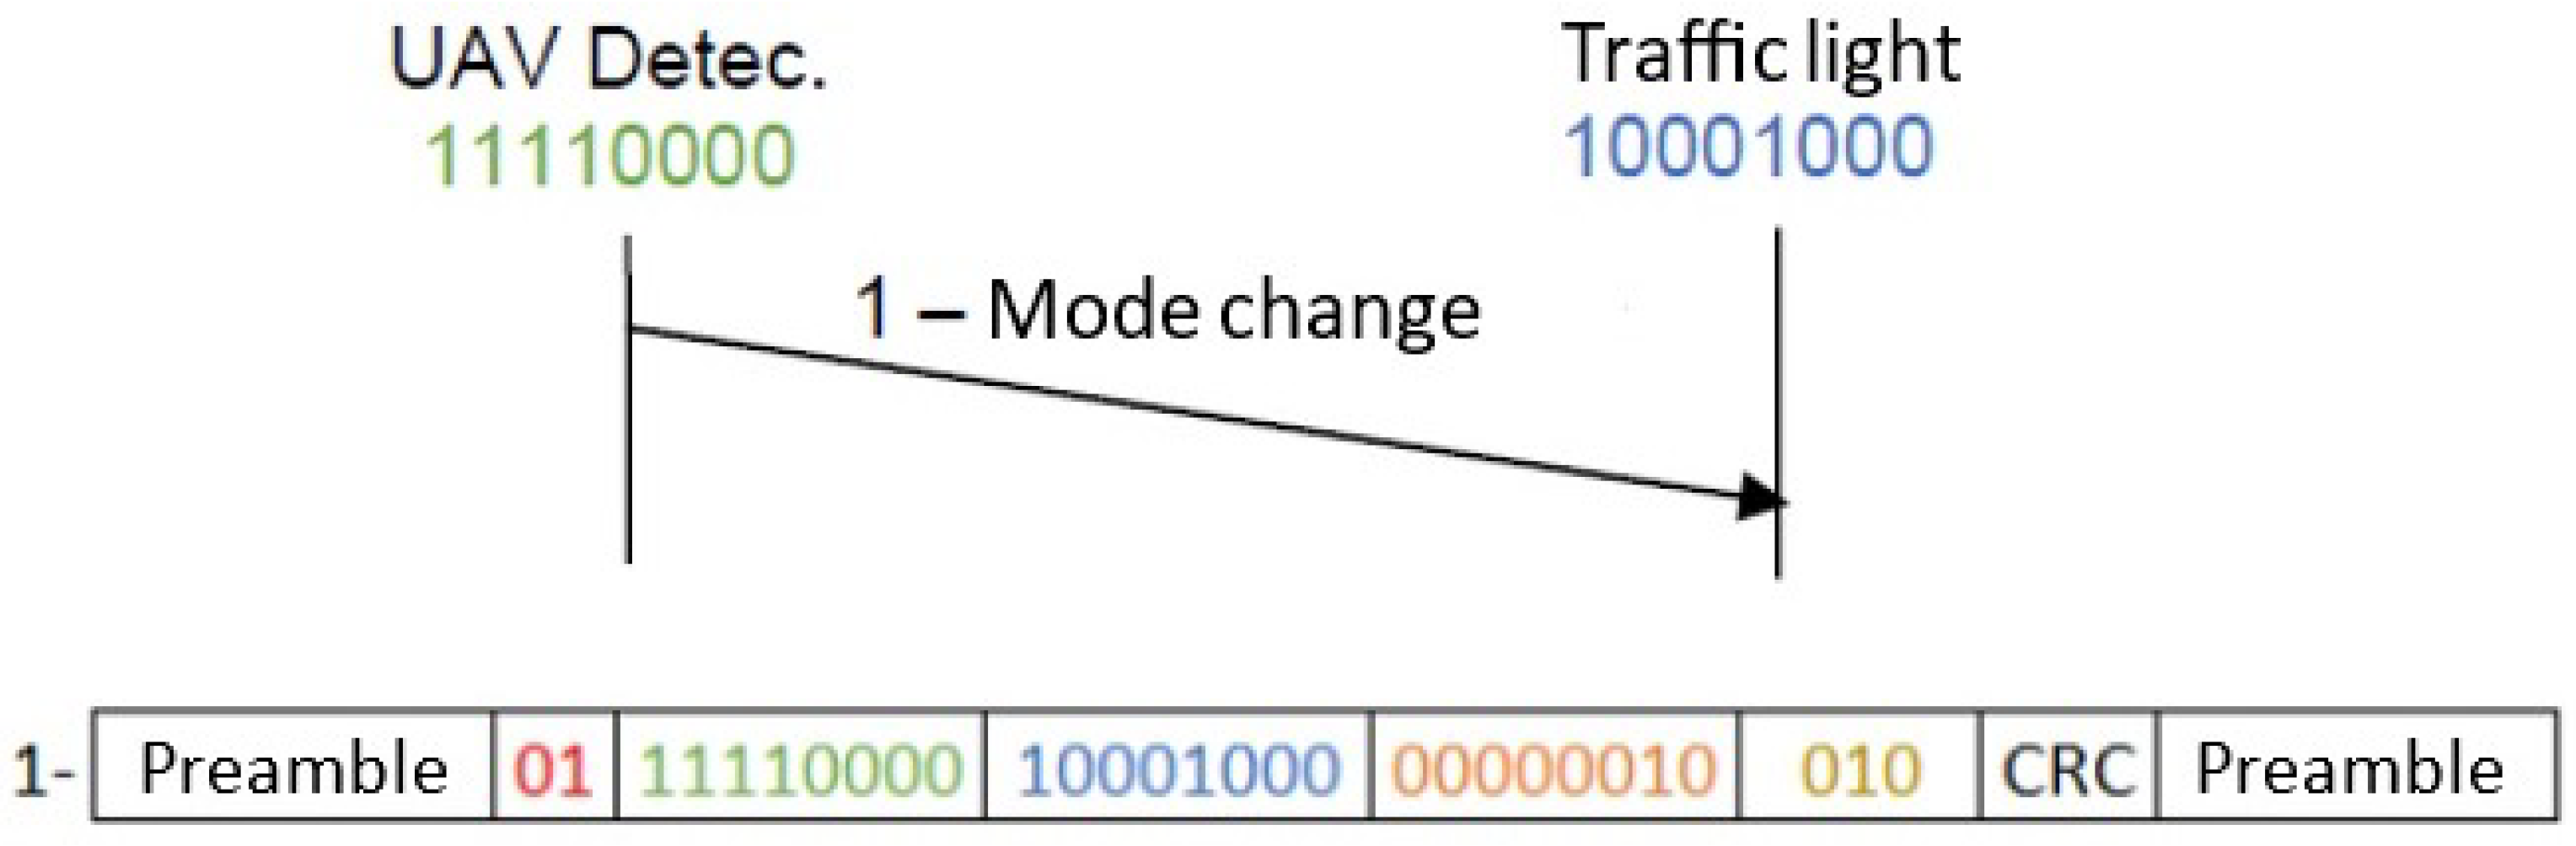
- If bits are 01, these frames will notify the detector UAV at the traffic light of the need to make a mode change.
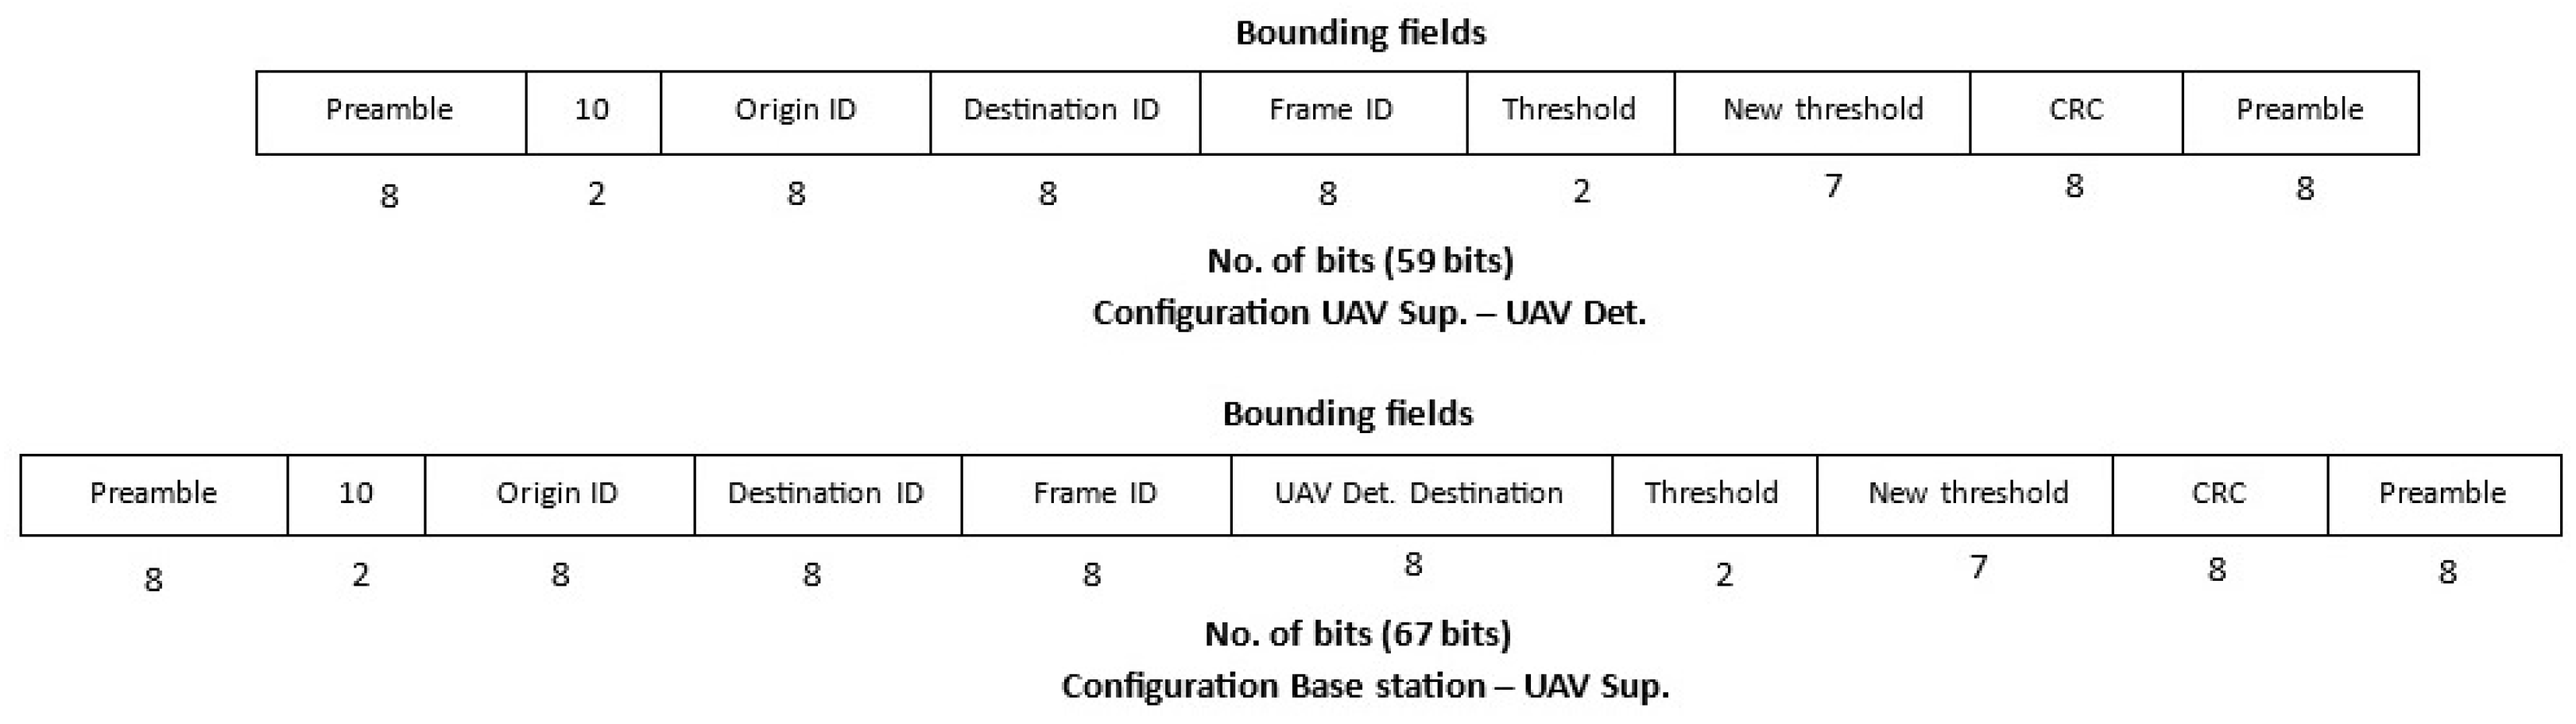
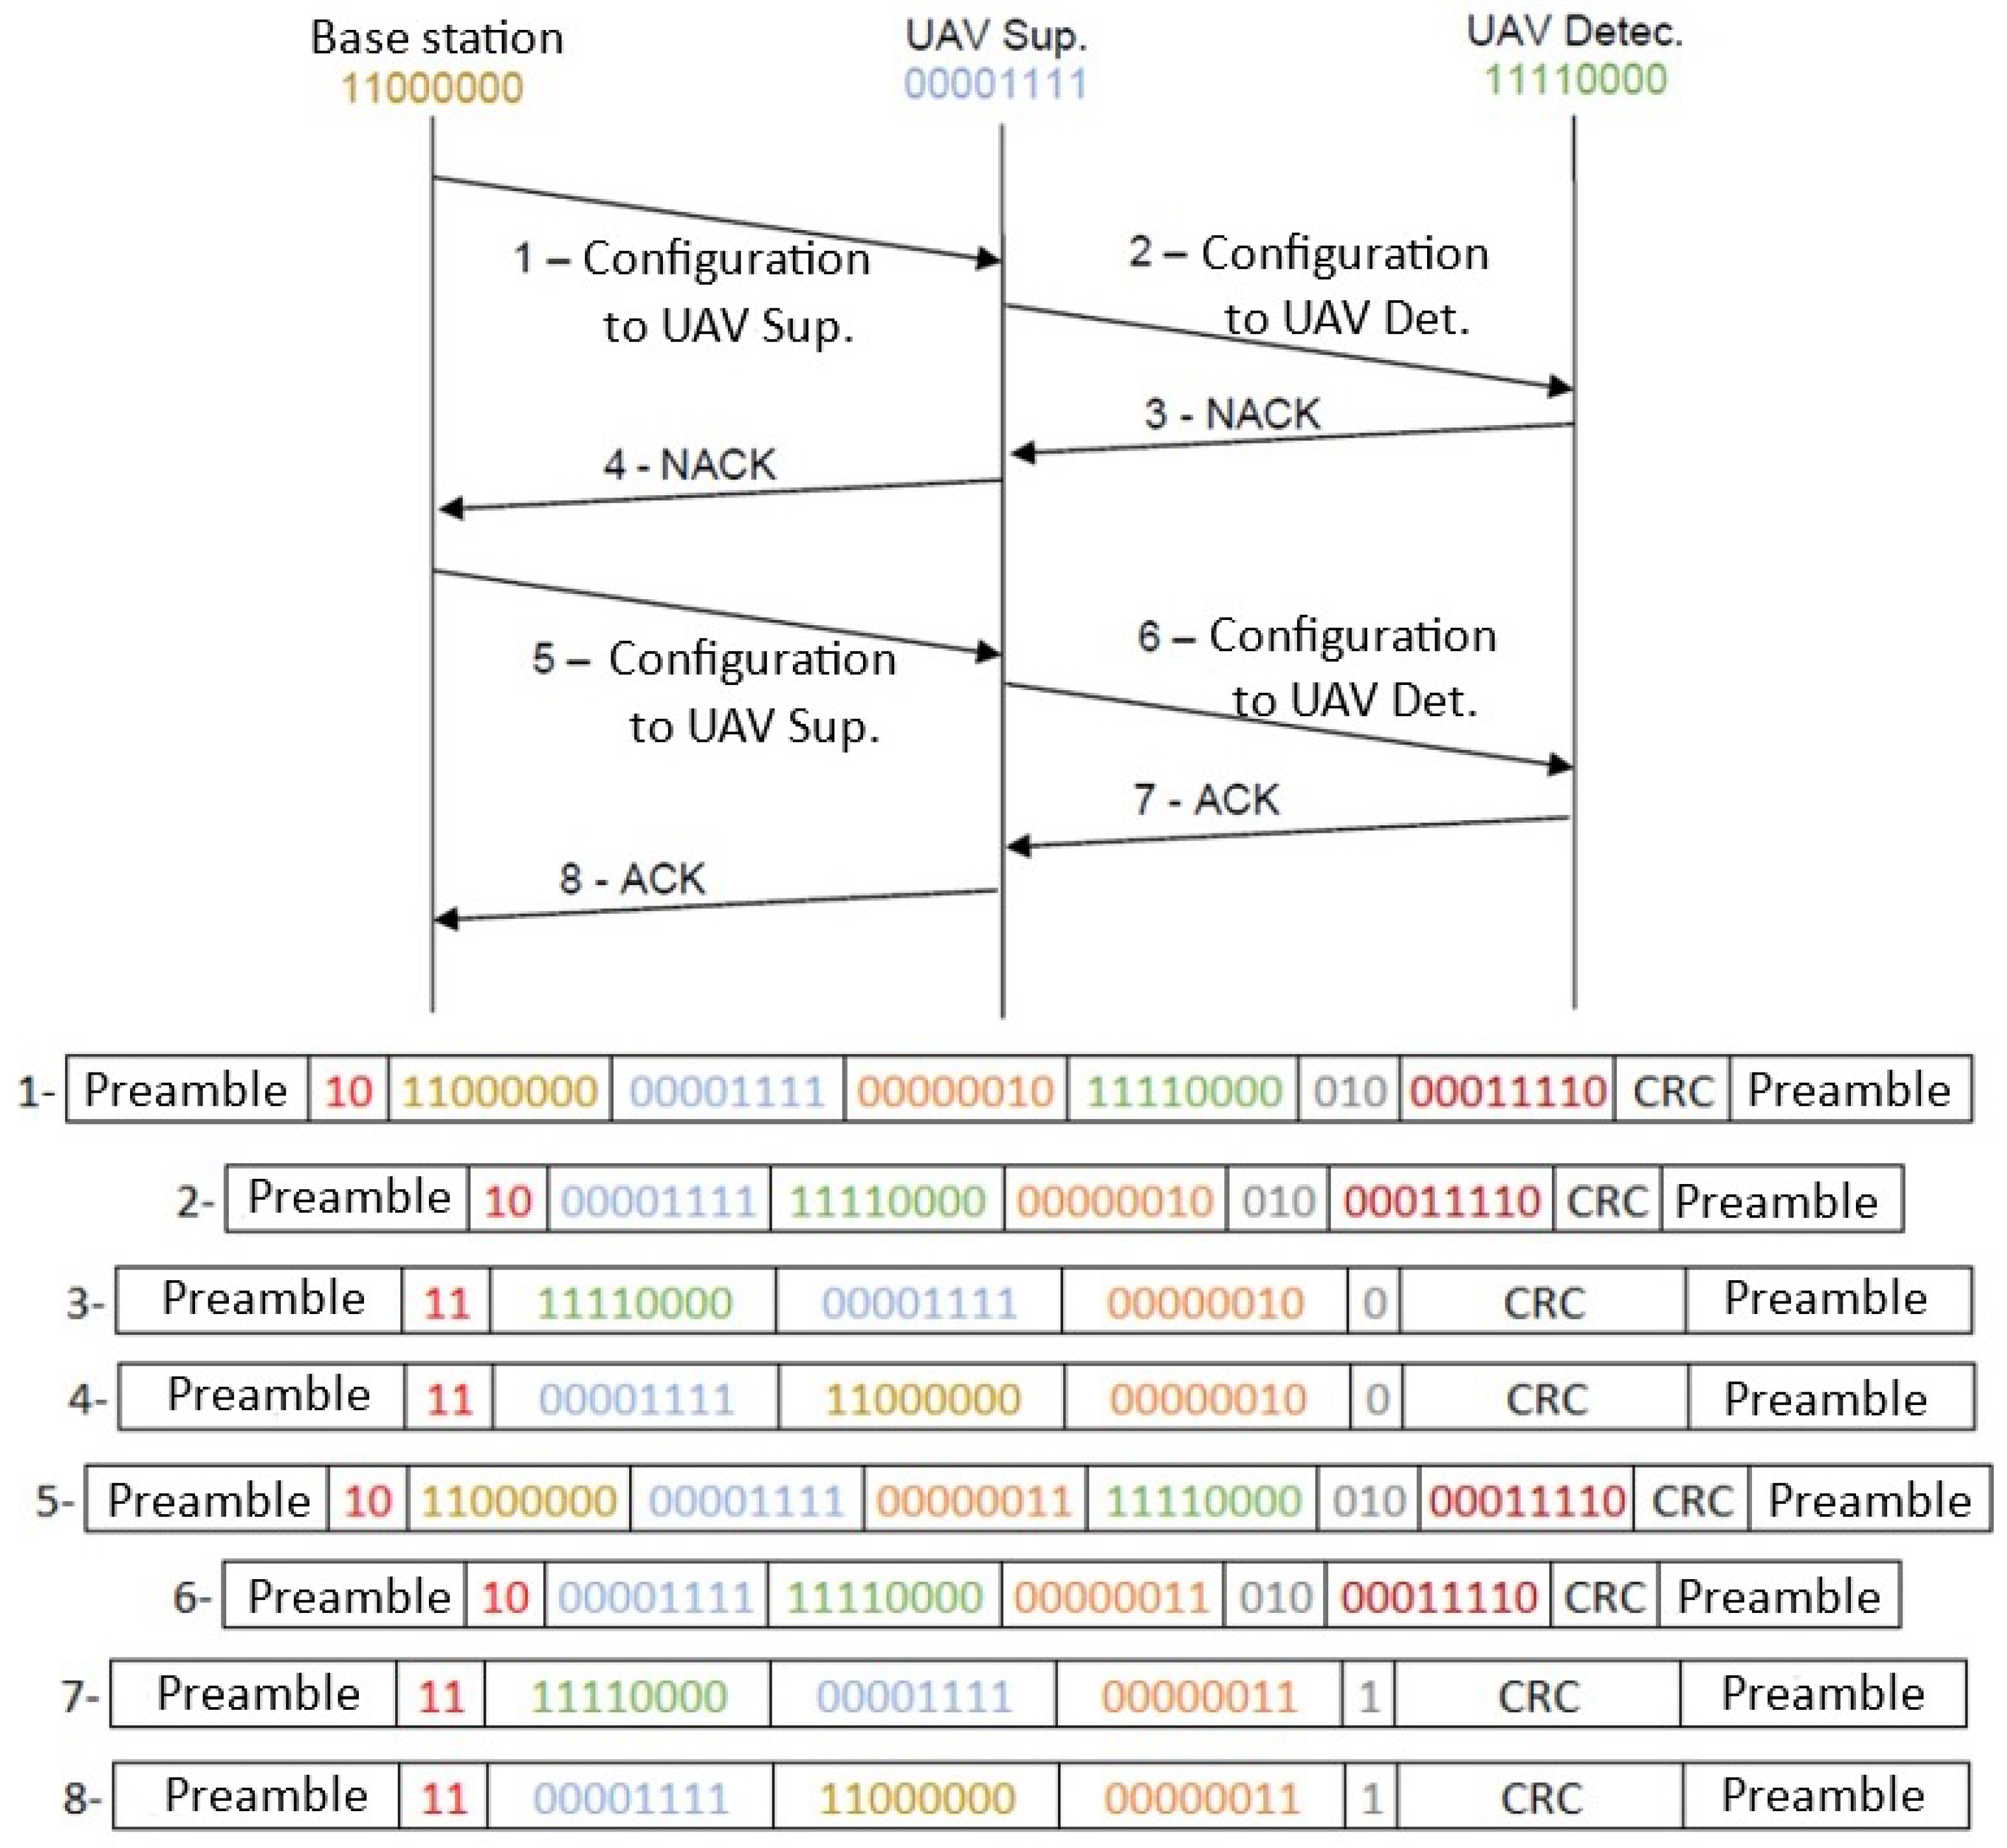
- In case the bits indicate 10, this signifies configuration frames. Their purpose is to facilitate adjustments to the thresholds for potential modes within the detector UAVs. This message originates from the base station and traverses through the supervisor UAV, with the latter being responsible for disseminating it to the relevant detector UAVs.
- Finally, for the value 11, these are acknowledgment (ACK) frames in which the sender is informed whether the message has been received and processed correctly or not. The decision to use an ACK protocol arises from the fact that we consider it important because the traffic lights have to work correctly, and an unwanted mode change does not occur if the information has not arrived correctly or has been affected. In case any unwanted mode change occurs, instead of managing traffic saturation to decrease it, we will help to do the opposite because more vehicles will arrive on the road and cannot get through it.
- Mode change frameThe first type of message that is exposed is the one that will be sent from a detector UAV to a traffic light, indicating that a mode change is required due to current traffic circumstances.In Figure 13, it can be seen that the two message-type bits will have the value “01”. It is also observed that the first 34 bits form the common part in all frames. In the source ID field, we will have the address of the detector UAV that originated the message, while in the destination ID, the address of the traffic light will be entered. After these common fields, three bits appear that will indicate the operating mode in which the traffic light must operate. These three bits allow us to encode eight possible modes of operation, in our case having three possible free modes since, as we will see in Section 4.2, our system uses five modes of traffic lights and detector UAVs.
- ACK and NACK frameThe next frame type that can be found would be the one in which we find that the two frame-type bits have the value “11”. This type of frame, whose structure we can see in Figure 14, again has the 34 bits common to all the frames in our system.It can be seen from Figure 14 that a single-bit frame field will define whether the ACK message has a positive result or a negative result. In this way, the sender can be informed that a frame has been processed successfully. This type of frame will be sent from the detector UAV to the supervisor UAV and from the latter to the base station and will confirm through the frame ID the type of message to which it is responding and whether it has been treated successfully or not.
- Configuration frameThe third possible frame type will have the value “10” in the frame-type bits, corresponding to the configuration frame. As mentioned previously, these frames allow us to change the traffic congestion detection thresholds of the detector UAVs. These types of frames will be sent from the base station and are aimed at the detector UAVs with which we will have two types of configuration frames: those that will be sent between the base station and the supervisor UAV and the one that the supervisor UAV will send to the UAV-affected detector. As seen in Figure 15, the 34 common bits will again be present regardless of the sender of the frame.After that, depending on the sender and receiver of the frame, there are two possible frames. Knowing that the first part of this type of frame is sent from the base station to the supervising UAV, the lower type of frame in Figure 15 will be discussed first. The source ID will be this frame’s base station, and the destination ID will correspond to the supervising UAV. As you can see, we will have eight bits that will indicate the address of the recipient detector UAV, two bits that will indicate which threshold must be modified in this detector UAV, and seven bits that allow us to indicate the value of this new threshold. As seen previously in Figure 10, there are different thresholds, which are , , , and , which correspond to the four possible values that the two threshold bits give us. That is, for “00” we will modify , and with “01” it will be , and so on. The new value to be inserted is given by the seven bits of the new threshold field, where we can represent values from zero to one hundred according to the scale in Figure 10 to be able to set the new value of the selected threshold.Once the UAV receives the configuration frame from the base station, it must be sent to the affected detector UAV. To do this, we will now look at the upper frame of Figure 15. In this case, the source ID will be the supervisor UAV, and the destination ID will be the detector UAV. After this, we see the two bits again to know which threshold must be modified and the seven bits that indicate the new value of the selected threshold.
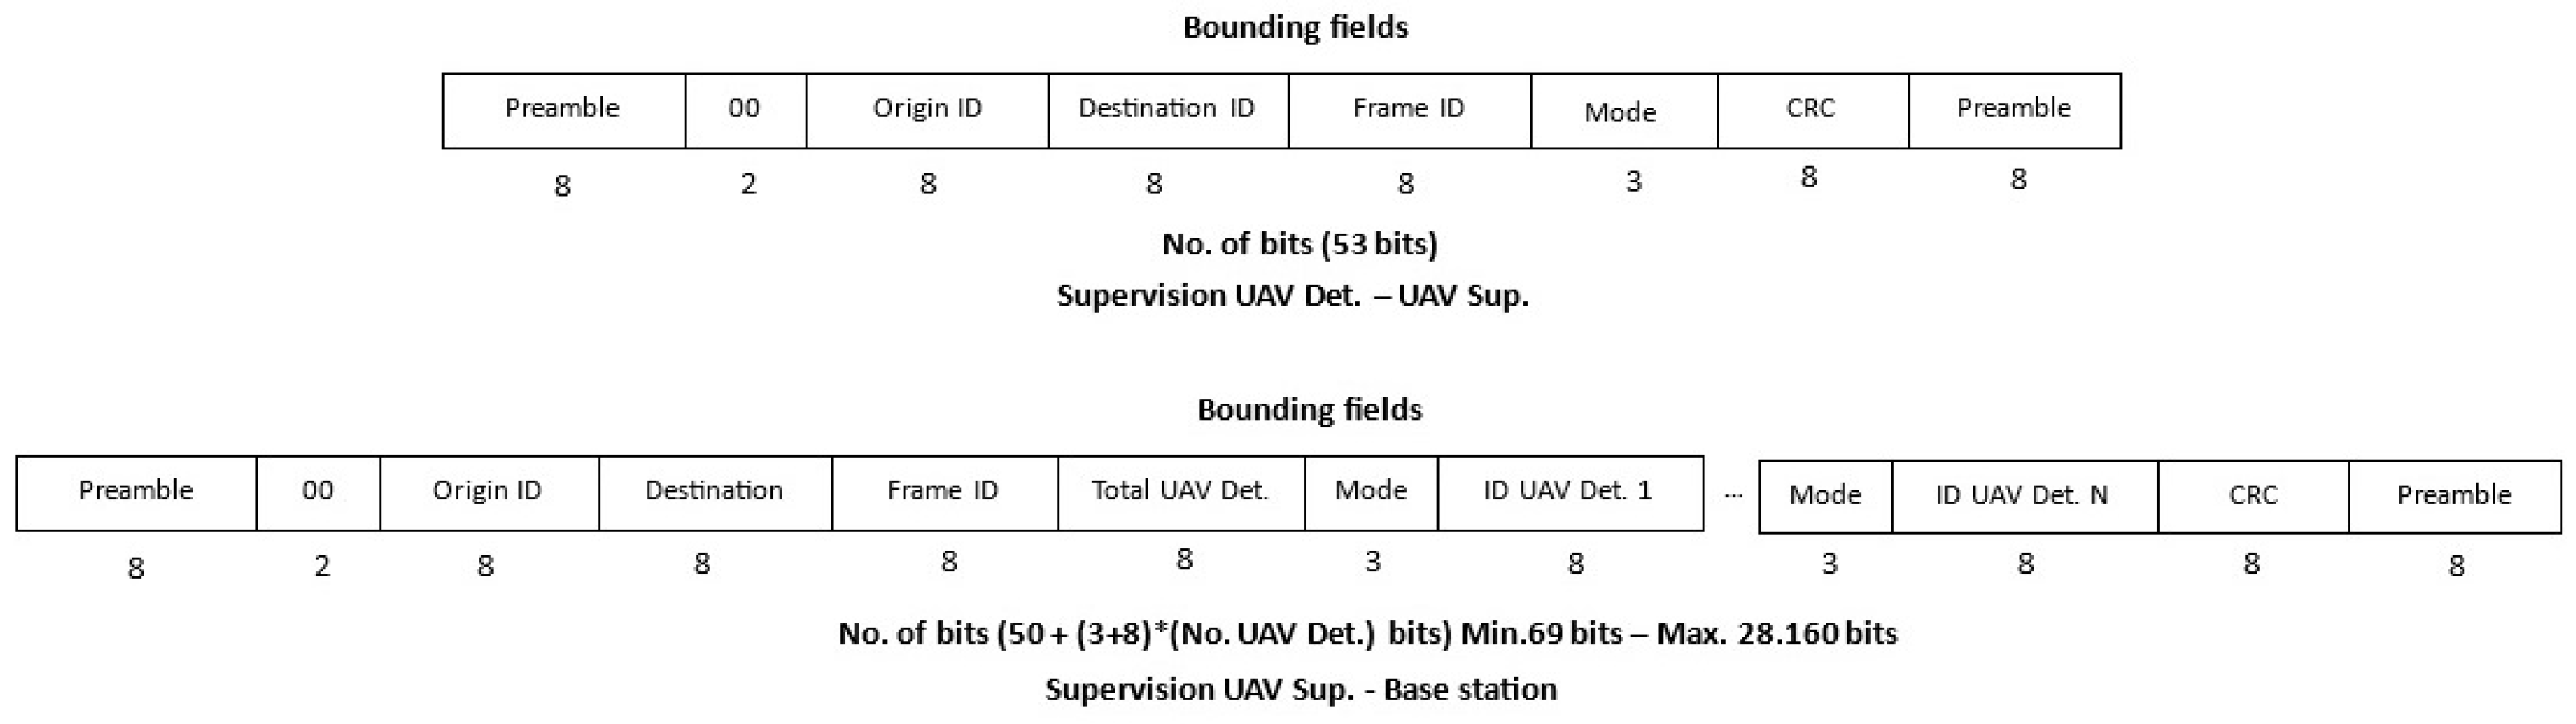
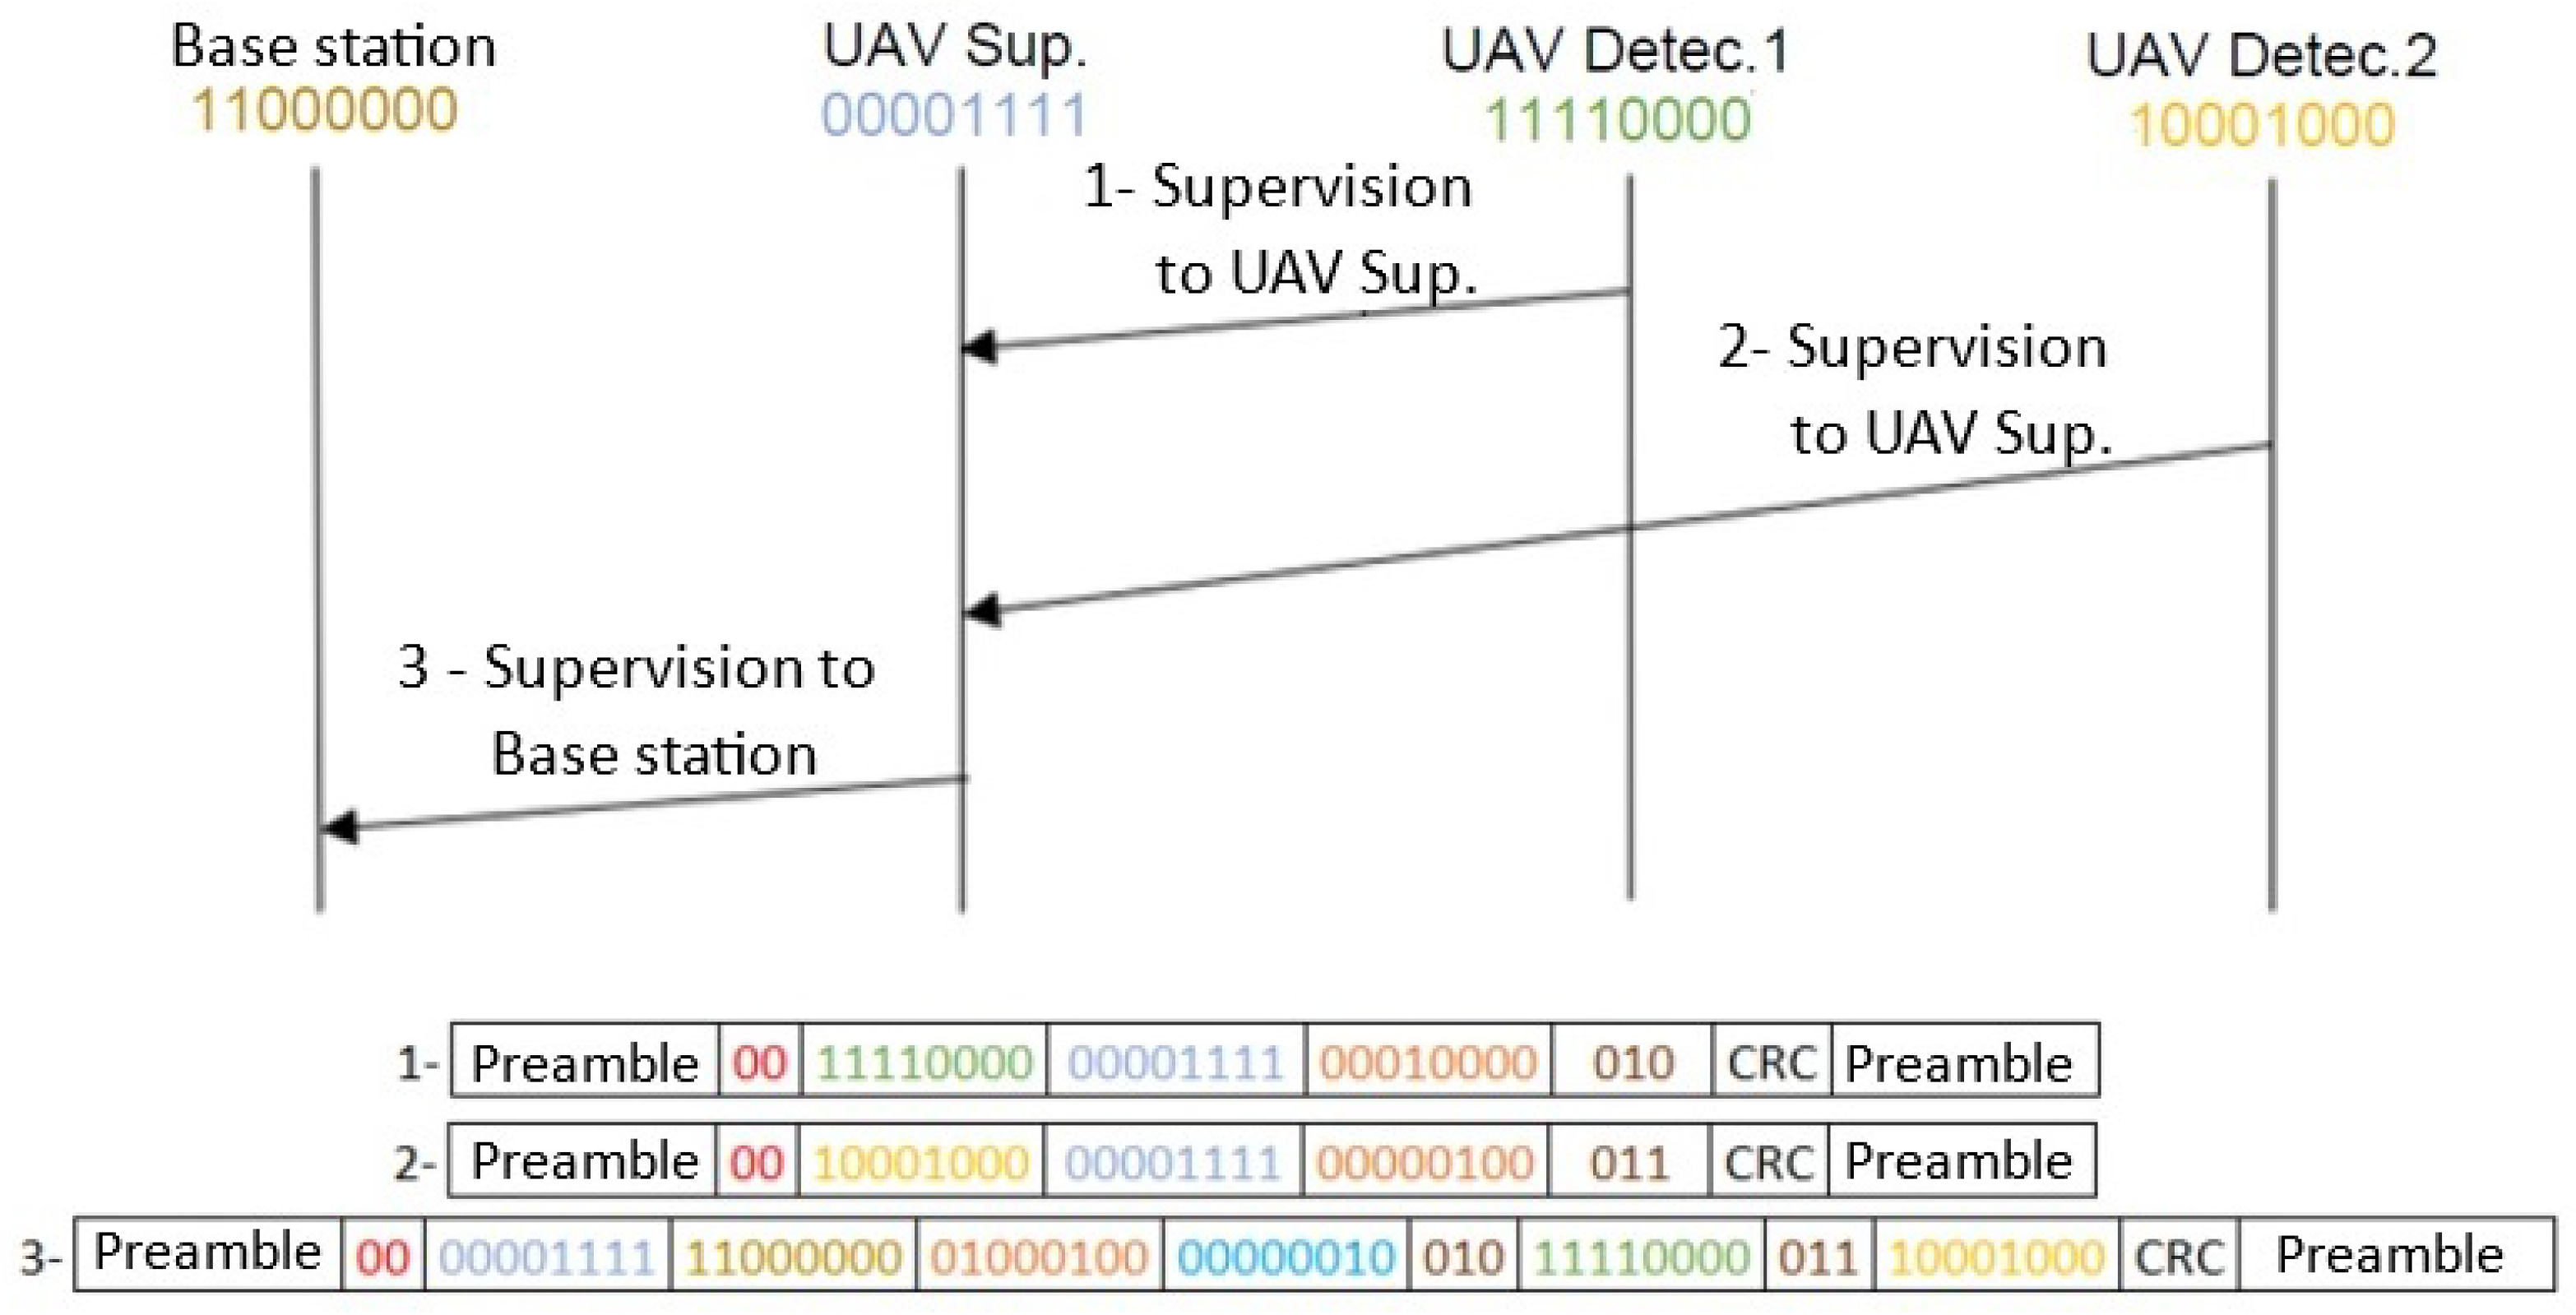
- Supervision frameThe last type of frame that we can find will be the supervision frame. In this case, two types of frames can be found, again, depending on the sender and the receiver. One type of these frames, which we can see in the upper frame of Figure 16, will be sent from time to time from the detector UAVs to the supervisor UAV. These mentioned frames will include in the source ID the detector UAV that sends it and in the destination ID the address of the supervising UAV. After this, there are three bits that allow the supervising UAV to be notified as to which mode the detector UAV that sent the message is in.The other category of frames in this scenario pertains to the transmission from the supervisor UAV to the base station, providing information about the operational modes of all detector UAVs within the system. This can be observed in Figure 16. Following the standard section designating the source as the supervisor UAV and the destination as the base station, there is an eight-bit field that communicates to the base station the total count of UAV detectors in the system. Subsequently, the mode and address of the initial UAV in the system are dispatched, allowing the base station to receive mode and ID data as specified by the supervising UAV. Depending on the number of UAV detectors in the system, the frame may contain up to 28,160 bits. This does not present an issue during transmission, as it would take 1402 milliseconds to transmit at a rate of 2 Mbits per second.
4.2. Communication Protocol
- Supervisor UAV: This system element primarily operates in the “Supervision” mode and “Configuration” mode. In the former mode, information flows from the supervisor UAV to the base station, whereas in the latter, the supervisor at the base station receives the information and subsequently transmits it to the detector UAVs as required. The associated operating modes of the UAV supervisor can be observed in Figure 20.In the “Supervision” mode, the supervisor UAV transmits information regarding the status and mode of the detector UAVs under its supervision to the base station. This mode involves the reception of periodic information messages from the detector UAVs, and the data received from them are subsequently relayed to the base station. These messages, originating from various detector UAVs, will be intermittently received and promptly forwarded to the base station. As the supervisor UAV continually receives information from the detector UAVs, a consistent stream of data will be dispatched to the base station, ensuring real-time monitoring of the system’s status.
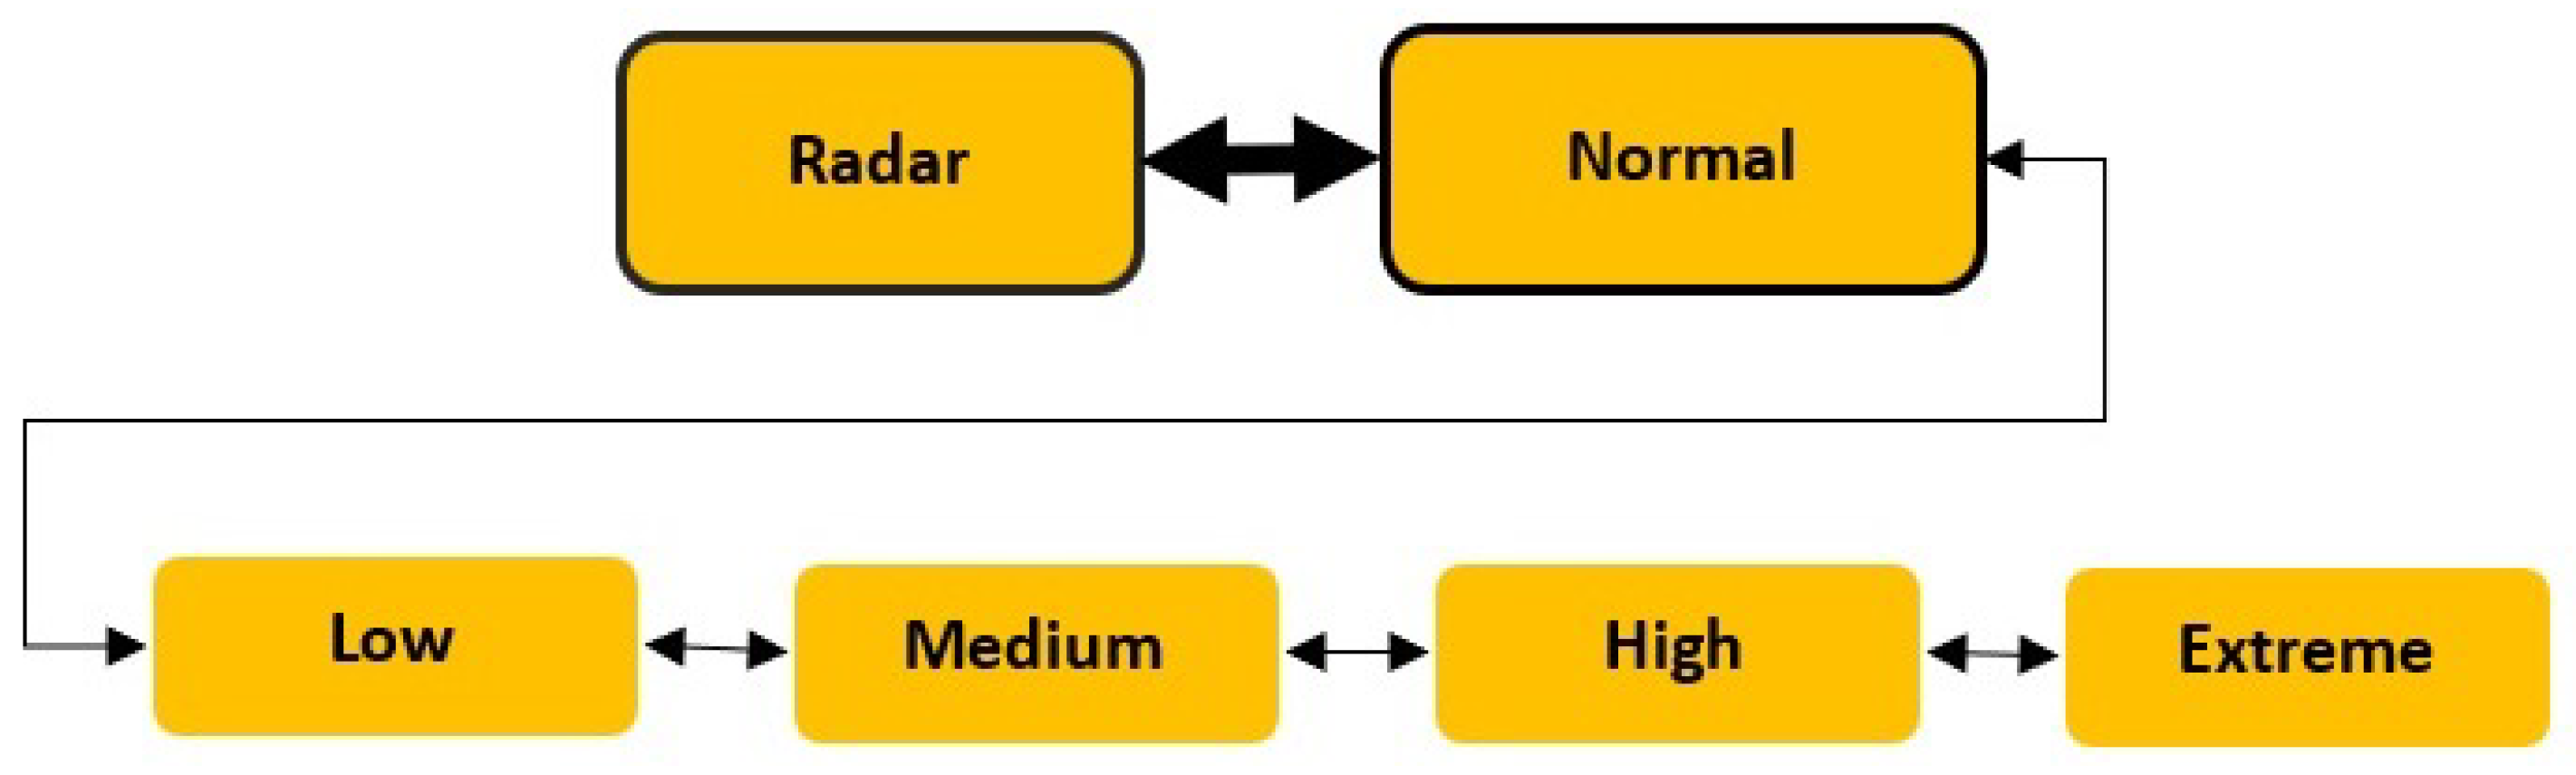
- Detector UAV: The detector UAV has two main operating modes: “Radar” mode and “Normal” mode. Within the “Normal” mode, you can find four operating submodes, depending on the traffic detected, which are “Low”, “Medium”, “High”, and “Extreme”. Therefore, the detector UAV can be in “Radar” mode if the traffic crossing the road is minimal or non-existent and can change to “Normal-Low” mode as soon as the traffic intensity exceeds the congestion threshold value for the change. When any mode change occurs in the detector UAV, it notifies the traffic light that it must also make a change to adapt. Likewise, if the detected traffic intensity is greater than the upper threshold value of the “Normal-Low” mode, it will switch to the “Normal-Medium” mode, and the traffic light will be informed that it must make a mode change. In Figure 21, we can see the schematic diagram of the modes in which the UAV detector can be found.Let us remember that the detector UAV is responsible for taking photographs in order to determine traffic congestion, so when the mode is changed the time that will pass between taking one image and the next will vary, time being higher for the “Normal-Low” mode and decreasing until reaching the minimum time that would correspond to the “Normal-Extreme” mode.On the other hand, and as we have seen in the UAV supervisor section, the detector UAV sends supervision messages to the supervisor UAV from time to time with the objective of informing that the system is operating correctly. These messages are sent periodically to the UAV supervisor and always have the same time interval between them.When the UAV is in “Radar” mode, it can be said that it is in a state similar to a low-consumption state. In this mode, the UAV does not take photographs since it is assumed that the traffic that travels along the road is minimal. The detection of the passage of vehicles is carried out using the technology provided by VLC. That is, through the light beam that is sent, we will detect the passage of possible vehicles. In this way, if the continued passage of vehicles is detected, it will go to “Normal” mode.Regarding the “Normal” mode, as we have already mentioned, the UAV could be in four possible submodes, the first submode being the “Normal-Low” mode, which it reaches after leaving the “Radar” mode.In the “Normal-Low” mode, the detector UAV will take photographs from time to time, with the time interval between images being the longest of all the submodes. When the UAV is in this mode, it is assumed that there is a light or low traffic load on the monitored road. As long as the image traffic congestion parameter value is contained between this mode’s upper and lower threshold values, the detector UAV will not make any changes and will remain in “Normal-Low” mode, taking and processing the images. When the measured parameter is below the lower threshold of the mode, the UAV will go to “Radar” mode and will notify the traffic light that it must proceed to a mode change. On the contrary, if the measured congestion parameter’s value exceeds the mode’s upper threshold value, the UAV will go to the “Normal-Medium” mode and inform the traffic light that it must change to the specific associated mode.When the UAV is in the “Normal-Medium” mode, the interval between photographs will be less than in the previous mode. In this way, the UAV can detect changes in traffic faster and more agilely and inform the traffic light so that it can adapt similarly. If the detector UAV is in this mode, the images will be treated in the same way so that depending on the intensity of the traffic detected on the supervised road and the traffic congestion parameter detected, the UAV may go to a “Normal-Low” mode if the measured parameter is at a value lower than the threshold of the current mode, or to a “Normal-High” mode if, on the other hand, the measured parameter is higher than the upper threshold value of the mode. As with the other operating modes, if the value of the measured congestion parameter is between the upper and lower threshold values, the UAV will remain in the current mode.Thirdly, we can examine the “Normal-High” mode. In this mode, the image-taking interval of the UAV will be reduced again, with the aim being that the system is capable of detecting changes in traffic and is able to adapt. As in the other modes, the image is treated identically, and the road congestion level will be extracted from it. Depending on this congestion parameter extracted from the image, the UAV can determine if it must change or stay in the same mode. If the parameter is below the threshold defined for this mode, it will switch to the “Normal-Medium” mode, while if the measured value of the parameter is greater than the upper value of the threshold, it will switch to the “Normal-Urgent” mode.Lastly, there is the “Normal-Urgent” mode. This mode has the lowest time interval between taking photographs since it is assumed that there is very high congestion or saturation in traffic and that, if measures are not taken in time, this can lead to large delays. The detector UAV will be in this mode whenever the congestion parameter measured in the image exceeds the lower threshold value for this mode. Once the number of vehicles on the road is reduced and the image congestion parameter is below the threshold of this mode, the UAV will switch to the “Normal-High” mode and will inform the traffic light so that it also adapts its mode to the amount of traffic detected.Finally, if the detector UAVs must be removed due to low battery, they inform the traffic light that it must make a mode change, since, in this case, the detector UAVs will stop monitoring the traffic and the control of the traffic light lights must be carried out by another device, which will be the traffic light regulator.
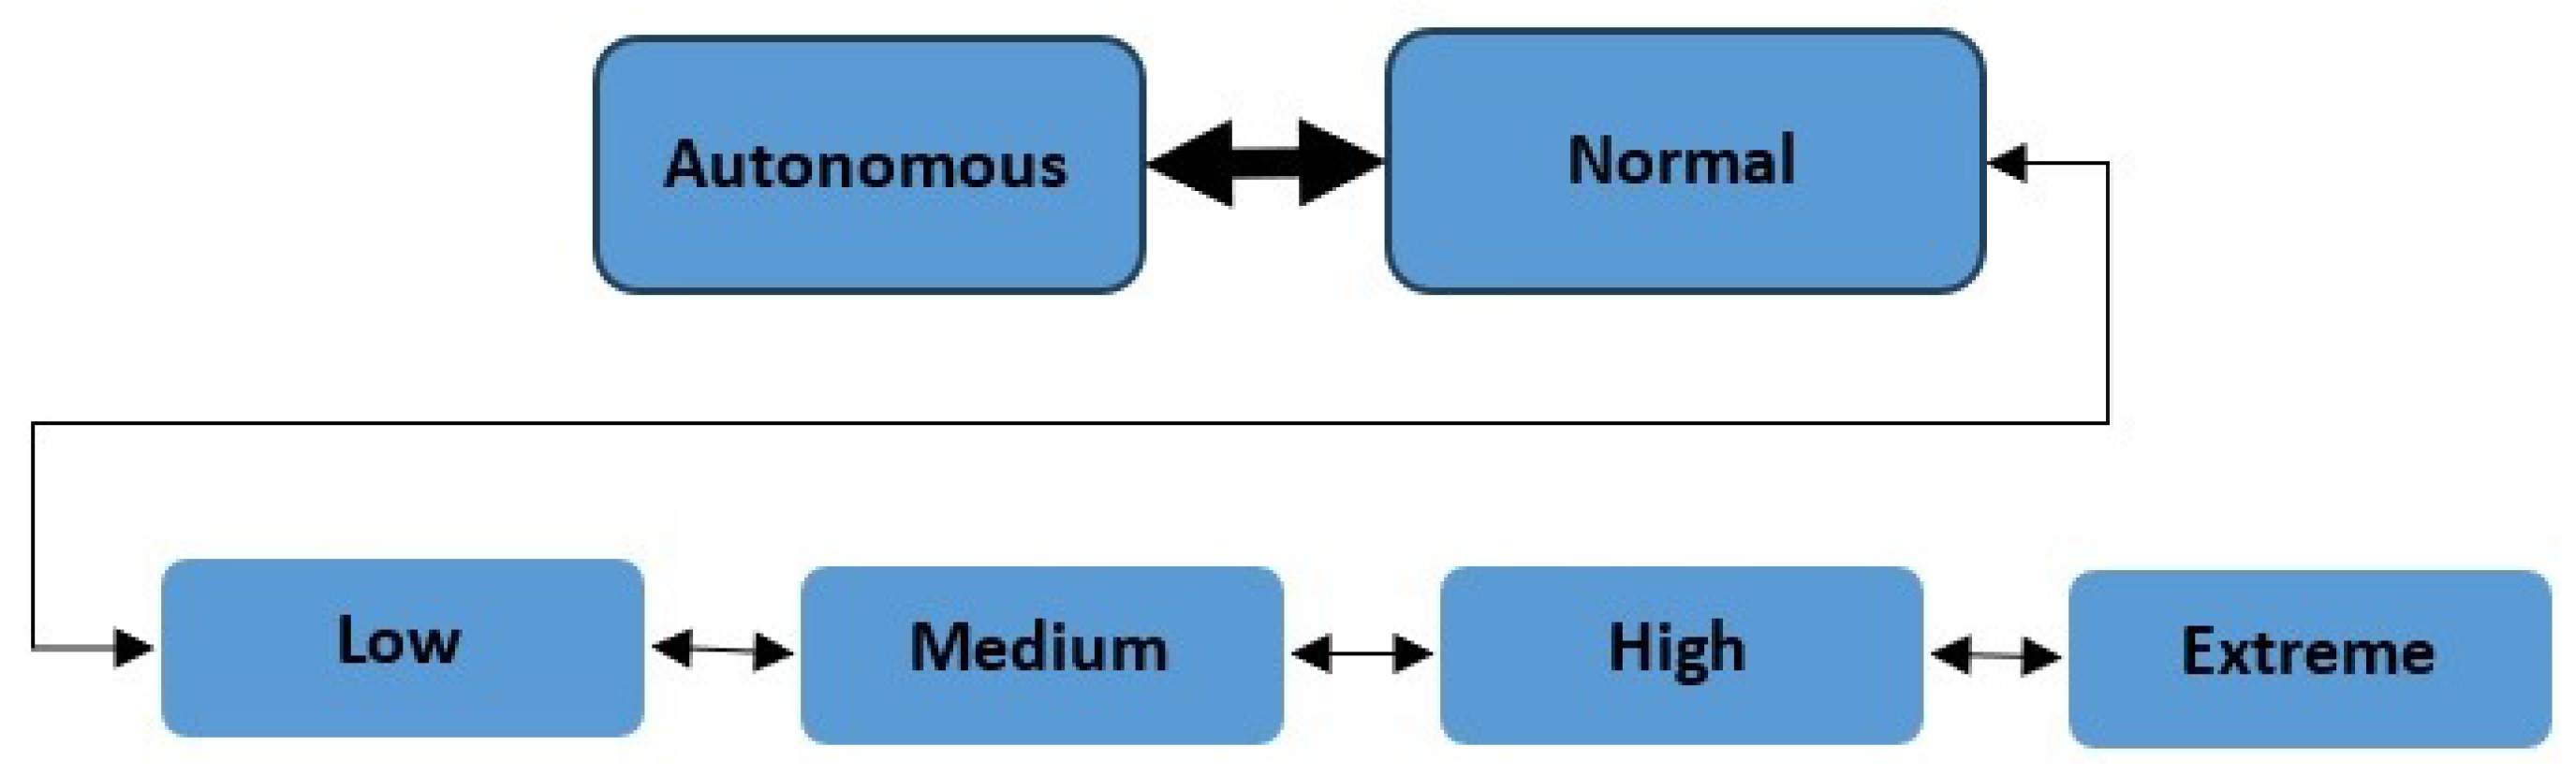
- Traffic light: The last element of the system that appears to us will be the traffic light. As indicated throughout this work, this element will be a passive element of the system since it will only execute the corresponding changes marked by the detector UAV.Like the detector UAV, the traffic light operates in two primary modes: “Autonomous” and “Normal” modes. Within the “Normal” mode there are four submodes, categorized based on the detected traffic intensity: “Low”, “Medium”, “High”, and “Extreme”. The organization of potential states for the traffic light is illustrated in Figure 22. The traffic light requires instruction from the detector UAV for a mode transition. Each submode within the “Normal” mode dictates varying durations for which traffic management lights are active. For instance, in the “Normal-Low” mode, the green light remains on for a shorter duration compared to the standard “Normal” mode. Conversely, in “Normal-Medium,” the red light’s duration is extended relative to the first mode. This adjustment in traffic light timings aims to facilitate efficient and agile traffic management.When the traffic light is in “Autonomous” mode, the order to turn the traffic light on and off will be regulated by the traffic light regulator to which it is connected. Thus, in “Autonomous” mode, the control of the traffic light will be, despite the redundancy, autonomous, just as it is currently being done in cities.Once the traffic light receives the message from the UAV indicating that it must go to “Normal” mode, the traffic light will disconnect the orders to turn the lights off and on from the traffic light regulator so that until it receives an order, the UAV will not make any further mode changes.When the traffic light receives the order to change to “Normal-Low” mode from the detector UAV, its lights will change the ignition time of each of them to adapt to the new situation. In this mode, the red light will have a shorter time while the green light will increase the time. This mode is associated with a low level of traffic with few vehicles on the road. The traffic light will remain in this mode until further orders from the detector UAV.If the traffic light is in “Normal-Medium” mode, it will again make an adjustment to its ignition time. In this case, the red light time will be reduced again and the green light time will be increased. In this way, we will have a longer green light time than in the previous mode, and thus, traffic will be more fluid. In this mode, it is assumed that the level of vehicles on the road is not very high and that there is fluid traffic.If the traffic light is in the “Normal-High” mode, it once again makes an adjustment to the lighting time of its lights. Again, the time that the red light is on will be reduced while the time that the green light will remain on will increase. It is assumed that if we are in this mode, there will begin to be traffic jams and crowds of vehicles on the road, so we should try to reduce the saturation on the road.As the last possible mode of the traffic light, we find the “Normal-Extreme” mode. The traffic light will be in this mode when the UAV detects that there is a large congestion of vehicles. In this mode, a final adjustment is made to the time that the lights remain on, reducing the time of the red light to a minimum and increasing the green light to a maximum. In this way, we will be able to give a quick exit to vehicles that are on the saturated road.As we have said in the text related to the detector UAV, if the supervising UAV notifies the detector UAVs of the withdrawal order, they inform the traffic light that it must make a mode change. In this case, the traffic light will return to “Autonomous” mode since UAVs provide no traffic congestion detection service, and the traffic light regulator will have to take care of the time that the lights are on for.
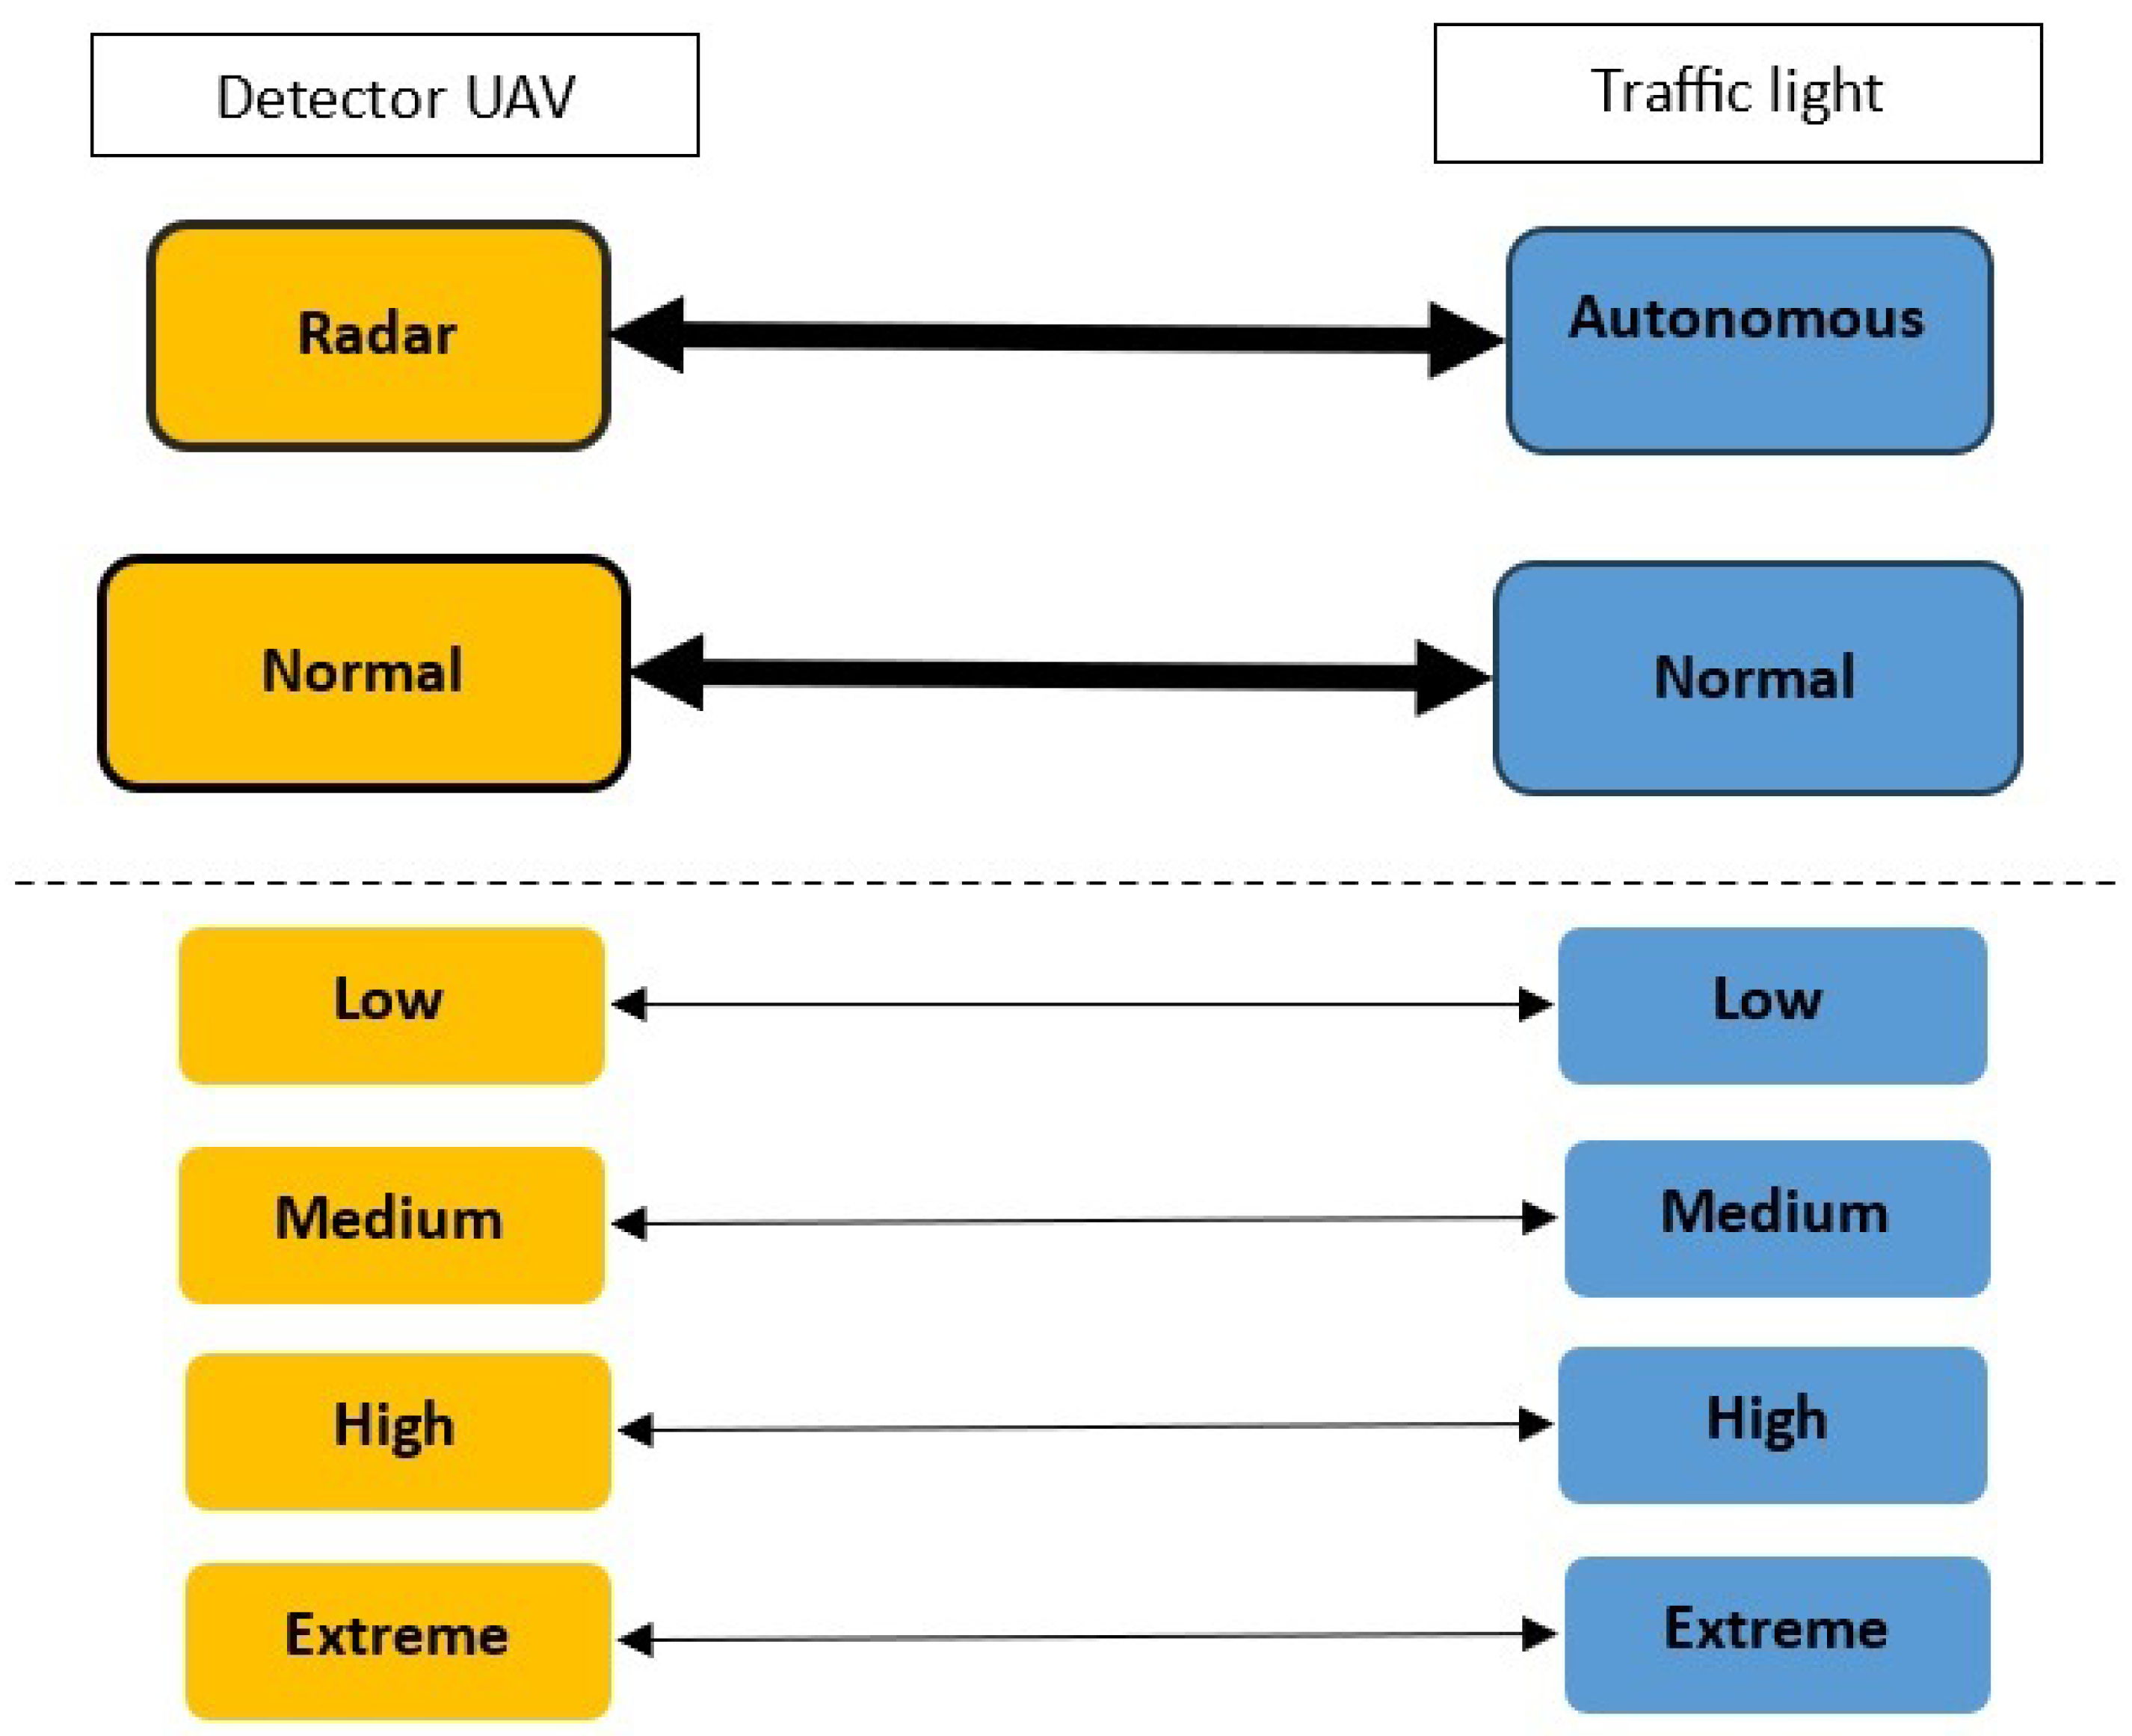
- Relationship between the modes of the UAV detector and the traffic light: Now that the modes in which the elements of the system can be found in are known, it is important to know what relationship exists between the detector UAV and the traffic light since, as we have been saying throughout this section, when the detector UAV considers a mode change, it must inform the traffic light of the change to the desired mode. It can be said that when the detector UAV changes modes, the traffic light must also do so, as indicated. Changing modes affects both differently because, as we have seen, in the case of the UAV it will influence the time interval between taking one image and the next, increasing as it goes, detecting greater congestion on the road. For its part, at the traffic light, as the detector UAV detects an increase in traffic, the time that its red light remains on will be reduced and the green light will remain on longer in order to allow vehicles to pass.In Figure 23, we can see on the left the possible modes of the traffic light and on the right all the possible modes of the detector UAV. Looking back to Figure 23, we can see the two main modes of operation of both elements and, separated by a dotted line, the submodes of each of them. Likewise, we can see that there are horizontal lines that join each of these modes and submodes. If submodes are joined by a horizontal line, this mean that they are associated. When the detector UAV is in that mode, it will indicate to the traffic light that it must change to the associated mode. For example, if we imagine that the UAV is in “Normal-Low” mode, the traffic light will be in “Normal-Low” mode. The UAV detects the need to make a mode change and switches to “Normal-High” mode because there begins to be many vehicles on the road; it will switch to “Normal-Stop” mode and inform the traffic light that it should also switch to “Normal-Stop” mode. In the same way, if it is detected that traffic has decreased and conditions imply a change from “Normal-High” to “Normal-Low”, the UAV will change to the latter mode and will once again inform the traffic light of the need for the change from “Normal-High” to “Normal-Low”.So, we can affirm that, thanks to these associated modes between both elements, it will be possible to know, due to the supervision messages sent by the detector UAVs, the state of the traffic light since, by knowing the UAV’s mode, we know the associated state of this second element that regulates traffic.
5. Prototype Insights Evaluation
5.1. Uav and VLC Integration Analysis
- Adaptability to Urban Environments: a VLC’s non-directional nature, combined with UAV mobility, allows for flexibility in navigating complex urban landscapes, improving the system’s adaptability to diverse city environments.
- Reduced Infrastructure Dependency: this integration reduces reliance on traditional ground-based infrastructure for traffic monitoring, potentially lowering costs and improving system scalability.
- Enhanced Communication Resilience: a VLC’s use of the visible light spectrum provides an alternative communication framework that can be resilient to electromagnetic interference, offering a robust solution for communication in congested urban settings.
- Quick Deployment and Maneuverability: UAVs offer rapid deployment and maneuverability, allowing for swift adaptation to changing traffic patterns and emergencies, making the system highly responsive.
- Environmental Sustainability: these technologies support smart city initiatives, contributing to a more sustainable environment through improved traffic flow and reduced fuel consumption.
5.2. Messaging System Analysis
- Adaptability: messages are adapted to diverse content needs. They can accommodate short, concise messages and longer, detailed communications, providing flexibility for various contexts.
- Efficient Communication: variable-length messages enable efficient communication by tailoring the length of the information conveyed. This provides savings in bandwidth and resource savings that facilitate exchange.
- Enhanced Clarity: the flexibility in message length allows for clearer communication. Short messages are straightforward to grasp, while longer messages can provide in-depth explanations and details, enhancing overall clarity.
- Customization: variable-length messages permit customization based on the audience, platform, or communication channel. This adaptability ensures that messages align with the preferences and expectations of the intended recipients.
- Optimized Attention: short messages are often more attention-grabbing and suitable for quick consumption, effectively capturing immediate interest. Longer messages, conversely, cater to audiences seeking in-depth information, optimizing attention for different user preferences.
- Versatility: variable-length messages offer versatility in communication strategies. Whether aiming for brevity in certain situations or depth in others, this adaptability supports diverse messaging goals and communication styles.
- Balanced Information Delivery: longer messages allow for a more comprehensive topic exploration, ensuring the information is balanced and well-rounded. Variable length facilitates striking the right balance in delivering the intended message.
5.3. Challenges and Future Trends
- VLC Technology Challenges: VLC technology introduces a notable challenge, as VLC lacks the directional characteristics of a laser, relying on LED lights for information transmission. This raises potential interference from various urban light sources, such as streetlights and advertising panels. Future research will investigate the impact of light pollution on the communication protocol, determining the system’s efficiency under different lighting conditions.
- Adverse Weather Conditions: a critical challenge arises in assessing the system’s functionality under adverse weather conditions, such as rain or intense fog. The quality of the images captured by UAVs may be compromised, affecting vehicle detection accuracy. Future research will explore potential limitations and adaptations required for the system to operate effectively in varying weather scenarios.
- Image Processing Algorithm Optimization: the YOLO algorithm has been proposed for image processing in our prototype; however, alternative algorithms like SSD, Faster R-CNN, RetinaNet, or MobileNet-SSD present viable options. Future investigations will delve into a comparative analysis of these algorithms, aiming to optimize the on-board image processing capabilities of UAVs, thereby enhancing the efficiency of the traffic management system.
- Joint Sensing and Communication: a compelling avenue for future exploration involves the integration of joint sensing and communication, leveraging signals from existing or future communication systems for sensing purposes. This interdisciplinary approach opens up possibilities for our proposed system to seamlessly integrate with UAV onboard communication technologies, presenting an intriguing challenge and area for further research.
- UAV Components Challenges: Processing Power vs. Flight Durability for battery consumption supposes a commitment to refining and optimizing this delicate balance without isolating specific UAV components. This encapsulates a dedication to advancing the overall system’s efficiency, emphasizing the integration and synergy of various elements rather than a detailed analysis of individual UAV components. This focus on the system’s holistic functionality lays the groundwork for future research endeavors to enhance the integrated system’s overall performance and endurance.
6. Conclusions
Author Contributions
Funding
Data Availability Statement
Conflicts of Interest
References
- Tarazona Lizarraga, C. Análisis de las Necesidades de una Smart City en el Marco de un Desarrollo Sostenible. Master’s Thesis, Universitat Oberta de Catalunya, Barcelona, Spain, 2020. [Google Scholar]
- Sao, A.; Gupta, J. Sustainability Indicators and Ten Smart Cities Review. In Proceedings of the 2023 IEEE International Conference on Contemporary Computing and Communications (InC4), Bangalore, India, 21–22 April 2023; Volume 1, pp. 1–6. [Google Scholar] [CrossRef]
- Kasat, K.; Shaikh, N.; Rayabharapu, V.K.; Nayak, M.; Sayyad Liyakat, K.K. Implementation and Recognition of Waste Management System with Mobility Solution in Smart Cities using Internet of Things. In Proceedings of the 2023 Second International Conference on Augmented Intelligence and Sustainable Systems (ICAISS), Trichy, India, 23–25 August 2023; pp. 1661–1665. [Google Scholar] [CrossRef]
- Puyol, J.L.M.; Baeza, V.M. Bicycle Sharing System Using an IoT Network. In Proceedings of the 2021 Global Congress on Electrical Engineering (GC-ElecEng), Valencia, Spain, 10–12 December 2021; pp. 131–135. [Google Scholar] [CrossRef]
- Skabardonis, A. Chapter 11—Traffic management strategies for urban networks: Smart city mobility technologies. In Transportation, Land Use, and Environmental Planning; Deakin, E., Ed.; Elsevier: Amsterdam, The Netherlands, 2020; pp. 207–216. [Google Scholar] [CrossRef]
- Bai, Y.; Zhao, H.; Zhang, X.; Chang, Z.; Jäntti, R.; Yang, K. Towards Autonomous Multi-UAV Wireless Network: A Survey of Reinforcement Learning-Based Approaches. IEEE Commun. Surv. Tutor. 2023, 25, 3038–3067. [Google Scholar] [CrossRef]
- Georlette, V.; Moeyaert, V. Li-Fi and Visible Light Communication for Smart Cities and Industry 4.0: Challenges, research & market status in 2023. In Proceedings of the 2023 23rd International Conference on Transparent Optical Networks (ICTON), Bucharest, Romania, 2–6 July 2023; pp. 1–4. [Google Scholar] [CrossRef]
- Guo, Q.; Li, L.; Ban, X. Urban traffic signal control with connected and automated vehicles: A survey. Transp. Res. Part C Emerg. Technol. 2019, 101, 313–334. [Google Scholar] [CrossRef]
- Yang, Z.; Feng, Y.; Liu, H.X. A cooperative driving framework for urban arterials in mixed traffic conditions. Transp. Res. Part C Emerg. Technol. 2021, 124, 102918. [Google Scholar] [CrossRef]
- Bharadwaj, S.; Carr, S.; Neogi, N.; Poonawala, H.; Chueca, A.B.; Topcu, U. Traffic Management for Urban Air Mobility. In Proceedings of the NFM 2019: 11th Annual NASA Formal Methods Symposium, Houston, TX, USA, 7–9 May 2019; Springer: Cham, Switzerland, 2019; pp. 71–87. [Google Scholar] [CrossRef]
- Zhu, Z.; Yang, Y.; Guo, C.; Chen, M.; Cui, S.; Poor, H.V. Power Efficient Deployment of VLC-enabled UAVs. In Proceedings of the 2020 IEEE 31st Annual International Symposium on Personal, Indoor and Mobile Radio Communications, London, UK, 31 August–3 September 2020; pp. 1–6. [Google Scholar] [CrossRef]
- Baeza, V.M.; Sánchez-Fernández, M.; Armada, A.G.; Royo, A. Testbed for a LiFi system integrated in streetlights. In Proceedings of the 2015 European Conference on Networks and Communications (EuCNC), Paris, France, 29 June–2 July 2015; pp. 517–521. [Google Scholar] [CrossRef]
- Mohamed, N.; Al-Jaroodi, J.; Jawhar, I.; Idries, A.; Mohammed, F. Unmanned aerial vehicles applications in future smart cities. Technol. Forecast. Soc. Chang. 2020, 153, 119293. [Google Scholar] [CrossRef]
- Mahrez, Z.; Sabir, E.; Badidi, E.; Saad, W.; Sadik, M. Smart Urban Mobility: When Mobility Systems Meet Smart Data. IEEE Trans. Intell. Transp. Syst. 2022, 23, 6222–6239. [Google Scholar] [CrossRef]
- Shrestha, R.; Oh, I.; Kim, S. A Survey on Operation Concept, Advancements, and Challenging Issues of Urban Air Traffic Management. Front. Future Transp. 2021, 2. [Google Scholar] [CrossRef]
- Yilmaz, B.Y.; Denizer, S.N. Multi UAV Based Traffic Control in Smart Cities. In Proceedings of the 2020 11th International Conference on Computing, Communication and Networking Technologies (ICCCNT), Kharagpur, India, 1–3 July 2020; pp. 1–7. [Google Scholar] [CrossRef]
- Kim, J.A.; Sung, J.Y.; Park, S.H. Comparison of Faster-RCNN, YOLO, and SSD for Real-Time Vehicle Type Recognition. In Proceedings of the 2020 IEEE International Conference on Consumer Electronics—Asia (ICCE-Asia), Seoul, Republic of Korea, 1–3 November 2020; pp. 1–4. [Google Scholar] [CrossRef]
- Li, M.; Zhang, Z.; Lei, L.; Wang, X.; Guo, X. Agricultural Greenhouses Detection in High-Resolution Satellite Images Based on Convolutional Neural Networks: Comparison of Faster R-CNN, YOLO v3 and SSD. Sensors 2020, 20, 4938. [Google Scholar] [CrossRef] [PubMed]
- Tan, L.; Huangfu, T.; Wu, L. Comparison of RetinaNet, SSD, and YOLO v3 for real-time pill identification. BMC Med. Inform. Decis. Mak. 2021, 21, 324. [Google Scholar] [CrossRef] [PubMed]
- Lei, Y.; Tong, X.; Qiu, C.; Sun, Y.; Tang, J.; Guo, C.; Li, H. Onboard Data Management Approach Based on a Discrete Grid System for Multi-UAV Cooperative Image Localization. IEEE Trans. Geosci. Remote Sens. 2023, 61, 4706417. [Google Scholar] [CrossRef]
- Garau Guzmán, J. Gestión del tráfico mediante UAV y VLC. Master’s Thesis, Universitat Oberta de Catalunya, Barcelona, Spain, 2020. [Google Scholar]
- Sharma, R.; Kaushik, B.; Gondhi, N. Character Recognition using Machine Learning and Deep Learning—A Survey. In Proceedings of the 2020 International Conference on Emerging Smart Computing and Informatics (ESCI), Pune, India, 12–14 March 2020; pp. 341–345. [Google Scholar] [CrossRef]
- Dol, M.; Geetha, A. A Learning Transition from Machine Learning to Deep Learning: A Survey. In Proceedings of the 2021 International Conference on Emerging Techniques in Computational Intelligence (ICETCI), Hyderabad, India, 25–27 August 2021; pp. 89–94. [Google Scholar] [CrossRef]
- Redmon, J.; Divvala, S.; Girshick, R.; Farhadi, A. You Only Look Once: Unified, Real-Time Object Detection. In Proceedings of the 2016 IEEE Conference on Computer Vision and Pattern Recognition (CVPR), Las Vegas, NV, USA, 27–30 June 2016; pp. 779–788. [Google Scholar] [CrossRef]
- Baeza, V.M.; Armada, A.G. Noncoherent Massive MIMO. In Wiley 5G Ref: The Essential 5G Reference Online; Wiley: Hoboken, NJ, USA, 2019; pp. 1–28. [Google Scholar] [CrossRef]
- Baeza, V.; Ha, V.; Querol, J.; Chatzinotas, S. Non-coherent massive MIMO integration in satellite communication. In Proceedings of the 39th International Communications Satellite Systems Conference (ICSSC 2022), Stresa, Italy, 18–21 October 2022; Volume 2022, pp. 200–205. [Google Scholar] [CrossRef]


| Model | Average Precision | True Positive | False Positive | Frame per Second (FPR) |
|---|---|---|---|---|
| YOLO v4 | 98.08% | 273 | 25 | 82.1 |
| R_CNN | 93.2% | 262 | 17 | 36.32 |
| SSD | 92.7% | 257 | 34 | 105.14 |
| Frame Type | Bits of Code | Origin–Destination |
|---|---|---|
| Supervision | 00 | UAV Detector–UAV Supervisor UAV Supervisor– Base station |
| Mode change | 01 | UAV Detector–Traffic light |
| Configuration | 10 | Base station–UAV Supervisor UAV Supervisor–UAV Detector |
| ACK/NACK | 11 | UAV Detector–UAV Supervisor UAV Supervisor–Base station |
Disclaimer/Publisher’s Note: The statements, opinions and data contained in all publications are solely those of the individual author(s) and contributor(s) and not of MDPI and/or the editor(s). MDPI and/or the editor(s) disclaim responsibility for any injury to people or property resulting from any ideas, methods, instructions or products referred to in the content. |
© 2023 by the authors. Licensee MDPI, Basel, Switzerland. This article is an open access article distributed under the terms and conditions of the Creative Commons Attribution (CC BY) license (https://creativecommons.org/licenses/by/4.0/).
Share and Cite
Garau Guzman, J.; Baeza, V.M. Enhancing Urban Mobility through Traffic Management with UAVs and VLC Technologies. Drones 2024, 8, 7. https://doi.org/10.3390/drones8010007
Garau Guzman J, Baeza VM. Enhancing Urban Mobility through Traffic Management with UAVs and VLC Technologies. Drones. 2024; 8(1):7. https://doi.org/10.3390/drones8010007
Chicago/Turabian StyleGarau Guzman, Javier, and Victor Monzon Baeza. 2024. "Enhancing Urban Mobility through Traffic Management with UAVs and VLC Technologies" Drones 8, no. 1: 7. https://doi.org/10.3390/drones8010007
APA StyleGarau Guzman, J., & Baeza, V. M. (2024). Enhancing Urban Mobility through Traffic Management with UAVs and VLC Technologies. Drones, 8(1), 7. https://doi.org/10.3390/drones8010007