Article

Medium-Sized Lake Water Quality Parameters Retrieval Using Multispectral UAV Image and Machine Learning Algorithms: A Case Study of the Yuandang Lake, China

1
Department of Civil Engineering, Xi’an Jiaotong-Liverpool University, Suzhou 215000, China
2
Wujiang District Water Bureau, Suzhou 215215, China
3
Department of Urban Design, Xi’an Jiaotong-Liverpool University, Suzhou 215000, China
*
Author to whom correspondence should be addressed.
Drones 2023, 7(4), 244; https://doi.org/10.3390/drones7040244
Submission received: 7 March 2023 / Revised: 24 March 2023 / Accepted: 29 March 2023 / Published: 1 April 2023

Abstract

:
Water quality monitoring of medium-sized inland water is important for water environment protection given the large number of small-to-medium size water bodies in China. A case study was conducted on Yuandang Lake in the Yangtze Delta region, with a surface area of 13 km2. This study proposed utilising a multispectral uncrewed aerial vehicle (UAV) to collect large-scale data and retrieve multiple water quality parameters using machine learning algorithms. An alternate processing method is proposed to process large and repetitive lake surface images for mapping the water quality data to the image. Machine learning regression methods (Random Forest, Gradient Boosting, Backpropagation Neural Network, and Convolutional Neural Network) were used to construct separate water quality inversion models for ten water parameters. The results showed that several water quality parameters (CODMn, temperature, pH, DO, and NC) can be retrieved with reasonable accuracy (R2 = 0.77, 0.75, 0.73, 0.67, and 0.64, respectively), although others (NH3-N, BGA, TP, Turbidity, and Chl-a) have a determination coefficient (R2) less than 0.6. This work demonstrated the tremendous potential of employing multispectral data in conjunction with machine learning algorithms to retrieve multiple water quality parameters for monitoring medium-sized bodies of water.

1. Introduction

Inland waters, such as lakes, reservoirs, and rivers, are important supplies of freshwater for humans. Since human populations are typically located near water bodies, the water bodies are prone to pollution from intensive human activities and environmental changes. Pollutants from agricultural activities and industrial waste cause an overabundance of nutrients in the water, resulting in eutrophication. Eutrophication leads to excessive growth of simple plants and causes algae blooms, which ruin the aquatic ecological system by consuming a considerable amount of dissolved oxygen and resulting in the death of aquatic creatures and plants. Eutrophication has and continues to represent a severe threat to sources of water supply, fisheries, and recreational water bodies because of the pervasive extent of water quality degradation brought on by nutrient enrichment. Thus, water quality monitoring has become an important strategy for water environment protection to reduce eutrophication. Water quality is monitored according to the Environmental Quality Standards for Surface Water [1] in China by assessing the chemical constituents and conditions of the water bodies at the required temporal and spatial gaps. The water quality parameters and concentrations stated in the standard are the most often employed evaluation measurements to characterise the water quality of inland bodies.
At present, water quality monitoring mainly relies on either in-field sampling and laboratory analysis or direct in situ monitoring using instruments installed onsite. The cost of direct monitoring, however, was greatly impacted by the required temporal or spatial scope of the water quality data. Since the introduction of remote sensing technology, remote sensing has been employed as a supplement to conventional approaches due to its convenient acquisition, long-term dynamic monitoring, and affordable characteristic. Thiemann used satellite spectral data to invert the chlorophyll-a concentration of lakes in Mecklenburg, Germany, and combined it with the Carlson model to determine the degree of eutrophication in the area [2]. Chlorophyll-a was the water parameter that researchers most frequently studied since its optically active characteristic eases the use of satellite data for monitoring, and it has a direct relationship with the occurrence of algae bloom [3,4,5,6,7,8,9,10,11,12]. Other than chlorophyll-a, satellite data are also widely used for monitoring other optically visible and non-visible water parameters such as temperature [8,13], Turbidity [5,7,13,14], total phosphorous (TP) [15,16], ammonia nitrogen (NH3-N) [10,15,17], electrical conductivity (EC) [13,14], pH [9,13] and dissolved oxygen (DO) [10,13,14] which are important indicators for inland water quality. The water retrieval models used in the studies are eXtreme Gradient Boosting (XGBoost) [10], Support Vector Regression (SVR) [10,14,15], Random Forest (RF) [10,15], Multiple Linear Regression (MLR) [14], Extreme Learning Machine Regression (ELR) [14], Gradient Boosting Machine (GBM) [15] Convolutional Neural Networks (CNN) [11,12], and Artificial Neural Network (ANN) [10,15]. According to this research, satellite remote sensing technology is relatively mature in the application of water quality monitoring and can yield decent results. However, its applicability in remote sensing of water environments of small- and medium-sized lakes, reservoirs, and rivers is limited due to the spatial resolution, temporal resolution, and occlusions caused by atmospheric clouds [18,19]. As a result, new strategies must be developed to monitor the water quality characteristics in small- to medium-sized water bodies.
UAV spectral remote sensing technology is proving to be of great practical use by obtaining broad-range and high-frequency environmental data at a more economical cost to support precise water management and pollution control activities [20,21]. Additionally, UAVs are capable of performing high-resolution and autonomous ground data collection. For instance, Su and Chou employ regression models to construct highly related features and multispectral bands between water quality from UAV imagery with high spatial resolution [22]. Flynn and Chapra were able to approximate the coverage of the algal water surface by using UAVs with high-frequency data collection to understand the complex physical transportation and biological features of algae [23]. Since then, multispectral UAV remote sensing data has been used to retrieve various water parameters, including Chl-a [24,25,26,27,28], Turbidity [24,25,29], TP [25,26,27], TN [25,26,27], NH3-N [25], and permanganate index (CODMn) [26]. The algorithms used to retrieve the water quality parameters are RF [25,26,27,28], XGBoost [25,26,27], SVR [28], Backpropagation Neural Network (BP) [26], CNN [28], ELR [28], Deep Neural Network (DNN) [25], ANN [27], and matching pixel by pixel (MPP) algorithm [24,29]. However, for other water parameters such as temperature, EC, DO, and pH, some research indicate that UAV is used to collect water samples or measurements directly to obtain the concentration; the retrieval of those parameters using remotely sensed UAV data has not been widely explored [22]. Hence, more investigations are required to study the feasibility of multispectral UAV remote sensing data in retrieving multiple water parameters. Despite the fact that UAVs are capable of monitoring at a variety of geographic scales, including rivers, reservoirs, and lakes, research on UAVs has only focused on small-scale data collecting and water quality monitoring [22,25,26,30,31]. According to the statistic of the number of lakes and surface area provided in China, 90% of the lakes are found with a surface area within 1 to 50 km2 [32]. Despite the high number of small-to-medium scaled lakes, the monitoring method has not been investigated thoroughly for medium-sized water bodies due to extensive and prolonged data collection, as well as distinct data processing techniques. UAV remote sensing data collection is constrained by the flight duration, weather and the data requirement for building high-quality orthomosaic maps [20]. Due to the existing limitations of UAVs, data collection and processing are more challenging for medium-sized lakes. Hence, our research proposed the use of multispectral UAV remote sensing data for medium-sized lake water quality monitoring and investigated the inversion of multiple water parameters using machine learning algorithms for inland water monitoring.
The main innovations and contributions of our research work are as follows: (1) systematic data collection and data processing using multispectral UAV was proposed for effective and efficient monitoring of medium-sized water bodies. (2) using band equations derived from multispectral UAV images to retrieve multiple water parameters, including Chl-a, temperature, pH, DO, EC, blue-green algae (BGA), Turbidity, NH3-N, TP, and CODMn.

2. Materials and Methods

A systematic multispectral UAV remote sensing data collection and processing workflow for medium-sized lake is introduced in this work, and four machine learning models: RF, GB, BP, and CNN, are utilised to retrieve ten water quality parameters. This chapter discussed the data collection and processing for multispectral UAV and in situ water data, as well as the employed machine learning models.

2.1. Study Area

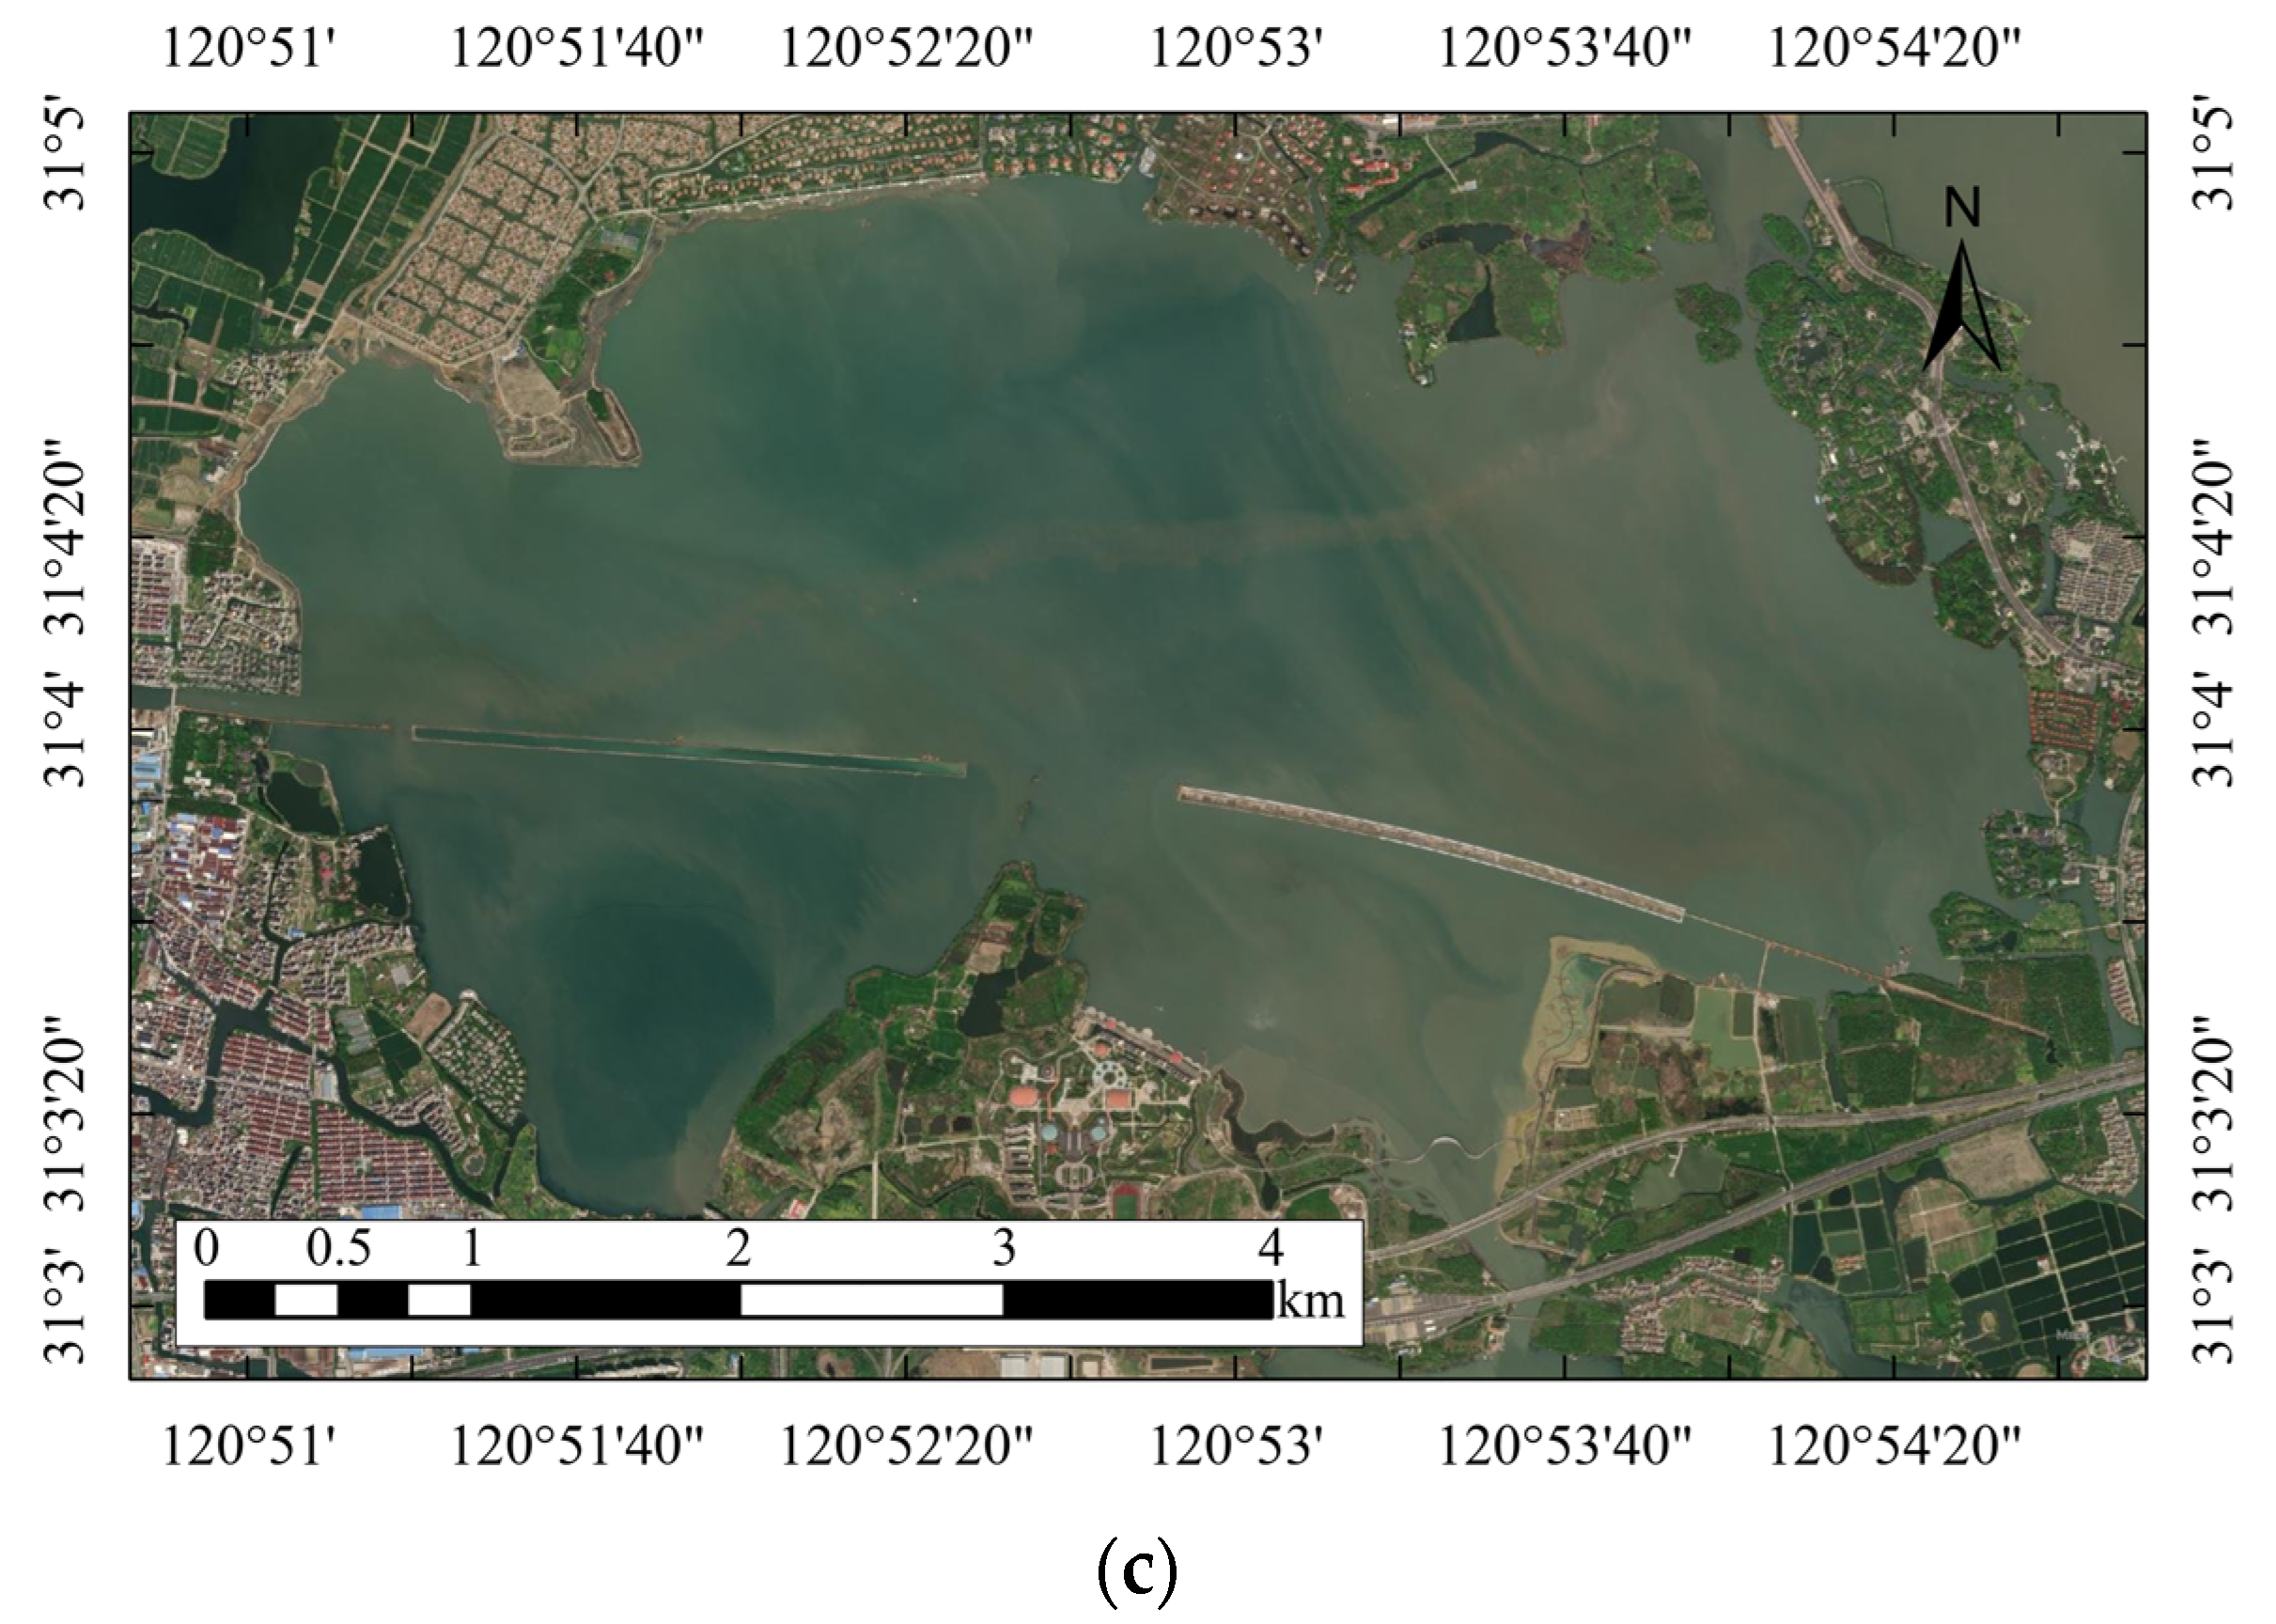
The study area was Yuandang Lake (31.0634° N, 120.8901° E), located in Suzhou, Jiangsu Province, China, and connected to three rivers that flow in and out of the lake. The surface area of the lake is roughly 13 km2, which is a reasonable representation of medium-sized lakes. Based on the satellite images of the lake from 2019 to 2021, it is observed that there were algae blooms occurring throughout the months of August and September. Temperature increment during the summer season caused the occurrence of algae bloom, which will have a major impact on the water ecosystem and generate serious environmental problems. The Yuandang Lake is one of the important lakes in the Yangtze Delta region, which is essential for economic, ecological, and social benefits and is a habitat for many species. In the overall development strategy in the Yangtze Delta region, the water quality of the lake needs to be monitored and improved to support the development of green economy. Thus, it is vital to monitor the water quality of the Yuandang lake, and study is undertaken for the entire region of the lake. Figure 1 depicts the geographic location of the study region.

2.2. Data Collection

Based on the algae bloom period studied using satellite images, data collection was conducted on 5, 8, and 10 August 2022. The collected data of this study consists of around 1 k UAV photos, 4 k water quality data points, and 60 water samples.

2.2.1. UAV Multispectral Image Collection

In this study, DJI P4 Multispectral UAV is used to capture high-resolution multispectral photographs. The drone is capable of collecting blue, green, red, red-edge, near-infrared bands, and RGB images simultaneously using its six 1/2.9-inch CMOS sensors. The image resolution of the multispectral bands and RGB was 1600 × 1300 pixels captured with a 5.74 mm focal lens. The cameras are mounted on a 3-axis gimbal, which provides stabilisation when taking photos. Table 1 lists the central wavelength of each band.
The flight plan was determined using the DJI GS Pro, which can be used to plan a route automatically based on the flight area, flight altitude, front overlap ratio, and side overlap ratio. Due to the large surface area of the lake, the operational altitude of the UAV was set at a maximum altitude of 500 m while both the front and side overlap degree was set at 15% to enable efficient data collection of the entire lake. The resulting ground sampling distance after the setting is around 25.9 cm/pixel. In addition to flight altitude and overlapping ratio, sun glint or water flares are the most influential factor in the UAV water quality inversion. Based on multiple trial flight tests, the acquired photo is more susceptible to sun glint effect when the sun incidence angle is larger than 60°. Thus, in order to eliminate water reflection, all images were taken between 9.00–11.00 and 14.00–17.00 local time, where the sun incidence angle was between 30°–60°. Since large-scale data collection required longer operation time, weather forecasts had to be checked on a regular basis to ensure low precipitation and wind speed throughout the day. Each collected image will have precise coordinates stored in the image metadata, utilising the onboard Real-Time Kinematic (RTK) technology for further processing. DJI also provides extra information such as flight yaw, pitch, and roll in the image metadata to simplify image processing.
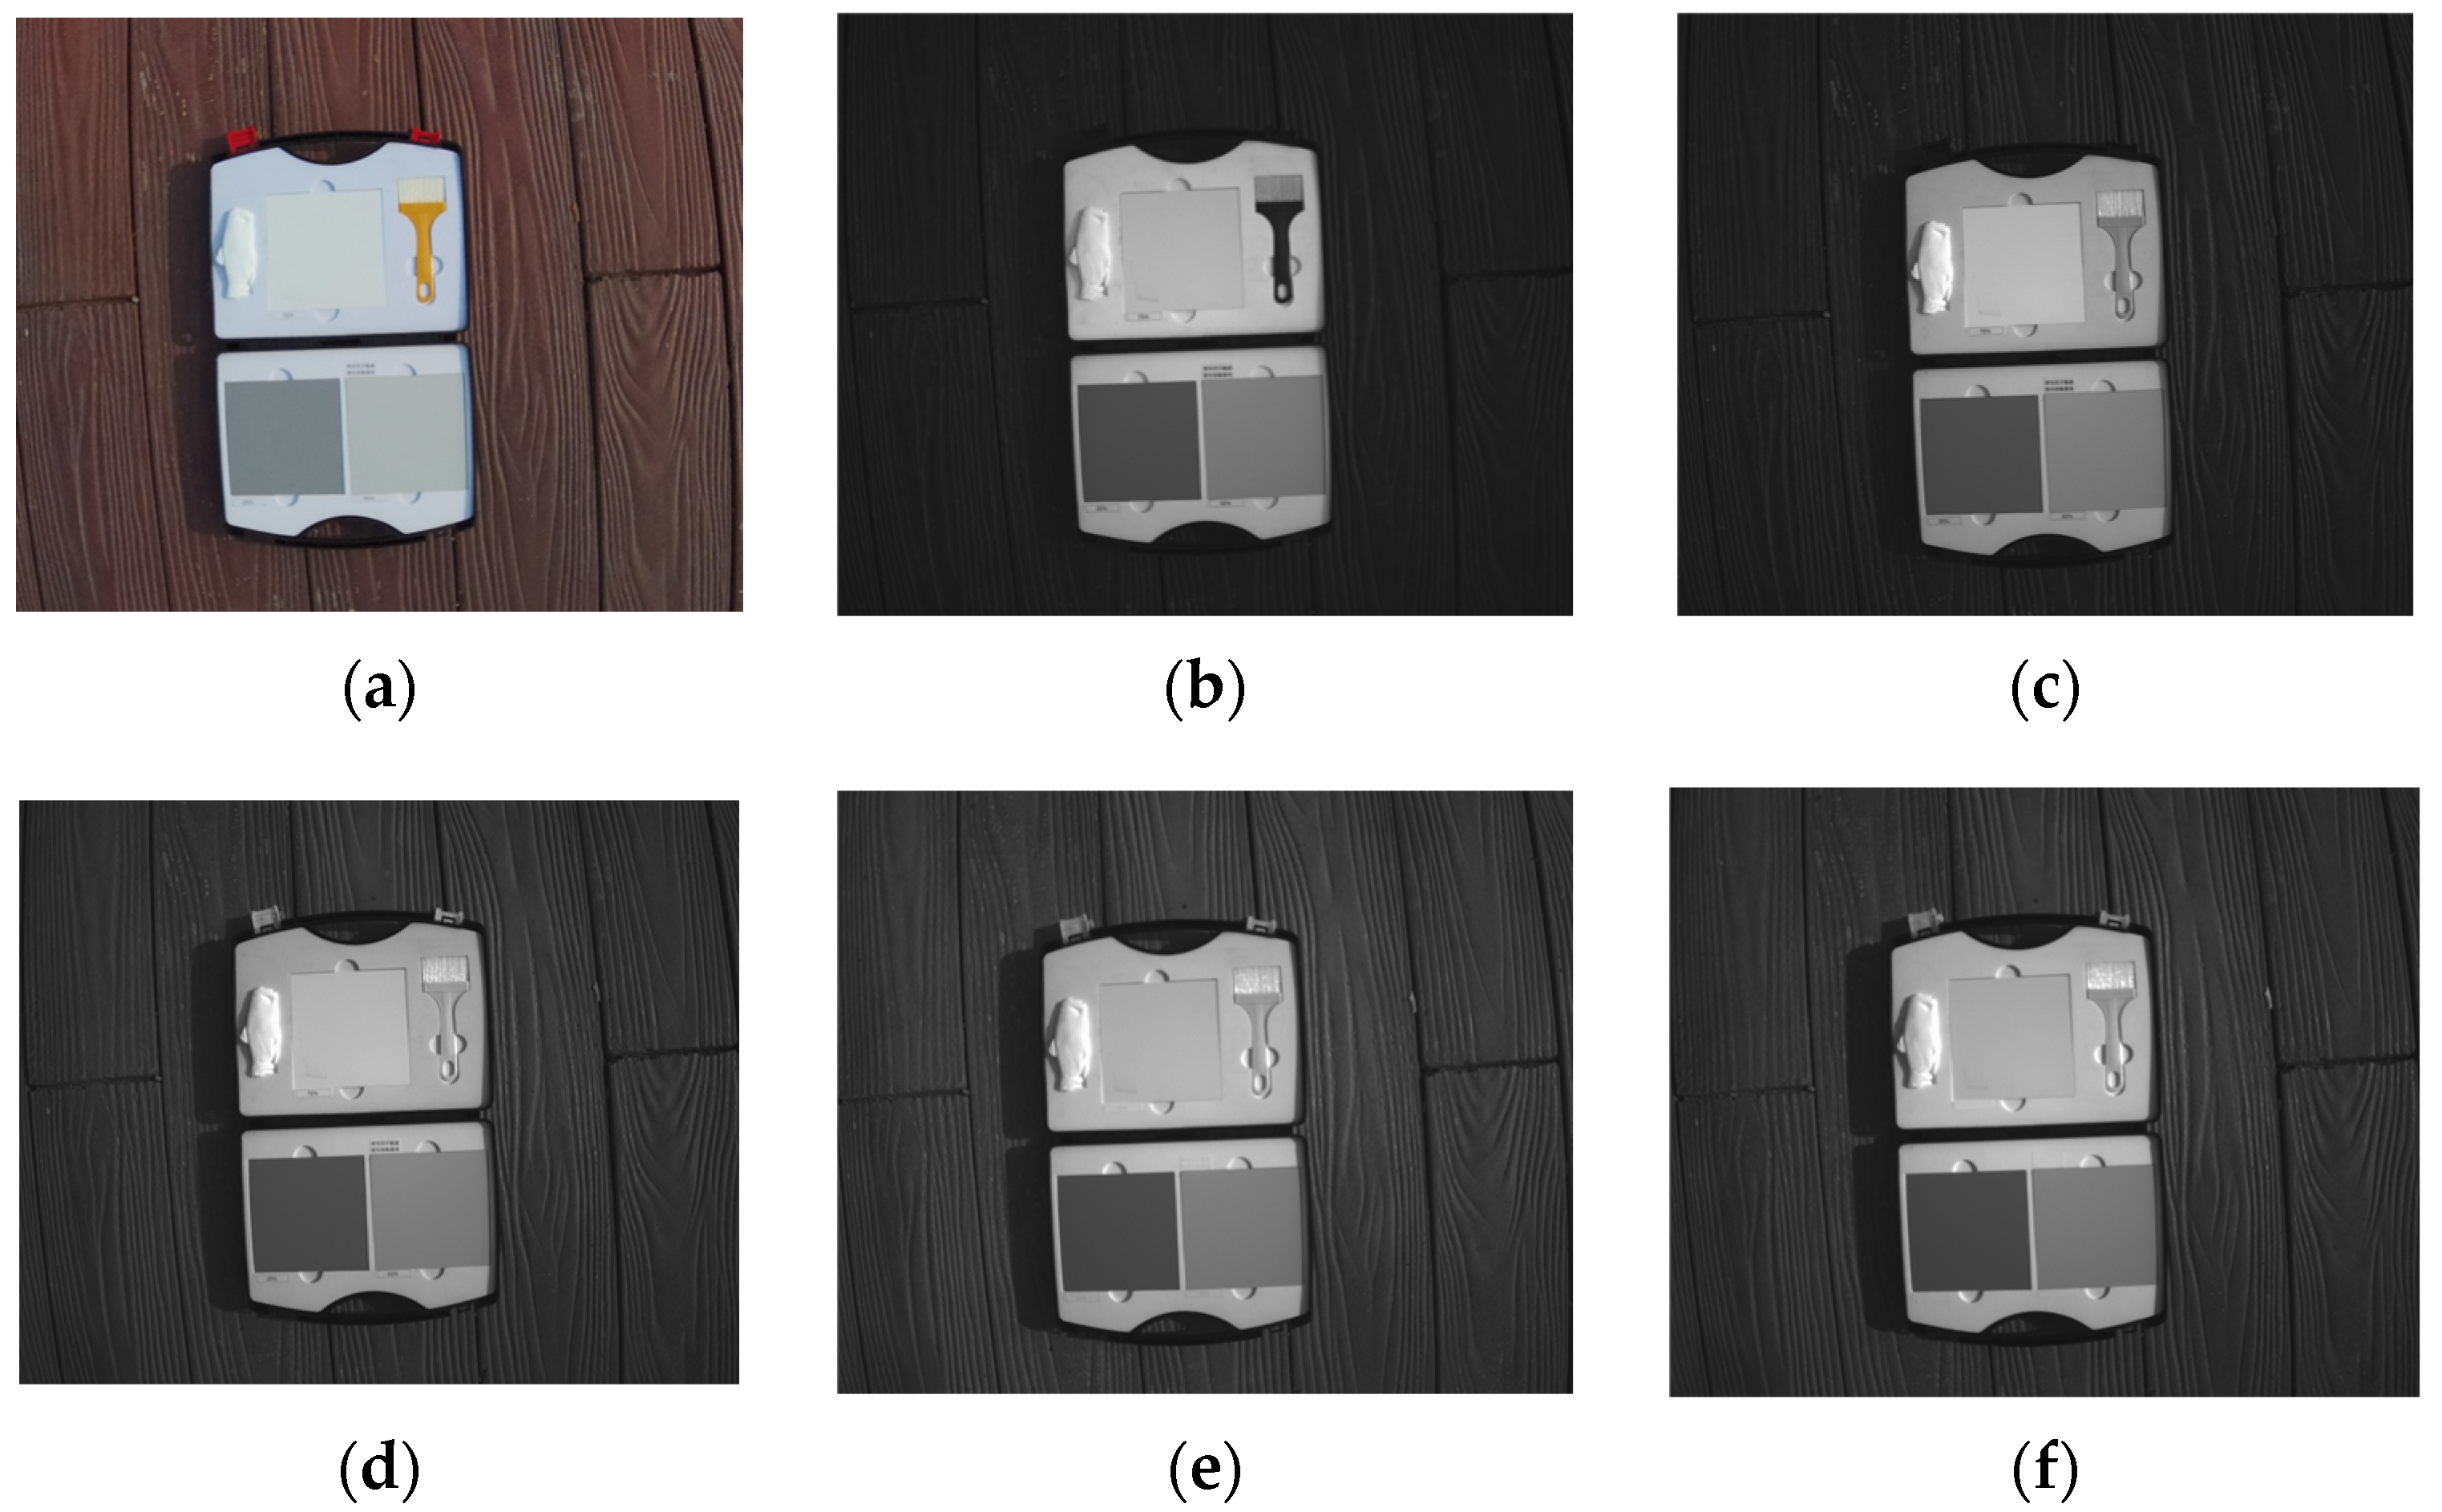
The collected multispectral data are displayed as digital numbers (DN) in the image. A calibration plate is required for radiometric calibration to obtain an accurate reflectance image. Hence, during each data collection, a set of calibration plate photos is also collected, as shown in Figure 2. The calibration plates constitute 25%, 50%, and 75% reflectance surfaces for precise calibration. For every planned path and coverage area, a set of 6 photos will be generated same as in Figure 2.

2.2.2. In Situ Water Data Collection

Data collection of water quality parameters was carried out in two different ways: (1) using a YSI EXO2 Multiparameter Sonde handheld meter and (2) collecting water samples for laboratory testing and analysis. Both methods have been used in water quality monitoring previously [10,14].
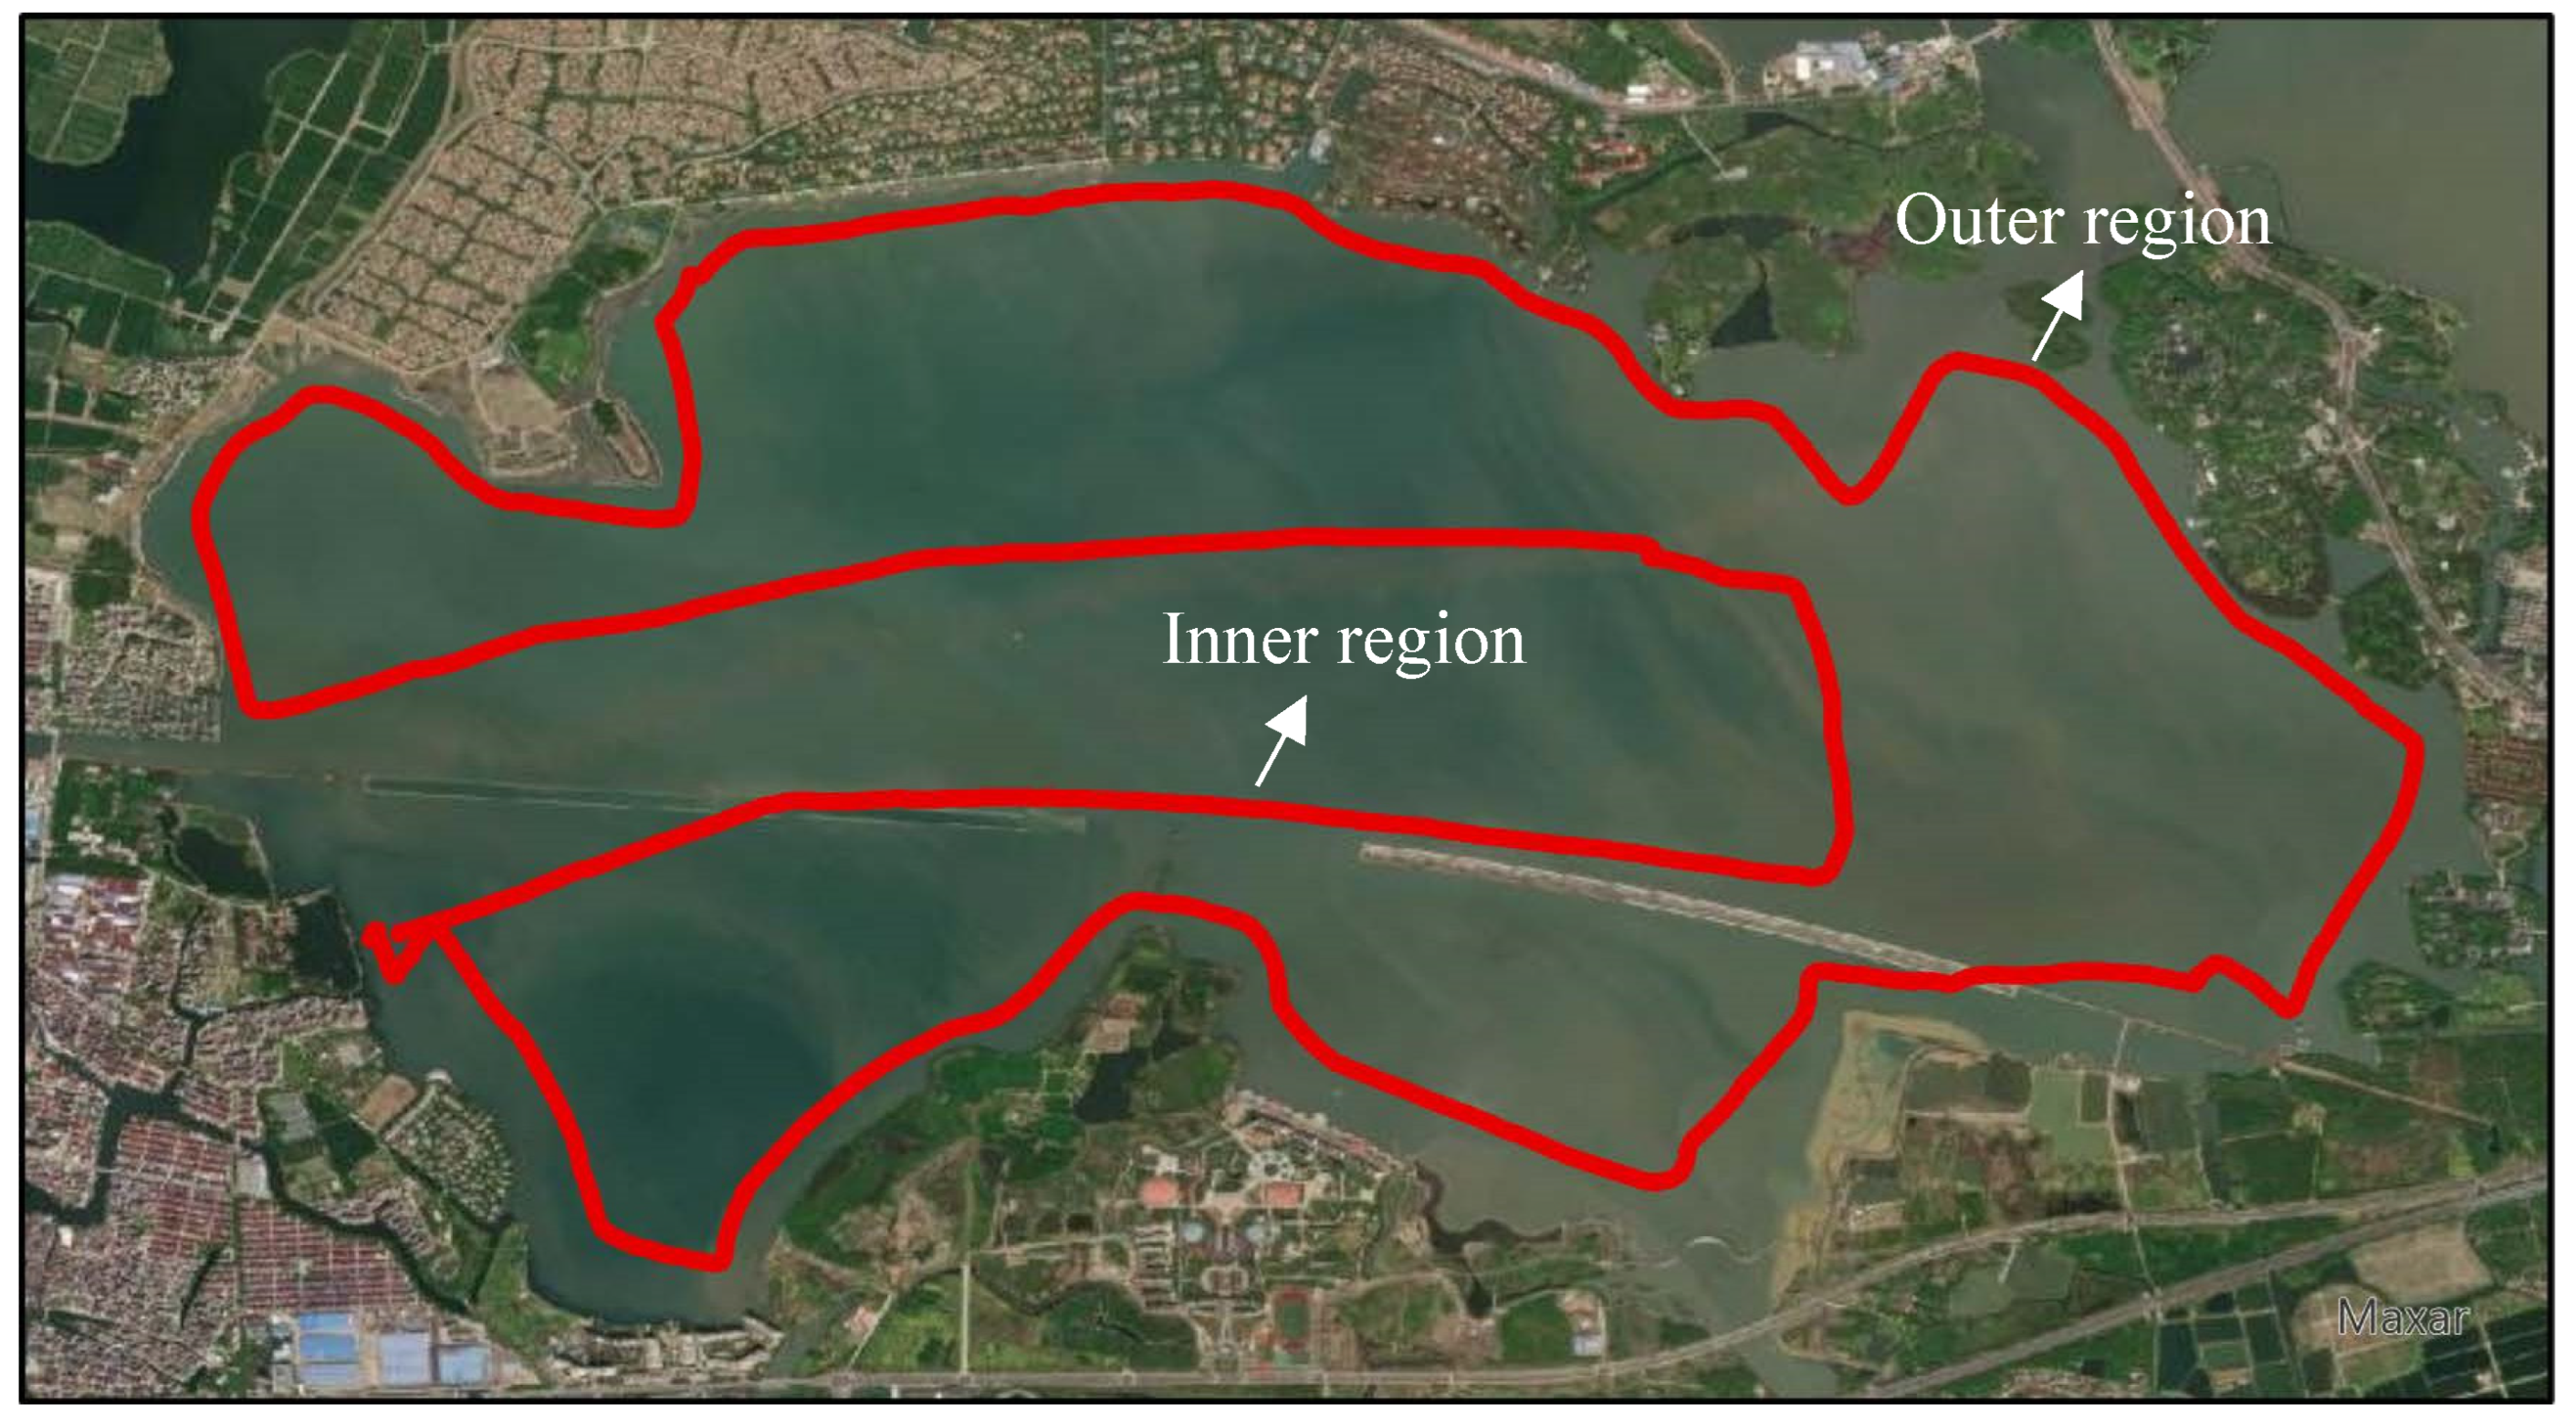
The route for recording water quality parameters is depicted in Figure 3 with inner and outer regions, and approximately 1.5–2 k data points are collected each time continuously for about three hours. The route is planned based on the observation from the satellite image that the harmful algae bloom will first emerge in the outer region of the lake and gradually grow to the inner region. The handheld meter is equipped with sensors for measuring seven parameters: pH, BGA, Chl-a, EC, DO, temperature, and Turbidity values, each of them important for monitoring and evaluating water quality. In addition to that, GPS location of every data point is also recorded.
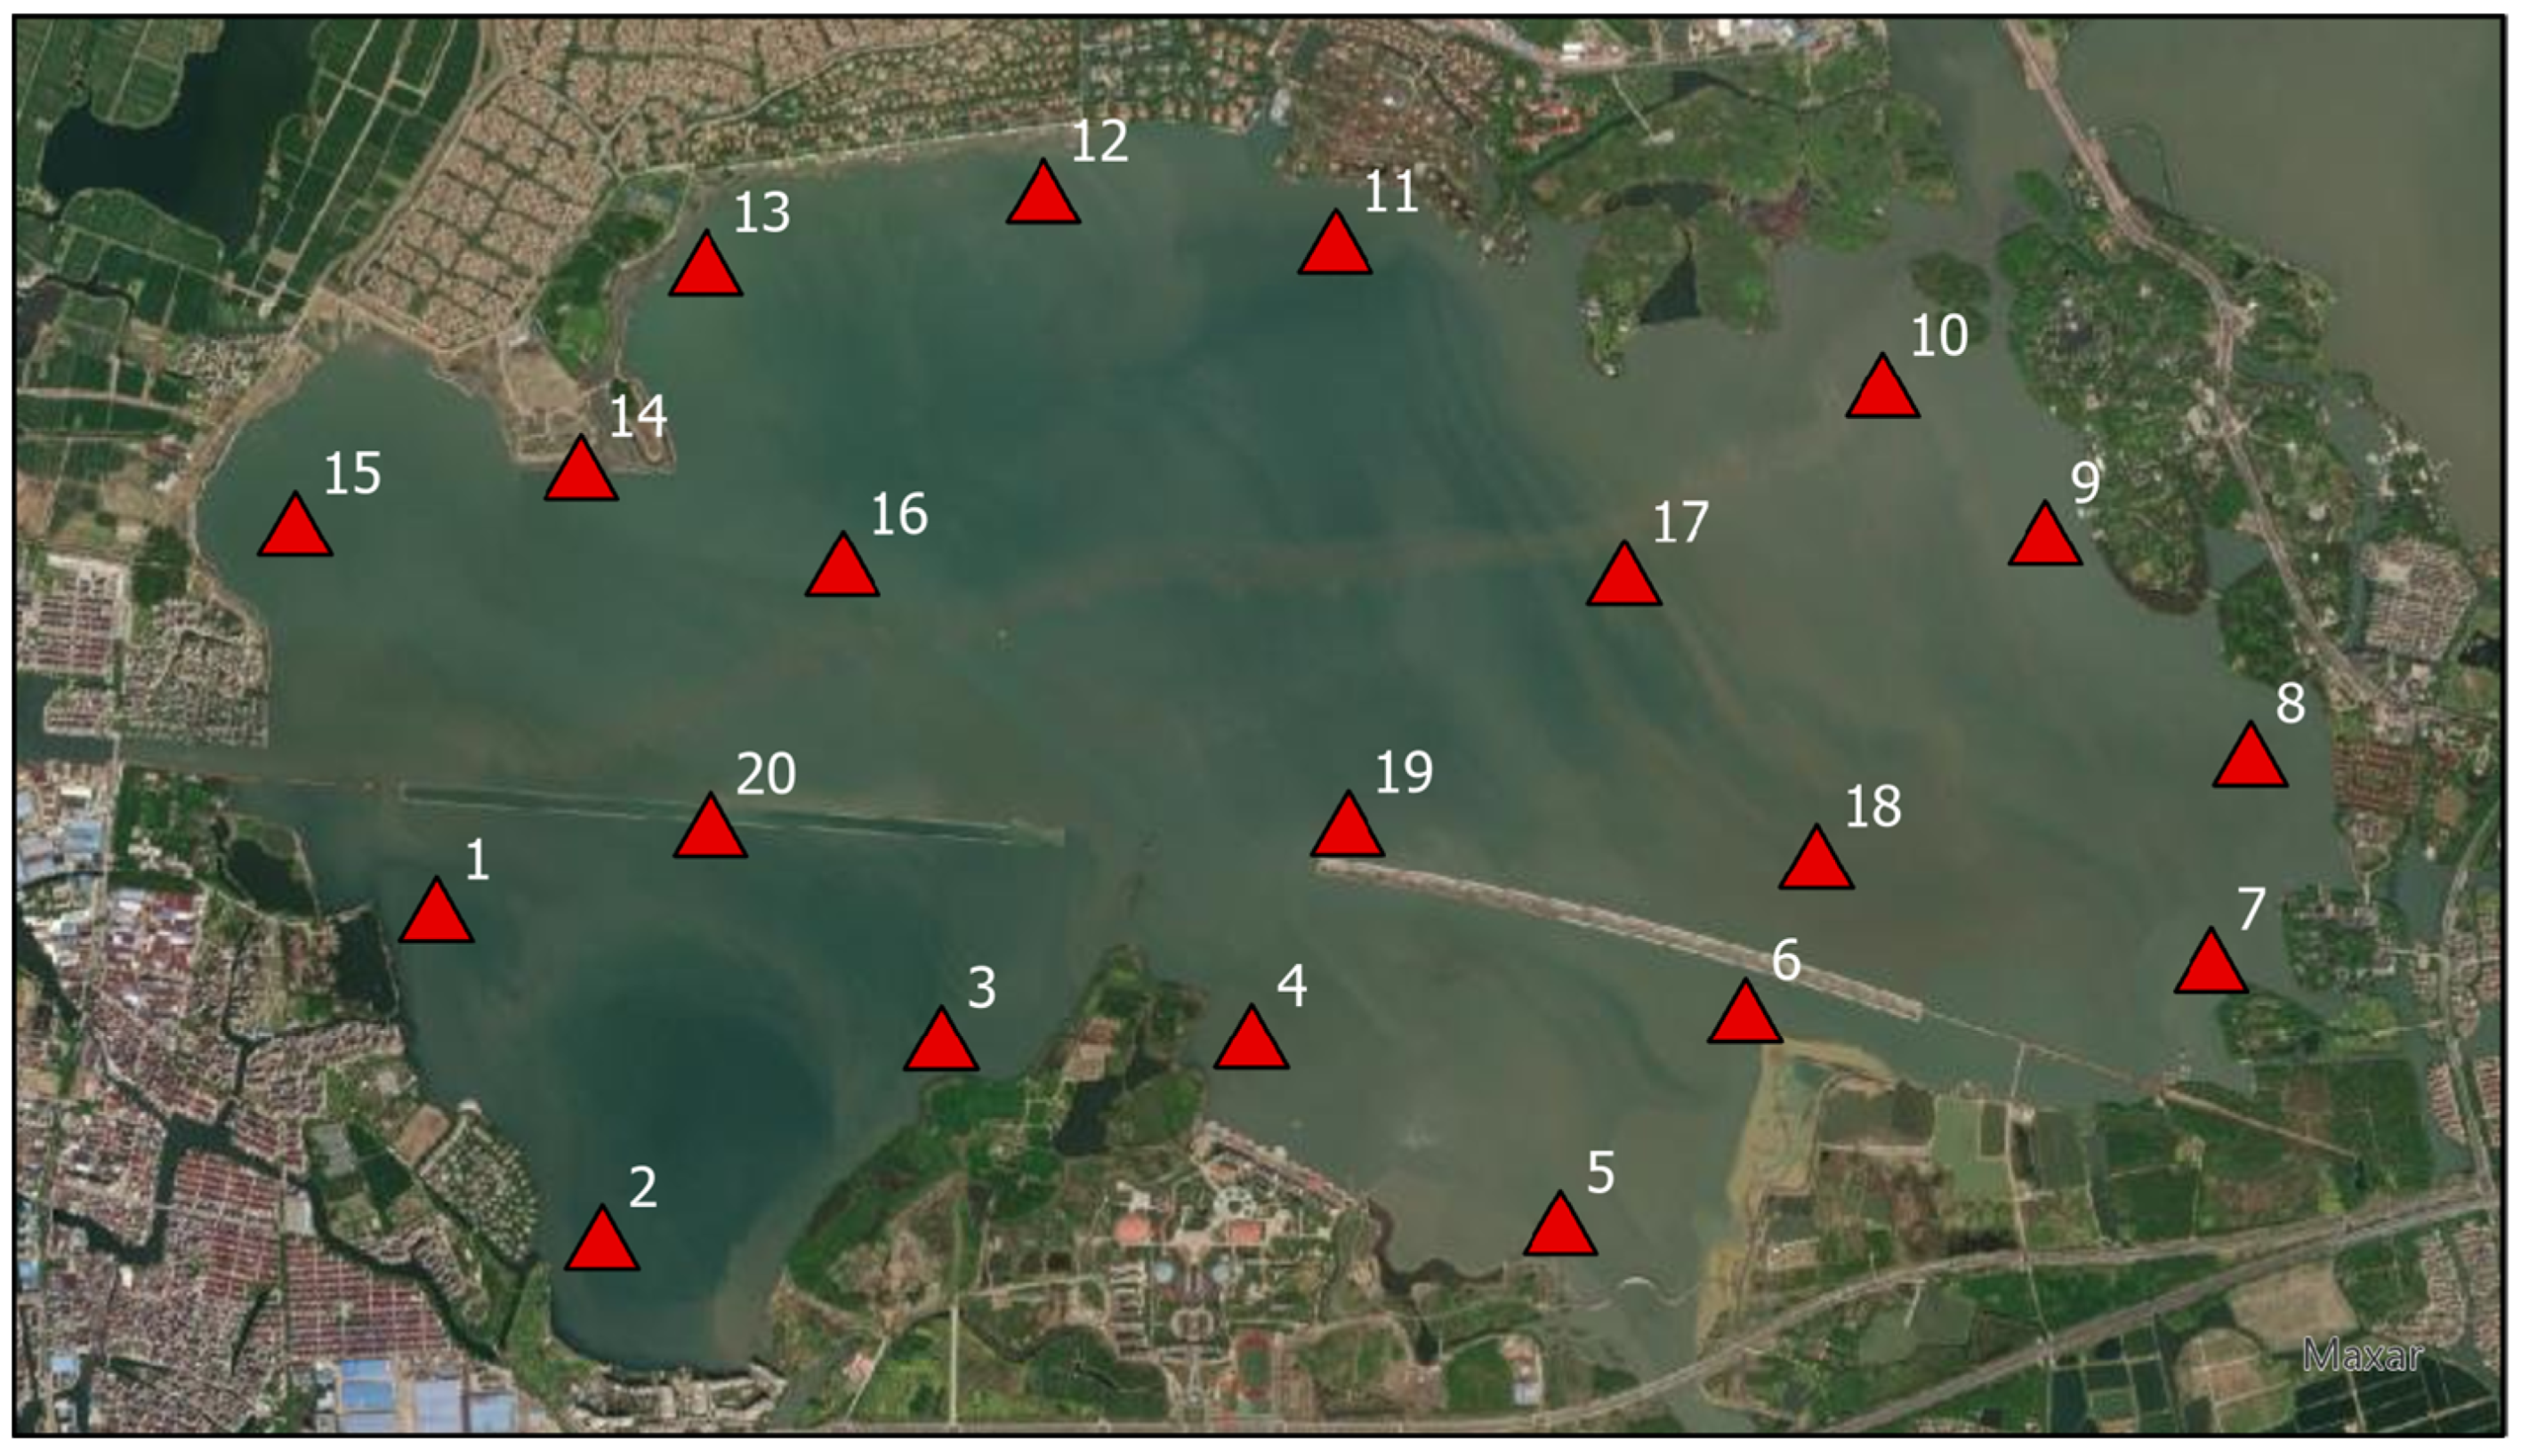
Figure 4 depicts the locations where the water sample was taken; 20 sampling points were evenly distributed across the lake to represent each subregion. The analysed water parameters are NH3-N, TP, and CODMn, which are essential for determining the standards of lake eutrophication and popular indicators for organic pollution. Two 2.5-L bottles of water are collected at a depth of 50 cm at each sampling location for spectrophotometric analysis to determine the exact water quality concentration.

2.3. Data Processing

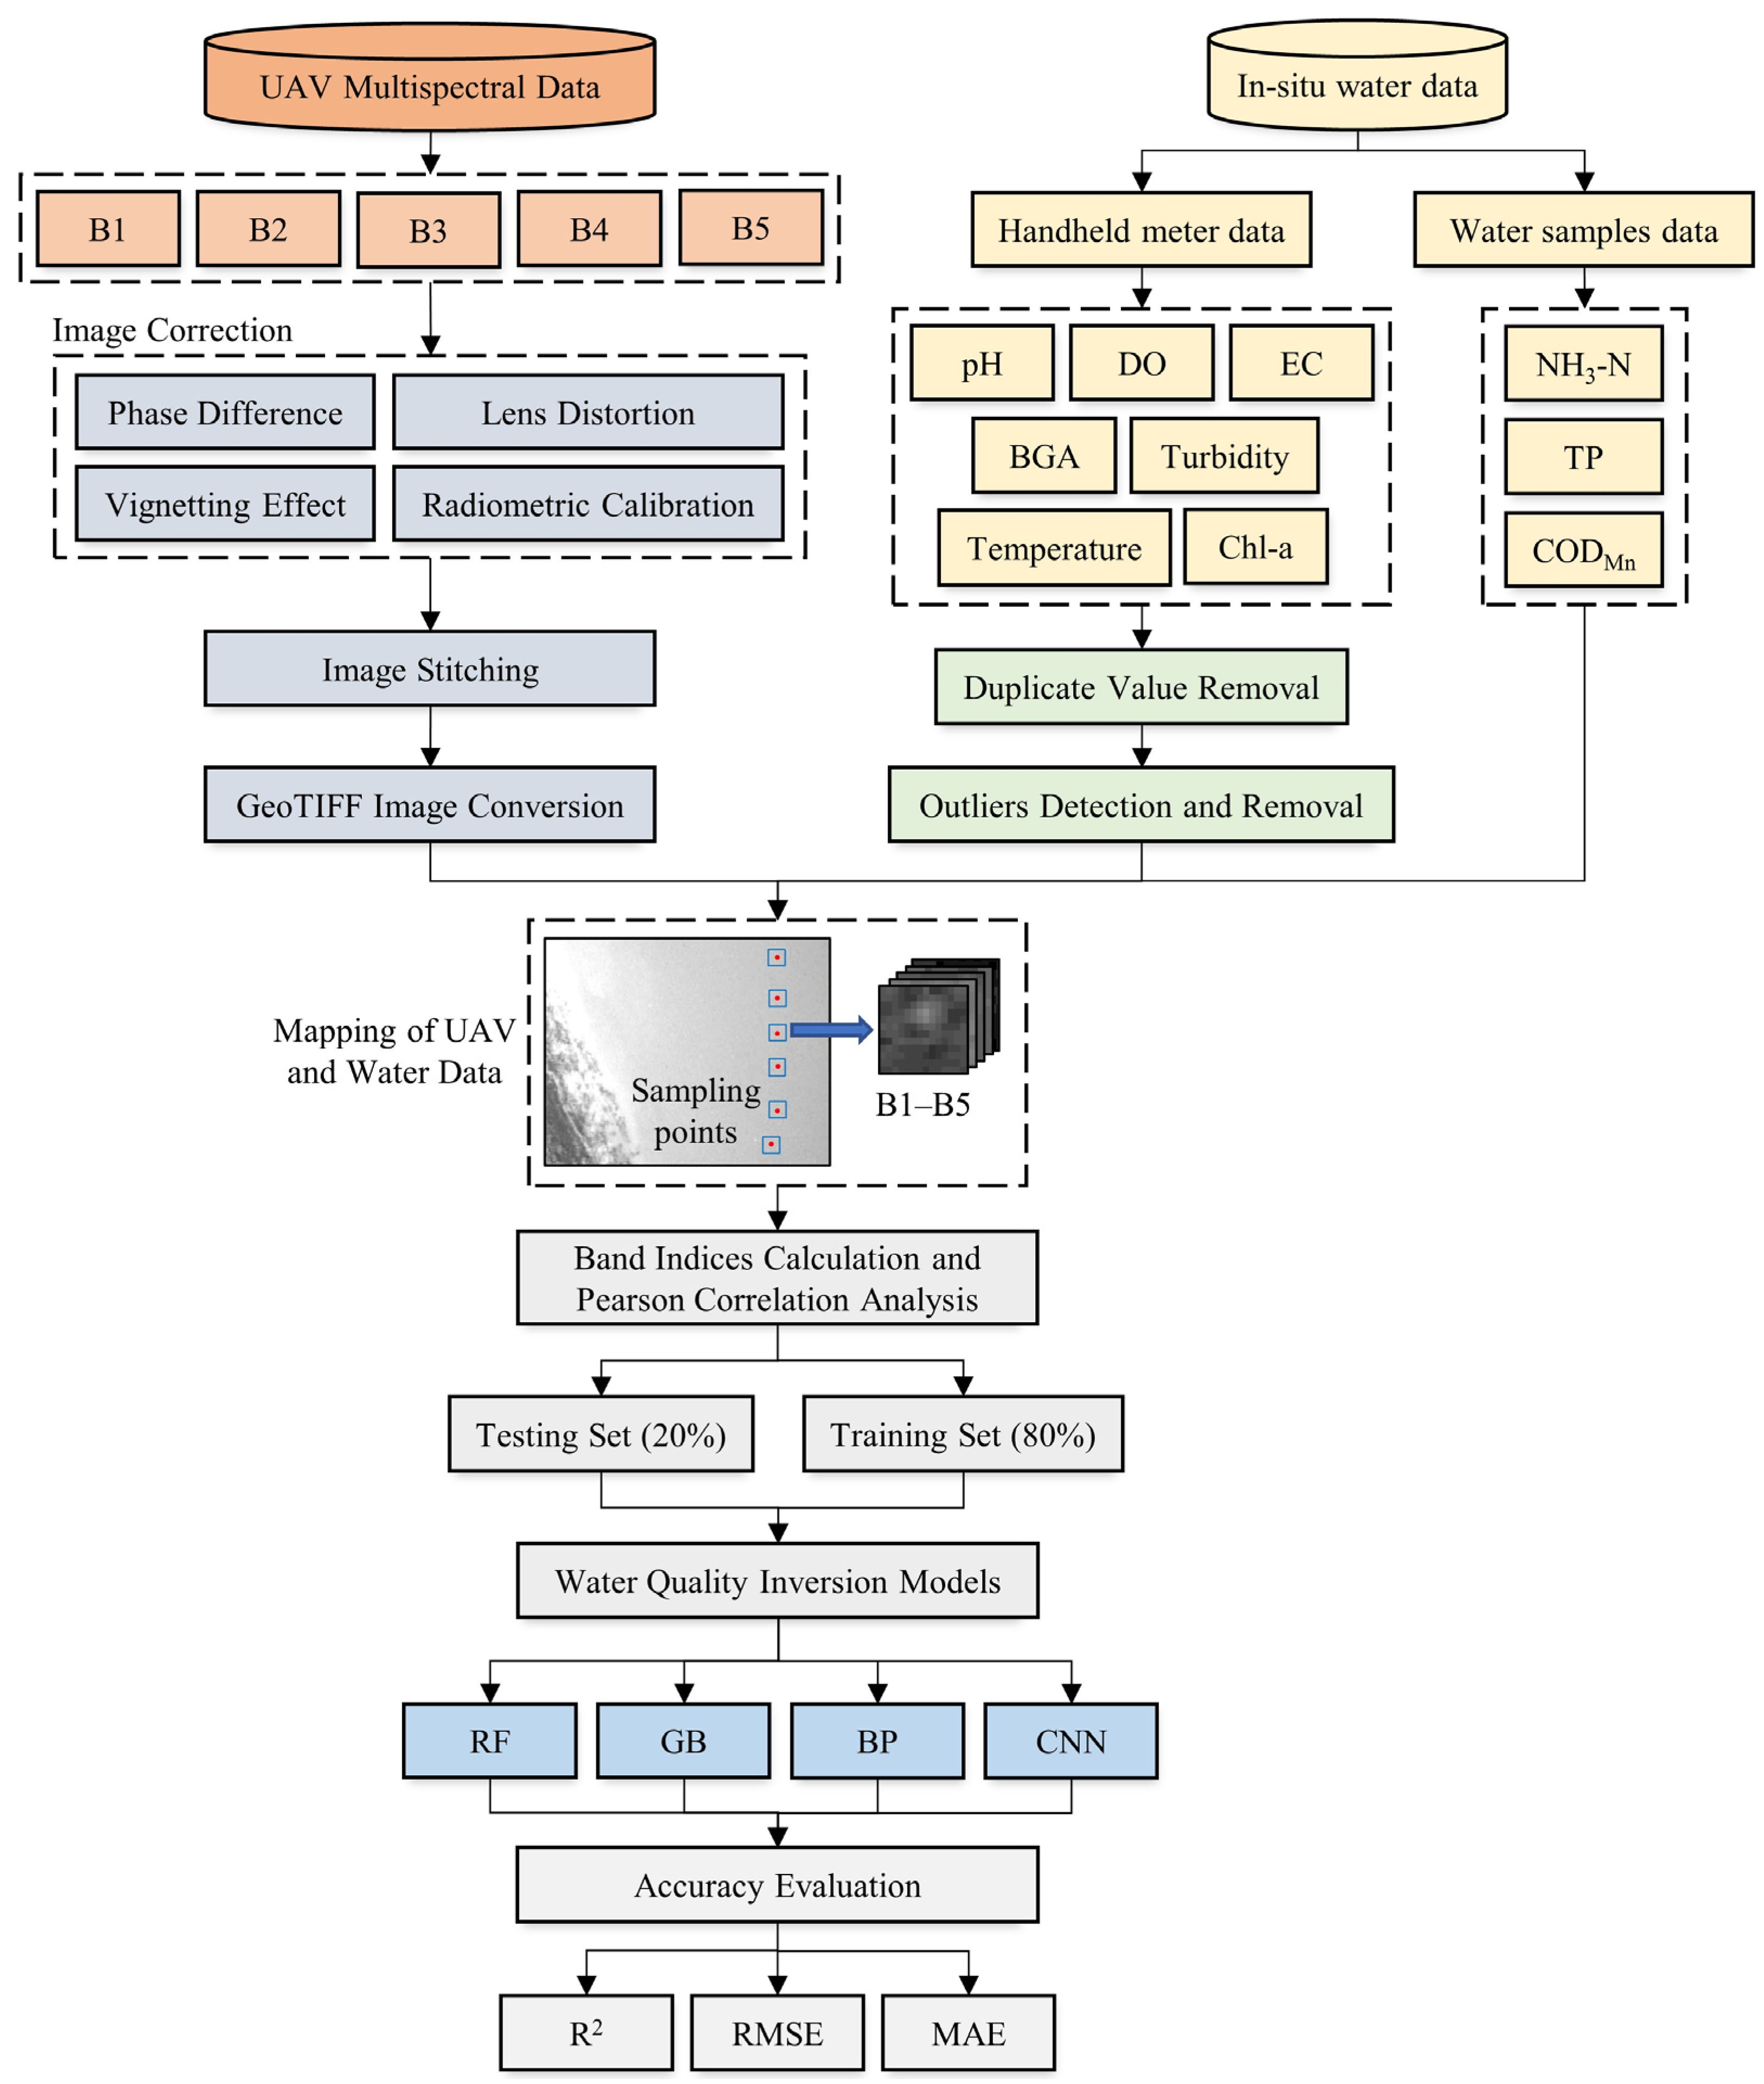
After data collection, both the UAV multispectral data and the in situ water data are processed according to the workflow shown in Figure 5, with the details outlined in the subsequent six sections.

2.3.1. UAV Multispectral Image Data Processing

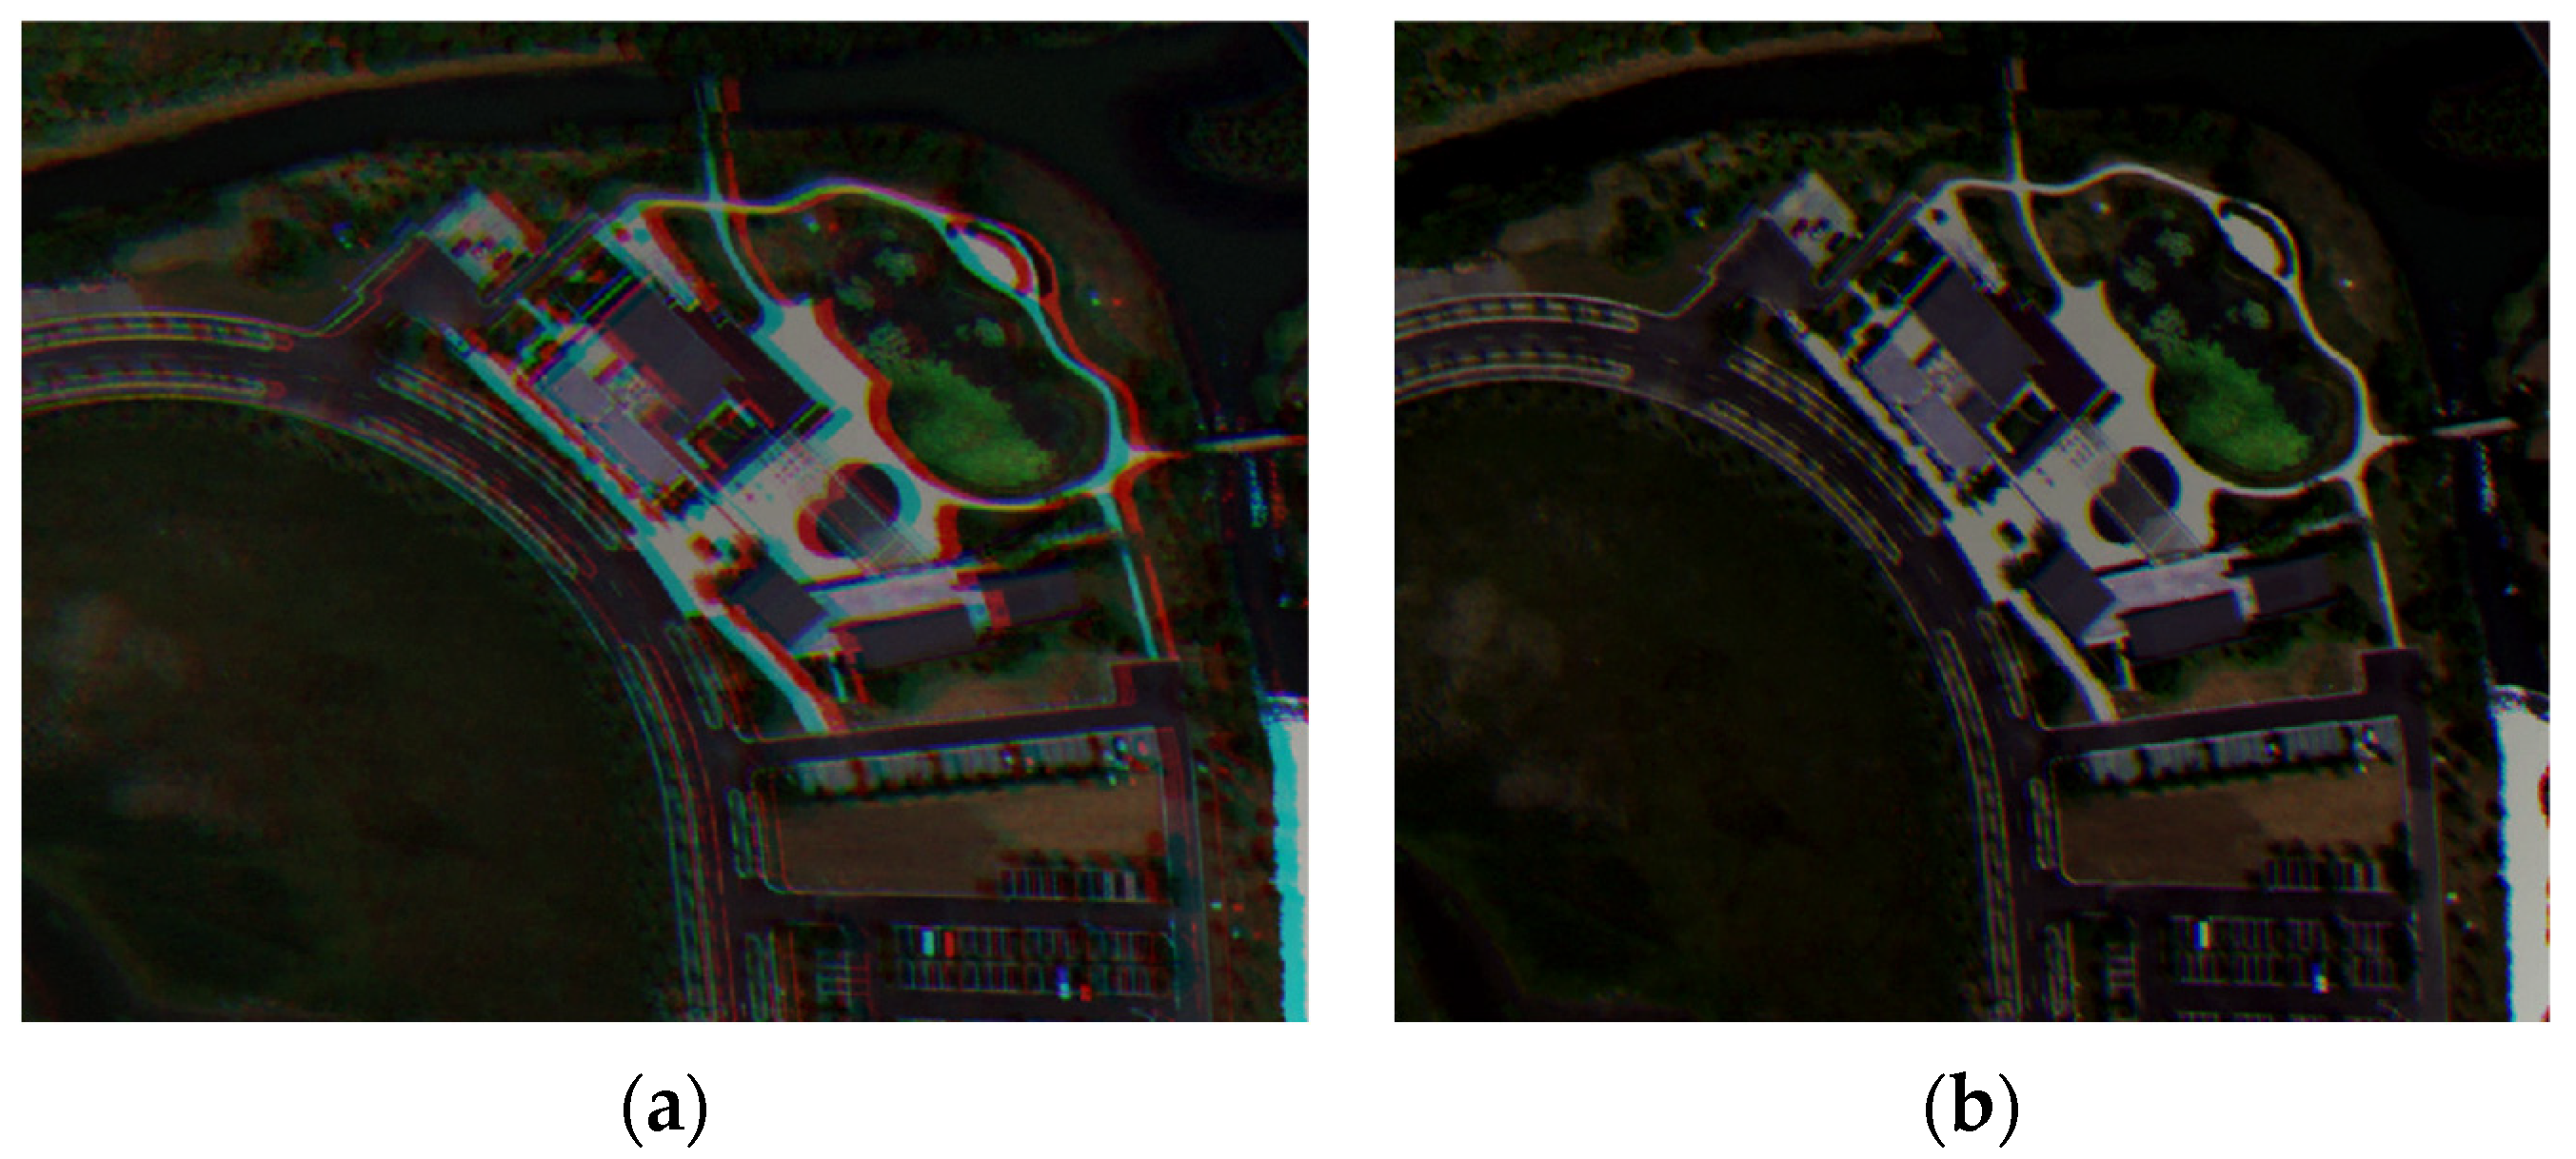
The raw multispectral band images were prone to phase difference, lens distortion, and vignetting effect; all images were processed in accordance with the DJI’s specific guidelines [33]. The phase difference is caused by the multispectral cameras’ different locations. DJI provided the relative optical centre of each camera in x and y coordinates, which correspond to the physical positions of the cameras for correction. Although the correction is not perfect, the phase difference between each band is reduced to some extent. Lens distortion is a common effect in every camera system; it can be corrected using the dewarp data in the image metadata. Furthermore, due to lens limitations, each multispectral band image suffers from vignetting. The vignetting effect is the difference in image intensity where the image centre appears to be brighter than the edge. The vignette is corrected using vignetting data from the metadata file. After the corrections, the reflectance value can be calculated accurately using the equation provided in the guideline. The image before and after correction is shown in Figure 6, where the phase difference and lens distortion effect can be observed before the correction.
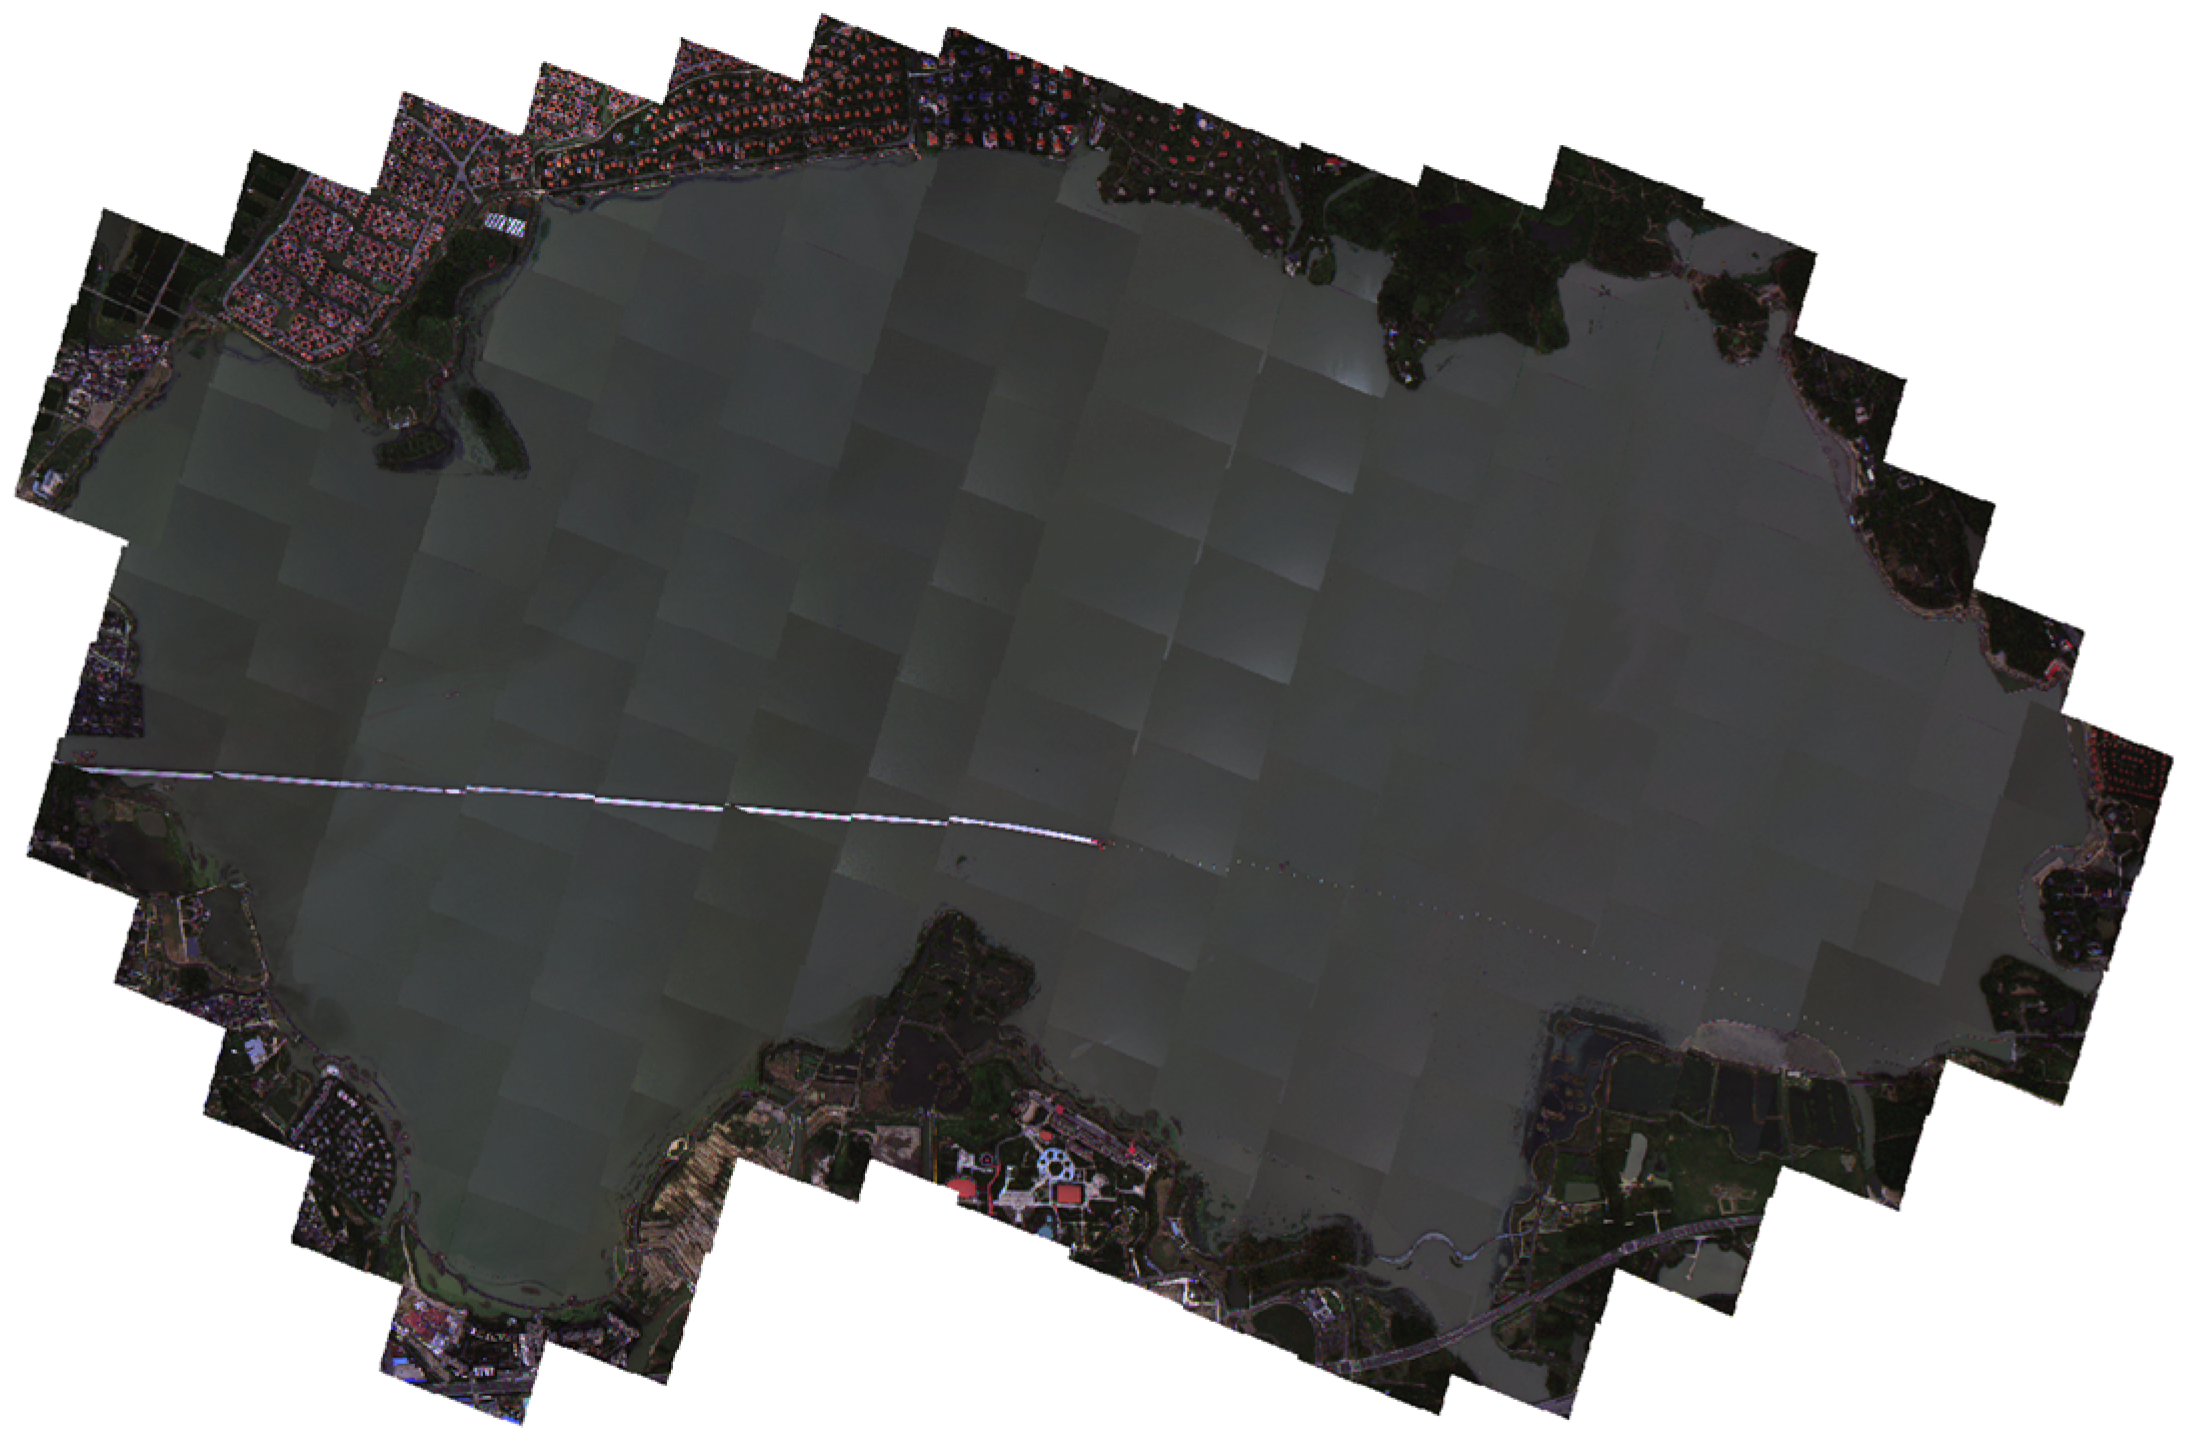
Furthermore, radiometric calibration is performed using a calibration plate to ensure the accuracy of the calculated reflectance value. This step is critical for large-scale image data collection because the data collection process took around 4–6 h, resulting in inconsistent image intensity due to variations in sun angles. Three calibration plates with different reflective surfaces were custom-made and sent to the lab to record the reflectance value of each wavelength from 420 to 1000 nm. The lab report is required in order to determine the true reflectance value of each multispectral band. A set of multispectral band images is captured before or after each data collection, with the calibration plates placed directly below the camera. The mean pixel value of each calibration plate is extracted from the captured images to plot the linear regression equation for each band together with the true reflectance value [34]. The reflectance value of the image was obtained using the linear regression equation, and the corrected images were stitched together to form a panoramic photo of the entire lake. Due to the low feature point across all lake surface images, commercial software used for small-scaled water bodies are incapable of reconstructing the entire lake surface. This is because commercial software mainly uses feature points between each image to construct the mosaic image, but the lake water surface images in large-scale data collections lack consistent salient features, making it impossible for the algorithm to identify important information for reconstruction. Because no other image stitching or 3D reconstruction software can produce panoramic images from repetitive lake images, code is written to stitch the image using the image GNSS coordinates as well as position and orientation system (POS) of the drone. The positioning accuracy of RTK GNSS is around 1 cm horizontally and 1.5 cm vertically, which is sufficient for image stitching. Figure 7 depicts panoramic image after stitching.
The panoramic image, however, requires additional processing because it lacks accurate geographic coordinate information that can be used to combine with continuous water parameter data and water samples. Since a single GPS coordinate on each image centre is insufficient for the water data mapping, ArcGIS Pro is used to convert the panoramic image to a GeoTIFF file [35]. By using some lakeside objects such as houses and landmarks as georeferencing ground control points, the image is transformed to the specific location and masked with a coordinate layer where each pixel is assigned a GPS coordinate value.

2.3.2. In Situ Water Data Processing

The aforementioned water data collection approaches with respect to Figure 4 in Section 2.2.2 yielded ten water quality parameters data with GPS coordinates. Since the data are collected while the boat is moving, occasionally, water weed and grass will intertwine with the handheld metre, requiring personnel to stop the boat to remove the intertwined grass, resulting in duplicate values. As part of the data cleansing process, duplicate values in the collected continuous measurements were deleted. Furthermore, because of the intertwined water weed and grass, abnormal values such as a sudden large increase in water parameters’ concentration existed in the dataset, which would affect the model accuracy. Hence, anomaly detection is performed using the isolation forest (IF) algorithm to detect outliers autonomously. IF is an unsupervised model built based on decision trees that process the randomly subsampled data in a tree structure based on randomly selected features. IF algorithm labelled the anomaly values to be removed in the data processing state.

2.3.3. Mapping of UAV and Water Data

UAV data and water quality data were in the same coordinate system after processing; the value of five multispectral bands was recorded for each water data point using the mean pixel value with a window size of 20 × 20 pixels, as shown in Figure 5. The window size is decided using other research as a reference [11,12,36]. A window size is required because the band data will deviate if they are obtained from a single pixel, whereas if the window size is too large, the band data will lose some features. During data collection, the sun glint effect was minimised but not eliminated completely in some images; thus, the reflected water region with sun glint is masked with black pixel value manually to be filtered out of the dataset.

2.3.4. Calculation of Band Indices

According to relevant studies, different band combinations were used in water quality inversion to improve the accuracy of the inversion model. Additionally, the band ratios approach can remove background noise and interference from rough water surfaces [37]. Therefore, a total of 84 band indices were used in this study, as shown in Table 2. The band indices were constructed using five bands with the combination of band sums, band differences, band ratios, and other vegetation indices summarised in other studies [26,28,30].

2.3.5. Machine Learning Models

Random Forest (RF), Gradient Boosting (GB), Convolutional Neural Network (CNN), and Backpropagation Neural Network (BP) are chosen as water quality inversion algorithms because they are common models that have performed relatively well in previous research [36,38,39].
RF model, developed by Breiman, is a common machine learning algorithm that is used for both classification and regression problems [40]. RF model consists of large number of decision trees that operate as an ensemble to generate a final output for a specific problem. The model first selects a subset of data points and features to construct individual decision tree for each sample. Each decision tree will generate an output, and the final output is decided based on majority voting or averaging. In decision trees, low correlation between trees is the key to producing accurate predictions. In order to achieve low correlation in RF model, it uses bagging method to allow each individual tree to randomly sample from the dataset with replacement, resulting in different trees. Feature randomness in an RF model forces each tree to select only from a random selection of features, resulting in more variation and eventually leading to lower correlation across the tree. The hyperparameter of the RF model can be tuned using randomised search in scikit-learn library. The chosen parameters are n_estimators (1400), min_samples_split (2), min_samples_leaf (1), max_features (auto), and max_depth (100) for the RF model used in this study.
GB model is also used for both classification and regression problems. Gradient Boosting is a variation of ensemble methods in which numerous weak models are created and combined to improve overall performance. GB model, like RF, is built of ensemble of decision trees, but the sequence of each tree is generated focusing on the prediction residuals of previous tree [41]. GB model estimates the basis function non-parametrically and uses gradient descent to approximate the solution in function space. The hyperparameter of the RF model can be tuned using randomised search in scikit-learn library. The chosen parameters are n_estimators (800), learning_rate (0.01), loss (squared_error), and max_depth (5) for the RF model used in this study. Additionally, GB model has many variants, such as XGBoost, and it can combine with genetic algorithm (GA) for optimal global solution, which is called GA_XGBoost model [25].
CNN is a feedforward neural network that performs well in target recognition and regression. Examples of CNN models are AlexNet, VGG-16, Google Net, ResNet, and other classical Convolutional Neural Network models. Although the structures are complex and varied, the basic structures and principles are similar, and the models have an input layer, a hidden layer, and an output layer. The hidden layer of CNN is made up of convolutional layers, activation function layers, pooling layers, and fully connected layers. Convolution is the operation of extracting features by weighting and averaging the pixel points in the local area of the input image with the convolution kernel’s weight coefficients, pooling is used to compress the extracted features, and the activation function adds nonlinear variations to the neural network model. To train the CNN model, the model undergoes continuous convolution and pooling to adjust the weight parameters of each CNN layer. The weight parameters are continuously adjusted until loss is minimised to better fit the features of the input data. The architecture layers of the CNN model used in this study is shown in Figure 8 with two convolutional blocks and one fully connected layer. The two convolutional blocks consist of a convolutional layer (Conv), a batch normalisation layer (Batch Norm) to speed up the training and a rectified linear unit (ReLU) which is an activation function layer. The dropout layer is placed before the fully connected layer to prevent overfitting, while the flattening layer converts the data into a one-dimensional array for inputting the data into the fully connected layer. The architecture does not include the pooling layer since the dimension reduction is not obvious for small images. The network architecture is relatively simple since research has shown that deep layers are not required for water quality inversion [12,36].
BP neural network is a multi-layer feedforward network that generally consists of three layers: input layer, hidden layer (also known as intermediate layer), and output layer. The neurons in each layer are only fully connected with each other and the neurons in adjacent layers, with no connection between neurons in the same layer and no feedback connection between neurons in each layer, resulting in a hierarchical feedforward neural network system. Each neuron receives input signals from other neurons, and each signal is routed through a weighted connection. The neuron adds these signals together to obtain a total input value, which is then compared to the neuron’s threshold and finally processed by an activation function to obtain the final output, which is passed on layer by layer as input to subsequent neurons. The purpose of the activation function is to introduce non-linearity into the model. Without an activation function, no matter how many layers the neural network has, it is ultimately limited to a linear mapping, resulting in the network’s approximation capability being rather limited, and a simple linear mapping cannot solve the linear indistinguishability problem. Various features for retrieving the water quality parameters are processed through the input layer of the BP neural network, and the final prediction results are obtained through the output layer output. When the output layer of the BP neural network output results and its pre-set input value of the error is large, the BP neural network enters the backpropagation stage, and the neuron weights are updated until the output results and the expected result error meet certain conditions. The number of features selected determines the number of input nodes of the BP model. After testing and refining the different hidden layers’ architecture, the BP model utilised in this study has 6 hidden layers with node numbers of 14-14-15-15-15-15.

2.3.6. Accuracy Evaluation

The coefficient of determination (R2), root mean square error (RMSE), and mean absolute error (MAE) were used to quantify the accuracy and performance of the model using new data (Equations (1)–(3), respectively).
R 2 = 1 ( y i ŷ i ) 2 ( y i y - ) 2
RMSE = 1 n i = 1 n ( ŷ i y i ) 2
MAE = 1 n i = 1 n | ŷ i y i |
where ŷ i represents the predicted values of the water quality parameters, y i represents the measured values of the water quality parameters, and n is the number of sampling points. The value of R2 ranges from 0 to 1. An R2 value of 1 denotes perfect precision, whereas a score of 0 denotes the model’s lowest prediction performance. The value range of RMSE is (0, +∞). High RMSE indicates that the model’s predicted value has a high degree of deviation. MAE is the mean of the absolute value of the error between the predicted value and the observed value. A model with a high R2, low RMSE, and a low MAE is considered suitable for quantitative inversion.
The data set was divided into training and validation sets using random split sampling. In total, 80% of the inputting data were used for training the model, and 20% of the inputting data were used to assess the prediction accuracy of the model. In this study, all the above model operations were based on the anaconda platform, and the modeling of water quality parameters with the RF algorithms was implemented with the scikit-learn machine learning library, while the BP and CNN were implemented using MATLAB.

3. Results

This chapter presents descriptive statistics for the water data acquired in Section 2.2.2 and Pearson correlation analysis results for spectral indices with the ten water quality parameters in Table 2. The results of the machine learning regression models on retrieving ten water parameters are shown in the Section 3.

3.1. Data Analysis

Table 3 summarises the mean, maximum, minimum, and standard deviation of the concentrations of the water quality parameters samples of ammonia nitrogen, total phosphorous, and permanganate index in three sampling days with respect to Figure 4 in Section 2.2.2.
Based on Table 3, NH3-N ranged from 0.2658–1.1499 mg/L within 5–10 August, with the mean and standard deviation of 0.6394 ± 0.2235 mg/L; the highest concentration was obtained on 5 August, TP ranged from 0.5809–1.1499 mg/L with mean and standard deviation of 0.7967 ± 0.1512 mg/L. Based on the concentration of TP, a decreasing trend is observed in the concentration values.
TP ranged from 0.0676–0.1986 mg/L within 5–10 August, with the mean and standard deviation of 0.1308 ± 0.0333 mg/L; the highest concentration was obtained on 10 August, TP ranged from 0.1016–0.1986 mg/L with mean and standard deviation of 0.14998 ± 0.03414 mg/L. Based on the concentration of TP, an increasing trend is observed in the concentration values.
For CODMn, it ranged from 3.4296–7.5345 mg/L within 5–10 August, with the mean and standard deviation of 6.1657 ± 0.8656 mg/L; the highest concentration was obtained on 5 August where CODMn ranged from 6.8058–7.5345 mg/L with mean and standard deviation of 7.1753 ± 0.2098 mg/L.
Table 4 summarises the mean, maximum, minimum, and standard deviation of the concentrations of the seven water quality parameters in three sampling days with respect to Figure 3 in Section 2.2.2.
Table 4 displays the statistical analysis results of seven water parameters’ raw data. Turbidity and NC have the highest standard deviation among all water parameters, with NC having a similar standard deviation on each day and Turbidity having a significantly distinct standard deviation. Chl-a and BGA show similar data variations, while pH, DO, and temperature show little variations in the concentration.

3.2. Spectral Index and Water Quality Parameters Correlation Analysis

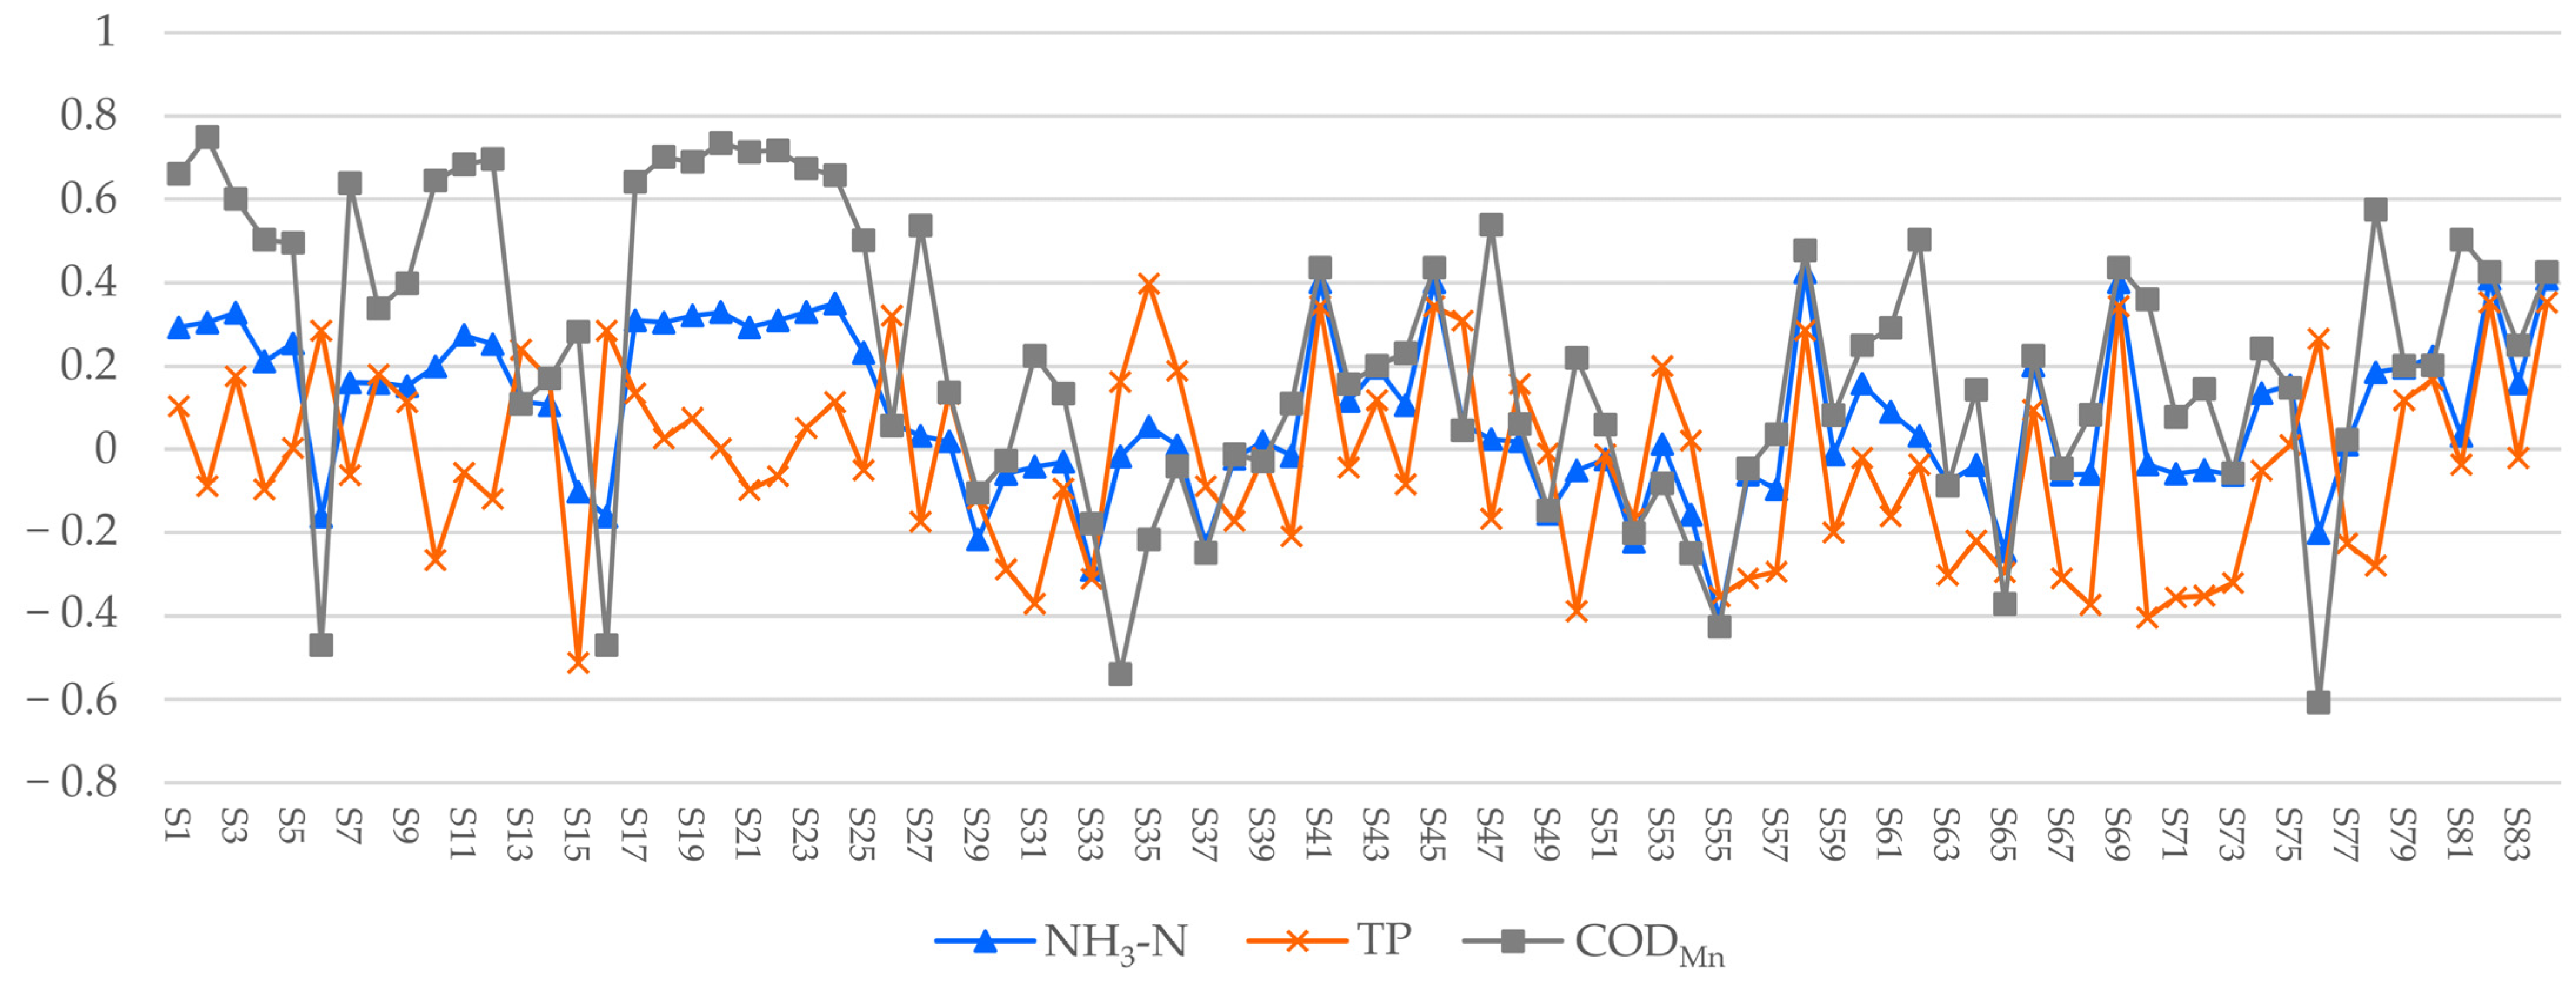
Pearson correlation analysis is performed to determine the most relevant features out of water parameters and spectral indices. Figure 9 shows the correlation coefficient between the NH3-N, TP, CODMn, and 84 spectral indices. Among the three water parameters, CODMn has the highest correlation coefficients with spectral indices, where the highest correlated spectral index is S2 with a 0.749 correlation value. S15 is the most correlated spectral index for TP, with a correlation value of −0.5121, and S58 is the most correlated spectral index for NH3-N.
The correlation coefficient between temperature, DO, EC, and 84 spectral indices is shown in Figure 10. Water parameter temperature has the highest positive and negative correlation coefficients with spectral indices among the three parameters, where the highest positively correlated spectral index is S10 with a 0.579 correlation coefficient, while the highest negatively correlated spectral index is S76 with a −0.548 correlation coefficient. DO is more negatively correlated with spectral indices, with S22 having the largest negative correlation coefficient of −0.485. For EC water parameters, it is also more negatively correlated with spectral indices, with S3 having the highest correlation value of −0.516.
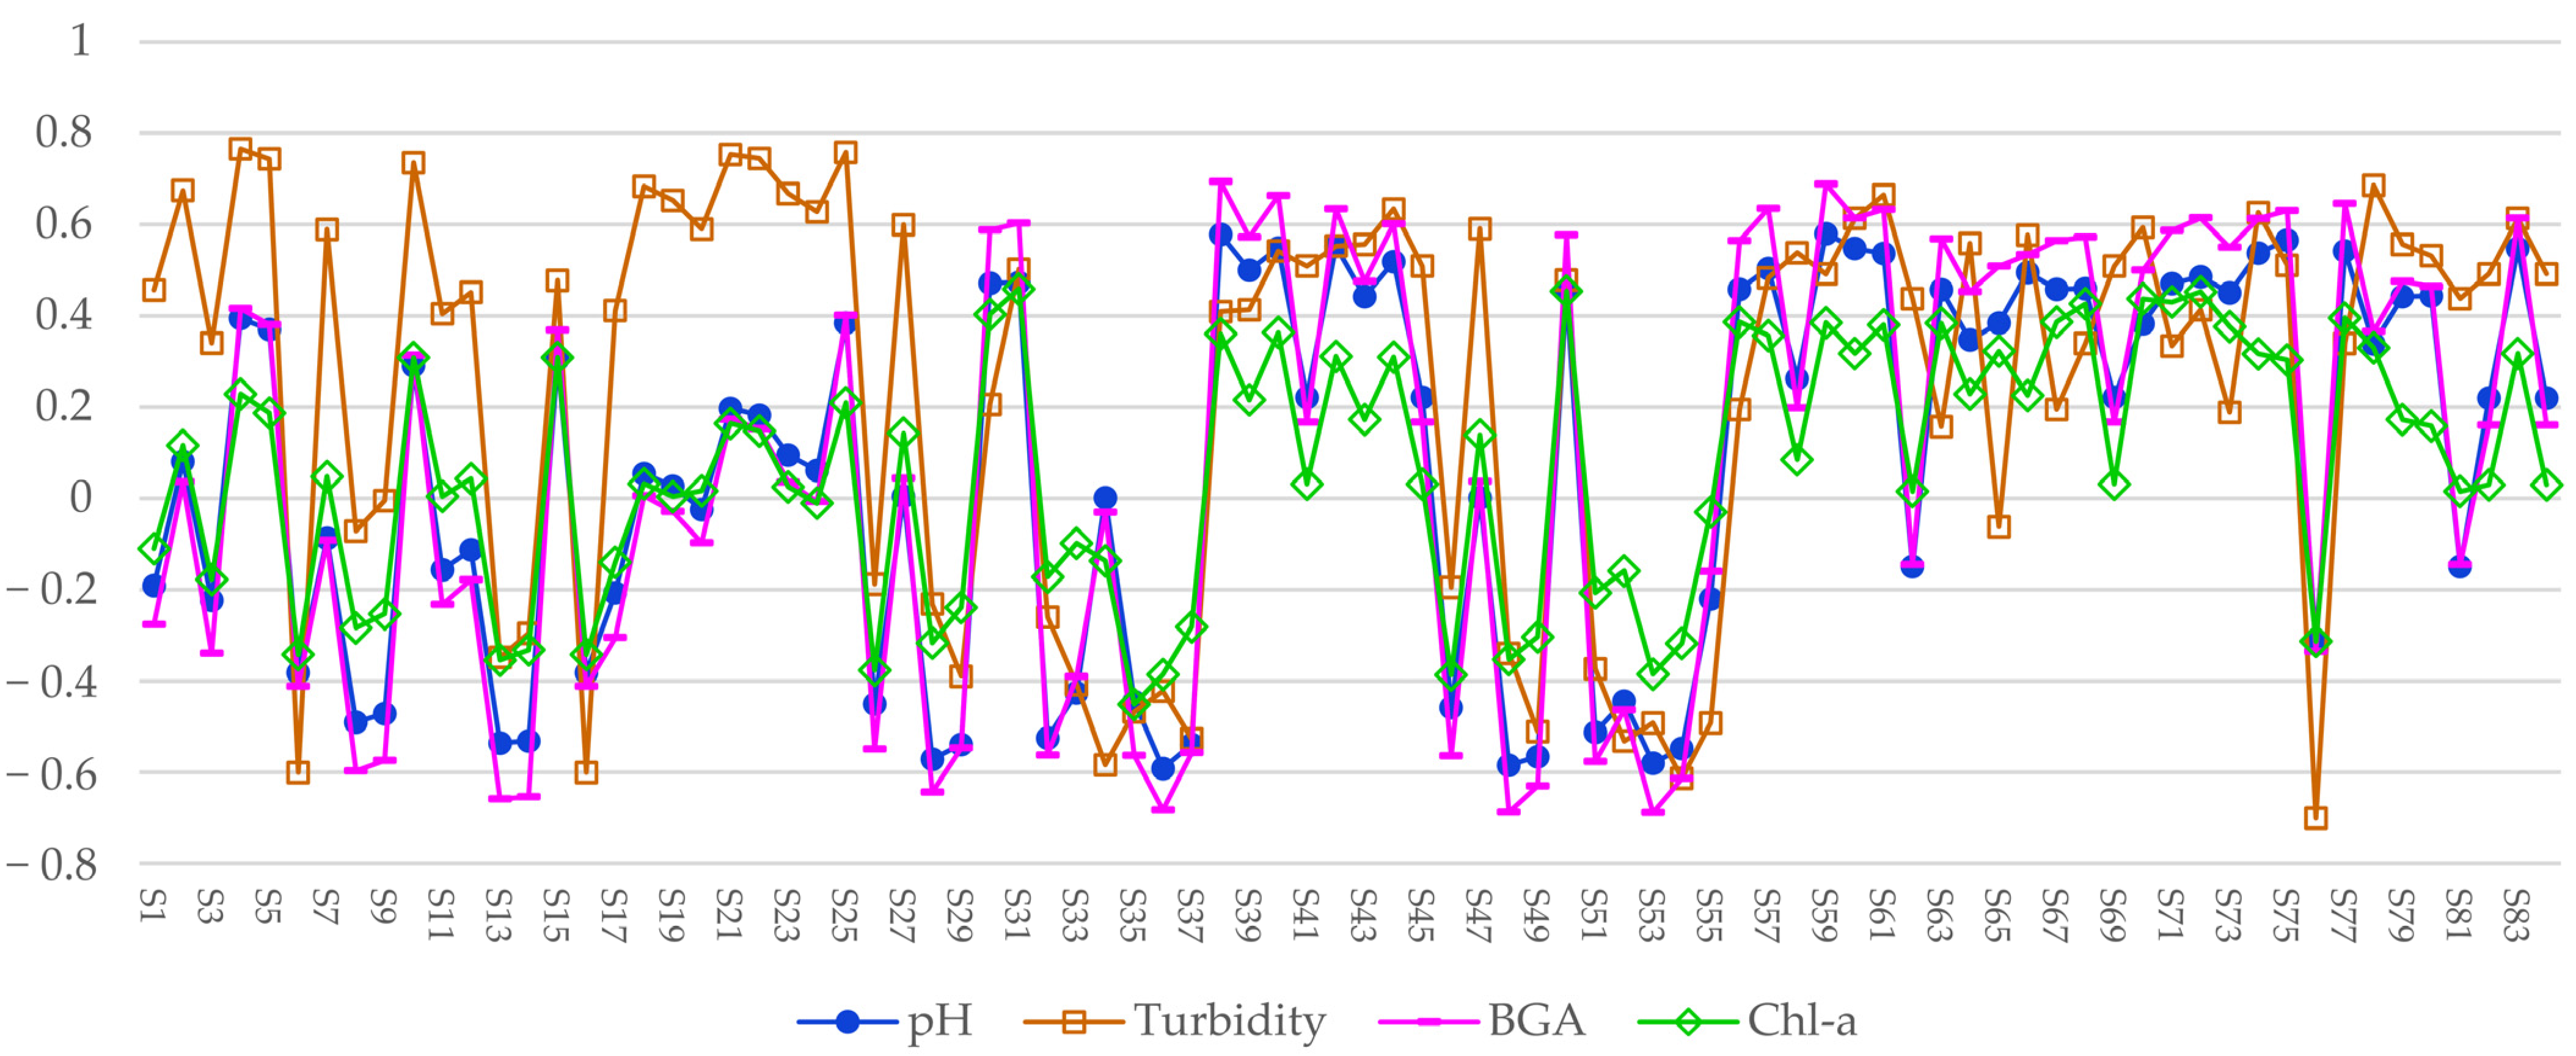
The correlation coefficient between pH, Turbidity, BGA, Chl-a, and 84 spectral indices is shown in Figure 11. The correlation coefficients for these four water parameters indicate a similar trend, with Turbidity having the highest positive correlation coefficients. S4 is the most correlated spectral index with Turbidity, with a correlation coefficient of 0.766 correlation coefficients. S53 is the most negatively correlated spectral index with BGA, with a correlation coefficient of −0.689 correlation coefficients. S36 is the most correlated spectral index for pH, with a correlation coefficient of −0.591. Whereas Chl-a has the lowest correlation with spectral indices, the highest correlation value is spectral index S31(=0.459).
Based on the analysis result, it can be observed that NH3-N, TP, BGA, and Chl-a show a weaker correlation with the features. Eventually, the highest correlated spectral indices were selected as variables to establish the inversion model.

3.3. Results of Multivariate Regression Models

Table 5 shows the results of four multivariate regression models (RF, GB, BP, and CNN) using correlated spectral indices features in retrieving five water parameters: NH3-N, TP, CODMn, Chl-a, and BGA. According to the results, the RF model performed the best out of all models, while the CNN model performed the worst. On the training dataset, the RF model achieved around 0.88–0.95 R2 for all five parameters inversion; however, the R2 of the testing dataset was lowest for Chl-a (R2 = 0.33) while highest for CODMn (R2 = 0.78) and moderate for NH3-N (R2 = 0.51), TP (R2 = 0.45), and BGA (R2 = 0.43). On the training dataset, the GB model achieved around 0.65–0.95 R2 for all five parameters inversion; however, the R2 of the testing dataset was lowest for Chl-a (R2 = 0.32) and TP (R2 = 0.32) while highest for CODMn (R2 = 0.74) and moderate for NH3-N (R2 = 0.55) and BGA (R2 = 0.45). In comparison, the BP model achieved around 0.25–0.65 R2 in the training dataset and 0.15–0.52 R2 in the testing dataset for all five parameters. The worst-performing BP model was the inversion of the NH3-N (R2 = 0.15) water parameter, while the best-performing model was the inversion of BGA (R2 = 0.52). CNN model, on the other hand, achieved around 0.20–0.67 R2 for the training dataset and 0.15–0.64 R2 for the testing dataset. The best-performing CNN model was for CODMn (R2 = 0.64). Overall, CODMn has the best inversion result.
The best model for retrieving water parameter NH3-N is the GB model (R2 = 0.55), whereas the best model for retrieving water parameter TP, CODMn, and Chl-a is the RF model (R2 = 0.45, R2 = 0.78, and R2 = 0.33); the best model for retrieving water parameter BGA is BP model (R2 = 0.52).
Table 6 shows the results of four multivariate regression models (RF, GB, BP, and CNN) using correlated spectral indices features in retrieving five water parameters: Turbidity, pH, NC, DO, and temperature. According to the results, the RF model performed the best out of all models, while the CNN model performed the worst. On the training dataset, the RF model achieved around 0.90–0.96 R2 for all five parameters inversion; however, the R2 of the testing dataset was lowest for Turbidity (R2 = 0.34) while highest for pH (R2 = 0.73), temperature (R2 = 0.70), DO (R2 = 0.67), and NC (R2 = 0.64). On the training dataset, the GB model achieved around 0.77–0.90 R2 for all five parameters inversion; however, the R2 of the testing dataset was lowest for Turbidity (R2 = 0.30) while highest for temperature (R2 = 0.75) and pH (R2 = 0.67) and moderate for DO (R2 = 0.62) and NC (R2 = 0.59). In comparison, the BP model achieved around 0.36–0.68 R2 in the training dataset and 0.31–0.64 R2 in the testing dataset for all five parameters. The worst-performing BP model was the inversion of Turbidity (R2 = 0.31), while the best-performing model was the inversion of temperature (R2 = 0.64). The CNN model, on the other hand, achieved around 0.32–0.44 R2 for the training dataset and 0.35–0.40 R2 for the testing dataset. The best-performing CNN model was for NC (R2 = 0.40). Overall, pH, NC, DO, and temperature have good inversion results.
The best model for retrieving water parameter Turbidity is the CNN model (R2 = 0.34), whereas the best model for retrieving water parameter pH, NC, and DO is the RF model (R2 = 0.72, R2 = 0.64, and R2 = 0.67); the best model for retrieving water parameter temperature is GB model (R2 = 0.75).
Overall, the water parameters that achieved 0.6 R2 or higher were CODMn, temperature, pH, DO, and NC, with the R2 of 0.77, 0.75, 0.73, 0.67, and 0.64. Turbidity and Chl-a have the lowest R2 with only 0.34 and 0.33.

4. Discussion

Based on the results obtained from the previous chapter, this chapter discussed the findings of the Pearson correlation analysis, the machine learning model’s performance compared with other studies, and the limitations of this study.

4.1. Correlated Features of Different Water Quality Parameters

The ten water quality parameters investigated in the study were NH3-N, TP, CODMn, pH, BGA, Chl-a, EC, DO, temperature, and Turbidity. Based on previous studies, water quality parameters can be classified into two categories: optically active and optically inactive. Among the ten measured water parameters, optically active parameters include Chl-a, temperature, Turbidity, EC, and BGA, while optically inactive parameters include NH3-N, TP, DO, CODMn, and pH [14,42,43,44].
For optically active water parameters such as Chl-a, the Pearson correlation analysis revealed that Chl-a’s most correlated spectral index is B2/B3, which is related to the green and red band, while BGA is most correlated with band ratios consisting of red, red edge, and NIR. Based on a prior study, the researcher used a similar band for global spatial regression modelling of Chl-a [45]. It is mentioned by the researchers that in clear waters, blue and green spectral bands are commonly used for modelling because the phytoplankton controlled the properties in clear waters, whereas in turbid waters, the red and NIR spectral bands or the green-to-red band is used to avoid high absorption of non-algal particles. The lake chosen for the case study was the latter with turbid waters, so the results are consistent with previous findings. The most correlated spectral indicator for Turbidity is the red edge band, which contradicts findings using MODIS satellite that the red band is more sensitive to Turbidity [46]. The most correlated spectral index is B2 − B3 for temperature and the red band for EC; there is no comparable study to compare the sensitive bands with.
Previous research has shown that optically sensitive parameters with significant optical properties allow for the identification of similar spectral bands [47], whereas for non-optical sensitive parameters, it is usually difficult to obtain accurate quantitative predictions of their concentrations and spatial distributions based on satellite remote sensing images and simple statistical analysis models. Hence, the correlated variables for non-optical sensitive parameters were inconsistent with the other finding [25,26].

4.2. Performance of ML Models in Water Quality Monitoring

The result of CODMn, TP, NH3-N, Turbidity, and Chl-a can be used to compare with other studies [25,26,28]. Two other studies employed the exact same multispectral UAV device as ours, but the flight altitude settings were substantially different, with one set at 150–160 m, one at 10 m, and ours at 500 m [26,28]. At the same time, the other study employed a multirotor UAV with Rededge-MX multi-spectral camera flying at 160–165 m for image data collection [25]. Table 7 displays the regression modelling results of several water parameters using different ML models.
Our study has the best modelling result for CODMn using the RF model with the R2 of 0.778 with the RMSE of 0.304 mg/L. The best result for TP, NH3-N, Turbidity, and Chl-a was using the GA_XGBoost ML model [25]. The author combined the characteristic of adaptive search from GA with the high efficiency and flexibility of XGBoost to obtain good modelling results. However, some of the remaining water parameters (temperature, pH, DO, NC, and BGA) obtained decent results (R2 = 0.75, 0.73, 0.67, 0.64, and 0.52) but they are not comparable because UAV multispectral was not previously utilised to model those parameters. Although some of the water parameters are optically inactive, UAVs have the advantage of obtaining high-resolution data that can be used to improve the modelling of those parameters. This work validates the high accuracy of obtaining numerous optical and non-optical active parameters using ML algorithms; however, it does have certain limitations. Further research using various ML and Deep Learning models in conjunction with multispectral data is necessary.

4.3. Limitations

In this study, UAV is proven to be able to capture high temporal data with large spatial coverage, which is suitable for high-frequency data collection of medium-sized water bodies. Nevertheless, few relevant investigations have been undertaken, and related theories and approaches are still in their development. Accurate radiometric calibration for UAV multispectral images is still a difficult subject, especially when the survey area is large, resulting in varying imaging times and sun angle, making it difficult to capture the complex optical properties of the inland water bodies. Accurate calibration and processing of images are key to high-accuracy modelling results. Hence, more research is required to investigate the data processing of UAV multispectral photos captured over a long duration of time. Furthermore, the acquired water data contains outliers that must be eliminated in order for the trained model to generalise properly. This study employed the IF method to find outliers, but it suffered from unbalanced data and required a large amount of training data to perform well. As a result, more research is needed to determine the best outlier detection method for water quality inversion.

5. Conclusions

In this study, multispectral UAVs with high spatial and temporal characteristic is used to acquire spectral data for a medium-sized lake with a surface area of 13 km2. The multispectral data were collected and processed systematically, and different band equations were used to generate the spectral indices, with the optimal indices chosen for modelling based on Pearson correlation analysis. ML regression methods, including RF, GB, BP, and CNN, were used to construct separate water quality retrieval models for NH3-N, TP, CODMn, pH, BGA, Chl-a, EC, DO, temperature, and Turbidity. Water parameters including R2, temperature, pH, DO, and NC (R2 = 0.77, 0.75, 0.73, 0.67, and 0.64) all achieved satisfactory results, while NH3-N, BGA, TP, Turbidity, and Chl-a obtained poor results (R2 = 0.55, 0.52, 0.45, 0.34, and 0.33). The feature variables derived from multispectral data demonstrate notable advantages in terms of water quality inversion for several water parameters and predicted water quality changes and spatial distributions more effectively and accurately, especially for water bodies at larger scales. Consequently, this study provides an efficient and practical way for monitoring optically active and inactive water parameters, and future research should strongly consider the adoption of multispectral UAVs to retrieve and monitor spatiotemporal changes in multiple water quality parameters of medium-sized water bodies.

Author Contributions

Conceptualisation and methodology, Y.L. and C.Z.; software, L.F.; validation, Y.L. and L.F.; formal analysis, Y.L., L.F. and H.H.; investigation, Y.L., L.F. and H.H.; resources, C.Z., Y.X. and L.K.; data curation, T.L., H.H., L.F. and Y.L.; writing—original draft preparation, Y.L., L.F. and T.L.; writing—review and editing, C.Z. and H.H.; visualisation, Y.L. and L.F.; supervision, C.Z. and Y.X.; project administration, C.Z., Y.X. and L.K.; funding acquisition, C.Z., Y.X. and L.K. All authors have read and agreed to the published version of the manuscript.

Funding

This research was funded by Xi’an Jiaotong-Liverpool University Urban and Environmental Studies University Research Center, grant number RDH-101-2022-0032.

Data Availability Statement

Not applicable.

Acknowledgments

We appreciate Yiyang Wang, Wenlin Fu, Yingqiu Ru for collecting UAV images, and Chunyao Xu for collecting water quality data.

Conflicts of Interest

The authors declare no conflict of interest.

References

  1. GB 3838–2002; Environmental Quality Standards for Surface Water. China, Ministry of Environmental Protection of the People’s Republic of China: Beijing, China, 2002.
  2. Thiemann, S.; Kaufmann, H. Determination of chlorophyll content and trophic state of lakes using field spectrometer and IRS-1C satellite data in the Mecklenburg Lake District, Germany. Remote Sens. Environ. 2000, 73, 227–235. [Google Scholar] [CrossRef]
  3. Seegers, B.N.; Werdell, P.J.; Vandermeulen, R.A.; Salls, W.; Stumpf, R.P.; Schaeffer, B.A.; Owens, T.J.; Bailey, S.W.; Scott, J.P.; Loftin, K.A. Satellites for long-term monitoring of inland US lakes: The MERIS time series and application for chlorophyll-a. Remote Sens. Environ. 2021, 266, 112685. [Google Scholar] [CrossRef]
  4. Coelho, C.; Heim, B.; Foerster, S.; Brosinsky, A.; De Araújo, J.C. In Situ and satellite observation of CDOM and chlorophyll-a dynamics in small water surface reservoirs in the brazilian semiarid region. Water 2017, 9, 913. [Google Scholar] [CrossRef] [Green Version]
  5. Warren, M.A.; Simis, S.G.; Selmes, N. Complementary water quality observations from high and medium resolution Sentinel sensors by aligning chlorophyll-a and turbidity algorithms. Remote Sens. Environ. 2021, 265, 112651. [Google Scholar] [CrossRef] [PubMed]
  6. Papenfus, M.; Schaeffer, B.; Pollard, A.I.; Loftin, K. Exploring the potential value of satellite remote sensing to monitor chlorophyll-a for US lakes and reservoirs. Environ. Monit. Assess. 2020, 192, 808. [Google Scholar] [CrossRef]
  7. Ouma, Y.O.; Noor, K.; Herbert, K. Modelling reservoir chlorophyll-a, TSS, and turbidity using Sentinel-2A MSI and Landsat-8 OLI satellite sensors with empirical multivariate regression. J. Sens. 2020, 2020, 8858408. [Google Scholar] [CrossRef]
  8. Ferral, A.; Solis, V.; Frery, A.; Aleksinko, A.; Bernasconi, I.; Marcelo Scavuzzo, C. In-Situ and satellite monitoring of the water quality of a eutrophic lake intervened with a system of artificial aireation. IEEE Lat. Am. Trans. 2018, 16, 627–633. [Google Scholar] [CrossRef]
  9. Mohsen, A.; Elshemy, M.; Zeidan, B. Water quality monitoring of Lake Burullus (Egypt) using Landsat satellite imageries. Environ. Sci. Pollut. Res. 2021, 28, 15687–15700. [Google Scholar] [CrossRef]
  10. Tian, S.; Guo, H.; Xu, W.; Zhu, X.; Wang, B.; Zeng, Q.; Mai, Y.; Huang, J.J. Remote sensing retrieval of inland water quality parameters using Sentinel-2 and multiple machine learning algorithms. Environ. Sci. Pollut. Res. 2022, 30, 18617–18630. [Google Scholar] [CrossRef] [PubMed]
  11. Yang, H.; Du, Y.; Zhao, H.; Chen, F. Water quality Chl-a inversion based on spatio-temporal fusion and convolutional neural network. Remote Sens. 2022, 14, 1267. [Google Scholar] [CrossRef]
  12. Aptoula, E.; Ariman, S. Chlorophyll-a retrieval from sentinel-2 images using convolutional neural network regression. IEEE Geosci. Remote Sens. Lett. 2021, 19, 1–5. [Google Scholar] [CrossRef]
  13. Torres-Bejarano, F.; Arteaga-Hernández, F.; Rodríguez-Ibarra, D.; Mejía-Ávila, D.; González-Márquez, L. Water quality assessment in a wetland complex using Sentinel 2 satellite images. Int. J. Environ. Sci. Technol. 2021, 18, 2345–2356. [Google Scholar] [CrossRef]
  14. Peterson, K.T.; Sagan, V.; Sloan, J.J. Deep learning-based water quality estimation and anomaly detection using Landsat-8/Sentinel-2 virtual constellation and cloud computing. GISci. Remote Sens. 2020, 57, 510–525. [Google Scholar] [CrossRef]
  15. Li, N.; Ning, Z.; Chen, M.; Wu, D.; Hao, C.; Zhang, D.; Bai, R.; Liu, H.; Chen, X.; Li, W. Satellite and Machine Learning Monitoring of Optically Inactive Water Quality Variability in a Tropical River. Remote Sens. 2022, 14, 5466. [Google Scholar] [CrossRef]
  16. Wu, C.; Wu, J.; Qi, J.; Zhang, L.; Huang, H.; Lou, L.; Chen, Y. Empirical estimation of total phosphorus concentration in the mainstream of the Qiantang River in China using Landsat TM data. Int. J. Remote Sens. 2010, 31, 2309–2324. [Google Scholar] [CrossRef]
  17. Dong, G.; Hu, Z.; Liu, X.; Fu, Y.; Zhang, W. Spatio-temporal variation of total nitrogen and ammonia nitrogen in the water source of the middle route of the South-to-North Water Diversion Project. Water 2020, 12, 2615. [Google Scholar] [CrossRef]
  18. Izadi, M.; Sultan, M.; Kadiri, R.E.; Ghannadi, A.; Abdelmohsen, K. A remote sensing and machine learning-based approach to forecast the onset of harmful algal bloom. Remote Sens. 2021, 13, 3863. [Google Scholar] [CrossRef]
  19. Yang, H.; Kong, J.; Hu, H.; Du, Y.; Gao, M.; Chen, F. A review of remote sensing for Water Quality Retrieval: Progress and challenges. Remote Sens. 2022, 14, 1770. [Google Scholar] [CrossRef]
  20. Mishra, V.; Avtar, R.; Prathiba, A.; Mishra, P.K.; Tiwari, A.; Sharma, S.K.; Singh, C.H.; Chandra Yadav, B.; Jain, K. Uncrewed Aerial Systems in Water Resource Management and Monitoring: A Review of Sensors, Applications, Software, and Issues. Adv. Civ. Eng. 2023, 2023, 3544724. [Google Scholar] [CrossRef]
  21. Sibanda, M.; Mutanga, O.; Chimonyo, V.G.; Clulow, A.D.; Shoko, C.; Mazvimavi, D.; Dube, T.; Mabhaudhi, T. Application of drone technologies in surface water resources monitoring and assessment: A systematic review of progress, challenges, and opportunities in the global south. Drones 2021, 5, 84. [Google Scholar] [CrossRef]
  22. Su, T.-C.; Chou, H.-T. Application of multispectral sensors carried on unmanned aerial vehicle (UAV) to trophic state mapping of small reservoirs: A case study of Tain-Pu reservoir in Kinmen, Taiwan. Remote Sens. 2015, 7, 10078–10097. [Google Scholar] [CrossRef] [Green Version]
  23. Flynn, K.F.; Chapra, S.C. Remote sensing of submerged aquatic vegetation in a shallow non-turbid river using an unmanned aerial vehicle. Remote Sens. 2014, 6, 12815–12836. [Google Scholar] [CrossRef] [Green Version]
  24. Su, T.-C. A study of a matching pixel by pixel (MPP) algorithm to establish an empirical model of water quality mapping, as based on unmanned aerial vehicle (UAV) images. Int. J. Appl. Earth Obs. Geoinf. 2017, 58, 213–224. [Google Scholar] [CrossRef]
  25. Chen, B.; Mu, X.; Chen, P.; Wang, B.; Choi, J.; Park, H.; Xu, S.; Wu, Y.; Yang, H. Machine learning-based inversion of water quality parameters in typical reach of the urban river by UAV multispectral data. Ecol. Indic. 2021, 133, 108434. [Google Scholar] [CrossRef]
  26. Xiao, Y.; Guo, Y.; Yin, G.; Zhang, X.; Shi, Y.; Hao, F.; Fu, Y. UAV Multispectral Image-Based Urban River Water Quality Monitoring Using Stacked Ensemble Machine Learning Algorithms—A Case Study of the Zhanghe River, China. Remote Sens. 2022, 14, 3272. [Google Scholar] [CrossRef]
  27. Wu, D.; Jiang, J.; Wang, F.; Luo, Y.; Lei, X.; Lai, C.; Wu, X.; Xu, M. Retrieving Eutrophic Water in Highly Urbanized Area Coupling UAV Multispectral Data and Machine Learning Algorithms. Water 2023, 15, 354. [Google Scholar] [CrossRef]
  28. Zhao, X.; Li, Y.; Chen, Y.; Qiao, X.; Qian, W. Water Chlorophyll a Estimation Using UAV-Based Multispectral Data and Machine Learning. Drones 2023, 7, 2. [Google Scholar] [CrossRef]
  29. Ying, H.; Xia, K.; Huang, X.; Feng, H.; Yang, Y.; Du, X.; Huang, L. Evaluation of water quality based on UAV images and the IMP-MPP algorithm. Ecol. Inform. 2021, 61, 101239. [Google Scholar] [CrossRef]
  30. Wang, F.; Hu, H.; Luo, Y.; Lei, X.; Wu, D.; Jiang, J. Monitoring of Urban Black-Odor Water Using UAV Multispectral Data Based on Extreme Gradient Boosting. Water 2022, 14, 3354. [Google Scholar] [CrossRef]
  31. Cillero Castro, C.; Domínguez Gómez, J.A.; Delgado Martín, J.; Hinojo Sánchez, B.A.; Cereijo Arango, J.L.; Cheda Tuya, F.A.; Díaz-Varela, R. An UAV and satellite multispectral data approach to monitor water quality in small reservoirs. Remote Sens. 2020, 12, 1514. [Google Scholar] [CrossRef]
  32. Ma, R.; Yang, G.; Duan, H.; Jiang, J.; Wang, S.; Feng, X.; Li, A.; Kong, F.; Xue, B.; Wu, J.; et al. China’s lakes at present: Number, area and spatial distribution. Sci. China Earth Sci. 2011, 41, 394–401. [Google Scholar] [CrossRef]
  33. P4 Multispectral Image Processing Guide. Available online: https://dl.djicdn.com/downloads/p4-multispectral/20200717/P4_Multispectral_Image_Processing_Guide_EN.pdf (accessed on 18 February 2023).
  34. Guo, Y.; Senthilnath, J.; Wu, W.; Zhang, X.; Zeng, Z.; Huang, H. Radiometric calibration for multispectral camera of different imaging conditions mounted on a UAV platform. Sustainability 2019, 11, 978. [Google Scholar] [CrossRef] [Green Version]
  35. ArcGis Pro 2.8. Available online: https://pro.arcgis.com/ (accessed on 5 January 2023).
  36. Pu, F.; Ding, C.; Chao, Z.; Yu, Y.; Xu, X. Water-quality classification of inland lakes using Landsat8 images by convolutional neural networks. Remote Sens. 2019, 11, 1674. [Google Scholar] [CrossRef] [Green Version]
  37. Wang, L.; Yue, X.; Wang, H.; Ling, K.; Liu, Y.; Wang, J.; Hong, J.; Pen, W.; Song, H. Dynamic inversion of inland aquaculture water quality based on UAVs-WSN spectral analysis. Remote Sens. 2020, 12, 402. [Google Scholar] [CrossRef] [Green Version]
  38. Lu, Q.; Si, W.; Wei, L.; Li, Z.; Xia, Z.; Ye, S.; Xia, Y. Retrieval of water quality from UAV-borne hyperspectral imagery: A comparative study of machine learning algorithms. Remote Sens. 2021, 13, 3928. [Google Scholar] [CrossRef]
  39. He, Y.; Gong, Z.; Zheng, Y.; Zhang, Y. Inland reservoir water quality inversion and eutrophication evaluation using BP neural network and remote sensing imagery: A case study of Dashahe reservoir. Water 2021, 13, 2844. [Google Scholar] [CrossRef]
  40. Breiman, L. Random forests. Mach. Learn. 2001, 45, 5–32. [Google Scholar] [CrossRef] [Green Version]
  41. Elith, J.; Leathwick, J.R.; Hastie, T. A working guide to boosted regression trees. J. Anim. Ecol. 2008, 77, 802–813. [Google Scholar] [CrossRef]
  42. Gholizadeh, M.H.; Melesse, A.M.; Reddi, L. A comprehensive review on water quality parameters estimation using remote sensing techniques. Sensors 2016, 16, 1298. [Google Scholar] [CrossRef] [PubMed] [Green Version]
  43. Niu, C.; Tan, K.; Jia, X.; Wang, X. Deep learning based regression for optically inactive inland water quality parameter estimation using airborne hyperspectral imagery. Environ. Pollut. 2021, 286, 117534. [Google Scholar] [CrossRef] [PubMed]
  44. Ahmed, M.; Mumtaz, R.; Anwar, Z.; Shaukat, A.; Arif, O.; Shafait, F. A multi–step approach for optically active and inactive water quality parameter estimation using deep learning and remote sensing. Water 2022, 14, 2112. [Google Scholar] [CrossRef]
  45. Chu, H.-J.; He, Y.-C.; Chusnah, W.N.U.; Jaelani, L.M.; Chang, C.-H. Multi-reservoir water quality mapping from remote sensing using spatial regression. Sustainability 2021, 13, 6416. [Google Scholar] [CrossRef]
  46. Petus, C.; Chust, G.; Gohin, F.; Doxaran, D.; Froidefond, J.-M.; Sagarminaga, Y. Estimating turbidity and total suspended matter in the Adour River plume (South Bay of Biscay) using MODIS 250-m imagery. Cont. Shelf Res. 2010, 30, 379–392. [Google Scholar] [CrossRef] [Green Version]
  47. Pahlevan, N.; Smith, B.; Alikas, K.; Anstee, J.; Barbosa, C.; Binding, C.; Bresciani, M.; Cremella, B.; Giardino, C.; Gurlin, D. Simultaneous retrieval of selected optical water quality indicators from Landsat-8, Sentinel-2, and Sentinel-3. Remote Sens. Environ. 2022, 270, 112860. [Google Scholar] [CrossRef]
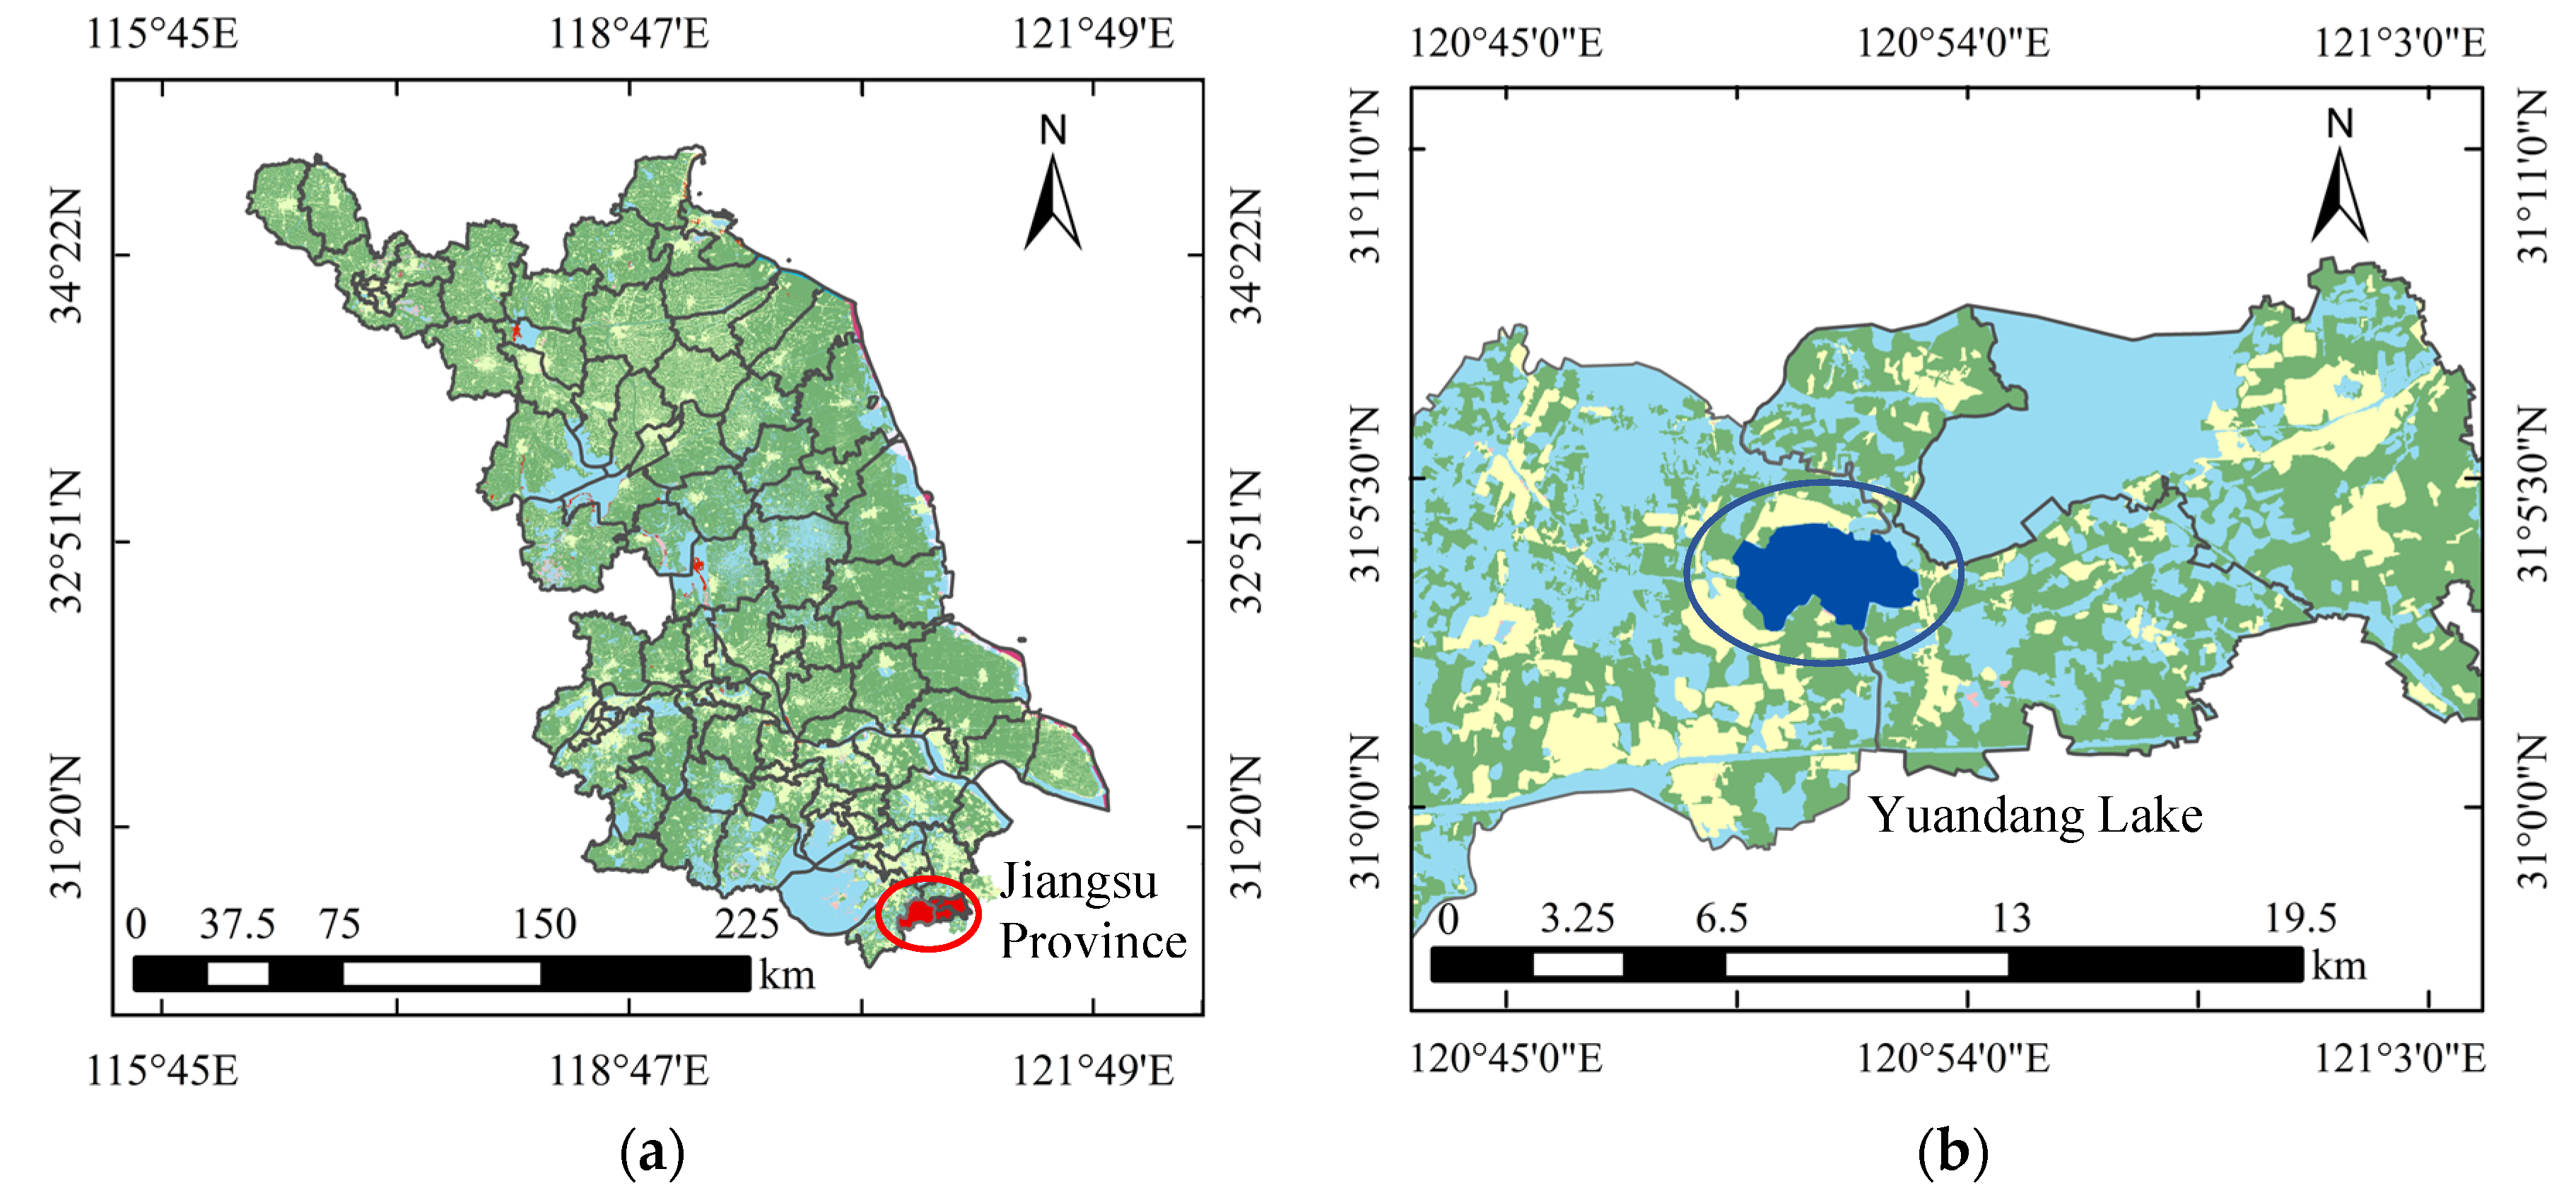
Figure 1. Geography location of Yuandang Lake: (a) Jiangsu Province in China; (b) Yuandang Lake; (c) Satellite image of Yuandang Lake.
Drones 07 00244 g001aDrones 07 00244 g001b
Figure 2. Set of calibration plate images captured using DJI P4 Multispectral UAV: (a) RGB image; (b) Blue band image; (c) Green band image; (d) Red band image; (e) Red edge band image; (f) NIR band image.
Drones 07 00244 g002
Figure 3. Water quality sonde data collection route.
Drones 07 00244 g003
Figure 4. Water sampling locations.
Drones 07 00244 g004
Figure 5. Data processing workflow.
Drones 07 00244 g005
Figure 6. Stacked multispectral bands image of lakeside: (a) Before correction; (b) After correction.
Drones 07 00244 g006
Figure 7. Panoramic image of Yuandang Lake.
Drones 07 00244 g007
Figure 8. CNN model architecture.
Drones 07 00244 g008
Figure 9. Pearson Correlation of water parameters NH3-N, TP, and CODMn with 84 spectral indices.
Drones 07 00244 g009
Figure 10. Pearson Correlation of water parameters temperature, DO, and EC with 84 spectral indices.
Drones 07 00244 g010
Figure 11. Pearson Correlation of water parameters pH, Turbidity, BGA, and Chl-a with 84 spectral indices.
Drones 07 00244 g011
Table 1. DJI P4 multispectral camera band and wavelength.
BandWavelength Range (nm)
Blue (B1)450 ± 16
Green (B2)560 ± 16
Red (B3)650 ± 16
Red Edge (B4)730 ± 16
Near Infrared (B5)840 ± 16
Table 2. Band indices calculation.
IndexFormulaIndexFormulaIndexFormula
S1B1S30 B 2 / B 1 S59 ( B 4     B 3 ) / ( B 4 + B 3 )
S2B2S31 B 2 / B 3 S60 ( B 5     B 3 ) / ( B 5 + B 3 )
S3B3S32 B 2 / B 4 S61 ( B 5     B 3 ) / ( B 1 + B 2 )
S4B4S33 B 2 / B 5 S62 ( B 1     B 3 ) / B 2
S5B5S34 B 3 / B 1 S63 1 . 67     3 . 94   ×   ln ( B 1 ) + 3 . 78   ×   ln ( B 2 )
S6 B 1     B 2 S35 B 3 / B 2 S64 ( ( B 5     B 3 ) / ( B 5 + B 3 ) )   ×   ( B 5 / B 3 )
S7 B 1     B 3 S36 B 3 / B 4 S65 2 × B 3     B 2   B 1     1 . 4   ×   B 2     B 3
S8 B 1     B 4 S37 B 3 / B 5 S66 ( B 5     ( B 3 + B 2 ) / 2 ) / ( B 5 + ( B 3 + B 2 ) / 2 )
S9 B 1     B 5 S38 B 4 / B 1 S67 ( B 2     B 1 ) / ( B 2 + B 1 )
S10 B 2     B 3 S39 B 4 / B 2 S68 ( B 2 2   B 3   ×   B 1 ) / ( B 2 2 + B 3   ×   B 1 )
S11 B 2     B 4 S40 B 4 / B 3 S69 ( B 5 / B 4 )     1
S12 B 2     B 5 S41 B 4 / B 5 S70 B 2     B 3 / B 2 + B 2     B 1
S13 B 3     B 4 S42 B 5 / B 1 S71 ( 2   ×   B 2     B 3     B 1 ) / ( 2   ×   B 2 + B 3 + B 1 )
S14 B 3     B 5 S43 B 5 / B 2 S72 B 2 / ( B 3 a   ×   B 1 1 a )   a = 0 . 667
S15 B 4     B 5 S44 B 5 / B 3 S73 ( B 2 2   B 1 2 ) / ( B 2 2 + B 1 2 )
S16 B 1 + B 2 S45 B 5 / B 4 S74 ( 2.5 × ( B 5   B 3 ) ) / ( B 5 + 2.4 ×   B 3 + 1 )
S17 B 1 + B 3 S46 ( B 1     B 2 ) / ( B 1 + B 2 ) S75 ( B 5     B 1 ) / ( B 5 + B 1 )
S18 B 1 + B 4 S47 ( B 1     B 3 ) / ( B 1 + B 3 ) S76 0 . 441   ×   B 3     0 . 881   ×   B 2 + 0 . 385   ×   B 1 + 18 . 787
S19 B 1 + B 5 S48 ( B 1     B 4 ) / ( B 1 + B 4 ) S77 ( B 5 + B 2     2   ×   B 1 ) / ( B 5 + B 2 + 2   ×   B 1 )
S20 B 2 + B 3 S49 ( B 1     B 5 ) / ( B 1 + B 5 ) S78 2   ×   B 2     B 3     B 1
S21 B 2 + B 4 S50 ( B 2     B 3 ) / ( B 2 + B 3 ) S79 ( B 5 / B 2 )     1
S22 B 2 + B 5 S51 ( B 2     B 4 ) / ( B 2 + B 4 ) S80 ( B 5     B 2 ) / ( B 5 + B 2 )
S23 B 3 + B 4 S52 ( B 2     B 5 ) / ( B 2 + B 5 ) S81 ( B 1     B 3 ) / B 2
S24 B 3 + B 5 S53 ( B 3     B 4 ) / ( B 3 + B 4 ) S82 ( ( B 5 / B 4 )     1 ) / ( ( B 5 / B 4 ) + 1 )
S25 B 4 + B 5 S54 ( B 3     B 5 ) / ( B 3 + B 5 ) S83 ( ( B 5 / B 3 )     1 ) / ( ( B 5 / B 3 ) + 1 )
S26 B 1 / B 2 S55 ( B 4     B 5 ) / ( B 4 + B 5 ) S84 ( B 5     B 4 ) / ( B 5 + B 4 )
S27 B 1 / B 3 S56 ( B 2     B 1 ) / ( B 2 + B 1 )
S28 B 1 / B 4 S57 ( B 3 1   B 4 1 )   ×   B 5
S29 B 1 / B 5 S58 ( B 3 1   B 4 1 )
Table 3. Statistical analysis of water samples measurements data of three days. N represents the number of sampling points. Units are mg/L.
Date NH3-N (mg/L)TP (mg/L)CODMn (mg/L)
5 August 2022
(N = 20)
Max1.14990.16947.5345
Min0.58090.08156.8058
Mean0.79670.12277.1573
SD0.15120.02500.2098
8 August 2022
(N = 20)
Max1.08330.16325.9810
Min0.40370.06763.4296
Mean0.71280.12015.3174
SD0.17580.02980.5582
10 August 2022
(N = 20)
Max0.72090.19866.3950
Min0.26580.10165.3114
Mean0.41480.149986.0241
SD0.12110.034130.3031
All dataMax1.14990.19867.5345
Min0.26580.06763.4296
Mean0.63940.13086.1657
SD0.22350.03330.8656
Table 4. Statistical analysis of continuous water quality measurement data of three days. N represents the number of sampling points.
Date Chl-a (ug/L)BGA (ug/L)Turbidity (NTU)pHNC (uS/cm)DO (mg/L)Temperature (°C)
5 August 2022
(N = 1519)
Max64.08089.330412.0009.980738.0009.04039.061
Min0.4800.2704.8507.93012.0005.93032.654
Mean13.75312.286140.6319.004591.2147.68735.504
SD10.05512.91998.0380.31765.7260.6831.522
8 August 2022
(N = 1767)
Max38.30021.63065.5509.140678.00012.88033.497
Min1.8402.56016.9907.8906.2005.28031.473
Mean8.7697.22433.8898.738609.1499.23932.611
SD3.9482.8528.6080.23865.0021.4100.441
10 August 2022
(N = 1546)
Max88.33078.710119.2609.610707.00019.07034.925
Min1.2801.00011.8908.1306.3005.03030.839
Mean14.90812.23937.5038.923630.2939.30533.197
SD11.41011.48116.6590.29452.0321.8670.939
All dataMax88.33089.330412.0009.980738.00019.07039.061
Min0.4800.2704.8507.8906.2005.03030.839
Mean12.30010.42068.6008.881610.2768.77233.708
SD9.30010.17274.2790.30463.3311.5901.618
Table 5. Multivariate regression results between multispectral band-derived features and the corresponding water quality data of NH3-N, TP, COD, Chl-a and BGA.
NH3-N (mg/L)TP (mg/L)CODMn (mg/L)Chl-a (ug/L)BGA (ug/L)
RFTrainingR20.87980.88520.95260.90470.9271
RMSE0.05450.00780.16050.82720.6244
TestingR20.51040.4454 *0.7777 *0.3330 *0.4312
RMSE0.12110.0158 *0.3038 *2.2747 *1.7475
MAE0.09620.0123 *0.2478 *1.6845 *1.2739
GBTrainingR20.84210.79080.94540.64630.7322
RMSE0.06370.01050.16051.60111.2086
TestingR20.5460 *0.32050.73510.31930.4468
RMSE0.1204 *0.01620.41922.13011.6738
MAE0.0904 *0.01100.36411.59291.2613
BPTrainingR20.27680.35980.65100.25170.5772
RMSE0.13290.01910.43503.67432.5188
TestingR20.14740.28710.76070.20600.5160 *
RMSE0.14810.01540.32953.94912.5766 *
MAE0.11410.01320.25502.80761.8558 *
CNNTrainingR20.27680.29530.66620.20290.4984
RMSE0.13290.01960.42273.90362.6807
TestingR20.14750.28410.63970.19320.4331
RMSE0.14810.01770.38623.64362.9746
MAE0.11420.01410.30662.66922.0371
* Highlighted in bold and underlined are the best model results on test dataset.
Table 6. Multivariate regression results between multispectral band-derived features and the corresponding water quality data of Turbidity, pH, NC, DO and temperature.
Turbidity (NTU)pHNC (uS/cm)DO (mg/L)Temperature (°C)
RFTrainingR20.90900.95960.94260.95720.9592
RMSE19.59340.03824.56060.21950.2096
TestingR20.34030.7262 *0.6449 *0.6728 *0.7071
RMSE55.88280.0997 *11.1834 *0.6157 *0.5648
MAE27.39250.0670 *7.6322 *0.4104 *0.3430
GBTrainingR20.80140.83470.77440.83340.9061
RMSE28.78070.07589.04320.44250.4625
TestingR20.30400.67060.58640.61610.7547 *
RMSE58.73290.111112.06920.67450.7402 *
MAE30.63180.08088.66390.48470.4783 *
BPTrainingR20.36090.68190.49240.58770.6807
RMSE52.13330.107324.61380.99550.8015
TestingR20.31270.63830.44690.54340.6359
RMSE55.58920.114028.06321.07630.8228
MAE31.20540.083118.17430.74400.5692
CNNTrainingR20.39250.31570.41410.41960.4397
RMSE48.46310.157027.76551.17961.0511
TestingR20.3433 *0.35470.40330.37580.3792
RMSE50.3219 *0.152928.31781.26411.1083
MAE27.2034 *0.120317.69180.94370.7495
* Highlighted in bold and underlined are the best model results on test dataset.
Table 7. Comparison of regression results with other studies.
ParametersModelsSourceR2RMSE
CODMnRFOur study0.778 *0.304 *
BP-RF[26]0.2700.770
TPRFOur study0.4450.016
BP[26]0.4300.053
GA_XGBoost[25]0.699 *0.034 *
NH3-NGBOur study0.5460.120
GA_XGBoost[25]0.694 *0.163 *
TurbidityGBOur study0.34350.322
GA_XGBoost[25]0.597 *10.127 *
Chl-aRFOur study0.3332.274
RF-XGB[26]0.5001.770
GA_XGBoost[25]0.855 *0.046 *
CNN[28]0.7908.770
* Highlighted in bold are the best model results.
Disclaimer/Publisher’s Note: The statements, opinions and data contained in all publications are solely those of the individual author(s) and contributor(s) and not of MDPI and/or the editor(s). MDPI and/or the editor(s) disclaim responsibility for any injury to people or property resulting from any ideas, methods, instructions or products referred to in the content.