Review

Drones for Flood Monitoring, Mapping and Detection: A Bibliometric Review

1
SMART Infrastructure Facility, University of Wollongong, Wollongong 2500, Australia
2
Independent Researcher, Sydney 2000, Australia
3
NVIDIA, Santa Clara, CA 95051, USA
4
Australian Urban Research Infrastructure Network (AURIN), University of Melbourne, Melbourne 3000, Australia
*
Author to whom correspondence should be addressed.
Drones 2023, 7(1), 32; https://doi.org/10.3390/drones7010032
Submission received: 5 December 2022 / Revised: 23 December 2022 / Accepted: 27 December 2022 / Published: 1 January 2023
(This article belongs to the Special Issue Drones for Natural Hazards)

Abstract

:
Floods are one of the most often occurring and damaging natural hazards. They impact the society on a massive scale and result in significant damages. To reduce the impact of floods, society needs to keep benefiting from the latest technological innovations. Drones equipped with sensors and latest algorithms (e.g., computer vision and deep learning) have emerged as a potential platform which may be useful for flood monitoring, mapping and detection activities in a more efficient way than current practice. To better understand the scope and recent trends in the domain of drones for flood management, we performed a detailed bibliometric analysis. The intent of performing the bibliometric analysis waws to highlight the important research trends, co-occurrence relationships and patterns to inform the new researchers in this domain. The bibliometric analysis was performed in terms of performance analysis (i.e., publication statistics, citations statistics, top publishing countries, top publishing journals, top publishing institutions, top publishers and top Web of Science (WoS) categories) and science mapping (i.e., citations by country, citations by journals, keyword co-occurrences, co-authorship, co-citations and bibliographic coupling) for a total of 569 records extracted from WoS for the duration 2000–2022. The VOSviewer open source tool has been used for generating the bibliographic network maps. Subjective discussions of the results explain the obtained trends from the bibliometric analysis. In the end, a detailed review of top 28 most recent publications was performed and subjected to process-driven analysis in the context of flood management. The potential active areas of research were also identified for future research in regard to the use of drones for flood monitoring, mapping and detection activities.

1. Introduction

Floods are among the most devastating and frequently occurring natural hazards, mainly because of the associated damages and mass-scale community impacts [1,2,3]. Some highlighted damages caused by flooding include structural damage, agricultural damage, relocation of communities and loss of human life [4,5]. The recent increase in flooding events is often attributed to climate change and global warming causing intense and prolonged rainfalls [1,6]. However, the increased damages due to flooding events are associated with human-induced factors, such as exponential population growth, unplanned urbanization and inefficient flood management [7,8]. Among the above-mentioned factors, efficient flood management is considered significant in reducing the impacts of floods. Towards improving the existing flood-management mechanisms, it has become inevitable to benefit from the latest technological advancements.
Drones, also known as unmanned aerial vehicles (UAVs), are increasingly being used in a variety of scientific domains to collect data and perform tasks that would be difficult or impossible for humans to do [9,10,11]. Drones have applications in multiple scientific domains, such as agriculture (e.g., crops monitoring [12], detecting diseases [13], mapping fields for optimized fertilization and irrigation [14,15]), environmental science (e.g., wildlife monitoring [16,17], forest health assessment [18], water quality monitoring [19], air quality monitoring [20]), oceanography (e.g., marine life monitoring [21], monitoring of ocean currents and tides [22]), archaeology (e.g., detailed site mapping [23], hidden structure identification [24]) and disaster response (e.g., damage assessments [25], victim identification [26], boundary identification [27], quick extent mapping [28]). In the context of flood management, drones are reported to be one of the technology-oriented platforms which could significantly assist many activities, specifically monitoring, mapping and detection [1,9,29]. In the recent past, drone technology has exponentially progressed with the availability of efficient sensing hardware, commercialization and ease of access. A small-to-medium drone fully equipped with advanced sensors (e.g., camera, Light Detection and Ranging (LiDAR), infrared (IR) heat sensor), edge-computing hardware (e.g., NVIDIA) and state-of-the-art artificial intelligence (AI) algorithms can serve as an efficient tool to assist monitoring, mapping and detection for flood-management activities. A few highlighted flood-management activities that may benefit from drone technology include flood inundation mapping [30,31], flood-damage mapping [31,32], surface-water detection [19,33], flood-boundary identification [34,35] and flood-victim identification [36]. Overall, drones have proven to be an efficient on-demand tool with the advantages of low cost, high safety and robustness from a flood-management perspective [9]. However, the flood-management domain is yet to explore the full potential of drone technology; therefore, this domain presents a huge opportunity for future research.
According to its definition, the branch of study known as “bibliometrics” involves scholars analysing bibliographic records (i.e., published literature) using various statistical and mathematical techniques in order to spot significant trends and patterns [37,38,39,40]. Bibliometric studies are a type of research that uses quantitative methods to analyse and measure the impact and influence of publications. These studies typically aim to identify patterns and trends in the production, distribution and reception of knowledge, and to evaluate the relative importance and impact of different bibliographic factors (e.g., citations, authors, institutions, journals) [37,38]. One of the key aims of bibliometric studies is to provide a systematic and objective assessment of the state of a particular field of research. This is achieved by measuring the quantity and quality of relevant publications, and the extent to which they are cited and used by other scholars. This can help researchers, policy makers and funding agencies to identify areas of strength and weakness, and to make informed decisions about the allocation of resources and support. Another aim of bibliometric studies is to identify emerging trends and areas of growth in a field, by analyzing the changing patterns of publication and citation over time. This can help researchers to identify new opportunities and challenges, and to stay up-to-date with the latest developments in their field. Bibliometric studies can also be used to assess the impact and reach of individual publications, authors and institutions, by measuring the number of citations they receive, the journals in which they are published and the countries and institutions where they are cited. This can help researchers to evaluate their own work and to identify opportunities for collaboration and networking with other scholars [39,40]. Further, organizations can utilize this type of analysis to make decisions and evaluate the effectiveness of particular institutions, countries and periodicals. The VOSviewer [41], BibExcel [42], CiteSpace [43] and Bibliometrix [44] are some of the highlighted software tools used by the researchers to perform the bibliometric analysis. Drones have been identified as one of the trending technologies being utilized for flood monitoring and detection due to their capacity to provide an on-demand, larger perspective of the flooded region and map the degree of damage. The performed bibliometric analysis will facilitate the workers dealing with flood management and drone technologies in acquiring the important quantitative trends. Additionally, new researchers will benefit from identifying focal research areas and potential research directions. These evaluations can also help funding agencies identify possible institutions and locations where research in this topic should be fostered. Motivated by the significance and necessity of such an analysis, this work presents a comprehensive bibliometric review of the literature concerning the use of drone technology for flood monitoring, mapping and detection.
The main objective of the performed bibliometric analysis is to highlight and understand the significant research trends in the context of using of drones for flood monitoring, mapping and detection activities. To achieve this objective, this paper presents performance analysis (i.e., publication statistics, citations statistics, top publishing countries, top publishing journals, top publishing institutions, top publishers, top Web of Science (WoS) categories) and science mapping (i.e., citations by country, citations by journals, keyword co-occurrences, co-authorship, co-citations, bibliographic coupling) for relevant bibliographic records extracted from the WoS database. The article is organized as follows: 
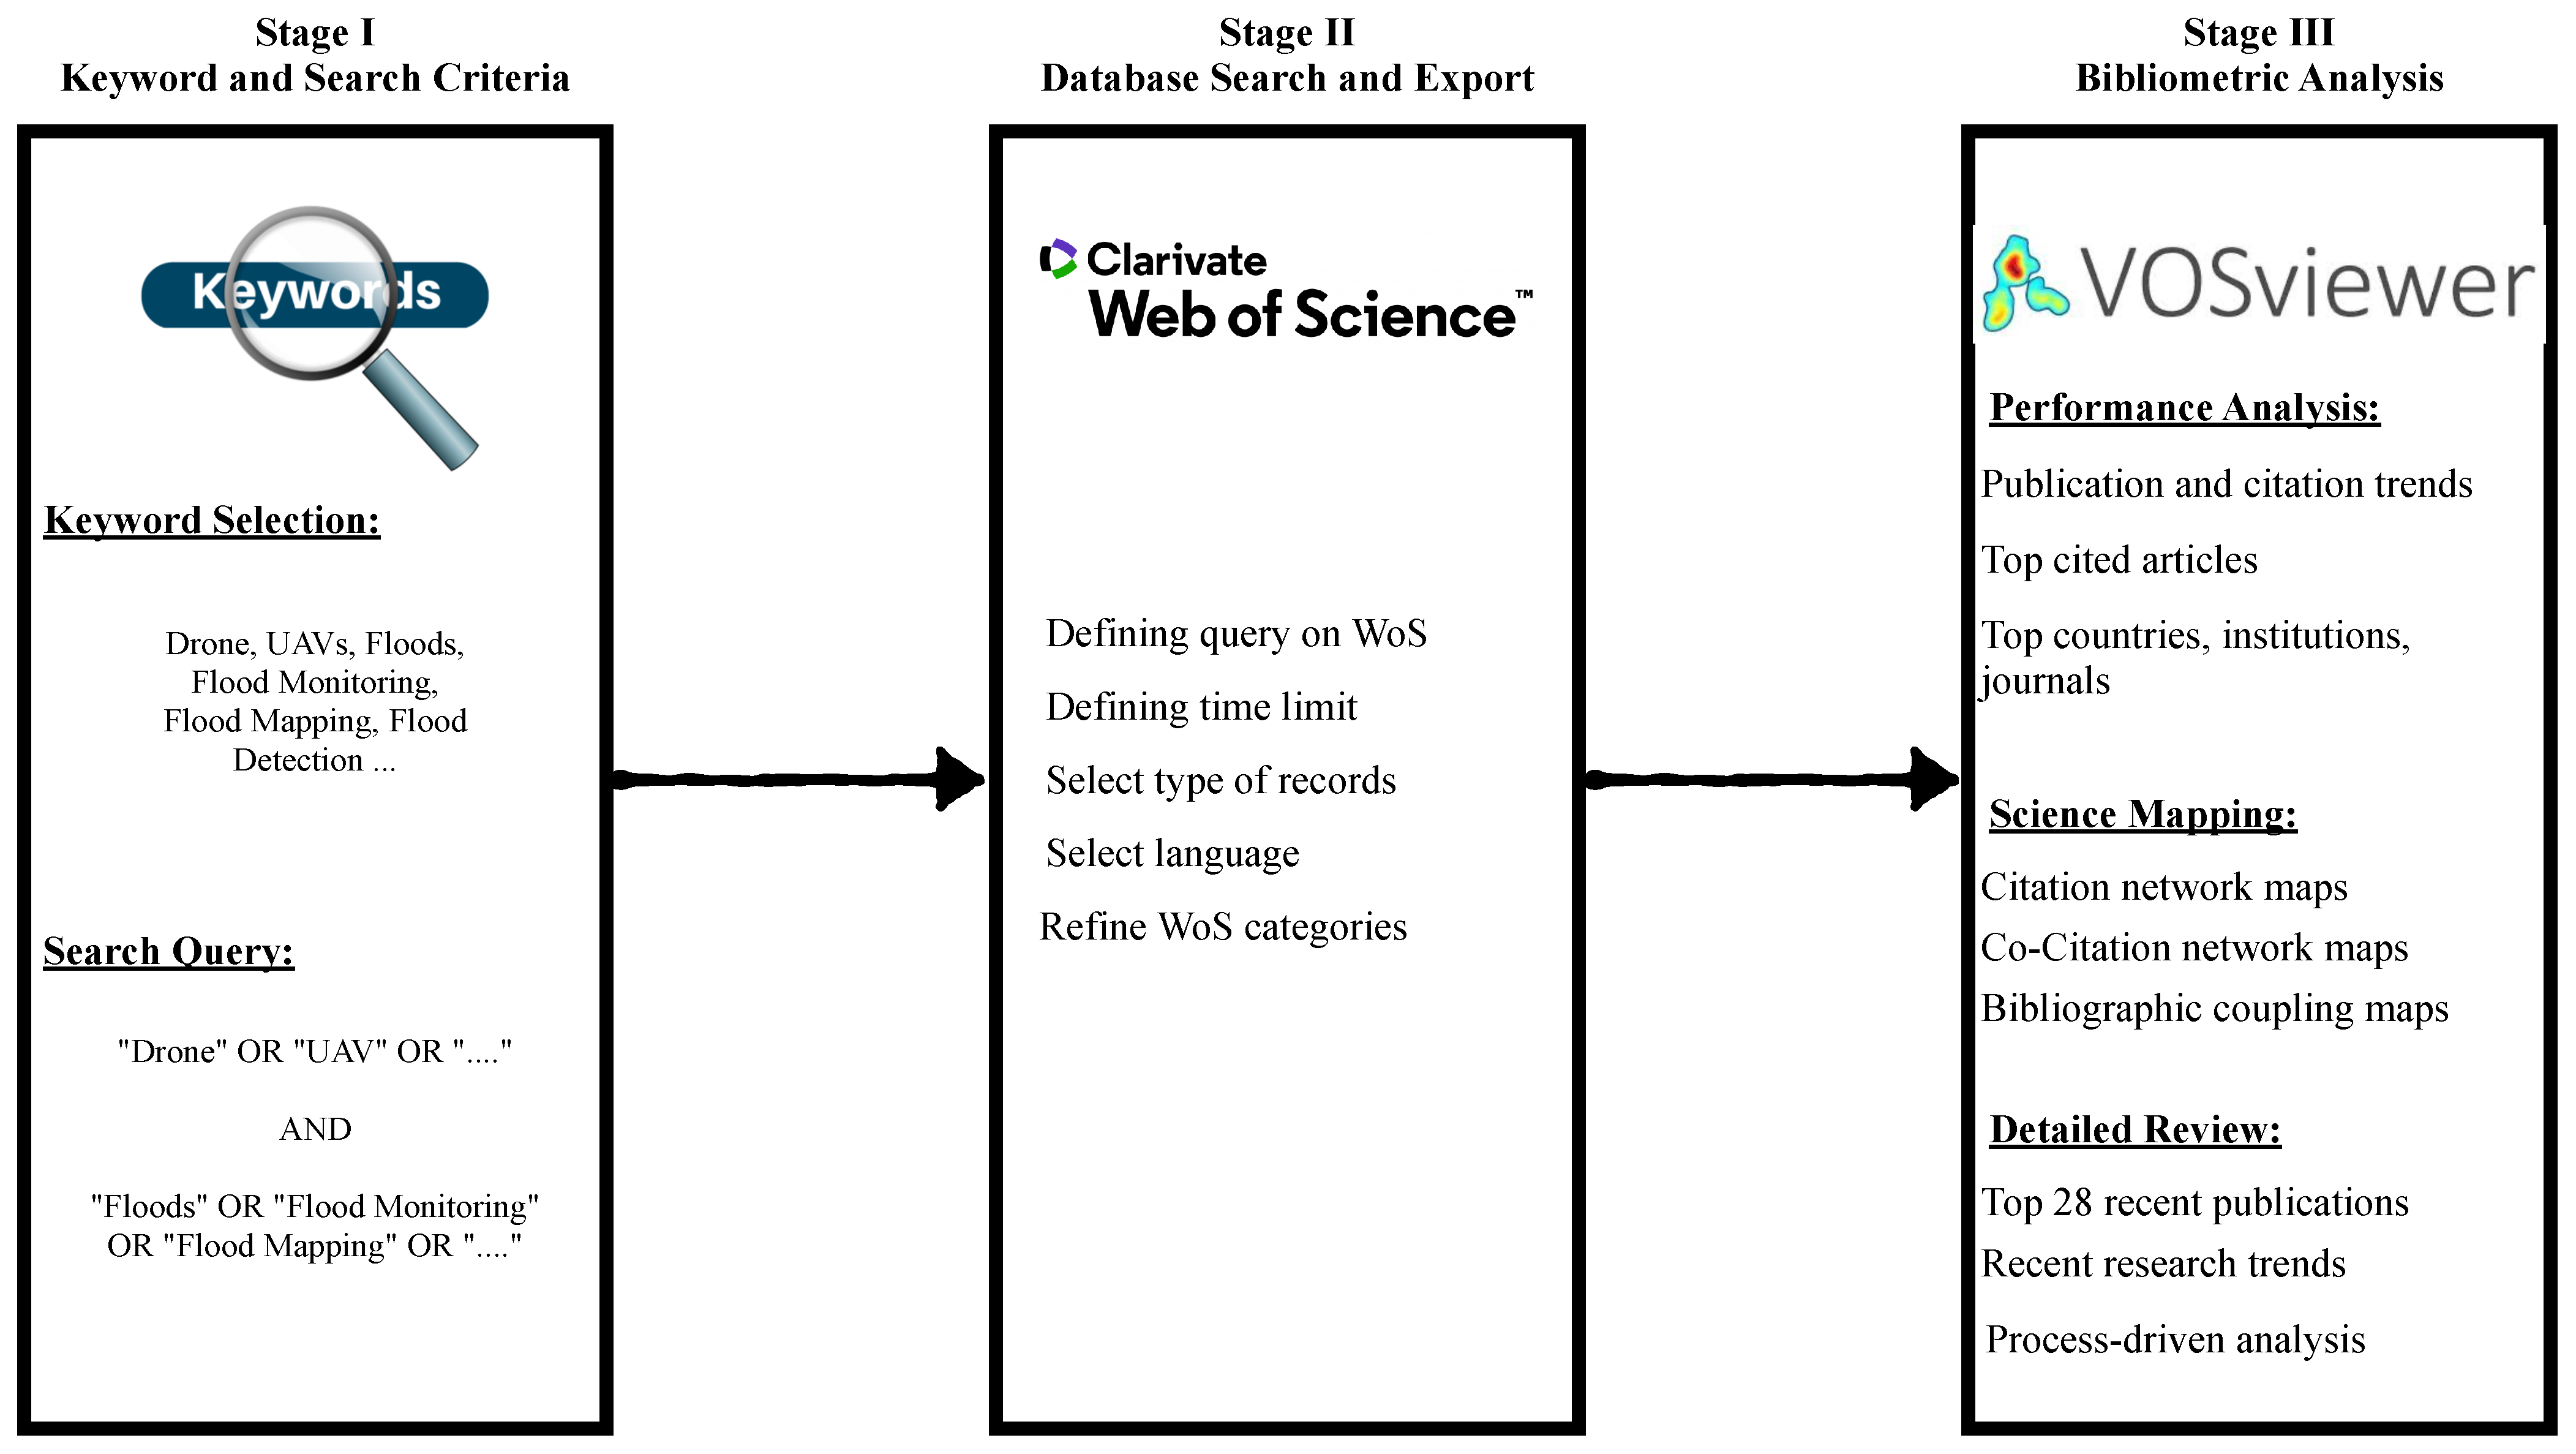
Section 2 provides the information about the research approach, materials and methods used to conduct the bibliometric analysis. Section 3 is the core of this manuscript, which presents the detailed bibliometric analysis in terms of performance analysis and science mapping. Section 4 outlines the important insights that emerged from the bibliometric analysis and includes the subjective discussions on the results. Section 5 presents the process-driven review of recent literature to evaluate the research in line with the flood-management activities. Finally, Section 6 concludes the study and summarizes the outcomes of the study. Furthermore, potential limitations and future research directions are also highlighted.

2. Materials and Methods

We adopted a three-stage standard approach (see Figure 1) for performing the presented bibliometric analysis based on the relevant literature [37,39,45,46]. The three stages involved in the process include (a) keyword and search criteria (b) database search and export (c) bibliometric analysis. Each stage is discussed in detail as follows:
  • Stage I: Keyword and Search Criteria: A series of research questions were formulated (see Table 1) relating to the use of drones for flood monitoring, mapping and detection. Based on the formulated research questions, a range of keywords were identified and a search query was developed to extract the relevant literature from the database. Furthermore, search criteria were defined at the first stage to define the scope of study. For the performed bibliometric analysis, only English-language literature from 2000 till 2022 was considered.
“Flood” OR “Flooding” OR “Floods” OR “Flood Detection” OR “Flood Monitoring”
OR “Flood Mapping” OR “Water Mapping” OR “Surface Water Detection”
AND
“Drone” OR “Drones” OR “Unmanned Aerial Vehicle” OR “UAV” OR “Unmanned
Aerial System” OR “UAS”.
  • Stage II: Database Search and Export: At the second stage, first, a database was identified and searched against the defined keyword query. For this research, we used the WoS database, which is one of the most comprehensive in the sciences and engineering domain. Bboth the WoS and Scopus are considered useful for performing bibliometric analysis; however, there are some key differences which influence the choice. One key difference is the scope of coverage by each database. WoS includes a carefully curated selection of high-quality, peer-reviewed literature, and Scopus covers a broader range of journals and other sources, including open access and non-peer-reviewed publications. As a result, there are high chances of having not-related literature entries when using Scopus, which may have a significant impact when the number of bibliographic records are less than 1000. Further, the WoS provides a range of citation-based metrics, such as the impact factor and the h-index, and tools for analyzing the relationships between papers, authors and institutions. Therefore, for the subject bibliometric analysis, we decided to use WoS with the objective of analyzing only high-quality, peer-reviewed literature to get the most significant trends in this domain [47,48,49]. We defined the keyword query on the WoS and applied multiple filters based on the defined search criteria to refine the results. The time limit was defined based on the search criteria (i.e., 2000–2022); the type of records were set to articles, proceedings, review articles and book chapters; language was selected as English; and non-related WoS categories (e.g., economics, plant science, energy fuels, archaeology, mathematics, management, entomology, cybernetics, limnology) were excluded. As a result of the defined research query, in total, 561 literature records were extracted (dated 23 August 2022) and were exported to be analyzed using the bibliometric analysis tools.
  • Stage III: Bibliometric Analysis: At the third and final stage, the exported literature records from the WoS were analyzed statistically and graphically. The results are presented as performance analysis (i.e., publication statistics, citations statistics, top publishing countries, top publishing journals, top publishing institutions, top publishers, top WoS categories) and science mapping (i.e., citations by country, citations by journals, keyword co-occurrences, co-authorship, co-citations, bibliographic coupling) to highlight the important bibliometric trends. The performance analysis was prepared using a WoS analysis report and a Microsoft Excel tool; the network maps were generated using the VOSviewer tool (version 1.6.18), which is one of the most commonly used tools reported in recent literature for creating high-quality bibliometric visualizations [50,51,52]. For the maps generated, other than the variations in the thresholds to get a better visualization, default software parameters were used. Finally, to better understand the ongoing research trends, highlight active areas of research and identifying potential future research directions, a detailed literature review of 28 most recent publications was performed. The literature was also analyzed using process-driven framework [53] to assess the research from the flood-management perspective.

3. Results

The literature related to use of drones for flood monitoring, mapping and detection has been bibliometically explored in terms of performance analysis and science mapping. The performance analysis was performed to highlight the statistical trends, and science mappings were plotted to understand the relationships between the literature entries.

3.1. Performance Analysis

The performance analysis part of the bibliometric analysis presents the descriptive quantitative trends of the literature entries. Some highlighted trends reported by the performance analysis include number of publications per year, number of citations per year, top research articles, top contributing countries, top publishing journals, top publishing universities, top publishing publishers and top WoS categories targeted by the researchers [37].

3.1.1. Publications and Citations Statistics

The number of publications and corresponding citations are two prominent factors in quantitatively evaluating the trends of certain technology in a given subject domain. These numbers also suggest the level of attention being given to the topic by the research community. The trends for number of publications and number of citations for the use of drones in flood monitoring, mapping and detection domain are shown in Figure 2. It can be observed that, overall, an increasing trend is reported for both the number of publications and number of citations, an indicator for drone technology emergence within the flood-management domain. Specifically, after 2014, a significant increase can be observed which may be related to innovations in the drone hardware and availability of the drones commercially at an affordable price.
In order to spotlight the most influential topics and authors, a list of the top five most cited publications where drone technology has been reported to be used for the flood monitoring, mapping or detection purposes is presented in Table 2. The most cited article in the list was published by McCabe et al. [54] in 2017 titled The future of Earth Observation in Hydrology; it has a total of 229 citations. The number of citations are at the lower end, which suggests that drones as technology are yet to be explored at their full potential in the context of flood monitoring, mapping and detection.

3.1.2. Top Publishing Countries

Statistics in terms of publications coming from different geographical locations are also important performance measures within bibliometric analysis. A list of countries with most the number of publications in relation to the use of drones for flood monitoring, mapping and detection activities is presented in Table 3. The United States of America (USA) leads the list with 115 publications (19% of the total publications), and China and Italy are second and third best with 14% and 9% contributions.

3.1.3. Top Publishing Journals

To identify the quality of research being published in a certain domain, the journal to which the research is published is an important indicator. A list of top ten journals where most of the research related to use of drones in flood monitoring, mapping and detection domain has been published is presented in Table 4. Remote Sensing, Water and Sensors are reported to be the top journals. Remote Sensing is the top journal with an impact factor of 5.34, and a JCR rank of Q1 suggests the high quality research being published in relation to the use of drones for flood-management-related activities.

3.1.4. Top Publishing Institutions

To identify the top universities and influential research groups involved in performing research related to the use of drones for the flood monitoring, mapping and detection, trends about top publishing institutions are reported (see Table 5). The Polytechnic University of Bucharest and Chinese Academy of Sciences are highlighted as the top two organizations. However, it is important to mention that overall numbers are very low, even for top organizations, which suggests a distributed contribution from different universities with no clear winner.

3.1.5. Top Publishers

The publisher is another important factor in assessing the quality of research in a certain domain, along with the journal. Table 6 lists the top ten publishers which published the most research in relation to the use of drones for flood monitoring, mapping and detection. IEEE, MDPI, Elsevier, Springer Nature and Wiley have been reported as the top publishers. IEEE leads the list with the most publications (i.e., 140), and MDPI is the second on the list with 120 publications. This indicates that research on drones for flood monitoring is often published in the most renowned and authentic publishers.

3.1.6. Top Web of Science Categories

To identify the subject domains targeted by the researchers in publishing the literature related to use of drones for the flood monitoring, mapping and detection, trends in terms of different WoS categories are presented in Table 7. It can be observed that Geosciences, Environmental Sciences and Remote Sensing have been reported as top WoS categories with 166, 132 and 130 publications, respectively.

3.2. Science Mapping

Science mapping enables the structural interactions and connections between literature entries to be seen, towards demonstrating the mutual relationships. Some common relationships to be explored in the science mapping include citation analysis, keyword co-occurrence analysis, co-authorship analysis, co-citation analysis and bibliographic coupling analysis [59,60]. The bibliometric relationships are represented by the network maps generated using the VOSviewer tool. Among the different types of visualizations that VOSviewer can generate are network maps, density maps and overlay maps, which are briefly described as follows [59,60,61]:
  • Network maps are often used to represent the structure and organization of a citation network, or the connections between different publications, authors or institutions. Network maps can be generated using VOSviewer by selecting the appropriate data and mapping variables, and can be customized and tailored to the specific research questions and objectives of the study [61].
  • Density maps are often used to represent the relative importance or influence of different publications, authors or institutions within a field of research. Density maps can help researchers to identify areas of concentration or specialization within a field, and to evaluate the relative impact and reach of different publications or authors [61].
  • Overlay maps are often used to combine and compare different types of data or variables within a single map. Overlay maps can help researchers to visualize the relationships between different datasets, and to identify patterns and trends that may not be immediately apparent in individual maps [61].
Each network map consists of nodes and links, where each node denotes an entity (i.e., country, author, document, journal, institution and keyword), and the link between two nodes denotes the co-occurrence relationship between those two entities. The weight of the represented entity is denoted by the size of the node, and the relationship strength is represented by the thickness of the link between two entities. The extent to which two entities are related to each other is represented by the distance between them, and the nodes’ colors categorize the entities into different clusters.

3.2.1. Citations

The citation network maps demonstrate the citation relationships (citing articles and cited references) between two entities (e.g., countries, journals). This section presents the citation network maps of bibliometric entries for countries, documents and institutions.
A citation network map for countries is presented in Figure 3. For network mapping, a threshold of 10 was used for minimum number of documents from a country. From the total of 81 countries, only 20 met the defined mapping criteria. The USA (115), China (82) and Italy (53) are the countries with the highest numbers of documents based on the node sizes. The strongest citation relationship between two countries belonging to different nodes was observed between the USA and Italy (i.e., link strength of 23). The clusters group the countries together which cited the same references.
To highlight the trend of contributions from each country over the time, an overlay map of the countries based on their citations is presented in Figure 4. It can be observed that Australia, Brazil and Greece are the countries where researchers published most recently on the use of drones for flood monitoring, mapping and detection.
Figure 5 shows the citation-based network map for the journals. The map was generated using the threshold of five as a minimum number of documents from each journal. This rule resulted in 17 journals out of total 335. Remote Sensing (45), Water (17) and Sensors (14) are highlighted as top journals with the highest numbers of documents. The strongest citation relationship for journals from two different clusters was observed between Remote Sensing and Sensors with the link strength of 13. The clusters grouped the journals together which cited the same references. Figure 6 shows the overlay network map to identify the journals which have published most recently. Sustainability, Drones and Science of the Total Environment were observed as the journals publishing state-of-the-art research in the domain of using drones for flood monitoring, mapping and detection.

3.2.2. Keyword Co-Occurrences

The keyword co-occurrence network map (see Figure 7) presents the relationships between different author-defined keywords based on how often those keywords appear together. For generation of a network map, the co-occurrence threshold for a keyword was set to a minimum of 6, which resulted in 34 keywords out of total 1830 author-defined keywords. The keyword “unmanned vehicles” has been mentioned in the literature with different names and cumulatively appeared as a top keyword. It had 217 occurrences (i.e., UAV (117), UAVs (13), unmanned aerial vehicle (51) and unmanned aerial vehicles (36)). Other highlighted keywords included remote sensing (49), floods (40), drones (33), LiDAR (27), photogrammetry (23), deep learning (14), image processing (13), disaster management (13) and artificial intelligence (7). UAV and remote sensing are the two most commonly co-occurring keywords from two distinct clusters with the link strength of 15. In terms of relatedness, UAV and structure from motion are identified to be the most related keywords from two different clusters. It is also important to highlight the research theme of each keyword cluster (see Figure 7). It can be observed that the red cluster is focused on AI and image processing, the green cluster is focused on floods and disasters, the purple cluster is focused on photogrammetry and structure from motion (SfM), the blue cluster is focused on LiDAR and digital elevation models (DEMs) and the yellow cluster is focused on geomorphology and UAVs. To understand the recent trends of research in use of drones for flood monitoring, mapping and detection, an overlay map of keywords is shown in Figure 8. It can be observed that the focus of recent research is more on machine learning, deep learning, artificial intelligence, energy efficiency and climate change.

3.2.3. Co-Authorship

To investigate the collaboration between the research groups from different countries, a co-authorship network map is presented in Figure 9. The minimum threshold to generate the map was set to 5 publications from each country, which resulted in 33 countries out of 81. Five clusters of countries were observed based on the co-authorship analysis. Highlighted countries from each cluster included:
  • The United States of America, Italy, Japan, France and Turkey from the blue cluster.
  • China, Germany, Belgium, Spain, Australia, Poland and Scotland from the green cluster.
  • Australia, South Korea, Iran and Malaysia from the yellow cluster.
  • India, England, Canada, Saudi Arabia and Portugal from the red cluster.
  • Switzerland, Slovakia and Czech Republic from the purple cluster.
The strongest co-authorship relationship was observed between the USA and China with link strength of eight. A few other highlighted cross-cluster collaborations can be identified between: (a) the USA and England, (b) the USA and India, (c) the USA and Australia and (d) Australia and China.

3.2.4. Co-Citations

To highlight the similarity of documents on the research theme level, co-citation based network maps were used, which analyze the literature based on the principle of how many times two documents are cited in a third document. Figure 10 shows the co-citation network map for the authors. For generating the network map, a threshold for minimum number of citations by any author was set to 30, which resulted in 16 from the total of 14,816 authors. The authors were grouped mainly into three clusters based on the type of research they perform. From the two distinct clusters, the strongest co-citation relation was reported between James, MR, and Fonstad, MA, with the link strength of 32. On the other hand, the strongest co-citation relation within the same cluster was observed between James, MR, and Westboy, MJ, with the link strength of 53. James, MR, and Westboy, MJ, are also the leading citation holders, with 69 and 77 citations, respectively.

3.2.5. Bibliographic Coupling

To highlight the relationships between the literature entries based on the shared references, bibliographic coupling analysis was performed for countries, documents, institutions and journals. Figure 11 shows the network map based on the bibliographic coupling between countries. For the generation of a map, a minimum threshold of 10 documents from a country was set, which resulted in 20 countries of the total of 81. Four clusters were identified based on the shared references. From the two distinct clusters, the strongest bibliographic coupling relationship was reported between the USA and Italy, with link strength of 1051. On the other hand, the strongest bibliographic coupling relationship from within the same cluster was reported between Italy and Germany, with the link strength of 1302.
Figure 12 presents the network map based on the bibliographic coupling for journal. To generate the network map, a threshold of 5 was set for minimum number of documents by journal, which resulted in 17 institutions from a total of 335. In total, four clusters of journals were formed in the map. From two different clusters, the strongest bibliographic coupling was observed between Remote Sensing and Water, with the link strength of 206. On the other hand, from within the same cluster, the strongest bibliographic coupling was observed between Remote Sensing and Geomorphology, with the link strength of 281.

4. Discussions

This section summarizes the important trends reported from the performed bibliometric analysis and also provides the subjective opinions, where applicable, to discuss the results. The results are also explained subjectively to help readers understand the highlighted trends from the analysis. Listed below are the trends identified from the performance analysis and science mapping performed to explore the literature in relation to the use of drones for the flood monitoring, mapping and detection:
  • The number of publications and corresponding citations are reported to have increased over the years, specifically after 2014. This increased attention to the use of drones for flood monitoring, mapping and detection may be associated with latest innovations in the drone technology and the commercial availability of drones at economical prices. It is worth noting that similar increases in publication and citation rates have also been observed in other bibliometric reviews [50,52,62]. This raises the question of whether these trends accurately reflect the research focus on this topic, or if they are simply a result of the overall increase in the number of publications in recent years due to changes in academic dynamics. Researchers may be publishing more due to requirements for a certain number of publications as part of their degree completion. However, despite these uncertainties, it is undeniable that drones have emerged as a disruptive technology in recent decades and have garnered significant attention from the research community, particularly following the availability of drones for commercial use. Floods, as a hazard that requires broad coverage, are particularly well-suited for the use of drones. A review of the evolution of research in this field reveals that there is no clear pattern in the development of drone-based flood-management research. Instead, research has focused on a wide range of flood-management activities over the past few decades. Earlier research utilized drones for remote sensing to collect data relevant to flood analysis and mapping, whereas more recent research has utilized drones equipped with high-resolution cameras, LiDAR, RADAR, multi-spectral cameras and thermal sensors to capture data. The most cited research, as reported in Table 2, also shows a lack of a clear pattern, with a focus on a range of topics, including flood mapping, coastal monitoring, aerial observations and emergency communication networks.
  • The overall number of publications in the subject domain is comparatively on the lower end (i.e., 569), which indicates that the flood-management domain is yet to benefit from the full potential of drone technologies. Given the availability of drones and innovations in the sensor development, drones can prove a significantly helpful tool for flood monitoring, mapping and detection purposes. Artificial Intelligence of Things (AIoT) and edge-computing [63,64] technologies are yet to be fully explored in this context to avoid the privacy, latency and bandwidth issues.
  • The USA, China, Italy, England and India are highlighted as the top countries in terms of the number of publications coming from each country. It is a common trend in other bibliometric reviews [52,62] to find that the USA and China are the top contributing countries. This may be due to the fact that these countries are home to many top-ranked academic institutions and have higher numbers of institutions compared to other countries. Additionally, both the USA and China are technology giants, and may therefore have higher levels of research and awareness regarding drones. A portion of the research in these countries may also be in response to recent flooding events and an increased focus on disaster-management research. The inclusion of Italy, England and India in the list of top contributing countries may be due to their vulnerability to floods and the occurrence of increased flooding events, which may have spurred research in this specific area.
  • Remote Sensing, Water and Sensors are identified as the top journals publishing research related to the use of drones for flood monitoring, mapping and detection purposes. All of the journals are peer-reviewed, impact-factor-holding and indexed journals. One potential reason for the high number of publications in MDPI journals within the field of drone-based flood-management research may be the open access policy and rapid publication time offered by these journals. MDPI has gained a reputation as a top publisher in this domain for its commitment to rapid open-access publication without sacrificing the quality of the peer-review process. Additionally, the availability of journals with a specific focus on drones in flood management within the MDPI portfolio may increase the chances of acceptance for relevant research, as it is less likely to be rejected due to a lack of fit with an appropriate journal’s scope. The availability of discounted publication fees for researchers in developing countries may also be a factor contributing to the popularity of MDPI journals in this field.
  • A review of the top publishing institutions in the field of drone-based flood-management research reveals a lack of a clear pattern. Small portions of research are being published by a wide range of institutions. For example, the top contributing institution, the Polytechnic University of Bucharest, only published 4% of the total number of publications. An analysis of the WoS categories for these publications shows that the majority of research was published in the geosciences, environmental sciences and water resources domains. This trend suggests that researchers from the application domain of flood management, rather than the technology domain of drones, are more heavily involved in this research. This also suggests that the research is more applied in nature, utilizing existing drone technologies and AI algorithms to address problems within the flood-management domain, rather than focusing on the development of new technologies.
  • The citations network map for publishing countries in the field of drone-based flood-management research reveals strong relationships between the United States and Italy. This citation relationship may be due to the fact that research conducted in the United States is considered a benchmark in the field, and Italy, as the third largest contributor, frequently cites this benchmark research. A strong citation relationship also exists among China, the United States, and Italy. Australia is another country where a significant amount of recent research in this field has been published, which may be related to the recent flooding events that have impacted Australia over the past five years [65,66]. A similar pattern can be observed in the citation network map for journals. The top three publishing journals—Remote Sensing, Sensors, and Water—display strong citation relationships due to the high volume of research published in these journals. These findings suggest that research in the field of drone-based flood management tends to build upon and reference the work of others, particularly within the top contributing countries and journals.
  • The most important keyword co-occurrence analysis reported UAVs; remote sensing, floods, drones, LiDAR, photogrammetry, deep learning, image processing, disaster management and artificial intelligence as the trending keywords. The co-occurrence strength analysis of keywords within the field of drone-based flood-management research highlights several pairs of closely related terms, including UAV–remote sensing, UAV–LiDAR, UAV–floods, UAV–photogrammetry and UAV–image processing. This suggests that the use of UAVs equipped with LiDAR and camera sensors for flood monitoring purposes is a common focus of research in this field. This trend is consistent with literature indicating the increasing use of UAVs with multiple sensors for various applications [9,67,68]. Additionally, the use of image processing, artificial intelligence and deep learning algorithms for the analysis of drone-captured data in order to extract useful information is also a prevalent topic within this research area [1,3,29]. These findings suggest that the development and application of advanced technologies, such as UAVs with multiple sensors and sophisticated data analysis algorithms, is a key focus of research in the field of drone-based flood management. From the overlay maps, machine learning, deep learning and artificial intelligence are the most targeted keywords recently, which indicates that the focus of research is more towards the development of efficient software tools which enable the drones to extract the useful information more efficiently.
  • From the bibliographic coupling and co-authorship analysis, the USA, China and Italy were identified as the overall winners in terms of most related countries. This suggests the existence of strong research collaborations among the universities of these countries. This may be associated with the overall number of universities in these countries, the areas of these countries and the technological advancements related to drones in these countries.

5. Recent Research Trends

This section presents a detailed author-centered review of 28 recent literature entries that utilize drones to address flood-management issues. The aim of this review is to highlight the current trends in this research domain and identify active areas of research where the potential of drones is being explored in the context of flood management. In order to provide a comprehensive understanding of the research in this field, the review is organized chronologically to demonstrate the evolution of technology in this domain. Additionally, a process-driven review of the literature is included to analyze the research from the perspective of flood-management utilities. This review aims to provide a nuanced understanding of the current state of research in the field of drone-based flood management and identify areas for future study.
Akay et al. [69] used UAV-based monitoring to quantify and visualize the morphological changes of meander structures in the Buyuk Menderes River Basin in Turkey. Field surveys were conducted in 2018 and 2019, and multi-temporal orthomosaics and digital surface models were constructed using the SfM technique. The digital shoreline analysis system and DEM of difference tools were used to assess spatial and volumetric changes in the meander structures. The results of this study highlight the importance of mapping and monitoring river basins for effective disaster management. Loli et al. [70] described a study that used drones and 3D modeling to investigate a flash flood that caused damage to bridges and buildings in Central Greece. The research focused on a single case study and used detailed mechanical modeling to investigate the failure of a bridge abutment during the flood. The study found that the flood had a lower bound-flow velocity at the subject location, and suggested that this approach could be used to estimate the intensity of similar extreme events in the future. However, the study only focused on a single case and did not provide a detailed comparison with other methods for studying flash floods. Ye et al. [71] proposed a novel approach using drones to improve the quality of drainage-network extraction in flat terrains. The approach uses information about hydrogeomorphic features, such as obstacles and channels, to construct a digital elevation-extended model (DXM), which is then used to extract drainage networks. The approach was applied and validated in a case study in Yanhu Lake, and was found to be effective at determining flow directions. The use of drones in the approach allows for high-resolution data collection, which improves the accuracy of the extracted drainage networks. However, it is not clear from the text how this approach compares to existing methods for drainage network extraction, or how it might be applied in practice. Additionally, the use of a priori knowledge about hydrogeomorphic features raises questions about the generalizability of the approach to other areas.
Su et al. [72] performed an investigation that used drones equipped with visible and infrared cameras to detect leakage in river embankments during flood season. The study proposed a leakage identification method based on UAV infrared images and a region segmentation method based on infrared and visible image fusion. The proposed methods were applied to an actual river embankment and found to be effective at identifying leakage. Our study suggests that this approach has potential for use in detecting leakage in river embankments during flood season. Kundu et al. [73] estimated the extent and depth of floodwater in the Houston area after Hurricane Harvey using data from LiDAR DEM and synthetic aperture radar (SAR) and unmanned aerial vehicle synthetic aperture radar (UAVSAR). The flood’s extent was observed to decrease between 29 and 30 August and 5 September 2017, and the flood depths estimated using DEM were compared with USGS gauge data and showed a high correlation. The use of Sentinel-1 and UAVSAR allowed for daily temporal repeat and provided detailed information on the affected areas for disaster management. Trepekli et al. [74] examined the potential use of miniaturized LiDAR scanners mounted on UAVs for improving urban flood modeling and assessments at the local scale. By generating ultra-high-spatial-resolution digital terrain models featuring buildings and urban microtopographic structures, the accuracy and detail of simulated flooded areas were vastly improved. The use of UAV-LiDAR data enabled the identification of structures such as archways and bridges that were critical for predicting precise run-off courses. The application of UAV-LiDAR technology may enhance the effectiveness of urban planning by projecting the locations, extents and run-offs of flooded areas in dynamic urban settings.
Khan et al. [75] highlighted the potential for using UAVs in disaster management. UAVs can provide fast, cost-effective, easy-to-deploy and secure wireless communication to victims after natural or human-made disasters, such as floods, earthquakes and tsunamis. The study also discusses the potential challenges and issues associated with using UAVs in disaster management, including interference; coordination; quality of service (QoS) requirements; and size, weight and power limitations. Overall, the use of UAVs in disaster management can provide an effective and efficient solution for providing communication and support to victims in the aftermath of disasters. Papaioannou et al. [76] investigated the use of UAVs to generate high-resolution orthophoto mosaics and DEMs to create spatially distributed roughness coefficient maps. The maps were used to improve flood inundation modeling in ungauged streams. The study found that a combination of local entropy values and maximum likelihood classification produced satisfactory results in determining grain classes along a stream with inhomogeneous bed composition. The resulting roughness coefficient maps were used in 1D, 2D and coupled (1D/2D) hydraulic modeling approaches for flood inundation modeling. The methodology was demonstrated on the Xerias stream in Greece and could potentially be applied to other Mediterranean streams with similar characteristics. Song et al. [77] used UAVs to monitor and assess flood risks in urban areas. The UAVs were used to create high-resolution topographic data, which were then used to conduct a watershed analysis to identify points of convergence for rainwater flow. Based on this analysis, a monitoring point was proposed for preventing flood damage in the area. The study demonstrated the potential of UAVs for improving flood-risk assessments and informing flood prevention efforts in urban areas.
Alfonso-Torreno et al. [78] analyzed the effects of gully control measures on the hydrological dynamics and sediment load in an agroforestry system in southwestern Spain. The control measures included gabion check-dams, brushwood check-dams and fencing, and were implemented and monitored using aerial images acquired by an UAV. The results showed that the control measures reduced suspended sediment concentration by 65% and successfully stabilized the expansion of the channel network. The study highlights the potential for UAVs to be used in monitoring gully rehabilitation efforts. Further research is needed to understand the long-term effects of the control measures. Higgisson et al. [79] used UAVs and convolutional neural networks (CNNs) to estimate the cover of Phragmites australis, a type of reed, in a wetland in Australia. The study found that prior environmental watering significantly increased the cover of Phragmites australis and improved the condition of the reedbeds. The use of UAVs and CNNs allowed for consistent data collection and analysis in difficult-to-access areas. These findings demonstrate the potential for using environmental water to maintain the resilience of wetlands. Yang et al. [80] proposed the use of drones and remote-sensing techniques, such as LiDAR and UAV surveys, to study the effects of a rainfall-induced landslide at Mt. Silabaku in Taiwan. The analysis of the data revealed that the landslide was caused by heavy rains and local failures, resulting in large deposits of debris along the Yusui Stream. The high-resolution topographic data showed that the debris deposits were estimated to be over 8 million cubic meters, posing a threat to nearby villages and infrastructure. This study highlights the importance of using drone technology and remote sensing for disaster management and risk assessment in landslide-prone areas.
Alberico et al. [81] used satellite and drone images to monitor the formation and dismantling of a fan delta at the mouth of the Sfalassa Stream in Calabria, Italy. The flood event of November 2015 placed 25,000 m3 of coarse sand and gravel sediments in a few hours, forming the fan-shaped delta. The delta was then dismantled by three main storm surges occurring from November 2015 to January 2016. The images showed the gradual erosion of the fan delta, highlighting its complete dismantling in about three months. This analysis demonstrated the usefulness of high-resolution observing systems in understanding the processes that shape coastal environments and in informing coastal-zone-management efforts. Jiang et al. [82] examined the vegetation of the reservoir Water Level Fluctuation Zone (WLFZ) in the Jinsha River basin in China using small UAVs and field research. The study found that the original drought-tolerant vegetation in the WLFZ has evolved into amphibious herbaceous vegetation, with simpler species composition and a lack of trees and shrubs. The results also showed that flooding stress has a greater impact on vegetation species than drought stress, and that vegetation in the WLFZ is distributed in a band-like pattern along the water-level elevation gradient. The authors suggest that the restoration of the WLFZ should prioritize native species and take local conditions into account. Prabhu et al. [83] proposed the use of deep learning techniques and UAVs for identifying and locating survivors in flood-devastated areas during rescue operations. The proposed model, called RescueNet, uses UAV images to detect and count affected individuals in real-time. Results show that the model has high precision, high recall and a high F1-score, indicating its effectiveness in aiding rescue efforts.
Hernandez et al. [84] proposed an AI-based pipeline for processing natural disaster images taken by drones. The pipeline, which consists of a lightweight autoencoder, dimensionality reduction and fuzzy clustering, is designed to reduce the amount of information to be processed by first responders in the event of a natural disaster. The proposed pipeline was evaluated on several edge computing platforms with low-power accelerators and was shown to substantially reduce the amount of information to be processed while providing real-time tracking of natural disasters. This demonstrates the potential for using drones and AI in disaster responses. Munawar et al. [27] proposed a design for maximizing drone coverage in a post-disaster flood situation. A mathematical optimization model was developed, and the Particle Swarm Optimization (PSO) algorithm was used to solve the problem. The proposed approach indicates that maintaining the flight height of the drone above 120 m can enhance coverage by approximately 34% compared to a flight height of 100 m. This study highlights the potential for using drones in disaster response and recovery efforts. Bilasco et al. [85] presented a hybrid risk-assessment methodology for buildings in cases of floods using geographic information systems (GIS) and UAVs to collect and process data. The methodology is based on detailed information on the terrestrial surface and measurements of past flood levels to estimate post-flood peak discharge. This information is used to calculate shear stress and velocity, which are then used to create a hazard and risk map for buildings. The study highlights the potential for using GIS and UAVs in strategic flood management, and the value of involving citizens in mapping risks and adapting to climate change.
Romagnoli et al. [86] performed a study on Lipari island in the Aeolian Archipelago and examined the coastal erosion and flooding in the low-lying areas of the island, which are particularly vulnerable to the effects of sea-level rise. The study used remote-sensing techniques such as aero-photogrammetry, UAV surveys and satellite data, and offshore geophysical surveys and field observations. The results showed that natural and anthropogenic factors played a role in the long- and mid-term evolution of the studied coastal areas, and highlighted the need for proper management to reduce natural risks and mitigate the impacts of future climate change. Guo et al. [87] combined the use of ground penetrating radar (GPR) with UAV detection to study the recent sediments of a braided river in Datong, China. The GPR technique was used to describe the fluvial facies and reservoir architecture of the area, and the data were processed and interpreted to identify the characteristics of different sedimentary units. The results show that GPR and UAV data can be effectively combined to study the complex spatial distributions and internal structures of braided river reservoirs, which has important implications for flood mitigation, among other things. Hagge-Kubat et al. [88] investigated a hillslope debris flow that occurred in the Eifel area of western Central Europe using a combination of field studies and geophysical techniques, including electrical resistivity tomography, direct push hydraulic profiling, sediment coring and UAV-generated photogrammetry. The results showed that the geomorphological and geotectonic position of the hillslope played a crucial role in the triggering of the debris flow. The combination of large surface runoff and strong interflow at the sliding surface caused the transformation from an initial translational slide into a hillslope debris flow. The study also developed and validated a stand-alone model of the debris flow on a local scale, which showed promising results. This research highlights the potential for using drones in the investigation of mass movements in mountain regions.
Wang et al. [89] proposed a new method for monitoring ice velocity in rivers using UAVs and machine vision technology. The method involves using UAVs to capture high-resolution orthoimages during ice flood periods, extracting feature points in drift ice images with the scale-invariant feature transform algorithm and tracking the motion trajectories of these points to establish an ice displacement rate field. The study demonstrated the effectiveness of this method by applying it to the Mohe River in Heilongjiang Province, China, and finding average ice velocities of 2.00 and 0.74 m/s. This method offers a cost-efficient and accurate alternative to traditional ice-velocity-monitoring methods. Lei et al. [90] proposed a new method for monitoring and assessing flood disasters using a combination of satellite remote sensing, UAV remote sensing and field measurements. The method was tested in Poyang County, Jiangxi Province, China, and was able to accurately assess the extent of the flood, and provided information on the evolution of the disaster and its impact. This integrated air–space–ground approach can provide detailed information at different spatiotemporal scales, supporting emergency responses and disaster reduction efforts. Giulietti et al. [91] proposed a method for water-level evaluation using photogrammetry derived from images recorded by UAVs. The dense point cloud was used to find the best fitting plane for the river water surface using the random sample consensus (RANSAC) method. A reference point of known altitude within the image was used to compute the distance between it and the fitted plane, allowing for the monitoring of the water’s surface altitude. The sensitivity of these photogrammetric techniques for river water level determination was also analyzed, with a focus on the effects of image data quality, reflections and process parameters. The optimal plane depth and number of iterations were found to have minimal error.
Giannitsopoulos et al. [92] examined the current variability in England with regard to the use of unmanned aerial systems (UASs) in flood-emergency responses. Expert elicitation was used to gather information on UAS deployment in different flood-emergency scenarios. The survey found that reducing equipment assembly time, establishing a national network of qualified UAS pilots and effective deployment of UASs when on-site could reduce the response time to flood emergencies. In order to improve comparability and reduce bias in data collection and interpretation, clear guidelines on data products, processing time, platform and sensor selection may also be necessary. The authors suggest that releasing a comprehensive documentation pack with guidelines and protocols for UAS pilots on flood emergency calls could enhance the timeliness of responses. Amphawan et al. [93] demonstrated the potential for using UAVs for free-space optical communications during rescue operations in flood-stricken areas. By leveraging linearly polarized Laguerre–Gaussian modes for spatial mode diversity, the bit error rate was improved by 38% to 55%, which was attributed to an increase in the predominant mode power. The results of this study highlight the potential for using UAVs in establishing efficient communication during the disaster response and recovery efforts. Belcore et al. [94] used multispectral drone imagery to generate a high-resolution land cover map of flood-prone rural villages in southwest Niger. The resulting map was used to estimate potential damages from flood events by focusing on highly detailed classes, such as houses and production areas. The land cover was generated using object-oriented supervised classification with a random forest classifier. The study found that the resulting map had an overall accuracy of 0.94, with the least performant classes being grasslands and rocky clustered areas. This method could be useful for monitoring areas vulnerable to natural hazards and reducing disaster risk. Hidayah et al. [95] used 2D-hydrodynamic modeling and digital surface models (DSMs) from UAV imagery to construct flood hazard maps based on hazard levels for various flood return periods. The results showed that the simulation of return periods for 2 and 10 years resulted in a 37% increase in flood hazard levels. The study also identified areas that were exposed to increased levels of flood inundation, including housing, roads and rice fields. The use of UAV imagery in this study highlights the potential for using drones in flood risk reduction efforts.
In summary, from the presented recent literature, the followings trends can be reported:
  • The active areas of research from the latest relevant literature include post and pre-flood structural assessments, flood risk mapping, land cover estimation, hydraulic structure monitoring, flood depth estimation, flood victims detection, flood coverage mapping, debris flow monitoring, coastal monitoring, sediment transport, floodplain and reservoir vegetation monitoring, real-time flood detection, water level measurements and emergency communication networks.
  • The trending technologies reported in the literature include computer vision, deep learning, SfM, LiDAR, DEM, 2D hydraulic modeling, CFD, photogrametry, SAR, CNN, YOLO, PSO, GIS, GPR and DSM.
  • In terms of how frequently certain technologies are used, computer vision, deep learning and DEM emerged as top three most used technologies.
Given the summary of how latest technologies are being used in the context of drone-based flood management, listed are a few use-cases demonstrating the directions in which future research may move.
  • Water/flood depth estimation using the latest computer vision and deep learning techniques (e.g., reference object detection-based estimation, water gauge detection-based estimation).
  • Flood-damage mapping of a given area using computer vision and LiDAR sensors. In addition, the use of SfM technology for 3D construction and detailed building level damage analysis.
  • Surface-water detection using conventional image processing techniques and deep-learning-based segmentation models.
  • On-demand monitoring and detection of coastal floods using UAV-captured visual and LiDAR data analyzed with latest machine learning and deep learning algorithms.

Process-Driven Analysis

The process-driven analysis of literature aims to examine and understand the technological contributions within the context of flood management. By aligning these contributions with specific phases and needs within flood management, solution providers can better understand the requirements and specific activities that their solutions should address. For example, during the response phase of flood management, there may be a need for real-time drone-based mapping solutions to quickly provide a map of flood-affected areas, even if the accuracy is not 100%. On the other hand, during the mitigation phase, a flood hazard zone mapping solution may need to be more precise, but may not necessarily need to be real-time. Understanding the specific needs and requirements of each phase of flood management is crucial for developing effective and appropriate solutions.
Table 8 presents the results of a process-driven analysis of recent literature that utilizes drones for various activities related to flood management. The analysis shows that the majority of research in this area focuses on the mitigation phase of flood management, specifically targeting needs related to flood-vulnerability monitoring and flood-risk assessment. This may be due to the fact that drones are well-suited for on-demand mapping of local areas, which can be more efficient and cost-effective than using full-scale manned aerial platforms. Additionally, many mapping solutions do not require real-time functionality, allowing for the collection and analysis of high-resolution images at a base station using advanced algorithms. While the use of drones for on-board computing using edge computers is a challenging task due to payload and power constraints, they are commonly used during the response phase for activities, such as flood monitoring, flood mapping, structural-damage assessments and flood-victim identification. During the preparedness phase, drones have been used for hydraulic structure monitoring and water-level monitoring. However, the recovery phase has been largely neglected in this regard, despite the potential for drones to assist in tasks such as reconstruction monitoring, flood-debris removal and transport-route clearance.

6. Conclusions

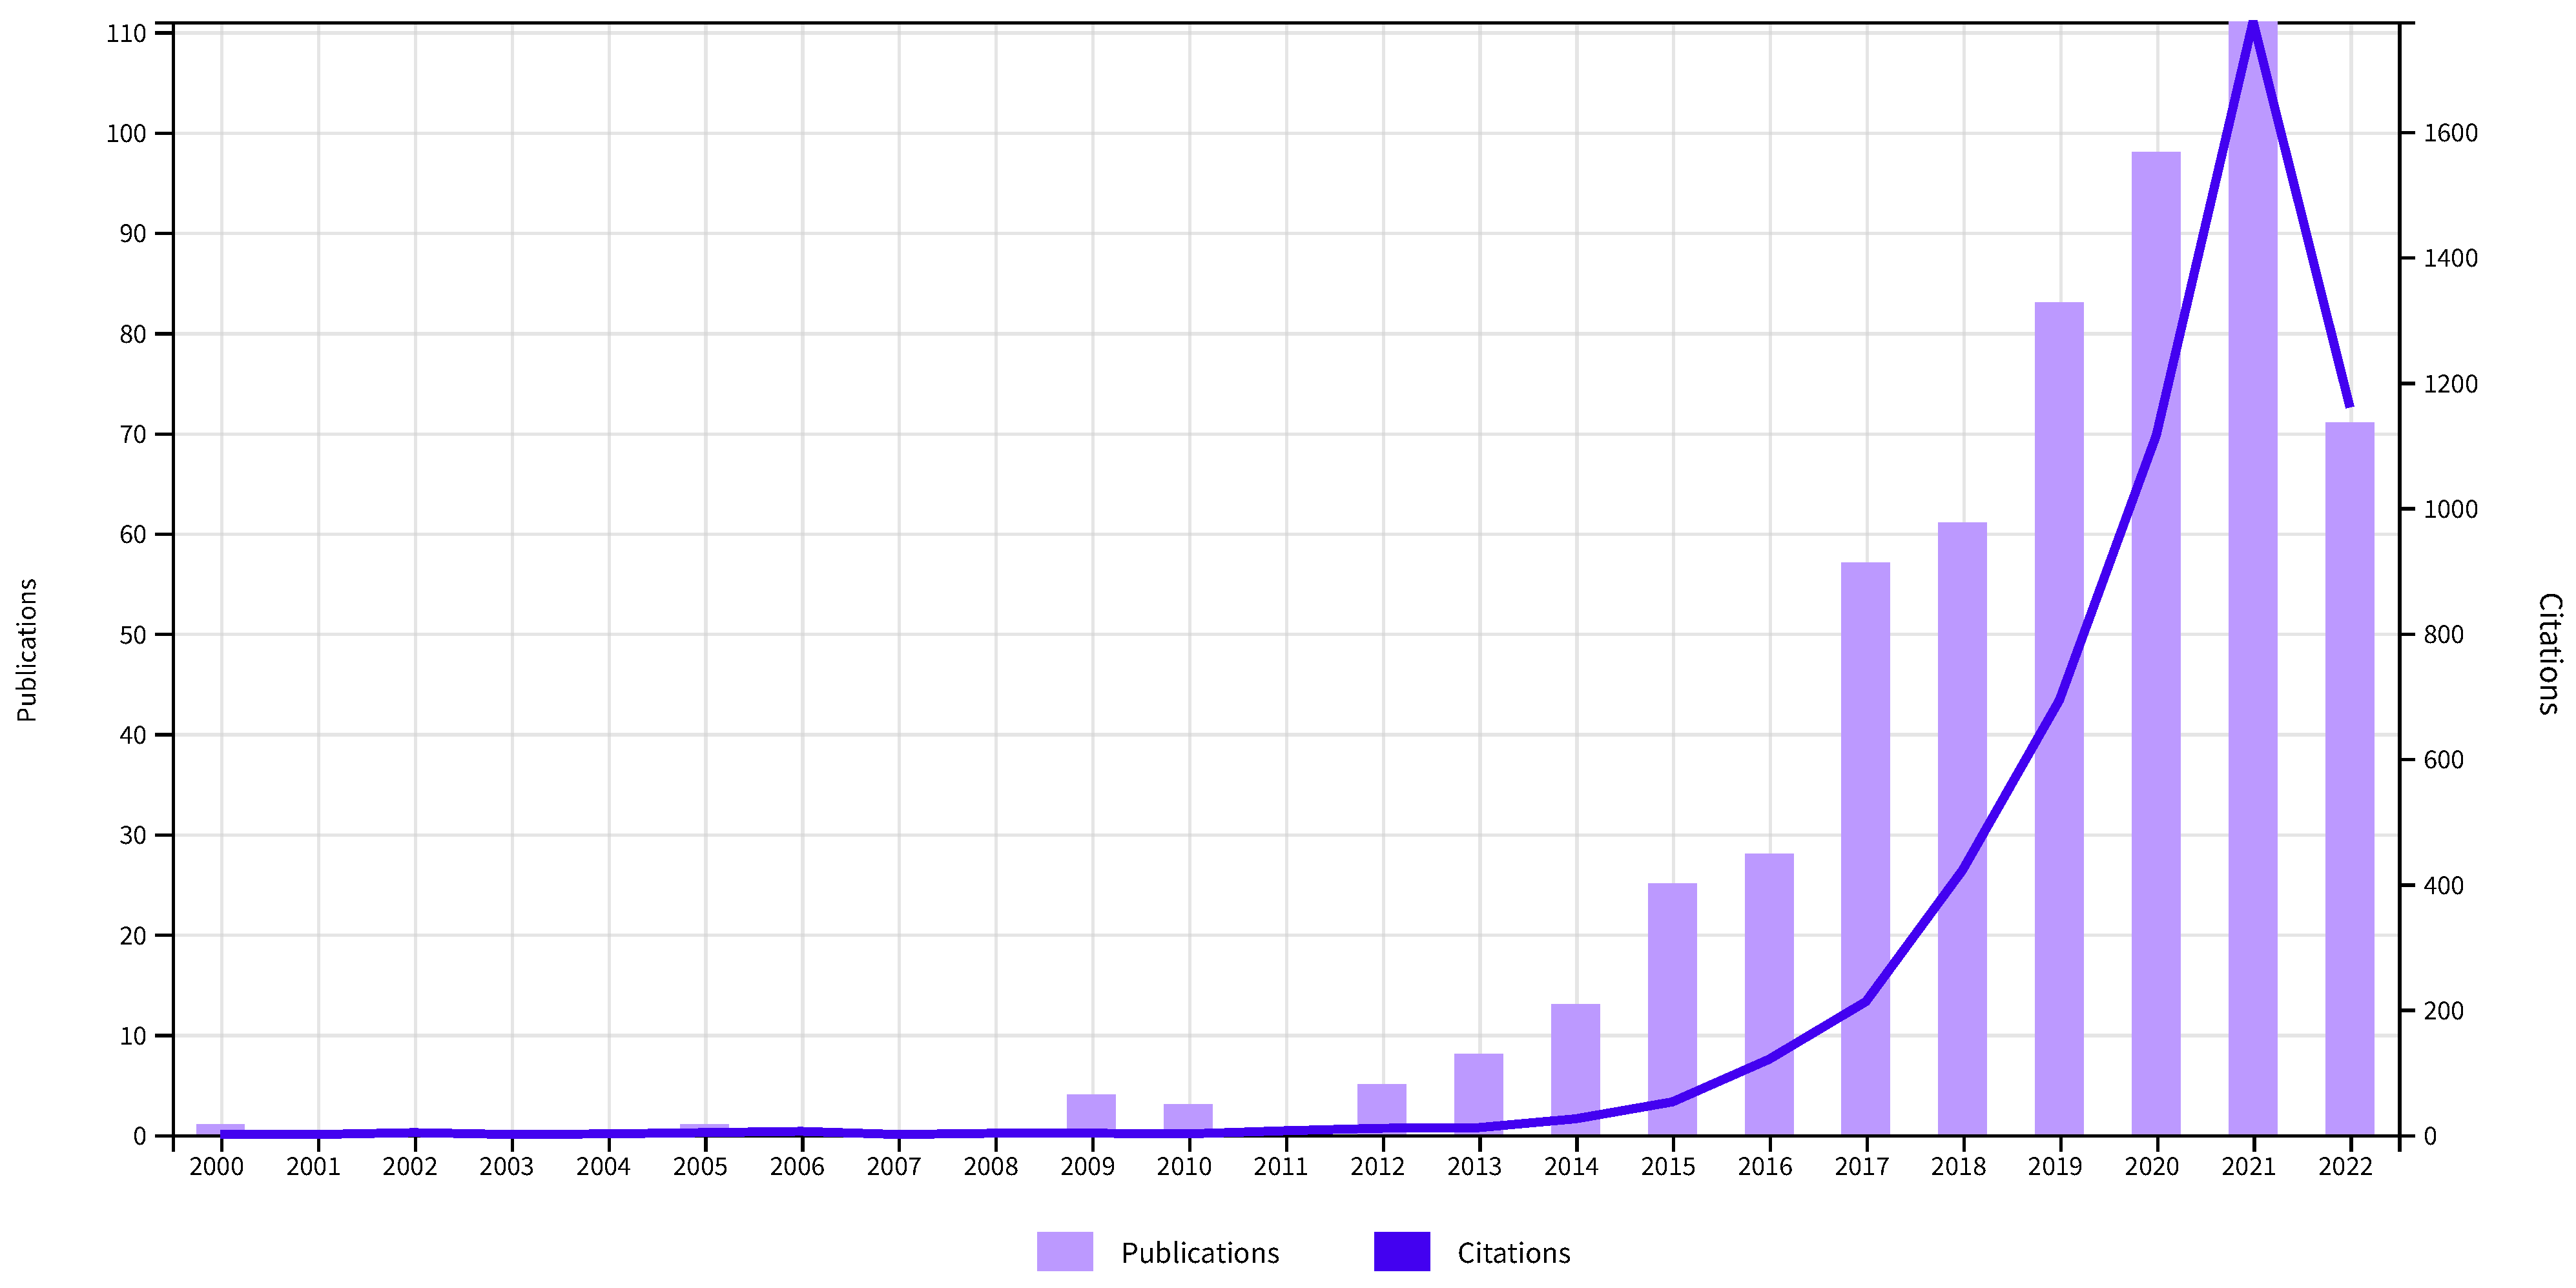
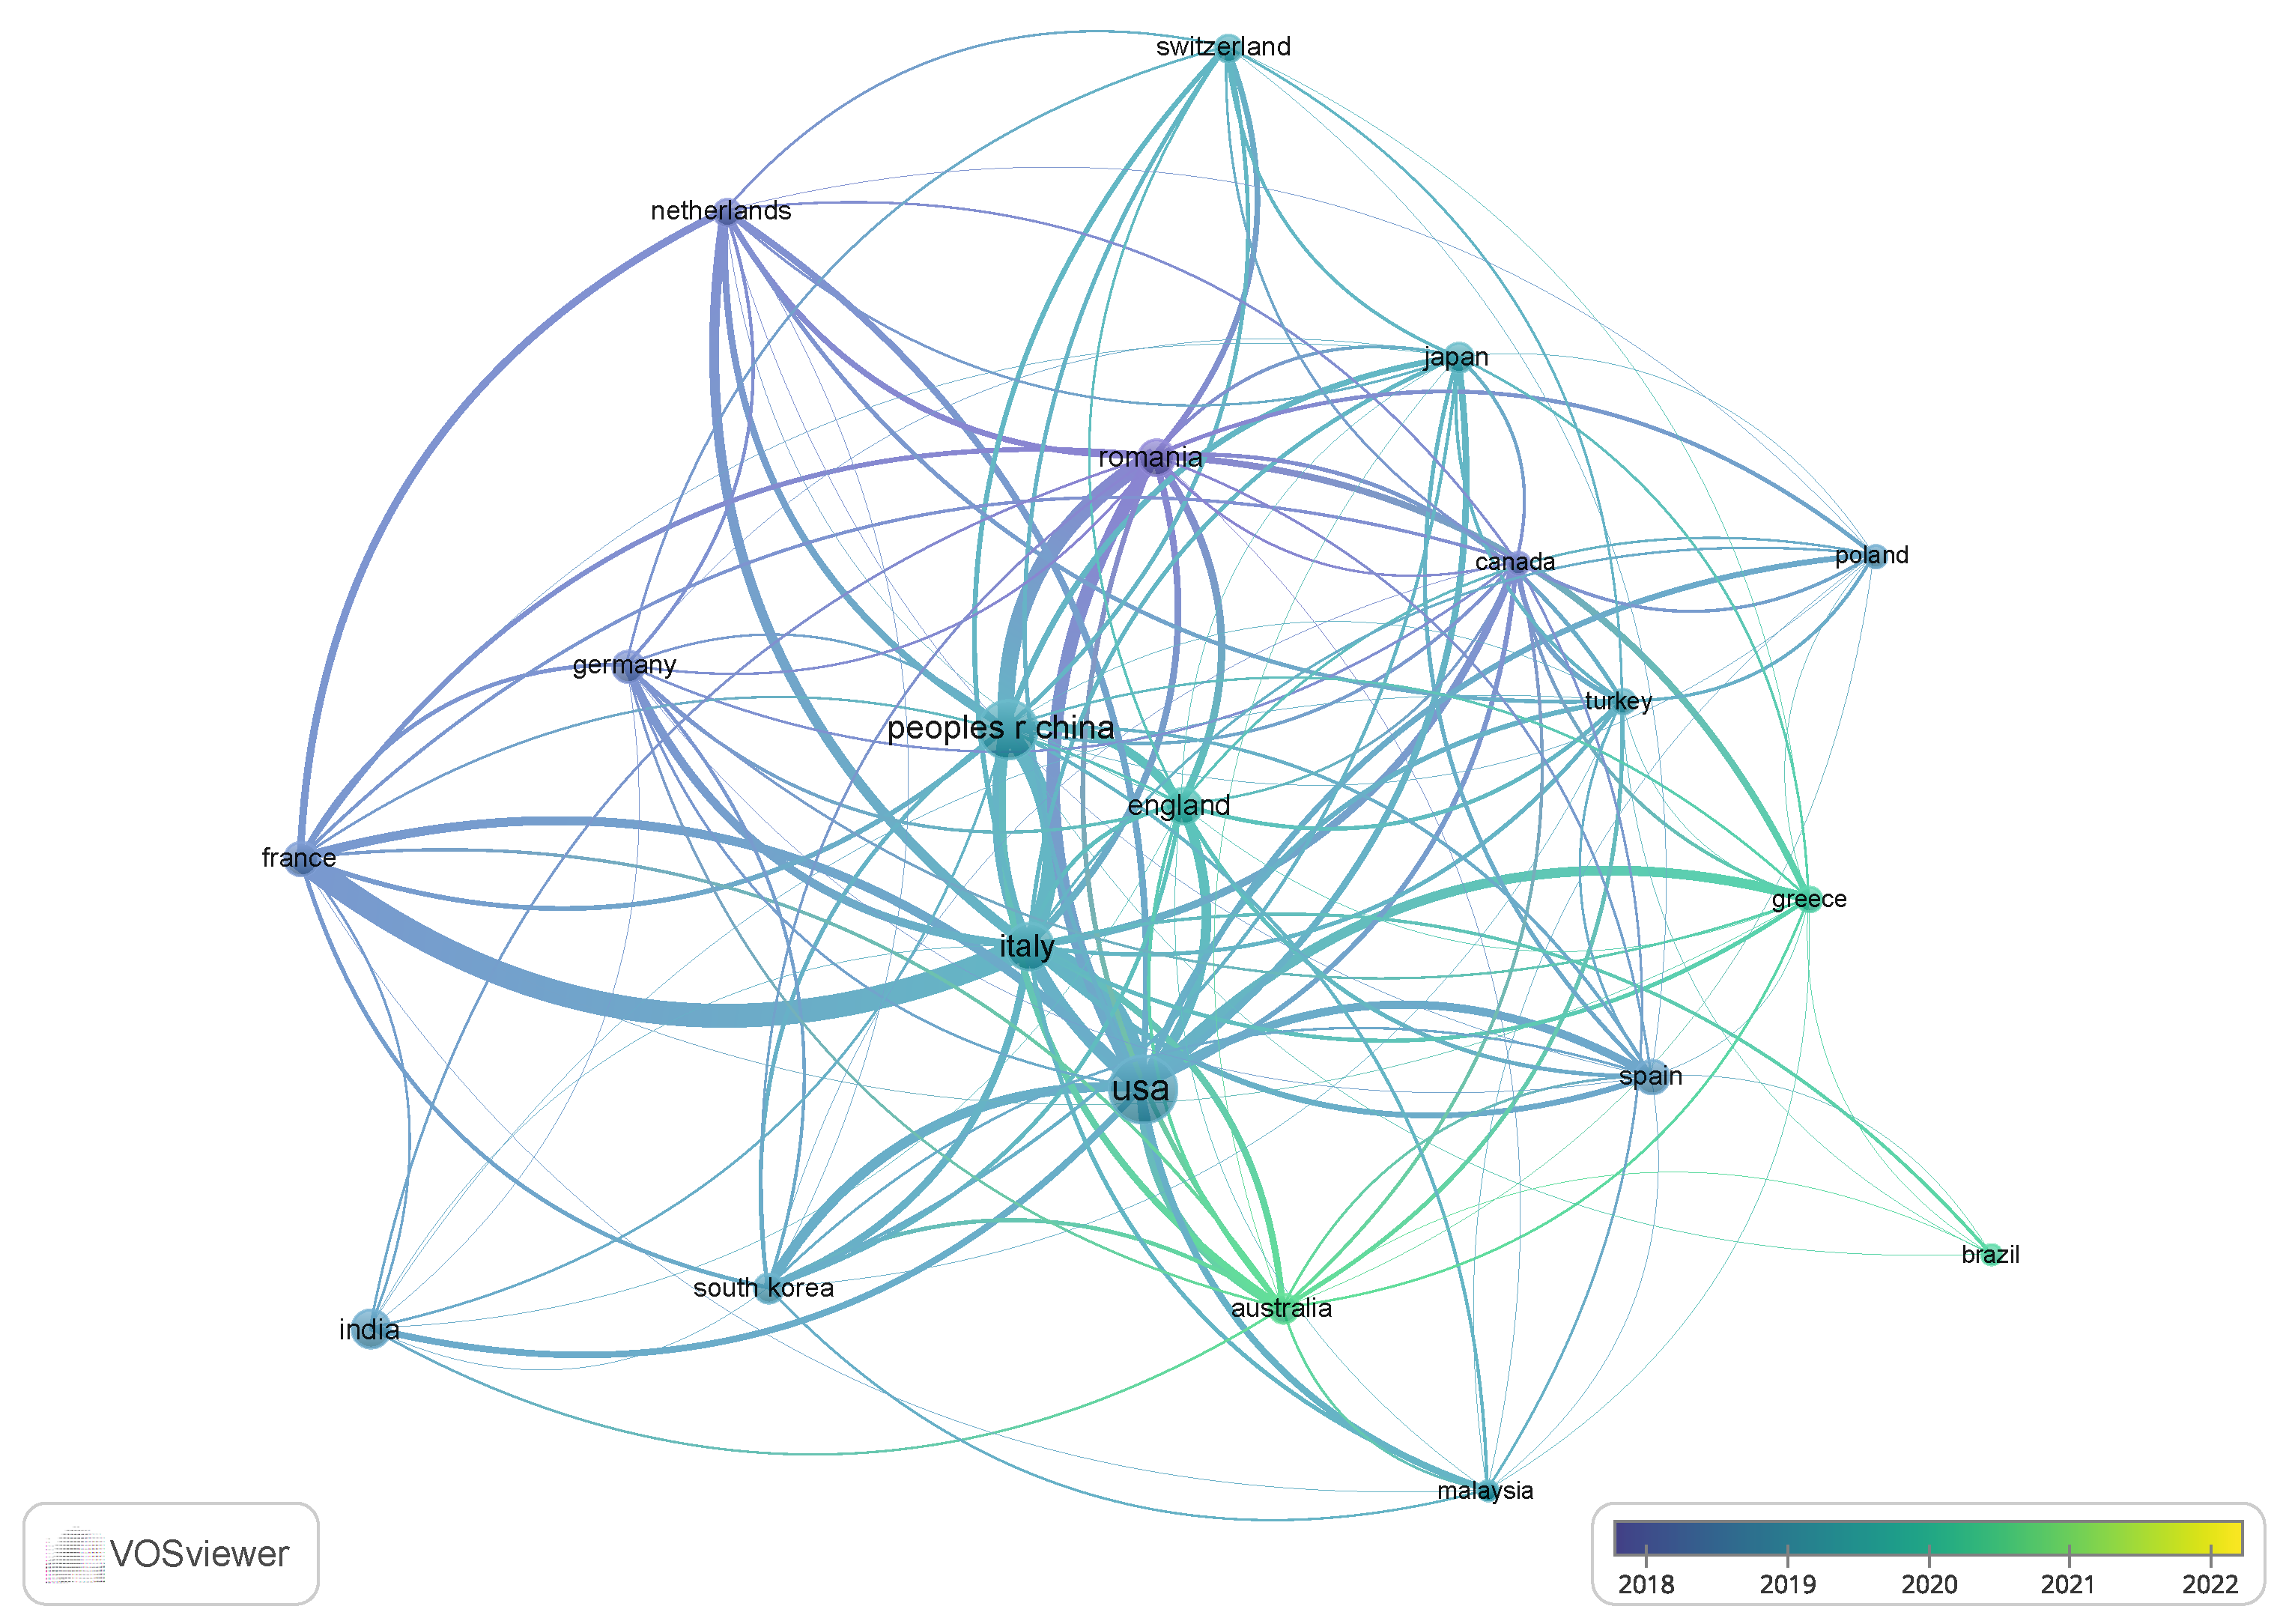
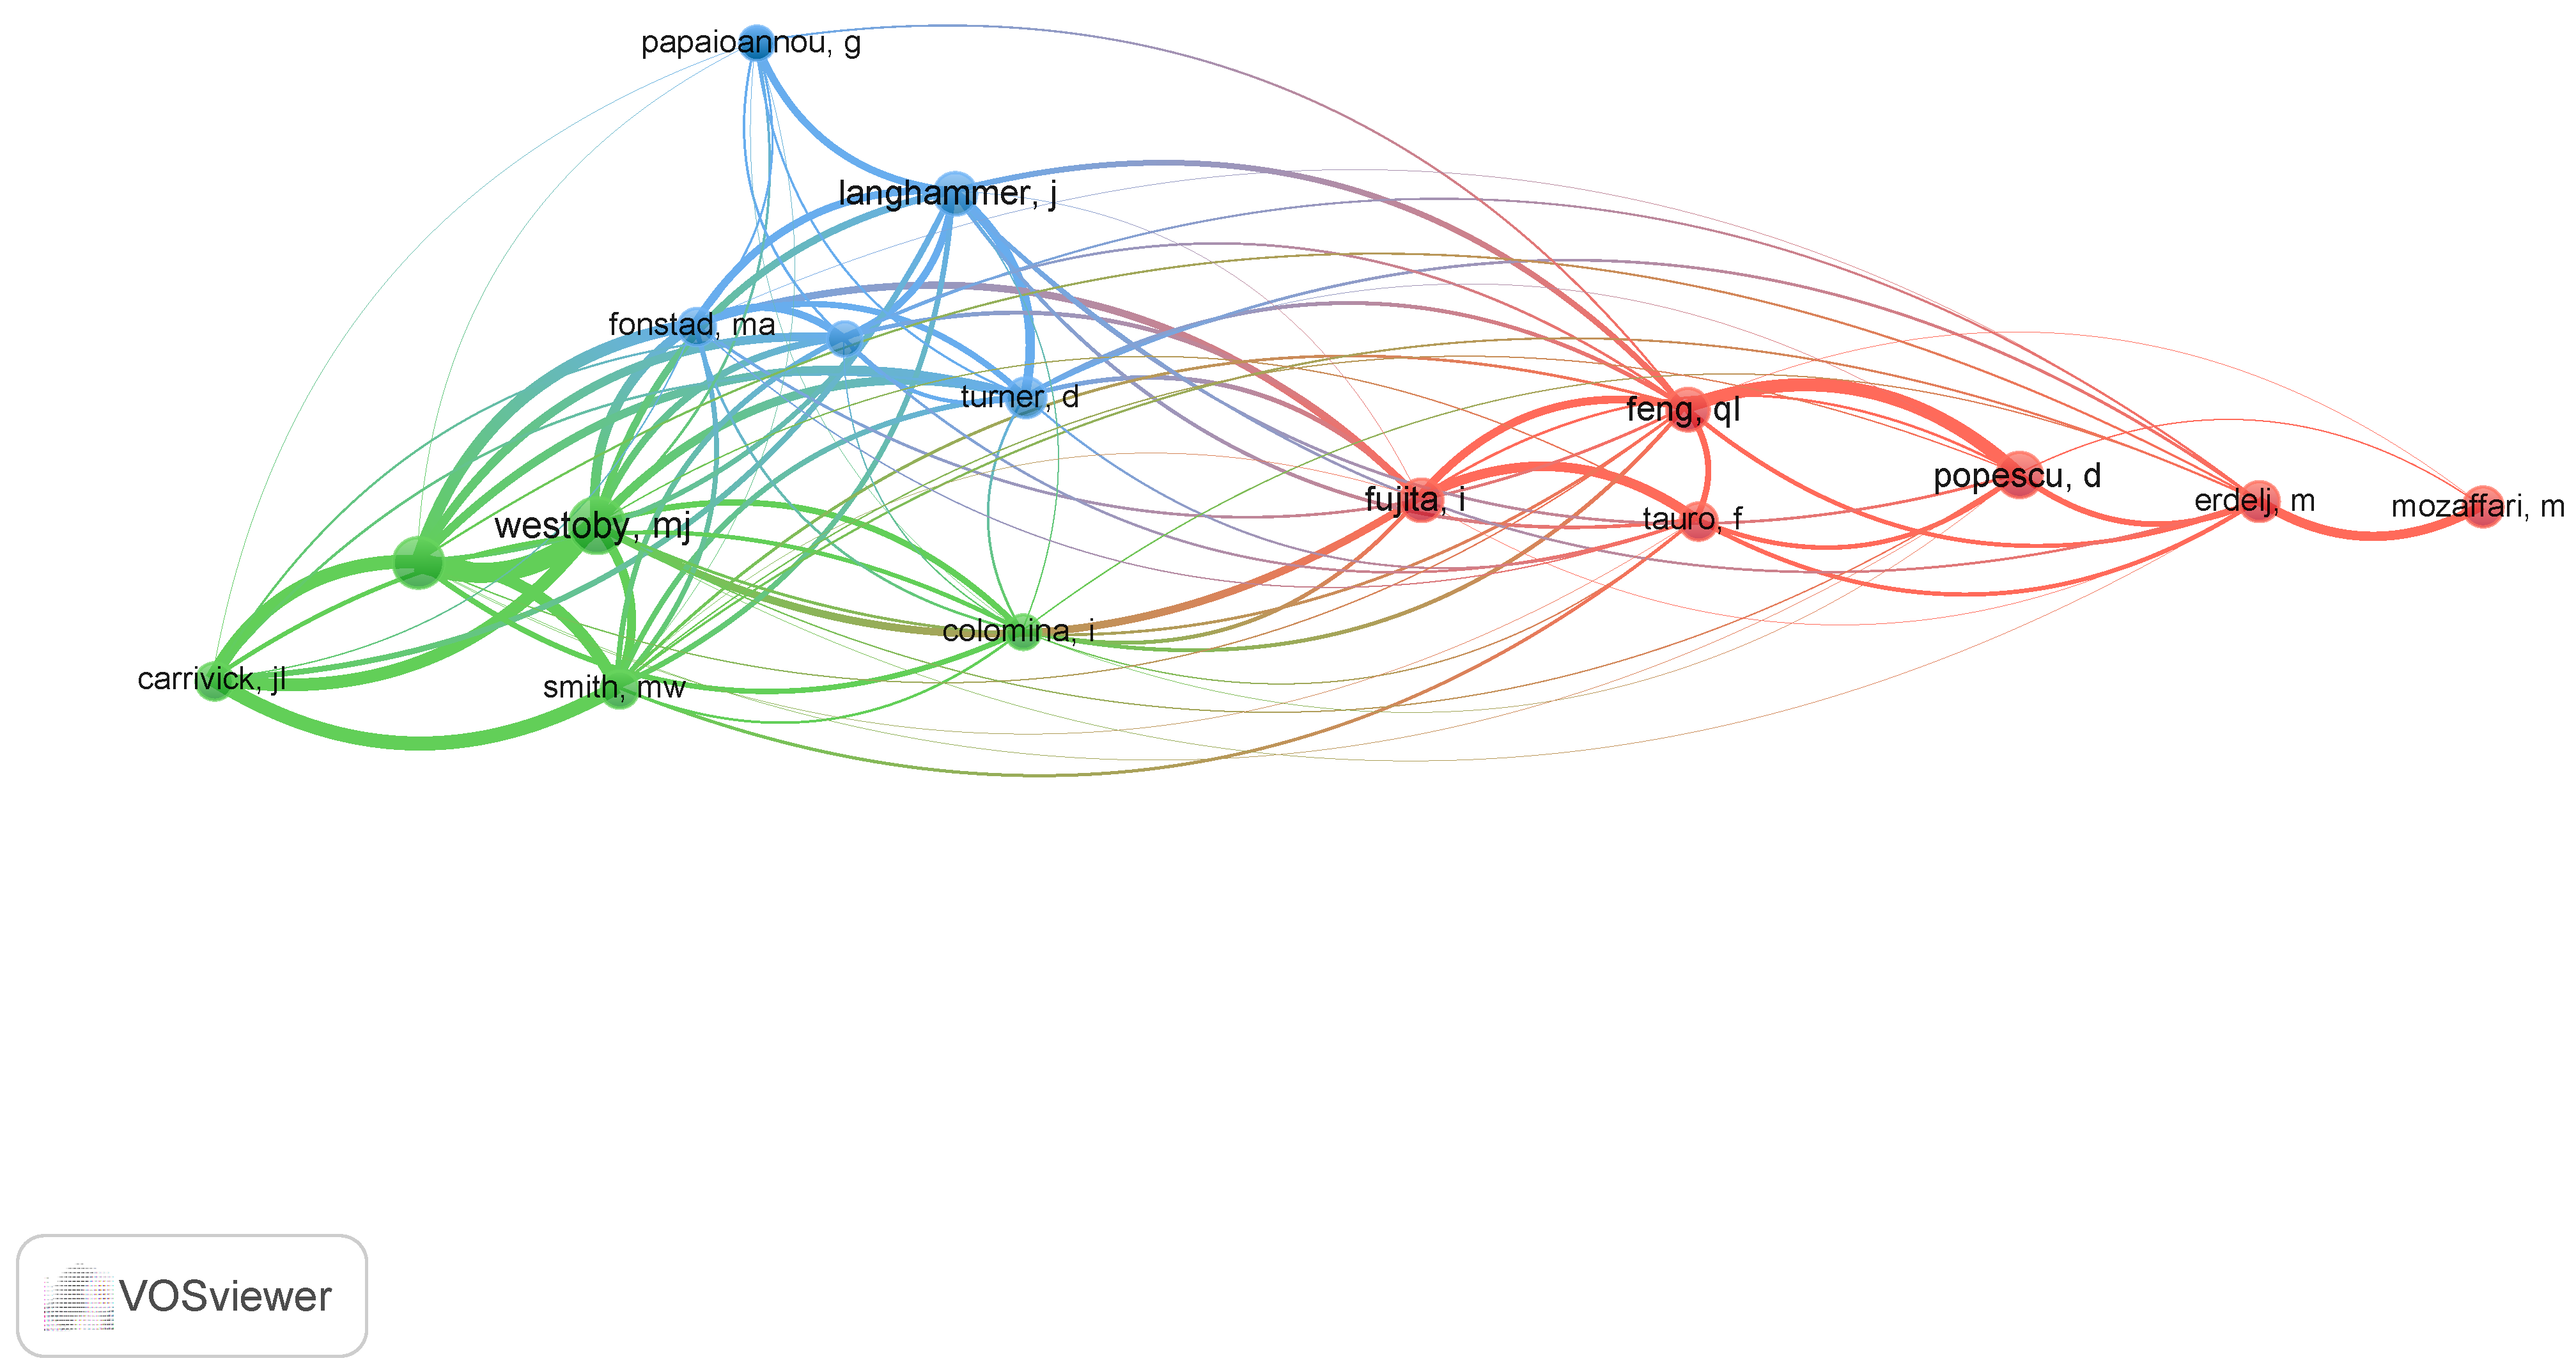
The manuscript reported detailed bibliometric analysis on the trends in the literature in the context of the use of drones for flood monitoring, mapping and detection. The performance analysis and science mapping were performed on a total of 569 bibliographic records exported from the Web of Science (WoS). The performance analysis suggested a rapid increase in the number of publications and corresponding citations from 2014 onwards, which may be related to the latest advancements in the drone-related technologies and the commercial availability of drones at cheap prices. The increasing trend of publications was also found to be common among other bibliometric reviews, which suggests that this may be associated with the change in academic dynamics. In terms of geographic distribution, the United States of America (USA) and Peoples Republic of China have emerged as the two countries with the highest numbers of publications. This trend may be associated with the number of recent flooding events and emphasis on disaster-mitigation policies. However, these two countries emerged on top among the bibliometric reviews on the other topics, which suggests that this trend likely to be associated with the number of universities and the rankings of the universities in these countries resulting in more publications. In terms of journals, Remote Sensing, Sensors and Water were found to be the top placed where related research was published. MDPI emerged as one of the top publishers where most recent research was published, which may be attributed to their rapid publication, high impact factors and open-access policy. The keyword co-occurrence analysis revealed UAVs, remote sensing, floods, drones, deep learning and artificial intelligence as trending terms, which suggests that drones equipped with the latest hardware sensors (e.g., camera and LiDAR) are used to capture the information, which later is analyzed using the latest computer vision algorithms to extract flood-relevant information. Furthermore, the focus of most recent research was observed to be towards development of novel computer vision and machine learning algorithms rather than purely towards drone hardware. In the bibliographic coupling and co-authorship analysis, the strongest collaboration for countries was observed to be between the USA and China, while for journals it was between Remote Sensing and Photogrammetry. These strong relationships suggest that similar research is being performed; however, it is also important to mention that benchmark research is being published by among one of these countries/journals, resulting in more coupled citations. Based on the detailed review of the 28 most-recent literature entries, flood-depth estimation using compute vision, flood-damage mapping, 3D reconstruction using structure from motion (SfM), surface-water detection and coastal flood monitoring were identified as the potential active areas of research. In the end, a process-driven analysis was performed, which indicated that most of the research is performed within the mitigation phase for addressing flood vulnerability mapping and flood-risk assessment needs. However, the recovery phase is completely being neglected despite having the potential for the use of drones in tasks such as reconstruction monitoring, debris removal monitoring and transport route monitoring. A few limitations of the performed bibliometric analysis are subjective discussions of the results, short-term forecasts only and an inability to assess the quality of the reported bibliographic records. A detailed systematic review streamlined to a more specific concept will lead into better and more detailed insights into the literature related to use of drones for flood-management activities.

Author Contributions

Conceptualization, U.I., M.Z.B.R., J.Z., J.B. and P.P.; methodology, U.I. and M.Z.B.R.; software, U.I.; validation, U.I., M.Z.B.R. and J.Z.; formal analysis, U.I.; investigation, U.I.; resources, U.I.; data curation, U.I.; writing—original draft preparation, U.I.; writing—review and editing, U.I., M.Z.B.R., J.Z., J.B. and P.P.; supervision, J.B. and P.P. All authors have read and agreed to the published version of the manuscript.

Funding

This research received no external funding.

Acknowledgments

I would like to thank Christian Ritz for his support in preparing and submitting the manuscript.

Conflicts of Interest

The authors declare no conflict of interest.

Abbreviations

The following abbreviations are used in this manuscript:
UAVsUnmanned Aerial Vehicles
LiDARLight Detection and Ranging
IRInfrared
AIArtificial Intelligence
WoSWeb of Science
USAUnited States of America
CNRConsiglio Nazionale Delle Ricerche
DEMDigital Elevation Model
AIoTArtificial Intelligence of Things
SfMStructure from Motion
DXMDigital Elevation-eXtended Model
SARSynthetic Aperture Radar
UAVSARUnmanned Aerial Vehicle Synthetic Aperture Radar
QoSQuality of Service
CNNsConvolutional Neural Networks
WLFZWater Level Fluctuation Zone
PSOParticle Swarm Optimization
GISGeographic Information System
GPRGround Penetrating Radar
RANSACRandom Sample Consensus
UASUnmanned Aerial System
DSMsDigital Surface Models

References

  1. Iqbal, U.; Perez, P.; Li, W.; Barthelemy, J. How computer vision can facilitate flood management: A systematic review. Int. J. Disaster Risk Reduct. 2021, 53, 102030. [Google Scholar] [CrossRef]
  2. Iqbal, U.; Riaz, M.Z.B.; Barthelemy, J.; Hutchison, N.; Perez, P. Floodborne Objects Type Recognition Using Computer Vision to Mitigate Blockage Originated Floods. Water 2022, 14, 2605. [Google Scholar] [CrossRef]
  3. Arshad, B.; Ogie, R.; Barthelemy, J.; Pradhan, B.; Verstaevel, N.; Perez, P. Computer vision and IoT-based sensors in flood monitoring and mapping: A systematic review. Sensors 2019, 19, 5012. [Google Scholar] [CrossRef] [Green Version]
  4. Nofal, O.M.; van de Lindt, J.W. High-resolution flood risk approach to quantify the impact of policy change on flood losses at community-level. Int. J. Disaster Risk Reduct. 2021, 62, 102429. [Google Scholar] [CrossRef]
  5. Abdel-Mooty, M.N.; Yosri, A.; El-Dakhakhni, W.; Coulibaly, P. Community flood resilience categorization framework. Int. J. Disaster Risk Reduct. 2021, 61, 102349. [Google Scholar] [CrossRef]
  6. Wasko, C.; Nathan, R.; Stein, L.; O’Shea, D. Evidence of shorter more extreme rainfalls and increased flood variability under climate change. J. Hydrol. 2021, 603, 126994. [Google Scholar] [CrossRef]
  7. Mondal, M.S.H. The implications of population growth and climate change on sustainable development in Bangladesh. J. Disaster Risk Stud. 2019, 11, 1–10. [Google Scholar] [CrossRef] [Green Version]
  8. Zeleňáková, M. Flood risk assessment and management in Slovakia. WIT Trans. Ecol. Environ. 2011, 146, 61–70. [Google Scholar]
  9. Iqbal, U.; Barthelemy, J.; Perez, P. Emerging role of unmanned aerial vehicles (UAVs) for disaster management applications. In Nanotechnology-Based Smart Remote Sensing Networks for Disaster Prevention; Elsevier: Amsterdam, The Netherlands, 2022; pp. 281–301. [Google Scholar]
  10. Mohsan, S.A.H.; Khan, M.A.; Noor, F.; Ullah, I.; Alsharif, M.H. Towards the unmanned aerial vehicles (UAVs): A comprehensive review. Drones 2022, 6, 147. [Google Scholar] [CrossRef]
  11. Alsamhi, S.H.; Shvetsov, A.V.; Kumar, S.; Shvetsova, S.V.; Alhartomi, M.A.; Hawbani, A.; Rajput, N.S.; Srivastava, S.; Saif, A.; Nyangaresi, V.O. UAV computing-assisted search and rescue mission framework for disaster and harsh environment mitigation. Drones 2022, 6, 154. [Google Scholar] [CrossRef]
  12. Hafeez, A.; Tiwari, V.; Verma, V.K.; Ansari, A.S.; Husain, M.A.; Singh, S.; Khan, A.N. Crop Monitoring and Automatic Weed Detection using Drone. In Proceedings of the 2021 International Conference on Control, Automation, Power and Signal Processing (CAPS), Jabalpur, India, 10–12 December 2021; pp. 1–4. [Google Scholar]
  13. Anghelache, D.; Persu, C.; Dumitru, D.; Bălţatu, C. Intelligent Monitoring Of Diseased Plants Using Drones. Ann. Univ.-Craiova-Agric. Mont. Cadastre Ser. 2021, 51, 146–151. [Google Scholar] [CrossRef]
  14. Supriya, C.; Murali Arthanari, P.; Kumaraperumal, R.; Sivamurugan, A. Optimization of Spray Fluid for Herbicide Application for Drones in Irrigated Maize (Zea mays L.). Agric. Food Sci. 2021, 33, 137–145. [Google Scholar] [CrossRef]
  15. Brahmanand, P.; Singh, A.K. Precision Irrigation Water Management-Current Status, Scope and Challenges. Indian J. Fertil. 2022, 18, 372–380. [Google Scholar]
  16. Stone, Z.; Parker, K.A. Unmanned aerial vehicle (UAV) activity elicits little to no response from New Zealand forest birds during wildlife monitoring. Notornis 2022, 69, 25–119. [Google Scholar]
  17. Ivanova, S.; Prosekov, A.; Kaledin, A. A Survey on Monitoring of Wild Animals during Fires Using Drones. Fire 2022, 5, 60. [Google Scholar] [CrossRef]
  18. Ecke, S.; Dempewolf, J.; Frey, J.; Schwaller, A.; Endres, E.; Klemmt, H.J.; Tiede, D.; Seifert, T. UAV-based forest health monitoring: A systematic review. Remote Sens. 2022, 14, 3205. [Google Scholar] [CrossRef]
  19. Sibanda, M.; Mutanga, O.; Chimonyo, V.G.; Clulow, A.D.; Shoko, C.; Mazvimavi, D.; Dube, T.; Mabhaudhi, T. Application of drone technologies in surface water resources monitoring and assessment: A systematic review of progress, challenges, and opportunities in the global south. Drones 2021, 5, 84. [Google Scholar] [CrossRef]
  20. Hemamalini, R.R.; Vinodhini, R.; Shanthini, B.; Partheeban, P.; Charumathy, M.; Cornelius, K. Air quality monitoring and forecasting using smart drones and recurrent neural network for sustainable development in Chennai city. Sustain. Cities Soc. 2022, 85, 104077. [Google Scholar] [CrossRef]
  21. Butcher, P.A.; Colefax, A.P.; Gorkin, R.A., III; Kajiura, S.M.; López, N.A.; Mourier, J.; Purcell, C.R.; Skomal, G.B.; Tucker, J.P.; Walsh, A.J.; et al. The drone revolution of shark science: A review. Drones 2021, 5, 8. [Google Scholar] [CrossRef]
  22. Taddia, Y.; Pellegrinelli, A.; Corbau, C.; Franchi, G.; Staver, L.W.; Stevenson, J.C.; Nardin, W. High-resolution monitoring of tidal systems using UAV: A case study on Poplar Island, MD (USA). Remote Sens. 2021, 13, 1364. [Google Scholar] [CrossRef]
  23. Casana, J.; Laugier, E.J.; Hill, A.C.; Reese, K.M.; Ferwerda, C.; McCoy, M.D.; Ladefoged, T. Exploring archaeological landscapes using drone-acquired lidar: Case studies from Hawaii, Colorado, and New Hampshire, USA. J. Archaeol. Sci. Rep. 2021, 39, 103133. [Google Scholar] [CrossRef]
  24. Roiha, J.; Heinaro, E.; Holopainen, M. The Hidden Cairns—A Case Study of Drone-Based ALS as an Archaeological Site Survey Method. Remote Sens. 2021, 13, 2010. [Google Scholar] [CrossRef]
  25. Nath, N.D.; Cheng, C.S.; Behzadan, A.H. Drone mapping of damage information in GPS-Denied disaster sites. Adv. Eng. Inform. 2022, 51, 101450. [Google Scholar] [CrossRef]
  26. Daud, S.M.S.M.; Yusof, M.Y.P.M.; Heo, C.C.; Khoo, L.S.; Singh, M.K.C.; Mahmood, M.S.; Nawawi, H. Applications of drone in disaster management: A scoping review. Sci. Justice 2022, 62, 30–42. [Google Scholar] [CrossRef]
  27. Munawar, H.S.; Hammad, A.W.; Waller, S.T. Disaster Region Coverage Using Drones: Maximum Area Coverage and Minimum Resource Utilisation. Drones 2022, 6, 96. [Google Scholar] [CrossRef]
  28. Munawar, H.S.; Gharineiat, Z.; Akram, J.; Imran Khan, S. A Framework for Burnt Area Mapping and Evacuation Problem Using Aerial Imagery Analysis. Fire 2022, 5, 122. [Google Scholar] [CrossRef]
  29. Munawar, H.S.; Hammad, A.W.; Waller, S.T. A review on flood management technologies related to image processing and machine learning. Autom. Constr. 2021, 132, 103916. [Google Scholar] [CrossRef]
  30. Gebrehiwot, A.A.; Hashemi-Beni, L. Three-dimensional inundation mapping using UAV image segmentation and digital surface model. ISPRS Int. J.-Geo-Inf. 2021, 10, 144. [Google Scholar] [CrossRef]
  31. Gebrehiwot, A.; Hashemi-Beni, L.; Thompson, G.; Kordjamshidi, P.; Langan, T.E. Deep convolutional neural network for flood extent mapping using unmanned aerial vehicles data. Sensors 2019, 19, 1486. [Google Scholar] [CrossRef] [Green Version]
  32. Jiménez-Jiménez, S.I.; Ojeda-Bustamante, W.; Ontiveros-Capurata, R.E.; Marcial-Pablo, M.d.J. Rapid urban flood damage assessment using high resolution remote sensing data and an object-based approach. Geomat. Nat. Hazards Risk 2020, 11, 906–927. [Google Scholar] [CrossRef]
  33. Singh, A.D.; Alvarez, F.V. Simulating gps-denied autonomous uav navigation for detection of surface water bodies. In Proceedings of the 2020 International Conference on Unmanned Aircraft Systems (ICUAS), Athens, Greece, 1–4 September 2020; pp. 1792–1800. [Google Scholar]
  34. Popescu, D.; Ichim, L.; Caramihale, T. Flood areas detection based on UAV surveillance system. In Proceedings of the 2015 19th International Conference on System Theory, Control and Computing (ICSTCC), Fundata, Romania, 14–16 October 2015; pp. 753–758. [Google Scholar]
  35. Karamuz, E.; Romanowicz, R.J.; Doroszkiewicz, J. The use of unmanned aerial vehicles in flood hazard assessment. J. Flood Risk Manag. 2020, 13, e12622. [Google Scholar] [CrossRef]
  36. Muhamat, A.A.; Zulkifli, A.F.; Ibrahim, M.A.; Sulaiman, S.; Subramaniam, G.; Mohamad, S.; Suzuki, Y. Realising the Corporate Social Performance (CSP) of Takaful (Islamic Insurance) Operators through Drone-Assisted Disaster Victim Identification (DVI). Sustainability 2022, 14, 5440. [Google Scholar] [CrossRef]
  37. Donthu, N.; Kumar, S.; Mukherjee, D.; Pandey, N.; Lim, W.M. How to conduct a bibliometric analysis: An overview and guidelines. J. Bus. Res. 2021, 133, 285–296. [Google Scholar] [CrossRef]
  38. Donthu, N.; Reinartz, W.; Kumar, S.; Pattnaik, D. A retrospective review of the first 35 years of the International Journal of Research in Marketing. Int. J. Res. Mark. 2021, 38, 232–269. [Google Scholar] [CrossRef]
  39. Danvila-del Valle, I.; Estévez-Mendoza, C.; Lara, F.J. Human resources training: A bibliometric analysis. J. Bus. Res. 2019, 101, 627–636. [Google Scholar] [CrossRef]
  40. Diodato, V.P.; Gellatly, P. Dictionary of Bibliometrics; Routledge: London, UK, 2013. [Google Scholar]
  41. Eck, N.J.V.; Waltman, L. VOS: A new method for visualizing similarities between objects. In Advances in Data Analysis; Springer: Berlin/Heidelberg, Germany, 2007; pp. 299–306. [Google Scholar]
  42. Persson, O.; Danell, R.; Schneider, J.W. How to use Bibexcel for various types of bibliometric analysis. Celebr. Sch. Commun. Stud. 2009, 5, 9–24. [Google Scholar]
  43. Chen, C. CiteSpace II: Detecting and visualizing emerging trends and transient patterns in scientific literature. J. Am. Soc. Inf. Sci. Technol. 2006, 57, 359–377. [Google Scholar] [CrossRef] [Green Version]
  44. Aria, M.; Cuccurullo, C. bibliometrix: An R-tool for comprehensive science mapping analysis. J. Inf. 2017, 11, 959–975. [Google Scholar] [CrossRef]
  45. Van Nunen, K.; Li, J.; Reniers, G.; Ponnet, K. Bibliometric analysis of safety culture research. Saf. Sci. 2018, 108, 248–258. [Google Scholar] [CrossRef]
  46. Mora, L.; Bolici, R.; Deakin, M. The first two decades of smart-city research: A bibliometric analysis. J. Urban Technol. 2017, 24, 3–27. [Google Scholar] [CrossRef]
  47. AlRyalat, S.A.S.; Malkawi, L.W.; Momani, S.M. Comparing bibliometric analysis using PubMed, Scopus, and Web of Science databases. JoVE J. Vis. Exp. 2019, 152, e58494. [Google Scholar] [CrossRef] [PubMed]
  48. Gorraiz, J.; Schloegl, C. A bibliometric analysis of pharmacology and pharmacy journals: Scopus versus Web of Science. J. Inf. Sci. 2008, 34, 715–725. [Google Scholar] [CrossRef] [Green Version]
  49. de Carvalho Pereira, F.; Verocai, H.D.; Cordeiro, V.R.; Gomes, C.F.S.; Costa, H.G. Bibliometric analysis of information systems related to innovation. Procedia Comput. Sci. 2015, 55, 298–307. [Google Scholar] [CrossRef] [Green Version]
  50. Garrigos-Simon, F.J.; Narangajavana-Kaosiri, Y.; Lengua-Lengua, I. Tourism and sustainability: A bibliometric and visualization analysis. Sustainability 2018, 10, 1976. [Google Scholar] [CrossRef]
  51. Gizzi, F.T.; Potenza, M.R. The scientific landscape of November 23rd, 1980 Irpinia-Basilicata Earthquake: Taking stock of (almost) 40 years of studies. Geosciences 2020, 10, 482. [Google Scholar] [CrossRef]
  52. Goerlandt, F.; Li, J.; Reniers, G. The landscape of risk communication research: A scientometric analysis. Int. J. Environ. Res. Public Health 2020, 17, 3255. [Google Scholar] [CrossRef]
  53. Iqbal, U.; Perez, P.; Barthelemy, J. A process-driven and need-oriented framework for review of technological contributions to disaster management. Heliyon 2021, 7, e08405. [Google Scholar] [CrossRef] [PubMed]
  54. McCabe, M.F.; Rodell, M.; Alsdorf, D.E.; Miralles, D.G.; Uijlenhoet, R.; Wagner, W.; Lucieer, A.; Houborg, R.; Verhoest, N.E.; Franz, T.E.; et al. The future of Earth observation in hydrology. Hydrol. Earth Syst. Sci. 2017, 21, 3879–3914. [Google Scholar] [CrossRef] [Green Version]
  55. Klemas, V.V. Coastal and environmental remote sensing from unmanned aerial vehicles: An overview. J. Coast. Res. 2015, 31, 1260–1267. [Google Scholar] [CrossRef] [Green Version]
  56. Liu, P.; Chen, A.Y.; Huang, Y.N.; Han, J.Y.; Lai, J.S.; Kang, S.C.; Wu, T.H.; Wen, M.C.; Tsai, M.H. A review of rotorcraft Unmanned Aerial Vehicle (UAV) developments and applications in civil engineering. Smart Struct. Syst. 2014, 13, 1065–1094. [Google Scholar] [CrossRef]
  57. Feng, Q.; Liu, J.; Gong, J. Urban flood mapping based on unmanned aerial vehicle remote sensing and random forest classifier—A case of Yuyao, China. Water 2015, 7, 1437–1455. [Google Scholar] [CrossRef]
  58. Tuna, G.; Nefzi, B.; Conte, G. Unmanned aerial vehicle-aided communications system for disaster recovery. J. Netw. Comput. Appl. 2014, 41, 27–36. [Google Scholar] [CrossRef]
  59. Van Eck, N.; Waltman, L. Software survey: VOSviewer, a computer program for bibliometric mapping. Scientometrics 2010, 84, 523–538. [Google Scholar] [CrossRef] [Green Version]
  60. Moral-Muñoz, J.A.; López-Herrera, A.G.; Herrera-Viedma, E.; Cobo, M.J. Science mapping analysis software tools: A review. In Springer Handbook of Science and Technology Indicators; Springer: Berlin/Heidelberg, Germany, 2019; pp. 159–185. [Google Scholar]
  61. van Eck, N.J.; Waltman, L. VOSviewer manual. In Manual for VOSviewer Version; Leiden University: Rapenburg, Netherlands, 2011; Volume 1. [Google Scholar]
  62. Da Fonseca-Soares, D.; Galvinicio, J.D.; Eliziário, S.A.; Ramos-Ridao, A.F. A Bibliometric Analysis of the Trends and Characteristics of Railway Research. Sustainability 2022, 14, 13956. [Google Scholar] [CrossRef]
  63. Iqbal, U.; Barthelemy, J.; Perez, P.; Davies, T. Edge-Computing Video Analytics Solution for Automated Plastic-Bag Contamination Detection: A Case from Remondis. Sensors 2022, 22, 7821. [Google Scholar] [CrossRef] [PubMed]
  64. Barthélemy, J.; Verstaevel, N.; Forehead, H.; Perez, P. Edge-computing video analytics for real-time traffic monitoring in a smart city. Sensors 2019, 19, 2048. [Google Scholar] [CrossRef] [Green Version]
  65. Iqbal, U.; Bin Riaz, M.Z.; Barthelemy, J.; Perez, P. Quantification of visual blockage at culverts using deep learning based computer vision models. Urban Water J. 2022, 1–13. [Google Scholar] [CrossRef]
  66. Iqbal, U.; Barthelemy, J.; Li, W.; Perez, P. Automating visual blockage classification of culverts with deep learning. Appl. Sci. 2021, 11, 7561. [Google Scholar] [CrossRef]
  67. Erdelj, M.; Natalizio, E.; Chowdhury, K.R.; Akyildiz, I.F. Help from the sky: Leveraging UAVs for disaster management. IEEE Pervasive Comput. 2017, 16, 24–32. [Google Scholar] [CrossRef]
  68. McDonald, W. Drones in urban stormwater management: A review and future perspectives. Urban Water J. 2019, 16, 505–518. [Google Scholar] [CrossRef]
  69. Akay, S.S.; Özcan, O.; Şanlı, F.B. Quantification and visualization of flood-induced morphological changes in meander structures by UAV-based monitoring. Eng. Sci. Technol. Int. J. 2022, 27, 101016. [Google Scholar] [CrossRef]
  70. Loli, M.; Mitoulis, S.A.; Tsatsis, A.; Manousakis, J.; Kourkoulis, R.; Zekkos, D. Flood characterization based on forensic analysis of bridge collapse using UAV reconnaissance and CFD simulations. Sci. Total Environ. 2022, 822, 153661. [Google Scholar] [CrossRef]
  71. Ye, S.; Zhang, Q.; Yan, F.; Ren, B.; Shen, D. A novel approach for high-quality drainage network extraction in flat terrains by using a priori knowledge of hydrogeomorphic features to extend DEMs: A case study in the Hoh Xil region of the Qinghai-Tibetan Plateau. Geomorphology 2022, 403, 108138. [Google Scholar] [CrossRef]
  72. Su, H.; Ma, J.; Zhou, R.; Wen, Z. Detect and identify earth rock embankment leakage based on UAV visible and infrared images. Infrared Phys. Technol. 2022, 122, 104105. [Google Scholar] [CrossRef]
  73. Kundu, S.; Lakshmi, V.; Torres, R. Flood Depth Estimation during Hurricane Harvey Using Sentinel-1 and UAVSAR Data. Remote Sens. 2022, 14, 1450. [Google Scholar] [CrossRef]
  74. Trepekli, K.; Balstrøm, T.; Friborg, T.; Fog, B.; Allotey, A.N.; Kofie, R.Y.; Møller-Jensen, L. UAV-borne, LiDAR-based elevation modelling: A method for improving local-scale urban flood risk assessment. Nat. Hazards 2022, 113, 423–451. [Google Scholar] [CrossRef]
  75. Khan, A.; Gupta, S.; Gupta, S.K. Emerging UAV technology for disaster detection, mitigation, response, and preparedness. J. Field Robot. 2022, 39, 905–955. [Google Scholar] [CrossRef]
  76. Papaioannou, G.; Markogianni, V.; Loukas, A.; Dimitriou, E. Remote Sensing Methodology for Roughness Estimation in Ungauged Streams for Different Hydraulic/Hydrodynamic Modeling Approaches. Water 2022, 14, 1076. [Google Scholar] [CrossRef]
  77. Song, Y.; Lee, H.; Kang, D.; Kim, B.; Park, M. A Study on the Determination Methods of Monitoring Point for Inundation Damage in Urban Area Using UAV and Hydrological Modeling. Water 2022, 14, 1117. [Google Scholar] [CrossRef]
  78. Alfonso-Torreño, A.; Schnabel, S.; Gómez-Gutiérrez, Á.; Crema, S.; Cavalli, M. Effects of gully control measures on sediment yield and connectivity in wooded rangelands. Catena 2022, 214, 106259. [Google Scholar] [CrossRef]
  79. Higgisson, W.; Cobb, A.; Tschierschke, A.; Dyer, F. The Role of Environmental Water and Reedbed Condition on the Response of Phragmites australis Reedbeds to Flooding. Remote Sens. 2022, 14, 1868. [Google Scholar] [CrossRef]
  80. Yang, C.M.; Chao, W.A.; Weng, M.C.; Fu, Y.Y.; Chang, J.M.; Huang, W.K. Outburst debris flow of Yusui Stream caused by a large-scale Silabaku landslide, Southern Taiwan. Landslides 2022, 19, 1807–1811. [Google Scholar] [CrossRef]
  81. Alberico, I.; Casalbore, D.; Pelosi, N.; Tonielli, R.; Calidonna, C.; Dominici, R.; De Rosa, R. Remote Sensing and Field Survey Data Integration to Investigate on the Evolution of the Coastal Area: The Case Study of Bagnara Calabra (Southern Italy). Remote Sens. 2022, 14, 2459. [Google Scholar] [CrossRef]
  82. Jiang, W.; Li, W.; Zhou, J.; Wang, P.; Xiao, H. Drone-based investigation of natural restoration of vegetation in the water level fluctuation zone of cascade reservoirs in Jinsha River. Sci. Rep. 2022, 12, 1–21. [Google Scholar] [CrossRef]
  83. Prabhu, B.; Lakshmi, R.; Ankitha, R.; Prateeksha, M.; Priya, N. RescueNet: YOLO-based object detection model for detection and counting of flood survivors. Model. Earth Syst. Environ. 2022, 8, 4509–4516. [Google Scholar] [CrossRef]
  84. Hernández, D.; Cano, J.C.; Silla, F.; Calafate, C.T.; Cecilia, J.M. AI-enabled autonomous drones for fast climate change crisis assessment. IEEE Internet Things J. 2021, 9, 7286–7297. [Google Scholar] [CrossRef]
  85. Bilasco, S.; Hognogi, G.G.; Roșca, S.; Pop, A.M.; Iuliu, V.; Fodorean, I.; Marian-Potra, A.C.; Sestras, P. Flash Flood Risk Assessment and Mitigation in Digital-Era Governance Using Unmanned Aerial Vehicle and GIS Spatial Analyses Case Study: Small River Basins. Remote Sens. 2022, 14, 2481. [Google Scholar] [CrossRef]
  86. Romagnoli, C.; Bosman, A.; Casalbore, D.; Anzidei, M.; Doumaz, F.; Bonaventura, F.; Meli, M.; Verdirame, C. Coastal Erosion and Flooding Threaten Low-Lying Coastal Tracts at Lipari (Aeolian Islands, Italy). Remote Sens. 2022, 14, 2960. [Google Scholar] [CrossRef]
  87. Guo, W.; Dong, C.; Lin, C.; Zhang, T.; Zhao, Z.; Li, J. 3D Sedimentary Architecture of Sandy Braided River, Based on Outcrop, Unmanned Aerial Vehicle and Ground Penetrating Radar Data. Minerals 2022, 12, 739. [Google Scholar] [CrossRef]
  88. Hagge-Kubat, T.; Fischer, P.; Süßer, P.; Rotter, P.; Wehinger, A.; Vött, A.; Enzmann, F. Multi-Methodological Investigation of the Biersdorf Hillslope Debris Flow (Rheinland-Pfalz, Germany) Associated to the Torrential Rainfall Event of 14 July 2021. Geosciences 2022, 12, 245. [Google Scholar] [CrossRef]
  89. Wang, E.; Hu, S.; Han, H.; Li, Y.; Ren, Z.; Du, S. Ice Velocity in Upstream of Heilongjiang Based on UAV Low-Altitude Remote Sensing and the SIFT Algorithm. Water 2022, 14, 1957. [Google Scholar] [CrossRef]
  90. Lei, T.; Wang, J.; Li, X.; Wang, W.; Shao, C.; Liu, B. Flood Disaster Monitoring and Emergency Assessment Based on Multi-Source Remote Sensing Observations. Water 2022, 14, 2207. [Google Scholar] [CrossRef]
  91. Giulietti, N.; Allevi, G.; Castellini, P.; Garinei, A.; Martarelli, M. Rivers’ Water Level Assessment Using UAV Photogrammetry and RANSAC Method and the Analysis of Sensitivity to Uncertainty Sources. Sensors 2022, 22, 5319. [Google Scholar] [CrossRef] [PubMed]
  92. Giannitsopoulos, M.L.; Leinster, P.; Butler, D.; Smith, M.; Rivas Casado, M. Towards the coordinated and fit-for-purpose deployment of Unmanned Aerial Systems (UASs) for flood risk management in England. AQUA Water Infrastruct. Ecosyst. Soc. 2022, 71, 879–895. [Google Scholar] [CrossRef]
  93. Amphawan, A.; Arsad, N.; Neo, T.K.; Jasser, M.B.; Mohd Ramly, A. Post-Flood UAV-Based Free Space Optics Recovery Communications with Spatial Mode Diversity. Electronics 2022, 11, 2257. [Google Scholar] [CrossRef]
  94. Belcore, E.; Piras, M.; Pezzoli, A. Land Cover Classification from Very High-Resolution UAS Data for Flood Risk Mapping. Sensors 2022, 22, 5622. [Google Scholar] [CrossRef] [PubMed]
  95. Hidayah, E.; Halik, G.; Indarto, I.; Khaulan, D.W. Flood hazard mapping of the Welang river, Pasuruan, East Java, Indonesia. J. Appl. Water Eng. Res. 2022, 24, 1–12. [Google Scholar] [CrossRef]
Figure 1. Research approach for performing the presented bibliometric analysis.
Drones 07 00032 g001
Figure 2. Trends for number of publications and citations.
Drones 07 00032 g002
Figure 3. Network map of citations for countries. Each node represents a country, node size corresponds to the number of publications by each country, the link between two nodes denotes the citation relationship between two countries, the width of the link denotes the strength of the citation relationship, the distance between two nodes defines how closely the two countries are related and colors define the citation-based clusters to which countries belong.
Drones 07 00032 g003
Figure 4. Overlay map of citations for countries. Each node represents a country, node size corresponds to the number of publications by each country, the link between two nodes denotes the citation relationship between two countries, the width of the link denotes the strength of the citation relationship and the distance between two nodes defines how closely the two countries are related.
Drones 07 00032 g004
Figure 5. Network map of citations for journals. Each node represents a journal, node size corresponds to the number of publications by the journal, the link between two nodes denotes the citation relationship between two journals, the width of the link denotes the strength of the citation relationship, the distance between two nodes defines how closely the journals are related and colors define the citation-based clusters to which journals belong.
Drones 07 00032 g005
Figure 6. Overlay map of citations for journals. Each node represents a journal, node size corresponds to the number of publications by the journal, the link between two nodes denotes the citation relationship between two journal, the width of the link denotes the strength of the citation relationship and the distance between two nodes defines how closely they journals are related.
Drones 07 00032 g006
Figure 7. Network map of co-occurrence of author keywords. Each node represents a keyword, node size corresponds to the number of occurrences for each keyword, the link between two nodes denotes the co-occurrence relationship between two keywords, the width of the link denotes the strength of the co-occurrence relationship, the distance between two nodes defines how closely two keywords are related and the colors define the co-occurrence-based clusters to which keywords belong.
Drones 07 00032 g007
Figure 8. Overlay map of co-occurrences for author keywords. Each node represents a keyword, node size corresponds to the number of occurrences for each keyword, the link between two nodes denotes the co-occurrence relationship between two keywords, the width of the link denotes the strength of the co-occurrence relationship and the distance between two nodes defines how closely the two keywords are related.
Drones 07 00032 g008
Figure 9. Network map of co-authorship across countries. Each node represents an author, node size corresponds to the number of publications by each author, the link between two nodes denotes the co-authorship relationship between two authors, the width of the link denotes the strength of the co-authorship relationship, the distance between two nodes defines how closely two authors are related and colors define the co-authorship-based clusters to which authors belong.
Drones 07 00032 g009
Figure 10. Network map of co-citations among authors. Each node represents an author, node size corresponds to the number of citations by each author, a link between two nodes denotes the co-citation relationship between the two authors, the width of the link denotes the strength of the co-citation relationship, the distance between two nodes defines how closely the authors are related and colors define the co-citation-based cluster to which authors belong.
Drones 07 00032 g010
Figure 11. Network map of bibliographic coupling among countries. Each node represents a country, node size corresponds to the number of publications by each country, the link between two nodes denotes the bibliographic coupling relationship between two countries, the width of the link denotes the strength of the bibliographic coupling relationship, distance between two nodes defines how closely the two countries are related and colors define the bibliographic coupling-based clusters to which countries belong.
Drones 07 00032 g011
Figure 12. Network map of bibliographic coupling among journals. Each node represents a journal, node size corresponds to the number of publications by the journal, the link between two nodes denotes the bibliographic coupling relationship between the two journals, the width of the link denotes the strength of the bibliographic coupling relationship, the distance between two nodes defines how closely the two journals are related, colors define the bibliographic coupling-based clusters to which journals belong.
Drones 07 00032 g012
Table 1. List of research questions.
How have drones/UAVs been used for flood-management activities?
How have drones/UAVs been used for flood mapping?
How have drones/UAVs been used for flood monitoring?
How have drones/UAVs been used for flood detection?
What drone technologies are useful for flood management?
Table 2. Top-5 publications with the most citations in the context of use of drones for flood monitoring, mapping and detection.
Serial #TitleAuthors# of Citations
1The future of Earth observation in hydrologyMcCabe et al. [54]229
2Coastal and Environmental Remote Sensing from Unmanned
Aerial Vehicles: An Overview
Klemas, VV [55]193
3A review of rotorcraft Unmanned Aerial Vehicle (UAV) developments
and applications in civil engineering
Liu et al. [56]173
4Urban Flood Mapping Based on Unmanned Aerial Vehicle Remote
Sensing and Random Forest Classifier-A Case of Yuyao, China
Feng et al. [57]162
5Unmanned aerial vehicle-aided communications system for disaster recoveryTuna et al. [58]105
Table 3. Top ten countries with highest numbers of publications.
CountryNumber of PublicationsPercentage out of Total
United States of America (USA)11519.69%
Peoples Republic of China8314.21%
Italy539.07%
England366.16%
India366.16%
Romania315.30%
France284.79%
Spain284.79%
Germany254.21%
Japan244.11%
Table 4. Top ten journals with the highest numbers of publications.
JournalNumber of PublicationsPercentage out of TotalImpact FactorJCR Rank
Remote Sensing (MDPI)457.75%5.34Q1
Water (MDPI)172.91%3.53Q1
Sensors (MDPI)142.39%3.84Q1
Geomorphology122.05%4.40Q1
ISPRS111.88%11.77Q1
Drones91.54%5.53Q1
Earth Surface Processes and Landforms81.37%3.95Q1
Frontiers in Earth Science81.37%3.66Q1
Science of the Total Environment81.37%10.75Q1
IEEE Access71.19%3.36Q1
Table 5. Top ten institutions with the highest numbers of publications.
InstitutionNumber of PublicationsPercentage out of Total
Polytechnic University of Bucharest233.93%
Chinese Academy of Sciences172.91%
Consiglio Nazionale Delle Ricerche122.05%
Texas AM University System111.88%
University of North Carolina111.88%
Istanbul Technical University101.71%
UDICE French Research Universities101.71%
Beijing Normal University91.54%
Centre National De La Recherche Scientifique91.54%
University of New South Wales91.54%
Table 6. Top ten publishers with the highest numbers of publications.
PublisherNumber of PublicationsPercentage out of Total
IEEE14023.97%
MDPI12220.89%
Elsevier8514.55%
Springer Nature396.67%
Wiley355.99%
Copernicus Gesellschaft Mbh264.45%
Taylor & Francis162.74%
Frontiers Media101.71%
Iop Publishing Ltd91.54%
Spie-Int Soc Optical Engineering91.54%
Table 7. Top ten WoS categories with the highest numbers of publications.
WoS CategoriesNumber of PublicationsPercentage out of Total
Geosciences Multidisciplinary16628.42%
Environmental Sciences13222.60%
Remote Sensing13022.26%
Engineering Electrical Electronic12120.71%
Imaging Science Photographic Technology8214.04%
Water Resources7913.52%
Telecommunications6711.47%
Geography Physical6210.61%
Computer Science Information Systems498.39%
Engineering Civil345.82%
Table 8. Process-driven analysis of the most recent literature on the use of drones for flood detection, monitoring and mapping.
ArticleDatePhaseNeeds/TaskAssessment/ActivityTechnology Used
Akay et al. [69]04-06-2021MitigationFlood Prevention MeasuresStructural MonitoringSfM, DEM
Loli et al. [70]03-02-2022MitigationDamage AssessmentsBridge Damage Analysis3D modelling, CFD
Ye et al. [71]04-02-2022MitigationFlood Vulnerability MappingDrainage Network MappingDXM
Su et al. [72]23-02-2022PreparednessFlood MonitoringHydraulic Structure Leakage DetectionImage Segmentation
Kundu et al. [73]17-03-2022ResponseFlood Detection and MappingFlood Depth EstimationSAR, LiDAR
Trepekli et al. [74]22-03-2022MitigationFlood Risk Analysis and ManagementFlood Risk AssessmentLiDAR
Khan et al. [75]28-03-2022All (survey article)NAMany (survey article)NA
Papaioannou et al. [76]29-03-2022MitigationFlood Vulnerability MappingStream Roughness Coefficient MappingDEMs
Song et al. [77]31-03-2022MitigationFlood Risk Analysis and ManagementFlood Risk AssessmentTopographic Data Analysis
Alfonso-Torreno et al. [78]02-04-2022MitigationFlood Risk Analysis and ManagementSediment Transport AssessmentDrone Captured Images
Higgisson et al. [79]13-04-2022MitigationFlood Risk Analysis and ManagementFloodplain Vegetation MonitoringCNN
Yang et al. [80]22-04-2022ResponseFlood Damage AnalysisPost Flood AssessmentsLiDAR
Alberico et al. [81]29-04-2022MitigationFlood Risk Analysis and ManagementCoastal MonitoringHigh-Resolution UAV Images
Jiang et al. [82]01-05-2022MitigationFlood Risk Analysis and ManagementReservoir Vegetation AssessmentUAVs and Field Research
Prabhu et al. [83]07-05-2022ResponseFlood ResponseFlood Victim DetectionUAVs, Deep Learning, YOLO
Hernandez et al. [84]09-05-2022ResponseFlood Scope and MappingFlood DetectionComputer Vision, Deep Learning
Munawar et al. [27]13-05-2022Response/RecoveryFlood Scope and MappingPost-Flood Coverage MappingPSO
Bilasco et al. [85]20-05-2022MitigationFlood Risk Analysis and ManagementStructural Risk AssessmentGIS, UAVs
Romagnoli et al. [86]22-05-2022MitigationFlood Risk Analysis and ManagementCoastal MonitoringPhotogrammetry, UAVs
Guo et al. [87]10-06-2022MitigationFlood Risk Analysis and ManagementRiver Sediment BehaviourUAV, GPR
Hagge-Kubat et al. [88]14-06-2022MitigationFlood Risk Analysis and ManagementDebris Flow InvestigationUAV, Photogrammetry
Wang et al. [89]18-06-2022PreparednessFlood MonitoringIce Velocity MonitoringUAVs, Computer Vision
Lei et al. [90]13-07-2022ResponseFlood Scope and MappingFlood Monitoring and DetectionUAVs, Remote Sensing
Giulietti et al. [91]16-07-2022PreparednessFlood MonitoringWater Level EvaluationUAVs, Photogrametry
Giannitsopoulos et al. [92]18-07-2022All (survey article)NAMany (survey article)NA
Amphawan et al. [93]19-07-2022Response/RecoveryFlood ResponseEfficient Communication NetworksDrones based Networks
Belcore et al. [94]27-07-2022MitigationFlood Vulnerability MappingLand Cover MappingMultispectral Images
Hidayah et al. [95]13-08-2022MitigationVulnerability MappingFlood Hazard Mapping2D Modelling, DSM
Disclaimer/Publisher’s Note: The statements, opinions and data contained in all publications are solely those of the individual author(s) and contributor(s) and not of MDPI and/or the editor(s). MDPI and/or the editor(s) disclaim responsibility for any injury to people or property resulting from any ideas, methods, instructions or products referred to in the content.

