Article

Design and Implementation of UAVs for Bird’s Nest Inspection on Transmission Lines Based on Deep Learning

Department of Aeronautics and Astronautics, Fudan University, Shanghai 200433, China
*
Author to whom correspondence should be addressed.
Drones 2022, 6(9), 252; https://doi.org/10.3390/drones6090252
Submission received: 1 September 2022 / Revised: 8 September 2022 / Accepted: 8 September 2022 / Published: 13 September 2022
(This article belongs to the Section Drone Design and Development)

Abstract

:
In recent years, unmanned aerial vehicles (UAV) have been increasingly used in power line inspections. Birds often nest on transmission line towers, which threatens safe power line operation. The existing research on bird’s nest inspection using UAVs mainly stays at the level of image postprocessing detection, which has poor real-time performance and cannot obtain timely bird’s nest detection results. Considering the above shortcomings, we designed a power inspection UAV system based on deep learning technology for autonomous flight, positioning and photography, real-time bird nest detection, and result export. In this research, 2000 bird’s nest images in the actual power inspection environment were shot and collected to create the dataset. The parameter optimization and test comparison for bird’s nest detection are based on the three target detection models of YOLOv3, YOLOv5-s, and YOLOX-s. A YOLOv5-s bird’s nest detection model optimized for bird’s nest real-time detection is proposed, and it is deployed to the onboard computer for real-time detection and verification during flight. The DJI M300 RTK UAV was used to conduct a test flight in a natural power inspection environment. The test results show that the mAP of the UAV system designed in this paper for bird’s nest detection is 92.1%, and the real-time detection frame rate is 33.9 FPS. Compared with the previous research results, this paper proposes a new practice of using drones for bird’s nest detection, dramatically improving the real-time accuracy of bird’s nest detection. The UAV system can efficiently complete the task of bird’s nest detection in the process of electric power inspection, which can significantly reduce manpower consumption in the power inspection process.

1. Introduction

Power line inspection effectively ensures safe transmission network operation, and transmission line tower inspection is an important part of the power line inspection work. In recent years, birds have frequently nested on transmission line towers, which seriously threatens safe power line operation. At present, the area of high-voltage overhead transmission lines is constantly expanding, and many lines are located in mountainous areas with complex terrain. In this environment, birds often build their nests on transmission line towers or insulators [1].
In the past, inspecting transmission lines was mainly performed manually. In en-vironments with complex terrain, the efficiency of manual inspection was low. With the rapid development of UAV technology, the application of UAV power inspection technology can greatly improve transmission line inspection work efficiency. Traditional UAV power inspection mainly relies on manual UAV flight control, and the transmission line towers are photographed in the form of aerial photography. A large number of generated photos need to be manually checked and recorded after the flight. With the development of artificial intelligence technology, an increasing number of scholars are paying attention to UAV autonomous power inspection technology [2,3,4,5,6].
The core of realizing autonomous UAV power inspection is to perform automatic target detection on images. In recent years, target detection based on deep learning has become a popular research direction in the computer vision field. Many new target detection algorithms have been proposed and applied in the autonomous UAV power inspection field. From 2014 to the present, starting with the R-CNN algorithm proposed in [7], these algorithms have used deep learning technology to automatically extract hidden features in input images to classify and predict samples with a higher accuracy. With the continuous breakthroughs in deep learning and computer vision, many deep learning-based image target detection algorithms have emerged after R-CNN, such as Fast R-CNN [8], Faster R-CNN [9], and YOLO.
Deep learning is a class of multilayer neural network algorithms that can automatically learn the internal structure of the data hidden in the training data through supervised, semi-supervised, or unsupervised training methods. According to whether there is an explicit region proposal, the target detection algorithm can be divided into a two-stage target detection algorithm and a one-stage target detection algorithm. The two-stage target detection algorithm is also called the target detection algorithm based on the region proposal or the target detection algorithm based on the region of interest. This type of algorithm transforms the detection problem into a classification problem with pictures in the generated proposed region through explicit region proposals. Representative two-stage object detection algorithms include R-CNN and Fast R-CNN. The one-stage target detection algorithm is also called the regression-based target detection algorithm. This type of algorithm does not directly generate the region of interest but regards the target detection task as a regression task for the entire image. Representative one-stage target detection algorithms include YOLO and SSD. Figure 1 shows the general framework of these two classes of object detection algorithms.
At present, the application of deep learning in UAV power inspection is mainly for detecting insulators and U-bolt groups, and there are few studies on the automatic detection of bird’s nests on transmission lines. Based on an enhanced Faster R-CNN for aerial images, Reference [10] proposed a detection example of a tower insulator and U-bolt group, which proved the detection effectiveness of deep learning on aerial images of overhead lines. Based on the YOLOv2 deep learning model, Reference [11] proposed an insulator detection and evaluation method. Based on aerial images captured by UAVs, it can detect insulators in clean backgrounds, with different object resolutions and lighting conditions. Experiments showed that the method can accurately locate the insulators in real-time UAV-based image data. The detected insulator images were then successfully evaluated for the insulator surface condition using different classifiers to assess the presence of ice, snow, and water. Reference [12] proposed a detection method for UAV electrical components based on the YOLOv3 algorithm. On this basis, the super-resolution convolutional neural network (SRCNN) was used to realize the super-resolution reconstruction of the blurred image, and the dataset was realized. The experiment proved that the technology improves the UAV recognition robustness of UAV power inspection systems. At present, there are few related studies on the use of drones to detect bird nests on transmission lines. a method for bird’s nest detection on transmission lines using drone images was proposed by Reference [13]. This paper proposes a deep learning-based bird’s nest detection method. For the automatic detection framework, the prior dimension of anchors is obtained by using K-means clustering to improve the coordinate frame generation accuracy. The bird’s nest automatic detection framework proposed in this work achieves high detection accuracy.
The above work studies the postdetection of the pictures taken by UAV power inspection based on deep learning. However, there are still many problems with how to perform the real-time detection of airborne images during the real-time UAV flight. On this basis, how to superimpose the detection results into the real-time video stream captured by the drone so that staff can view and process it in time still needs to be further studied and solved.

2. Materials and Methods

To improve the efficiency of UAV bird’s nest inspection of transmission lines and to consider future practical applications, a complete workflow is formulated according to the functions to be realized by this system. The workflow of the system is shown in Figure 2.
Before the UAV performs an inspection mission, it is necessary to set the waypoints and photo task points of the inspection line. This process relies on the generated power line laser point cloud model or manually setting the waypoints. According to the power inspection personnel’s experience and actual situation, the drone’s bird’s nest usually exists in the tower body and the power cable part of the transmission line tower. Therefore, when setting the shooting angle of the drone, the method shown in Figure 3 is usually used. The waypoint planning software can simulate and debug the expected photographing effect.
After the UAV and the onboard computer are turned on, the inspectors first preset the waypoint information of the line to be inspected and upload it to the UAV, where the waypoint information includes the photos that the UAV needs to perform at each waypoint. According to the task and camera angle, the drone takes off autonomously according to the waypoint information of the inspection route obtained and automatically takes pictures after arriving at the waypoint.
During this process, the onboard computer pulls the video stream of the drone’s camera gimbal in real time, obtains the photos taken, and performs bird’s nest detection and identification for the video stream and photo synchronization. The map interface of the recognition software is displayed. After the drone completes a single inspection mission according to the waypoint and lands, the bird’s nest detection software will automatically generate a KML location record file and a photo of the bird’s nest detected to the U disk inserted into the onboard computer, which can then be viewed in the map software on the PC.

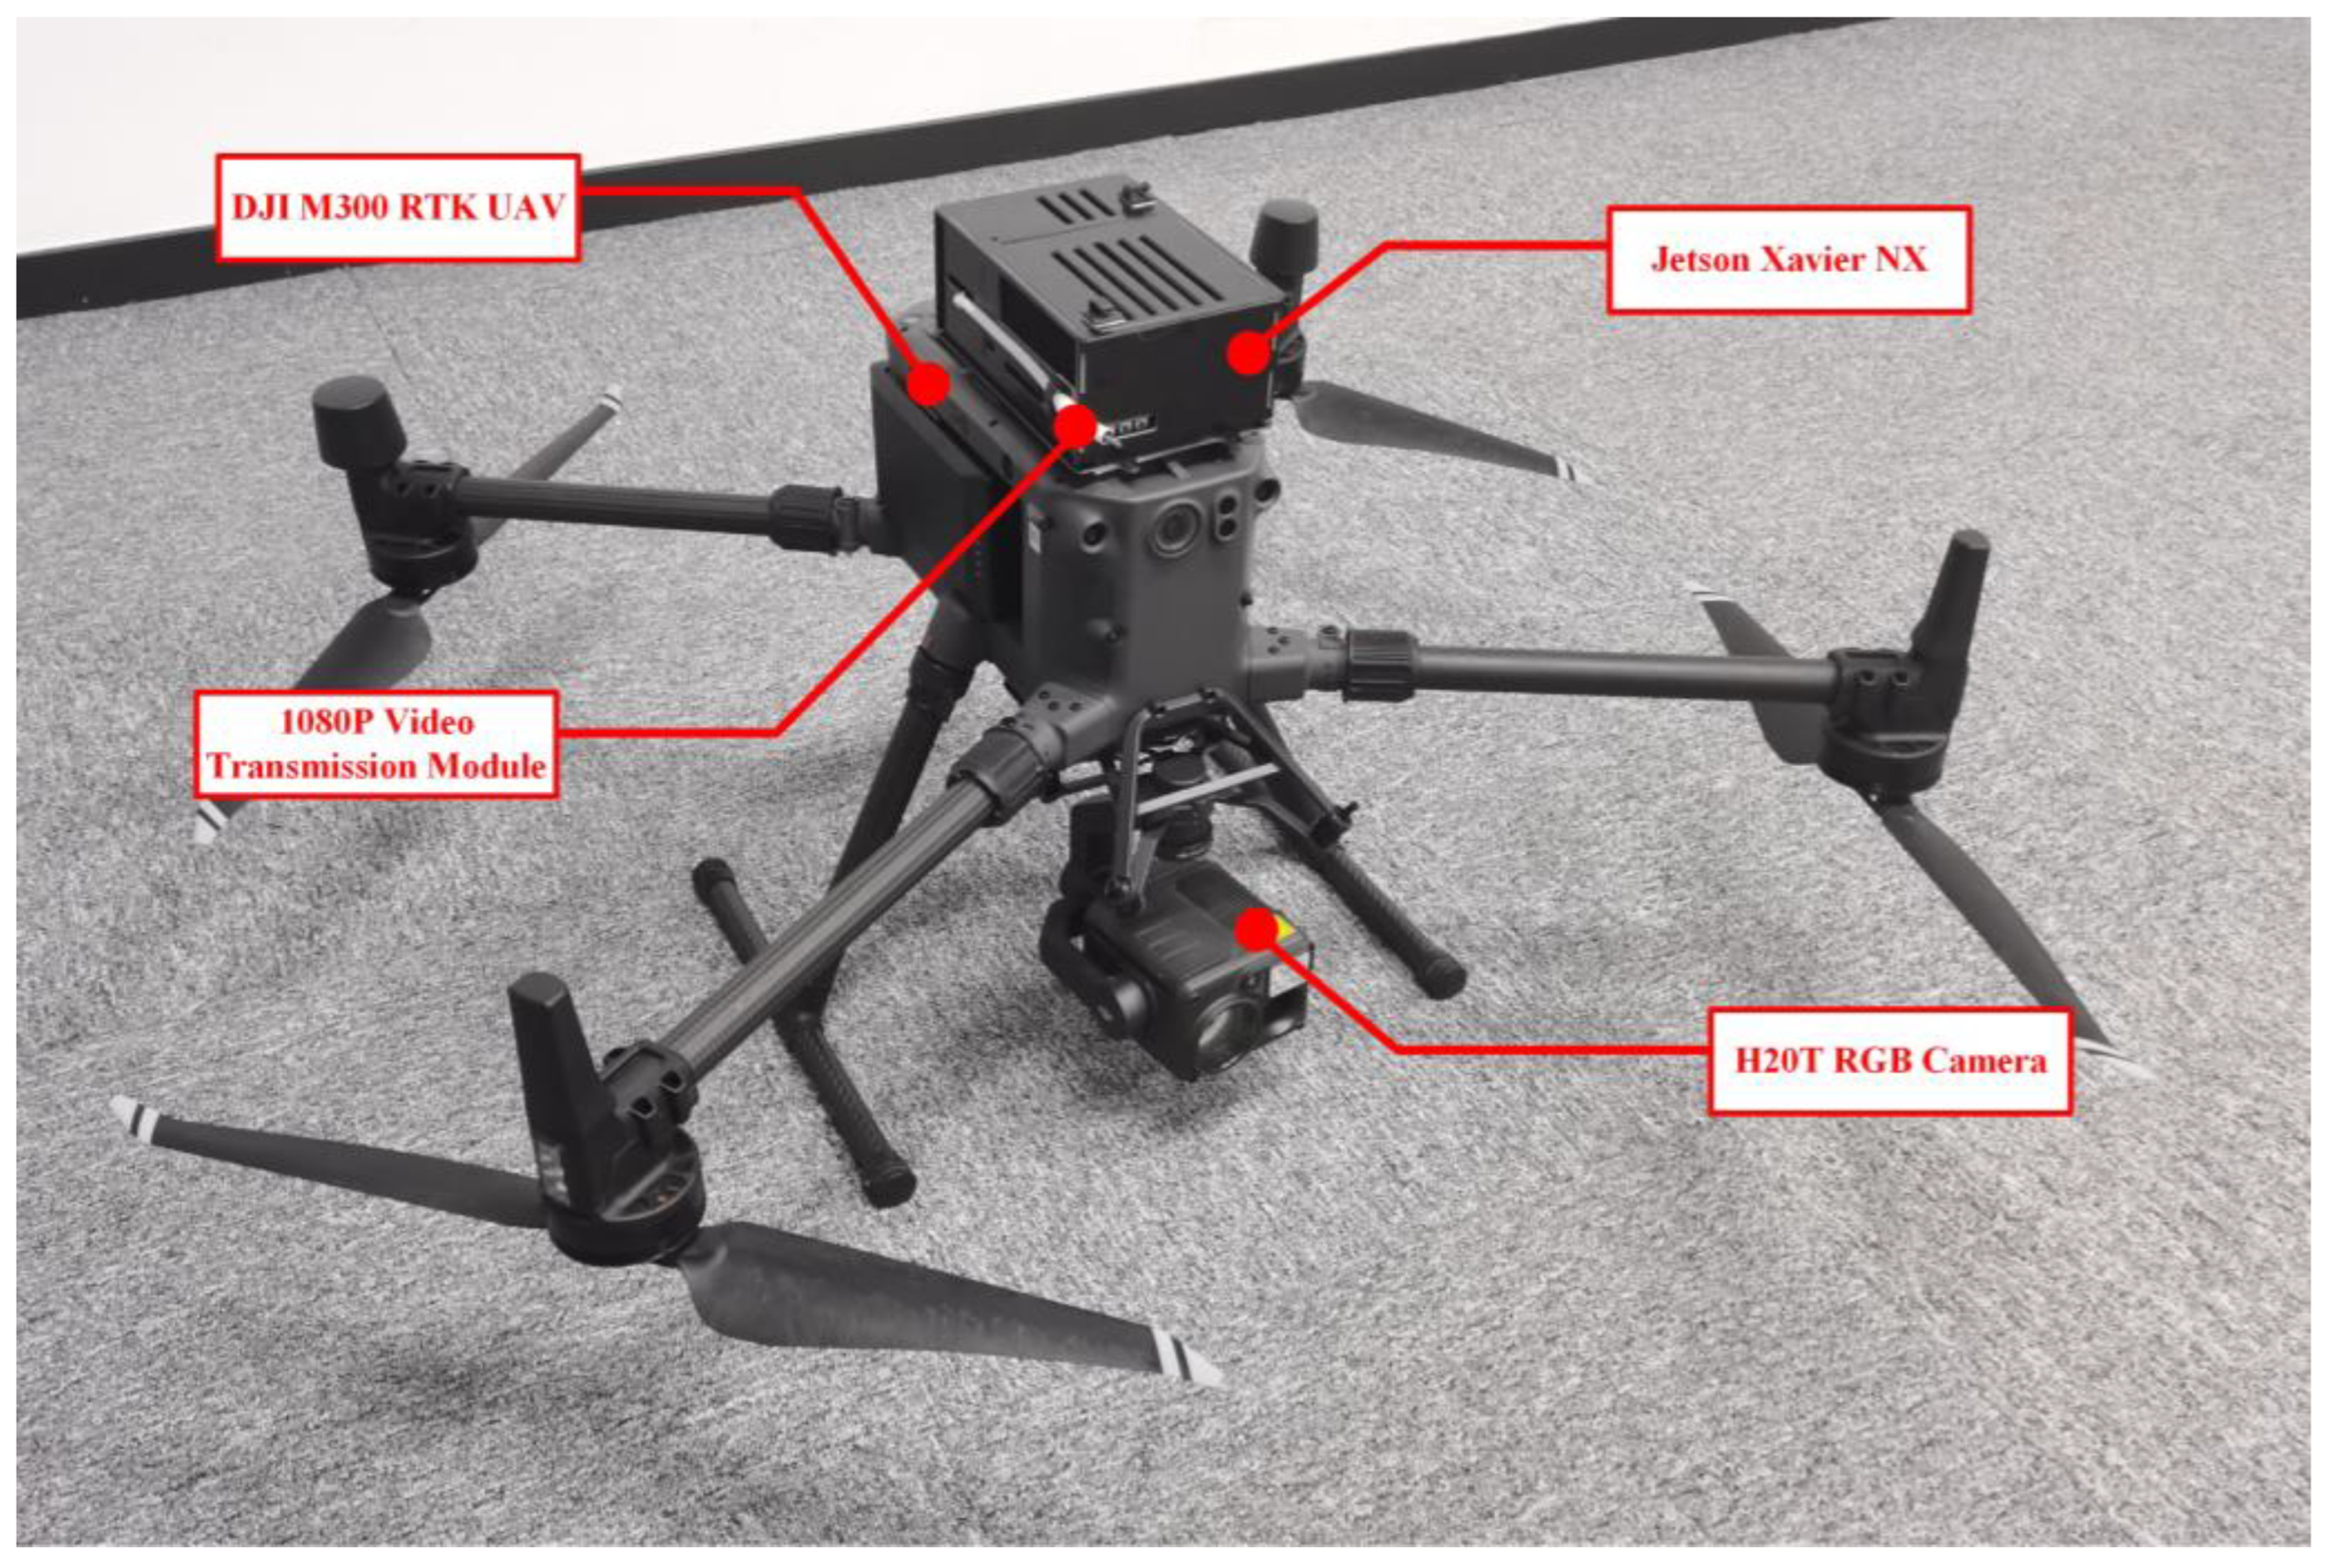
2.1. Hardware Design

This system uses the DJI M300 RTK UAV as the development test and flight test platform and the Nvidia Jetson Xavier NX as the onboard computer for developing and testing deep learning algorithms. The M300 RTK UAV provides the Onboard SDK for development, and using the SDK greatly improves the software development efficiency. To ensure the good operation of the entire hardware system, a 1080P video transmission module is also configured, which is used to transmit the software running picture of the airborne computer back to the ground for real-time monitoring.
The hardware schematic of the UAV system we designed for bird’s nest detection is shown in Figure 4.
The DJI M300 RTK UAV integrates a flight control system, binocular vision, and an FPV camera, with functions, such as six-direction positioning, obstacle avoidance, and precise reshooting. It not only ensures flight safety but also provides necessary functions suitable for power inspection applications [14]. H20T was selected as the airborne gimbal during the development and implementation of this project. The functional parameters of the DJI M300 RTK UAV and H20T RGB camera are shown in Table 1.
In the design process of the UAV system, we also fully consider the influence of the magnetic field existing in the overhead transmission line on the navigation of the UAV. According to the research results of several works of literature and national standard inquiries [15,16,17], it is found that for the operation of 500 kV and 750 kV AC transmission lines, the safety distance between the UAV and the transmission line should generally not be less than 5 m. In our implementation process, in order to ensure the safety of the experiment, Increase the safety distance to 20 m. The use of the H20T optical zoom camera can ensure the shooting effect of photos, while satisfying the need for drones to eliminate magnetic field interference.
To ensure that the deep learning algorithm can be applied on the airborne end of the UAV, the Jetson Xavier NX artificial intelligence development kit is used as the hardware terminal of the image recognition calculation, and on this basis, the development of the bird’s nest positioning and recognition algorithm software is carried out. Nvidia Jetson devices are embedded AI computing platforms that provide high-performance, low-power computing support for deep learning and computer vision [18,19,20]. The specifications of the onboard computer are shown in Table 2.

2.2. Software Design

The software implementation process of this system is based on the Nvidia Jetpack development environment, using Qt as the application development framework, integrating the DJI Onboard SDK and the PaddlePaddle deep learning framework, and completing the software development on this basis.
Nvidia JetPack SDK contains TensorRT, OpenCV, CUDA toolkit, cuDNN, and L4T with LTS Linux kernel [21].
The DJI Onboard SDK is an open-source software library that allows a computer to communicate directly with the DJI M300 RTK drone through the serial port. The Onboard SDK provides access to aircraft telemetry, flight control, and other drone functions, and developers can use the Onboard SDK to connect external controllers to the drone and use it to control the flight. The SDK contains an open-source C++ library, which can be used to control the M300 RTK drone through the serial interface, support Linux, ARM, and STM32, and it has a drone simulator and visualization tools that can be used for real-time simulation tests, while satisfying program debugging. This is convenient for developers to start quickly and to carry out secondary development [22,23].
During the implementation of this project, the DJI Onboard SDK was used to obtain the real-time UAV flight position, flight waypoint information, video stream, and captured photos. Based on the above information as software input, the software processing architecture is shown in Figure 5.

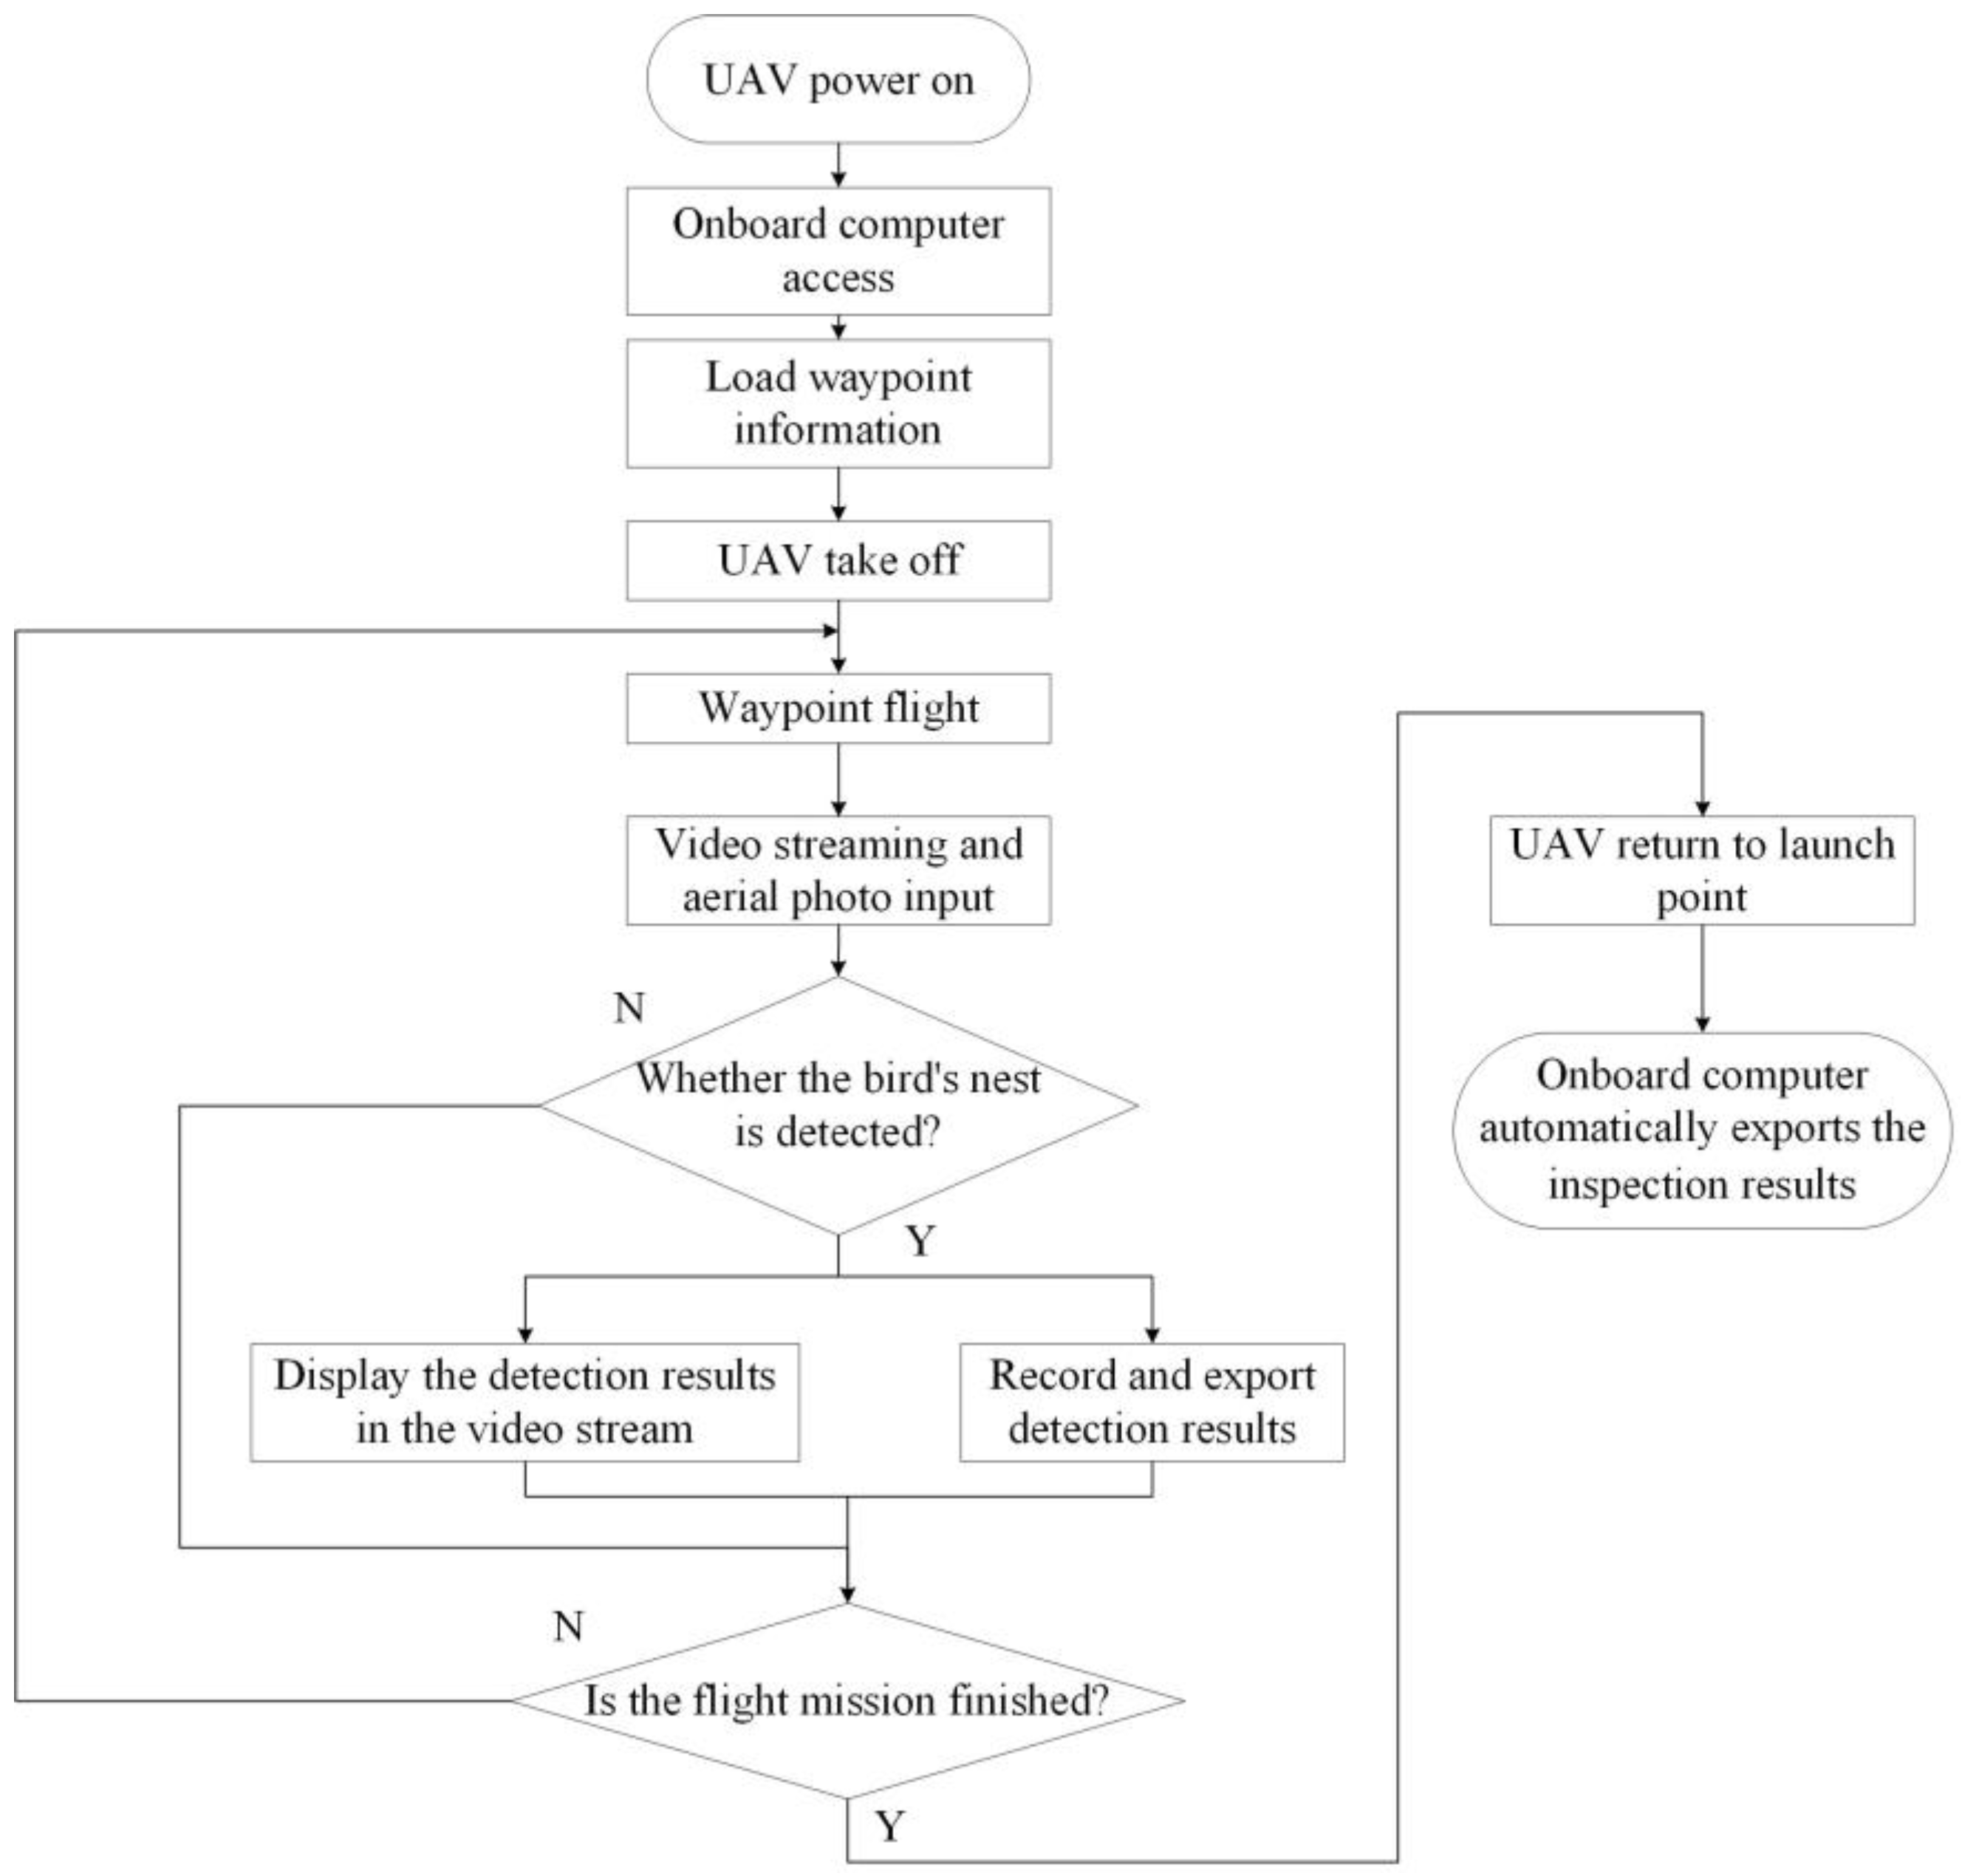
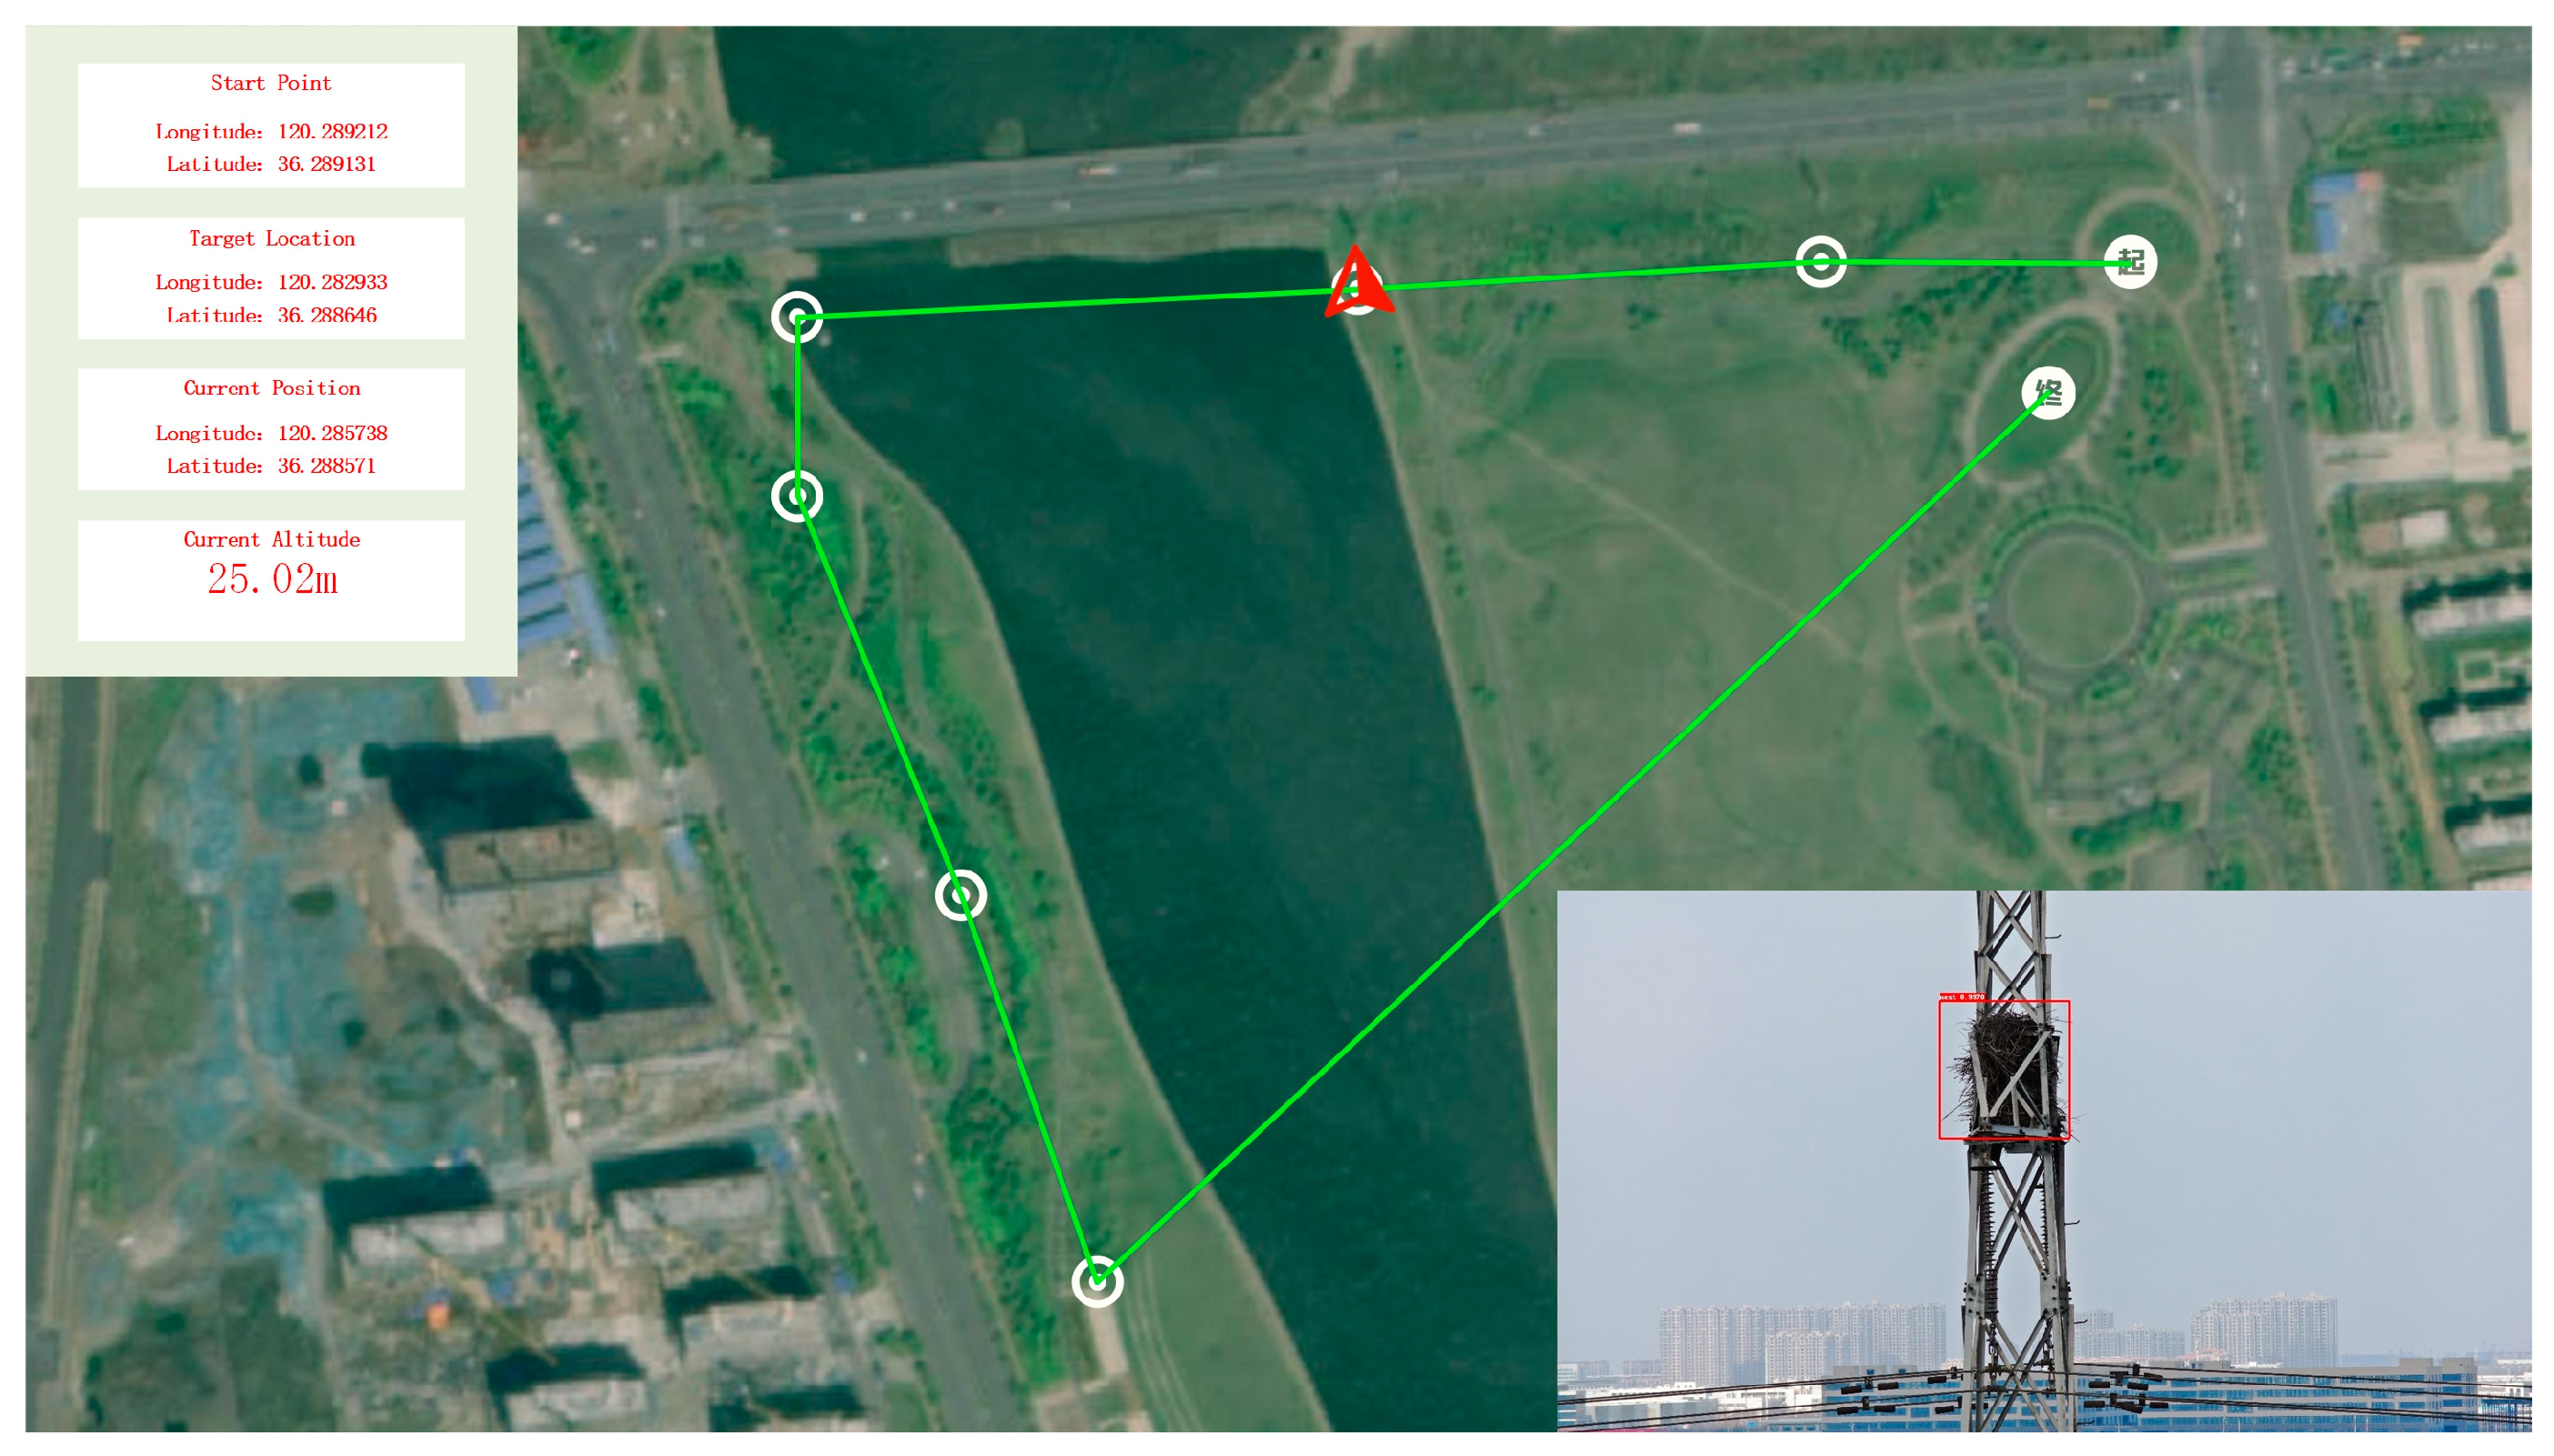
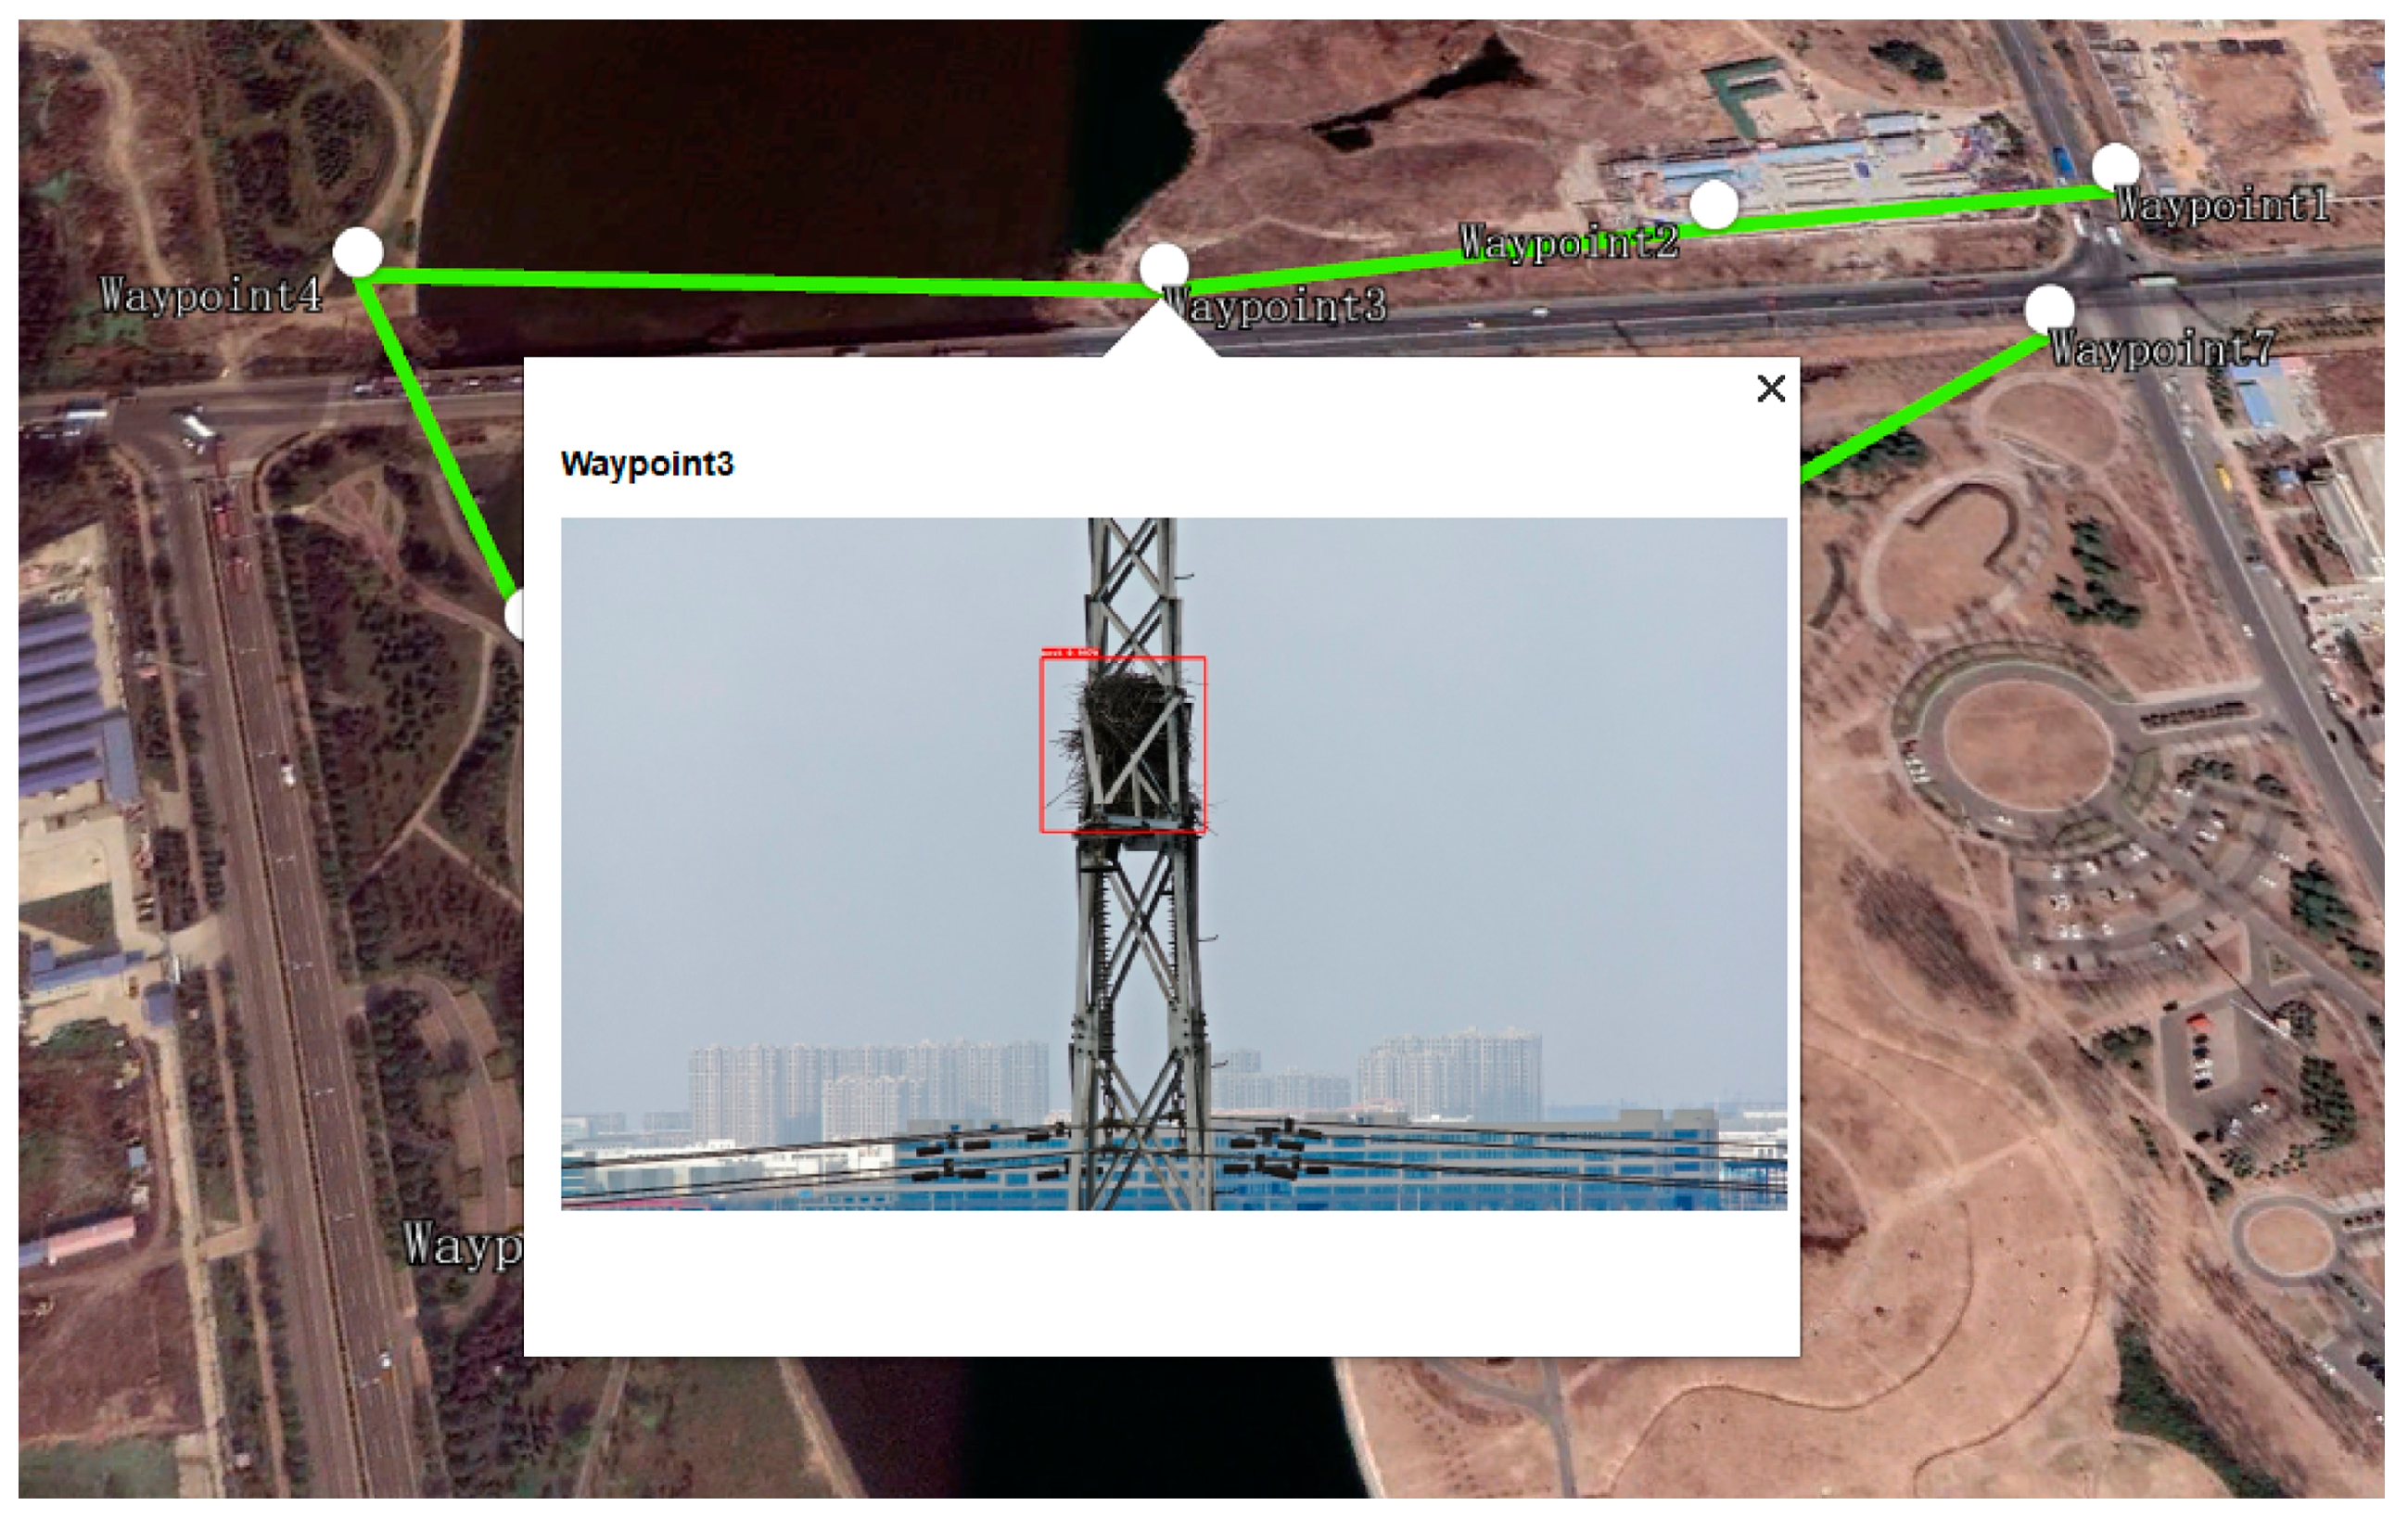
2.2.1. Navigation and Localization Module

The autonomous inspection process of this system relies on the accurate reshooting function of the UAV. Since the M300 RTK UAV has an RTK GPS module, it can achieve high-precision and accurate positioning.
Before the task starts, the operator plans the route based on the point cloud of the line to be inspected or the information of past inspection waypoints; the specific position target can be set in flight and saved as a route task, which is imported into the unmanned aerial vehicle. After the aircraft tasks are completed, the drone conducts a fully autonomous waypoint flight for the route. For each mission of the same line, the UAV can automatically capture the latest image of the same position, which is used as the image input source of the bird’s nest recognition module.
The bird’s nest recognition software module is based on the above image and performs real-time bird’s nest detection on the image during the flight of the drone. If a bird’s nest is found, it further extracts the photo point location data in the EXIF information of the image, marks it on the software interface, and detects the bird’s nest. The pictures and location information of the bird’s nest are written to the output folder.

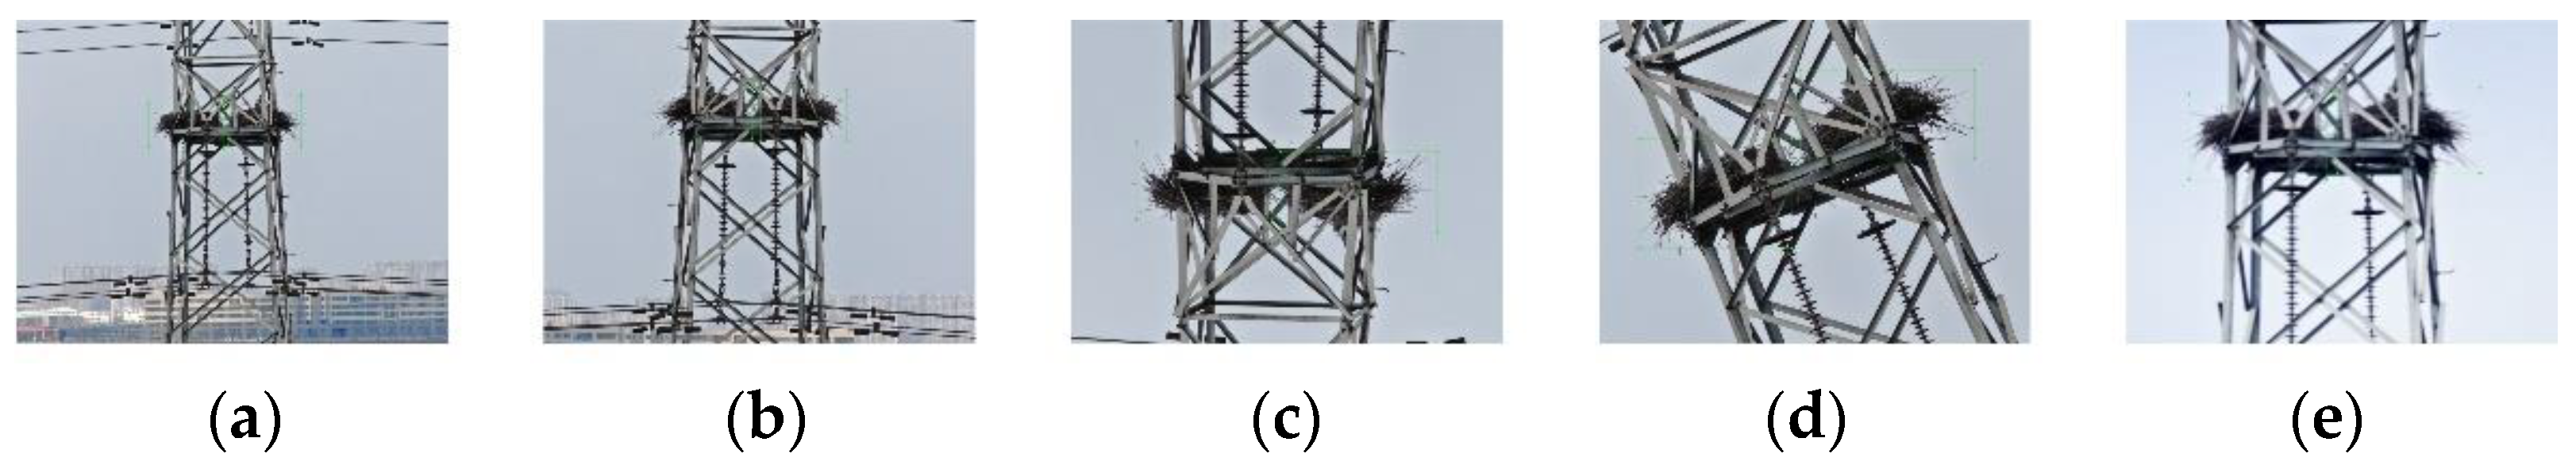
2.2.2. Bird’s Nest Detection Module

The bird’s nest detection software module proposed in this paper is implemented by three different YOLO detection algorithms, including the MobileNetv3-Large improved YOLOv3 algorithm, YOLOv5 algorithm, and YOLOX algorithm, and the experimental results of the three algorithms are compared.
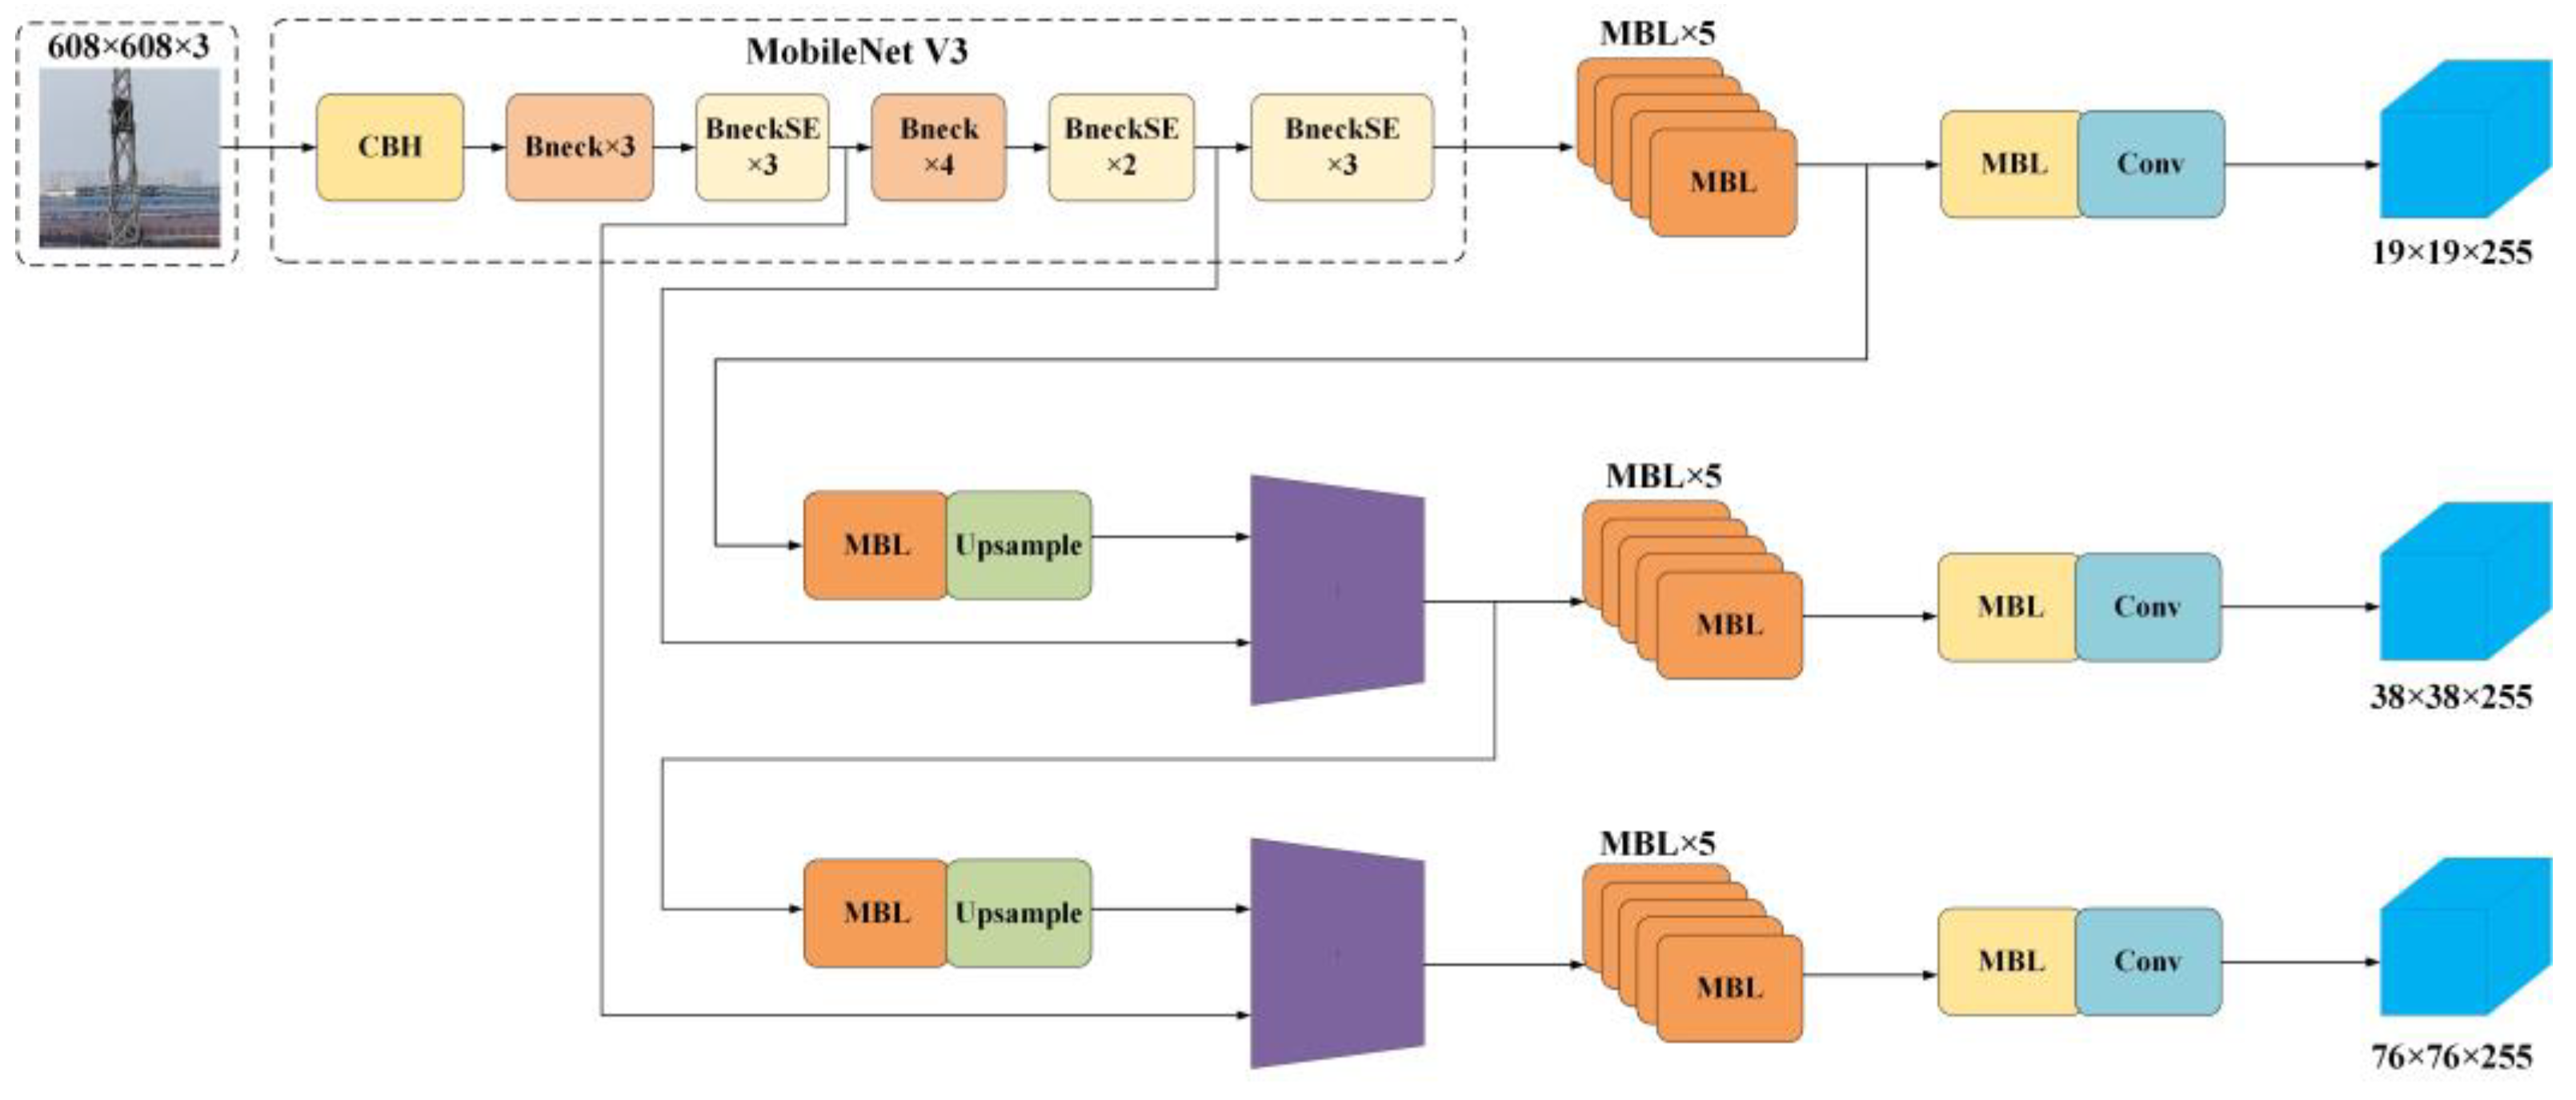
  • Improved YOLOv3 detection algorithm based on MobileNetv3-Large
YOLOv3 is an improved version of the YOLO series algorithm proposed by Redmon et al. in 2018 [24]. YOLOv3 uses a deep residual network to extract image features and achieves multiscale prediction, achieving a better balance between detection accuracy and speed. The YOLOv3 algorithm is divided into two parts: the backbone network and the prediction network from the network architecture. The backbone network of the traditional YOLOv3 algorithm is Darknet-53, which can be divided into 5 stages according to the size of the feature map. In the third, fourth, and fifth stages, the output feature map of the stage is fed into the prediction network.
The prediction network fuses multiple scale feature maps for multiscale prediction, assuming that the input image size is 608 × 608 pixels, and the feature sizes output by the prediction network are 19 × 19, 38 × 38, and 76 × 76.
This paper improves the YOLOv3 network structure. As shown in Figure 6, the lightweight backbone network MobileNetV3-Large [25] is used to replace Darknet-53 as the backbone network to improve the YOLOv3 network. MobileNetV3-Large is the third version of MobileNet. Based on MobileNetv2, it adds network structure search, compressed excitation module (SE), and activation functions hard-swish and hard-sigmoid.
The MobileNetV3-Large network structure is shown in Table 3. The units in the table number the input data according to the processing order. In Table 3, each row lists the specification configuration of each layer in the model network. The first row in the table corresponds to the first network layer. The data transmission in the network is top-down, that is, the upper layer is processed. The feature map output is used as the input to the next layer, Conv2d is the normal convolution layer, Pool is the pooling layer, and bneck is the basic building block. SE indicates whether to add a compressed excitation module (SE) in the basic building block, and √ indicates that a compressed excitation module (SE) is added to the basic building block of this layer. NL represents the nonlinear activation function in the network, including HS and RE, where HS represents the hard-swish function and RE represents the ReLU function. NBN indicates that the batch normalization layer is not added after the convolutional layer. As seen in the table, the number of filters of the previous convolutional layer is the same as the number of channels of the input feature map of the next layer. When the step size is 2, the size of the output feature map is halved. It is worth noting that the MobileNetV3-Large model in Table 3 is used for the k-class image classification task, which replaces the fully connected layer with a pooling layer and two 1 × 1 convolutional layers in the last 3 layers. The layer outputs a feature map of size 12 × k, which is used to represent the 1 × k classification result vector.
2.
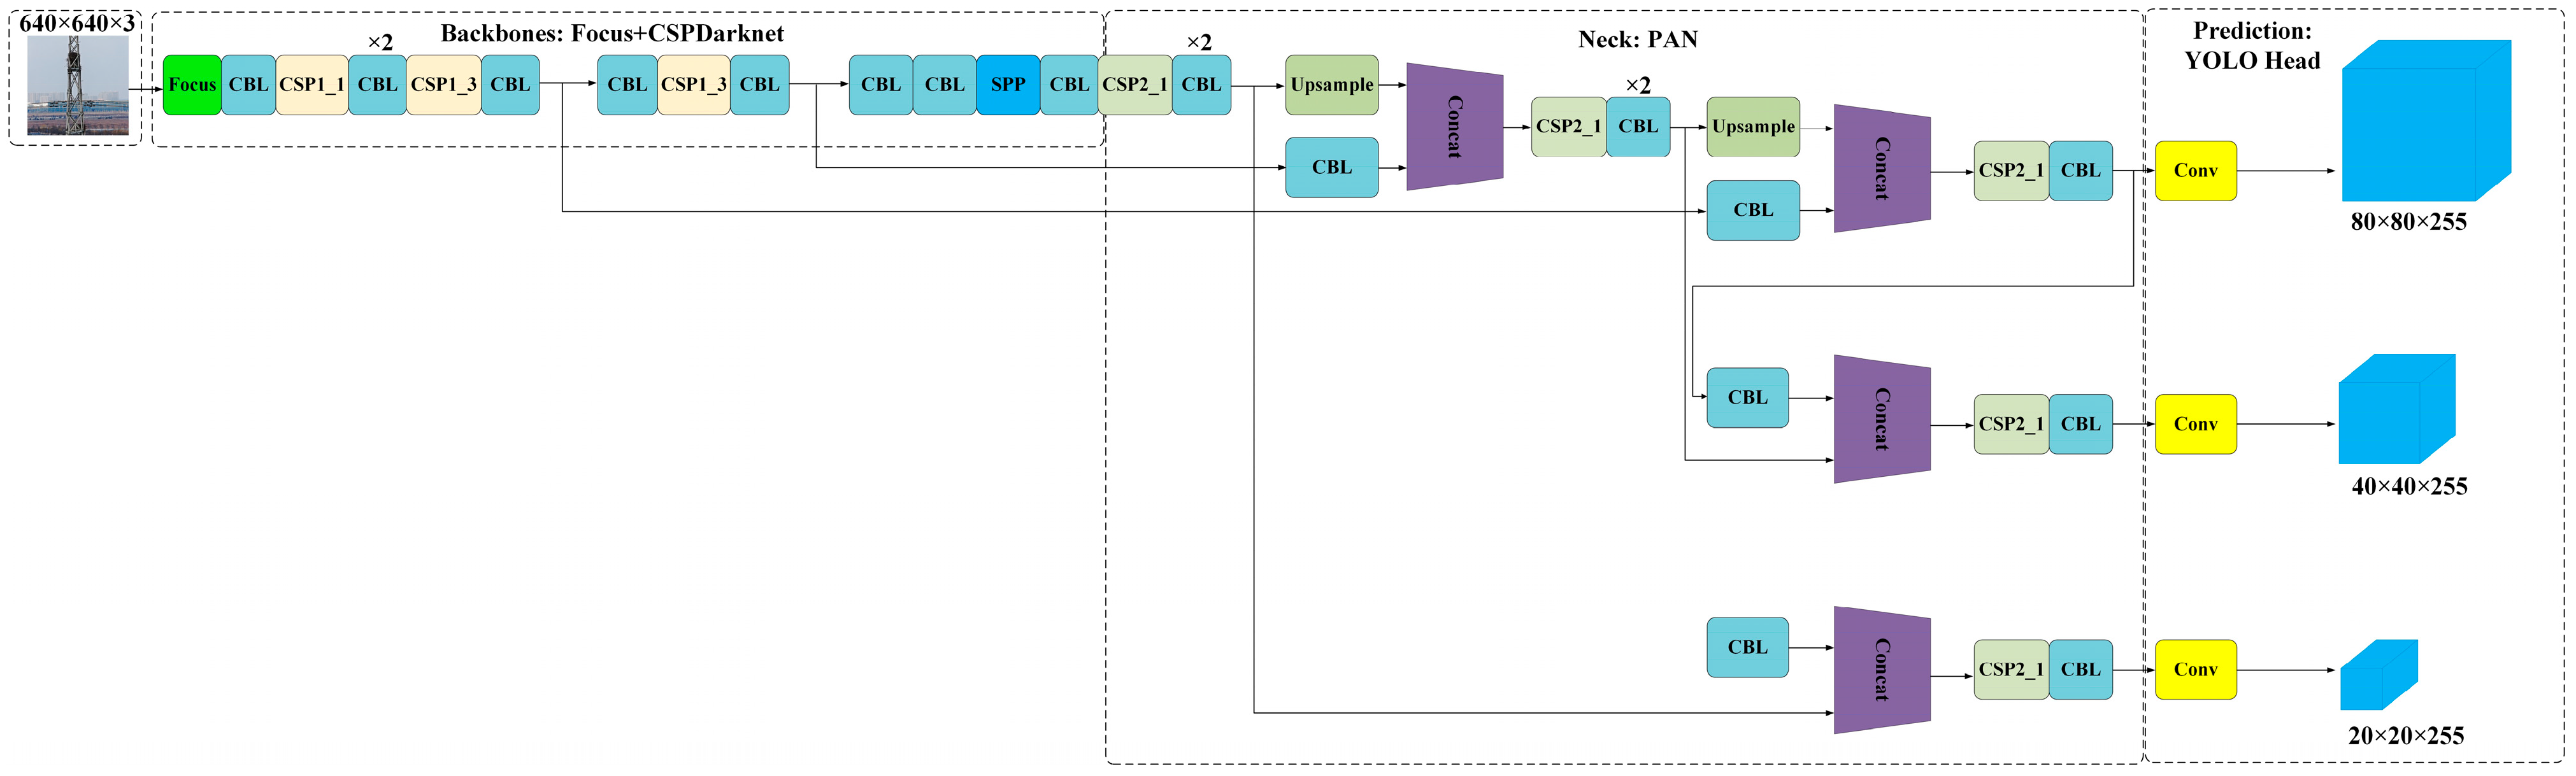
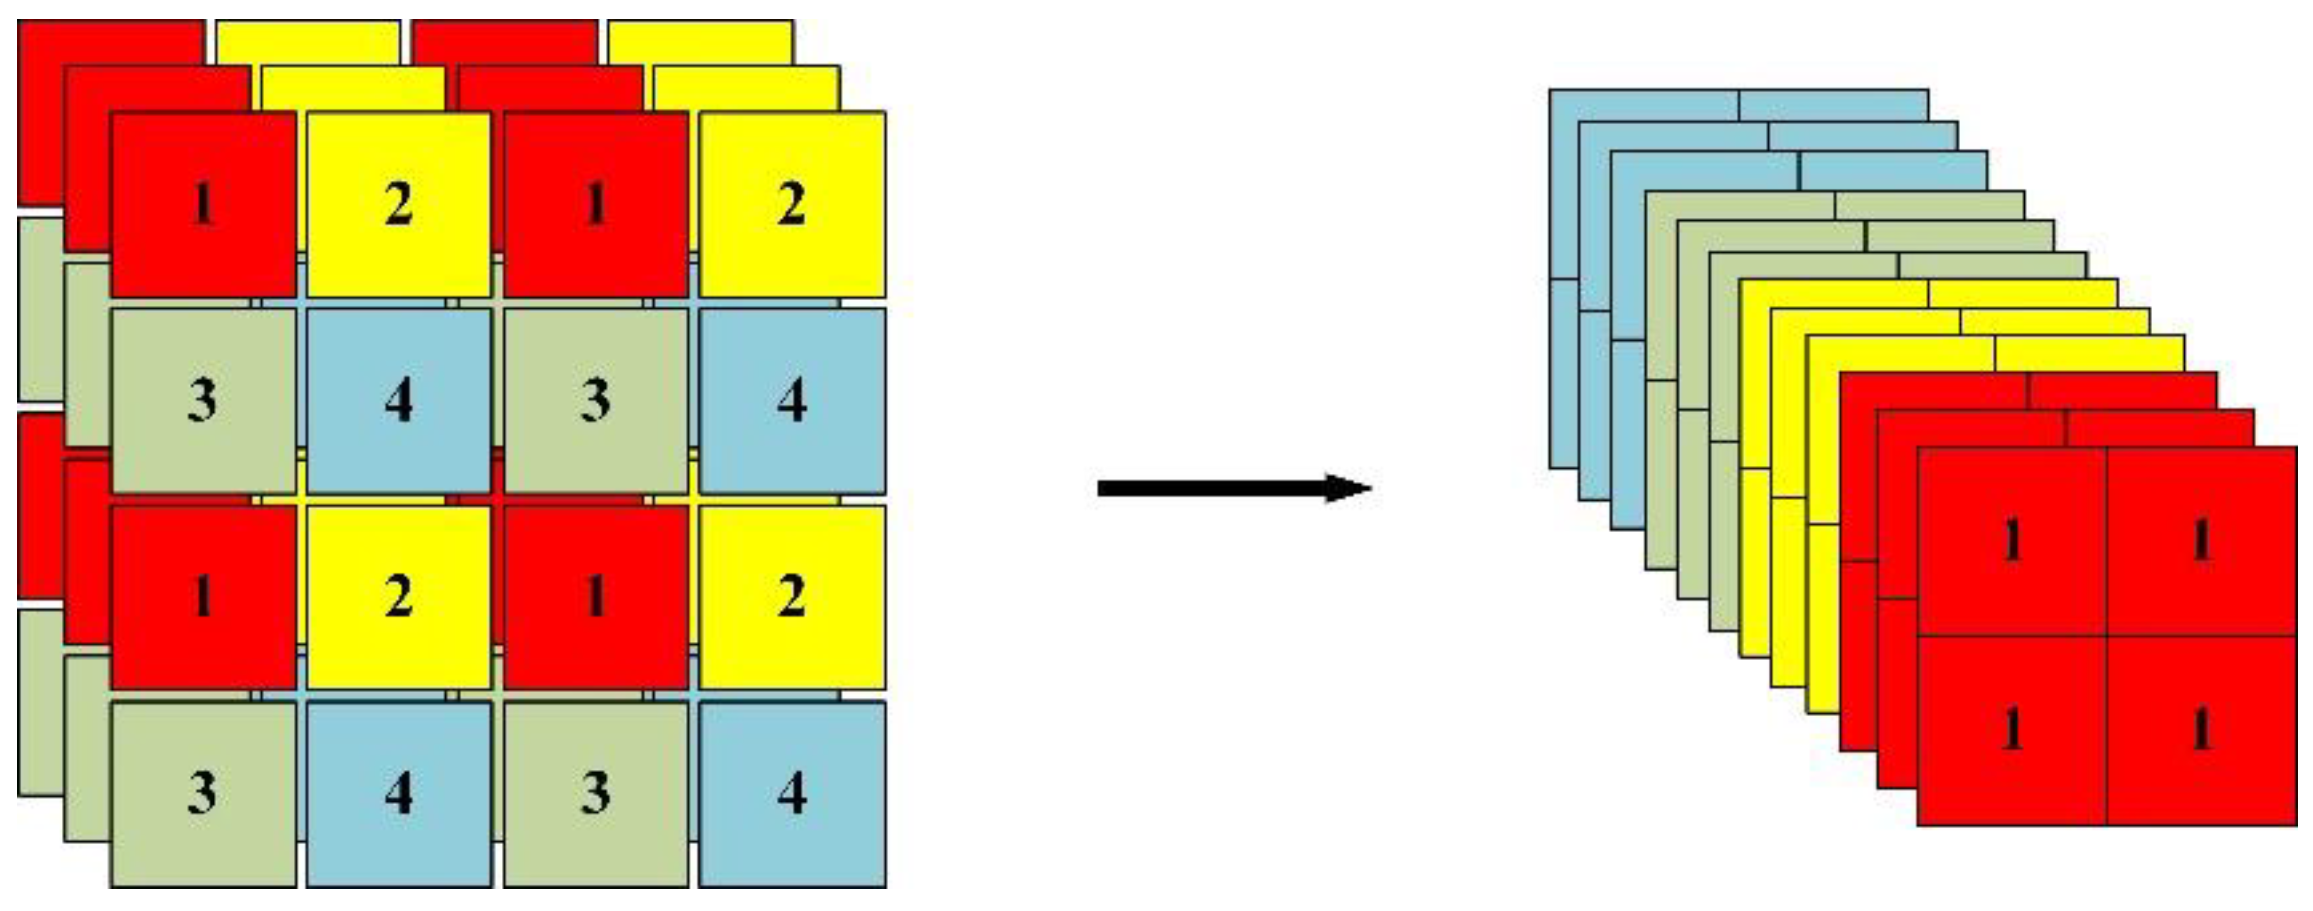
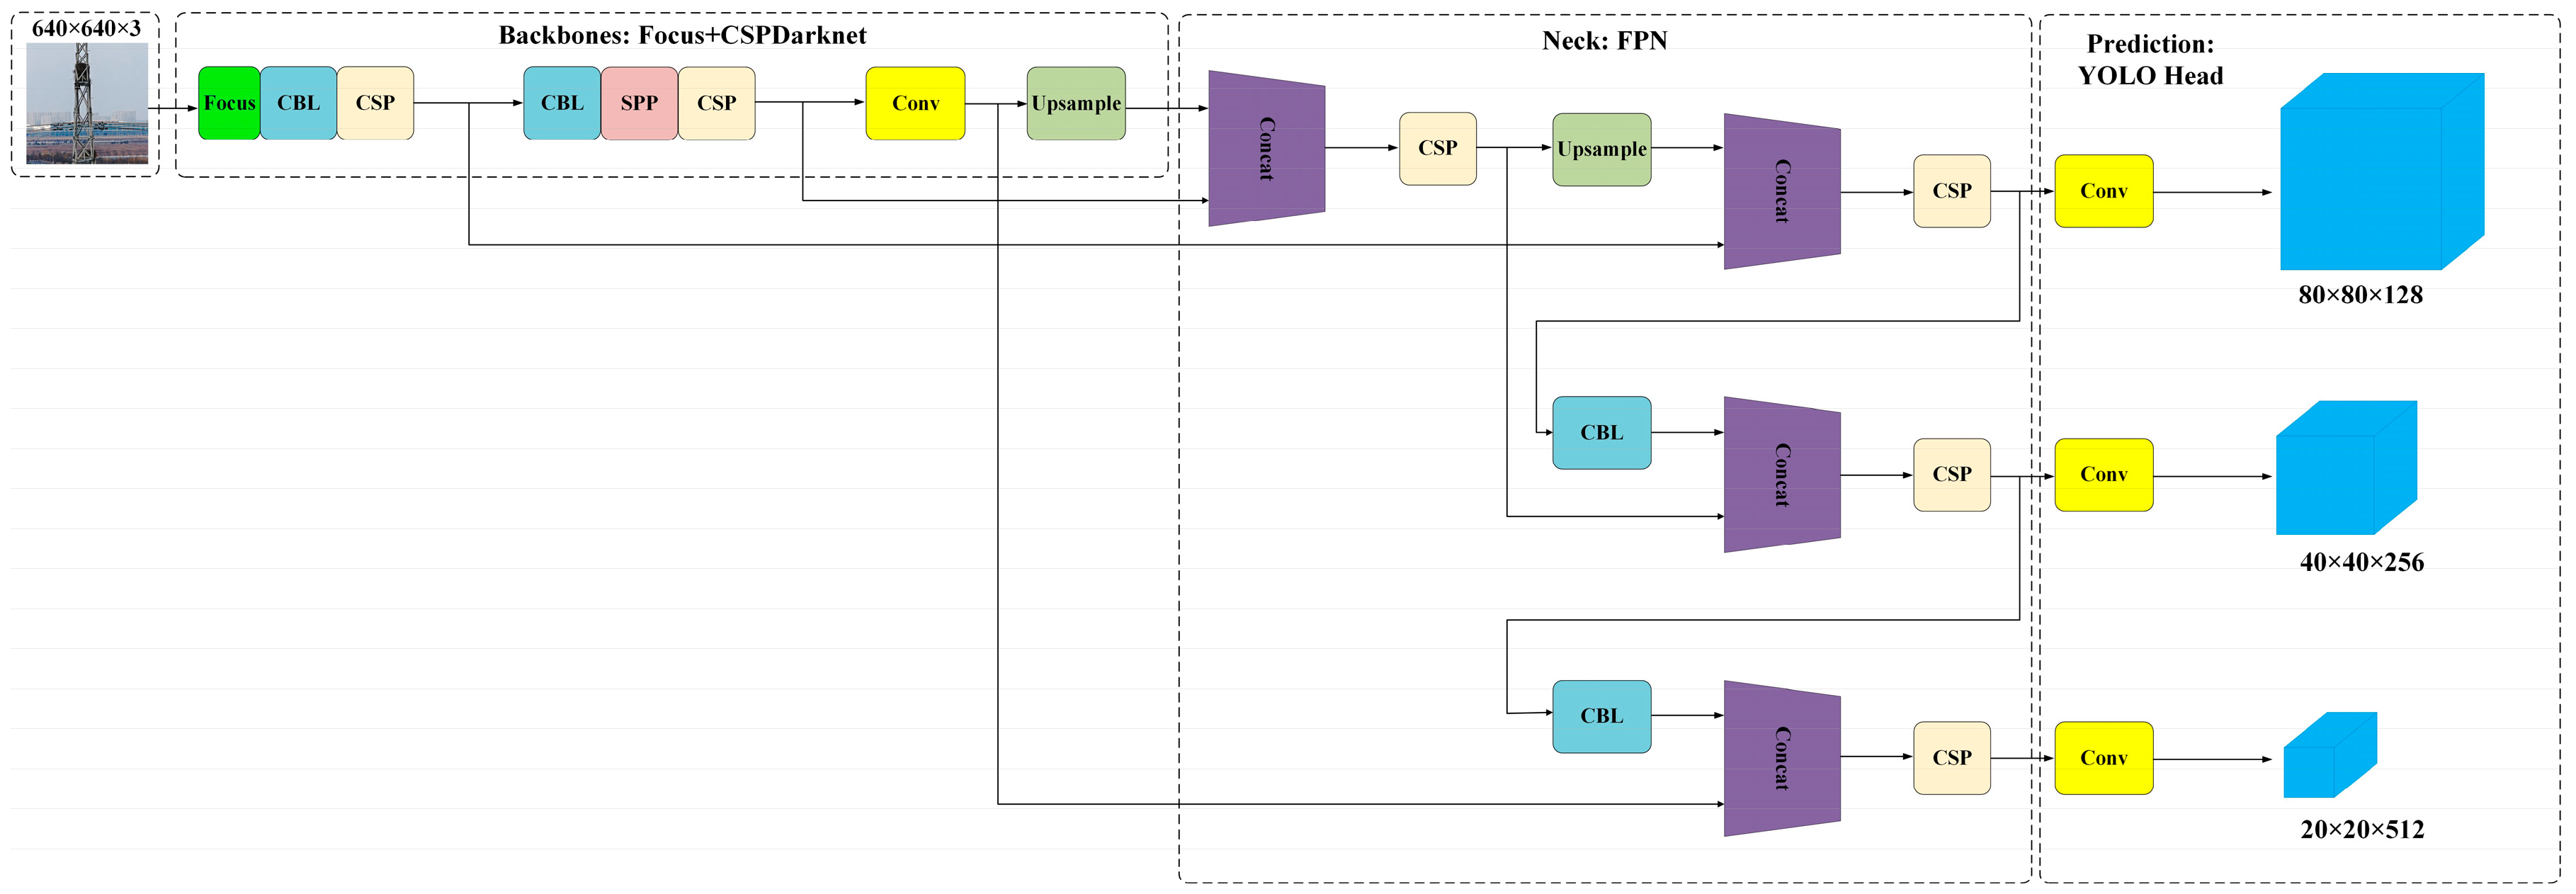
YOLOv5-s detection algorithm
YOLOv5 is the fifth-generation model of the YOLO series. It is a target detection model based on the PyTorch framework. It is improved from the YOLOv3 model. Its structure and process are shown in Figure 7.
Structurally, YOLOv5 can be divided into three parts. The focus + CSPDarknet structure is used on the backbone feature extraction network, the neck is the enhanced feature pyramid network PAN, and the final prediction is the YOLO head. Currently, there are four versions of YOLOv5, namely, YOLOv5-s, YOLOv5-m, YOLOv5-l, and YOLOv5-x. The weights of the four versions and the width and depth of the model are sequentially increased. In this paper, YOLOv5-s is selected. Although its AP accuracy is lower than those of the other three models, its depth is the smallest, and it is more suitable for the lightweight deployment of UAV airborne AI computing platforms [26,27].
Compared with YOLOv3, the convolution block structure DarkNetConv of YOLOv5 has changed, and its activation function uses SiLU improved from Sigmoid and ReLU, which is better than ReLU on the deep neural network model; in addition, YOLOv5 will also replace the YOLOv3 backbone network The first three layers are replaced by the focus network, as shown in Figure 8. The network structure performs a slicing operation similar to downsampling on the input image, takes a value of every other pixel in the image to obtain four independent feature layers, and then stacks these four independent feature layers to concentrate the width and height information into the channel. The input channel is expanded four times, and the newly spliced feature layer is equivalent to the original 3-channel RGB and becomes 12 channels. After using the focus network, the number of network parameters and computations can be reduced, thereby improving the training speed [28].
3.
YOLOX-s detection algorithm
YOLOX was released by Megvii Technology in July 2021. When choosing the benchmark model of YOLOX, the author did not choose the YOLOv4 and YOLOv5 series but based on the anchor frame algorithm, YOLOv3, which is currently widely used in the industrial field, was selected. SPP differs from YOLOv3 in that YOLOv3-SPP adds SPP components behind the backbone network of YOLOv3 [29,30].
To facilitate analysis, the YOLOX network structure can also be divided into three modules: backbone, neck, and prediction layers.
The input uses two powerful data enhancement technologies: mixup and mosaic. Mosaic enhancement, which can effectively improve the detection effect of small targets, is also widely used in the YOLOv4 and YOLOv5 algorithms. Mixup is an addition to mosaic. The backbone network is consistent with the original YOLOv3 backbone network and adopts the DarkNet53 network. The neck is also fused using the FPN structure. The prediction layer consists of the following parts: decoupling head, anchor-free detector, label assignment strategy and loss computation. The author made the network structure into an optional configuration. According to the width and height of the network, it is divided into YOLOX-s, YOLOX-m, YOLOX-l, YOLOX-x, and other versions. This paper uses the standard network structure YOLOX-s model [31,32], and its network structure is shown in Figure 9.

3. Results

In the development and implementation process of this project, the test is divided into two stages. First, the aerial photo dataset of power towers containing the bird’s nest targets is collected and the bird’s nest marking, training, and testing are performed based on the detection model proposed in this paper. Then, after deploying the software and onboard computer to the UAV, field flight tests are carried out to evaluate the bird’s nest detection and positioning effect of the whole system in the actual operating environment.
During the bird’s nest detection dataset labelling process, a total of 600 images containing the bird’s nest targets were collected, including aerial pylon images of the drone and bird’s nest images from the network. These images were used to mark the bird’s nest data for training and testing. In addition, by randomly cropping, flipping, and stretching the training dataset, a total of approximately 2000 images were obtained for training. The above datasets were randomly divided into 10 nonoverlapping subdatasets, 9 subdatasets were selected as the training set, and 1 subdataset was used as the validation set.
Figure 10 shows a schematic diagram of image annotation for the training set. Figure 10a is the original image, and the rest of the images are based on the expanded image data obtained after image processing.

3.1. Bird’s Nest Detection Module Test

For target detection algorithms, it is usually necessary to use certain evaluation criteria to measure the algorithm model performance. For deep learning algorithms, a variety of evaluation indicators need to be considered to evaluate the model algorithm. In this experiment, in the process of training the model, by visualizing the change in the loss curve of the training output parameters, we set different parameters to obtain multiple training models. The precision rate (Precision), the recall rate (Recall), the average precision (AP), and the mean average precision (mAP) were calculated as the indicators to measure the model. In addition, since this project needs to realize real-time bird’s nest target detection on UAVs, it is very important to meet the real-time detection requirements, so the indicator of detection speed also needs to be considered.
In order to calculate the above evaluation indicators, Table 4 defines positive and negative samples.

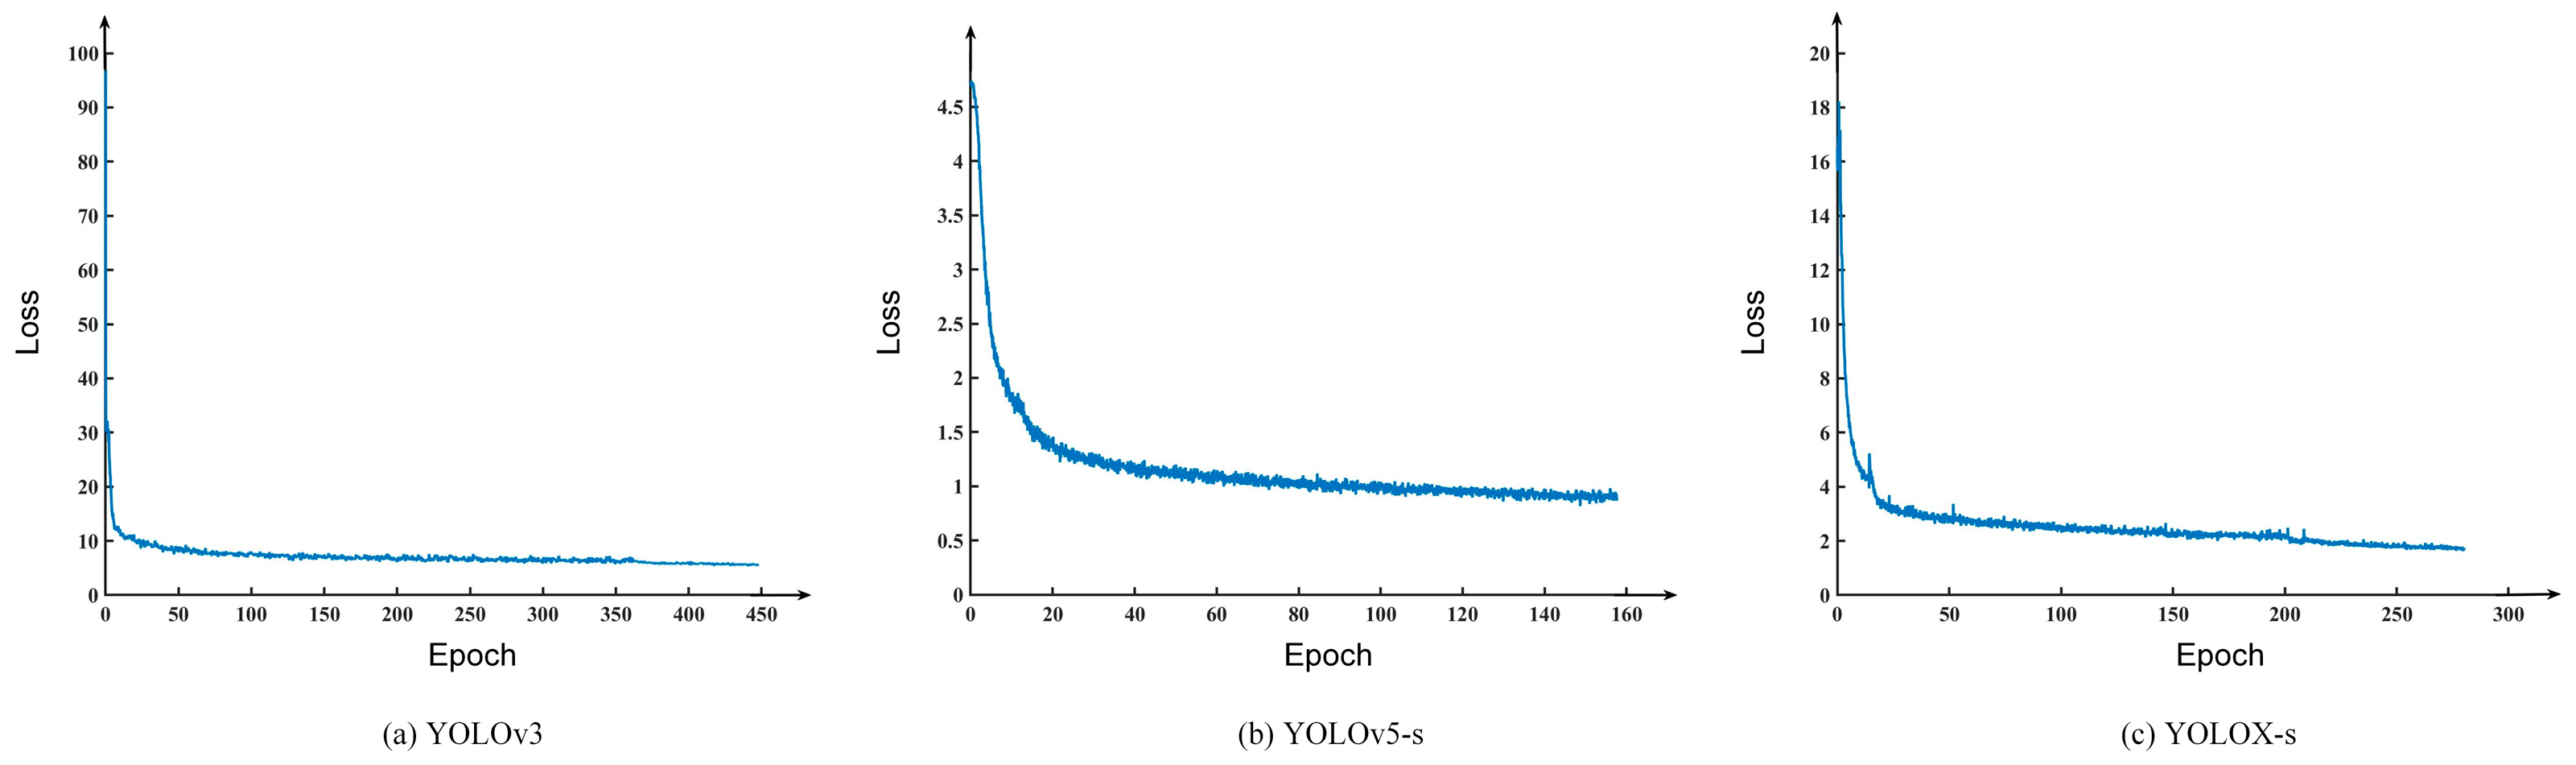
3.1.1. Loss Function

In statistics, loss functions are often used for parameter estimation, expressing the difference between the estimated and true values of a data instance. Deep learning relies on statistical theory as support, so in deep learning, the loss function is used to estimate the degree of inconsistency between the training model and the test f(x) and the true value Y, usually L(Y, f(x)) is expressed. It is generally believed that the smaller the loss function, the better the robustness of the model.
The loss function of the YOLO algorithm consists of three parts: coordinate error, IOU error, and classification error. Through calculating network output S × S × (B × 5 + C) dimension vector and real target input S × S × (B × 5 + C) dimensional vector and the mean square and error to optimize the model parameters. Its loss function is as follows:
l o s s = λ c o o r d i = 0 S 2 j = 0 B 1 i j o b j [ ( x i x ^ i ) 2 + ( y i y ^ i ) 2 ] + λ c o o r d i = 0 S 2 j = 0 B 1 i j o b j [ ( w i w ^ i ) 2 + ( h i h ^ i ) 2 ] + i = 0 S 2 j = 0 B 1 i j o b j ( C i C ^ i ) 2 + λ n o o b j i = 0 S 2 j = 0 B 1 i j n o o b j ( C i C ^ i ) 2 + i = 0 S 2 1 i o b j c c l a s s e s ( p i ( c ) p ^ i ( c ) ) 2
The first two parts of Formula 1 calculate the coordinate error, the middle two parts calculate the IOU error, and the last part calculates the classification error, where 1 ij obj indicates that if the target appears in cell i , it is marked as 1; otherwise, it is 0, and 1 ij obj and 1 ij noobj indicate that the target appears or does not appear, respectively, in the j-th border of the i-th cell [33].

3.1.2. Precision

In the field of object detection, the accuracy rate is the ratio of the number of correct objects detected to the sum of the number of detected objects, which measures the precision of the detection model [34]. The formula for calculating the accuracy rate is:
P = T P T P + F P

3.1.3. Recall

Recall refers to the ratio of the number of correct objects detected to the sum of the number of true objects annotated manually and measures the recall of the detection model [35]. The formula for calculating recall is:
R = T P T P + F N

3.1.4. Mean Average Precision

The precision–recall (PR) curve is drawn based on the corresponding precision and recall curves. The QP is the area under the PR curve, which can be obtained by calculating the function integral of the precision rate and the recall rate. Average precision refers to averaging the correct objects detected over multiple test sets.
The average precision A P calculation formula is:
A P = 0 1 P ( R ) d R
It can be seen from the above that A P calculates the average precision of a certain target category. To evaluate the overall model performance, it is necessary to average the APs of all targets to obtain the m A P .
The m A P calculation formula is shown in the following formula, where N is the number of target categories to be detected.
m A P = A P N

3.1.5. Detection Speed

The task of bird’s nest target detection requires real-time detection of the bird’s nest targets. Therefore, for the detection algorithm model, the detection speed is a particularly important indicator. In this experiment, the detection speed of the model is calculated by recording the time used for detection on the test set in units of frames per second (FPS).

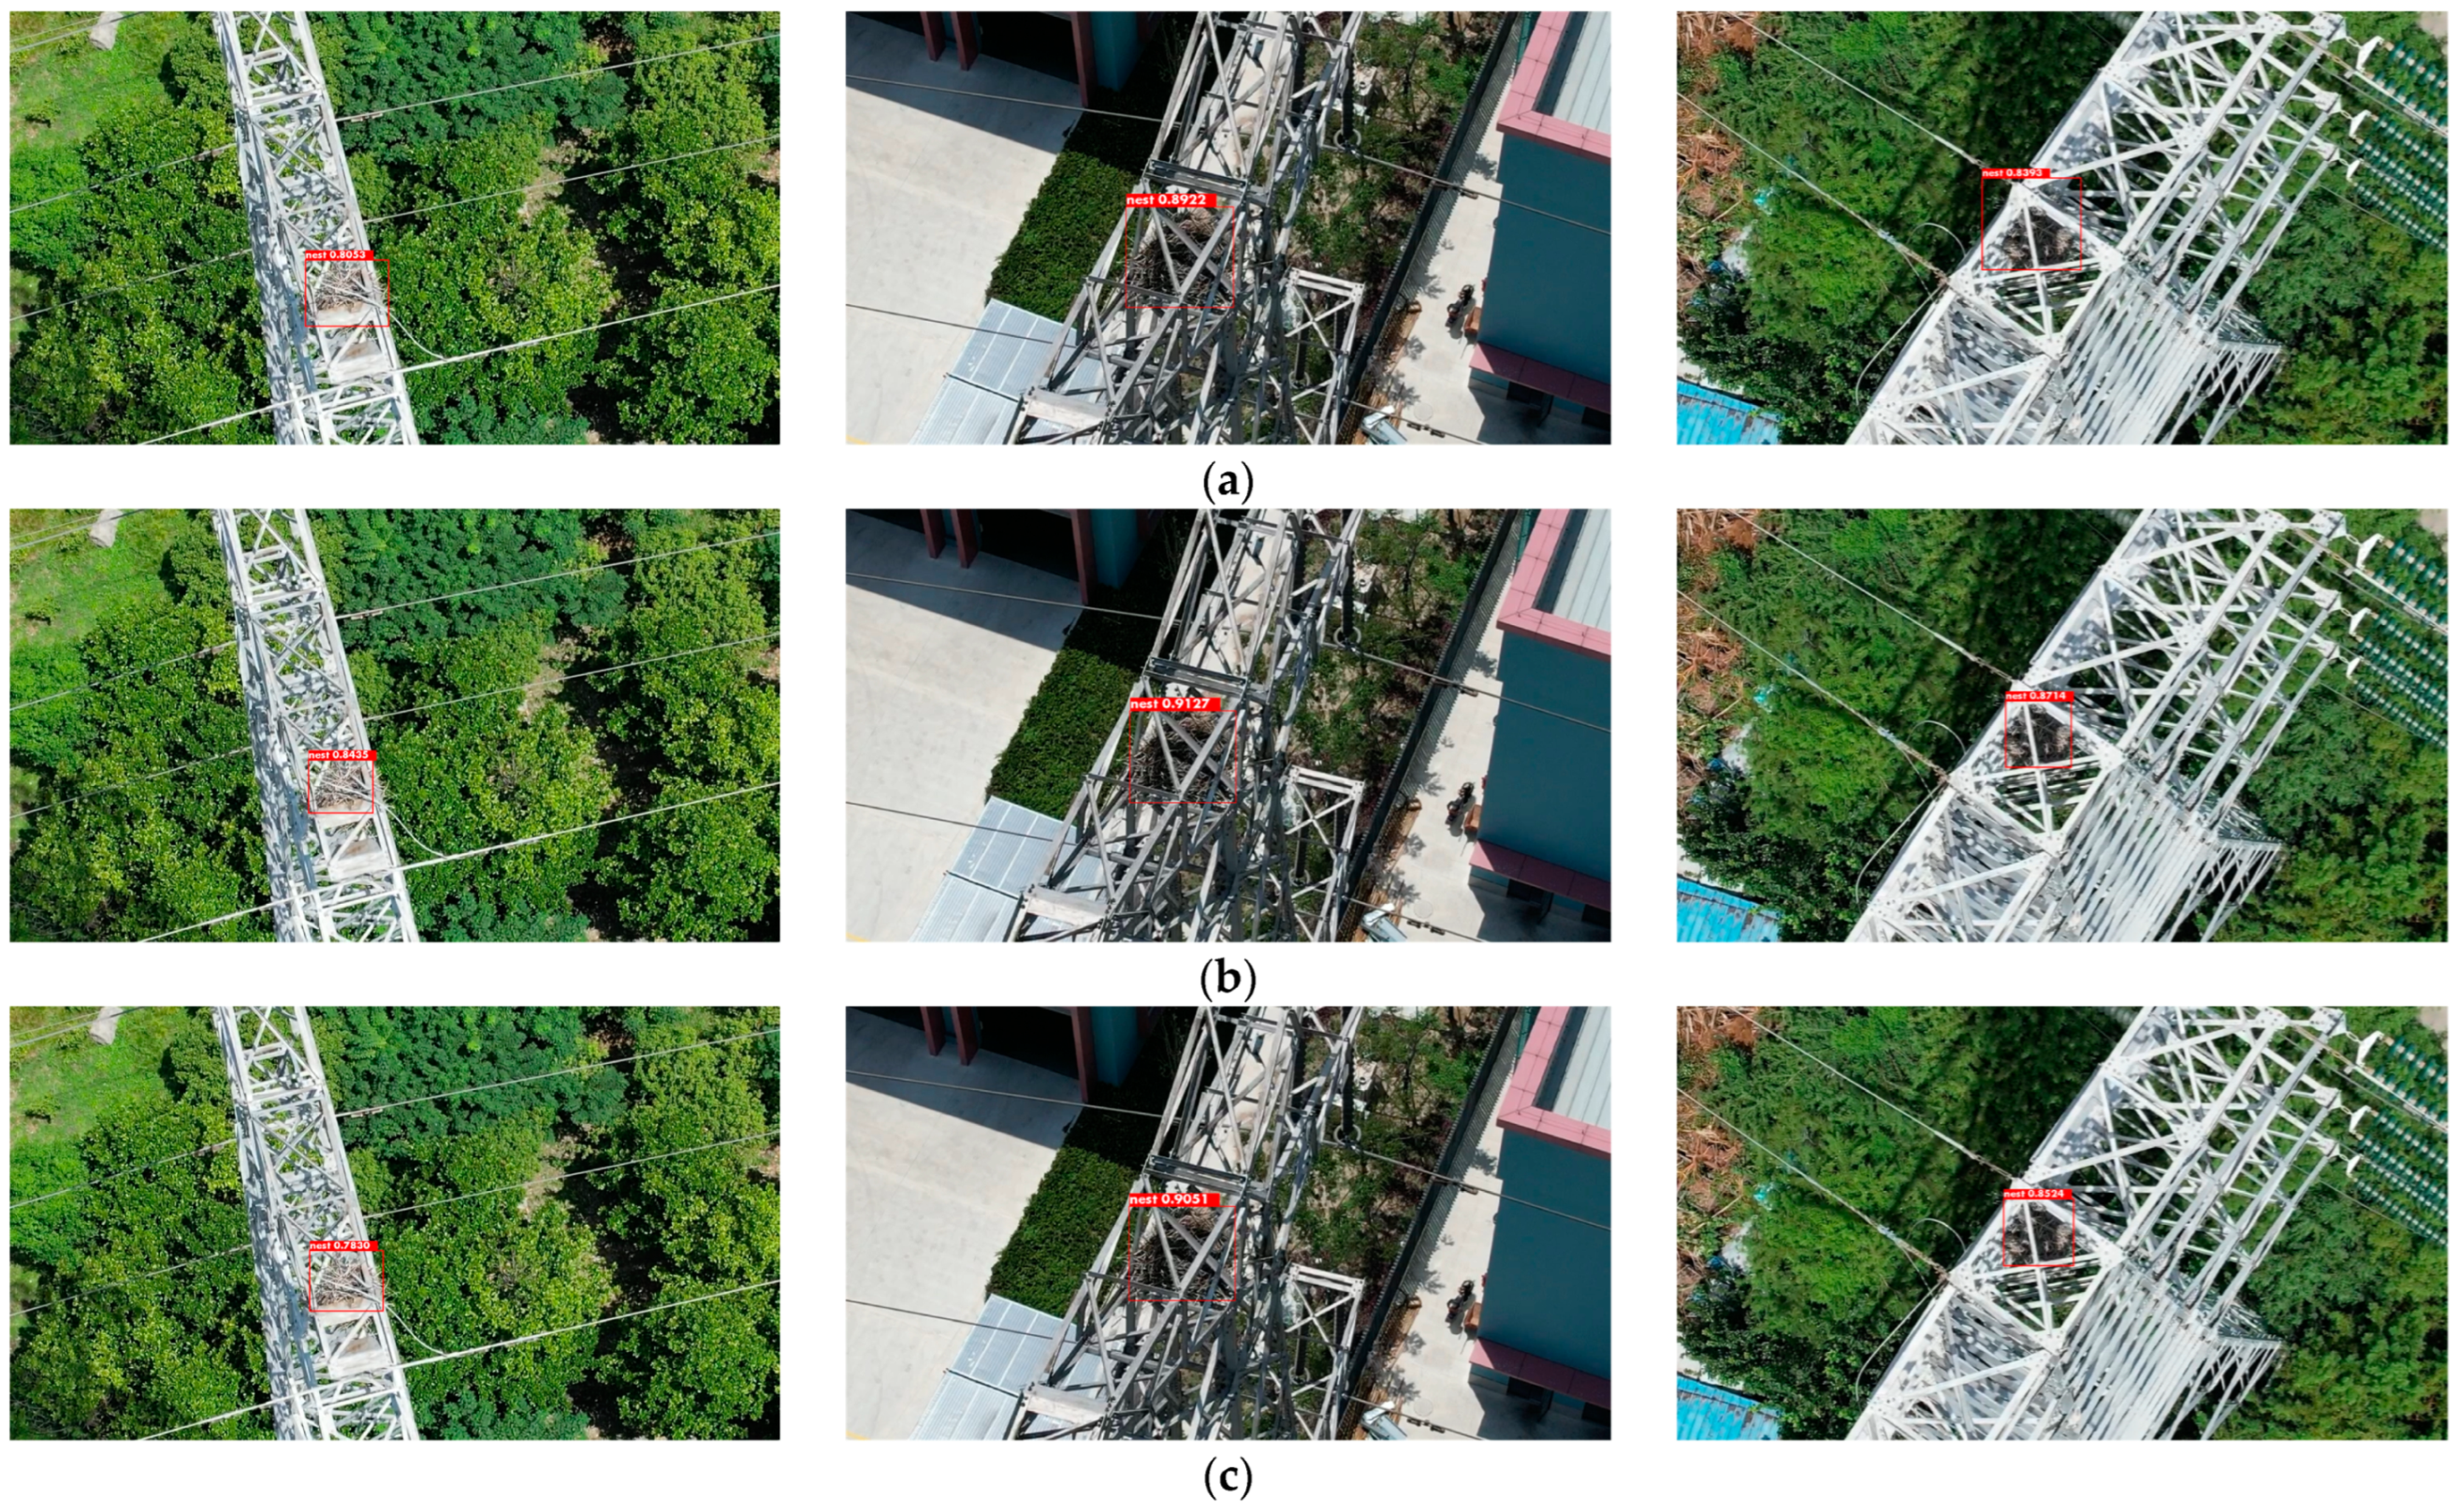
3.1.6. Bird Nest Detection Module Test Results

This experiment builds the experimental models of three algorithms based on the PaddlePaddle framework [36], and the training configuration parameters are shown in Table 5.
Figure 11 shows the relationship between loss and epoch obtained from the training of the three models. The changes in the loss curves all show a downwards trend. This is due to the backpropagation of the deep neural network. In the repeated training process, the error continues to decrease, so the loss value continues to decrease. In the training process of the three models, YOLOv3, YOLOv5-s, and YOLOX-s, it can be seen in the figure that when the epoch reaches approximately 450, 160, and 280, respectively, the loss value achieves a better convergence effect.
According to the training results, the following statistical results of the three models can be obtained, as shown in Table 6. Among them, the mAP of YOLOv5-s is 92.1%, which is better than that of YOLOX-s and YOLOv3.
Then, the three models were deployed to Jetson Xavier NX to test the frame rate of bird’s nest detection, and the following experimental results were obtained, as shown in Table 7. Among them, YOLOv5-s has the highest detection frame rate, which is better than YOLOv3 and YOLOX-s.
As shown in Figure 12, the bird’s nest detection results after the three detection models are deployed to Jetson Xavier NX are, respectively, shown. Among them, for the same test images, YOLOv5-s has the highest detection accuracy.
According to the experimental results, to ensure the real-time detection frame rate and accuracy of the bird’s nest of the airborne computer, YOLOv5-s was finally selected as the bird’s nest detection model deployed by the airborne computer and then the test flight in the real field environment was carried out.

3.2. Flight Test

To test the performance of the system in the real power inspection scene, the onboard computer was mounted on the UAV and carried out the field flight test. The test selected a continuous transmission line with 6 towers and set up a total of 18 aerial photos. According to the naked eye observation results, there are bird nests on three of the tower structures.
The following is the field test data. The UAV flight speed is set to 5 m/s. After the UAV takes off autonomously, it takes fixed photos of the photo waypoints one by one. The onboard computer processes the photos in real time. The entire inspection flight process consumes time. The flight status display and processing results during the flight are shown in Figure 13.
Figure 14 shows the results of exporting the KML file generated by the onboard computer containing the bird’s nest picture and position coordinates after the drone lands.
In addition, in the actual application process of the UAV system, a target with a detection accuracy rate exceeding 80% can be set as required to prompt and export the results, and the power inspection staff can view the detection results during the flight. After the drone flight mission is over, when the photos and location information of the bird’s nest are checked later through the software, the bird’s nest detection result can be re-checked to further ensure the accuracy of the bird’s nest detection result.
According to the field test results, it can be proven that the system has a certain application value in the actual environment. Its operational robustness and the accuracy of bird’s nest data detection still need to be optimized through a large number of flight tests in the real environment. After the dataset is further expanded, the accuracy of bird’s nest detection will improve.

4. Conclusions

In this paper, a UAV system for automatic inspection of bird’s nest transmission lines is designed to improve the efficiency of bird’s nest inspection. In the implementation process, based on technologies, such as autonomous navigation and deep learning, a UAV system with functions, such as autonomous flight inspection, real-time automatic detection of the bird’s nest, and position export for transmission lines, is realized.
In order to improve the detection accuracy of the bird’s nest detection model, we took and collected 2000 bird’s nest images in the actual power inspection environment to create a dataset. The parameters optimization and test comparison for bird’s nest detection are based on the three target detection models of YOLOv3, YOLOv5-s, and YOLOX-s. According to the test results, the YOLOv5-s bird’s nest detection model optimized for bird’s nest real-time detection has a higher mAP and detection frame rate than the other two models. It was deployed to the onboard computer for real-time detection and verification during flight. The optimized YOLOv5-s bird’s nest detection model can meet the daily inspection needs of transmission lines. Its mAP for bird’s nest detection is 92.1%, and the real-time detection frame rate is 33.9 FPS, which will significantly shorten the time for exporting transmission line inspection results. The test results proved that the UAV system could efficiently complete the power inspection bird’s nest detection task. The system has reasonable practicability and can greatly reduce labor consumption in the power inspection process.
In the future, we plan to test the system in more complex power inspection scenarios. We will iterate the robustness of the bird’s nest detection model by expanding the bird’s nest image dataset. We will also consider how to use lower-cost artificial intelligence onboard computers to achieve high-accuracy and high-speed real-time detection of bird nests so that this system can be more widely used.

Author Contributions

All authors contributed to the study conception and design. H.L. contributed to programming, visualization, hardware design, writing, and editing. Y.L. was involved with software, deep learning concepts, data collection and preparation, and drafting. Y.D. and J.A. contributed to supervision, reviewing, and validation. All authors have read and agreed to the published version of the manuscript.

Funding

This work was sponsored by Shanghai Sailing Program under Grant No. 20YF1402500, and Shanghai Natural Science Fund under Grant No. 22ZR1404500.

Institutional Review Board Statement

Not applicable.

Informed Consent Statement

Not applicable.

Data Availability Statement

Not applicable.

Acknowledgments

The authors are grateful to Zheng Wang for his help with dataset preparation.

Conflicts of Interest

The authors declare no conflict of interest.

References

  1. Hao, J.; Wulin, H.; Jing, C.; Xinyu, L.; Xiren, M.; Shengbin, Z. Detection of bird nests on power line patrol using single shot detector. In Proceedings of the 2019 Chinese Automation Congress (CAC), Hangzhou, China, 22–24 November 2019; IEEE: Piscataway, NJ, USA, 2019; pp. 3409–3414. [Google Scholar]
  2. Hui, X.; Bian, J.; Yu, Y.; Zhao, X.; Tan, M. A novel autonomous navigation approach for UAV power line inspection. In Proceedings of the 2017 IEEE International Conference on Robotics and Biomimetics (ROBIO), Macau, China, 5–8 December 2017; IEEE: Piscataway, NJ, USA, 2017; pp. 634–639. [Google Scholar]
  3. Chen, C.; Yang, B.; Song, S.; Peng, X.; Huang, R. Automatic clearance anomaly detection for transmission line corridors utilizing UAV-Borne LIDAR data. Remote. Sens. 2018, 10, 613. [Google Scholar] [CrossRef]
  4. Hui, X.; Bian, J.; Zhao, X.; Tan, M. Deep-learning-based autonomous navigation approach for UAV transmission line inspection. In Proceedings of the 2018 Tenth International Conference on Advanced Computational Intelligence (ICACI), Xiamen, China, 29–31 March 2018; IEEE: Piscataway, NJ, USA, 2018; pp. 455–460. [Google Scholar]
  5. Li, F.; Xin, J.; Chen, T.; Xin, L.; Wei, Z.; Li, Y.; Zhang, Y.; Jin, H.; Tu, Y.; Zhou, X.; et al. An automatic detection method of bird’s nest on transmission line tower based on faster_RCNN. IEEE Access 2020, 8, 164214–164221. [Google Scholar] [CrossRef]
  6. Wong, S.Y.; Choe, C.W.C.; Goh, H.H.; Low, Y.W.; Cheah, D.Y.S.; Pang, C. Power transmission line fault detection and diagnosis based on artificial intelligence approach and its development in uav: A review. Arab. J. Sci. Eng. 2021, 46, 9305–9331. [Google Scholar] [CrossRef]
  7. Girshick, R.; Donahue, J.; Darrell, T.; Malik, J. Rich feature hierarchies for accurate object detection and semantic segmentation. In Proceedings of the IEEE Conference on Computer Vision and Pattern Recognition, Columbus, OH, USA, 23–28 June 2014; pp. 580–587. [Google Scholar]
  8. Girshick, R. Fast r-cnn. In Proceedings of the IEEE International Conference on Computer Vision, Las Condes, Chile, 11–18 December 2015; pp. 1440–1448. [Google Scholar]
  9. Ren, S.; He, K.; Girshick, R.; Sun, J. Faster r-cnn: Towards real-time object detection with region proposal networks. Adv. Neural Inf. Process. Syst. 2015, 28. [Google Scholar] [CrossRef] [PubMed]
  10. Odo, A.; McKenna, S.; Flynn, D.; Vorstius, J.B. Aerial Image Analysis Using Deep Learning for Electrical Overhead Line Network Asset Management. IEEE Access 2021, 9, 146281–146295. [Google Scholar] [CrossRef]
  11. Sadykova, D.; Pernebayeva, D.; Bagheri, M.; James, A. IN-YOLO: Real-time detection of outdoor high voltage insulators using UAV imaging. IEEE Trans. Power Deliv. 2019, 35, 1599–1601. [Google Scholar] [CrossRef]
  12. Chen, H.; He, Z.; Shi, B.; Zhong, T. Research on recognition method of electrical components based on YOLO V3. IEEE Access 2019, 7, 157818–157829. [Google Scholar] [CrossRef]
  13. Li, J.; Yan, D.; Luan, K.; Li, Z.; Liang, H. Deep learning-based bird’s nest detection on transmission lines using UAV imagery. Appl. Sci. 2020, 10, 6147. [Google Scholar] [CrossRef]
  14. Brewer, K.; Clulow, A.; Sibanda, M.; Gokool, S.; Odindi, J.; Mutanga, O.; Naiken, V.; Chimonyo, V.G.P.; Mabhaudhi, T. Estimation of Maize Foliar Temperature and Stomatal Conductance as Indicators of Water Stress Based on Optical and Thermal Imagery Acquired Using an Unmanned Aerial Vehicle (UAV) Platform. Drones 2022, 6, 169. [Google Scholar] [CrossRef]
  15. Chen, D.-Q.; Guo, X.-H.; Huang, P.; Li, F.-H. Safety distance analysis of 500kv transmission line tower uav patrol inspection. IEEE Lett. Electromagn. Compat. Pract. Appl. 2020, 2, 124–128. [Google Scholar] [CrossRef]
  16. Zhang, W.; Ning, Y.; Suo, C. A method based on multi-sensor data fusion for UAV safety distance diagnosis. Electronics 2019, 8, 1467. [Google Scholar] [CrossRef]
  17. Bian, J.; Hui, X.; Zhao, X.; Tan, M. A novel monocular-based navigation approach for UAV autonomous transmission-line inspection. In Proceedings of the 2018 IEEE/RSJ International Conference on Intelligent Robots and Systems (IROS), Madrid, Spain, 1–5 October 2018; IEEE: Piscataway, NJ, USA, 2018; pp. 1–7. [Google Scholar]
  18. Polensky, J.; Regenda, J.; Adamek, Z.; Cisar, P. Prospects for the monitoring of the great cormorant (Phalacrocorax carbo sinensis) using a drone and stationary cameras. Ecol. Inform. 2022, 70, 101726. [Google Scholar] [CrossRef]
  19. Hossain, S.; Lee, D. Deep learning-based real-time multiple-object detection and tracking from aerial imagery via a flying robot with GPU-based embedded devices. Sensors 2019, 19, 3371. [Google Scholar] [CrossRef] [PubMed]
  20. Verucchi, M.; Bartoli, L.; Bagni, F.; Gatti, F.; Burgio, P.; Bertogna, M. Real-Time clustering and LiDAR-camera fusion on embedded platforms for self-driving cars. In Proceedings of the 2020 Fourth IEEE International Conference on Robotic Computing (IRC), Taichung, Taiwan, 9–11 November 2020; IEEE: Piscataway, NJ, USA, 2020; pp. 398–405. [Google Scholar]
  21. Barba-Guaman, L.; Eugenio Naranjo, J.; Ortiz, A. Deep learning framework for vehicle and pedestrian detection in rural roads on an embedded GPU. Electronics 2020, 9, 589. [Google Scholar] [CrossRef]
  22. Sabirova, A.; Fedorenko, R. Drone cinematography system design and new guideline model for scene objects interaction. In Proceedings of the 2020 International Conference Nonlinearity, Information and Robotics (NIR), Innopolis, Russia, 3–6 December 2020; IEEE: Piscataway, NJ, USA, 2020; pp. 1–6. [Google Scholar]
  23. Ferranti, L.; Bonati, L.; D’Oro, S.; Melodia, T. SkyCell: A prototyping platform for 5G aerial base stations. In Proceedings of the 2020 IEEE 21st International Symposium on “A World of Wireless, Mobile and Multimedia Networks (WoWMoM)”, Cork, Ireland, 31 August–3 September 2020; IEEE: Piscataway, NJ, USA, 2020; pp. 329–334. [Google Scholar]
  24. Redmon, J.; Farhadi, A. Yolov3: An incremental improvement. arXiv 2018, arXiv:1804.02767. [Google Scholar]
  25. Howard, A.; Sandler, M.; Chu, G.; Chen, L.C.; Chen, B.; Tan, M.; Wang, W.; Zhu, Y.; Pang, R.; Vasudevan, V.; et al. Searching for mobilenetv3. In Proceedings of the IEEE/CVF International Conference on Computer Vision, Seoul, Korea, 27 October–2 November 2019; pp. 1314–1324. [Google Scholar]
  26. Yang, G.; Feng, W.; Jin, J.; Lei, Q.; Li, X.; Gui, G.; Wang, W. Face mask recognition system with YOLOV5 based on image recognition. In Proceedings of the 2020 IEEE 6th International Conference on Computer and Communications (ICCC), Chengdu, China, 11–14 December 2020; IEEE: Piscataway, NJ, USA, 2020; pp. 1398–1404. [Google Scholar]
  27. Zhou, F.; Zhao, H.; Nie, Z. Safety helmet detection based on YOLOv5. In Proceedings of the 2021 IEEE International Conference on Power Electronics, Computer Applications (ICPECA), Shenyang, China, 22–24 January 2021; IEEE: Piscataway, NJ, USA, 2021; pp. 6–11. [Google Scholar]
  28. Nepal, U.; Eslamiat, H. Comparing YOLOv3, YOLOv4 and YOLOv5 for autonomous landing spot detection in faulty UAVs. Sensors 2022, 22, 464. [Google Scholar] [CrossRef] [PubMed]
  29. Ge, Z.; Liu, S.; Wang, F.; Li, Z.; Sun, J. Yolox: Exceeding yolo series in 2021. arXiv 2021, arXiv:2107.08430. [Google Scholar]
  30. Zhang, Y.; Zhang, W.; Yu, J.; He, L.; Chen, J.; He, Y. Complete and accurate holly fruits counting using YOLOX object detection. Comput. Electron. Agric. 2022, 198, 107062. [Google Scholar] [CrossRef]
  31. Zhang, M.; Wang, C.; Yang, J.; Zheng, K. Research on engineering vehicle target detection in aerial photography environment based on YOLOX. In Proceedings of the 2021 14th International Symposium on Computational Intelligence and Design (ISCID), Hangzhou, China, 11–12 December 2021; IEEE: Piscataway, NJ, USA, 2021; pp. 254–256. [Google Scholar]
  32. Liu, B.; Huang, J.; Lin, S.; Yang, Y.; Qi, Y. Improved YOLOX-S Abnormal Condition Detection for Power Transmission Line Corridors. In Proceedings of the 2021 IEEE 3rd International Conference on Power Data Science (ICPDS), online, 26 December 2021; IEEE: Piscataway, NJ, USA, 2021; pp. 13–16. [Google Scholar]
  33. Yang, W.; Jiachun, Z. Real-time face detection based on YOLO. In Proceedings of the 2018 1st IEEE International Conference on Knowledge Innovation and Invention (ICKII), Jeju Island, Korea, 23–27 July 2018; IEEE: Piscataway, NJ, USA, 2018; pp. 221–224. [Google Scholar]
  34. Dharneeshkar, J.; Aniruthan, S.A.; Karthika, R.; Parameswaran, L. Deep Learning based Detection of potholes in Indian roads using YOLO. In Proceedings of the 2020 International Conference on Inventive Computation Technologies (ICICT), Coimbatore, Tamil Nadu, 26–28 February 2020; IEEE: Piscataway, NJ, USA, 2020; pp. 381–385. [Google Scholar]
  35. Krawczyk, Z.; Starzyński, J. Bones detection in the pelvic area on the basis of YOLO neural network. In Proceedings of the 19th International Conference Computational Problems of Electrical Engineering, Banska Stiavnica, Slovakia, 16–19 September 2018; IEEE: Piscataway, NJ, USA, 2018; pp. 1–4. [Google Scholar]
  36. Ma, Y.; Yu, D.; Wu, T.; Wang, H. PaddlePaddle: An open-source deep learning platform from industrial practice. Front. Data Domputing 2019, 1, 105–115. [Google Scholar]
Figure 1. An overview of object detection models. (a) Two-stage object detection; (b) One-stage object detection.
Drones 06 00252 g001
Figure 2. Workflow diagram.
Drones 06 00252 g002
Figure 3. Schematic diagram of the location where the drone takes pictures and the camera angle setting.
Drones 06 00252 g003
Figure 4. Hardware schematic of the UAV system for bird’s nest inspection.
Drones 06 00252 g004
Figure 5. Software architecture.
Drones 06 00252 g005
Figure 6. YOLOv3 structure diagram.
Drones 06 00252 g006
Figure 7. YOLOv5-s structure diagram.
Drones 06 00252 g007
Figure 8. Focus network structure diagram.
Drones 06 00252 g008
Figure 9. YOLOX-s structure diagram.
Drones 06 00252 g009
Figure 10. Schematic diagram of bird’s nest samples after data augmentation. (a) Original image; (b) Horizonal flip image; (c) Vertical flip image; (d) Random rotate image; (e) Gaussian blur image.
Drones 06 00252 g010
Figure 11. The comparison of loss curves for YOLOv3, YOLOv5-s, and YOLOX-s. (a) YOLOv3; (b) YOLOv5-s; (c) YOLOX-s.
Drones 06 00252 g011
Figure 12. Comparison of the detection results of the three models. (a) YOLOv3; (b) YOLOv5-s; (c) YOLOX-s.
Drones 06 00252 g012
Figure 13. Display of flight status and bird’s nest detection results.
Drones 06 00252 g013
Figure 14. Display of flight status and bird’s nest detection results.
Drones 06 00252 g014
Table 1. UAV Specifications.
SpecificationsValue
DJI M300 RTK UAVDimensions810 × 670 × 430 mm
Max Takeoff Weight9 kg
Max Speed23 m/s
Max Ascent Speed6 m/s
Max Descent Speed5 m/s
Hovering AccuracyVertical:
±0.1 m (RTK enabled)
Horizontal:
±0.1 m (RTK enabled)
Max Flight Time55 min
Max Transmitting Distance 8 km
Obstacle Sensing RangeForward/Backward/Left/Right: 0.7–40 m
Upward/Downward: 0.6–30 m
Operating Temperature−20 °C to 50 °C
H20T
RGB Camera
Photo Size5184 × 3888
Sensor1/1.7″ CMOS, 20 MP
LensDFOV: 66.6–4°
Focal length: 6.83–119.94 mm
ISO Range100–25,600
Photo FormatJPEG
Table 2. Onboard computer specifications.
SpecificationsValue
Jetson Xavier NXGPU384-core Volta GPU with Tensor Cores
CPU6-core ARM v8.2 64-bit CPU, 6 MB L2 + 4 MB L3
Memory16 GB 128-Bit LPDDR4x|
59.7 GB/s
Storage16 GB eMMC 5.1
DL Accelerator(2×) NVDLA Engines
Size103 mm × 90.5 mm × 34 mm
Table 3. Specification for MobileNetV3-Large.
InputOperatorExp Size# OutSENLs
6082 × 3cov2d-16-HS2
3042 × 16bneck, 3 × 31616-RE1
3042 × 16bneck, 3 × 36424-RE2
1522 × 24bneck, 3 × 37224-RE1
1522 × 24bneck, 5 × 57240RE2
762 × 40bneck, 5 × 512040RE1
762 × 40bneck, 3 × 324080-HS2
382 × 80bneck, 3 × 320080-HS1
382 × 80bneck, 3 × 318480-HS1
382 × 80bneck, 3 × 3480112HS1
382 × 112bneck, 3 × 3672112HS1
382 × 112bneck, 5 × 5672160HS2
192 × 160bneck, 5 × 5960160HS1
192 × 160cov2d, 1 × 1-960-HS1
192 × 960pool, 7 × 7----1
12 × 960cov2d 1 × 1, NBN-1280-HS1
12 × 1280cov2d 1 × 1, NBN-k--1
Table 4. Definition of TP, TN, FP, FN.
Statistical ClassificationDefinition
True Positive(TP)A test result that correctly indicates the presence of a condition or characteristic
True Negative(TN)A test result that correctly indicates the absence of a condition or characteristic
False Positive(FP)A test result that indirectly indicates that a
particular condition or attribute is present
False Negative(FN)A test result that indirectly indicates that a
particular condition or attribute is absent
Table 5. Parameter settings for model training.
ModelEpochBatch SizeLearning RateInput ShapeTrainset/Validation
YOLOv3500320.005608 × 6089:1
YOLOv5-s500320.005640 × 6409:1
YOLOX-s500320.005640 × 6409:1
Table 6. Accuracy comparison of YOLOv3, YOLOv5-s and YOLOX-s.
ModelmAP/%
YOLOv390.1%
YOLOv5-s92.1%
YOLOX-s90.8%
Table 7. Detection speed comparison of YOLOv3, YOLOv5-s and YOLOX-s.
ModelFPS
YOLOv323.2
YOLOv5-s33.9
YOLOX-s31.1
Publisher’s Note: MDPI stays neutral with regard to jurisdictional claims in published maps and institutional affiliations.

