Article

Photogrammetric Acquisitions in Diverse Archaeological Contexts Using Drones: Background of the Ager Mellariensis Project (North of Córdoba-Spain)

by
Massimo Gasparini
*,
Juan Carlos Moreno-Escribano
and
Antonio Monterroso-Checa
Patricia Unit for R&D in Cultural Heritage (HUM 882 Research Group)/Ager Mellariensis Research Project (AEI FEDER HAR 77136-R), Universidad de Córdoba, Campus de Rabanales, Edificio C1, Carretera Nacional IV, km 396, 14014 Córdoba, Spain
*
Author to whom correspondence should be addressed.
Drones 2020, 4(3), 47; https://doi.org/10.3390/drones4030047
Submission received: 28 July 2020 / Revised: 14 August 2020 / Accepted: 22 August 2020 / Published: 25 August 2020

Abstract

:
Unmanned aerial vehicles (UAVs) and aerial photogrammetry have greatly contributed to expanding research in scientific fields that employ geomatics techniques. Archaeology is one of the sciences that has advanced most as a result of this technological innovation. The geographic products obtained by UAV photogrammetric surveys can detect anomalies corresponding to ancient settlements and aid in designing future archaeological interventions. These acquisitions also offer attractive scientific dissemination products. We present five archaeological sites from different ages located in the Guadiato Valley of Córdoba, Spain, where a series of photogrammetric images were acquired for purposes of both research and dissemination. Acquisitions were designed based on the accessibility of the sites and on the end-user experience. The results present several photogrammetric products for use in research, and the mandatory dissemination of the results of a publicly-funded research project.

Graphical Abstract

1. Introduction

In the last decade, the graphic documentation of archaeological heritage has advanced rapidly owing to the development of consumer unmanned aerial vehicles (UAVs) and user-friendly and high-performance photogrammetric software. In Spain [1,2,3,4,5,6], and many other European countries [7,8,9,10,11,12,13,14,15,16], several archaeological sites have been documented using UAV photogrammetric aerial surveys.
The geographic products resulting from the photogrammetric elaboration provide accurate and detailed spatial information that serves to improve the research of the site itself. The visualization and overlapping of these products in a geographical information system (GIS) enable the anomalies of buried archaeological remains to be individualized, thus permitting non-invasive, preliminary analyses and hypotheses of ancient settlements. Moreover, the acquisition and analysis of these geographic products facilitate the cost-effective planning of possible future archaeological interventions on the detected settlements with a high accuracy and certainty of ancient remains.
We present several photogrammetric surveys of difficult-to-access archaeological settlements made in recent years in the framework of the Ager Mellariensis Spanish National Research Project HAR 2016 77136-R [17]. Each of the UAV photogrammetric surveys was carried out with a different goal (research, planning of future activities and dissemination). All the analyzed archaeological sites are characterized by a series of problems:
  • The sites were totally or partially unknown;
  • They are very difficult to access due to their geographic and geomorphological position (e.g., on the top of mountain chains or submerged in reservoirs);
  • They are partially hidden by thick forest canopies.
Taking into account the original purpose of each survey, we designed each photogrammetric survey in a different way with the scope to acquire the best final quality of the products.
In a final step, we evaluated the absolute and relative accuracy of each photogrammetric aerial survey. There is an extensive state-of-the-art literature on the various methods used to validate the accuracy of the UAV photogrammetric data [18,19,20,21,22,23] applied specifically to archaeological settlements [24,25,26,27,28,29].
Due to the difficult access of our case studies, we compared the digital elevation models (DEMs) from the photogrammetric point clouds to accurate topographic surveys on the ground or to the LiDAR data of the National Aerial Orthophotography Plan (PNOA) [30] of the Spanish National Geographic Institute (IGN) [31].
The main aim of these comparisons is to explain that the use of aerial photogrammetry in archaeology cannot focus only on the extreme geometric accuracy: the mandatory goal is the best achievable quality of the photogrammetric products that are most used in archaeology (DEMs and ortophotomosaics). In archaeology, the sharpness and the high definition of the final images are more important than the extreme topographic and geometric accuracy of the photogrammetric model.
The case studies demonstrate that the accuracy of a photogrammetric survey can be adjusted to different final archaeological scopes without an excessive decrease in the final overall quality.

2. Materials and Methods

2.1. Case Studies

We present five archaeological sites representative of different historical ages located in the Guadiato Valley that were documented by means of UAV photogrammetric aerial surveys (Figure 1). Each of these sites presents particular features and difficulties that had to be addressed when planning and carrying out the UAV photogrammetric acquisitions.
The main goal guiding each photogrammetric acquisition survey was to ensure the best visual definition of the DEMs and ortophotomosaics. We need graphic products that have to be characterized by high-resolution and high sharpness in order to proceed with the remote sensing of the anomalies of buried archaeological remains. Therefore, for our studies, it is important to plan the photogrammetric survey with a high Ground Sample Distance (GSD), and it is also important to fly with the best environmental conditions (cloudy days with scattered sunlight). We try to obtain the best quality acquisitions with the fewest number of flights in one field work day, because the archaeological sites are almost always located in remote areas that are many kilometers away from the nearest modern settlement; these circumstances do not allow us to recharge the battery easily to realize further flights, and the displacements involve an excessive waste of time.
The five case studies are as follows:
  • Tartessian settlement of the Sierra Boyera Reservoir (Belmez): photogrammetric survey for the final graphic documentation of the archaeological campaign.
  • Mina de la Loba (Fuente Obejuna): photogrammetric survey to generate a graphic base for designing a future geophysical survey.
  • Caliphal fortress and settlement of Tolote (Los Blázquez): photogrammetric survey to detect anomalies on the ground belonging to archaeological remains.
  • Peñon de Peñarroya (Peñarroya–Pueblonuevo): photogrammetric survey to obtain a three-dimensional model for integration into a virtual reality application.
  • Venta de la Estrella (Espiel): photogrammetric survey to rapidly document an endangered archaeological site of difficult accessibility located in a reservoir.
The five surveys were performed with the following software and instrumentation:
  • DJI Phantom 4 Pro UAV platform for acquiring photos. The integrated RGB sensor is a 1” CMOS with 20 Mpx (image resolution 5472 px × 3648 px) and a focal length of 8.8 mm (24 mm at 35 mm format equivalent).
  • ARDUPILOT Mission Planner for flight planning.
  • Litchi mobile app for managing and controlling the UAV in the field.
  • Agisoft Metashape Pro for the photogrammetric processing. The main settings used for all the case studies were: (1) “accuracy: high” for the alignment (tie points); (2) “quality: high” for the dense clouds. All the sets of photos are self-calibrated by the software.

2.2. Tartessian Settlement of the Sierra Boyera Reservoir (Belmez)

In 2017, a severe drought in the Guadiato Valley led to a sharp drop in the water level of the Sierra Boyera Reservoir. As a result, a small peninsula emerged close to the reservoir dam, where the ruins of a Tartessian settlement became clearly visible (Figure 2). Members of the Ager Mellariensis project quickly performed an excavation to subsequently study and document the site before it was submerged again under the water of the reservoir.
When the archaeological excavation was finalized, a UAV photogrammetric survey was carried out to obtain an accurate and high-quality point cloud and its related by-products, including an orthophoto mosaic and a DEM. Because this may be the only geographical and graphic data that will be available for several years and there may not be another opportunity to document the site, the primary goal of the survey was to ensure that the product was of an overall high quality.
To collect the data, we first placed seven ground control points (GCPs) on the site. The GCPs were materialized in the field as squared targets printed in high-contrast with a size of 50 cm × 50 cm and anchored to the ground with pins at the corners. The GCPs were arranged uniformly throughout the study area (Figure 3). The geographic coordinates of each GCP were acquired with a Leica GNSS (Global Navigation Satellite System) system, and a real-time relative static survey of 60 measurements was performed for each GCP. The acquired data were post-processed using Leica GEO Office software. The Projected Coordinate Reference System is ETRS89 UTM Zone 30N.
The flight plan (Table 1) was set with the goal to obtain the best visual quality and a clear analysis of all the elements of the site.
Once the UAV flight was completed and georeferenced with the GNSS system, we proceeded with a second topographic survey with a Topcon OS 101 total station (TS) to improve the accuracy of the photogrammetric point cloud. We collected the coordinates of 138 well-characterized points of the archaeological structures.
As indicated by the total mean square error (MSE) of the GCPs in the XYZ coordinates of 1.37 cm and 0.5 px, the orthophoto mosaic and the DEM are of an excellent visual quality and a good topographic accuracy.

2.3. Mina de la Loba (Fuente Obejuna)

The second case study is the Mina de la Loba (Figure 4A), a late republic Roman mine (1st century BC) located in the municipality of Fuente Obejuna (Córdoba) [32]. The aim of the photogrammetric survey was to obtain an orthophoto mosaic and DEM that could be used as a highly reliable document for planning a future geophysical survey (Figure 4B). To cover the whole study area, it was necessary to prepare two different flight plans: one for the northern area and another for the southern area, with several meters of overlap between them (Table 2).
The photos were georeferenced using seven GCPs distributed throughout the entire study area, paying specific attention to emphasizing the most relevant differences in altitude (Figure 4B). The GCP coordinates were acquired using a TOPCON HiperSR dual frequency RTK (Real Time Kinematic) GNSS system connected to the Andalusian Positioning Network (RAP). This procedure allows for the real-time differential correction of the positioning error. The Projected Coordinate Reference System is ETRS89 UTM Zone 30N.
The orthophoto mosaic (Figure 4B) has a high-quality visibility and a spatial accuracy with a total MSE of the GCP coordinates of 2.83 cm and 0.225 px. This is due to the perfect environmental conditions during the data acquisition (solar light was scattered on the ground due to a completely cloudy sky and there were no steep differences in altitude), and due to the resulting absence of shadows on the terrain.

2.4. Caliphal Fortress and Village of Tolote (Los Blázquez)

The third case study is the photogrammetric acquisition of the caliphal fortress and settlement of Tolote located in the Sierra del Castillo in the municipality of Los Blázquez [33].
The main goal of this survey was to obtain a fairly reliable and good-quality graphic base to conduct a remote-sensing analysis of the Islamic structures and orographic anomalies and confirm a possible anthropic origin (Figure 5).
The area of influence of the ancient fortress and settlement covers approximately 14 ha. Due to its large size and the inaccessibility to various sectors of the castle (abrupt and thick Mediterranean forest), we were forced to reach an acceptable compromise between the feasibility of the work and the overall quality of the final product. To cover all possible visual angles, we designed two perpendicular flight plans (Table 3).
Although the resulting orthophoto mosaic is of a good visual quality, the physical inaccessibility to some areas affected the general quality of the topographic survey. We placed only six GCPs on the ground in the north-western and central sectors of the study area (Figure 6).
Due to the numerous cliffs and dense tree canopy of the study area, the GCPs in the north and east sectors were not clearly visible from the air. Therefore, the only reliable topographic point in these sectors is represented by the trig point n. 85,734 of the Lower Order Network (ROI–Red de Orden Inferior) of the Spanish geodetic control network. We carried out the acquisition of the georeferenced coordinates of the GCPs using the TOPCON HiperSR dual frequency RTK GNSS system connected to the Andalusian Positioning Network (RAP). The Projected Coordinate Reference System is ETRS89 UTM Zone 30N. In this case, the total MSE of the GCPs in the photogrammetric point cloud was 5.06 cm and 0.98 px.

2.5. Peñon de Peñarroya (Peñarroya–Pueblonuevo)

As one of the highest points of the Upper Guadiato Valley, the Peñon de Peñarroya is a rocky outcropping where a Chalcolithic settlement has been documented [34,35].
In this case study, a 3D model was generated from a UAV photogrammetric survey to insert this cultural and natural heritage environment in a virtual reality application called AeroGlobeGuadiatvr. Therefore, we only acquired the necessary photos by UAV for the photogrammetric elaboration, but did not conduct an accurate topographic survey on the ground of the area since the UAV’s GPS embedded system was sufficient for the purposes of the project. Given that this wide survey area spanned a surface of 42 ha, we decided to divide the area into three different flight plans, each one covering a specific sector (Table 4).
The orthophoto mosaic obtained by the photogrammetric process was of an adequate visual quality (Figure 7). The most obvious problem, clearly due to the lack of an accurate topographic survey on the ground, was the average positioning error of the photos combined with the UAV’s embedded GPS system, which was 1.99 m for the XYZ coordinates.

2.6. Venta de la Estrella (Espiel)

As in Section 2.2 (the Tartessian settlement of the Sierra Boyera Reservoir), the same drought that affected the Guadiato Valley in 2017 caused a small historical settlement (probably of Iberian and Roman origin) to emerge from the depths of another reservoir; in this case, the Puente Nuevo Reservoir in a site known as the Venta de la Estrella. Given the fortuitous discovery of this settlement—and its difficult accessibility—we decided to conduct a simple UAV photogrammetric survey (Table 5) without an accurate topographic survey on the ground. This choice was due to the need to map the site as quickly as possible before it was submerged again. We considered that the photogrammetric survey would provide sufficient data to carry out a provisional interpretation of the visible structures, without the need for a centimeter geometric accuracy.
The orthophoto mosaic obtained by the photogrammetric process is of a very good visual quality (Figure 8). However, like case study 2.5 of the Peñon de Peñarroya, the average positioning error of the photos, combined with the UAV’s embedded GPS system, was very large (2.5 m in the XYZ coordinates).

3. Results and Discussion

Appropriate geometric accuracy has reached different goals for each context.
For Section 2.2, the Tartessian settlement of the Sierra Boyera Reservoir in Belmez, an accuracy test was carried out based on an error check between the photogrammetric model and the topographic survey conducted with TS.
In the rest of the case studies, an accuracy test was also performed to check the error between our photogrammetric models and the open-access LiDAR data of the IGN.
The IGN acquired the LiDAR data of Andalucía in Spring of 2014 (March–May) and it published them in the 2016.
All the IGN LiDAR data of Andalucía are based on the ETRS89 geodetic datum. A Leica ALS60 sensor was used, and the point density of the point clouds is 0.5 pt/m2. The RMSExy is 0.3 m and the RMSEz is 0.2 m.
The downloadable LiDAR data are classified. Regarding our check-error tests, we have considered only the points of the Class 2 “Ground,” which is the most important point class to detect archaeological anomalies; the point density decreases to 0.3 pt/m2.

3.1. Accuracy Test of Tartessian Settlement of Sierra Boyera Reservoir (Belmez)

As explained in Section 2.2, we assessed the accuracy of this photogrammetric survey using an error check between the DEM of the area and the integrated GNSS and TS topographic survey (Figure 9). The coordinates obtained by the TS topographic survey were considered the most reliable and accurate.
The discrepancy (Δ) between the height (h) of each point of the topographic survey and the (h) of the corresponding pixels on the DEM generated from the photogrammetric survey data (Figure 10) was also calculated.
The root mean square error (RMSE) was then estimated based on the sum of the discrepancies (Figure 11), which is 0.055 m.

3.2. Accuracy Test of Mina de la Loba (Fuente Obejuna)

For the Mina de la Loba case study in Section 2.3, the data quality check was performed by comparing our DEM with the DTM processed of the LiDAR point cloud of the PNOA project.
The visible values in the discrepancies map are correct (Figure 12). If we do not consider the canopies of the trees, most of the values are in the orange range (−0.1 m to −0.4 m). Furthermore, it should be noted that the greatest distortions appear at the edges of the surveyed area (larger than −0.6 m in the northern area; larger than 0.7 m in the southern area). These are peripheral zones that are outside the area of intervention, and the errors can therefore be considered acceptable. Large distortions occurred in these peripheral areas due to the limited number of photos used for the photogrammetric processing and the absence of GCPs that would have surely limited the errors.

3.3. Results of Caliphal Fortress and Settlement of Tolote (Los Blázquez)

As explained in Section 2.4, the presence of a thick forest in the area of the fortress and village of Tolote negatively conditioned this acquisition. Before generating the DEM, we removed as many points related to the trees as possible without affecting the general quality of the model to reduce height errors due to the forest canopy.
When analyzing the discrepancies map (Figure 13) between the two DEMs, our acquisition and the IGN LiDAR data, it is interesting to observe that the western zone, the only area without forest cover, shows the largest discrepancies. Therefore, we assumed that the errors were not due to the presence of thick vegetation, but rather to the absence of GCPs on the ground in this area.
The analysis of the central sector of the surveyed area (Figure 14) where the castle and settlement are located shows that the largest discrepancies (color value: from red to yellow) correspond to the tree canopies that were impossible to remove (red) and to the background noise generated by the canopies (orange and yellow).
The most interesting values correspond to the green and aquamarine shades of the area where the structures of the castle and the village are located. These values are close to 30 cm (a tolerable discrepancy due to the RMSEz of the LiDAR data of 0.2 m).
The eastern area, which contains cliffs and a thick forest, presents high discrepancies (blue color value). These natural conditions impeded us from placing some GCPs to better compute the heights.
As result, the principal goal of furnishing good-quality graphic documentation to detect the structures of the castle and village from this photogrammetric survey was achieved considering the extension and the problematic terrain of the surveyed area.

3.4. Results of Peñon de Peñarroya (Peñarroya–Pueblonuevo) and Venta de la Estrella (Espiel)

Regarding Section 2.5 and Section 2.6, as explained in the previous sections, the UAV photogrammetric survey was not combined with an accurate topographic survey on the ground. As a result, the XYZ coordinates of the photogrammetric models have a low absolute accuracy.
However, the relative accuracy can be checked considering the homogeneity of the absolute errors of the photogrammetric model. An acceptable relative accuracy allows us to obtain different internal measurements of the model such as distances, areas and relative heights with a tolerable precision. Calculation errors can be easily identifiable by checking points in the photogrammetric model and in the geographic data of the PNOA (orthophotos and LiDAR data).
The selected sampling points were the same in both data sources (Figure 15 and Figure 16). The point sampling process was as follows:
  • The points were collected according to a uniform spatial distribution (whenever possible) and at different heights.
  • The sampling points, such as stones, crossroads and other features, were easily identifiable.
  • The position of the points was as close as possible to the bare ground or on flat spaces of more than 2 m2. Rocks or edges of buildings were avoided.
Homogeneity of the errors was evaluated using the coefficient of variation (CV), also known as the relative standard deviation (RSD) (Figure 17). This test could be indicative of the internal structure of the photogrammetric model. Although the absolute accuracy of the model presents large metric errors, it is interesting to determine if each part of the photogrammetric model presents the same general error.
The photogrammetric model of Section 2.5 Peñón de Peñarroya shows very high CV values above 100% (Table 6). If values above 50% are assumed to be indicative of high dispersion [36], the photogrammetric model can be considered null and void in terms of both its absolute and relative accuracy.
The photogrammetric model of Section 2.6 Venta de la Estrella presents an additional problem. When the PNOA LiDAR data were obtained in 2014, most of the surveyed area was flooded by the waters of the Puente Nuevo Reservoir (Figure 16B). Consequently, the PNOA LiDAR data for the site lacked information on absolute heights. Due to this problem, we were able to sample only four points in the northern sector of the surveyed area.
In this case, the CV values are very close to 0 and tolerable (Table 7). The most important problem is that the sampling points were not distributed uniformly in the surveyed area, and the data are insufficient to determine if the relative accuracy is acceptable.

4. Conclusions

Although some of the acquisitions presented here may have too many errors to be considered a high-quality geomatic product, it is important to take into account that the surveyed area presented several limitations. It is an extremely large wooded, rocky and irregular historical landscape conditioned by two reservoirs. Moreover, most of the land is private and it is difficult to access. However, photogrammetric acquisitions partially allow us to overcome these barriers. These “low cost” products have helped to preserve a substantial part of this threatened heritage. Without these acquisitions, we would not have been able to carry out the programmed socialization heritage activities. Acquisition and dissemination have served to increase the patrimonial interest of a site where no patrimonial documentation project has ever been carried out before.
In Section 2.2, an archaeological excavation was designed and carried out based on the acquired documentation. The surface ceramic contexts identified in the survey we conducted in 2018 were correctly georeferenced. In a few days, after our quick work, the reservoir flooded again, and this documentation is all that remains of the archaeological site until we are able return to it again.
The future prospects for the Mina de la Loba are more promising. A geophysical survey and an excavation based on a strong geomatic approach could be conducted in the framework of the Ager Mellariensis project. The documentation we obtained allowed us to detect anomalies and reconsider the extension of this archaeological site as well as optimize future geophysical prospections and excavation resources.
Similar conclusions can be drawn from the rest of the cases, especially cases 2.4 and 2.6. A plan for future interventions has already been designed for the caliphal fortress of Tolote. Moreover, like case 2.1, an archaeological site threatened by a reservoir has been recovered.
However, these acquisitions have an even more important application. They permit obtaining products for the socialization and dissemination of archaeological content. From a topographical point of view, although case 2.4 may not be very profitable nor too useful, the photogrammetric acquisition allowed us to develop a very interesting informative program: AeroGlobeGuadiatvr. This virtual tour using 3D glasses allows visitors to “fly” above the Peñon de Peñarroya (and other monuments of Alto Guadiato) in a hot air balloon while they listen to an account of the history of the site. The aim of the program is to raise awareness about the site among the local community and has attracted the interest of several institutions (Figure 18).
The strategy behind this remote sensing applications was to adapt photographic flights, taking into account their possibilities and limitations, to the objectives of the Ager Mellariensis archaeological research and social awareness project. The use of drones has allowed us to achieve these goals.

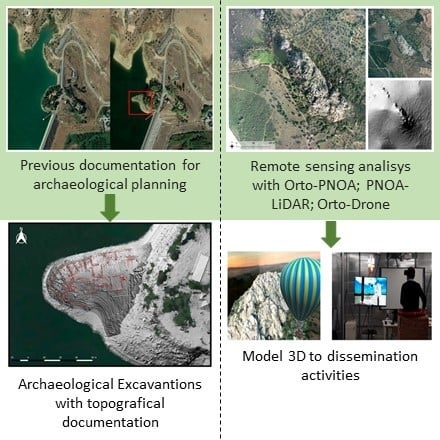
Author Contributions

Conceptualization, M.G., J.C.M.-E. and A.M.-C.; methodology, M.G. and J.C.M.-E.; validation, M.G. and J.C.M.-E.; investigation, M.G., J.C.M.-E. and A.M.-C.; data curation, J.C.M.-E.; writing—original draft preparation, M.G. and J.C.M.-E.; writing—review and editing, M.G. and A.M.-C.; supervision, A.M.-C.; project administration, A.M.-C.; funding acquisition, A.M.-C. All authors have read and agreed to the published version of the manuscript.

Funding

This research was funded by the National Research Agency–Spanish Ministry of Science and Innovation with FEDER actions. Grant number AEI FEDER HAR 2016 77136-R. The APC was funded by MDPI special offer.

Acknowledgments

Authors sincerely thanks MDPI for the invitation to publish this article in Drones-MDPI. The authors would like to thank Ramón González of CETEMET for providing image 18. Martha Gaustad revised the text.

Conflicts of Interest

The authors declare no conflict of interest.

References

  1. Fernández-Hernandez, J.; González-Aguilera, D.; Rodríguez-Gonzálvez, P.; Mancera-Taboada, J. Image-Based Modelling from Unmanned Aerial Vehicle (UAV) Photogrammetry: An Effective, Low-Cost Tool for Archaeological Applications. Archaeometry 2015, 57, 128–145. [Google Scholar] [CrossRef]
  2. Ruiz Sabina, J.Á.; Gallego Valle, D.; Peña Ruiz, C.; Molero García, J.M.; Gómez Laguna, A. Aerial Photogrammetry by drone in archaeological sites with large structures. Methodological approach and practical application in the medieval castles of Campo de Montiel. Virtual Archaeol. Rev. 2015, 6, 5. [Google Scholar] [CrossRef] [Green Version]
  3. Fernández-Lozano, J.; Gutiérrez-Alonso, G. Improving archaeological prospection using localized UAVs assisted photogrammetry: An example from the Roman Gold District of the Eria River Valley (NW Spain). J. Archaeol. Sci. Rep. 2016, 5, 509–520. [Google Scholar] [CrossRef]
  4. Mesas-Carrascosa, F.-J.; Notario García, M.; Meroño de Larriva, J.; García-Ferrer, A. An Analysis of the Influence of Flight Parameters in the Generation of Unmanned Aerial Vehicle (UAV) Orthomosaics to Survey Archaeological Areas. Sensors 2016, 16, 1838. [Google Scholar] [CrossRef] [PubMed] [Green Version]
  5. Rodrigues, J.; Figueiredo, M.; Bernardes, J.; Gonçalves, C. 3D modeling of the Milreu roman heritage with UAVs. In Proceedings of the Lecture Notes in Computer Science (Including Subseries Lecture Notes in Artificial Intelligence and Lecture Notes in Bioinformatics), Toronto, ON, Canada, 17–22 July 2016; Springer: Berlin/Heidelberg, Germany, 2016; Volume 9738, pp. 329–337. [Google Scholar]
  6. Gasparini, M.; Moreno-Escribano, J.C.; Monterroso-Checa, A. Identifying the Roman road from Corduba to Emerita in the Puente Nuevo reservoir (Espiel-Córdoba/Spain). J. Archaeol. Sci. Rep. 2019, 24, 363–372. [Google Scholar] [CrossRef]
  7. Verhoeven, G.; Docter, R. The amphitheatre of Carnuntum: Towards a complete 3D model using airborne Structure from Motion and dense image matching. In Proceedings of the 10th International Conference on Archaeological Prospection, Vienna, Austria, 29 May–2 June 2013; Austrian Academy of Sciences: Vienna, Austria, 2013; pp. 438–440. [Google Scholar]
  8. Fiorillo, F.; Jiménez Fernández-Palacios, B.; Remondino, F.; Barba, S. 3d Surveying and modelling of the Archaeological Area of Paestum, Italy. Virtual Archaeol. Rev. 2015, 4, 55. [Google Scholar] [CrossRef]
  9. Dubbini, M.; Curzio, L.I.; Campedelli, A. Digital elevation models from unmanned aerial vehicle surveys for archaeological interpretation of terrain anomalies: Case study of the Roman castrum of Burnum (Croatia). J. Archaeol. Sci. Rep. 2016, 8, 121–134. [Google Scholar] [CrossRef] [Green Version]
  10. Ostrowski, W.; Hanus, K. Budget UAV Systems for the Prospection of Small and Medium-Scale Archaeological Sites. ISPRS Int. Arch. Photogramm. Remote Sens. Spat. Inf. Sci. 2016, XLI-B1, 971–977. [Google Scholar] [CrossRef]
  11. Campana, S. Drones in Archaeology. State-of-the-art and Future Perspectives. Archaeol. Prospect. 2017, 24, 275–296. [Google Scholar] [CrossRef]
  12. Ceraudo, G.; Guacci, P.; Merico, A. The use of UAV technology in topographical research: Some case studies from Central and Southern Italy. SCIRES-IT 2017, 7, 29–38. [Google Scholar] [CrossRef]
  13. Cowley, D.; Moriarty, C.; Geddes, G.; Brown, G.; Wade, T.; Nichol, C. UAVs in Context: Archaeological Airborne Recording in a National Body of Survey and Record. Drones 2017, 2, 2. [Google Scholar] [CrossRef] [Green Version]
  14. Erenoglu, R.C.; Akcay, O.; Erenoglu, O. An UAS-assisted multi-sensor approach for 3D modeling and reconstruction of cultural heritage site. J. Cult. Herit. 2017, 26, 79–90. [Google Scholar] [CrossRef]
  15. Chiabrando, F.; D’Andria, F.; Sammartano, G.; Spanò, A. UAV photogrammetry for archaeological site survey. 3d models at the hierapolis in Phrygia (Turkey). Virtual Archaeol. Rev. 2018, 9, 28–43. [Google Scholar] [CrossRef] [Green Version]
  16. Carraro, F.; Marinello, A.; Morabito, D.; Bonetto, J. New Perspectives on the Sanctuary of Aesculapius in Nora (Sardinia): From Photogrammetry to Visualizing and Querying Tools. Open Archaeol. 2019, 5, 263–273. [Google Scholar] [CrossRef]
  17. Spanish National Research Project HAR 2016 77136-R “Ager Mellariensis”. Available online: http://www.uco.es/mellaria/ (accessed on 19 July 2020).
  18. Harwin, S.; Lucieer, A. Assessing the Accuracy of Georeferenced Point Clouds Produced via Multi-View Stereopsis from Unmanned Aerial Vehicle (UAV) Imagery. Remote Sens. 2012, 4, 1573–1599. [Google Scholar] [CrossRef] [Green Version]
  19. Aicardi, I.; Chiabrando, F.; Grasso, N.; Lingua, A.M.; Noardo, F.; Spanò, A. UAV photogrammetry with oblique images: First analysis on data acquisition and processing. ISPRS Int. Arch. Photogramm. Remote Sens. Spat. Inf. Sci. 2016, XLI-B1, 835–842. [Google Scholar] [CrossRef]
  20. Agüera-Vega, F.; Carvajal-Ramírez, F.; Martínez-Carricondo, P. Assessment of photogrammetric mapping accuracy based on variation ground control points number using unmanned aerial vehicle. Meas. J. Int. Meas. Confed. 2017, 98, 221–227. [Google Scholar] [CrossRef]
  21. Spanò, A.; Sammartano, G.; Calcagno Tunin, F.; Cerise, S.; Possi, G. GIS-based detection of terraced landscape heritage: Comparative tests using regional DEMs and UAV data. Appl. Geomat. 2018, 10, 77–97. [Google Scholar] [CrossRef] [Green Version]
  22. Cucchiaro, S.; Fallu, D.J.; Zhang, H.; Walsh, K.; Van Oost, K.; Brown, A.G.; Tarolli, P. Multiplatform-SfM and TLS data fusion for monitoring agricultural terraces in complex topographic and landcover conditions. Remote Sens. 2020, 12, 1946. [Google Scholar] [CrossRef]
  23. Kalacska, M.; Lucanus, O.; Arroyo-Mora, J.P.; Laliberté, É.; Elmer, K.; Leblanc, G.; Groves, A. Accuracy of 3D Landscape Reconstruction without Ground Control Points Using Different UAS Platforms. Drones 2020, 4, 13. [Google Scholar] [CrossRef] [Green Version]
  24. Lo Brutto, M.; Garraffa, A.; Meli, P. UAV platforms for cultural heritage survey: First results. ISPRS Ann. Photogramm. Remote Sens. Spat. Inf. Sci. 2014, 2, 227–234. [Google Scholar] [CrossRef] [Green Version]
  25. Tscharf, A.; Rumpler, M.; Fraundorfer, F.; Mayer, G.; Bischof, H. On the Use of UAVs in Mining and Archaeology—Geo-Accurate 3D Reconstructions Using Various Platforms and Terrestrial Views. ISPRS Ann. Photogramm. Remote Sens. Spat. Inf. Sci. 2015, II-1/W1, 15–22. [Google Scholar] [CrossRef] [Green Version]
  26. Chiabrando, F.; Lingua, A.; Maschio, P.; Teppati Losè, L. The influence of flight planning and camera orientation in UAVs photogrammetry. A test in the area of rocca San Silvestro (LI), Tuscany. Int. Arch. Photogramm. Remote Sens. Spat. Inf. Sci. ISPRS Arch. 2017, 42, 163–170. [Google Scholar] [CrossRef] [Green Version]
  27. Daponte, P.; De Vito, L.; Mazzilli, G.; Picariello, F.; Rapuano, S. A height measurement uncertainty model for archaeological surveys by aerial photogrammetry. Meas. J. Int. Meas. Confed. 2017, 98, 192–198. [Google Scholar] [CrossRef]
  28. Nikolakopoulos, K.G.; Soura, K.; Koukouvelas, I.K.; Argyropoulos, N.G. UAV vs classical aerial photogrammetry for archaeological studies. J. Archaeol. Sci. Rep. 2017, 14, 758–773. [Google Scholar] [CrossRef]
  29. Barba, S.; Barbarella, M.; Di Benedetto, A.; Fiani, M.; Gujski, L.; Limongiello, M. Accuracy Assessment of 3D Photogrammetric Models from an Unmanned Aerial Vehicle. Drones 2019, 3, 79. [Google Scholar] [CrossRef] [Green Version]
  30. PNOA—Plan National Ortofotografía Aérea. Available online: https://pnoa.ign.es/ (accessed on 24 July 2020).
  31. IGN—Instituto Geográfico Nacional. Available online: http://www.ign.es/web/ign/portal (accessed on 24 July 2020).
  32. Blázquez Martínez, J.M.; Domergue, C.; Sillières, P. La Loba: Fuenteobejuna, Province de Cordoue, Espagne: La Mine et le Village Minier Antiques; Mémoires; Ausonius Éditions: Bordeaux, France, 2002; ISBN 2-910023-29-X. [Google Scholar]
  33. Bernier Luque, J. Nuevos Yacimientos Arqueológicos en Córdoba y Jaén; Monte de Piedad y Caja de Ahorros de Córrdoba: Córdoba, Spain, 1981; ISBN 9788472316126. [Google Scholar]
  34. Romanillo, J.A.M.; Ruiz, L.J. Las pinturas del Abrigo Carmelo (Peñarroya, Córdoba). Empúries Rev. Món Clàssic Antig. Tardana 1966, 28, 170–175. [Google Scholar]
  35. Valiente, S.; Ruiz, J.; Giles, F. Aportaciones para la carta arqueológica del Norte de la provincia de Córdoba. Cuad. Prehist. Arqueol. 1974, 1, 103–131. [Google Scholar] [CrossRef] [Green Version]
  36. Pardo Merino, A.; Ruiz Díaz, M.Á.; San Martín Castellanos, R. Análisis de Datos en Ciencias Sociales y de la Salud I; Síntesis: Madrid, Spain, 2009; ISBN 978-84-9756-647-6. [Google Scholar]
Figure 1. Geographical location of the five archaeological case studies. © “Ager Mellariensis”/AEI FEDER HAR 77136-R. Orthoimage from © IGN ORTO-PNOA 2016.
Drones 04 00047 g001
Figure 2. Tartessian settlement of Sierra Boyera. On the left, the area on 21 July 2016. On the right, the same area on 28 October 2017, showing the emerged site. ©Images from Google Earth.
Drones 04 00047 g002
Figure 3. Orthophoto mosaic created by the photogrammetric workflow using photos acquired by Unmanned Aerial Vehicle (UAV) at a height of 20 m (area outlined in white) and the Ground Control Points (GCPs) used for the topographic survey (red). © “Ager Mellariensis”/AEI FEDER HAR 77136-R.
Drones 04 00047 g003
Figure 4. (A) Mina de la Loba. Extraction galleries and settlement. © “Ager Mellariensis”/AEI FEDER HAR 77136-R. (B) Orthophoto mosaic (left) and Digital Elevation Model (DEM) (right) of the final products of the Mina de la Loba photogrammetric survey. GCPs are marked in red. © “Ager Mellariensis”/AEI FEDER HAR 77136-R.
Drones 04 00047 g004
Figure 5. Orthophoto mosaic obtained by the photogrammetric survey of the caliphal fortress and Tolote settlement with the detected archaeological structures. © “Ager Mellariensis”/AEI FEDER HAR 77136-R.
Drones 04 00047 g005
Figure 6. Orthophoto mosaic obtained by the photogrammetric survey of the caliphal fortress and village of Tolote. GCPs are marked in red. © “Ager Mellariensis”/AEI FEDER HAR 77136-R.
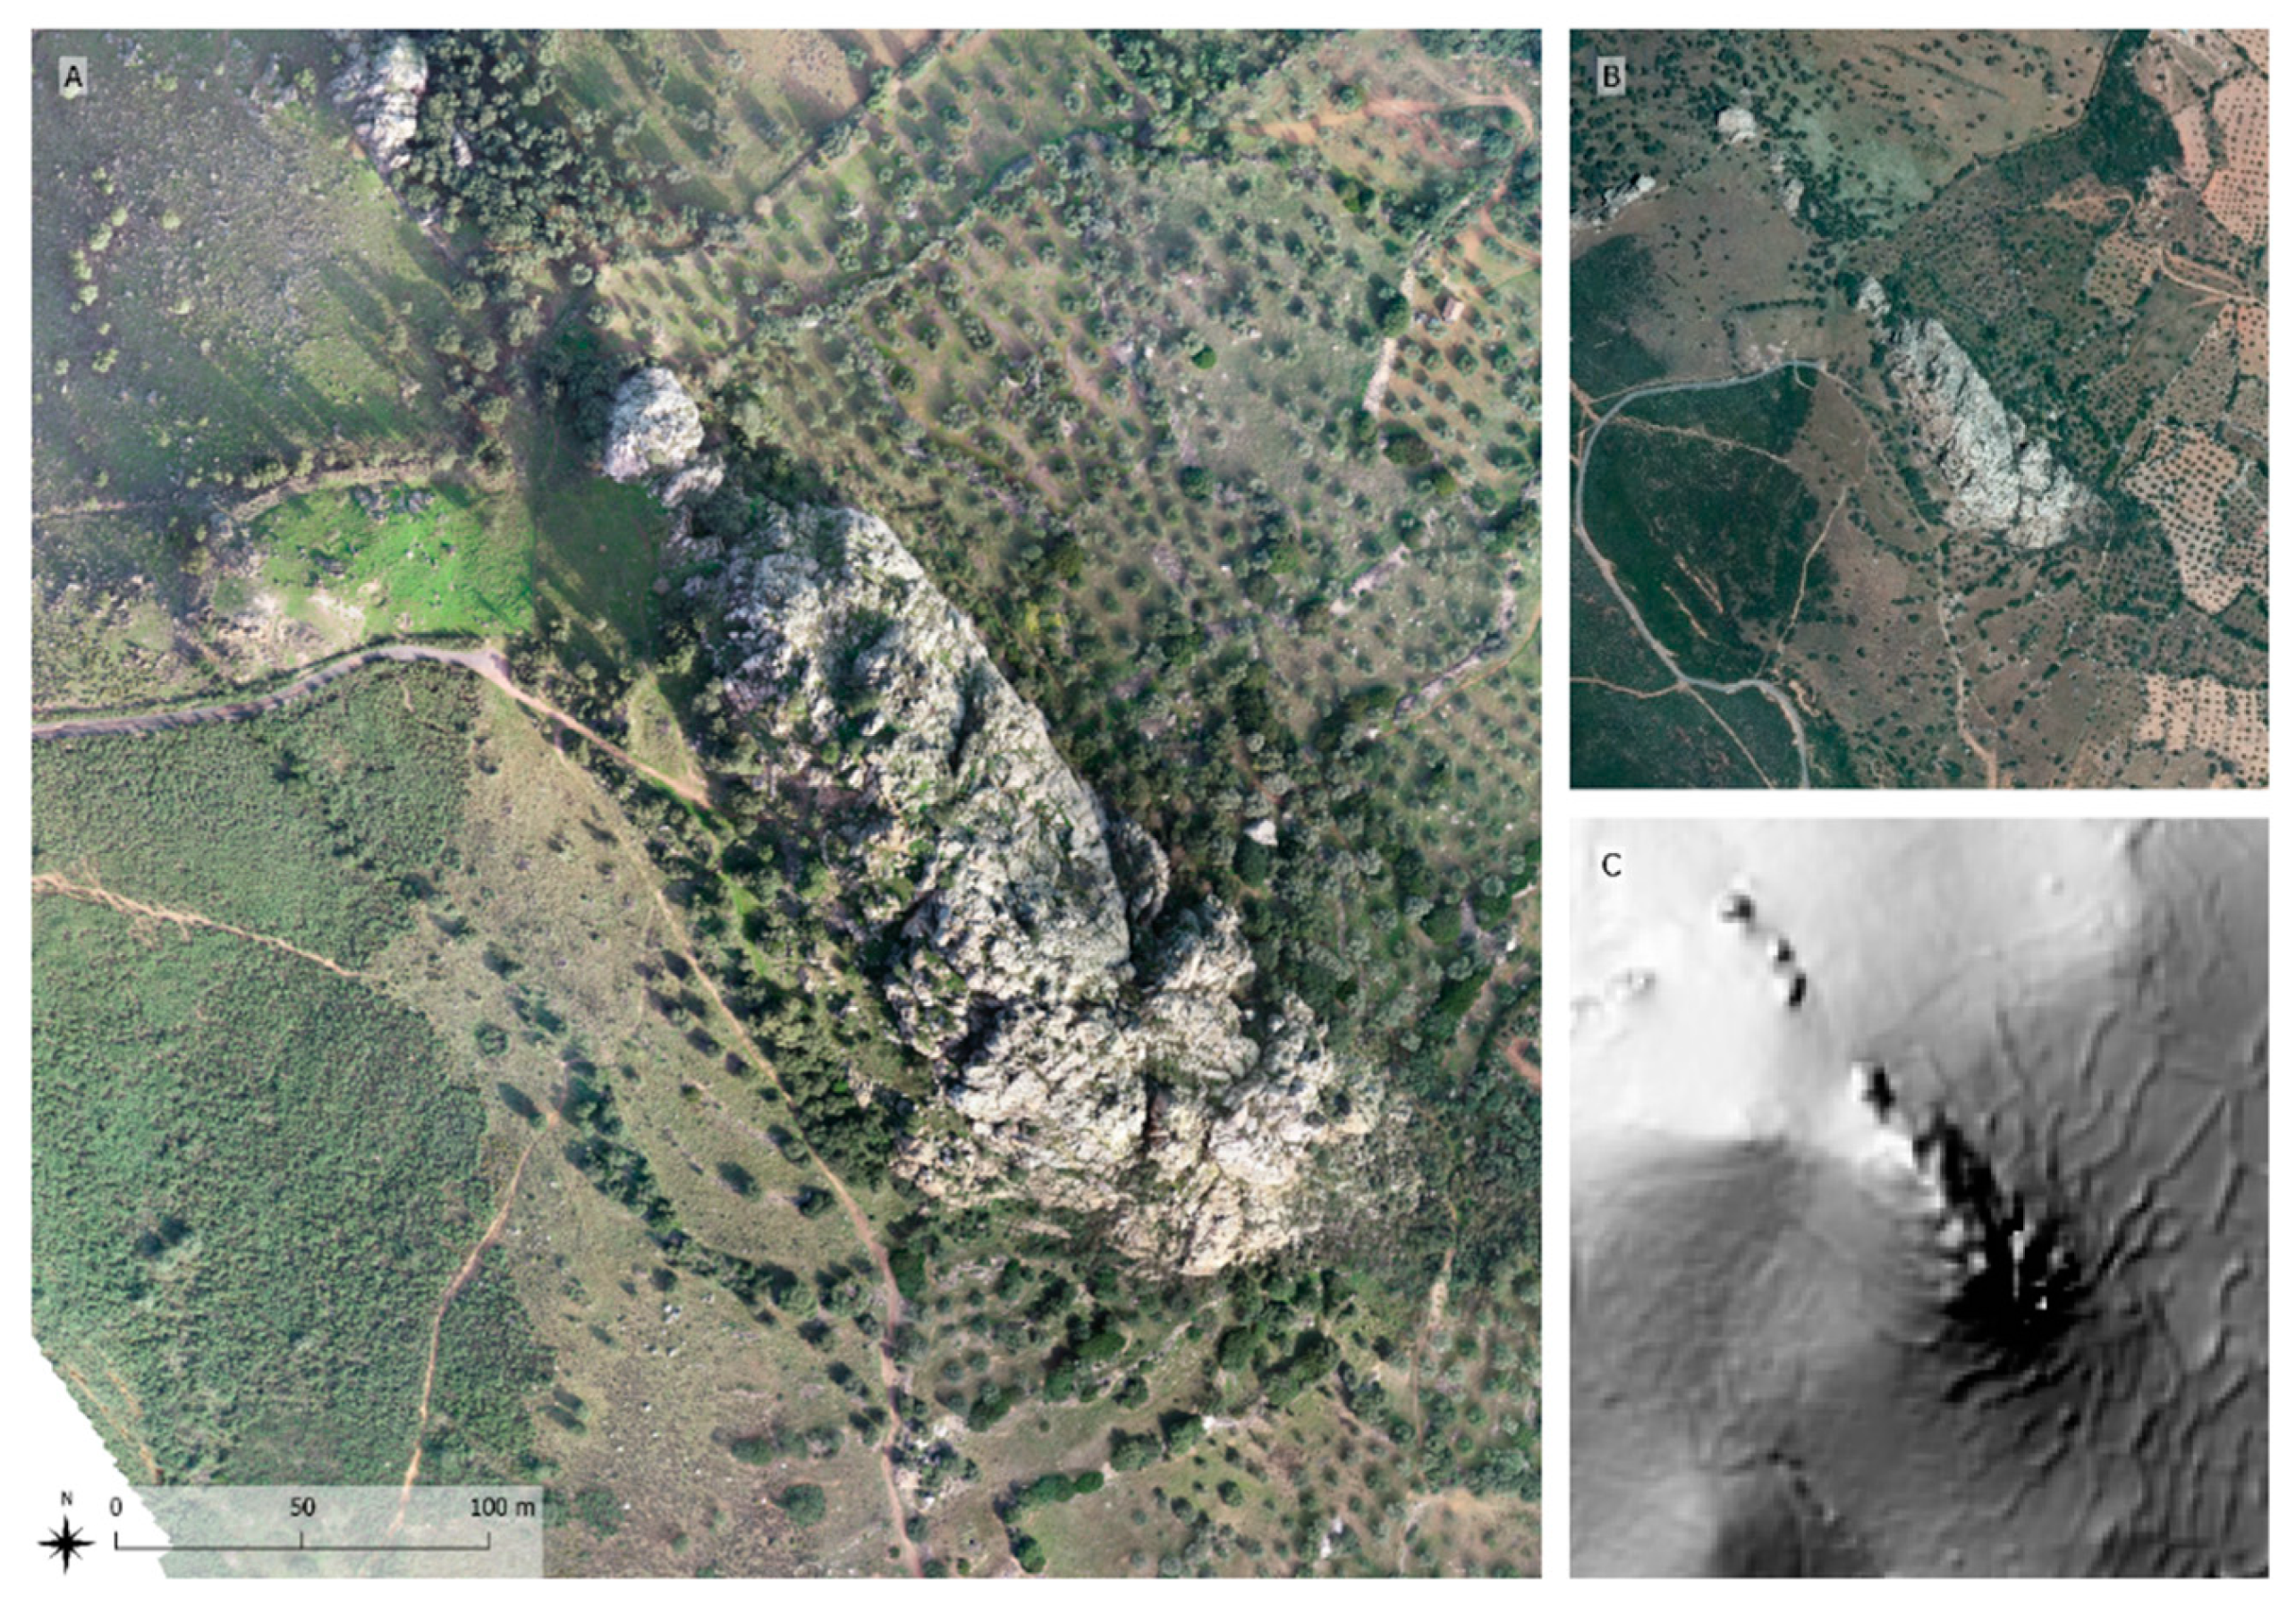
Drones 04 00047 g006
Figure 7. Peñon de Peñarroya: (A) orthophoto mosaic by UAV photogrammetric survey; (B) orthophoto mosaic of the year 2013 of the PNOA; (C) Digital Terrain Model (DTM) generated from the LiDAR files of the PNOA. © “Ager Mellariensis”/AEI FEDER HAR 77136-R.
Drones 04 00047 g007
Figure 8. Venta de la Estrella (Espiel): (A) ©PNOA orthophoto mosaic of 2005; (B) orthophoto mosaic by UAV photogrammetric survey without an accurate topographic survey on the ground; (C) DEM by UAV photogrammetric survey. © “Ager Mellariensis”/AEI FEDER HAR 77136-R.
Drones 04 00047 g008
Figure 9. Tartessian settlement of Sierra Boyera Reservoir: topographic survey with TS (red) overlapped on the hillshade map by DEM. © “Ager Mellariensis”/AEI FEDER HAR 77136-R.
Drones 04 00047 g009
Figure 10. Graph of the height discrepancies (Δh) between the points of the topographic survey with TS and the corresponding pixels extrapolated from the DEM.
Drones 04 00047 g010
Figure 11. Formula used to calculate the root mean square error (RMSE) between the TS topographic survey and the photogrammetric DEM: n is the number of points (138), hTotal Station [m] is the height obtained by the TS and hPhotogrammetric Model [m] is the height obtained by the DEM.
Drones 04 00047 g011
Figure 12. Mina de la Loba: map of discrepancies between the heights of the DEMs generated from the photogrammetric and LiDAR data. © “Ager Mellariensis”/AEI FEDER HAR 77136-R.
Drones 04 00047 g012
Figure 13. Caliphal fortress and settlement of Tolote: map of discrepancies between the heights of the DEMs generated by the elaboration of photogrammetric data and the PNOA LiDAR data. © “Ager Mellariensis”/AEI FEDER HAR 77136-R.
Drones 04 00047 g013
Figure 14. Caliphal fortress and village of Tolote: detail of the discrepancies map corresponding to the area where the historical structures are located. © “Ager Mellariensis”/AEI FEDER HAR 77136-R.
Drones 04 00047 g014
Figure 15. Section 2.5 Peñon de Peñarroya (Peñarroya–Pueblonuevo): (A) Comparison of the spatial distribution of the sampling points used to evaluate the absolute errors between the orthophoto mosaic obtained by the photogrammetric survey and (B) the Spanish PNOA orthophoto mosaic of 2016. A. © “Ager Mellariensis”/AEI FEDER HAR 77136-R. B. © IGN ORTO-PNOA 2016.
Drones 04 00047 g015
Figure 16. Section 2.6 Venta de la Estrella (Espiel): comparison of the spatial distribution of the sampling points used to evaluate the absolute errors between (A) the orthophoto mosaic obtained by the photogrammetric survey and (B) the Spanish PNOA orthophoto mosaic of 2016. A. © “Ager Mellariensis”/AEI FEDER HAR 77136-R. B. © IGN ORTO-PNOA 2016.
Drones 04 00047 g016
Figure 17. Coefficient of variation or relative standard deviation: X ¯ is the arithmetic mean of the errors, Xi is the error of each sampling point, S2 is the variance, S is the standard deviation and CV is the coefficient of variation expressed in %.
Drones 04 00047 g017
Figure 18. AeroGlobeGuadiatvr. Virtual tour of the Peñon de Peñarroya (and the medieval castle of Belmez) developed by Ramón González of Cetemet Inc. for the Ager Mellariensis research project.
Drones 04 00047 g018
Table 1. Flight plan settings for the photogrammetric survey of the Tartessian settlement of the Sierra Boyera Reservoir.
Survey Area0.21 ha
Flight level [m]20
Flight airspeed [m/s]1.5
Interval shooting [s]2
GSD [cm]0.5
Overlap [%]80
Sidelap [%]75
No. of photos used137
Table 2. Flight plan settings for the Mina de la Loba photogrammetric survey.
Flight Plan 1 (N)Flight Plan 2 (S)
Survey area11.5 ha12.7 ha
Flight level [m]120120
Flight airspeed [m/s]33
Interval shooting [s]22
GSD [cm]3.513.51
Overlap [%]>80>80
Sidelap [%]7574
No. of photos used942
Table 3. Flight plan settings for the photogrammetric survey of the caliphal fortress and village of Tolote (Los Blázquez).
Flight Plan 1 (N-S)Flight Plan 2 (E-W)
Survey area13.9 ha13.9 ha
Flight level [m]120120
Flight airspeed [m/s]33
Interval shooting [s]22
GSD [cm]3.513.51
Overlap [%]>80>80
Sidelap [%]7575
No. of photos used1109
Table 4. Flight plan settings for the Peñon de Peñarroya photogrammetric survey (Peñarroya–Pueblonuevo).
Flight Plan 1 (NW-SE)Flight Plan 2 (NW-SE)Flight Plan 3 (NW-SE)
Survey area14.6 ha14.2 ha13.2 ha
Flight level [m]120120120
Flight airspeed [m/s]333
Interval shooting [s]222
GSD [cm]3.513.513.51
Overlap [%]808080
Sidelap [%]707070
No. of photos used1442
Table 5. Flight plan settings for the Venta de la Estrella photogrammetric survey (Espiel).
Flight Plan 1 (N-S)Flight Plan 2 (NW-SE)
Survey area8 ha7 ha
Flight level [m]6060
Flight airspeed [m/s]1.51.5
Interval shooting [s]22
GSD [cm]1.41.4
Overlap [%]8080
Sidelap [%]7070
No. of photos used1151
Table 6. Results of the coefficient of variation for the 11 sampling points of Section 2.5 Peñon de Peñarroya.
Section 2.5 Peñón de Peñarroya
PNOA-LiDARPhotogrammetric ModelDiscrepancies
IDX [m]Y [m]H [m]X [m]Y [m]h [m]ΔX [m]ΔY [m]ΔZ [m]
1299,616.6314,243,949.724713.802299,614.5414,243,949.990702.861332.090−0.26610.941
2299,765.3334,244,121.761671.937299,764.4754,244,122.033663.747130.858−0.2728.190
3299,637.7084,243,784.115728.181299,636.8694,243,784.750717.705930.839−0.63510.475
4299,808.8134,243,865.292751.312299,807.9034,243,866.102739.388730.910−0.81011.923
5300,040.8274,244,072.587678.150300,040.5284,244,073.300668.812620.299−0.7139.337
6299,881.7504,243,576.557689.382299,881.7274,243,576.998678.827150.023−0.44110.555
7299,938.0884,243,727.442745.590299,936.4864,243,728.995735.176941.602−1.55310.413
8300,146.9784,243,803.410659.138300,147.1374,243,802.425649.09106−0.1590.98510.047
9300,020.2314,243,465.479657.916300,019.6024,243,465.947647.192260.629−0.46810.724
10300,089.2824,243,593.039661.015300,088.8254,243,592.640651.503170.4570.3999.512
11300,492.1834,243,686.371625.294300,491.1644,243,684.860613.410951.0191.51111.883
X ¯ [m]0.779−0.20610.364
S 2 [m]0.4290.7481.186
S [m]0.654875230.865143581.08901314
CV [%]84.0857652420.5293610.5080206
Table 7. Results of the coefficient of variation for the four sampling points of case study 2.6 Venta de la Estrella.
Section 2.6 Venta de la Estrella
PNOA-LiDARPhotogrammetric ModelDiscrepancies
IDX [m]Y [m]H [m]X [m]Y [m]h [m]ΔX [m]ΔY [m]ΔZ [m]
1323,329.9224,224,524.940443.529323,331.0934,224,526.652508.82272−1.171−1.712−65.294
2323,371.2644,224,552.508444.987323,372.464,224,554.039510.1181−1.196−1.531−65.131
3323,533.7884,224,525.563444.658323,534.8174,224,526.753509.28793−1.029−1.190−64.630
4323,423.4514,224,506.473443.624323,424.5324,224,508.301505.87317−1.081−1.828−62.249
X ¯ [m]−1.119−1.565−64.326
S 2 [m]0.0060.0781.997
S [m]0.077839040.278423391.41306383
CV [%]−6.95457166−17.7877904−2.19672414

