1. Introduction
Timber theft is the intentional illegal harvesting of timber that belongs to someone else. Similarly, timber trespass is the unintentional harvest of another person’s timber; this usually occurs while legally logging a site adjacent to where the trespass occurs. Timber theft and trespass are common problems worldwide [
1]. Both carry a civil penalty in most US states and the thief/trespasser, if caught and convicted, is usually required to pay damages in excess of the market value of the illegally harvested timber at the time the harvest occurred [
2]. The annual estimation of loss to landowners and timber companies due to timber theft/trespass is in excess of US
$20 billion globally [
3]. Aside from economic loss, timber theft can also cause environmental damage from left over slash piles as they can become fuel for wildfires. Timber theft/trespass is generally very difficult to detect in remote areas, as some landowners live far from the property they own or often travel away from property they live on. Accurate assessment of the diameter and number of tree stumps due to timber theft or trespass is needed to quantify the financial value of illegally harvested timber. Tree stump diameter can be used to estimate tree height and thus timber volume. Use of ground sampling techniques to quantify stump diameter and number following illegal timber harvest may not be cost effective and can be labor intensive.
Initial detection of timber trespass or theft is often not found for months or years after the event. Traditionally when it is found, labor intensive data collection and investigations must occur. If a rapid and cost-effective assessment of recently finished logging jobs could occur (as they are completed), landowners would know exactly what was cut and that no theft had occurred. Likewise, if there had been tree removals that were unknown at the time, these issues could be addressed immediately. Traditional data collection after timber theft places a financial value directly estimated from the number and diameter of the stumps removed. However, this process can be time consuming and expensive as it requires a person walking over a site to collect needed data.
To overcome the limitations of traditional approaches we used a small unmanned aerial system (UAS) capable of collecting geo-referenceable, high spatial resolution, visible spectrum imagery; specifically, a DJI Phantom 3 Professional [
4] with a 12.4 megapixel camera. The use of UAS has been shown to be an effective tool in forest monitoring and management. As a platform, UAS are important in filling data gaps and enhancing the capability of field surveys, manned aircraft and satellites. Remote sensing based on UAS data has been shown to be effective for surveying forests, mapping canopy gaps, measuring canopy height, tracking wildfires, and supporting intensive forest management [
5]. UAS collected imagery can help with early stage identification and damage estimation of forest windthrow [
6]. Remotely sensed imagery from a UAS also shown to be effective in providing assessment of post-fire salvage logging disturbance [
7]. The use of small UAS has been shown to be helpful in tropical communities to manage and conserve forests [
8]. Very high temporal and spatial resolution imagery obtained from the UAS provide a new tool for improved forest health monitoring during disease outbreaks [
9]. With commercial availability of high spatial resolution visible and small active sensors, data can be provided for high precision forestry applications such as three-dimensional tree measurements, assessment of tree competition measurements, and growth [
10]. Remote sensing using a UAS can provide a powerful tool for estimating the abundance and diameter of tree stumps at a recently logged site. This system can negate the cost and difficulties of ground sampling while gathering needed information in a fraction of the time needed to survey a site from the ground. Imagery collected from UAS sensors is georeferenced and when used in conjunction with computer vision algorithms can potentially solve the problem of measuring forest spatial structures (i.e., tree stumps).
The main goals and objectives of this study were:
To collect high spatial resolution visible spectrum imagery of freshly cut loblolly pine forest using a low cost UAS,
To study different computer vision algorithms to identify stumps, count stumps, estimate the stump diameter and stump area from aerial imagery,
Study the efficacy of the algorithms by validating the accuracy of computer vision algorithms with a human expert, and
Document the challenges involved in UAS based spatial measurement of pine forests.
This methodology is capable of providing measurement of the acreage, approximations of both the diameters and number of pine trees removed, which when coupled with product designations and general species can yield a scientifically backed estimate of value. Many forest managers and land owners use UAS video to visually inspect trees to monitor forest health. It is of importance to develop a methodology to automatically process these videos to identify stumps and estimate the stump diameters. Although use of orthomosaics produced from still images are preferable, given that imagery is already available in video format, this method may prove to be a quicker and less expensive method of approximating the value of removed pine timber in a clear-cut situation. It may also be useful as a post-logging tool showing landowners exactly where all logging took place.
The organization of this paper is as follows.
Section 2 presents materials and methods that describe the study area, UAS data collection and preprocessing, followed by the computer vision algorithms explored in this study.
Section 3 presents our results, while
Section 4 is a discussion of the results. Lastly,
Section 5 provides concluding remarks.
2. Materials and Methods
2.1. Study Area
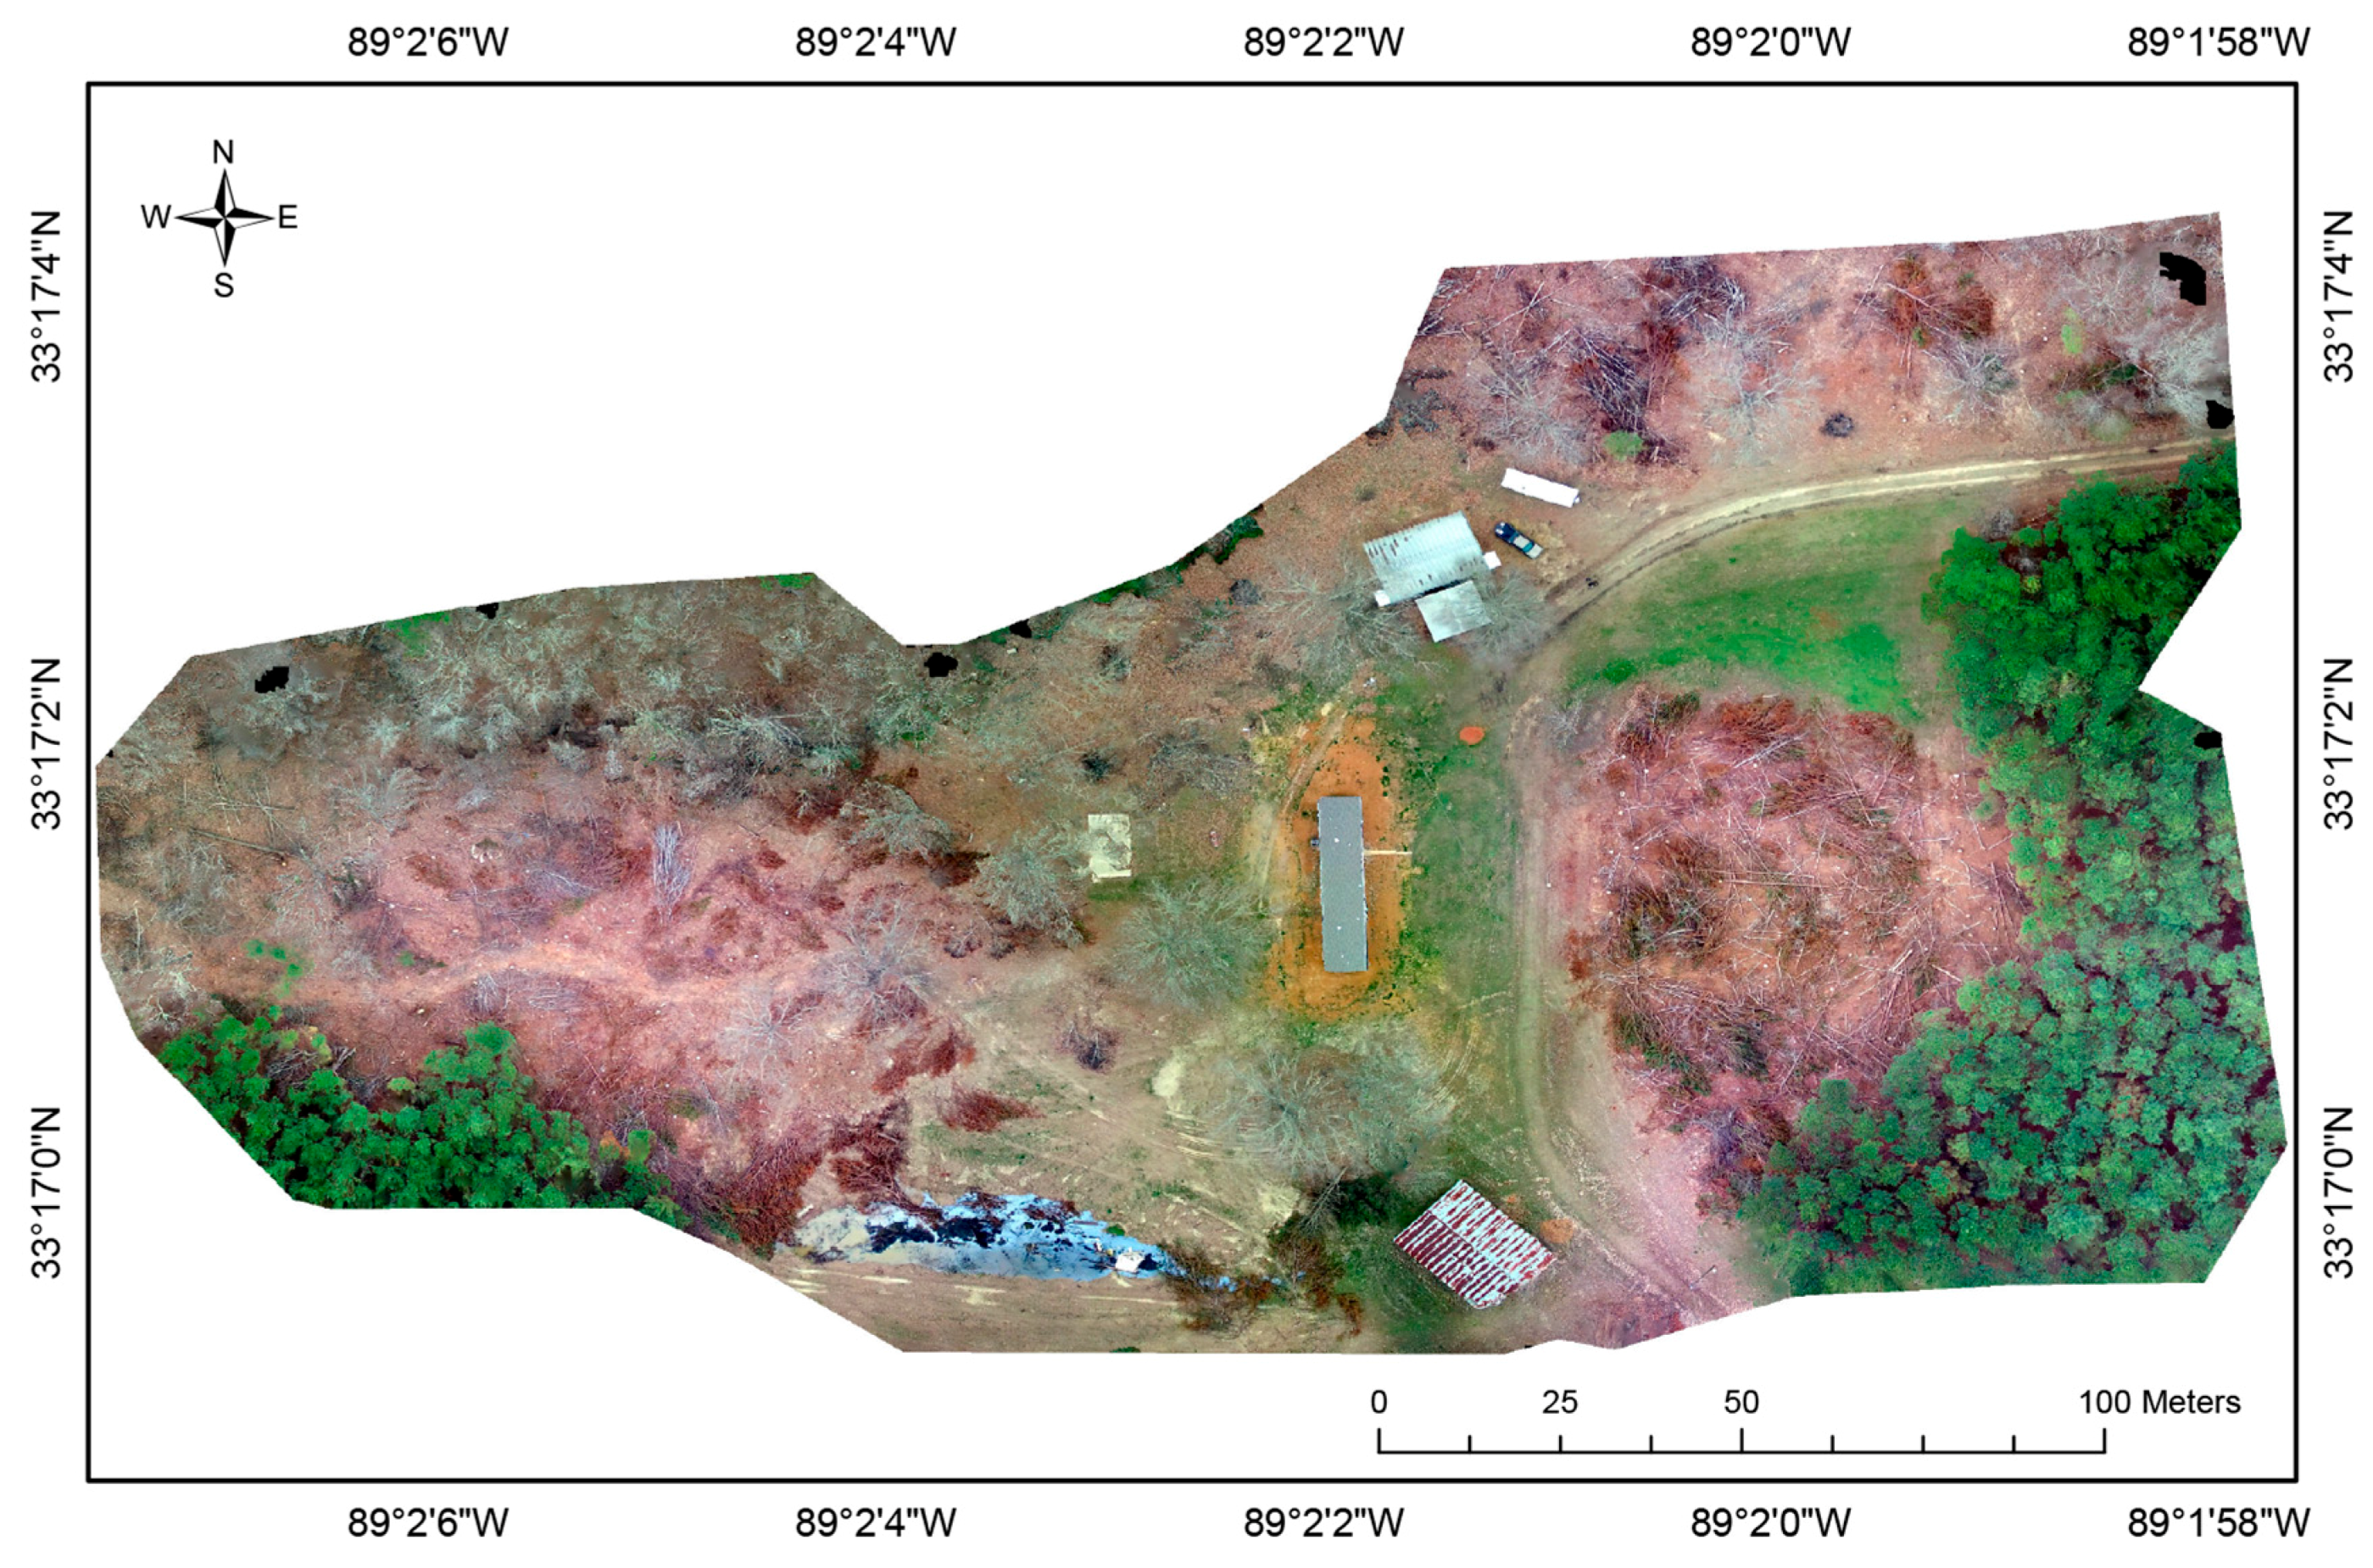
The study area is located in the northern part of Winston county, Mississippi USA. The data used in this study were collected over a site totalling approximately 11 acres of legally harvested loblolly pine (
Pinus taeda) timber. The UAS and ground data were collected on 18 January 2017 (
Figure 1).
2.2. UAS Image Acquisition
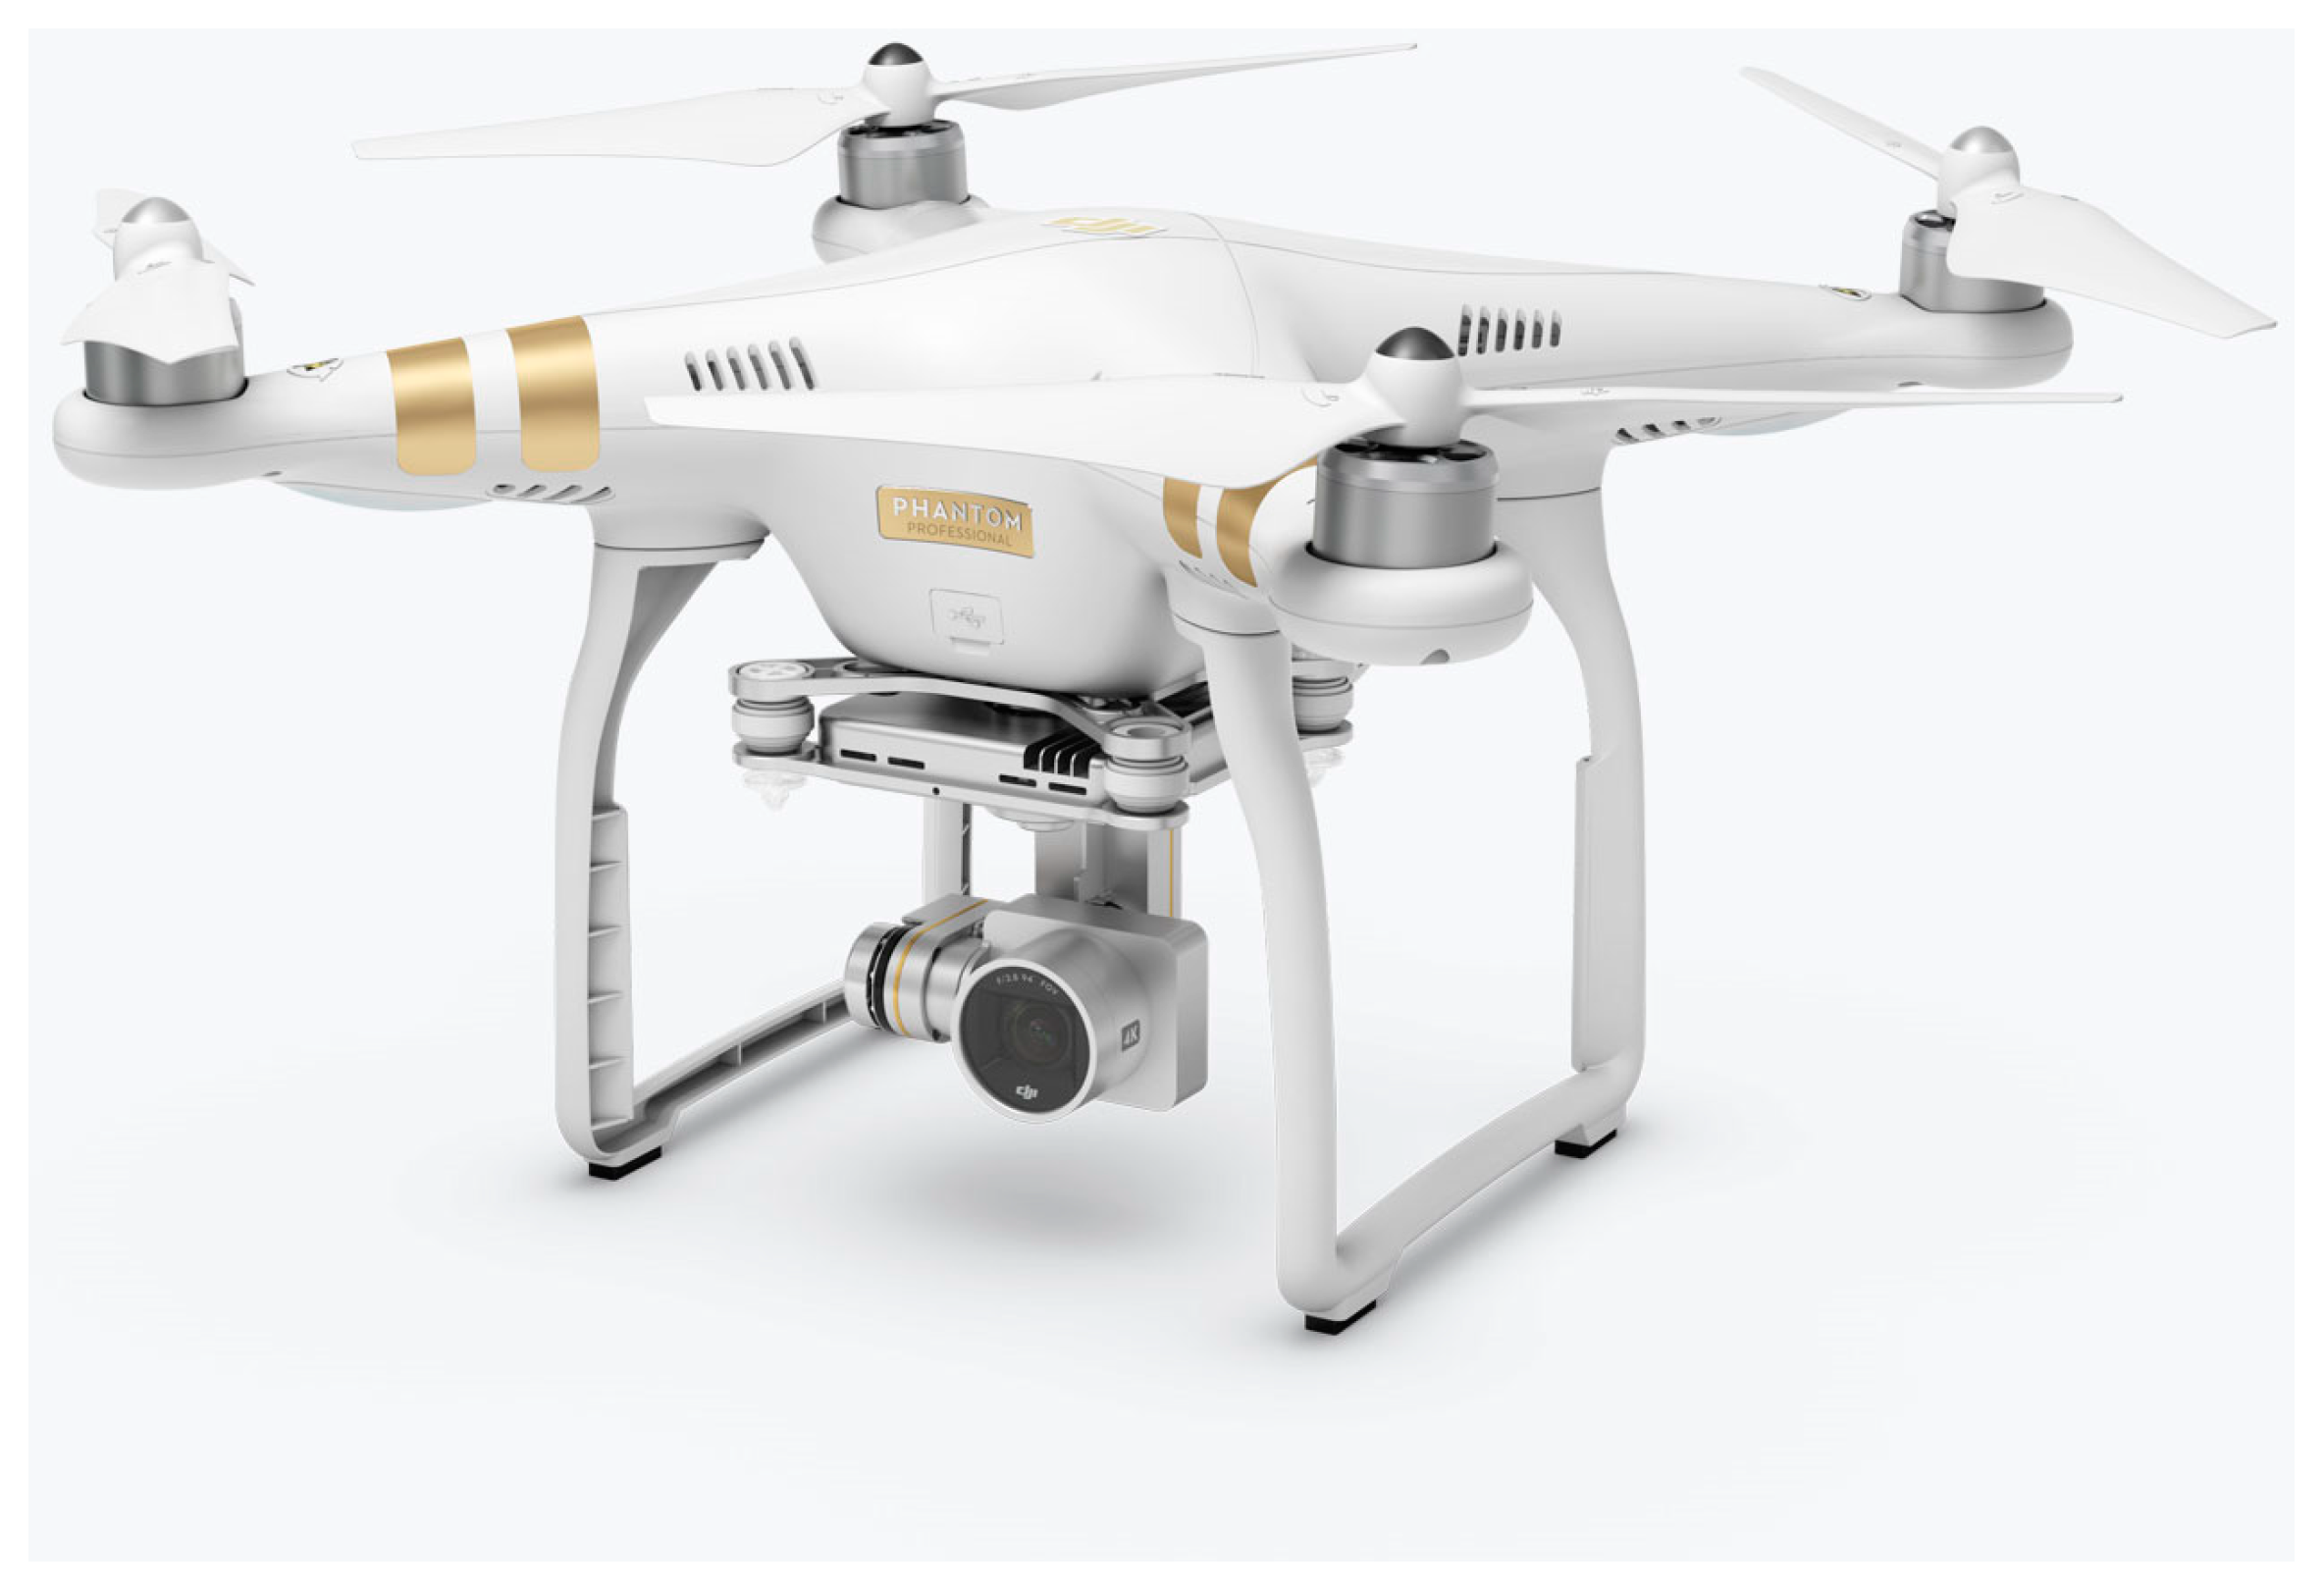
The area of interest was flown with a DJI Phantom 3 Professional (
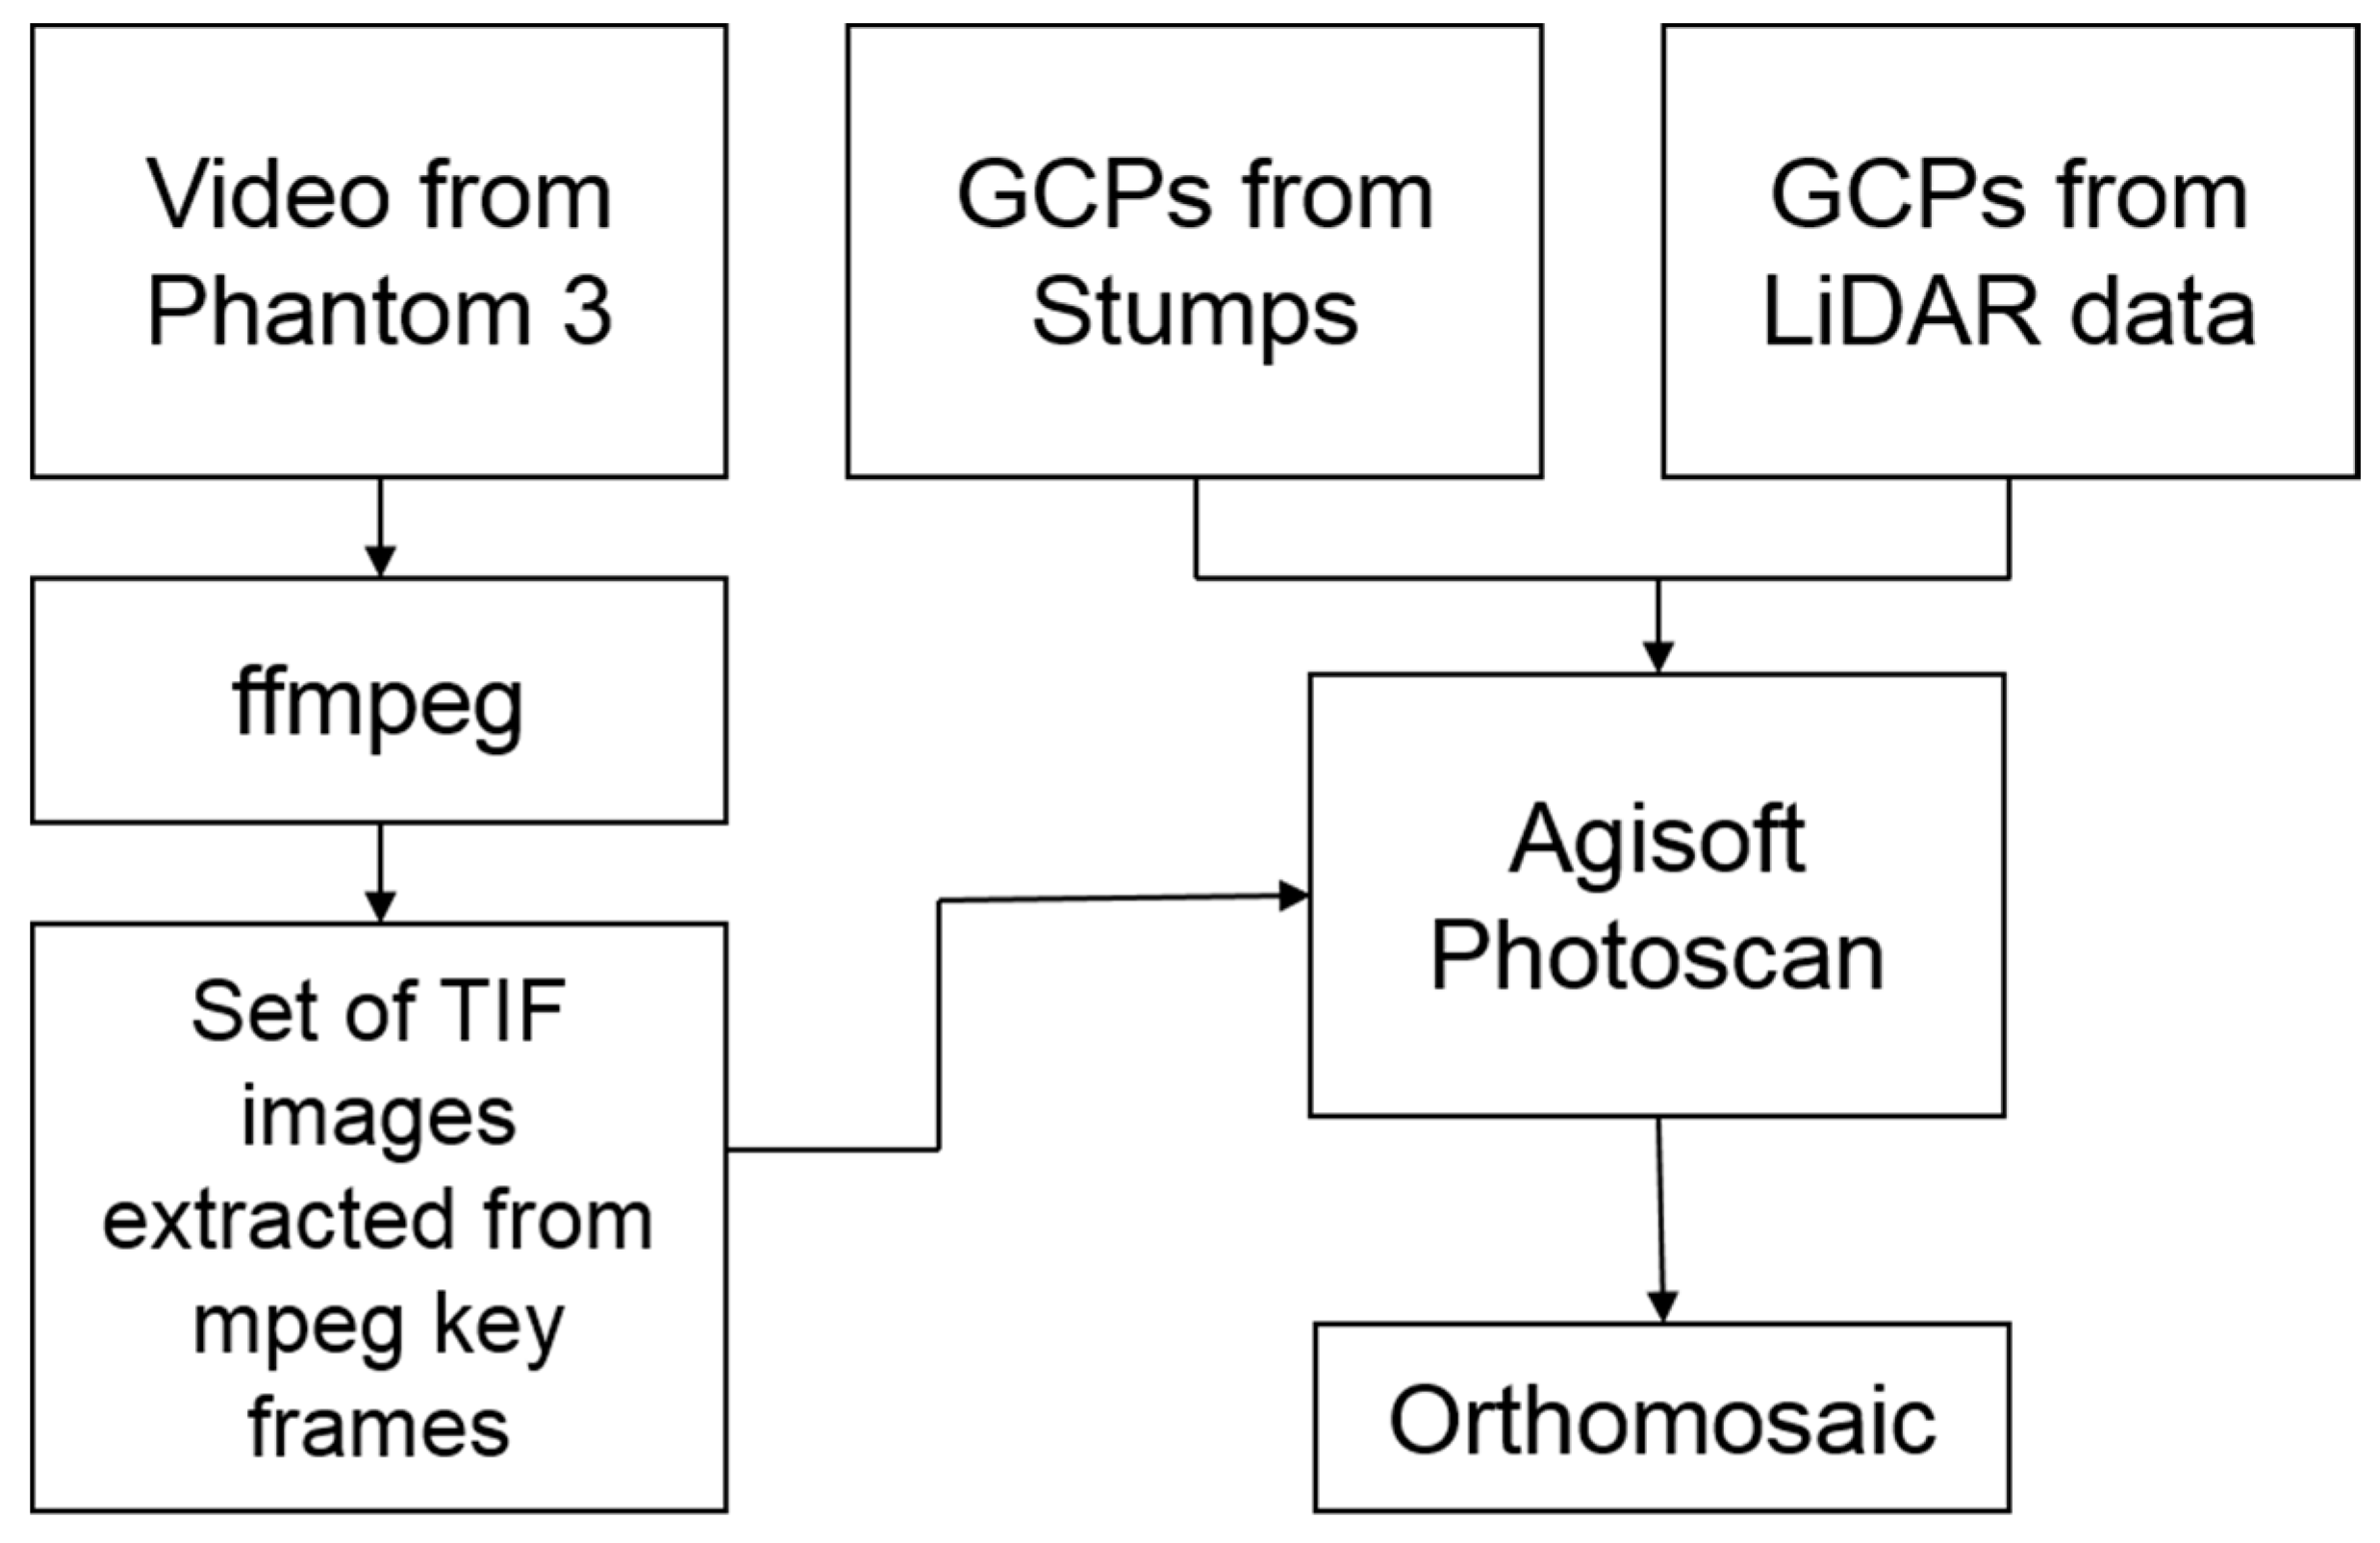
Figure 2). The UAS was flown at an altitude of 61 m above ground level and data was collected as a 4K (3840 × 2160) video file. To prepare the data for orthorectification, still frames were extracted from the 4K video (MPEG) via the ffmpeg software tools [
11]. For this study only key frames (I-frames) from the MPEG video file were extracted using the ffmpeg tool to maximize image quality. I-frames in an MPEG video are the least compressed frame; they are complete images (JPEG) that don’t require other frames to decode. The flight paths were parallel to ensure side overlap and the I-frames in MPEG ensured more than 95% of frontal overlap.
After key frames were extracted, they were loaded into Agisoft PhotoScan Pro [
12]. First, a photo alignment was performed to identify overlapping key points within each image (key frames), and uses this to determine the camera orientation at the time of image acquisition. This process produces a point cloud, which is a set of overlapping points with 3D coordinates (latitude, longitude, and altitude) for the entire dataset.
Next, from this point cloud, a digital surface model (DSM) was produced. This is a representation of the surface of the point cloud, and captures the contours of the local geography using photogrammetry. Finally, camera orientation was used to project images on to the DSM which produces a mosaic.
Using PhotoScan Pro, a mosaic in a relative coordinate system was exported. This mosaic was then post-corrected using a base map and airborne MARIS LiDAR data [
13] in ESRI ArcMap [
14]. These two sources of ground control points (GCPs) produced an accurate (sub-meter) orthomosaic. The mosaic was exported at the imagery’s estimated ground sample distance (GSD) (approximately 2.4 cm/pixel) so that it could be loaded into commercially available software and further analyzed (i.e., ESRI ArcMap and/or Trimble eCognition). The World Geodetic System 1984 (WGS84) reference coordinate system was used to produce the orthomosaic. The flowchart describing the data processing is shown in
Figure 3.
2.3. Tree Stump Detection
Detecting circles in an image is one of the well-studied problems in computer vision and pattern recognition [
15]. Because pine stumps are approximately circular in shape, algorithms developed to detect circular patterns were applied to the mosaic to detect any circular objects. In this work we use three of the most common techniques to detect circular patterns (tree stumps) and compare their ability to accurately identify stumps and calculate stump diameter. The three methods used were Template Matching (TM), Hough Circle Transform (HCT), and Phase Coding (PC).
2.3.1. Template Matching
The TM algorithm uses a small imagery subset of the target object (i.e., tree stumps) to be identified as a template for identifying the object in the larger image mosaic. The algorithm finds the matches of the template in the larger image based on the underlying similarity of the objects. In this implementation, we used normalized correlation (Equation (1)) as a metric for identifying the matched regions in the image,
where
c is the normalized correlation,
i(
x,
y) is the larger image mosaic under study,
t is the template,
is the template mean,
is the image mean, and
x,
y are coordinates within the image. For this study, we used the template matching algorithm implemented in Trimble eCognition object based image analysis software.
2.3.2. Hough Circle Transform
The HCT is an effective tool to determine the parameters of a circle when the number of pixels that fall on the perimeter are known. The parametric equations (Equations (2) and (3)) for a circle with radius
r and circle center (
p,
q) is given as,
where
x and
y are coordinates of the circle perimeter,
p and
q are coordinates of the circle center, and r is the circle radius. The circle detection algorithm seeks to find parameter space coordinates (
p,
q,
r) for each circle in the image. Each circle in the image can be described by the circle equation (Equation (4)),
An arbitrary circle edge point (
xi,
yi) will be transformed into a circular cone in the parameter space, thus transforming 2-dimensional coordinates of a circle into a 3-dimensional cone in parameter space. If all the image points fall on a circle perimeter (in 2-D space) then the cones will intersect (3-D space) at point (
p,
q,
r) corresponding to the parameters of the circle being detected in the image. Thus, the HCT algorithm will find all circles in the imagery. The stumps were identified using the MATLAB function
imfindcircles [
16]. Each identified image object is characterized by a circle center (
p,
q) and radii (
r). Circle centers are computed by HCT and the radii are computed using the (
p,
q) along with image information. This method is based on computing radial histograms [
15,
16].
2.3.3. Phase Coding
Modifications to HCT described in
Section 2.3.2 have been widely implemented [
17,
18] to increase the circle detection rate and to reduce the computation time. In this study, we used the modified HCT approach [
5], commonly referred as PC, to detect circles since this method employs a size invariant approach.
2.3.4. Estimating the Area of Stumps Using Fast Marching Image Segmentation
The area of the stumps is traditionally measured by using the diameter measurements from the ground. The person who logs it measures either the tree stump’s longest diameter or shorter diameter and finds the area of corresponding circle. The UAS-collected imagery provides us with a more accurate estimate of area through pixel measurements. This avoids the discrepancies introduced from inconsistency in field measurements. In this research, we show that using an image segmentation approach such as fast marching method (FMM) [
19] could be more meaningful in estimating the area from the UAS-collected imagery. In our implementation, we used the FMM provided in the Matlab Image processing toolbox. This approach alleviates the errors caused by non-circular tree stumps.
2.4. Accuracy Assessment
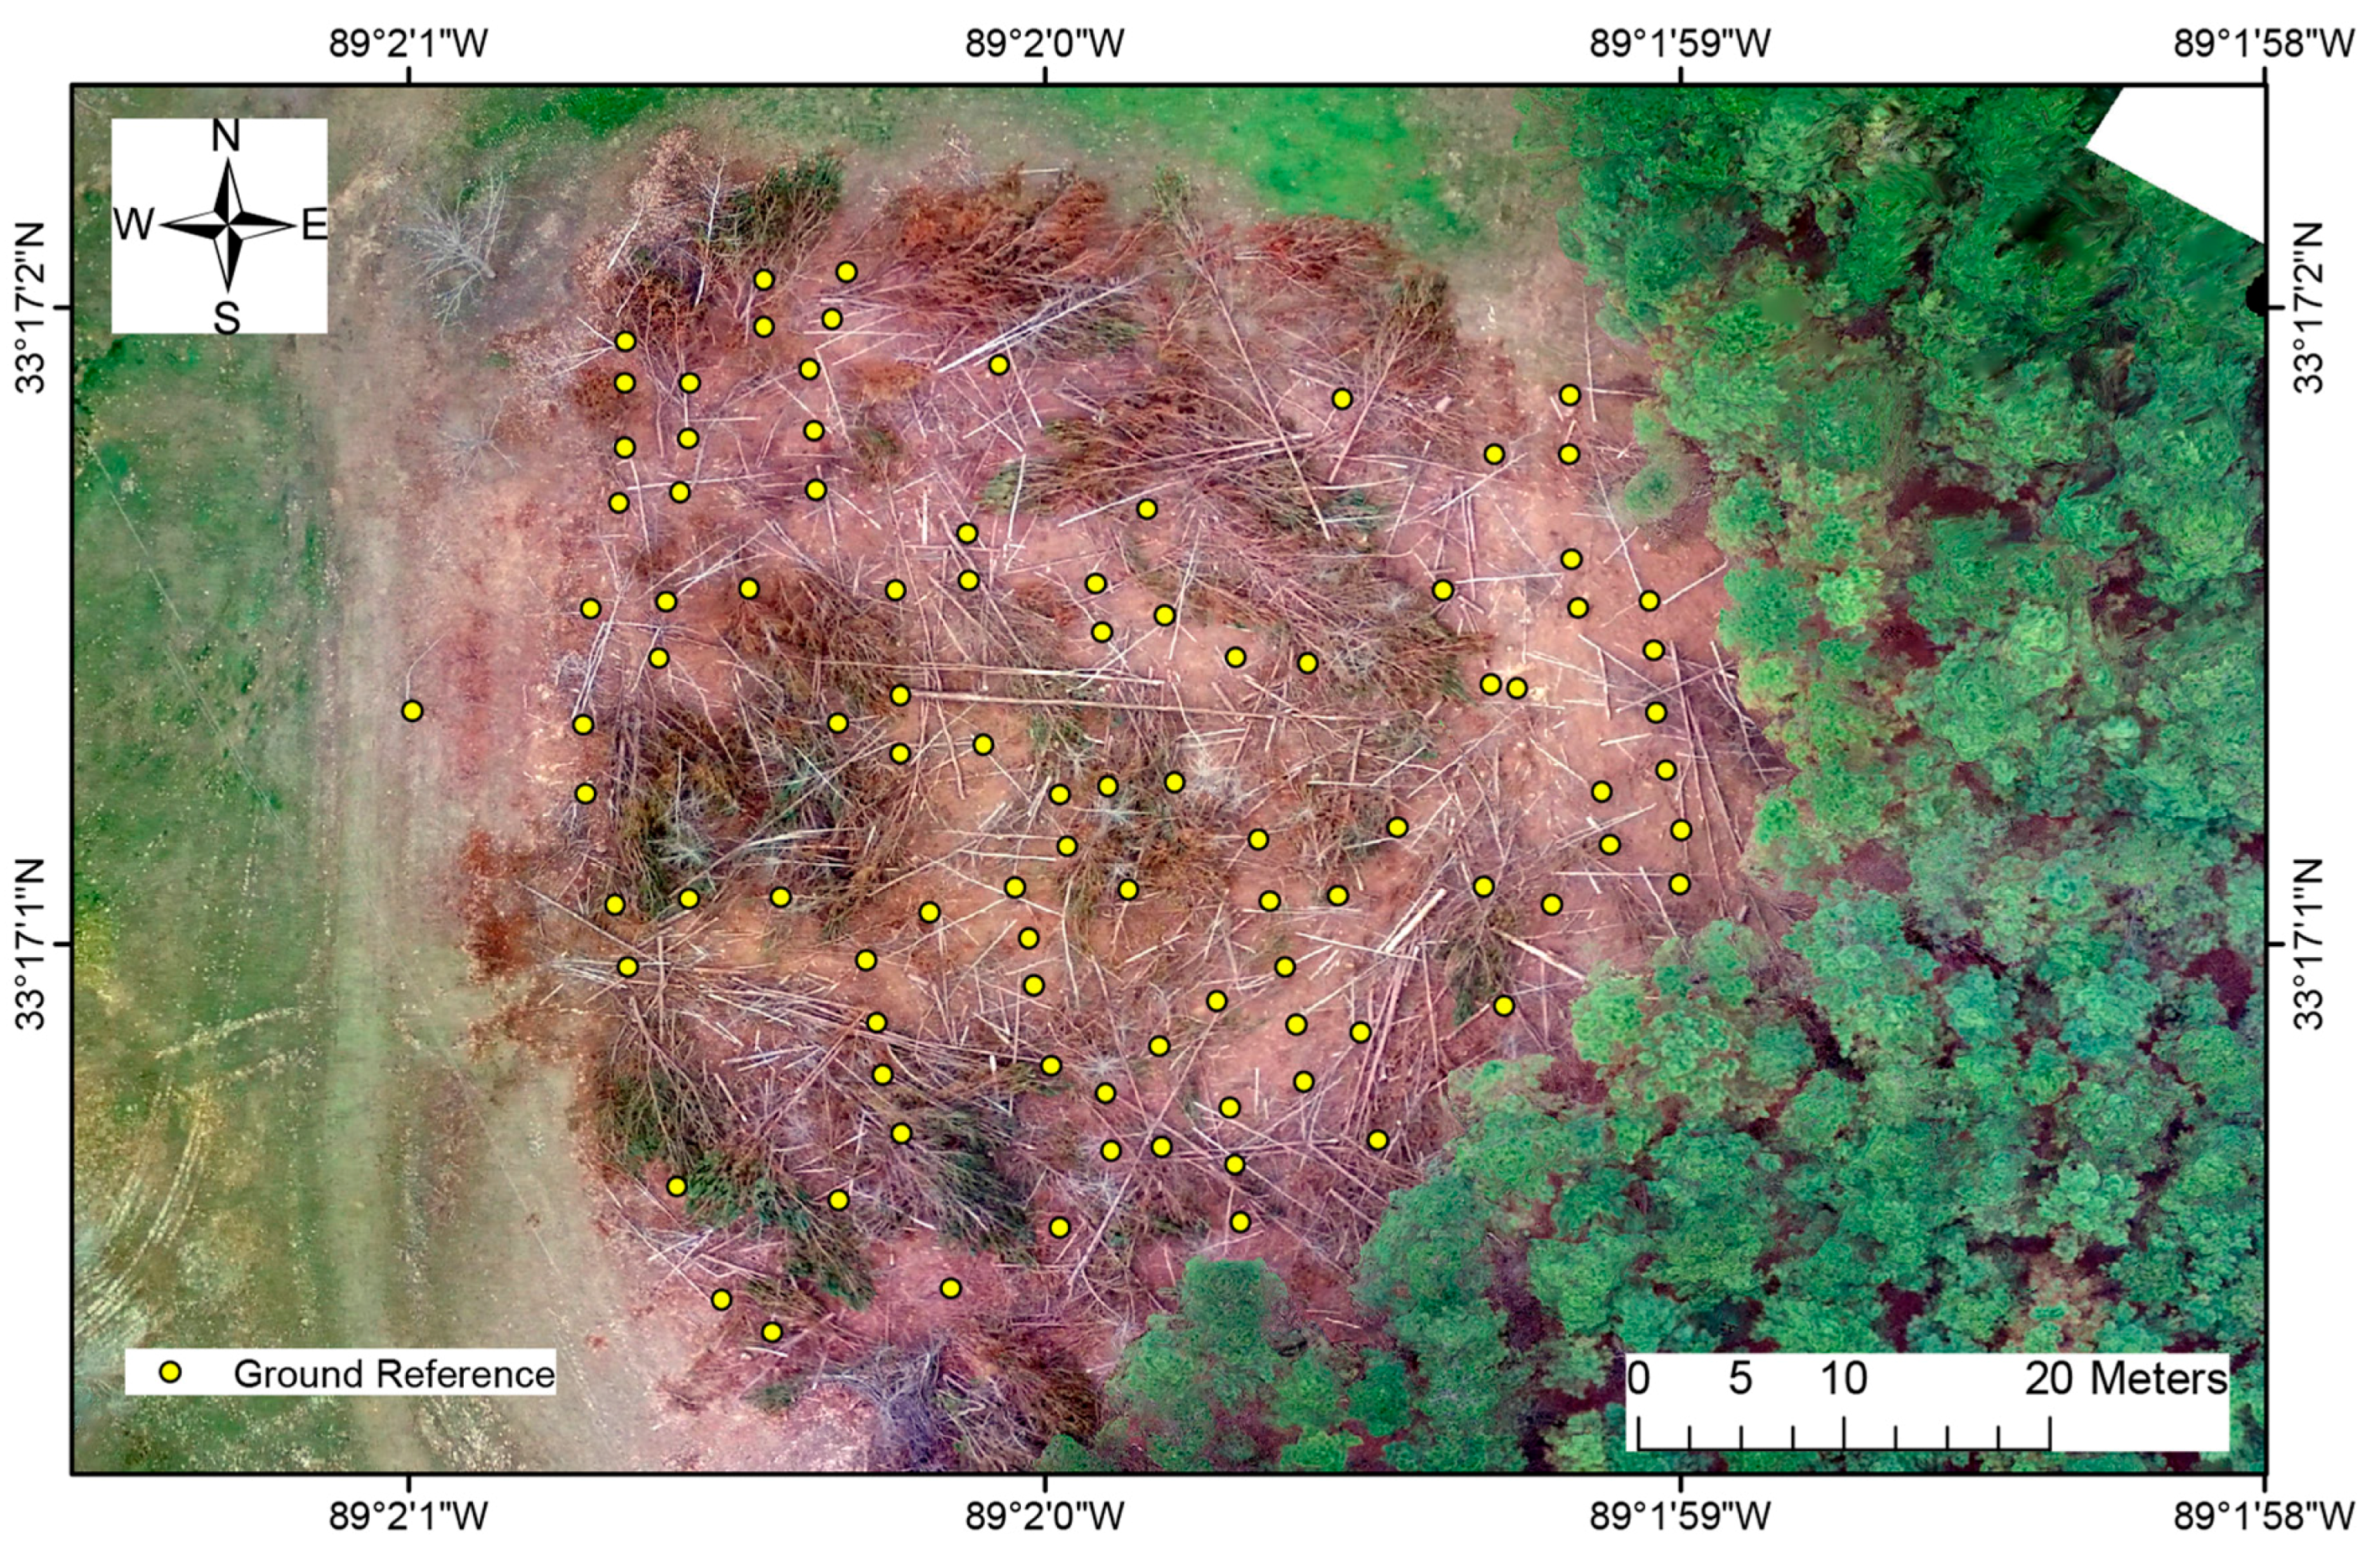
Prior to applying the computer algorithms, three regions in the imagery with clear cut stumps were selected to be used as ground reference (GR) patches (
Figure 4). These regions were accessed by a crew member with a handheld GPS (Trimble Geo 7X—sub-decimeter accuracy) unit to record the GPS location of tree stumps. The crew member also measured stump diameters along a north-south axis through each stump for all geotagged stumps. After the fieldwork, the imagery collected by the UAS was loaded into ESRI’s ArcMap program along with the GR data to further post-correct the mosaic to align the GR points to the tree stumps. This alignment was needed since the accuracy of the mosaic registered to the base map and MARIS LiDAR was not as accurate as the handheld GPS unit.
3. Results
The results of three computer vision algorithms (HCT, TM, and PC) were compared with respect to the following accuracies: (1) Overall Accuracy (OA); (2) Commission error (CE); (3) Omission error (OE); (4) Root mean squared error (RMSE); and (5) Coefficient of the variance normalized Root Mean Squared Error (cvNRMSE). OA is the percentage of the reference sample that is correctly predicted. In a confusion matrix, it is the sum of the diagonal elements divided by the total sum of the matrix. CE represents the percentage of non-tree stump (NS) objects that were mis-identified as tree stumps (S). OE represents the percentage of tree stumps (S) mis-identified as non-tree stump (NS) objects. The RMSE is a measure of the difference between values predicted by a computer vision algorithm and the values actually observed from the field by a human observer while cvNRMSE is a non-dimensional quantity that is estimated to compare RMSE with different units. We believe that comparing the results of the algorithms under study by using these parameters provides a good understanding of the efficacy of the methods.
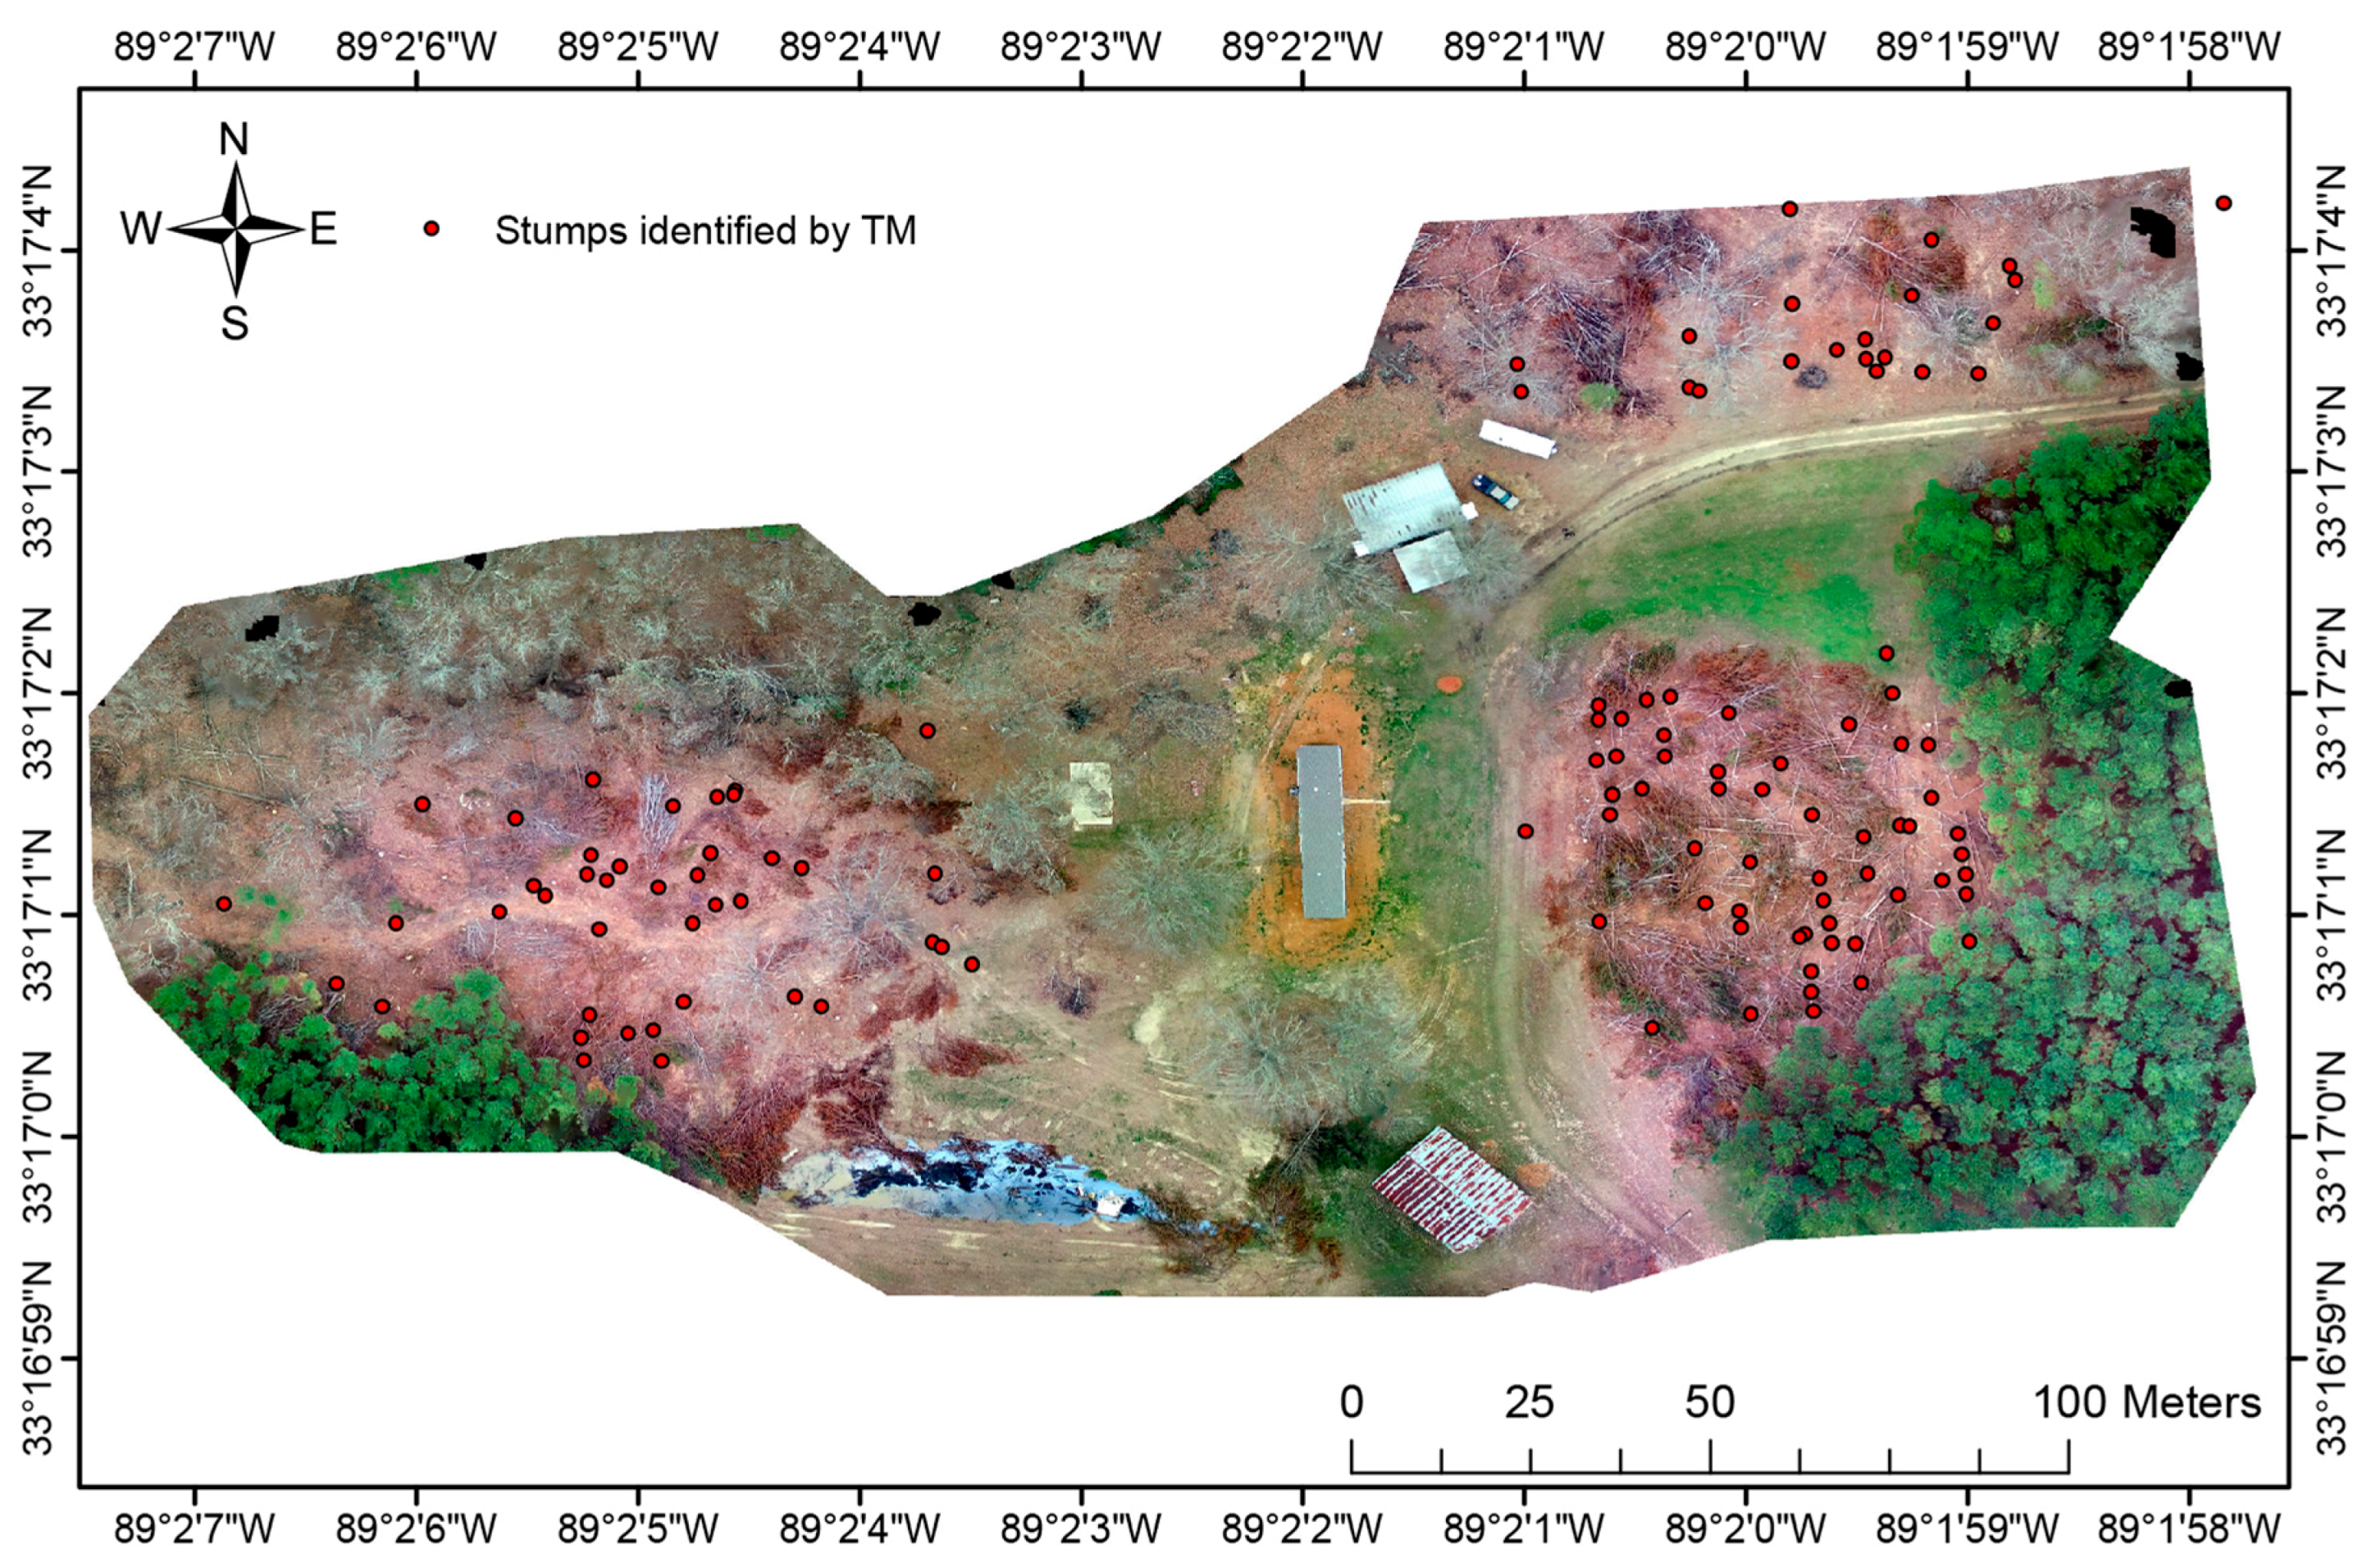
The performances evaluated over the GR show that: (1) TM fails to identify many of the tree stumps that are easily identified by HCT and PC, as the CE is unacceptably higher (~80%). Moreover, the diameter of the tree stumps could not be directly computed using the TM correlations (
Figure 5,
Table 1 and
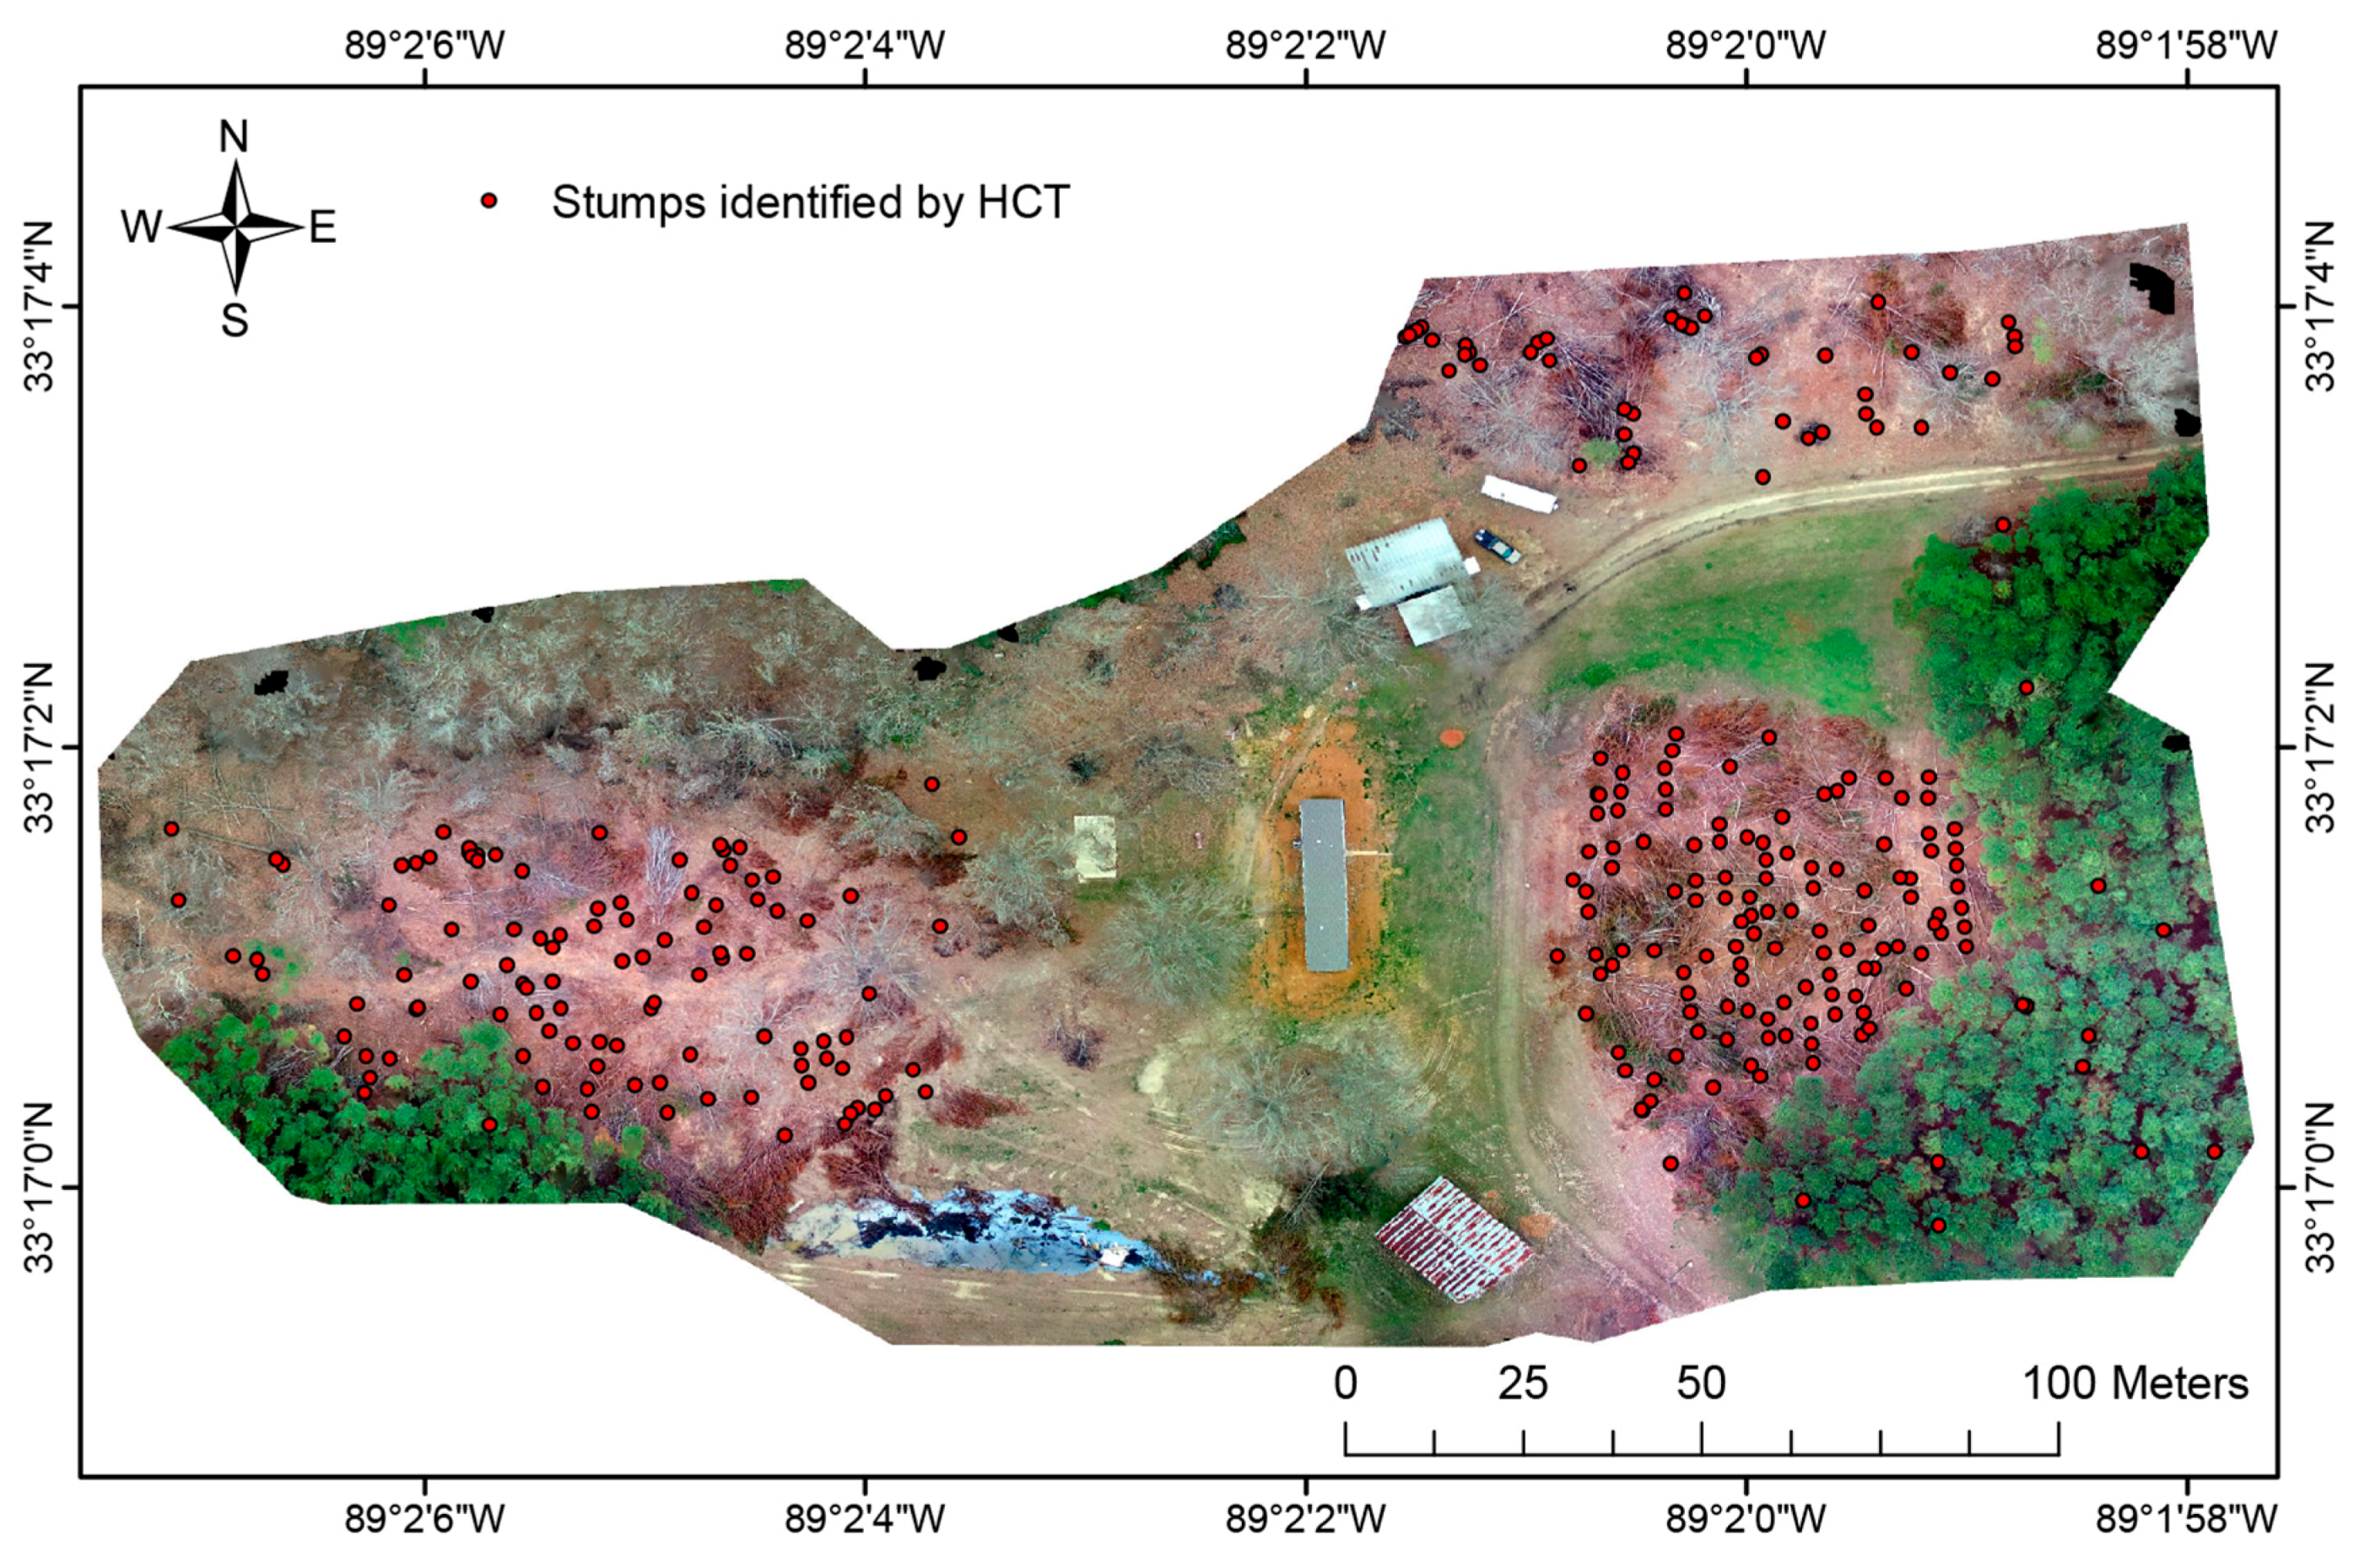
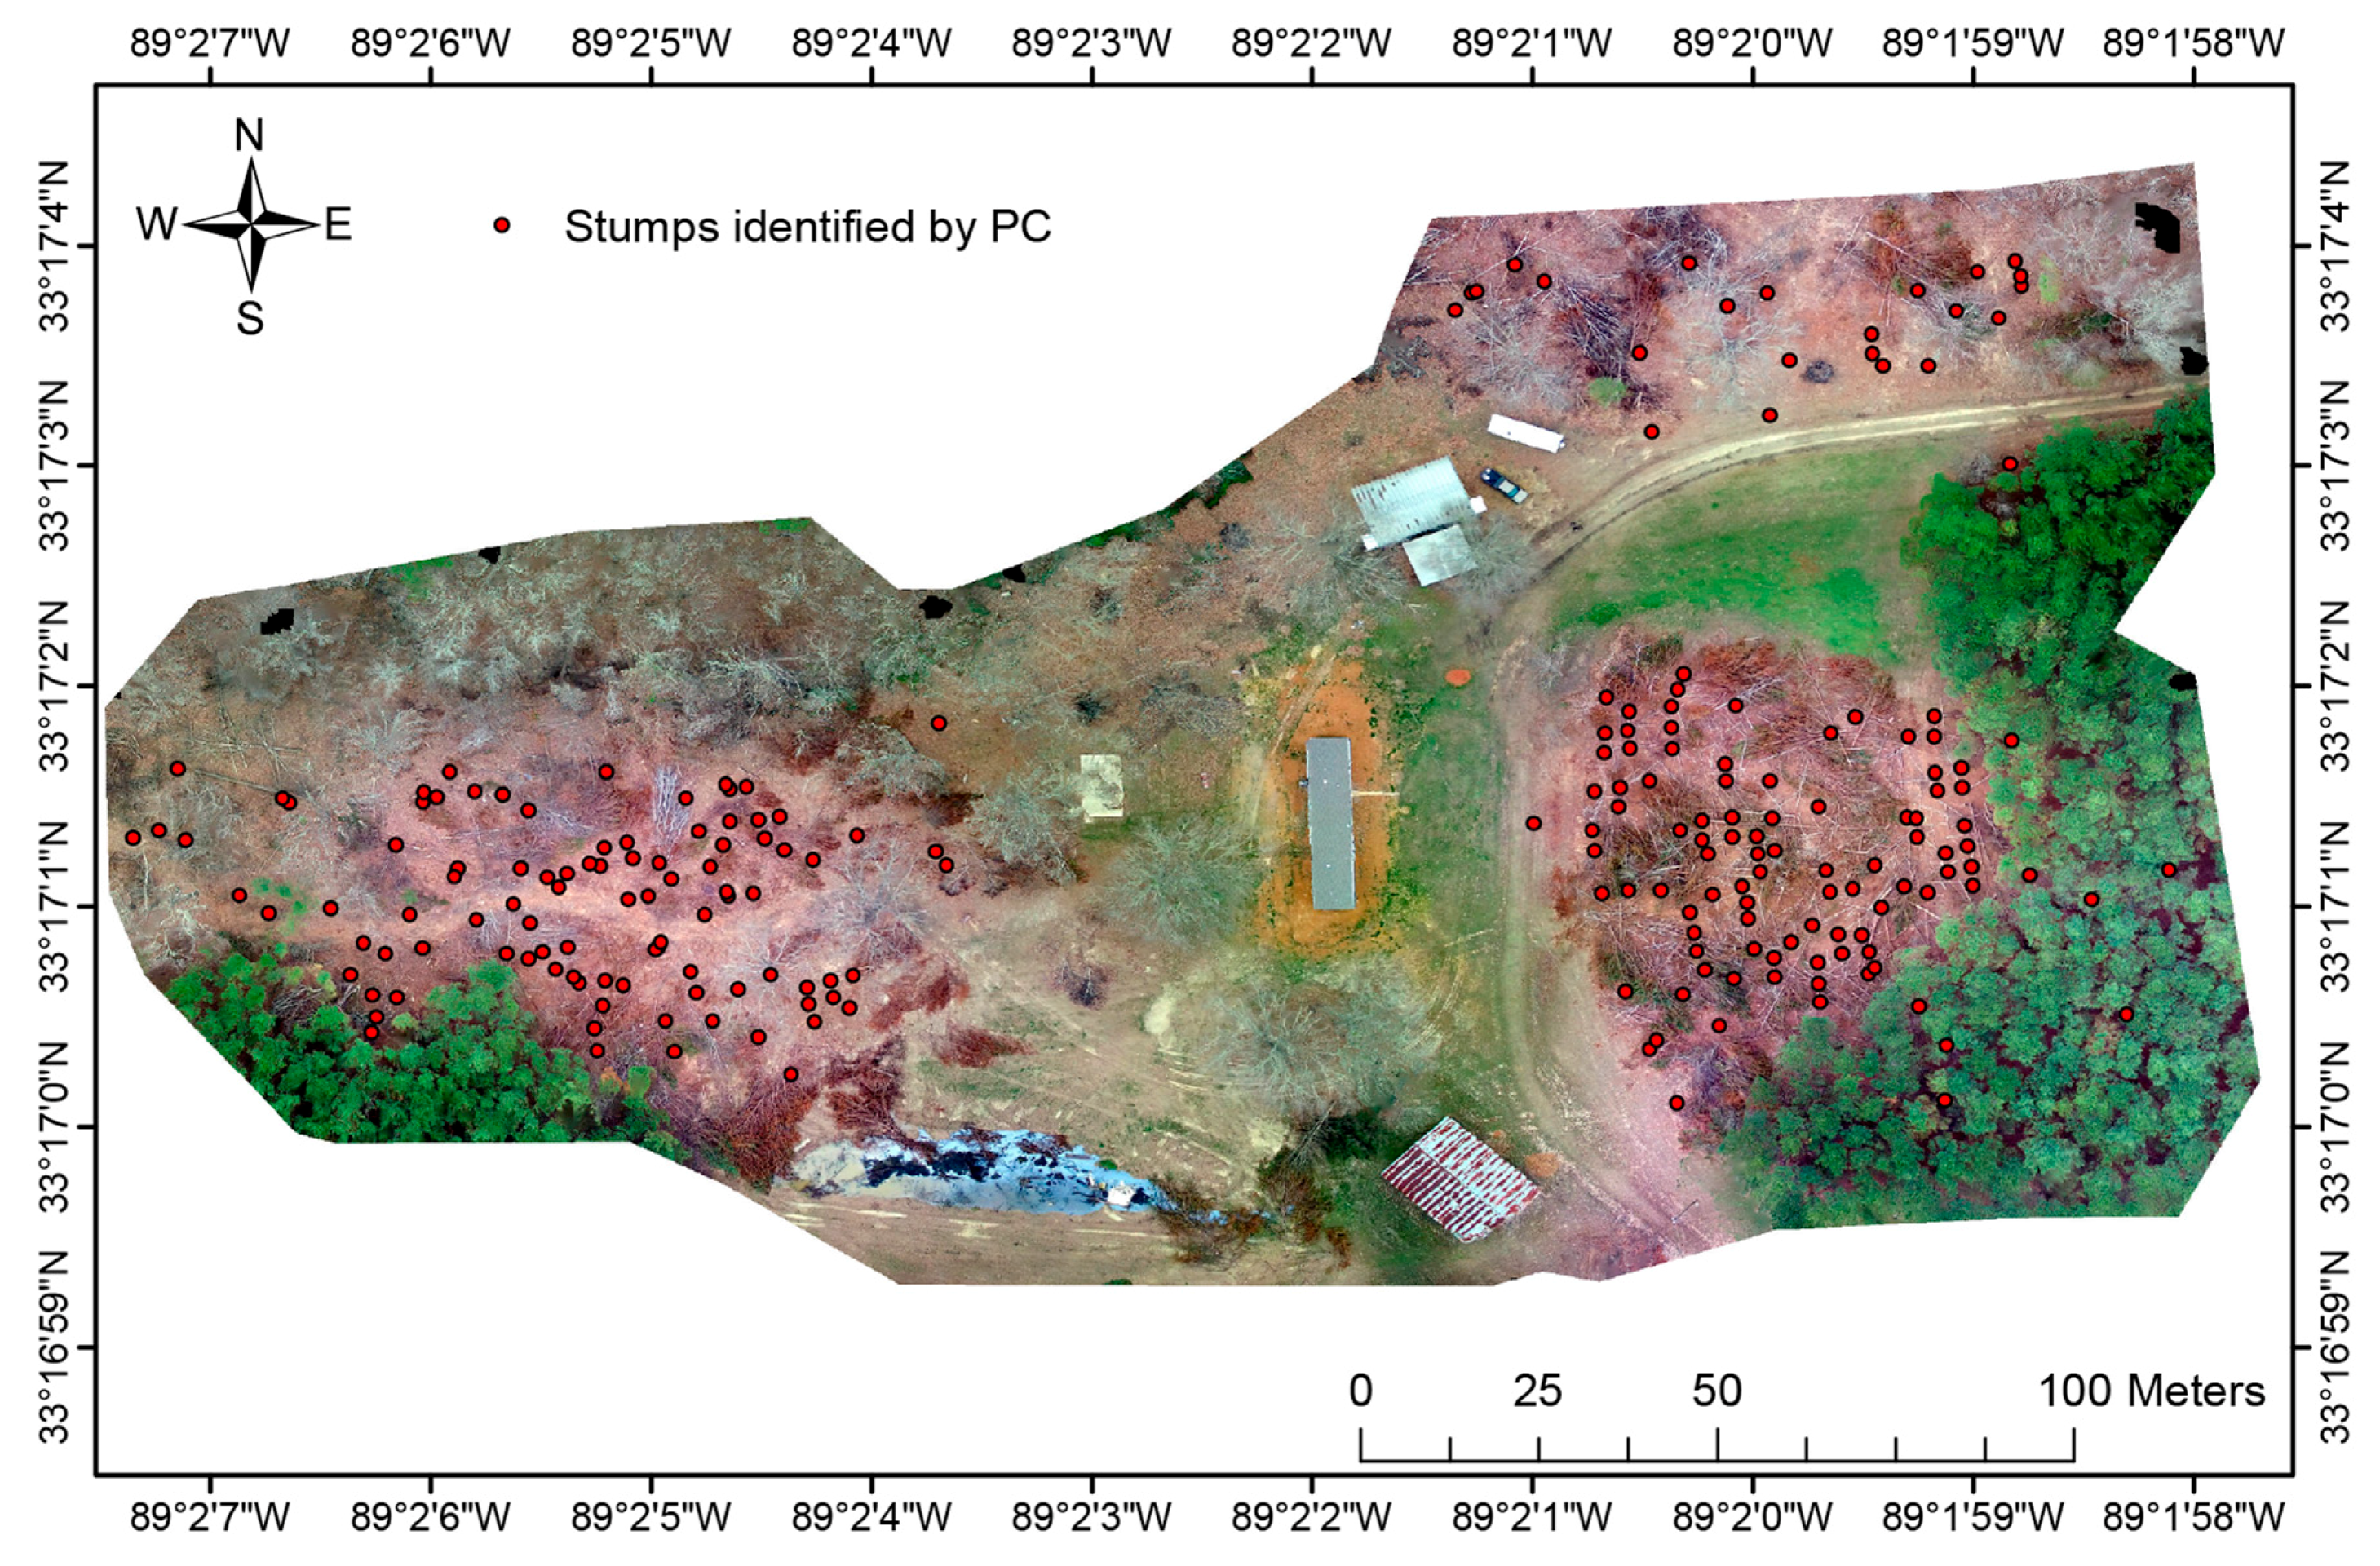
Table 2); (2)The HCT performed better than PC and TM when identifying the tree stumps (
Figure 6,
Table 1 and
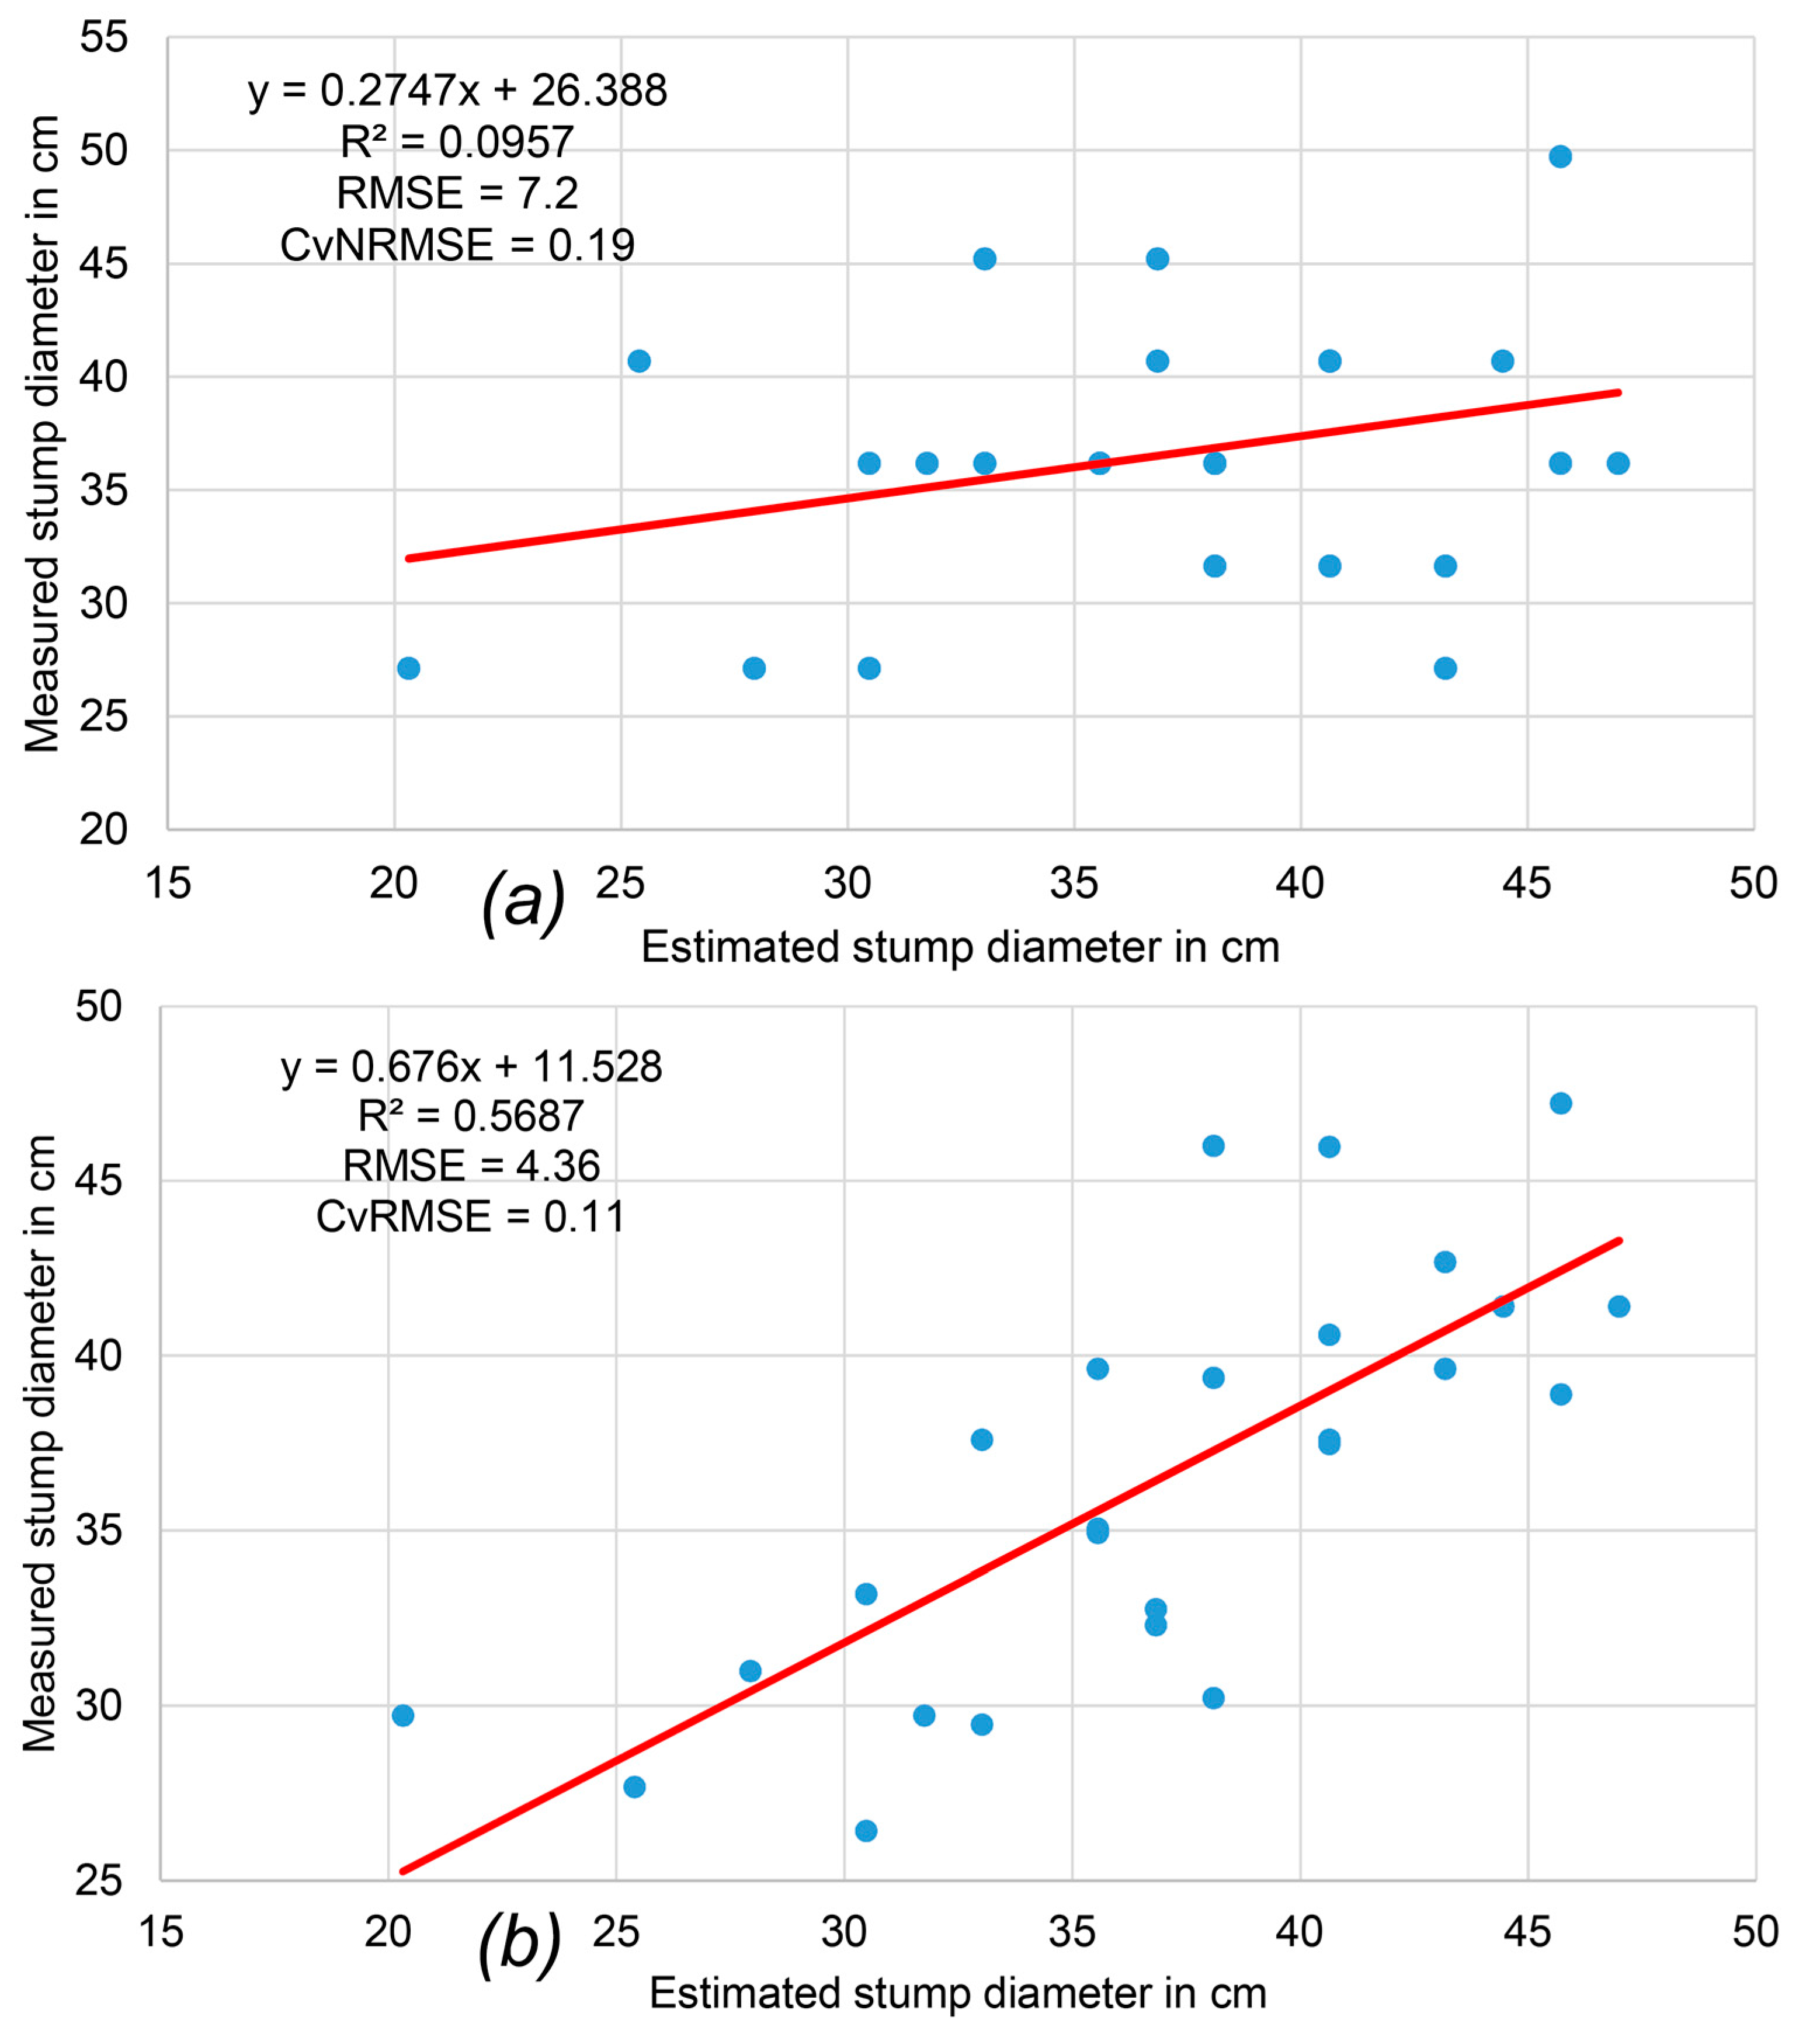
Table 2) with OA of 77.3% and acceptable 12% to 16% of OE and CE, respectively, compared to PC which had a slightly higher CE of 22.2%; and (3) The RMSE of PC and HCT methods in computing the diameter of the stumps reveal that the PC has a smaller error when compared to HCT (
Figure 7,
Table 1 and
Table 2). The results suggest that the HCT is more accurate in identifying tree stumps and PC is more accurate in estimating the stump diameters.
The trees laying on the ground in the orthomosaic are logging slash left behind after a logging event. Logging slash are small trees that are not of marketable size, or branches and tops of larger trees. We chose this site as a representative example of a typical logging site. In some cases, the stumps in the site are occluded by the logging slash; Hough transform is still able to process portions of a stump as if the entire stump were visible.
4. Discussion
These experiments show that there is very good agreement between automated measurements performed using UAS imagery and the ground reference values collected in the field. TM could only be used to identify the location of tree stumps but could not be used to calculate the diameter and thus basal area of tree stumps. However, HCT and PC could detect and compute diameters of stumps with RMSE ≈ 7.2 and 4.3 cm (
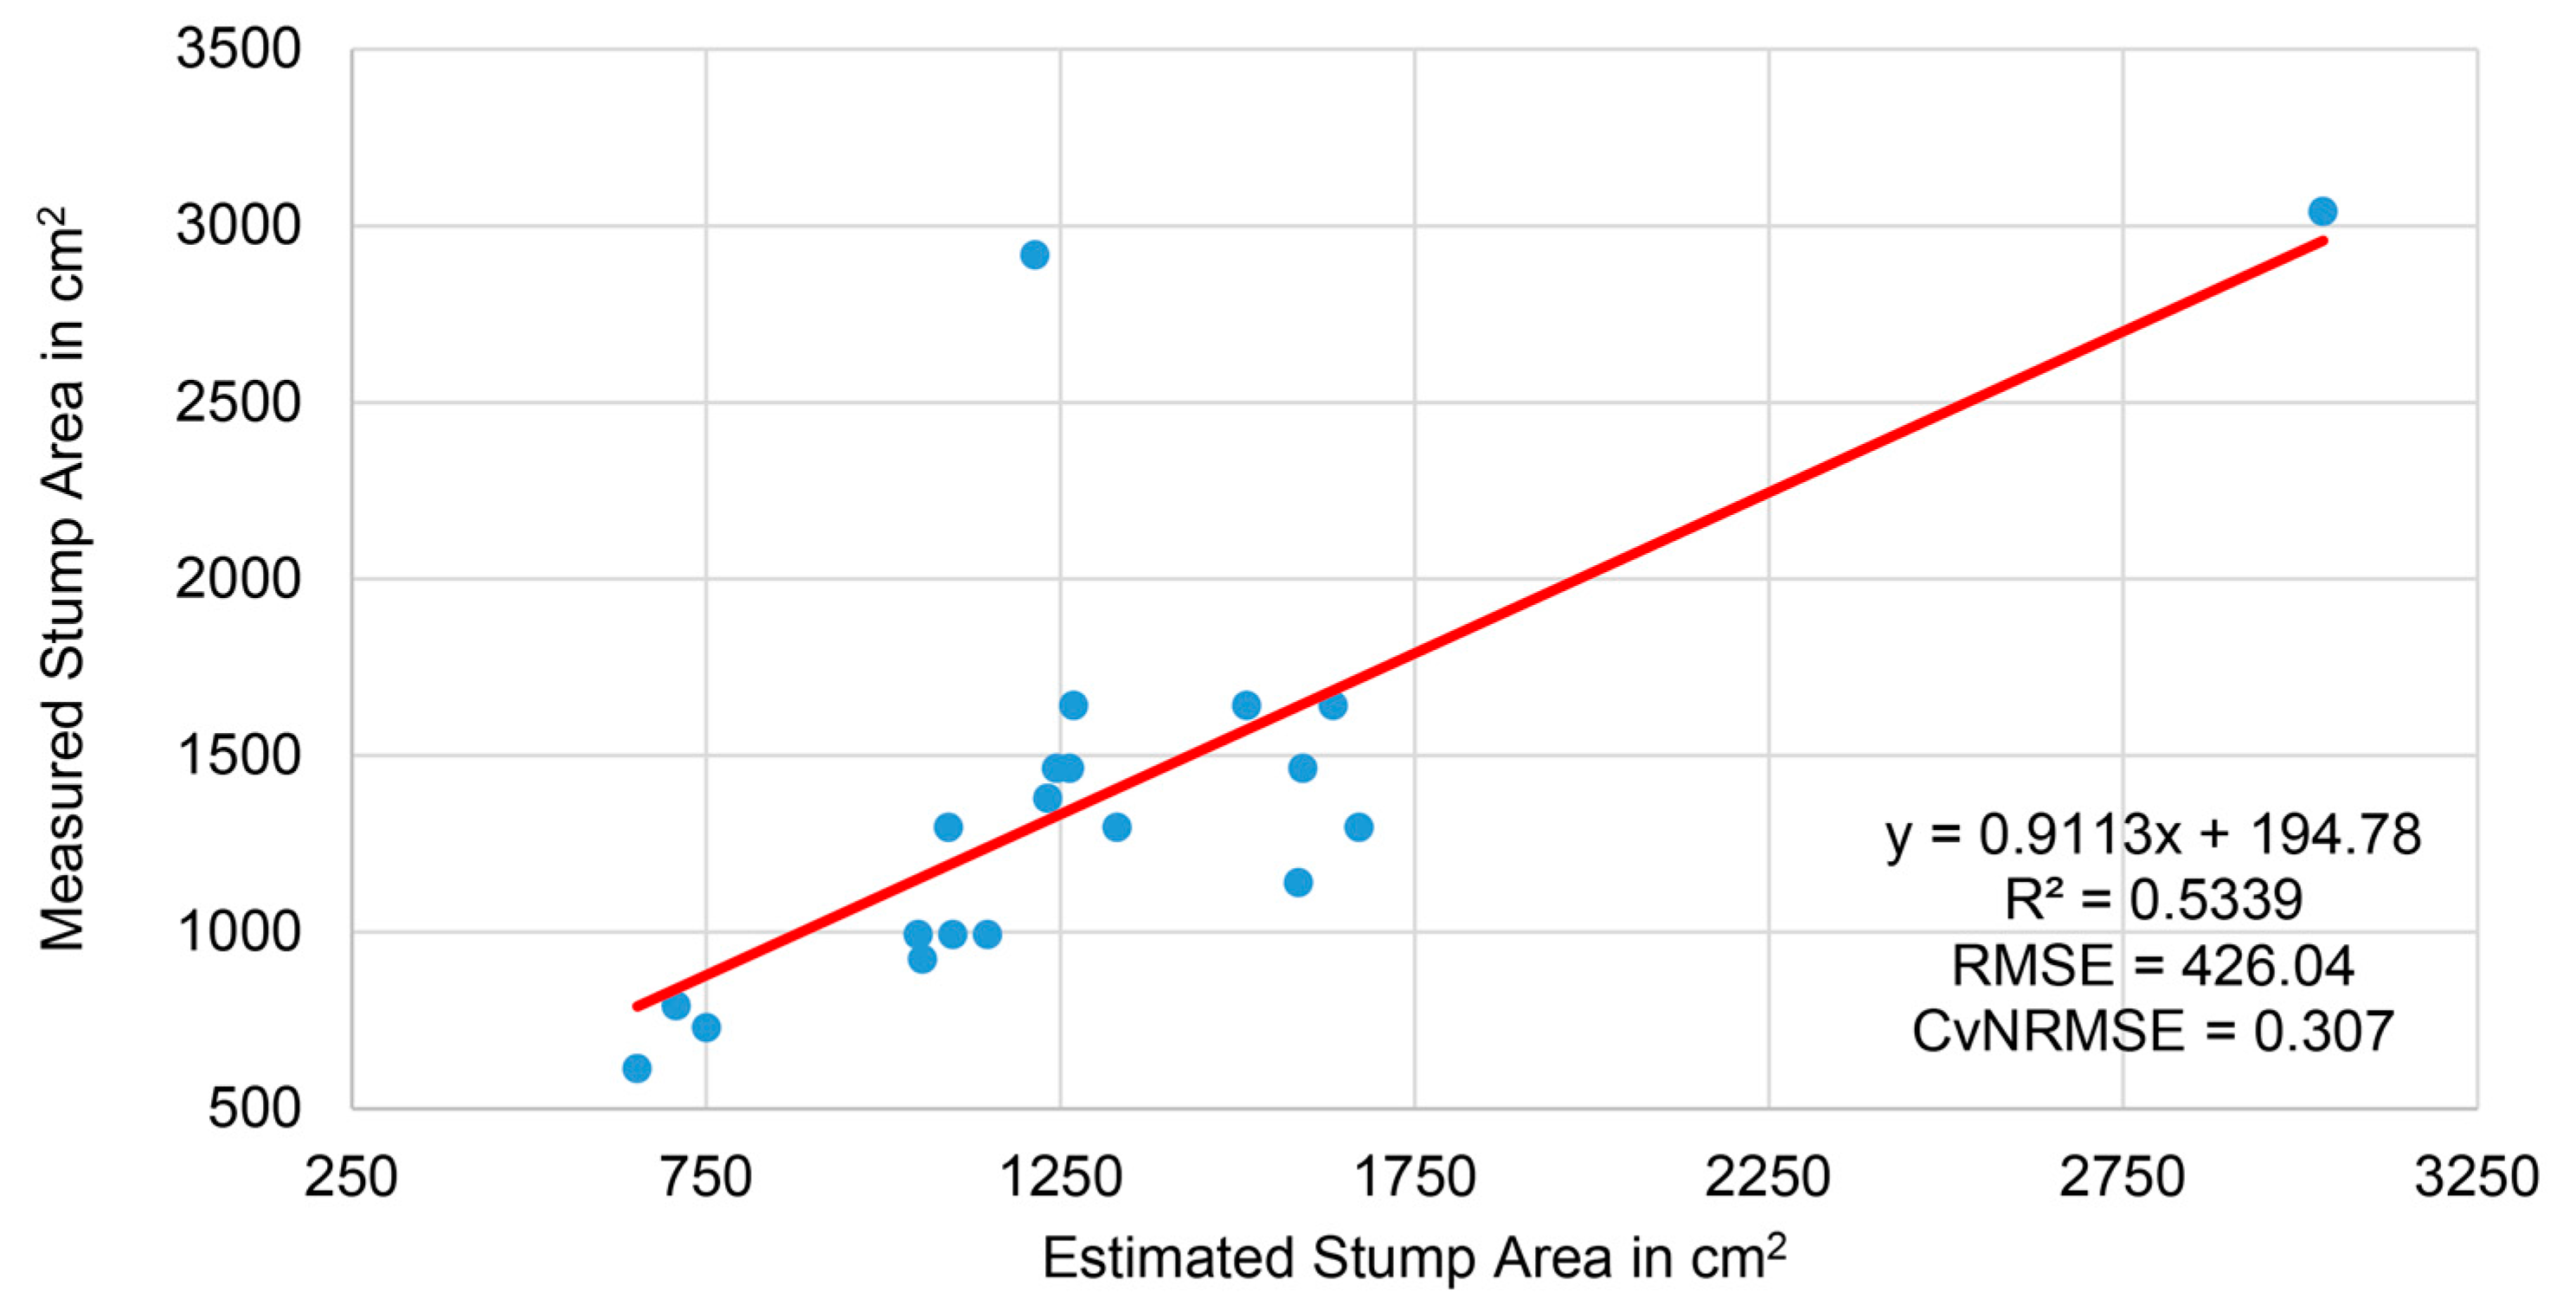
Figure 8), respectively. These errors could have been introduced in multiple ways; most notably the irregular shape of tree stumps, spatial resolution of collected imagery, and the accuracy of on-board UAS GPS units. Fast marching segmentation algorithm alleviates this issue by considering the irregularity of tree stumps. This results in better correlation between the estimated stump areas using the UAS obtained imagery and the fast marching segmentation algorithm with the corresponding ground reference values measured by direct field measurement (
Figure 9).
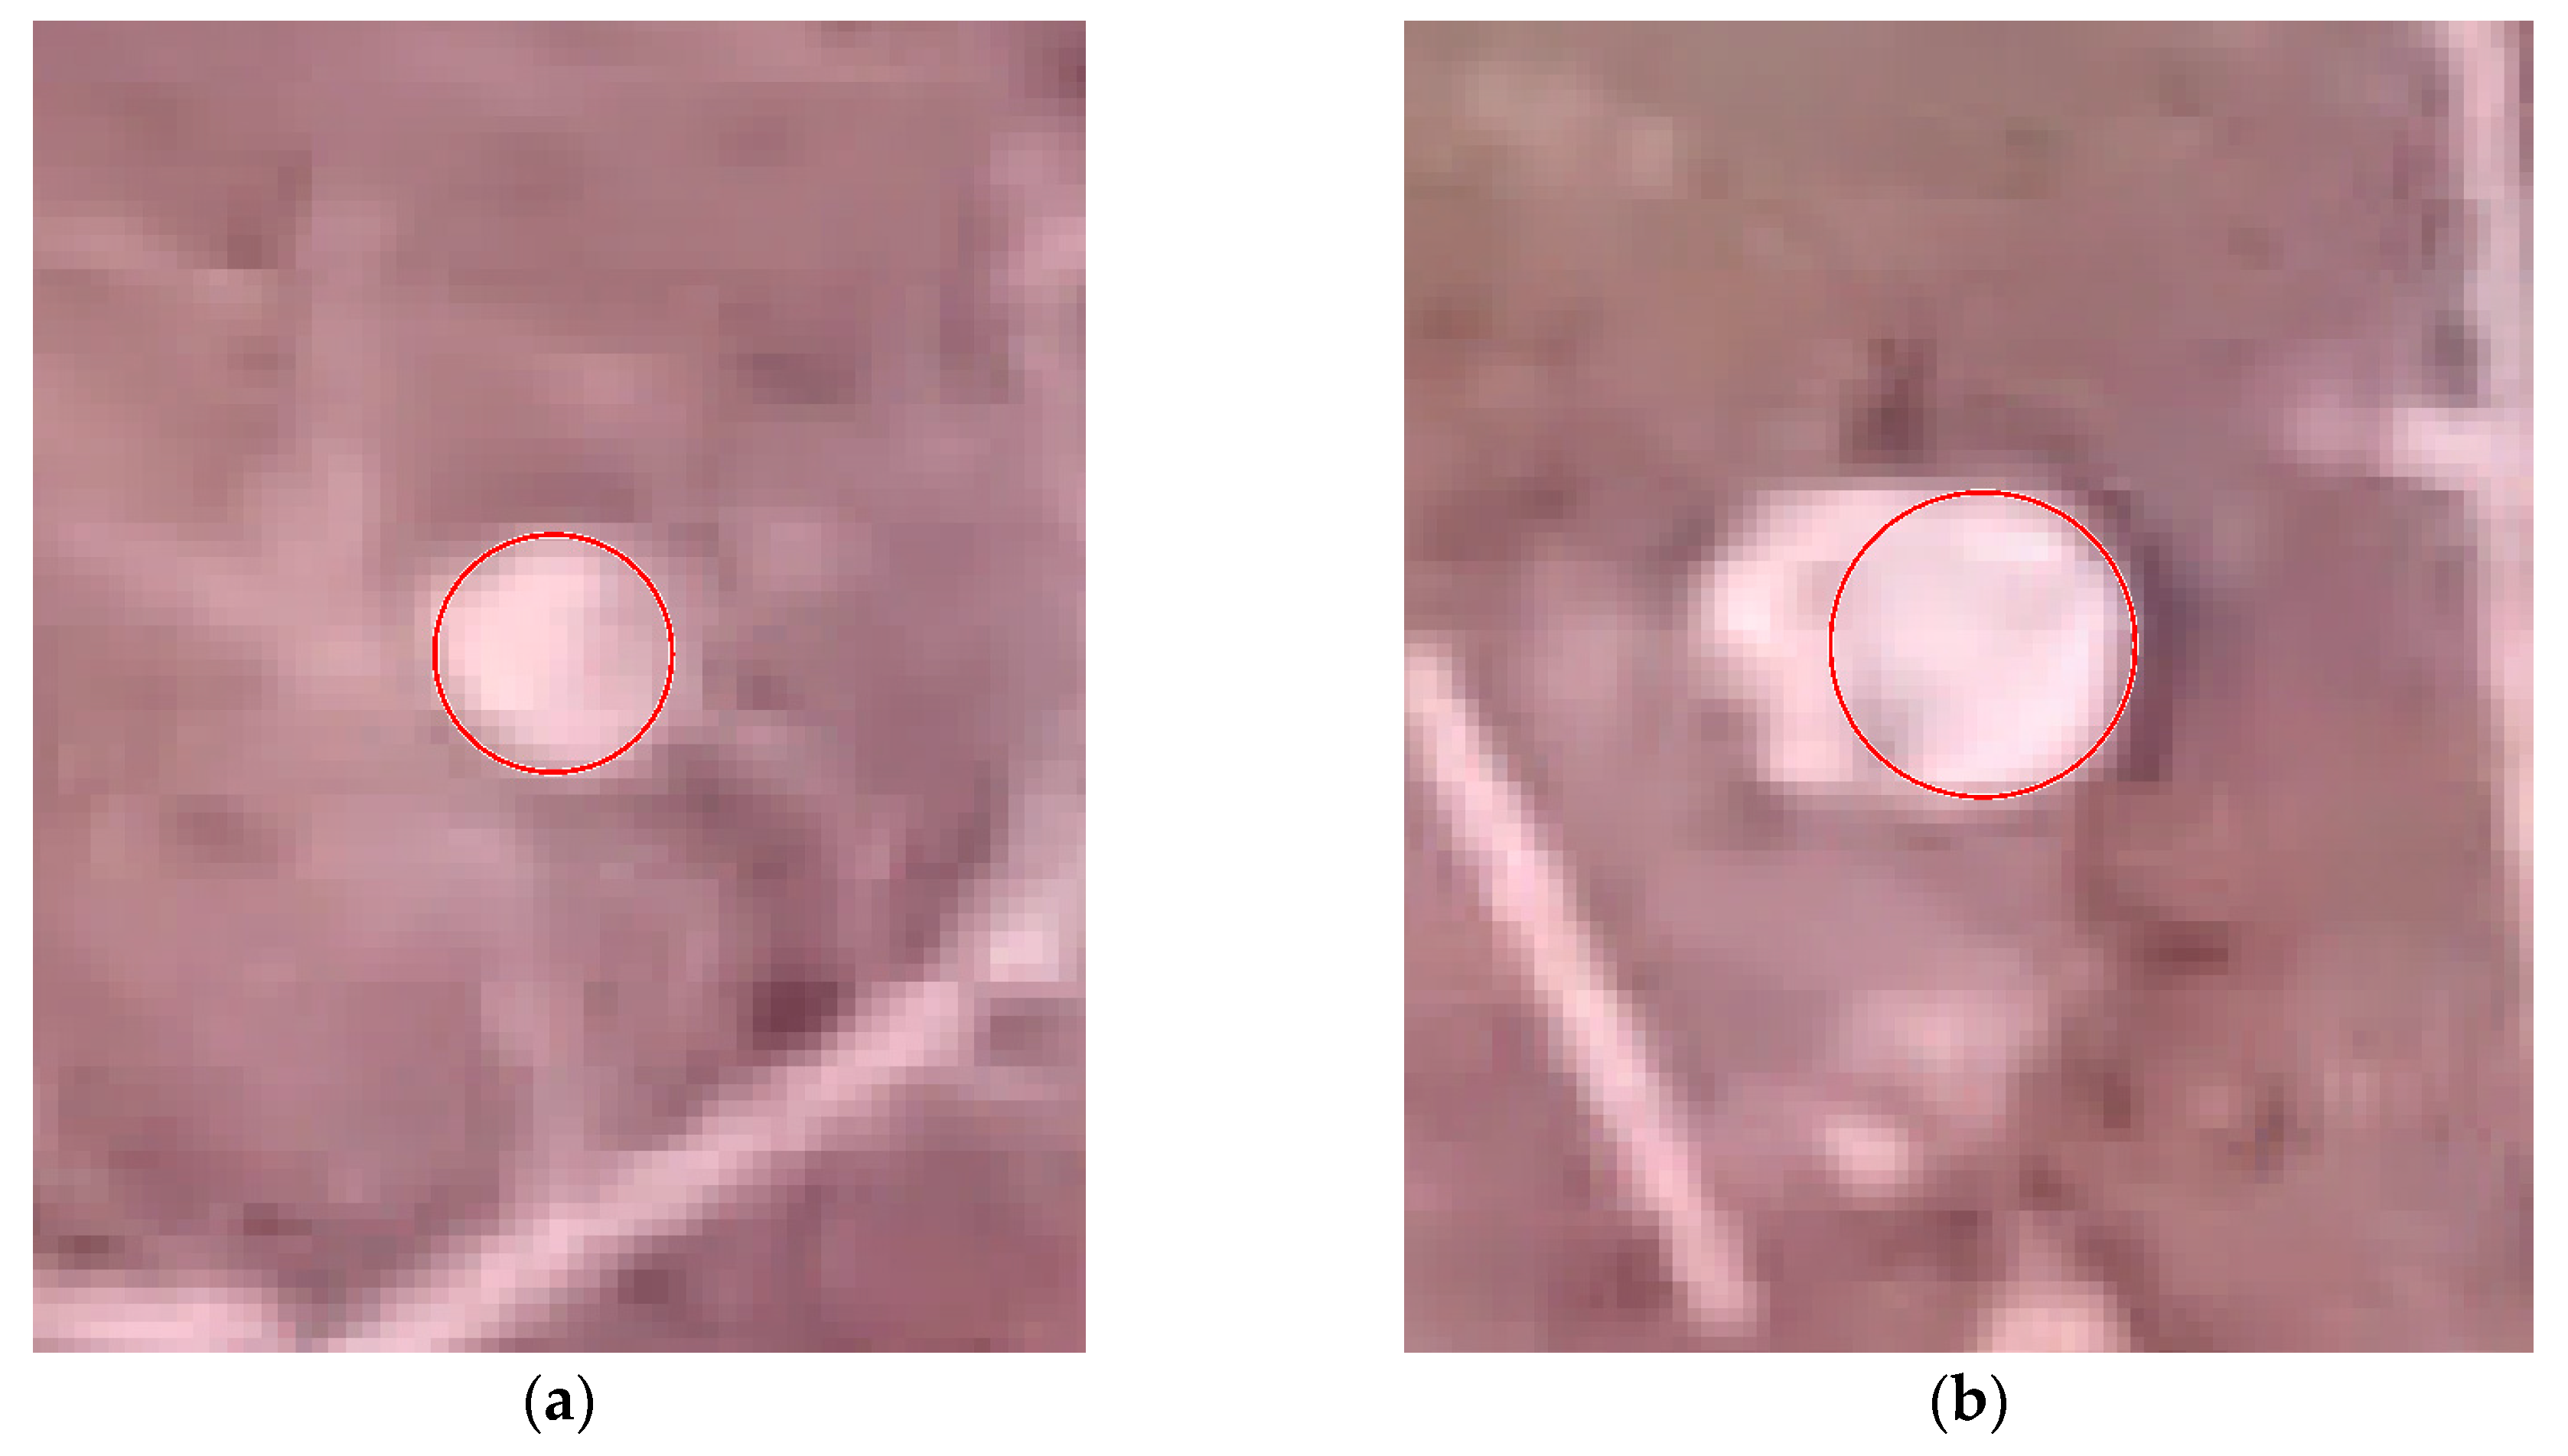
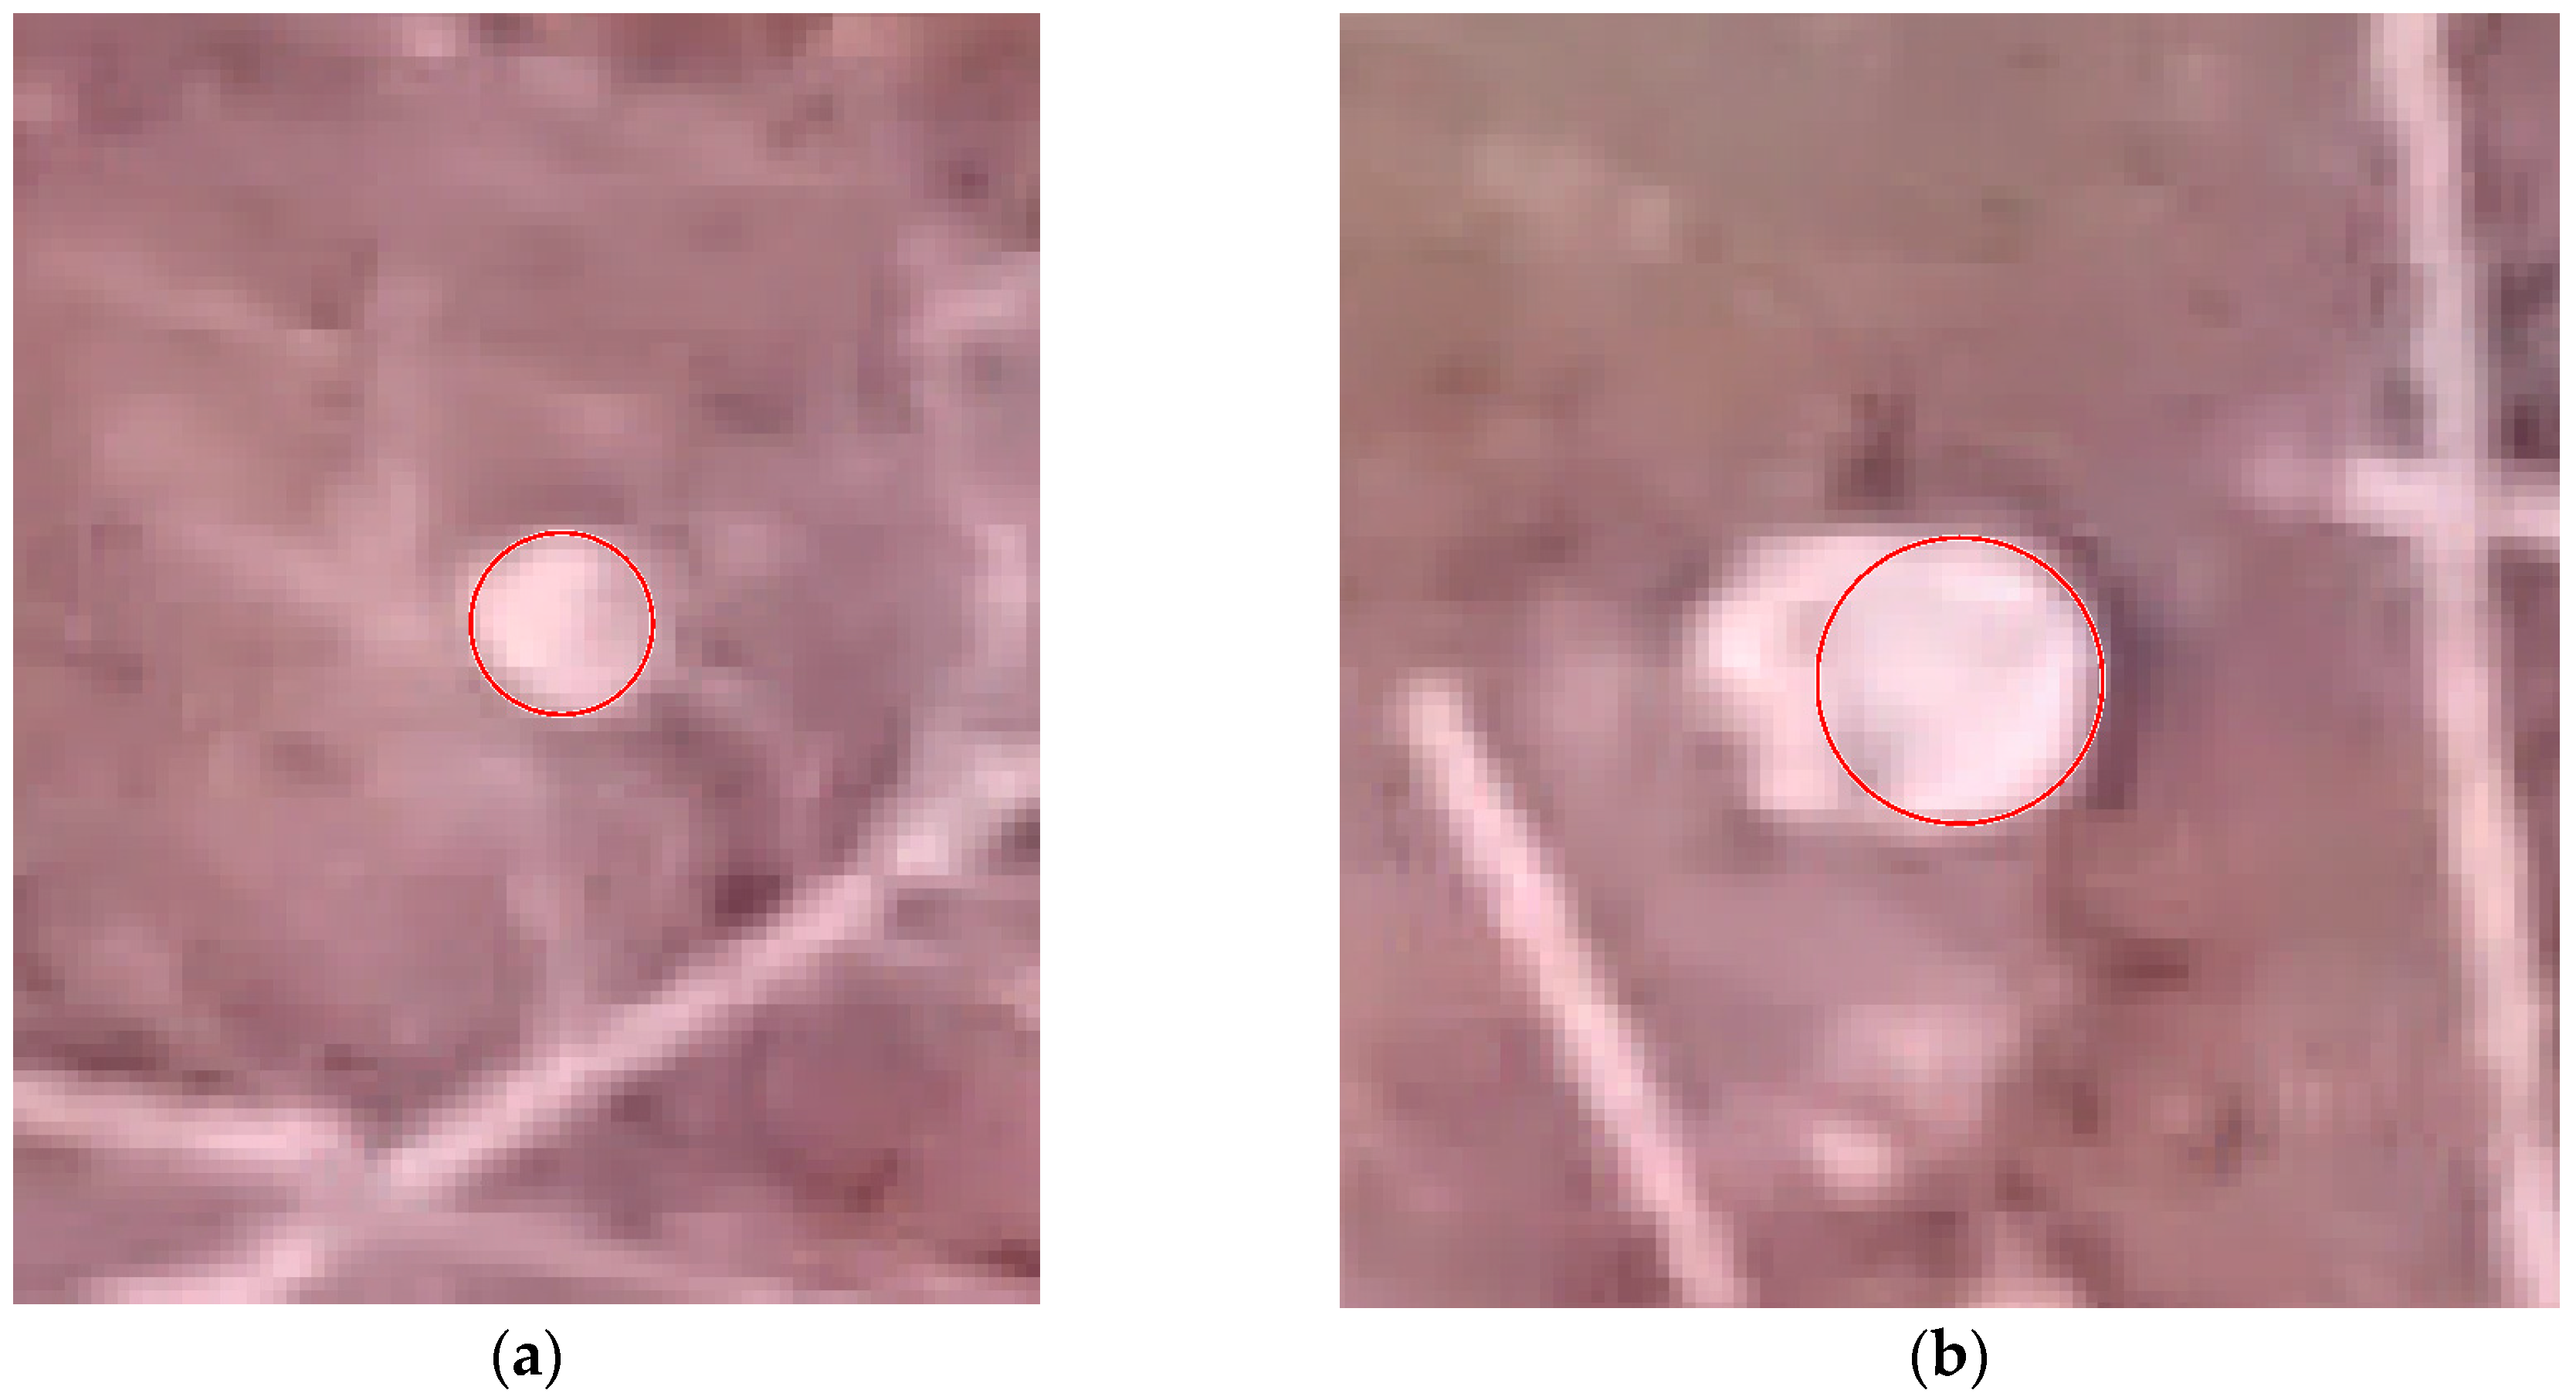
In this study, error may have been introduced when a stump with irregular shape was classified as circular. This in turn led to incorrect estimates of size (
Figure 10 and
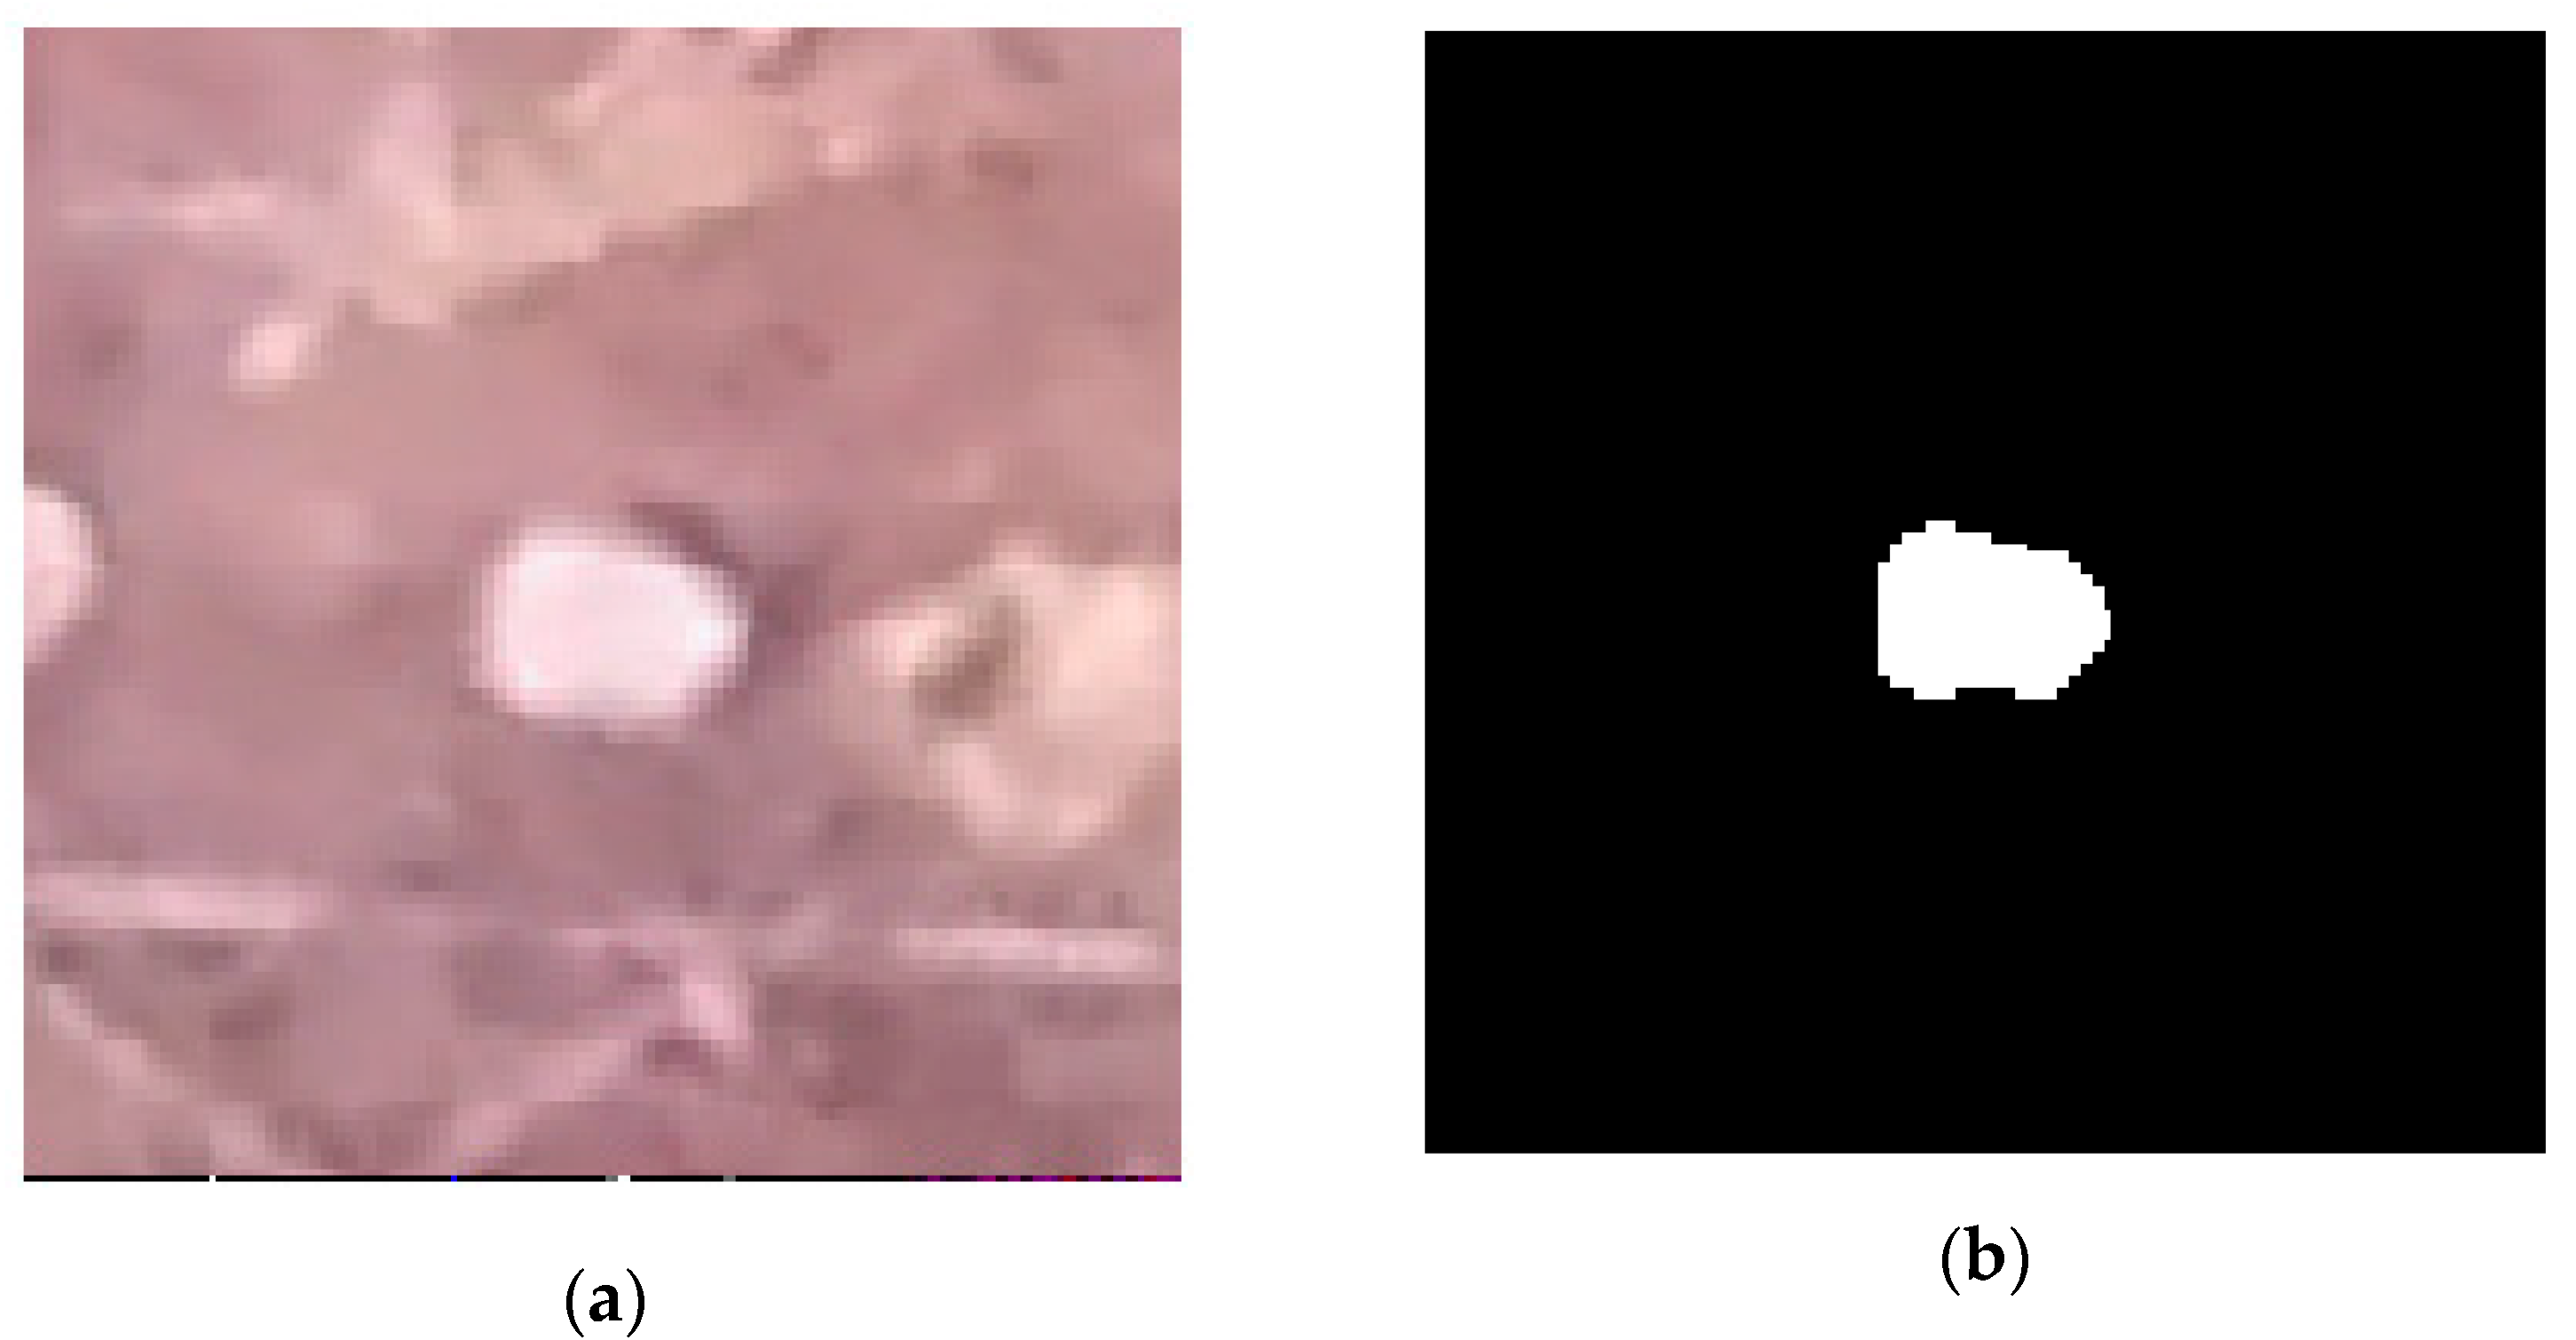
Figure 11). It was noted during the analysis of these data that most stumps were imperfect ovals rather than circular in shape. Thus, accuracy could be affected because tree stumps are not perfect circles but instead closer to imperfect ovals which would affect the accuracy of methodology used to detect circular objects. However, because contemporary field methodology also assumes a circular stump shape, error introduced through aerial measurements may over or underestimate basal area when compared to ground collected measurements if ground measurements were taken across a longer or shorter diameter on non-circular stumps. The error introduced by HCT on non-circular tree stumps measurements can be reduced by refining the HCT results using FMM (
Figure 12). It can be seen that the stump perimeter is delineated more precisely using FMM compared to PC and HCT (
Figure 10 and
Figure 11).
Similarly, the spatial resolution of the imagery can affect the error in analyses conducted on orthomosaics. Imagery with low spatial resolution portrays fuzzy delineation of object boundaries when compared to high spatial resolution imagery. This leads to less accurate measurements, as it is more difficult to detect the true edge of an object. Images extracted from a 4K video file often have less spatial resolution than still images, therefore imagery collected in point-and-shoot camera modes may be better suited for edge detection. The methodology of this research used a 4K video to generate the orthomosaic; as a result the imagery had some focusing artifacts such as blurring that could have negatively affected accuracies.
Low spatial resolution imagery can also increase the uncertainty in the georeferenced position of objects when those objects are used as GCPs to post-correct the orthomosaic. Most UAS have internal GPS units, however, these rarely have sub-meter accuracies. The addition of GPS units with greater accuracy would reduce the need to rely on in-image GCPs or LiDAR data to correctly position an orthomosaic over background imagery. While it is not necessary to have sub-meter accuracy for identification and measurements of tree stumps, many of the stumps are less than a meter in size, and are often less than a meter apart. Both improved spatial resolution and more accurate GPS information is helpful for the ground verification crew.
The proposed approach is already robust enough that this can be widely used as a tool to identify illegal logging and quantify timber losses. Estimating the value of timber immediately after legal harvesting is of great interest since it provides a way of quality control to make sure the quotas are being met and approximate the financial value of harvested timber.
Future work should investigate the use of oval detection methods and/or the fusion of HCT and PC to identify and measure tree stumps. Additional studies should also compare the benefits of using video data versus a still image data to generate orthomosaics.
5. Conclusions
Forest inventory immediately following logging can help detect and quantify any issues or problems involving timber theft/trespass. Identifying such events and estimating the damage resulting from such events in a safe, quick, and inexpensive manner is of particular interest to land owners and timber companies around the world. This study presents a first attempt to identify the cut area and the number of pine tree stumps and estimates the diameter of the stumps from a UAS collected imagery at 61 m with a visible range camera. We reported the performance of a stump count and size estimation system using TM, PC, and HCT. Most tree stumps in visible UAS imagery could be detected in all three approaches studied. The results showed that the HCT had the highest OA of 77.3% (16.3% OE, 12.8% CE) with RMSE of 7.2 cm and PC has OA of 72% (16.4% OE, 22.2% CE) with RMSE of 4.3 cm. HCT and PC requires the stumps to have circular cross-section for accurate delineation. Non-circular stumps gets approximated and may contribute to errors in diameter and area estimation. In this work, we also studied an alternative approach called FMM which doesn’t require the stumps to have circular cross-section. Additional study is needed to evaluate the efficacy of FMM as it requires more GR information than what was collected for this research. However, from our preliminary results, one can observe that the delineation of stumps is far more accurate with FMM than HCT and PC.
