You are currently viewing a new version of our website. To view the old version click .
Proceedings
  • Abstract
  • Open Access

27 March 2024

Multi-Sensor System for Saffron Quality Identification †

,
,
,
,
and
Department of Electronic Engineering, University of Rome Tor Vergata, 00133 Roma, Italy
*
Author to whom correspondence should be addressed.
Presented at the XXXV EUROSENSORS Conference, Lecce, Italy, 10–13 September 2023.
This article belongs to the Proceedings XXXV EUROSENSORS Conference

Abstract

The high commercial value of saffron prompts attempts to adulterate this commodity. Thus, there is growing interest in fast and simple methods of identifying quality products. Color and aroma are the most appreciated characteristics of saffron that make this spice widely used. On these bases, we developed a multisensor approach to saffron quality identification based on VIS spectrometry and volatile compound detection. For scopes, a miniaturized spectrophotometer and an electronic nose were used to identify high-quality saffron with respect to less-valuable commercial products and adulterant agents. The outer product of the spectra and electronic nose patterns was demonstrated to be effective at clustering samples according to their purity.

1. Introduction

Saffron is highly-value spice widely used because of its color and aroma. The high price of saffron prompts the introduction of adulterated products to the market in which small amounts of saffron are mixed with adulterants that typically try to reproduce the chromatic appearance of the spice. The identification of genuine saffron is then necessary to protect high-quality production. As color and aroma, the major properties of saffron, most techniques have focused on optical and chemical analyses [1]. The optical spectrum of saffron is related to the presence of crocin, a carotenoid responsible for the typical saffron color, with a spectral signature at around 400 nm. In terms of aroma, the major components of the headspace are derivatives of ketones, aldehydes, and acids [2]. In this paper, we investigate a hyphenate approach to saffron quality identification in which data obtained by a VIS spectrophotometer and electronic nose are combined [3]. This method has been tested to compare samples of high-quality saffron with products bought over the counter and the most used adulterants.

2. Materials and Methods

Samples of high-quality saffron provided by a local farm were analyzed together with commercial samples of standard quality bought in supermarkets and the most common adulterants, such as powders of safflower, marigold, and turmeric.
Spectral reflectance in the range of 350–750 nm was measured under white LED illumination, using a miniaturized spectrophotometer (C12666, Hamamatsu Photonics, Hamamatsu, Japan). Volatile compounds were measured using an in-house-designed electronic nose made of 12 porphyrinoids-coated quartz microbalances.

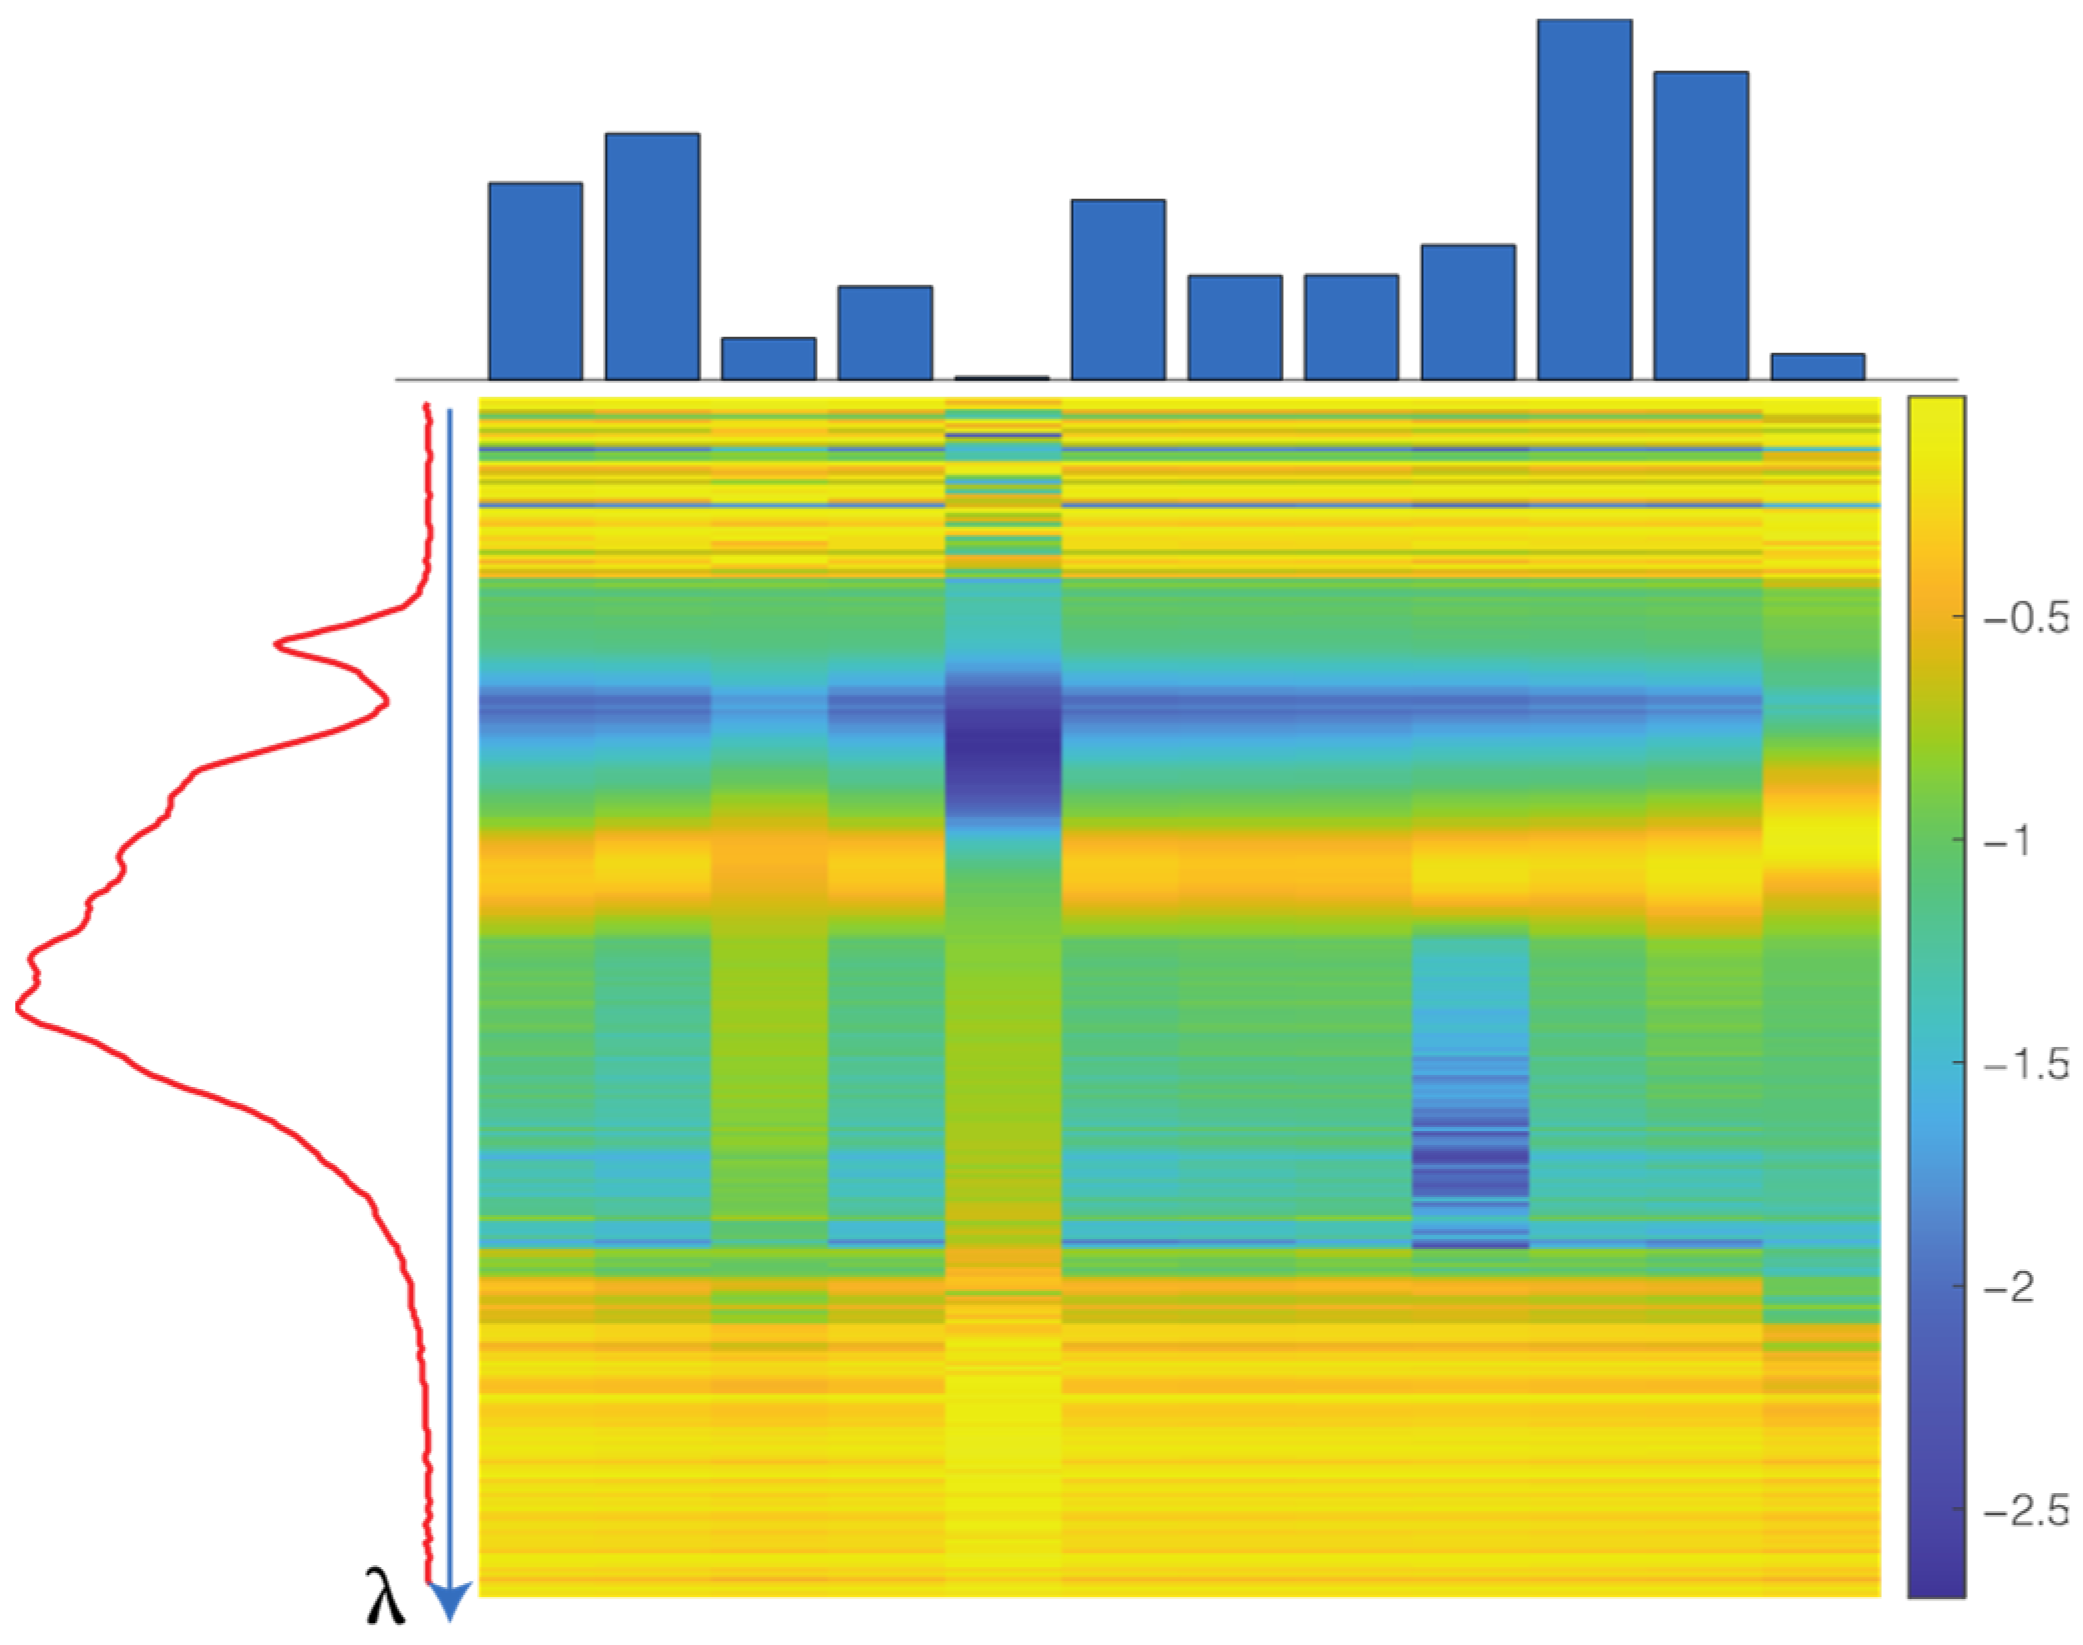
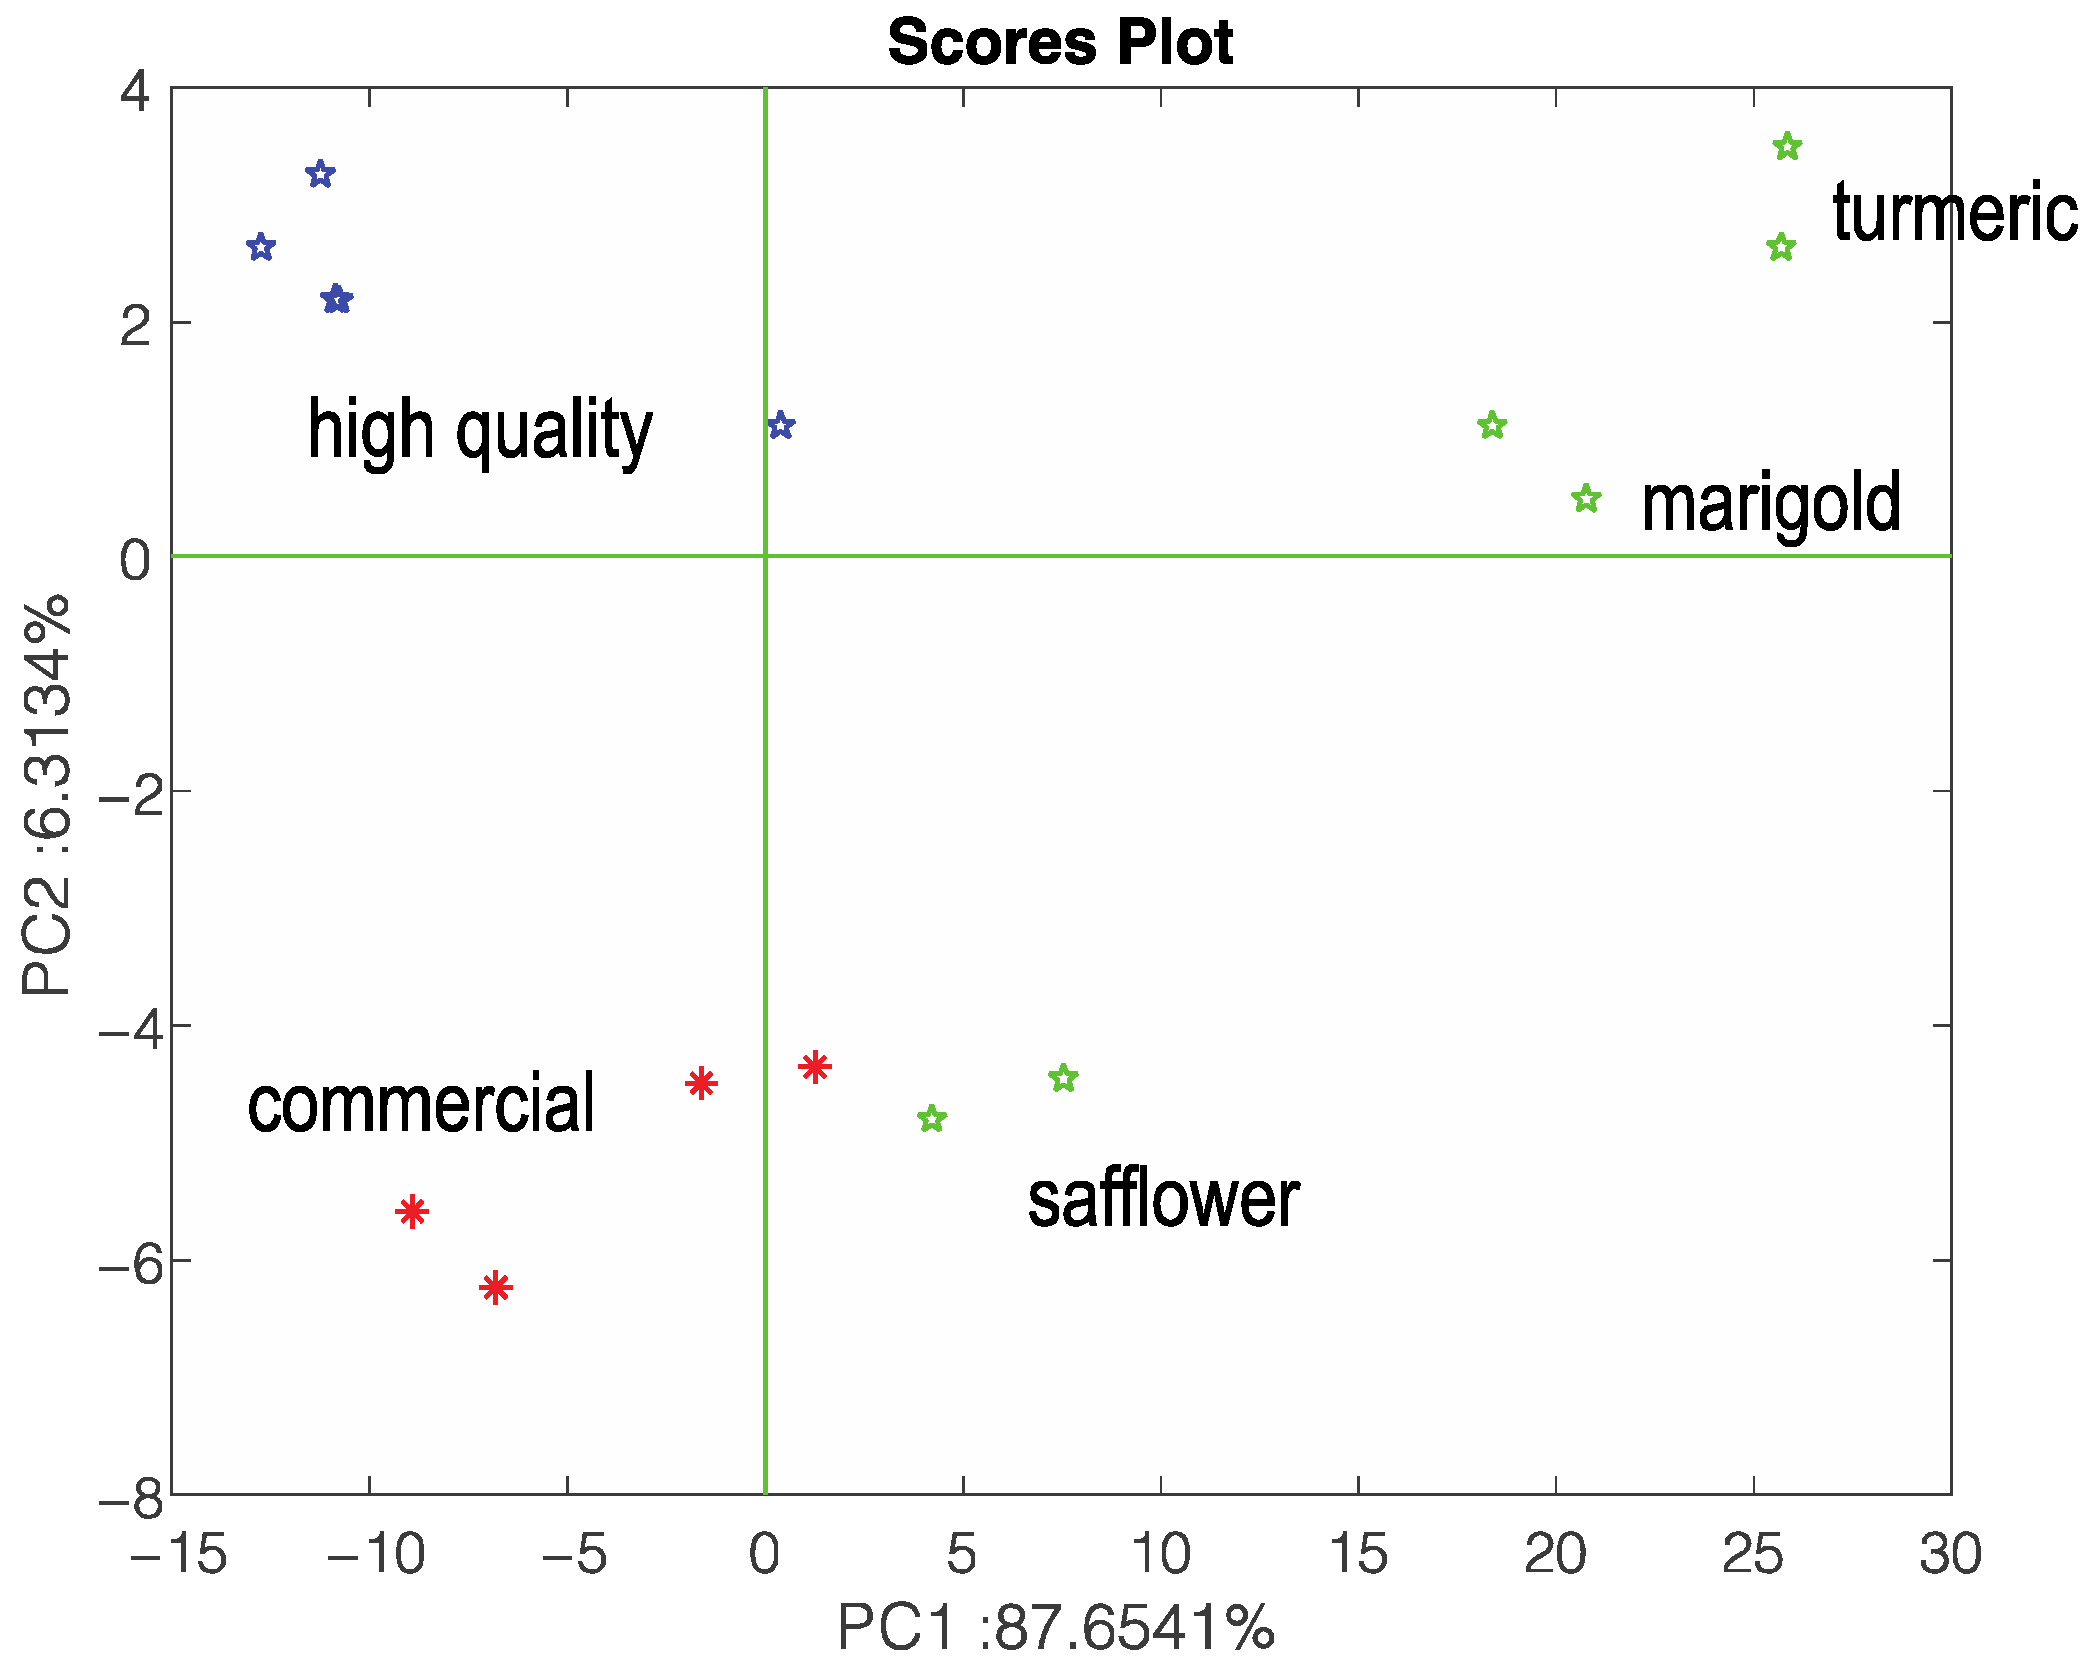
3. Results and Discussion

Each sample was characterized by the reflectance spectra and the sensor’s response pattern. The data from both instruments were combined, calculating the outer product of the spectra with the sensor’s pattern. The outer product returns, for each sample, a matrix with the dimensions 256 × 12 (see Figure 1).
Figure 1. Example of an outer product matrix obtained by combining the spectral signals (256 values) and electronic nose signals (12 values) for a single sample.
An ANOVA was carried out on each element of the matrix in order to determine the matrix elements that better identify high-quality saffron with respect to the other samples. Figure 2 shows a map of the p-value. Interestingly, the wavelengths contributing to the matrix element with the lowest p-value do not correspond to the spectral peaks. Rather, the spectral region between the two major spectral features mostly contributes to the identification of high-quality product. With respect to the contribution of the sensors of the array, the sensor with the greatest contribution is the device characterized by the smallest signal. Figure 3 shows a score plot calculated using the matrix elements with a p-value of less than 0.01. Before the PCA, each matrix was unfolded in a vector.
Figure 2. A p-value map of the outer product of the spectral and electronic nose signals. Representative spectra are shown. The values of the color bar are in a logarithmic scale.
Figure 3. Scores plot of the PCA calculated using the outer product matrix elements with a p-value of less than 0.01.
The results show a good segregation of high-quality produce with respect to commercial products and typical adulterants. Extensive measurements of the decay of saffron quality with time will be presented in the final paper.

Author Contributions

Conceptualization and design of experiment, R.C., C.D.N. and A.C.; performed the experiment, R.C., C.S., L.P. and V.A.; data analysis, C.D.N., R.C. and V.A.; and writing, C.D.N., R.C. and A.C. All authors have read and agreed to the published version of the manuscript.

Funding

This research received no external funding.

Institutional Review Board Statement

Not applicable.

Data Availability Statement

All data that support the findings of this study are available after the reasonable request to the corresponding author.

Acknowledgments

This research was supported by the Greenheart Societa’ Agricola Bio-innovativa s.r.l. and the Programma Operativo (PON) “Ricerca e Innovazione” 2014–2020- azioni iv.4–”Dottorati e contratti di ricerca su tematiche dell’innovazione” e iv.6 “Contratti di ricerca su tematiche green”.

Conflicts of Interest

The authors declare no conflict of interest.

References

  1. Kumari, L.; Jaiswal, P.; Tripathy, S.S. Various techniques useful for determination of adulterants in valuable saffron: A review. Trends Food Sci. Technol. 2021, 111, 301–321. [Google Scholar] [CrossRef]
  2. Amanpour, A.; Sonmezdag, A.S.; Kelebek, H.; Selli, S. GC-MS-olfactometric characterization of the most aroma-active components in a representative aromatic extract from Iranian saffron (Crocus sativus L.). Food Chem. 2015, 182, 251–256. [Google Scholar] [CrossRef]
  3. Di Natale, C.; Zude-Sasse, M.; Macagnano, A.; Paolesse, R.; Herold, B.; D’Amico, A. Outer product analysis of electronic nose and visible spectra: Application to the measurement of peach fruit characteristics. Anal. Chim. Acta 2002, 459, 107–117. [Google Scholar] [CrossRef]
Disclaimer/Publisher’s Note: The statements, opinions and data contained in all publications are solely those of the individual author(s) and contributor(s) and not of MDPI and/or the editor(s). MDPI and/or the editor(s) disclaim responsibility for any injury to people or property resulting from any ideas, methods, instructions or products referred to in the content.

Article Metrics

Citations

Article Access Statistics

Multiple requests from the same IP address are counted as one view.